Characteristics and Uncertainty of Industrial VOCs ...
14
Aerosol and Air Quality Research, 15: 1045–1058, 2015 Copyright © Taiwan Association for Aerosol Research ISSN: 1680-8584 print / 2071-1409 online doi: 10.4209/aaqr.2014.10.0236 Characteristics and Uncertainty of Industrial VOCs Emissions in China Xuecheng Wu, Weiwei Huang, Yongxin Zhang, Chenghang Zheng, Xiao Jiang, Xiang Gao * , Kefa Cen State Key Laboratory of Clean Energy Utilization, Zhejiang University, Hangzhou 310027, China ABSTRACT An industrial sector-based source volatile organic compounds (VOCs) emission inventory was developed for the year 2011 in China with the use of ‘emission factor method’. Based on the concept of source-tracing and a ‘bottom-up’ approach, it is estimated that the total emissions of industrial VOCs were 15.8 Tg for the year 2011, 17.7% of which came from production of VOCs, 8.4% came from storage and transport, 14.2% came from industrial processes using VOCs as raw materials, and 59.7% came from use of VOCs-containing products. Industrial VOCs emissions in East China were the largest contributors, comprising 40% of total. Four kinds of sources including furniture manufacturing, petroleum refining, machinery equipment manufacturing and printing industry took up 53.8% of total emissions. Therefore, more efficient VOCs control equipment should be paid attention to and promoted. A quantitative approach, the bootstrap simulation and Monte Carlo sampling, was used to analyze uncertainties, there is relatively medium uncertainty with an error of –42% to +71%, ranging from 9.2 to 27.2 Tg on the 95% confidence interval. To reduce VOCs emission inventory uncertainties requires giving priority to research on conducting more measurements of key sources. It’s imperative to establish domestic emission factor database. Keywords: Industrial VOCs; Emission inventory; Source-tracing; Uncertainty; China. INTRODUCTION With the development of the economy, the complex and regional air pollution issues such as high ozone concentration, photochemical smog and haze caused by fine particles have become the most crucial topics for atmospheric environment research all over the world (Chameides et al., 1999; Chan and Yaom, 2008; Shao et al., 2009; Zhao et al., 2009; Von Schneidemesser et al., 2010; Li et al., 2011; Ling et al., 2011; Wang and Hao, 2012; Xue et al., 2013; Huang et al., 2014). As an important pollutant, volatile organic compounds (VOCs) have an adverse effect on ambient air quality and human health. Photochemical reactions occur when VOCs meet nitrogen oxides under the condition of strong light, low wind speed, low humidity, resulting in the formation of photochemical smog. Besides, VOCs are also precursors of secondary organic aerosol (SOA) (Yuan et al., 2013). What’s worse, VOCs have harmful effects on the organs such as heart, lungs, liver and nervous system, causing acute and chronic poisoning, even carcinogenic and mutagenic (Zhou et al., 2011; Zhu and Liu, 2014). * Corresponding author. Tel.: +86-571-87951335; Fax: +86-571-87951335 E-mail address: [email protected] Since 2010, China has become the world’s second largest economy after United States, with industry, as a part of Secondary Industry in China, playing an essential role in Gross Domestic Products (GDP). Industry consumed approximately 70% of energy in 2012 and accounted for about 38% of total GDP in the meantime. Pollutants emissions generated in industry were substantial. In particular, industrial VOCs emissions (stack emissions and fugitive emissions) which are abundant, with a variety of compounds and properties, presenting complex and scattered, contributes a lot to VOCs emissions (Klimont et al., 2001; Ling et al., 2011; Fu et al., 2013). Emission inventory is a foundation of emission estimates (Chen et al., 2014). Several VOCs emission inventories have been established in China at different scales since recent decades. These VOCs inventories covered areas as large as the national scales (Wang et al., 2005; Liu et al., 2008; Wei et al., 2008; Chen et al., 2012; Cao et al., 2010; Yang, 2012; Streets et al., 2006) and down to regional (Fu et al., 2013; Huang et al., 2011; Liu et al., 2008; Lu et al., 2013; Streets et al., 2006; Zhao et al., 2012; Zheng et al., 2009a; Zheng et al., 2009b; Zheng et al., 2010; Yu et al., 2011; Zheng et al., 2009c) and urban levels(Cai et al., 2010; He et al., 2013). The accuracy of emission inventory is also essential for policy-makers and researchers. However, uncertainty in these inventories was rarely discussed or assessed in a qualitative way except few researchers (Wei et al., 2008; Zheng, Zhang et al., 2009;
Transcript of Characteristics and Uncertainty of Industrial VOCs ...

Aerosol and Air Quality Research, 15: 1045–1058, 2015 Copyright © Taiwan Association for Aerosol Research ISSN: 1680-8584 print / 2071-1409 online doi: 10.4209/aaqr.2014.10.0236
Characteristics and Uncertainty of Industrial VOCs Emissions in China Xuecheng Wu, Weiwei Huang, Yongxin Zhang, Chenghang Zheng, Xiao Jiang, Xiang Gao*, Kefa Cen State Key Laboratory of Clean Energy Utilization, Zhejiang University, Hangzhou 310027, China ABSTRACT
An industrial sector-based source volatile organic compounds (VOCs) emission inventory was developed for the year 2011 in China with the use of ‘emission factor method’. Based on the concept of source-tracing and a ‘bottom-up’ approach, it is estimated that the total emissions of industrial VOCs were 15.8 Tg for the year 2011, 17.7% of which came from production of VOCs, 8.4% came from storage and transport, 14.2% came from industrial processes using VOCs as raw materials, and 59.7% came from use of VOCs-containing products. Industrial VOCs emissions in East China were the largest contributors, comprising 40% of total. Four kinds of sources including furniture manufacturing, petroleum refining, machinery equipment manufacturing and printing industry took up 53.8% of total emissions. Therefore, more efficient VOCs control equipment should be paid attention to and promoted. A quantitative approach, the bootstrap simulation and Monte Carlo sampling, was used to analyze uncertainties, there is relatively medium uncertainty with an error of –42% to +71%, ranging from 9.2 to 27.2 Tg on the 95% confidence interval. To reduce VOCs emission inventory uncertainties requires giving priority to research on conducting more measurements of key sources. It’s imperative to establish domestic emission factor database. Keywords: Industrial VOCs; Emission inventory; Source-tracing; Uncertainty; China. INTRODUCTION
With the development of the economy, the complex and regional air pollution issues such as high ozone concentration, photochemical smog and haze caused by fine particles have become the most crucial topics for atmospheric environment research all over the world (Chameides et al., 1999; Chan and Yaom, 2008; Shao et al., 2009; Zhao et al., 2009; Von Schneidemesser et al., 2010; Li et al., 2011; Ling et al., 2011; Wang and Hao, 2012; Xue et al., 2013; Huang et al., 2014). As an important pollutant, volatile organic compounds (VOCs) have an adverse effect on ambient air quality and human health. Photochemical reactions occur when VOCs meet nitrogen oxides under the condition of strong light, low wind speed, low humidity, resulting in the formation of photochemical smog. Besides, VOCs are also precursors of secondary organic aerosol (SOA) (Yuan et al., 2013). What’s worse, VOCs have harmful effects on the organs such as heart, lungs, liver and nervous system, causing acute and chronic poisoning, even carcinogenic and mutagenic (Zhou et al., 2011; Zhu and Liu, 2014). * Corresponding author. Tel.: +86-571-87951335; Fax: +86-571-87951335 E-mail address: [email protected]
Since 2010, China has become the world’s second largest economy after United States, with industry, as a part of Secondary Industry in China, playing an essential role in Gross Domestic Products (GDP). Industry consumed approximately 70% of energy in 2012 and accounted for about 38% of total GDP in the meantime. Pollutants emissions generated in industry were substantial. In particular, industrial VOCs emissions (stack emissions and fugitive emissions) which are abundant, with a variety of compounds and properties, presenting complex and scattered, contributes a lot to VOCs emissions (Klimont et al., 2001; Ling et al., 2011; Fu et al., 2013). Emission inventory is a foundation of emission estimates (Chen et al., 2014). Several VOCs emission inventories have been established in China at different scales since recent decades. These VOCs inventories covered areas as large as the national scales (Wang et al., 2005; Liu et al., 2008; Wei et al., 2008; Chen et al., 2012; Cao et al., 2010; Yang, 2012; Streets et al., 2006) and down to regional (Fu et al., 2013; Huang et al., 2011; Liu et al., 2008; Lu et al., 2013; Streets et al., 2006; Zhao et al., 2012; Zheng et al., 2009a; Zheng et al., 2009b; Zheng et al., 2010; Yu et al., 2011; Zheng et al., 2009c) and urban levels(Cai et al., 2010; He et al., 2013). The accuracy of emission inventory is also essential for policy-makers and researchers. However, uncertainty in these inventories was rarely discussed or assessed in a qualitative way except few researchers (Wei et al., 2008; Zheng, Zhang et al., 2009;

Wu et al., Aerosol and Air Quality Research, 15: 1045–1058, 2015 1046
Zheng et al., 2010; Fu et al., 2013). Understanding the characteristics of the industrial VOCs
helps diagnose the impact of emission sources upon the real atmosphere and plan effective emission control strategies (Shin et al., 2013). Besides, industrial VOCs emissions are prone to be centrally controlled effectively among other sources. It is important and urgent that develop the industrial VOCs inventory in detail and timely.
Therefore, this paper aims to develop an industrial VOCs emission inventory based on the year 2011 in China. Furthermore, to quantify uncertainties in sector-based VOCs emission estimates by the use of bootstrap simulation and Monte Carlo sampling. DATA AND METHODOLOGY Methodology
A bottom-up approach was adopted, and the ‘emission factor method’ was used to calculate the VOCs emissions in this study. The annual emissions were calculated by using the following Eq. (1):
, , ,E (1 )j k j k j kj k
A EF (1)
where, j represents the province; k represents specific sector; E is annual total emission of VOCs; A is the activity data; EF denotes the emission factor; η is the removal efficiency. Study Domain and Source Categorization
The study domain ranged over 31 provinces in China, which was exclusive of Hong Kong, Macau and Taiwan
because of the limited data. Source categorization is the foundation of an accurate
emission inventory. Based on the concept of source-tracing (Chen et al., 2012; Yang, 2012), which represents VOCs’ application properties and material flow process, industrial VOCs emissions mainly generated from four links: Production of VOCs, storage and transport, industrial processes using VOCs as raw materials and use of VOCs-containing products. Combining with <Industrial Classification for National Economic Activities>, source categorization of industrial VOCs emission inventory were established. Compared to other studies (Streets et al., 2006; Liu et al., 2008; Wei et al., 2008; Cao et al., 2010; Chen et al., 2012; Yang, 2012), this source categorization systematically covered the whole process of industrial VOCs emissions in more detail. 84 particular industrial sources were established in total. Compilation of Activity Data
Activity data of VOCs emission inventory refers to a variety of human activities information affecting pollutant emissions, including product yields, raw material consumption, population, etc., it’s an important factor which affect the accuracy of the emission inventory. In this study, we referred much on official statistics for most activity data (e.g., fuel consumption, product output), some data were from Industry Association statistics (e.g., methanol, ink, adhesives), as shown in Table 1. 63 activity data used in this study were directly collected at the provincial level, yet the rest 21 data in certain sectors, such as adhesive on decoration, wooding, etc., were available only at national level, and then were distributed to provinces by using GDP.
Table 1. Source categorization, activity data and data sources of industrial VOCs emission inventory.
Links Emission sources Activity data Data sources
Production of VOCs
Crude oil/natural gas exploration Crude oil/Natural gas exploration
NBSC a Petroleum refining Tank/Transport/Leakage loss
Volatile refining wastewater Basic chemical raw materials manufacturing
Ethylene Methyl alcohol NFIAC b Benzene ACD c Synthesis ammonia
NBSC Storage and
transport
Storage & transportation of crude oil/gasoline/other oil
Production/Import/Export
Storage & transportation of solvent Production/Import/Export ACD
Industrial processes using VOCs as raw
materials
Manufacture of paint Manufacture of printing PPEIAC d Primary form of plastic Polyethylene/PVC/ABS/Other resins
NBSC Synthetic rubber/fibre Polyester/Chinlon/Acrylic/Vinylon/Spandex/ Cellulose/acetate /Other fibers
Manufacture of Adhesive Water-based/Other adhesive CATIA e Manufacture of food & drink Vegetable oil/Sugar refining NBSC
Fermentation alcohol/Wine ACD Beer
NBSC Chemical raw materials Chemical pesticide/Tyre Manufacture of commodity Manufacture of commodity
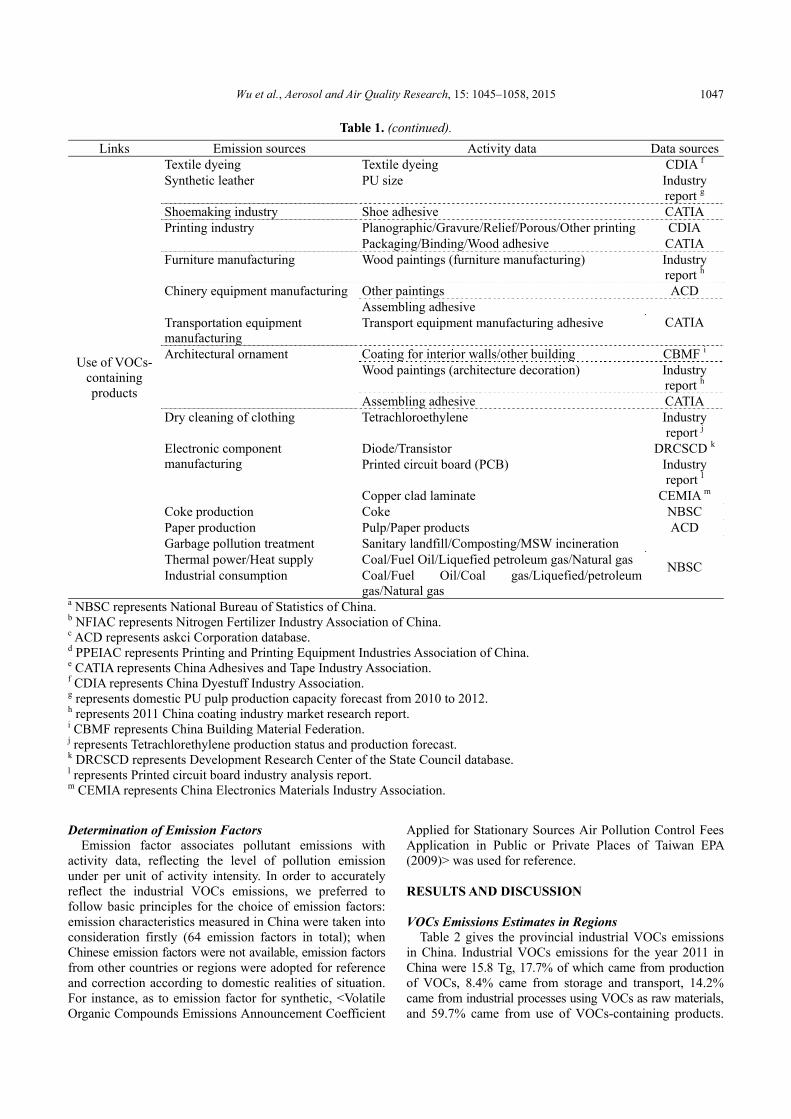
Wu et al., Aerosol and Air Quality Research, 15: 1045–1058, 2015 1047
Table 1. (continued).
Links Emission sources Activity data Data sources
Use of VOCs-containing products
Textile dyeing Textile dyeing CDIA f Synthetic leather PU size Industry
report g Shoemaking industry Shoe adhesive CATIA Printing industry Planographic/Gravure/Relief/Porous/Other printing CDIA
Packaging/Binding/Wood adhesive CATIA Furniture manufacturing Wood paintings (furniture manufacturing) Industry
report h Chinery equipment manufacturing Other paintings ACD
Assembling adhesive CATIA Transportation equipment
manufacturing Transport equipment manufacturing adhesive
Architectural ornament Coating for interior walls/other building CBMF i Wood paintings (architecture decoration) Industry
report h Assembling adhesive CATIA
Dry cleaning of clothing Tetrachloroethylene Industry report j
Electronic component manufacturing
Diode/Transistor DRCSCD k
Printed circuit board (PCB) Industry report l
Copper clad laminate CEMIA m Coke production Coke NBSC Paper production Pulp/Paper products ACD Garbage pollution treatment Sanitary landfill/Composting/MSW incineration
NBSC Thermal power/Heat supply Coal/Fuel Oil/Liquefied petroleum gas/Natural gas Industrial consumption Coal/Fuel Oil/Coal gas/Liquefied/petroleum
gas/Natural gas a NBSC represents National Bureau of Statistics of China. b NFIAC represents Nitrogen Fertilizer Industry Association of China. c ACD represents askci Corporation database. d PPEIAC represents Printing and Printing Equipment Industries Association of China. e CATIA represents China Adhesives and Tape Industry Association. f CDIA represents China Dyestuff Industry Association. g represents domestic PU pulp production capacity forecast from 2010 to 2012. h represents 2011 China coating industry market research report. i CBMF represents China Building Material Federation. j represents Tetrachlorethylene production status and production forecast. k DRCSCD represents Development Research Center of the State Council database. l represents Printed circuit board industry analysis report. m CEMIA represents China Electronics Materials Industry Association.
Determination of Emission Factors Emission factor associates pollutant emissions with
activity data, reflecting the level of pollution emission under per unit of activity intensity. In order to accurately reflect the industrial VOCs emissions, we preferred to follow basic principles for the choice of emission factors: emission characteristics measured in China were taken into consideration firstly (64 emission factors in total); when Chinese emission factors were not available, emission factors from other countries or regions were adopted for reference and correction according to domestic realities of situation. For instance, as to emission factor for synthetic, <Volatile Organic Compounds Emissions Announcement Coefficient
Applied for Stationary Sources Air Pollution Control Fees Application in Public or Private Places of Taiwan EPA (2009)> was used for reference. RESULTS AND DISCUSSION VOCs Emissions Estimates in Regions
Table 2 gives the provincial industrial VOCs emissions in China. Industrial VOCs emissions for the year 2011 in China were 15.8 Tg, 17.7% of which came from production of VOCs, 8.4% came from storage and transport, 14.2% came from industrial processes using VOCs as raw materials, and 59.7% came from use of VOCs-containing products.

Wu et al., Aerosol and Air Quality Research, 15: 1045–1058, 2015 1048
Tab
le 2
. Reg
iona
l ind
ustr
ial V
OC
s em
issi
ons
in C
hina
for
201
1.
Reg
ion
Prov
ince
pr
oduc
tion
of
VO
Cs,
Tg
stor
age
and
tran
spor
t, T
g in
dust
rial
pro
cess
es u
sing
V
OC
s as
raw
mat
eria
ls, T
g us
e of
VO
Cs-
cont
aini
ng
prod
ucts
, Tg
tota
l ind
ustr
ial V
OC
s em
issi
ons
in p
rovi
nce,
Tg
tota
l ind
ustr
ial V
OC
s em
issi
ons
in r
egio
n, T
g
Nor
th
Chi
na
Bei
jing
0.
06
0.04
0.
02
0.18
0.
30
2.01
T
ianj
in
0.11
0.
05
0.05
0.
31
0.52
H
ebei
0.
10
0.05
0.
11
0.42
0.
68
Sha
nxi
0.03
*
0.01
0.
21
0.25
In
ner
Mon
golia
0.
02
0.02
0.
08
0.13
0.
25
Nor
thea
st
Chi
na
Lia
onin
g 0.
33
0.16
0.
05
0.36
0.
90
1.57
Ji
lin
0.06
0.
02
0.10
0.
14
0.32
H
eilo
ngji
ang
0.12
0.
07
0.06
0.
09
0.34
Eas
t C
hina
Sha
ngha
i 0.
11
0.07
0.
08
0.91
1.
17
6.55
Jian
gsu
0.16
0.
07
0.34
0.
89
1.46
Z
heji
ang
0.16
0.
08
0.17
0.
84
1.26
A
nhui
0.
04
0.01
0.
08
0.26
0.
39
Fuj
ian
0.06
0.
03
0.03
0.
34
0.45
Ji
angx
i 0.
02
0.01
0.
02
0.08
0.
13
Sha
ndon
g 0.
38
0.18
0.
36
0.77
1.
69
Cen
tral
S
outh
C
hina
Hen
an
0.08
0.
03
0.15
0.
37
0.62
4.00
Hub
ei
0.07
0.
02
0.07
0.
20
0.36
H
unan
0.
05
0.02
0.
04
0.38
0.
49
Gua
ngdo
ng
0.23
0.
13
0.14
1.
68
2.18
G
uang
xi
0.06
0.
03
0.05
0.
09
0.24
H
aina
n 0.
06
0.04
*
0.03
0.
12
Sou
thw
est
Chi
na
Cho
ngqi
ng
0.01
*
0.03
0.
14
0.18
0.73
S
ichu
an
0.05
0.
01
0.11
0.
19
0.36
G
uizh
ou
0.01
*
0.01
0.
05
0.07
Y
unna
n 0.
01
* 0.
03
0.08
0.
12
Tib
et
* *
* 0.
02
0.02
Nor
thw
est
Chi
na
Sha
anxi
0.
14
0.07
0.
02
0.13
0.
36
0.99
G
ansu
0.
09
0.04
0.
01
0.05
0.
19
Qin
ghai
0.
01
0.01
*
0.02
0.
04
Nin
gxia
0.
02
0.01
0.
01
0.03
0.
07
Xin
jian
g 0.
16
0.07
0.
03
0.07
0.
32
Nat
iona
l To
tal
2.
80
1.34
2.
25
9.46
15
.85
(*
rep
rese
nts
less
than
0.0
05).

Wu et al., Aerosol and Air Quality Research, 15: 1045–1058, 2015 1049
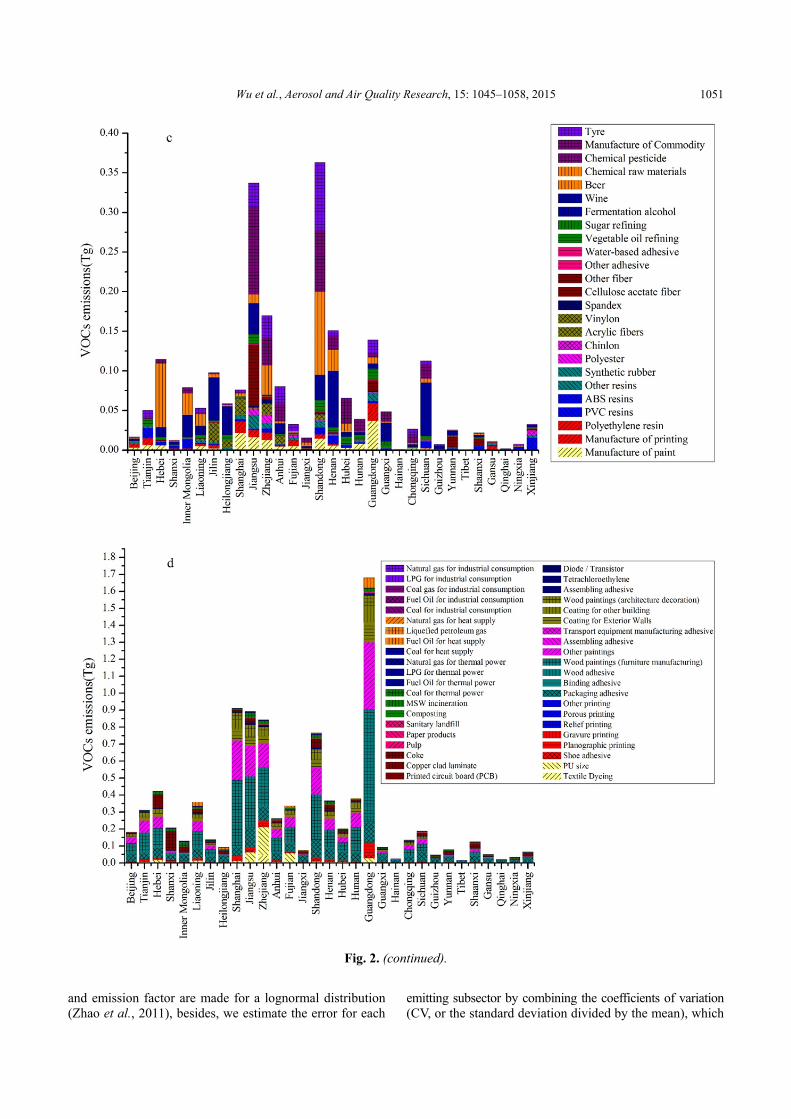
The use of VOCs-containing products took up more than 50% in 71% of provinces, nevertheless, production of VOCs contributed 30%–40% in 19% of provinces. Therefore, to control the industrial VOCs emissions, the use of VOCs-containing products should be focused on primarily. The three largest contributors were Guangdong (2.18 Tg), Shandong (1.69 Tg), and Jiangsu (1.46 Tg), as shown in Fig. 1, Fig. 2, which accounted for 33.7% of the national total emissions. This phenomenon was mainly due to the more developed industries in three provinces, especially in furniture manufacturing and printing industry, resulting in greater proportion of coatings and adhesives applications, thus causing large amounts of VOCs emissions. The industrial VOCs emissions in East China were 6.5 Tg, accounting for 41% of national total emission, which were far more than other regions. This was because the provincial emissions in East China such as Shanghai, Jiangsu, Zhejiang, and Shandong occupied the front rank in China. Regional VOCs Emissions Distribution
Fig. 3 presents industrial VOCs emissions per square kilometer and per capita of different provinces. Heavy emission densities were shown in East China, the top three average industrial VOCs emissions per square kilometer were Shanghai (186.1 ton/km2), Tianjin (46.4 ton/km2) and Beijing (17.7 ton/km2), which were 11–113 times of the
average level of China. It is the provincial different level of development, discrepant area and various industrial structure that mainly lead to huge variation range. The top three average industrial VOCs emissions per capita were Shanghai (0.05ton/capita), Tianjin (0.04 ton/capita), Zhejiang (0.02 ton/capita), respectively, which were 2–5 times as much as the average level of China. Generally speaking, there existed uneven in development among regions. Emission Contributions by Major Sources
Among the four links of VOCs emissions, use of VOCs-containing products was the biggest contributor, comprising 59.7% of total emissions for the year 2011. What’s more, furniture manufacturing accounted for 30% of the use of VOCs-containing products. 28 kinds of sources including petroleum refining, basic chemical raw materials manufacturing, printing Industry, surface coating, paint, ink or pigments manufacturing, etc. took up 91.4% of total emissions. The emissions of major sources were shown as Table 3. Assessment of Uncertainty in the Emission Inventory
A quantitative approach, the bootstrap simulation and Monte Carlo sampling, was utilized to analyze uncertainties in sector -based Industrial VOCs emissions estimates. According to previous studies, we have assumed that the activity data
Fig. 1. Regional industrial VOCs emissions in China for 2011(N is short for North China; NE is short for Northeast China; E is short for East China; C & E is short for Central South China; SW is short for Southwest China; NW is short for Northwest China).

Wu et al., Aerosol and Air Quality Research, 15: 1045–1058, 2015 1050
Fig. 2. Provincial industrial VOCs emissions of total sources (a: production of VOCs, b: storage and transport, c: industrial processes using VOCs as raw materials, d: use of VOCs-containing products).
Wu et al., Aerosol and Air Quality Research, 15: 1045–1058, 2015 1051
Fig. 2. (continued).
and emission factor are made for a lognormal distribution (Zhao et al., 2011), besides, we estimate the error for each
emitting subsector by combining the coefficients of variation (CV, or the standard deviation divided by the mean), which

Wu et al., Aerosol and Air Quality Research, 15: 1045–1058, 2015 1052
is based on the reliability of the data sources and the scope of application (Wei et al., 2011). The results show that there exist relatively medium uncertainties, with a 95% confidence interval of-42 to +71%, ranging from 9.2 to 27.2 Tg for this inventory. The 95% confidence interval of sectors are as shown in Table 4 and Fig. 4. The 95% confidence interval of production of VOCs, storage and transport, industrial processes using VOCs as raw materials and use of VOCs-containing products range from –58% to +136%, –61% to +135%, –8% to +83%, –62% to +115%, respectively, which is much higher than that of the total inventory. Considering the uncertainty of the emissions dates back to the transfer from activity data and emission factors, the uncertainty of sectors differs. The way to reducing uncertainty is to establish emission factor database in China, especially in the use of VOCs-containing products.
According to the sensitivity analysis, which were conducted by Monte Carlo with 10 000 simulation, as shown in Table 5, industrial VOCs emissions were assumed to be most sensitive to emission factor of Wood paintings (furniture manufacturing), contributing 37.7%, so a more specific investigation about paintings should be undertaken in China. Comparison with Emission Inventories Comparison with Emission Inventories in China
A comparison was made with other studies in China to validate the inventory developed in this study. Table 6 presents the results and associated information for different studies. We chose some research and compare VOCs emissions in different years and scales, shown as Figs. 5 and 6. The national industrial VOCs emissions, which play an essential role in anthropogenic emissions, have an increase of
Fig. 3. Industrial VOCs emissions per square kilometer (a) and per capita (b).

Wu et al., Aerosol and Air Quality Research, 15: 1045–1058, 2015 1053
Table 3. Industrial VOCs emissions of major sources.
Number Emission source Emissions, Tg Share in total, % 1 Furniture manufacturing 2.88 18.18 2 Petroleum refining 2.28 14.36 3 Chinery equipment manufacturing 1.74 10.96 4 Printing industry 1.61 10.19 5 Storage and transport 1.34 8.45 6 Architectural ornament 1.29 8.14 7 Manufacture of food & drink 0.57 3.59 8 Coke production 0.54 3.41 9 Chemical pesticide 0.39 2.44
10 Synthetic leather 0.38 2.37 11 Basic chemical raw materials manufacturing 0.36 2.30 12 Chemical raw materials 0.33 2.09 13 Thermal power 0.26 1.66 14 Shoemaking industry 0.26 1.64 15 Synthetic fibre 0.25 1.56 16 Primary form of plastic 0.24 1.51 17 Tyre 0.23 1.47 18 Others 0.90 5.67
Table 4. Uncertainty assessment of sector-based source VOCs emission estimates.
Links Sectors 95% confidence interval
Production of VOCs Crude oil and natural gas exploration [–56%, +101%]
[–58%, +136%] Petroleum refining [–67%, +167%] Basic chemical raw materials manufacturing [–75%, +188%]
Storage and transport
Storage & transportation of crude oil [–76%, +185%]
[–61%, +135%] Storage & transportation of gasoline [–82%, +246%] Storage & transportation of other oil [–81%, +255%] Storage & transportation of solvent [–89%, +297%]
Industrial processes using VOCs as raw
materials
Manufacture of paint [–94%, +357%] Manufacture of printing [–100%, +422%]
[–48%, +83%]
Primary form of plastic [–87%, +329%] Synthetic rubber [–100%, +443%] Synthetic fibre [–68%, +163%] Manufacture of adhesive [–269%, +408%] Manufacture of food&drink [–65%, +146%] Chemical raw materials [–85%, +263%] Chemical pesticide [–87%, +247%] Manufacture of commodity [–100%, +100%] Tyre [–87%, +273%]
Use of VOCs-containing products
Textile dyeing [–87%, +307%]
[–62%, +115%]
Synthetic leather [–95%, +371%] Shoemaking industry [–88%, +319%] Printing industry [–83%, +285%] Wood processing [–86%, +324%] Furniture manufacturing [–90%, +320%] Chinery equipment manufacturing [–85%, +263%] Transportation equipment manufacturing [–100%, +330%] Architectural ornament [–354%, +341%] Dry cleaning of clothing [–100%, +353%] Electronic component manufacturing [–100%, +320%] Coke production [–87%, +264%] Paper production [–100%, +194%] Garbage pollution treatment [–68%, +143%]

Wu et al., Aerosol and Air Quality Research, 15: 1045–1058, 2015 1054
Table 4. (continued).
Links Sectors 95% confidence interval Use of VOCs-
containing products Thermal power [–85%, +250%] [–62%, +115%] Heat supply [–80%, +210%] Industrial consumption [–81%, +226%]
Fig. 4. Industrial sector-based source VOCs emissions and uncertainty levels (Columns represent emissions and lines represent 95% confidence interval).
Table 5. The parameters contributing most to the industrial VOCs emissions uncertainties.
Parameter Contribution EF: Wood paintings (furniture manufacturing) 37.7% EF: Other paintings (chinery equipment manufacturing) 16.3% EF: Storage & transportation of crude oil 11.4% EF: Packaging adhesive 10.3% A: Packaging adhesive 2.8% A: Coating for interior walls 2.8% EF: Coke 1.9% EF: Coating for interior walls 1.4% EF: Leakage loss 1.3% EF: Wood paintings (architecture decoration) 1.1%
191% from 2000 to 2011. Meanwhile, the industrial VOCs emissions are 2.8 times compared to the transportation source (Wei et al., 2008), 4.4 times to bio-fuel combustion
source (Wei et al., 2008), 16.5 times to agricultural residues open burning (Wei et al., 2008) and 0.4 times to biogenic volatile organic compounds emissions (Li et al., 2013).

Wu et al., Aerosol and Air Quality Research, 15: 1045–1058, 2015 1055
Besides, the regional industrial VOCs emissions have gone up 1 to 6 times from 2003 to 2011, because currently there
are few control measures or standards for VOCs emissions in China.
Table 6. Comparison with other studies.
Reference Year a Domain Emission source VOCs
emissions, Tg
Inventory uncertainty
95% confidence interval
Streets et al., 2003 2000 China Major anthropogenic sources, including biomass burning
17.4 [–59%, +59%]
Liu et al., 2008 2000 China Anthropogenic source 8.27 / Zhao et al., 2012 2003 Huabei region b Total source 1.77 / Wei et al., 2008 2005 China Anthropogenic source 20.10 [–51%, +133%]
Zheng et al., 2009c 2006 Pearl River Delta (PRD) region Area source 0.314 / Yu et al., 2011 2006 Pearl River Delta (PRD) region Key VOC-related industries 0.417 [–31%, +58%]
Cao et al., 2010 2007 China Industrial source 7.97 / Huang et al., 2011 2007 Yangtze River Delta (YRD)
region Anthropogenic source 2.77 /
Chen et al., 2012 2009 China Industrial source 12.06 / Yang, 2012 2010 China Industrial source 13.36 /
Fu et al., 2013 2010 Yangtze River Delta (YRD) region
Total source 3.82 [–52%, +105%]
He et al., 2013 2010 Sichuan Stationary source 0.18 / This study 2011 China Industrial source 15.8 [–42%, +71%]
a Year refers when the inventories were established. b Huabei region includes administratively the Beijing and Tianjin Municipalities, Hebei and Shanxi Provinces, and Inner-Mongolia Autonomous Region.
Fig. 5. Comparison of national VOCs emissions inventories established by different studies (Columns represent emissions and lines represent 95% confidence interval).

Wu et al., Aerosol and Air Quality Research, 15: 1045–1058, 2015 1056
Fig. 6. Comparison of regional VOCs emissions inventories established by different studies (The industrial VOCs emissions of PRD in this study refer to Guangdong province, the industrial VOCs emissions of YRD in this study refer to Zhejiang province, Jiangsu province and Shanghai city).
Table 7. Comparison with other countries.
Country Year Industrial VOCs emissions, Tg Anthropogenic VOCs emissions, Tg China 2011 15.8 /
European a 2006 9.9 15.1 American b 2011 6.0 16.4
a data from Pouliot et al., 2012. b data from USEPA, http://www.epa.gov/cgi-bin/broker?polchoice=VOC&_debug=0&_service=data&_program=dataprog.national_1.sas
Comparison with Emission Inventories in world Industrial VOCs emissions in different countries were
summarized in Table 7. It shows the industrial VOCs emissions in China are 0.6 times larger than that in European, and 1.6 times larger than that in American. In terms of the results from other countries, it is time to properly balance the development of high emission industries and VOCs emissions. CONCLUSIONS AND RECOMMENDATIONS
Industrial sector-based source VOCs emissions inventory was developed for the year 2011 in China with the use of ‘emission factor method’, adopting a ‘bottom-up’ approach based on local source information. It is estimated from the inventory that the total emissions of industrial VOCs were 15.8 Tg for the year 2011, 59.7% of which came from the use of VOCs-containing products.
In general, the industrial VOCs emissions in East China
accounted for 40% of total, ranking first in regions. The emission from furniture manufacturing, petroleum refining, chinery equipment manufacturing and printing industry were dominant based on the emission inventory, therefore, more efficient VOCs control technologies should be paid attention to and promoted, especially in mayor sources.
Heavy emission densities were shown in East China, the average emission intensity in coastal provinces was much higher than that in inland provinces, part of that was because uneven in development existed among regions.
Relatively medium uncertainties were quantified with a 95% confidence interval of-42 to +71%, ranging from 9.2 to 27.2 Tg for VOCs estimates. It is highly necessary to strengthen the test of VOCs emission factors in China, whatever industrial or anthropogenic.
VOCs, as the key precursors of atmosphere pollutant, required to be reduced in order to improve the regional ozone and secondary aerosol pollution. However, the relevant

Wu et al., Aerosol and Air Quality Research, 15: 1045–1058, 2015 1057
regulations of VOCs have been neither comprehensive nor definite currently in China. As a consequence, more targeted and efficient control measures on reducing VOCs emissions are needed to be promoted in the national or regional planning. ACKNOWLEDGEMENT
This work was supported by the Key Consulting Project of China Academy of Engineering (Grant No. 2013-ZD-2-2), the National Science and Technology Pillar Program during the 12th Five-year Plan Period (Grant No. 2012BAB18B03), the Environmental Welfare Project of Ministry of Environmental Protection of China (Grant No. 201409008), the National Science Foundation for Distinguished Young Scholars of China (Grant No. 51125025), and the Key Innovation Team for Science and Technology of Zhejiang Province (Grant No. 2011R50017). REFERENCE Cai, C.J., Geng, F.H., Tie, X.X., Yu, Q. and An, J.L. (2010).
Characteristics and Source Apportionment of VOCs Measured in Shanghai, China. Atmos. Environ. 44: 5005–5014.
Cao, G.L., An, X.Q., Zhou, C.H., Ren, Y.Q. and Tu, J. (2010). Emission Inventory of Air Pollutants in China. China Environ. Sci. 30: 900–906 (in Chinese).
Chameides, W.L., Li, X.S., Tang, X.Y., Zhou, X.J., Luo, C., Kiang, C.S., John, J.St., Saylor, R.D., Liu, S.C., Lam, K.S., Wang, T. and Giorgi, F. (1999). Is Ozone Pollution Affecting Crop Yields in China? Geophys. Res. Lett. 26: 867–870.
Chan, C.K. and Yao, X.H. (2008). Air Pollution in Mega Cities in China. Atmos. Environ. 42: 1–42.
Chen, L.H., Sun, Y.Y., Wu, X.C., Zhang, Y.X., Zheng, C.H., Gao, X. and Cen, K.F. (2014). Unit-based Emission Inventory and Uncertainty Assessment of Coal-fired Power Plants. Atmos. Environ. 99: 527–535.
Chen, Y., Ye, D.Q., Liu, X.Z., Wu, J.L., Huang, B.C. and Zheng, Y.N. (2012). Source Tracing and Characteristics of Industrial VOCs Emissions in China. China Environ. Sci. 32: 48–55 (in Chinese).
Fu, X., Wang, S.X., Zhao, B., Xing, J., Cheng, Z., Liu, H. and Hao, J.M. (2013). Emission Inventory of Primary Pollutants and Chemical Speciation in 2010 for the Yangtze River Delta Region, China. Atmos. Environ. 70: 39–50.
He, M., Wang, X.R. and Han, L. (2013). Air Pollutant Emission Inventory and Characteristics from Stationary Sources in Sichuan Province. Acta Sci. Circumst. 33: 3127–3137 (in Chinese).
Huang, C., Chen, C.H., Li, L., Cheng, Z., Wang, H.L., Huang, H.Y., Streets, D.G., Wang, Y.J., Zhang, G.F. and Chen, Y.R. (2011). Emission Inventory of Anthropogenic Air Pollutants and VOC Species in the Yangtze River Delta Region, China. Atmos. Chem. Phys. 11: 4105–4120.
Huang, K., Fu, J.S., Gao, Y., Dong, X.Y., Zhuang, G.S. and Lin, Y.F. (2014). Role of Sectoral and Multi-pollutant Emission Control Strategies in Improving Atmospheric
Visibility in the Yangtze River Delta, China. Environ. Pollut. 184: 426–434.
Klimont, Z., Cofala, J., Schöpp, W., Amann, M., Streets, D.G., Ichikawa, Y. and Fujita, S. (2001). Projections of SO2, NOx, NH3 and VOC Emissions in East Asia up to 2030. Water Air Soil Pollut. 130: 193–198.
Li, L., Chen, C.H., Fu, J.S., Huang, C., Streets, D.G., Huang, H.Y., Zhang, G.F., Wang.Y.J., Jang, C.J., Wang, H.L., Chen, Y.R. and Fu, J.M. (2011). Air Quality and Emissions in the Yangtze River Delta, China. Atmos. Chem. Phys. 11: 1621–1639.
Li, L.Y., Chen, Y. and Xie, S.D. (2013). Spatio-temporal Variation of Biogenic Volatile Organic Compounds Emissions in China. Environ. Pollut. 182: 157–168.
Ling, Z.H., Guo, H., Cheng, H.R. and Yu, Y.F. (2011). Sources of Ambient Volatile Organic Compounds and Their Contributions to Photochemical Ozone Formation at a Site in the Pearl River Delta, Southern China. Environ. Pollut. 159: 2310–2319.
Liu, J.F., Zhao, J., Li, T.T., Bai, Y.H. and Liu, Z.R. (2008). Establishment of Chinese anthropogenic Source Volatile Organic Compounds Emission Inventory. China Environ. Sci. 28: 496–500 (in Chinese).
Liu, Y., Shao, M., Lu, S.H., Chang, C.C., Wang, J.L. and Fu, L.L. (2008). Source Apportionment of Ambient Volatile Organic Compounds in the Pearl River Delta, China: Part II. Atmos. Environ. 42: 6261–6274.
Lu, Q., Zheng, J.Y., Ye, S.Q., Shen, X.L., Yuan, Z.B. and Yin, S.S. (2013). Emission Trends and Source Characteristics of SO2, NOx, PM10 and VOCs in the Pearl River Delta Region from 2000 to 2009. Atmos. Environ. 76: 11–20.
Pouliot, G., Pierce, T., van der Gon, H.D., Schaap, M., Moran, M. and Nopmongcol, U. (2012). Comparing Emission Inventories and Model-ready Emission Datasets between Europe and North America for the AQMEII Project. Atmos. Environ. 53: p. 4–14.
Schneidemesser, E.V., Monks, P.S. and Plass-Duelmer, C. (2010). Global Comparison of VOC and CO Observations in Urban Areas. Atmos. Environ. 44: 5053–5064.
Shao, M., Zhang, Y.H., Zeng, L.M., Tang, X.Y., Zhang, J., Zhong, L.J. and Wang, B.G. (2009). Ground-level Ozone in the Pearl River Delta and the Roles of VOC and NOx in Its Production. J. Environ. Manage. 90: 512–518.
Shin, H.J., Roh, S.A., Kim, J.C., Lee, S.J. and Kim, Y.P. (2013). Temporal Variation of Volatile Organic Compounds and Their Major Emission Sources in Seoul, Korea. Environ. Sci. Pollut. Res. Int. 20: 8717–8728.
Streets, D.G., Zhang, Q., Wang, L.T., He, K.B., Hao, J.M., Wu, Y., Tang, Y.H. and Carmichael, G.R. (2006). Revisiting China's CO Emissions after the Transport and Chemical Evolution over the Pacific (TRACE-P) Mission: Synthesis of Inventories, Atmospheric Modeling, and Observations. J. Geophys. Res. 111, doi: 10.1029/2006JD007118.
Wang, S.X. and Hao, J.M. (2012). Air Quality Management in China: Issues, Challenges, and Options. J. Environ Sci. 24: 2–13.
Wang, X.P., Mauzerall, D.L., Hu, Y.T., Russell, A.G., Larson, E.D., Woo, J.H., Streets, D.G. and Guenther, A. (2005). A High-resolution Emission Inventory for Eastern China
Wu et al., Aerosol and Air Quality Research, 15: 1045–1058, 2015 1058
in 2000 and Three Scenarios for 2020. Atmos. Environ. 39: 5917–5933.
Wei, W., Wang, S.X., Chatani, S., Klimont, Z., Cofala, J. and Hao, J.M. (2008). Emission and Speciation of Non-methane Volatile Organic Compounds from Anthropogenic Sources in China. Atmos. Environ. 42: 4976–4988.
Wei, W., Wang, S.X. and Hao, J.M. (2011). Uncertainty Analysis of Emission Inventory for Volatile Organic Compounds from Anthropogenic Sources in China. Environ. Sci. 32: 305–312 (in Chinese).
Xue, L.K., Wang, T., Gao, J., Ding, A.J., Zhou, X.H., Blake, D.R., Wang, X.F., Saunders,S.M., Fan, S.J., Zuo, H.C., Zhang, Q.Z. and Wang, W.X. (2013). Ozone Production in Four Major Cities of China: Sensitivity to Ozone Precursors and Heterogeneous Processes. Atmos. Chem. Phys. Discuss. 13: 27243–27285.
Yang, L.X. (2012). Study on Temporal-spatial Characteristic and Control Strategy of Industrial Emissions of Volatile Organic Compounds in China. Master’s Thesis, South China University of Technology (in Chinese).
Yu, Y.F., Lu, Q., Zheng, J.Y. and Zhong, L.J. (2011). VOC Emission Inventory and Its Uncertainty from the Key VOC-related Industries in the Pearl River Delta Region. China Environ. Sci. 31: 195–201 (in Chinese).
Yuan, B., Hu, W.W., Shao, M., Wang, M., Chen, W.T., Lu, S.H., Zeng, L.M. and Hu, M. (2013). VOC Emissions, Evolutions and Contributions to SOA Formation at a Receptor Site in Eastern China. Atmos. Chem. Phys. 13: 8815–8832.
Zhao, B., Wang, P., Ma, J.Z., Zhu, S., Pozzer, A. and Li, W. (2012). A High-resolution Emission Inventory of Primary Pollutants for the Huabei Region, China. Atmos. Chem. Phys. 12: 481–501.
Zhao, C., Wang, Y.H. and Zeng, T. (2009). East China Plains: A “Basin” of Ozone Pollution. Environ. Sci. Technol. 43: 1911–1915.
Zhao, Y., Nielsen, C.P., Lei, Y., McElroy, M.B. and Hao, J. (2011). Quantifying the Uncertainties of a Bottom-up Emission Inventory of Anthropogenic Atmospheric Pollutants in China. Atmos. Chem. Phys. 11: 2295–2308.
Zheng, J.Y., Shao, M., Che, W.W., Zhang, L.J., Zhong, L.J., Zhang, Y.H. and Streets, D. (2009a). Speciated VOC Emission Inventory and Spatial Patterns of Ozone Formation Potential in the Pearl River Delta, China. Environ. Sci. Technol. 43: 8580–8586.
Zheng, J.Y., Zhang, L.J., Che, W.W., Zheng, Z.Y. and Yin, S.S. (2009b). A Highly Resolved Temporal and Spatial Air Pollutant Emission Inventory for the Pearl River Delta Region, China and Its Uncertainty Assessment. Atmos. Environ. 43: 5112–5122.
Zheng, J.Y., Zhang, L.J., Zhong, L.J. and Wang, Z.L. (2009c). Area Source Emission Inventory of Air Pollutant and Its Spatial Distribution Characteristics in Pearl River Delta. China Environ. Sci.29: 455–460 (in Chinese).
Zheng, J.Y., Zheng, Z.Y., Yu, Y.F. and Zhong, L.J. (2010). Temporal, Spatial Characteristics and Uncertainty of Biogenic VOC Emissions in the Pearl River Delta Region, China. Atmos. Environ. 44: 1960–1969.
Zhou, J., You, Y., Bai, Z.P., Hu, Y.D., Zhang, J.F. and Zhang, N. (2011). Health Risk Assessment of Personal Inhalation Exposure to Volatile Organic Compounds in Tianjin, China. Sci. Total Environ. 409: 452–459.
Zhu, X.D. and Liu, Y. (2014). Characterization and Risk Assessment of Exposure to Volatile Organic Compounds in Apartment Buildings in Harbin, China. Bull. Environ. Contam. Toxicol. 92: 96–102.
Received for review, October 10, 2014 Revised, December 3, 2014
Accepted, December 31, 2014