Chapter 6 The Binomial Probability Distribution and Related Topics Understanding Basic Statistics...
27
Chapter 6 The Binomial Probability Distribution and Related Topics Understanding Basic Statistics Fifth Edition By Brase and Brase Prepared by Jon Booze
-
Upload
magnus-fisher -
Category
Documents
-
view
233 -
download
1
Transcript of Chapter 6 The Binomial Probability Distribution and Related Topics Understanding Basic Statistics...
Chapter 6The Binomial
Probability Distribution and Related Topics
Understanding Basic Statistics Fifth Edition
By Brase and Brase Prepared by Jon Booze
6 | 2Copyright © Cengage Learning. All rights reserved.
Statistical Experiments and Random Variables
• Statistical Experiments – any process by which measurements are obtained.
• A quantitative variable, x, is a random variable if its value is determined by the outcome of a random experiment.
• Random variables can be discrete or continuous.
6 | 3Copyright © Cengage Learning. All rights reserved.
Random Variables and Their Probability Distributions
• Discrete random variables – can take on only a countable or finite number of values.
• Continuous random variables – can take on countless values in an interval on the real line
• Probability distributions of random variables – An assignment of probabilities to the specific values or a range of values for a random variable.
6 | 4Copyright © Cengage Learning. All rights reserved.
Random Variables and Their Probability Distributions
Which measurement involves a discrete random variable?
a). Determine the mass of a randomly-selected pennyb). Assess customer satisfaction rated from 1 (completely satisfied) to 5 (completely dissatisfied).c). Find the rate of occurrence of a genetic disorder in a given sample of persons.d). Measure the percentage of light bulbs with lifetimes less than 400 hours.
6 | 5Copyright © Cengage Learning. All rights reserved.
Random Variables and Their Probability Distributions
Which measurement involves a discrete random variable?
a). Determine the mass of a randomly-selected pennyb). Assess customer satisfaction rated from 1 (completely satisfied) to 5 (completely dissatisfied).c). Find the rate of occurrence of a genetic disorder in a given sample of persons.d). Measure the percentage of light bulbs with lifetimes less than 400 hours.
6 | 6Copyright © Cengage Learning. All rights reserved.
Discrete Probability Distributions
1) Each value of the random variable has an assigned probability.
2) The sum of all the assigned probabilities must equal 1.
6 | 7Copyright © Cengage Learning. All rights reserved.
Probability Distribution Features
• Since a probability distribution can be thought of as a relative-frequency distribution for a very large n, we can find the mean and the standard deviation.
• When viewing the distribution in terms of the population, use µ for the mean and σ for the standard deviation.
6 | 8Copyright © Cengage Learning. All rights reserved.
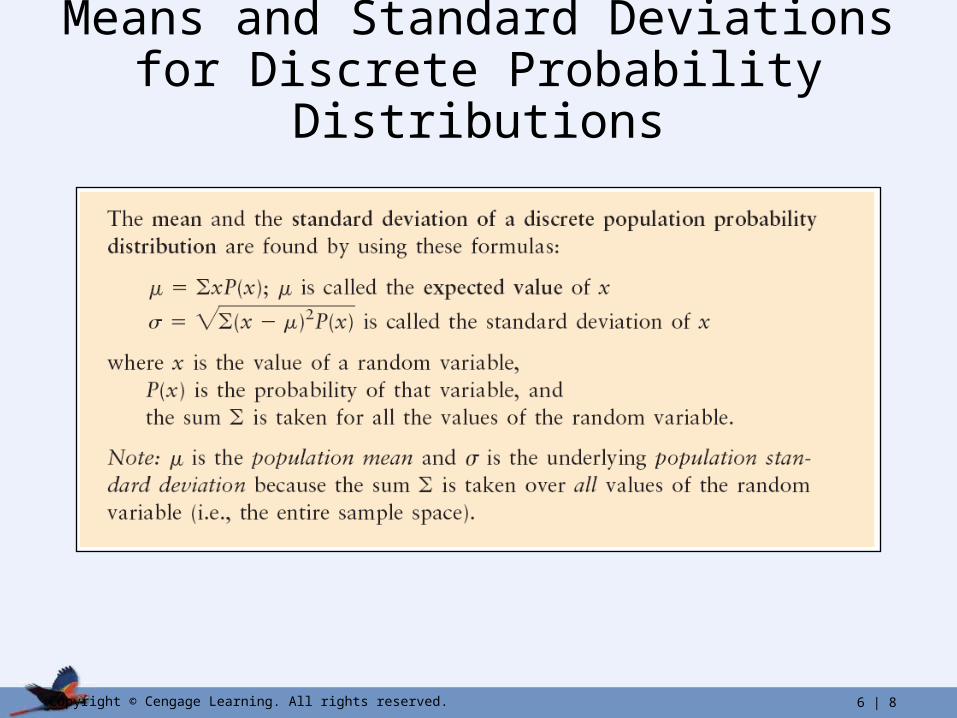
Means and Standard Deviations for Discrete Probability Distributions
6 | 9Copyright © Cengage Learning. All rights reserved.
Binomial Experiments
1) There are a fixed number of trials. This is denoted by n.
2) The n trials are independent and repeated under identical conditions.
3) Each trial has two outcomes:
S = success F = failure
6 | 10Copyright © Cengage Learning. All rights reserved.
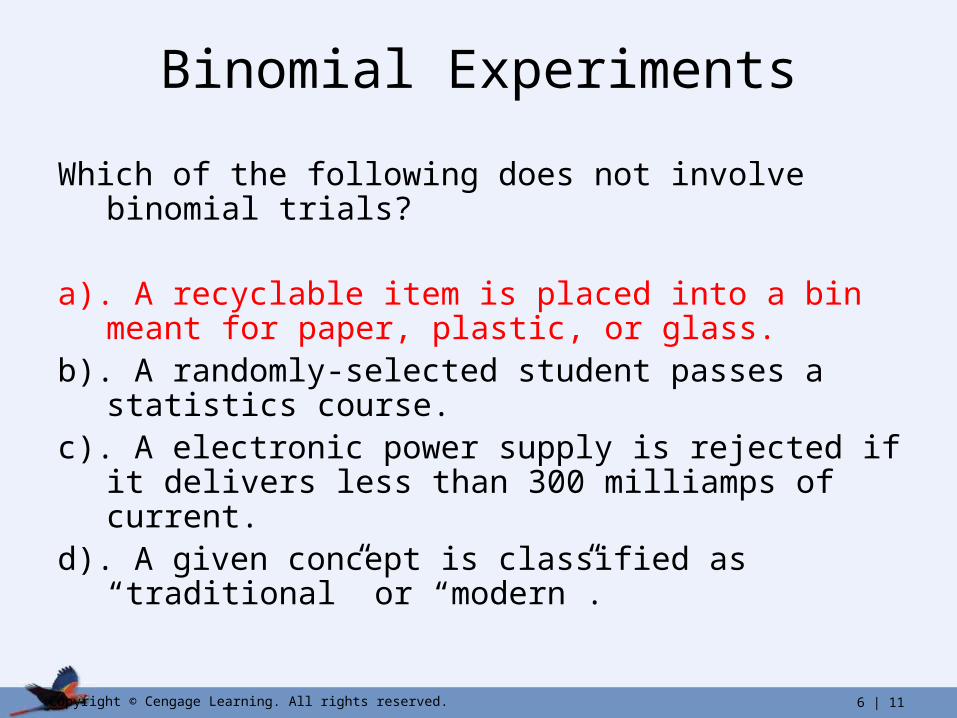
Binomial Experiments
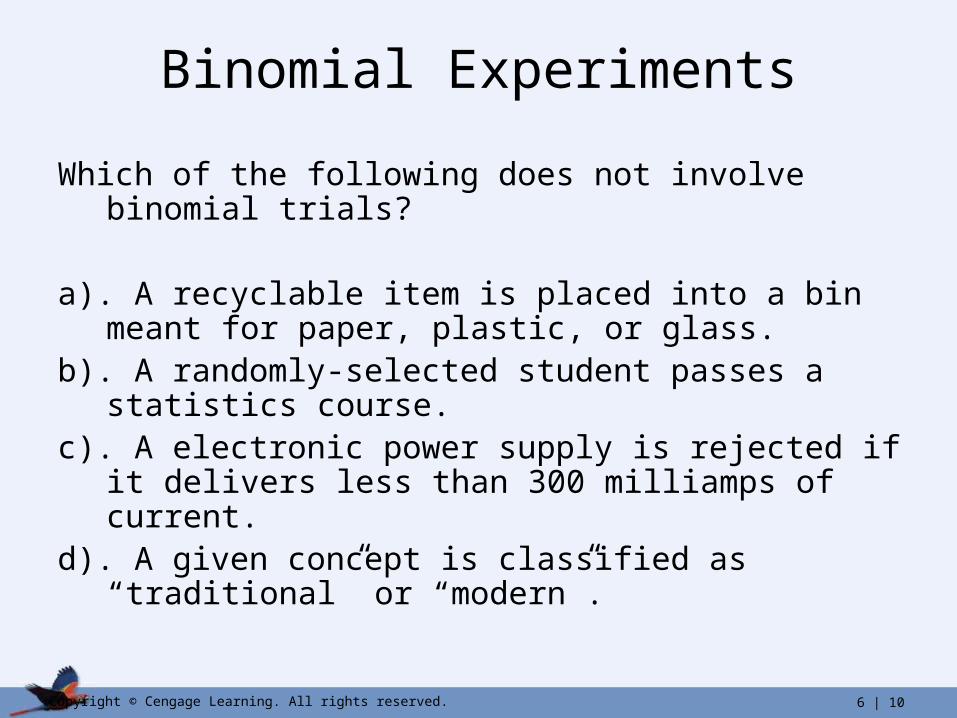
Which of the following does not involve binomial trials?
a). A recyclable item is placed into a bin meant for paper, plastic, or glass.
b). A randomly-selected student passes a statistics course.c). A electronic power supply is rejected if it delivers less
than 300 milliamps of current.d). A given concept is classified as “traditional” or “modern”.
6 | 11Copyright © Cengage Learning. All rights reserved.
Binomial Experiments
Which of the following does not involve binomial trials?
a). A recyclable item is placed into a bin meant for paper, plastic, or glass.
b). A randomly-selected student passes a statistics course.c). A electronic power supply is rejected if it delivers less
than 300 milliamps of current.d). A given concept is classified as “traditional” or “modern”.
6 | 12Copyright © Cengage Learning. All rights reserved.
Binomial Experiments
4) For each trial, the probability of success, p, remains the same. Thus, the probability of failure is 1 – p = q.
5) The central problem is to determine the probability of r successes out of n trials.
6 | 13Copyright © Cengage Learning. All rights reserved.
Determining Binomial Probabilities
1) Use the Binomial Probability Formula.
2) Use Table 2 of the appendix.
3) Use technology.
6 | 14Copyright © Cengage Learning. All rights reserved.
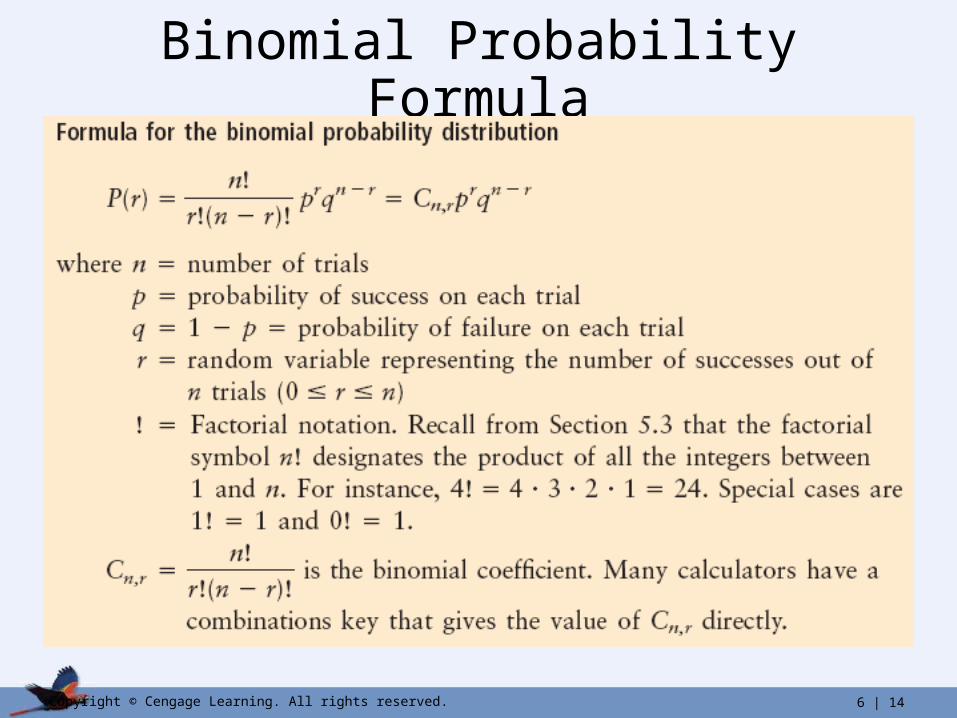
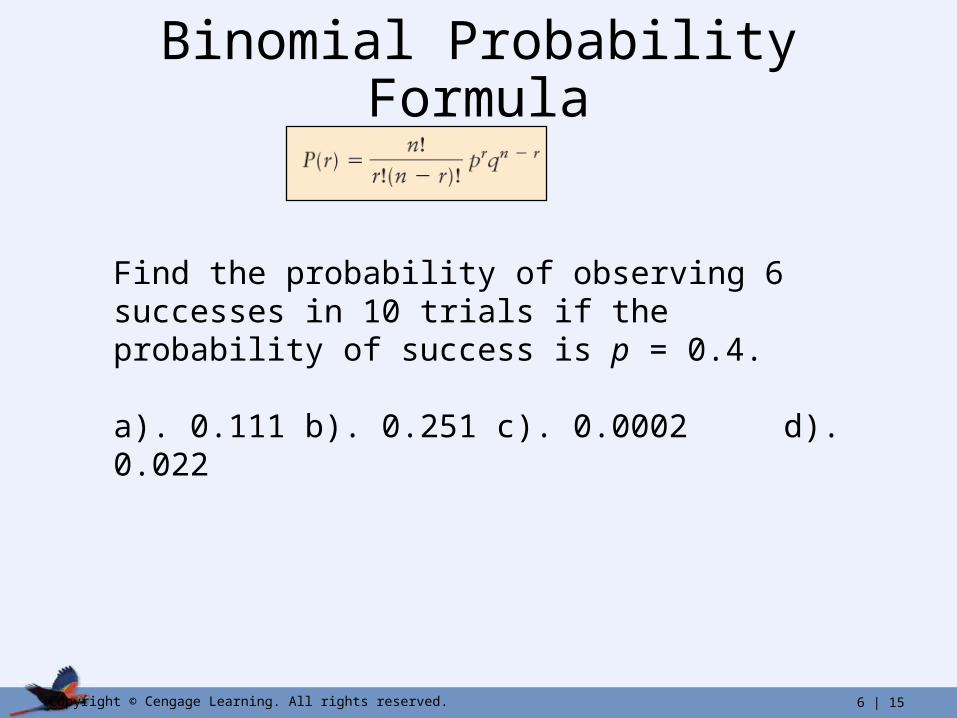
Binomial Probability Formula
6 | 15Copyright © Cengage Learning. All rights reserved.
Binomial Probability Formula
Find the probability of observing 6 successes in 10 trials if the probability of success is p = 0.4.
a). 0.111 b). 0.251 c). 0.0002 d). 0.022
6 | 16Copyright © Cengage Learning. All rights reserved.
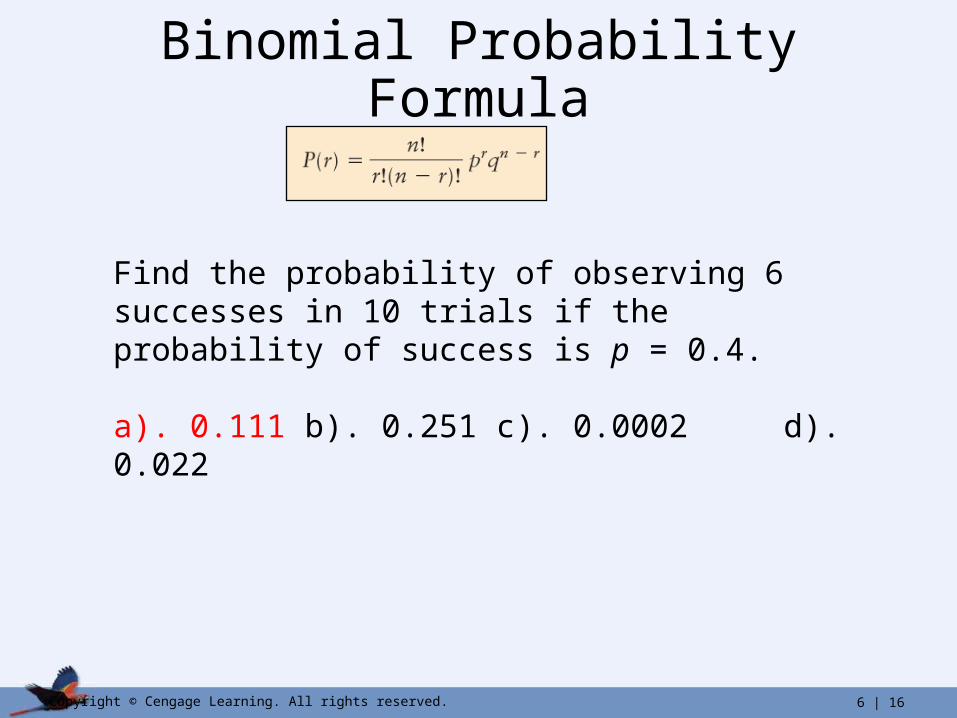
Binomial Probability Formula
Find the probability of observing 6 successes in 10 trials if the probability of success is p = 0.4.
a). 0.111 b). 0.251 c). 0.0002 d). 0.022
6 | 17Copyright © Cengage Learning. All rights reserved.
Using the Binomial Table
1) Locate the number of trials, n.
2) Locate the number of successes, r.
3) Follow that row to the right to the corresponding p column.
6 | 18Copyright © Cengage Learning. All rights reserved.
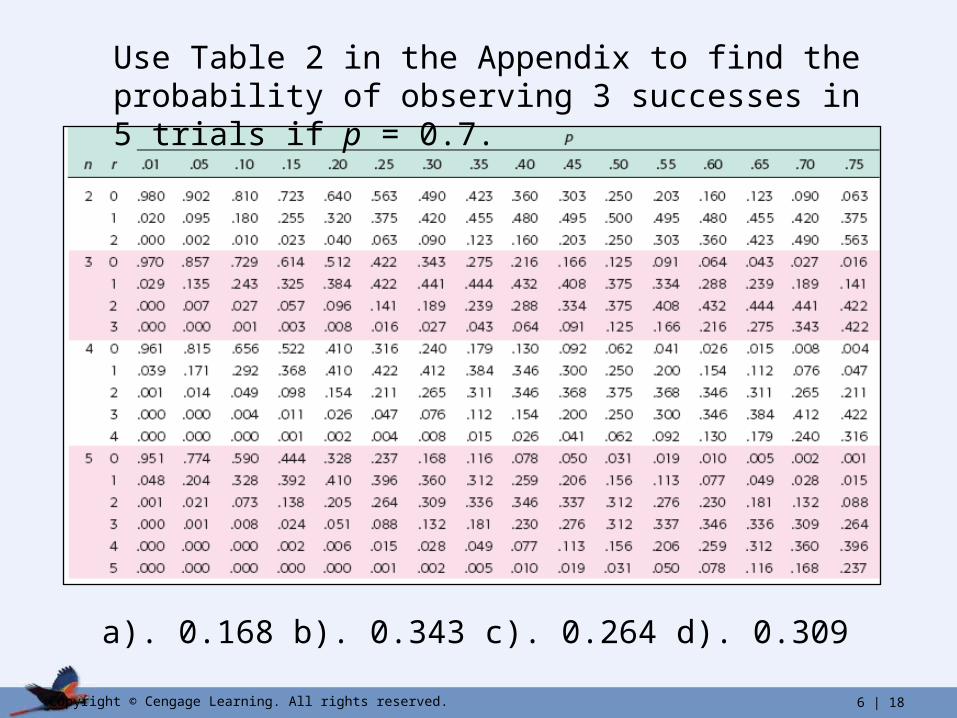
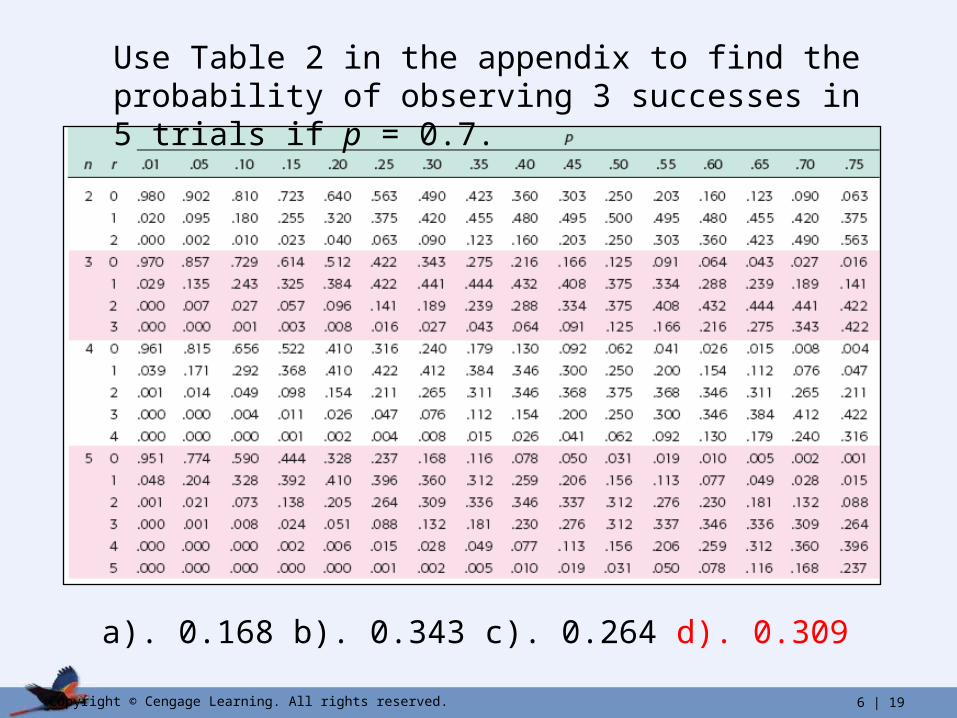
a). 0.168 b). 0.343 c). 0.264 d). 0.309
Use Table 2 in the Appendix to find the probability of observing 3 successes in 5 trials if p = 0.7.
6 | 19Copyright © Cengage Learning. All rights reserved.
a). 0.168 b). 0.343 c). 0.264 d). 0.309
Use Table 2 in the appendix to find the probability of observing 3 successes in 5 trials if p = 0.7.
6 | 20Copyright © Cengage Learning. All rights reserved.
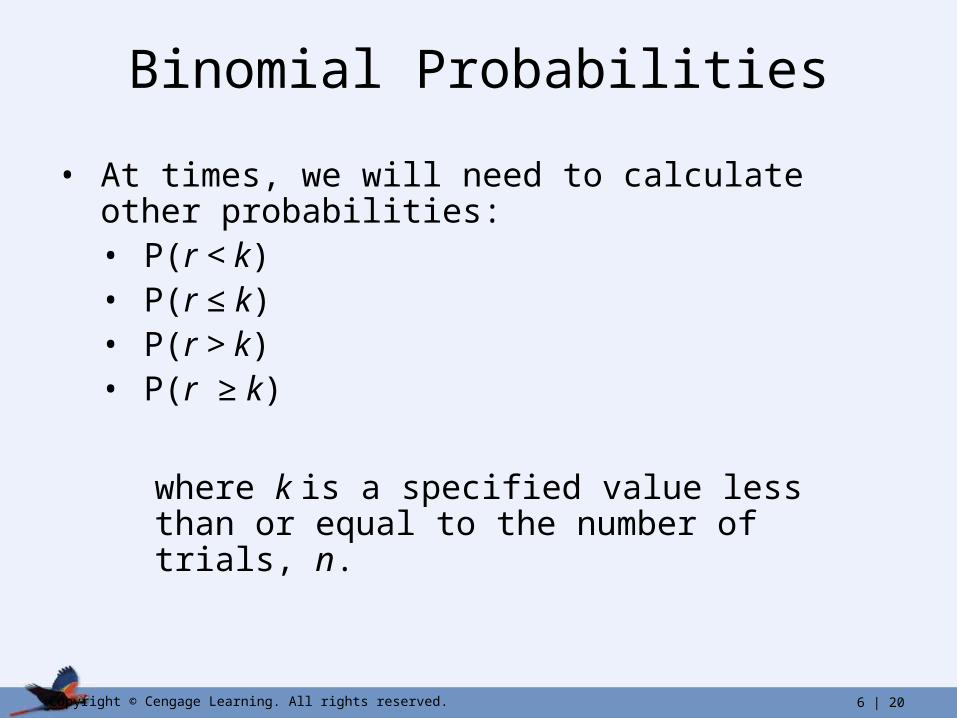
Binomial Probabilities
• At times, we will need to calculate other probabilities:• P(r < k)• P(r ≤ k)• P(r > k)• P(r ≥ k)
where k is a specified value less than or equal to the number of trials, n.
6 | 21Copyright © Cengage Learning. All rights reserved.
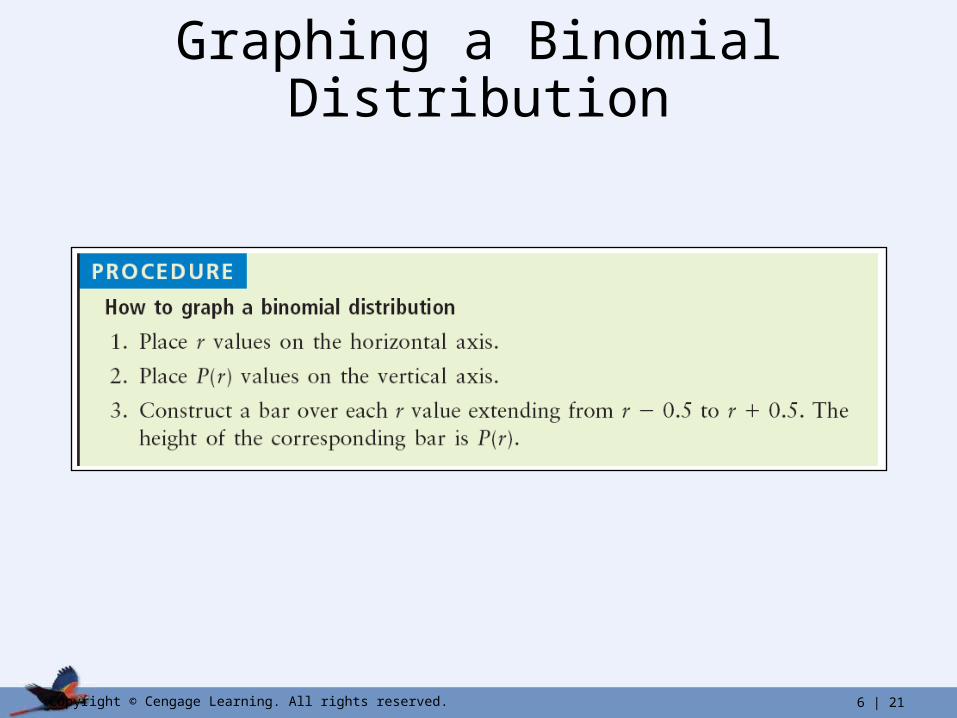
Graphing a Binomial Distribution
6 | 22Copyright © Cengage Learning. All rights reserved.
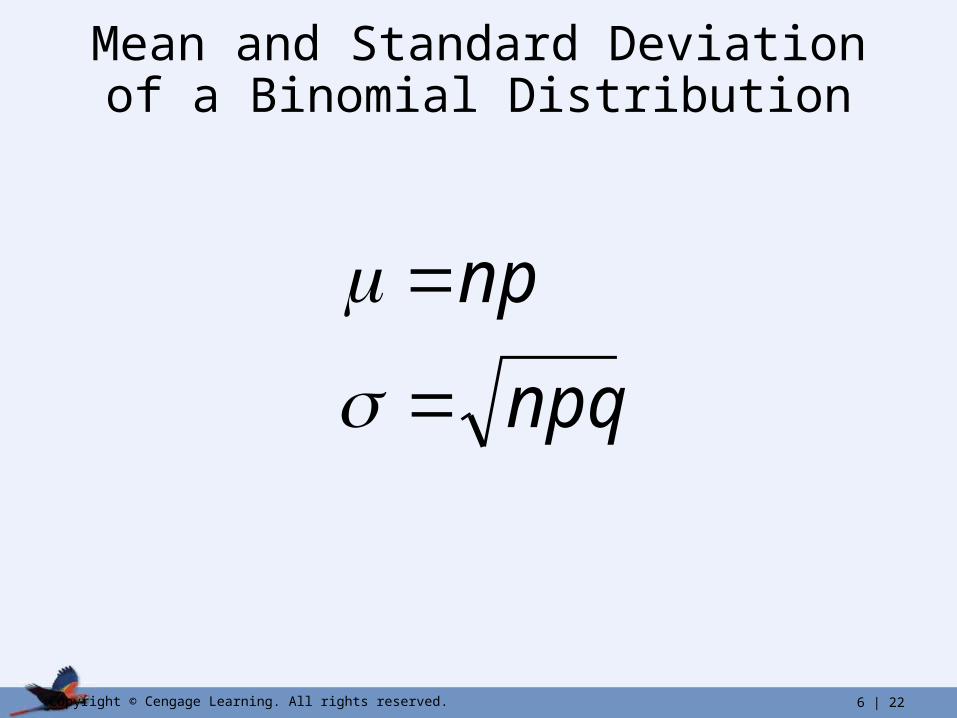
Mean and Standard Deviation of a Binomial Distribution
npq
np
=
=
σ
μ
6 | 23Copyright © Cengage Learning. All rights reserved.
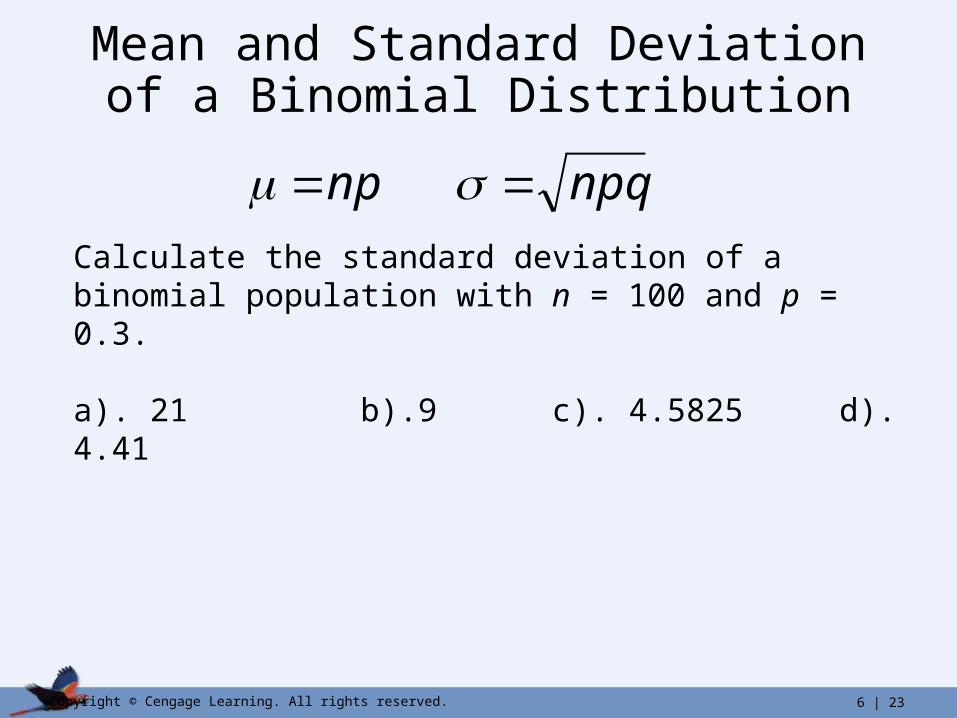
Mean and Standard Deviation of a Binomial Distribution
npqnp == σμ Calculate the standard deviation of a binomial population with n = 100 and p = 0.3.
a). 21 b).9 c). 4.5825 d). 4.41
6 | 24Copyright © Cengage Learning. All rights reserved.
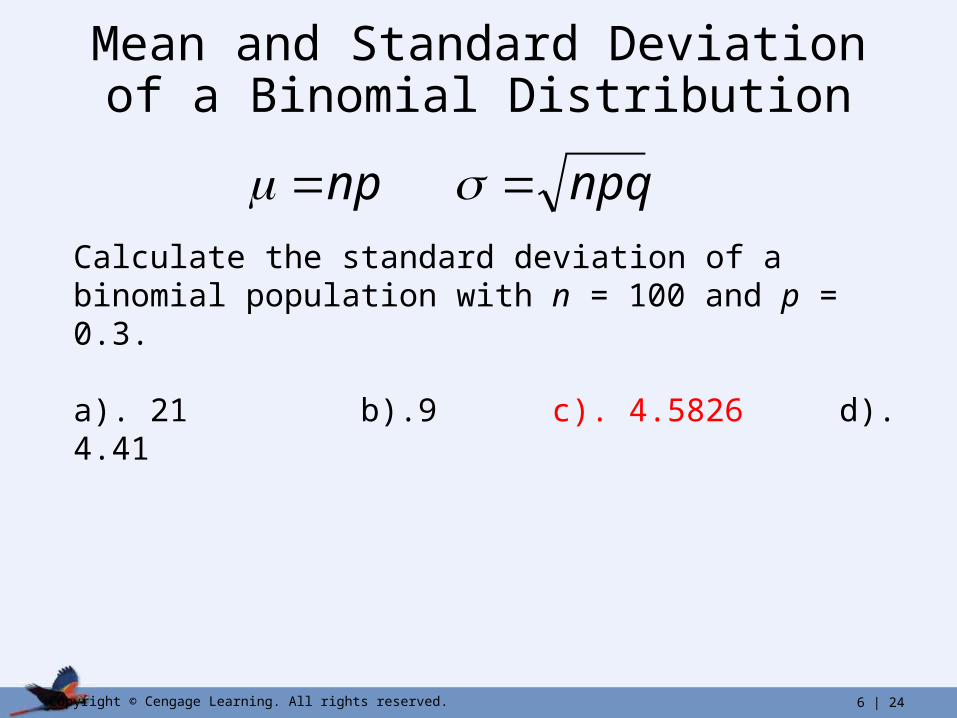
Mean and Standard Deviation of a Binomial Distribution
npqnp == σμ Calculate the standard deviation of a binomial population with n = 100 and p = 0.3.
a). 21 b).9 c). 4.5826 d). 4.41
6 | 25Copyright © Cengage Learning. All rights reserved.
Critical Thinking
• Unusual values – For a binomial distribution, it is unusual for the number of successes r to be more than 2.5 standard deviations from the mean.
– This can be used as an indicator to determine whether a specified number of r out of n trials in a binomial experiment is unusual.
6 | 26Copyright © Cengage Learning. All rights reserved.
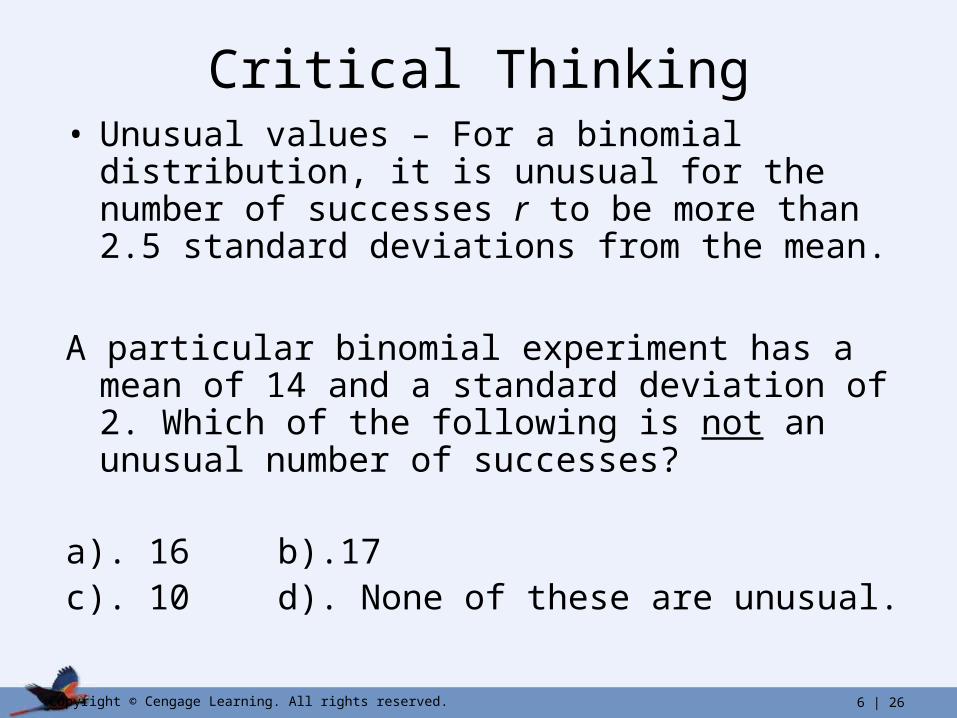
Critical Thinking• Unusual values – For a binomial distribution, it is
unusual for the number of successes r to be more than 2.5 standard deviations from the mean.
A particular binomial experiment has a mean of 14 and a standard deviation of 2. Which of the following is not an unusual number of successes?
a). 16 b).17c). 10 d). None of these are unusual.
6 | 27Copyright © Cengage Learning. All rights reserved.
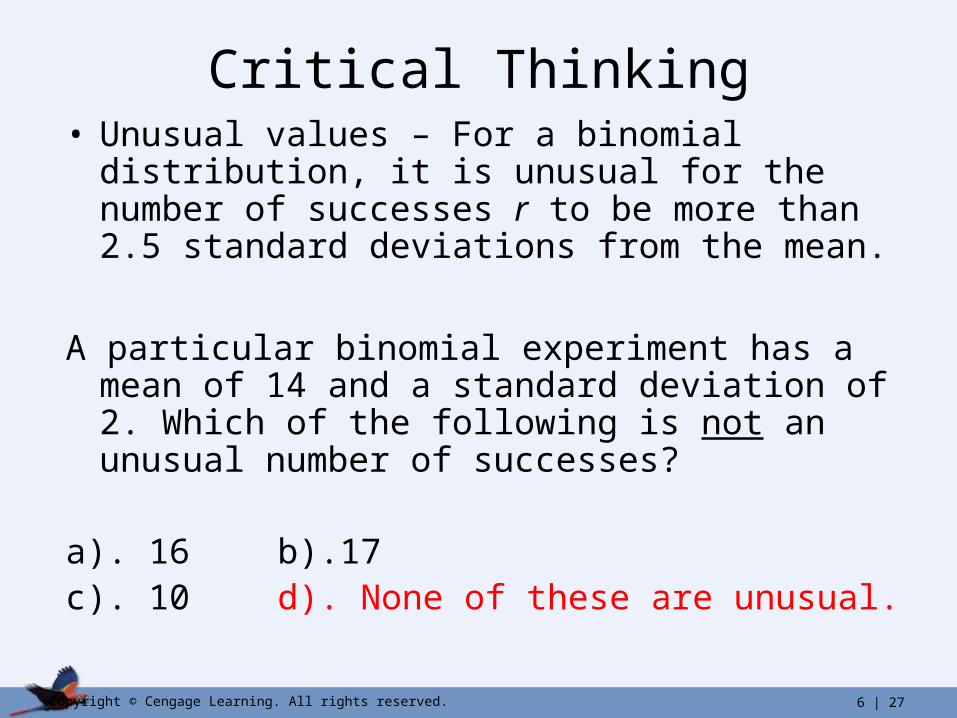
Critical Thinking• Unusual values – For a binomial distribution, it is
unusual for the number of successes r to be more than 2.5 standard deviations from the mean.
A particular binomial experiment has a mean of 14 and a standard deviation of 2. Which of the following is not an unusual number of successes?
a). 16 b).17c). 10 d). None of these are unusual.