Chapter 3. Murine left ventricular pressure-volume loops · Chapter 3. Murine left ventricular...
32
Chapter 3. Murine left ventricular pressure-volume loops 1 Left ventricular pressure-volume measurements in mice Daniel J. Lips, Theo van der Nagel, Paul Steendijk, Meindert Palmen, Ben Janssen, Jan-Melle van Dantzig, Leon J. de Windt and Pieter A. Doevendans In modified version in press Basic Res Cardiol.
Transcript of Chapter 3. Murine left ventricular pressure-volume loops · Chapter 3. Murine left ventricular...

Chapter 3 Murine left ventricular pressure-volume loops
1
Left ventricular pressure-volume measurements in mice
Daniel J Lips Theo van der Nagel Paul Steendijk Meindert Palmen Ben
Janssen Jan-Melle van Dantzig Leon J de Windt and Pieter A Doevendans
In modified version in press Basic Res Cardiol
Chapter 3 Murine left ventricular pressure-volume loops
2
Abstract
Genetically engineered mice are used in experiments in cardiovascular research The
in vivo assessment of cardiac performance demands accurate methods Overall cardiac
performance can be acquired by simultaneous and continuous left ventricular pressure and
volume (PV) measurements through the use of an intraventricular 14 F ultraminiature
conductance-micromanometer catheter positioned in the left ventricular cavity of intact mice
Cardiac performance is represented in the two-dimensional graph plotting pressure and
volume into PV-loops PV-loops adequately represent cardiac function and provide load and
heart rate independent parameters of intrinsic myocardial contractility and relaxation All
sorts of cardiopathological situations can be investigated thoroughly with the use of PV-
measurements
Chapter 3 Murine left ventricular pressure-volume loops
3
Introduction
The use of murine transgenic and gene-targeted models in the field of cardiovascular
research has shown an exponential growth since this approach provides essential genetic and
molecular insight into human congenital and acquired heart disease By manipulating and
investigating cardiac gene expression by means of accurate techniques to analyze the resultant
phenotype the molecular basis for cardiac dysfunction may be uncovered
To date multiple techniques allow assessment of murine left ventricular hemodynamic
behavior(12) such as MRI (3) transthoracic ultrasonography (4) Langendorff perfusion
systems (5) aortic flow probes (6) micromanometers (7) and more recently conductance-
micromanometers (8) The use of conductance-micromanometers allows generation of
instantaneous pressure and volume signals to create pressure-volume (PV) relations for highly
accurate assessment of left ventricular performance The PV-loop method is regarded as the
golden standard for assessment of intrinsic myocardial function in large animals (9) and
humans (10) Recently the development of miniaturized PV-catheters has made this
methodology applicable to small animals such as mice (8)
The method of PV-loop assessment will be discussed in the following paragraphs
More detailed information about the acquisition of left ventricular volume will be provided
and the concepts of parallel conductance and volume correction factors are introduced The
surgical protocols for open-chest and closed-chest PV measurements and the difference in
cardiac performance between these two protocols are part of the discussion How to read PV-
loops completes the chapter
Chapter 3 Murine left ventricular pressure-volume loops
4
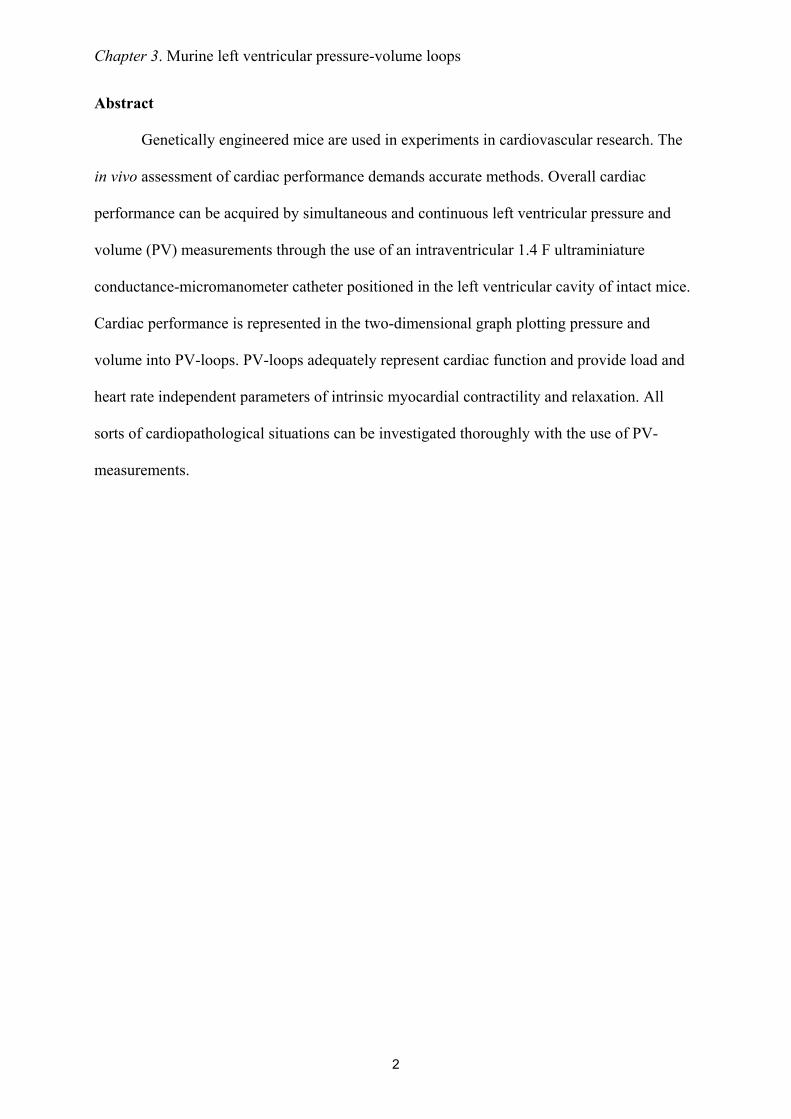
Fig 1 Presentation of the size of the Millar conductance-micromanometer The catheter is
placed in the left ventricle from a longitudinal sliced murine heart The tip of the catheter is
placed in the apex of the heart while the proximal part runs through the aortic valves From
top to bottom are seen two volume electrodes the pressure sensor and at the bottom two
volume electrodes An index finger indicates the miniature size of the catheter
Figure 1
Chapter 3 Murine left ventricular pressure-volume loops
5
The assessment of pressure-volume loops
PV loops are obtained by the conductance-micromanometer miniaturized for invasive
use in rodents (figure 1) (11) The volume-signal is derived in accordance with Ohmrsquos Law
ldquoThe amount of current flowing in a circuit made up of pure resistances is directly
proportional to the electromotive forces impressed on the circuit and inversely proportional to
the total resistance of the circuitrdquo In the setting of a mouse heart is the circuit of pure
resistances an analogue for ventricular bloodvolume the electromotive forces for the applied
voltage and the amount of current for plain current Voltage and current are constant during
bloodvolume measurements in the heart Bloodvolume itself however is not It varies
according to the cardiac cycle The varying ventricular bloodvolume of the mouse heart is
inversely proportional with the measured resistanceimpedance Or ventricular bloodvolume
is direct proportional with the measured electrical conductance of the blood (figure 2)
VOLU
ME
LV Volume
conductance
impedance
TIME
α
VcVc
physiological zero volume level
Figure 2
Chapter 3 Murine left ventricular pressure-volume loops
6
Fig 2 The concept of conductance derived left ventricular volume Left ventricular
bloodvolume is linear proportional with the time-varying conductance signal which correlates
with the level of resistanceimpedance of the bloodvolume on the electric current produced by
the catheter The conductance-catheter underestimates the volume-signal due to inhomogenity
of the electrical field The slope factor α corrects for this underestimation The offset volume
that arises from the protrusion of the electrical current in tissues besides blood (parallel
conductance) is corrected by the correction volume Vc
The conductance catheter is equipped with four electrodes (figure 3) two current
electrodes and two sensor electrodes The current electrodes produce an electric field with a
magnitude of 30 microA
Fig 3 Position of the conductance catheter in the left ventricle The catheter is retrogradely
inserted in the left ventricle The catheter consists of one pressure sensor and four volume
Figure 3
PS
SE
SE
CE
CE
49 mm45 mm
Chapter 3 Murine left ventricular pressure-volume loops
7
electrodes two current electrodes and two sensor electrodes The height of the measured
volume segment depends on the distance between the sensing electrodes ie 45 mm The
mean length of the longitudinal axis of the heart from adult mice is approximately 49 mm
CE indicates current electrode SE sensing electrode and PS pressure sensor
This specific current is chosen to prevent interaction with the murine endogenous
conduction system of the heart The catheter measures conductance which is translated into
left ventricular volume by a software program Cycle-varying conductance correlates with
time-varying ventricular volume V(t) according to the following formula
V(t) = ρ L2 [G(t) ndash Gp]
where ρ (rho) is the mouse specific blood resistivity L indicates the distance between the
sensor electrodes (ie 45 mm) G(t) the instantaneous conductance and Gp parallel
conductance The mouse specific blood resistance is determined using a Rho-cuvette with a
length of 05 cm and a diameter of 02 cm resulting in a content of 150 microl Gp is the offset in
the volume signal that originates from an additional conductance signal Shortly an electric
field broadens theoretically without end and protrudes through the ventricular wall into other
intrathoracic structures and organs Therefore the ventricular-derived conductance signal
originates partly from lungs mediastinum and most notably from the left ventricular
myocardium All have a relative contribution to the addition in ventricular-derived
conductance signal This offset-volume is referred to as the correction volume Vc (figure 2)
Several methods are used to acquire Gp and subsequent Vc One method calculates Gp from
the differences between myocardial and blood conductances at catheter excitation frequencies
of 2 and 10 kHz (12) The second method estimates Gp by exploiting the differential
frequency-induced conductivity of myocardium and blood (13) In our experiments we used
the hypertonic saline injection (HSI) method The method comprises of the infusion of 4 microl
Chapter 3 Murine left ventricular pressure-volume loops
8
hypertonic (30 NaCl) saline solution into the external jugular vein (~ 15 of left ventricular
absolute end-diastolic volume) The saline mixes with the murine blood and increases
conductance of blood through its high content of electrolytes The result is a volume increase
as shown by figure 4 a representative figure of a common HSI procedure The amount of
saline infusion is limited to 4 microl to prevent hemodynamic changes due to the fluid injection
As shown in figure 4 there is no influence on pressure The correction volume Vc is derived
via computerized algorithms
Fig 4 Conductance and pressure signals during hypertonic saline injection The total
acquired time period was 584 seconds Ventilation was stopped at the mark () after which 4
microL of 30 saline was injected (arrow) into the external jugular vein The conductivity of
blood was increased by the hypertonic saline infusion as demonstrated by the increase in the
conductance signal Parallel conductance is calculated by analyzing the conductance signal
Volu
me
(RVU
) Volume signal
30
35
40
45
50
Pressure signal
-200
20406080
100
Time (s)
Pres
sure
(mm
Hg)
Volu
me
(RVU
) Volume signal
30
35
40
45
50
30
35
40
45
50
Pressure signal
-200
20406080
100
-200
20406080
020406080
100
Time (s)
Pres
sure
(mm
Hg)
Figure 4
Chapter 3 Murine left ventricular pressure-volume loops
9
obtained during wash-in of the saline The unchanged pressure indicates that hemodynamics
are stable
In practice the conductance-catheter tends to constantly underestimate the left
ventricular bloodvolume The slope factor α should be calculated to correct for this
discrepancy (figure 2) For this purpose an independent volume measurement is needed
obtained in mice by blood flow measurements or echocardiography The slope factor α then
follows from the ratio conductance volumeindependent measured volume Table 1 shows the
results of α determination by echocardiography Slope factor α varied from 03 - 05
depending on the moment of measurement within the cardiac cycle The variance could be
due to the relative inaccuracy of ultrasonographic analyses It could also be inherent to
conductance measurements in the manner as performed Slope factor α deviates from 1
primarily due to the dependency of Gp on left ventricular volume (14) Gp should therefore be
measured continuously within the cardiac cycle to be able to correct adequately for the
variance of α However as the result of technical limitations continuous Gp acquisition is not
yet possible Whenever echocardiography is used end-diastolic volume EDV should be used
for α determination The variance of this calculated α is minor (SEM = 002) and the
correlation relatively high (adjusted R2 = 065)
Chapter 3 Murine left ventricular pressure-volume loops
10
Surgical protocols for PV-loops acquisition
The Sigma SA (CDLeycom Zoetermeer the Netherlands) single segment data
acquisition module was used for assessment of PV-loops The system operated on a constant
excitation current of 30microA to prevent interaction with the murine cardiac conduction system
determined by hypertonic saline injection and subtracted offline CONDUCT 2000 software
(CDLeycom Zoetermeer The Netherlands) was used for data acquisition and Circlab
software (LUMC Leiden The Netherlands) was used for offline data analysis
Invasive hemodynamic measurements of the murine left ventricle can theoretically be
performed by several ways for To date the most frequently reported method is an open-chest
(OC) approach (8) In brief mice are anaesthetized and the anterior thorax and the neck of the
mouse are shaved The animals are fixed on a warming plate Care is taken to maintain body
temperature constant at 37deg Celsius The neck skin of the mouse is opened by a saggital
incision The trachea is exposed to visually guide the intratracheal cannula (20-Gauge) where
after the cannula is connected to a mouse ventilator Minivent type 845 (Hugo Sachs
Electronics Germany) set at 150 strokes per minute and a tidal volume of 250 microl The
external jugular veins are cannulated with a flame-stretched PE-50 catheter for infusion of
saline and drugs The abdomen is opened subcostally The diaphragm is incised by a
transverse substernal approach leaving the pericardium intact The micromanometer is
calibrated with a mercury manometer by placing the sensor in 37deg Celsius normal saline The
left ventricle is entered through an apical stab with a 25 12 G needle immediately followed
by the Millar conductance-micromanometer The catheter is positioned correctly in the left
ventricle under guidance of the online pressure and volume signals The combination of
pressure and volume signals allows accurate positioning of the catheter in the left ventricle
Ventilation is stopped during data acquisition to avoid influence from ventilation of the lungs
on the pressure and volume signals The acquisition protocol consists of measurements of
Chapter 3 Murine left ventricular pressure-volume loops
11
baseline cardiac function hypertonic saline injection (3x) inferior caval vein occlusions with
and without β-adrenergic stimulation (isoproterenol 1000 pg)
This method is theoretically disadvantageous since collaps of the lungs and
destruction of myocardial integrity are induced through the relatively large surgical trauma
Furthermore in myocardial infarction studies the open-chest approach is hampered by
extensive left ventricular remodeling since the scar tissue is not accessible for the
conductance catheter and fails to provide a stable position
A closed-chest (CC) approach would theoretically circumvent several of these
disadvantages Firstly in a closed-chest the lungs remain untouched Secondly the cardiac
position and myocardial structures remain intact Thirdly surgical trauma and hemodynamic
stress would be reduced to a minimum Finally a closed-chest approach would allow accurate
assessment of left ventricular (LV) hemodynamic behavior in mice which underwent transient
or permanent occlusion of the left anterior descending coronary artery The surgical procedure
is similar to the open-chest approach except for the insertion of the conductance catheter into
the left ventricle In brief mice are anaesthetized and the neck and abdomen are shaved Care
is taken to maintain body temperature and ventilation support is provided as above Venous
catheters are placed after which the right common carotid is prepared for insertion of the
ultraminiature conductance-micromanometer The catheter is calibrated and subsequently
inserted into the left ventricle under guidance of the online pressure signal A transverse
abdominal incision without opening the thorax is performed to expose the inferior caval vein
The acquisition protocol is similar as in the open-chest approach
Chapter 3 Murine left ventricular pressure-volume loops
12
Explanation of the pressure-volume loop
The left ventricular PV loop is a two-dimensional representation of a single cardiac
cycle (figure 5) Beginning at end-diastole when the mitral valve closes the ejection phase
starts with pressure build up without actual volume ejection ie the isovolumic contraction
phase Blood is ejected out of the ventricle into the aorta upon opening of the aortic valve and
subsequently left ventricular volume decreases The end of ejection is defined by aortic valve
closure and followed by myocardial relaxation characterized by pressure decrease without
volume change ie the isovolumic relaxation phase The filling phase is initiated with
opening of the mitral valve and rise of ventricular volume The technique of simultaneous left
ventricular pressure and volume measurements provides continuous assessment of cardiac
function
Fig 5 The cardiac cycle in a single pressure-volume loop End-diastole is marked by the
closure of the mitral valves The hearts starts to build up pressure while all valves are closed
(isovolumetric contraction phase) before actual ejection begins following the opening of the
aortic valve Volume decreases while ejection progresses until the aortic valves close (end-
Closure aortic valve
VOLUME
PRES
SUR
E
Figure 5
Opening aortic valve
Isovolumicrelaxation
Isovolumiccontraction
Closure mitral valve
Openingmitral valve
Chapter 3 Murine left ventricular pressure-volume loops
13
systole) and relaxation starts Aortic and mitral valves are closed during relaxation
(isovolumic relaxation phase) The filling phase follows upon the opening of the mitral valve
and volume increase while pressure build up is minor
PV loops reveal in first instance the standard functional parameters (figure 6)
Fig 6 Cardiac performance parameters in the pressure-volume loop ED indicates end-
diastole ES end-systole Ved end-diastolic volume Ves end-systolic volume Ped end-
diastolic pressure Pes end-systolic pressure The area of the PV loop resembles stroke work
(SW) Stroke volume SV can be derived by subtracting Ves from Ved
However specific PV relationships are acquired too (table 2 figure 7) These
relationships describe the contractile and relaxative capabilities of the heart independent of
preload afterload or heart rate Transient occlusion of the inferior caval vein in mice is
performed to obtain these relationships Caval vein occlusion leads to a decrease in venous
return and thereby in preload of the left ventricle The response of the heart is typical as
Figure 6
VOLUME
PRES
SURE
ES
ED
Pes
Ved Ves
Ped
SV
SW
Chapter 3 Murine left ventricular pressure-volume loops
14
presented in figure 7 and shows the PV correlations Contractile parameters derived from PV-
correlations best detect small alterations in contractility in mice (15)
Fig 7 Pressure-volume relationships Variably loaded PV loops are used to define several PV
relationships The variable loading is derived by occluding the inferior caval vein and thereby
reducing venous return The end-systolic PV relationship (ESPVR) describes the contractile
performance of the left ventricle Contractility is linear correlated with the steepness of the
ESPVR slope ie Ees The end-diastolic PV relationship (EDPVR) describes diastolic
performance for instance diastolic distensibility The slope of the EDPVR (β) indicates the
passive chamber stiffness
The end-systolic PV relationship (ESPVR) describes the relation between volume and
pressure changes in systole Within the physiological range this relationship approximates a
straight line The relationship can be described in terms of its slope which reflects myocardial
contractility and its volume axis intercept V0 The volume intercept from the ESPVR line
Figure 7
PRES
SURE ESPVR
VOLUME
EesEes
EDPVRβ
V75
Chapter 3 Murine left ventricular pressure-volume loops
15
could better be taken at a constant pressure level in the physiological range for example
between 50 and 100 mm Hg (16) The volume intercept at a constant pressure (eg V75)
reflects myocardial contractility as it indicates the extent of contraction Increased myocardial
contractility for instance during beta-adrenergic stimulation with isoprenaline results in a
steeper ESPVR-slope and a leftward shift on the volume axis while attenuated contractility
for example during clinical heart failure results in a concomitantly plain slope and a
rightward shift on the volume axis The slope of the ESPVR (Ees) is used to describe the left
ventricular elastance Arterial elastance (Ea) a measure for ventricular afterload is described
by the slope of the relationship between stroke volume and end-systolic pressure (figure 8)
Fig 8 Arterial-ventricular coupling Ventricular elastance is estimated from the end-
systolic PV relationship (ESPVR) slope Ees Arterial elastance (Ea) is approximated by the
stroke volumeend-systolic pressure ratio (Ao Pes-SV relationship) The between Ea and Ees
reflects the coupling between the left ventricle and the arterial circulation The production of
stroke work is maximal when the Ea and Ees are approximately equal
Figure 8
Ea Ees
VOLUME
PRES
SURE
PRESSURE
PV-relat
ion Ao PES ndash SV relation
Chapter 3 Murine left ventricular pressure-volume loops
16
The production of stroke work is maximal when the Ees and Ea are approximately
equal Stroke work attenuates substantially in relation to its maximal value whenever Ea and
Ees differ markedly (1718) The preload-recruitable stroke work (PRSW) is the relationship
between end-diastolic volume and performed stroke work by the ventricle It is a load-
independent measure of contractility related to preload The contractile state of the heart is
resembled by the steepness of the PRSW-slope In a high contractile state the heart is able to
perform more stroke work at a constant end-diastolic volume for instance by augmenting the
ejection fraction
Diastolic function is derived from the end-diastolic PV relationship (EDPVR) which
correlates with the compliance of the ventricular myocardium Diastolic dysfunctioning or
failure is observed by an inappropriate upward shift of the ESPVR The slope of the EDPVR
(β) increases during augmented stiffness of the ventricular wall when pressure rises
progressively more during ventricular filling The opposite occurs in case of increased
compliance Certain cardiac diseases and remodeling processes are correlated with increased
stiffness of the ventricular wall by collagen deposition resulting in an increase of the
EDPVR-slope (19)
Numerous other relationships can be assessed The limits are determined by the
interests and the creativity of the investigator
Chapter 3 Murine left ventricular pressure-volume loops
17
Results of PV-measurements with the open- (OC) and closed-chest (CC) approach
A comparative study was performed to determine scientifically based arguments for
the choice between open- (OC) or closed-chest (CC) PV measurements to examine murine
cardiac function Comparing cardiac performance between OC and CC protocols revealed
overall relatively similar values for the investigated parameters (table 3) The values for LV
volumes were corrected for ρ determined at 124 Ωcm in the used setup (N = 10 12352 plusmn
088 Ωcm) α (N = 13 030) and Vc Vc was determined during all PV experiments by the
hypertonic saline injection method No significant differences could be detected between CC
and OC instrumentation (9469 plusmn 483 microl versus 9272 plusmn 205 microl respectively NS) The 4 microl
30 saline demonstrated to be sufficient to change blood conductivity Moreover as this
volume encompasses only 15 of the normal murine end-diastolic volume it proved to be too
small to influence LV end-diastolic and end-systolic pressures (figure 4) in either OC or CC
mice
Several differences were found between the OC and CC approaches (table 3) Cardiac
function in the OC approach was characterized by higher ejection fractions (EF 69 versus
48 respectively) larger stroke volume (1998 versus 1470 microl respectively) and a leftward
shift in ventricular volume On the contrary measuring cardiac function with an intact thorax
resulted in higher end-systolic pressures (ESP OC 52 versus CC 65 mmHg with urethane
anesthesia) and a higher rate of relaxation as indicated by the dPdtmin No differences were
found in the PV relationships ie the ESPVR EDPVR or PRSW Interestingly the OC
approach did result in a mismatch between arterial afterload and ventricular work The
arterial-ventricular elastance ratio (EaEes) was significantly depressed following opening of
the chest In contrast EaEes ratios were normal (ie ~ 10) in the CC approach under both
regimens This finding is consistently found in open-chest instrumented mice (8) The arterial-
ventricular coupling mismatch was depending on arterial resistance the slope of the ESPVR
Chapter 3 Murine left ventricular pressure-volume loops
18
Table 1 Comparison of volume derived by ultrasonography and conductance
Descriptive statistics of alphaN Min Max Mean SEM
EDV 13 018 045 030 002ESV 13 016 094 051 007SV 13 009 058 026 004
Regression analysis
N
RR2
Adjusted R2
SEE
EDV13
082068065179
ESV13
083069066172
SV13
041017009117
Chapter 3 Murine left ventricular pressure-volume loops
19
Left ventricular volume was measured by both ultrasonography
and conductance in adult C57Bl6 mice End-diastolic end-
systolic and stroke volume were used to obtain alpha (α)
Descriptive analysis shows that α determination at the end-
diastolic moment results in the most consistent mean α Also
the correlation of LV volume values between ultrasonography
and conductance is high as shown by the regression analysis
SEM indicates standard error of the mean SEE standard error
of the estimate
EDVECHO (microl)120100806040200
EDV C
ON
DUC
TAN
CE (micro
l)
18
16
14
12
10
8
6
SCATTERPLOT OF END-DIASTOLIC VOLUMECONDUCTANCE VS ULTRASONOGRAPHY
EDVECHO (microl)120100806040200
EDV C
ON
DUC
TAN
CE (micro
l)
18
16
14
12
10
8
6
EDVECHO (microl)120100806040200
EDV C
ON
DUC
TAN
CE (micro
l)
18
16
14
12
10
8
6
SCATTERPLOT OF END-DIASTOLIC VOLUMECONDUCTANCE VS ULTRASONOGRAPHY
Chapter 3 Murine left ventricular pressure-volume loops
20
Table 2 Parameters derived by pressure-volume loops
Abbreviations DefinitionsGeneral parameters
CI (CI = CObody wt) CO HR
Card iac indexCard iac outputHeart rate
PressuredPdtmax
dPdtmin
PedPesτ
Maximum derivative of change in systolic pressure in timeMaximum derivative of change in diastolic pressure in timeEnd-diastolic pressureEnd-systolic pressureTime constant of isovolumic relaxation
VolumeEFSI (SI = SVbody wt)SVVedVes
Ejection fractionStroke index Stroke volumeEnd-diastolic pressureEnd-systolic pressure
Pressure-volume relationshipsβEa (Ea = PesSV)EDPVREes
Slope of the end-diastolic pressure-volume relat ionshipArterial elastanceEnd-diastolic pressure-volume relat ionshipEnd-systolic ventricular elastance
EmaxESPVR
(slope of the end-systolic pressure-volume relationship)Maximum chamber elasticity (∆P∆V)End-systolic pressure-volume relat ionship
Pressure-volume areaEfficiencyEWPEPRSWPVASWSWI (SWI = SWbody wt)
EWPVAExternal work = SWPotential energyPreload-recruitable stroke workPressure-volume area = EW + PEStroke workStroke work index
EmaxESPVR
(slope of the end-systolic pressure-volume (slope of the end-systolic pressure-volume relationship)Maximum chamber elasticity (∆P∆V)End-systolic pressure-volume relat ionship
Pressure-volume areaEfficiencyEWPEPRSWPVASWSWI (SWI = SWbody wt)
EWPVAExternal work = SWPotential energyPreload-recruitable stroke workPressure-volume area = EW + PEStroke workStroke work index
Chapter 3 Murine left ventricular pressure-volume loops
21
(Ees) proved to be equal in OC and CC instrumented mice The combination of enlarged
stroke volume with attenuated systolic pressures leads to a decrease in arterial elastance The
altered arterial elastance could be explained by the opening of the thorax A drop in overall
peripheral vascular resistance from baseline values has been described during thoracoscopy
(20)
Urethane
Volume (microl)
Pres
sure
(mm
Hg)
Pentobarbital
Volume (microl)
Pres
sure
(mm
Hg)
A
B
CCOCCCCCOCOC
CCOCCCCCOCOC
-100
102030405060708090
-10
0
10
20
30
40
50
60
0 5 10 15 20 25 30 35 400 5 10 15 20 25 30 35 40
0 5 10 15 20 25 30 35 400 5 10 15 20 25 30 35 40
Figure 9
Chapter 3 Murine left ventricular pressure-volume loops
22
Fig 9 Left ventricular pressure-volume loops Pressure presented in mmHg and volume microl
A Representative figure of PV loops acquired during urethane anesthesia in closed chest
(CC) and open chest (OC) instrumented mice B Representative figure of PV loops acquired
during pentobarbital anesthesia in CC and OC instrumented mice Loops are acquired during
an occlusion of the inferior caval vein Venous returns decreases which is represented in the
loops by attenuation of both pressure and volume The differences in ESP SW and ESPVR
between urethane and pentobarbital anesthesia can be observed by analyzing the loops in A
and B The loops show also the larger stroke volume and depressed systolic pressure in OC
instrumented mice
Figure 9 shows representative PV-loops while venous return was attenuated following
inferior caval vein occlusion Typical pressure and volume effects are depicted showing the
absence of apparent differences in PV relationships The mentioned differences in ESP SV
and EF are evident in the presented loops though
ECG recordings were made during both surgical protocols to detect possible heart rate
alterations and arrhythmias Murine left ventricular PV measurements could be distorted by
physiological responses to the catheterization Heart rate alterations could be anticipated
especially in relation to carotid sinus stimulation while cannulating of the carotid artery
However neither bradycardia nor other arrhythmias were observed during either CC or OC
procedures (figure 10) This finding indicates that cannulation of the right common carotid
artery does not alter heart rate by carotid sinus stimulation
Chapter 3 Murine left ventricular pressure-volume loops
23
Table 3 Functional parameters to determine baseline LV functioning in open- and closed-
chest protocols during steady-state measurement
URETHANE PENTOBARBITALOC CC OC CC
N = 5 N = 5 N = 10 N = 10
Mean plusmn SEM Mean plusmn SEM Mean plusmn SEM Mean plusmn SEM
HR 583 plusmn 20 658 plusmn 21 493 plusmn 25 481 plusmn 36SVdagger 1958 plusmn 351 1557 plusmn 254 2018 plusmn 183 1426 plusmn 103CO 12 plusmn 2 10 plusmn 2 10 plusmn 1 7 plusmn 0Vmaxdagger 1761 plusmn 053 2361 plusmn 223 3089 plusmn 289 3883 plusmn 230Vmindagger 215 plusmn 133 679 plusmn 180 1029 plusmn 189 2373 plusmn 199EFdagger 79 plusmn 6 66 plusmn 8 66 plusmn 4 39 plusmn 2
ESPdagger 52 plusmn 4 65 plusmn 5 42 plusmn 3 47 plusmn 4EDP 1 plusmn 1 -1 plusmn 1 -6 plusmn 2 1 plusmn 1
dPdtmax 7200 plusmn 1349 8252 plusmn 1685 4004 plusmn 629 3718 plusmn 684dPdtmindagger -4233 plusmn 531 -7577 plusmn 750 -3631 plusmn 424 -3348 plusmn 653Tau 10 plusmn 0 7 plusmn 0 12 plusmn 1 14 plusmn 2
SW 1066 plusmn 245 1147 plusmn 213 1076 plusmn 176 666 plusmn 116
EaEesdagger 065 plusmn 020 084 plusmn 016 060 plusmn 005 103 plusmn 015ESPVR 570 plusmn 094 589 plusmn 074 347 plusmn 027 318 plusmn 052EDPVR 009 plusmn 009 -008 plusmn 015 -015 plusmn 014 -005 plusmn 015PRSW 79 plusmn 14 64 plusmn 6 68 plusmn 10 53 plusmn 3
Results from LV pressure-volume measurements in C57Bl6 mice anesthetized by urethane or
pentobarbital Urethane versus pentobarbital P lt 005 dagger OC versus CC P lt 005 ρ Valued
124 Ωcm α 030 Open- (OC) and closed-chest (CC) protocols HR indicates heart rate in
bpm SV left ventricular stroke volume in microl CO cardiac output mlmin Vmin minimal left
ventricular volume in microl Vmax maximal left ventricular volume in microl EF ejection fraction in
ESP left ventricular end-systolic pressure in mmHg EDP left ventricular end-diastolic
pressure in mmHg dPdtmax maximal first derivative of left ventricular pressure in mmHgs
dPdtmin minimal first derivative of left ventricular pressure in mmHgs Tau time constant of
left ventricular relaxation in ms SW stroke work in mmHgmicrol Ea arterial elastance Ees
ventricular end-systolic elastance ESPVR left ventricular end-systolic PV relationship in
Chapter 3 Murine left ventricular pressure-volume loops
24
mmHgmicrol EDPVR left ventricular end-diastolic PV relationship in mmHgmicrol PRSW left
ventricular preload-recruitable stroke work in mmHg
The steady-state functional parameters from OC and CC instrumented mice during
either urethane or pentobarbital are also depicted in Table 2 The use of pentobarbital
anesthesia had a cardiodepressive effect that was represented by significant function decline
in most parameters EF dPdtMAX and ESPVR decreased respectively with 24 57 and 41
upon pentobarbital use compared to urethane anesthesia Pentobarbital therefore had strong
negative chronotropic and inotropic effects
Hear
trat
e(b
pm)
Heart rate trace in closed-chest animal
0
100
200
300
400
500
600
700
Time (minutes)
arterial canulation
A
0 1 2 3 4 5 6 7 8 9 10 11 12 13 14 15 16
Heart rate trace in open-chest animal
0
100
200
300
400
500
600
700
Time (minutes)
Hear
trat
e(b
pm)
Ventricular catheterisation
B
0 1 2 3 4 5 6 7 8 9 10 11 12 13 14
Figure 10
Chapter 3 Murine left ventricular pressure-volume loops
25
Fig 10 Heart rate tracings in closed chest and open chest instrumented mice
A Representative figure of a heart rate tracing in a closed-chest instrumented mouse The
moment of arterial cannulation is indicated Some arrhythmias are seen in response to
introduction of the catheter into the left ventricle Arrhythmias are only present in a short
time-period that is part of the stabilization period following catheter introduction Heart rate
remains unchanged during the measurements B Representative figure of a heart rate tracing
in an open-chest instrumented mouse Somewhat more pronounced chronotropic arrhythmias
are seen in response to ventricular introduction of the catheter by apical stab However no
significant brady- or tachycardias are present during the measurements
Chapter 3 Murine left ventricular pressure-volume loops
26
Discussion
In this chapter OC and CC protocols for in vivo left ventricular PV relationship
measurement are described and discussed Murine cardiac function determination via these
methods is sensitive reproducible and comparable The choice for open- or closed-chest PV
measurements in mice depends on the aim of the study with regards to the specific cardiac
pathology The OC approach is technically less complicated and less time consuming Main
characteristics of the OC model itself are low systolic pressures and arterial resistance The
OC approach could best be used in studies where myocardial integrity is not at stake
Particularly ischemiareperfusion studies regarding myocardial integrity are probably better
done using the CC approach
Assessment of cardiac performance in genetically engineered mice is indispensable to
understand human cardiovascular pathologies In general the synergistic features of cardiac
diseases such as hypertrophy and cell death affect cardiac function negatively The
contractile performance of the heart deteriorates which is reflected in the attenuation of
systolic parameters as ejection fraction stroke work and PV-relationships Furthermore
ventricular relaxation prolongs and diastolic filling becomes impaired The progression of
cardiac disease ultimately results in clinical heart failure which is defined by the inability of
the heart to meet hemodynamic demands of the body and is characterized by specific signs
and symptoms (21) The most important parameter of cardiac performance which defines
heart failure is cardiac output
The influence on cardiac performance of specific genes and proteins in the
development of cardiac diseases ought to be investigated extensively to assess their clinical
relevance Various techniques have been used to assess cardiac performance in mice The
main techniques will be discussed in brief
Chapter 3 Murine left ventricular pressure-volume loops
27
Echocardiography is the most widely used noninvasive technique to determine cardiac
performance in mice High-frequency transthoracic and transesophageal transducers are used
as effective tools for two-dimensional and Doppler imaging of ventricular wall structures
dimensions and volumes of cavum and cardiac function (2223) Full-conscious or gas-
anesthesia experiments are preferred for echocardiographic assessment of cardiac function in
mice (2425) There is no limit to the diversity of murine models investigated by this general
accepted method of cardiac performance assessment However the most questionable aspect
of these measurements is the significant inter- and intraobservator variance in the
measurements
Isolated working mouse heart measurements in a Langendorf perfusion setup are a
technique for ex vivo cardiac function measurements approximating the in vivo function level
(5) Cardiac output developed left ventricular pressure and first derivates of maximal and
minimal pressures are some of the parameters that can be derived Isolated working heart
measurements are especially useful to study the acute effects of ischemic preconditioning and
ischemia-induced apoptosis(2627) Metabolites of interest can be measured accurately in the
perfusion fluid Disadvantages are the impossibility of chronic studies and the
unphysiological situation of ex vivo cardiac function measurements
Aortic flow measurements by means of a flow-probe have been used in several
studies (2829) Aortic flow acquisition is a validated technique and reveals functional
parameters as cardiac output stroke volume and blood flow velocity However several
disadvantages oppose against this technique Firstly aortic flow measurements are invasive
(ie thoracotomy or laparotomy) and result solely in aortic derived volume parameters
Integrated ventricular function cannot be assessed More importantly the exact localization of
the flow probe around the aorta is the critical determinant of the systematic error made by
these measurements Flow probes have been placed around the ascending and descending
Chapter 3 Murine left ventricular pressure-volume loops
28
thoracic aorta and the abdominal aorta The percentage of total cardiac output passing the
flow probe on the specific location has to be estimated Flow probes located at the ascending
aorta correct for coronary circulation and for instance bloodvolume passing the descending
thoracic aorta has been estimated to be around 75 of total cardiac output (30) The estimated
correction factor provides lsquoabsolutersquo stroke volume instead of absolute LV cavum volumes
and does not correct for cardiophysiological changes Altered cardiophysiological situations
could theoretically influence the relative amount of bloodvolume passing the flow probe On
the other hand major advances are the possibility of chronic cardiac function measurements
and the relative facile manner of data acquirement(29) Moreover aortic flow probe
measurements are not hampered by deleterious cardiac remodeling in myocardial ischemia or
hypertrophy studies(2829)
The newly developed method of cardiac performance assessment by in vivo left
ventricular PV measurements in the CC model is introduced here Left ventricular PV
measurements in vivo provide an accurate assessment of murine cardiac function The method
is highly sensitive during open- and closed-chest approaches in determining alterations in left
ventricular function as result of cardiac disease or altered hemodynamic stress The
characteristics of simultaneous left ventricular pressure and volume measurements enable the
researcher to directly investigate pressure-related cardiac diseases as cardiac hypertrophy and
restrictive cardiomyopathy (31) or volume-related diseases as dilated cardiomyopathy (32)
Moreover the effective influence of both aspects of cardiac disease on each other can be
observed in detail For instance ventricular dilation and subsequent decrease in ventricular
systolic pressure is mapped accurately in PV-loops Continuous measurements provide
possibilities to investigate the complete cardiac cycle Basic aspects of cardiac physiology can
be visualized using PV-loops in mice (81533-35) For instance increase in ventricular filling
is followed by an increase in ejection fraction according to the Frank-Starling mechanism
Chapter 3 Murine left ventricular pressure-volume loops
29
The opposite is seen as a result of gradual venous return decrease in the case of transient caval
vein occlusion (figure 7 amp 9) Moreover the distinction between systolic and diastolic failure
can be made through continuous PV-measurements (19) Systolic heart failure encompasses
mainly an ejection dysfunction with impaired contractility Both aspects are obtained by and
directly visualized through PV-loops Additionally the definite diagnosis of diastolic failure
is dependent on the observation of an inappropriate upward shift of the (end-)diastolic PV
relationship requiring cardiac catheterization for continuous volume determinations using
impedance measurements and high-fidelity measurements of ventricular pressure with a
micromanometer (19) PV-loops are useful determining cardiac performance within the
complete continuum of healthy and diseased hearts
Chapter 3 Murine left ventricular pressure-volume loops
30
Conclusion
In vivo PV measurements provide an essential tool in the assessment of cardiac
function in genetically modified mice Open- and closed-chest surgical protocols for murine
cardiac function determination are sensitive reproducible and comparable PV-loops enable
the researcher to accurately investigate diverse murine models of cardiac pathology by
adequately visualizing the cause-and-effect relationship between genetic modification and
their functional outcome Changes in ventricular contractility are best detected by PV derived
parameters in comparison to other methods of cardiac function determination
Chapter 3 Murine left ventricular pressure-volume loops
31
References
1 Doevendans PA Daemen MJ de Muinck ED Smits JF Cardiovascular phenotypingin mice Cardiovasc Res 19983934-49
2 Hoit BD New approaches to phenotypic analysis in adult mice J Mol Cell Cardiol20013327-35
3 Chacko VP Aresta F Chacko SM Weiss RG MRIMRS assessment of in vivomurine cardiac metabolism morphology and function at physiological heart rates AmJ Physiol Heart Circ Physiol 2000279H2218-24
4 Tanaka N Dalton N Mao L et al Transthoracic echocardiography in models ofcardiac disease in the mouse Circulation 1996941109-17
5 De Windt LJ Willems J Reneman RS Van der Vusse GJ Arts T Van Bilsen M Animproved isolated left ventricular ejecting murine heart model Functional andmetabolic evaluation Pflugers Arch 1999437182-90
6 Palmen M Daemen MJ Buehler A et al Impaired cardiac remodeling and functionafter myocardial infarction in FGF-1 transgenic mice Circulation 1999100250
7 Rockman HA Hamilton RA Jones LR Milano CA Mao L Lefkowitz RJ Enhancedmyocardial relaxation in vivo in transgenic mice overexpressing the beta2-adrenergicreceptor is associated with reduced phospholamban protein J Clin Invest1996971618-23
8 Georgakopoulos D Mitzner WA Chen CH et al In vivo murine left ventricularpressure-volume relations by miniaturized conductance micromanometry Am JPhysiol 1998274H1416-22
9 Dekker AL Geskes GG Cramers AA et al Right ventricular support for off-pumpcoronary artery bypass grafting studied with bi-ventricular pressure-volume loops insheep Eur J Cardiothorac Surg 200119179-84
10 Schreuder JJ Steendijk P van der Veen FH et al Acute and short-term effects ofpartial left ventriculectomy in dilated cardiomyopathy assessment by pressure-volumeloops J Am Coll Cardiol 2000362104-14
11 Zimmer HG Measurement of left ventricular hemodynamic parameters in closed-chest rats under control and various pathophysiologic conditions Basic Res Cardiol19837877-84
12 Georgakopoulos D Kass DA Estimation of parallel conductance by dual-frequencyconductance catheter in mice Am J Physiol Heart Circ Physiol 2000279H443-50
13 Feldman MD Mao Y Valvano JW Pearce JA Freeman GL Development of amultifrequency conductance catheter-based system to determine LV function in miceAm J Physiol Heart Circ Physiol 2000279H1411-20
14 Kornet L Schreuder JJ Van de Velden ET Jansen JR The volume-dependency ofparallel conductance throughout the cardiac cycle and its consequence for volumeestimation of the left ventricle in patients Cardiovasc Res 200151729-35
15 Nemoto S DeFreitas G Mann DL Carabello BA Effects of changes in leftventricular contractility on indexes of contractility in mice Am J Physiol Heart CircPhysiol 2002283H2504-10
16 Baan J Van de Velden ET Steendijk P Ventricular pressure-volume relations in vivoEur Heart J 199213 SupplE2-6
17 Little WC Cheng CP Left ventricular-arterial coupling in conscious dogs Am JPhysiol 1991261H70-6
18 Sunagawa K Maughan WL Sagawa K Optimal arterial resistance for the maximalstroke work studied in isolated canine left ventricle Circ Res 198556586-95
Chapter 3 Murine left ventricular pressure-volume loops
32
19 Van Kraaij D Van Pol P Ruiters AW et al Diagnosing diastolic heart failure Eur JHeart Fail 20024419-30
20 Faunt KK Cohn LA Jones BD Dodam JR Cardiopulmonary effects of bilateralhemithorax ventilation and diagnostic thoracoscopy in dogs Am J Vet Res1998591494-8
21 Lips DJ Van Kraaij DL De Windt LJ Doevendans PA Molecular determinants ofmyocardial hypertrophy and failure alternative pathways for beneficial andmaladaptive hypertrophy Eur Heart J 200324883-96
22 Collins KA Korcarz CE Lang RM Use of echocardiography for the phenotypicassessment of genetically altered mice Physiol Genomics 200313227-39
23 Scherrer-Crosbie M Steudel W Hunziker PR et al Determination of right ventricularstructure and function in normoxic and hypoxic mice a transesophagealechocardiographic study Circulation 1998981015-21
24 Takuma S Suehiro K Cardinale C et al Anesthetic inhibition in ischemic andnonischemic murine heart comparison with conscious echocardiographic approachAm J Physiol Heart Circ Physiol 2001280H2364-70
25 Chaves AA Weinstein DM Bauer JA Non-invasive echocardiographic studies inmice influence of anesthetic regimen Life Sci 200169213-22
26 Yamaura G Turoczi T Yamamoto F Siddqui MA Maulik N Das DK STATsignaling in ischemic heart a role of STAT5A in ischemic preconditioning Am JPhysiol Heart Circ Physiol 2003285H476-82
27 Bell RM Yellon DM Atorvastatin administered at the onset of reperfusion andindependent of lipid lowering protects the myocardium by up-regulating a pro-survival pathway J Am Coll Cardiol 200341508-15
28 Aartsen WM Schuijt MP Danser AH Daemen MJ Smits JF The role of locallyexpressed angiotensin converting enzyme in cardiac remodeling after myocardialinfarction in mice Cardiovasc Res 200256205-13
29 Janssen B Debets J Leenders P Smits J Chronic measurement of cardiac output inconscious mice Am J Physiol Regul Integr Comp Physiol 2002282R928-35
30 Georgakopoulos D Christe ME Giewat M Seidman CM Seidman JG Kass DA Thepathogenesis of familial hypertrophic cardiomyopathy early and evolving effects froman alpha-cardiac myosin heavy chain missense mutation Nat Med 19995327-30
31 Liao P Georgakopoulos D Kovacs A et al The in vivo role of p38 MAP kinases incardiac remodeling and restrictive cardiomyopathy Proc Natl Acad Sci U S A20019812283-8
32 McConnell BK Jones KA Fatkin D et al Dilated cardiomyopathy in homozygousmyosin-binding protein-C mutant mice J Clin Invest 19991041235-44
33 Georgakopoulos D Kass DA Minimal force-frequency modulation of inotropy andrelaxation of in situ murine heart J Physiol 2001534535-45
34 Yang B Larson DF Watson R Age-related left ventricular function in the mouseanalysis based on in vivo pressure-volume relationships Am J Physiol1999277H1906-13
35 Reyes M Freeman GL Escobedo D Lee S Steinhelper ME Feldman MDEnhancement of contractility with sustained afterload in the intact murine heartblunting of length-dependent activation Circulation 20031072962-8
Chapter 3 Murine left ventricular pressure-volume loops
2
Abstract
Genetically engineered mice are used in experiments in cardiovascular research The
in vivo assessment of cardiac performance demands accurate methods Overall cardiac
performance can be acquired by simultaneous and continuous left ventricular pressure and
volume (PV) measurements through the use of an intraventricular 14 F ultraminiature
conductance-micromanometer catheter positioned in the left ventricular cavity of intact mice
Cardiac performance is represented in the two-dimensional graph plotting pressure and
volume into PV-loops PV-loops adequately represent cardiac function and provide load and
heart rate independent parameters of intrinsic myocardial contractility and relaxation All
sorts of cardiopathological situations can be investigated thoroughly with the use of PV-
measurements
Chapter 3 Murine left ventricular pressure-volume loops
3
Introduction
The use of murine transgenic and gene-targeted models in the field of cardiovascular
research has shown an exponential growth since this approach provides essential genetic and
molecular insight into human congenital and acquired heart disease By manipulating and
investigating cardiac gene expression by means of accurate techniques to analyze the resultant
phenotype the molecular basis for cardiac dysfunction may be uncovered
To date multiple techniques allow assessment of murine left ventricular hemodynamic
behavior(12) such as MRI (3) transthoracic ultrasonography (4) Langendorff perfusion
systems (5) aortic flow probes (6) micromanometers (7) and more recently conductance-
micromanometers (8) The use of conductance-micromanometers allows generation of
instantaneous pressure and volume signals to create pressure-volume (PV) relations for highly
accurate assessment of left ventricular performance The PV-loop method is regarded as the
golden standard for assessment of intrinsic myocardial function in large animals (9) and
humans (10) Recently the development of miniaturized PV-catheters has made this
methodology applicable to small animals such as mice (8)
The method of PV-loop assessment will be discussed in the following paragraphs
More detailed information about the acquisition of left ventricular volume will be provided
and the concepts of parallel conductance and volume correction factors are introduced The
surgical protocols for open-chest and closed-chest PV measurements and the difference in
cardiac performance between these two protocols are part of the discussion How to read PV-
loops completes the chapter
Chapter 3 Murine left ventricular pressure-volume loops
4
Fig 1 Presentation of the size of the Millar conductance-micromanometer The catheter is
placed in the left ventricle from a longitudinal sliced murine heart The tip of the catheter is
placed in the apex of the heart while the proximal part runs through the aortic valves From
top to bottom are seen two volume electrodes the pressure sensor and at the bottom two
volume electrodes An index finger indicates the miniature size of the catheter
Figure 1
Chapter 3 Murine left ventricular pressure-volume loops
5
The assessment of pressure-volume loops
PV loops are obtained by the conductance-micromanometer miniaturized for invasive
use in rodents (figure 1) (11) The volume-signal is derived in accordance with Ohmrsquos Law
ldquoThe amount of current flowing in a circuit made up of pure resistances is directly
proportional to the electromotive forces impressed on the circuit and inversely proportional to
the total resistance of the circuitrdquo In the setting of a mouse heart is the circuit of pure
resistances an analogue for ventricular bloodvolume the electromotive forces for the applied
voltage and the amount of current for plain current Voltage and current are constant during
bloodvolume measurements in the heart Bloodvolume itself however is not It varies
according to the cardiac cycle The varying ventricular bloodvolume of the mouse heart is
inversely proportional with the measured resistanceimpedance Or ventricular bloodvolume
is direct proportional with the measured electrical conductance of the blood (figure 2)
VOLU
ME
LV Volume
conductance
impedance
TIME
α
VcVc
physiological zero volume level
Figure 2
Chapter 3 Murine left ventricular pressure-volume loops
6
Fig 2 The concept of conductance derived left ventricular volume Left ventricular
bloodvolume is linear proportional with the time-varying conductance signal which correlates
with the level of resistanceimpedance of the bloodvolume on the electric current produced by
the catheter The conductance-catheter underestimates the volume-signal due to inhomogenity
of the electrical field The slope factor α corrects for this underestimation The offset volume
that arises from the protrusion of the electrical current in tissues besides blood (parallel
conductance) is corrected by the correction volume Vc
The conductance catheter is equipped with four electrodes (figure 3) two current
electrodes and two sensor electrodes The current electrodes produce an electric field with a
magnitude of 30 microA
Fig 3 Position of the conductance catheter in the left ventricle The catheter is retrogradely
inserted in the left ventricle The catheter consists of one pressure sensor and four volume
Figure 3
PS
SE
SE
CE
CE
49 mm45 mm
Chapter 3 Murine left ventricular pressure-volume loops
7
electrodes two current electrodes and two sensor electrodes The height of the measured
volume segment depends on the distance between the sensing electrodes ie 45 mm The
mean length of the longitudinal axis of the heart from adult mice is approximately 49 mm
CE indicates current electrode SE sensing electrode and PS pressure sensor
This specific current is chosen to prevent interaction with the murine endogenous
conduction system of the heart The catheter measures conductance which is translated into
left ventricular volume by a software program Cycle-varying conductance correlates with
time-varying ventricular volume V(t) according to the following formula
V(t) = ρ L2 [G(t) ndash Gp]
where ρ (rho) is the mouse specific blood resistivity L indicates the distance between the
sensor electrodes (ie 45 mm) G(t) the instantaneous conductance and Gp parallel
conductance The mouse specific blood resistance is determined using a Rho-cuvette with a
length of 05 cm and a diameter of 02 cm resulting in a content of 150 microl Gp is the offset in
the volume signal that originates from an additional conductance signal Shortly an electric
field broadens theoretically without end and protrudes through the ventricular wall into other
intrathoracic structures and organs Therefore the ventricular-derived conductance signal
originates partly from lungs mediastinum and most notably from the left ventricular
myocardium All have a relative contribution to the addition in ventricular-derived
conductance signal This offset-volume is referred to as the correction volume Vc (figure 2)
Several methods are used to acquire Gp and subsequent Vc One method calculates Gp from
the differences between myocardial and blood conductances at catheter excitation frequencies
of 2 and 10 kHz (12) The second method estimates Gp by exploiting the differential
frequency-induced conductivity of myocardium and blood (13) In our experiments we used
the hypertonic saline injection (HSI) method The method comprises of the infusion of 4 microl
Chapter 3 Murine left ventricular pressure-volume loops
8
hypertonic (30 NaCl) saline solution into the external jugular vein (~ 15 of left ventricular
absolute end-diastolic volume) The saline mixes with the murine blood and increases
conductance of blood through its high content of electrolytes The result is a volume increase
as shown by figure 4 a representative figure of a common HSI procedure The amount of
saline infusion is limited to 4 microl to prevent hemodynamic changes due to the fluid injection
As shown in figure 4 there is no influence on pressure The correction volume Vc is derived
via computerized algorithms
Fig 4 Conductance and pressure signals during hypertonic saline injection The total
acquired time period was 584 seconds Ventilation was stopped at the mark () after which 4
microL of 30 saline was injected (arrow) into the external jugular vein The conductivity of
blood was increased by the hypertonic saline infusion as demonstrated by the increase in the
conductance signal Parallel conductance is calculated by analyzing the conductance signal
Volu
me
(RVU
) Volume signal
30
35
40
45
50
Pressure signal
-200
20406080
100
Time (s)
Pres
sure
(mm
Hg)
Volu
me
(RVU
) Volume signal
30
35
40
45
50
30
35
40
45
50
Pressure signal
-200
20406080
100
-200
20406080
020406080
100
Time (s)
Pres
sure
(mm
Hg)
Figure 4
Chapter 3 Murine left ventricular pressure-volume loops
9
obtained during wash-in of the saline The unchanged pressure indicates that hemodynamics
are stable
In practice the conductance-catheter tends to constantly underestimate the left
ventricular bloodvolume The slope factor α should be calculated to correct for this
discrepancy (figure 2) For this purpose an independent volume measurement is needed
obtained in mice by blood flow measurements or echocardiography The slope factor α then
follows from the ratio conductance volumeindependent measured volume Table 1 shows the
results of α determination by echocardiography Slope factor α varied from 03 - 05
depending on the moment of measurement within the cardiac cycle The variance could be
due to the relative inaccuracy of ultrasonographic analyses It could also be inherent to
conductance measurements in the manner as performed Slope factor α deviates from 1
primarily due to the dependency of Gp on left ventricular volume (14) Gp should therefore be
measured continuously within the cardiac cycle to be able to correct adequately for the
variance of α However as the result of technical limitations continuous Gp acquisition is not
yet possible Whenever echocardiography is used end-diastolic volume EDV should be used
for α determination The variance of this calculated α is minor (SEM = 002) and the
correlation relatively high (adjusted R2 = 065)
Chapter 3 Murine left ventricular pressure-volume loops
10
Surgical protocols for PV-loops acquisition
The Sigma SA (CDLeycom Zoetermeer the Netherlands) single segment data
acquisition module was used for assessment of PV-loops The system operated on a constant
excitation current of 30microA to prevent interaction with the murine cardiac conduction system
determined by hypertonic saline injection and subtracted offline CONDUCT 2000 software
(CDLeycom Zoetermeer The Netherlands) was used for data acquisition and Circlab
software (LUMC Leiden The Netherlands) was used for offline data analysis
Invasive hemodynamic measurements of the murine left ventricle can theoretically be
performed by several ways for To date the most frequently reported method is an open-chest
(OC) approach (8) In brief mice are anaesthetized and the anterior thorax and the neck of the
mouse are shaved The animals are fixed on a warming plate Care is taken to maintain body
temperature constant at 37deg Celsius The neck skin of the mouse is opened by a saggital
incision The trachea is exposed to visually guide the intratracheal cannula (20-Gauge) where
after the cannula is connected to a mouse ventilator Minivent type 845 (Hugo Sachs
Electronics Germany) set at 150 strokes per minute and a tidal volume of 250 microl The
external jugular veins are cannulated with a flame-stretched PE-50 catheter for infusion of
saline and drugs The abdomen is opened subcostally The diaphragm is incised by a
transverse substernal approach leaving the pericardium intact The micromanometer is
calibrated with a mercury manometer by placing the sensor in 37deg Celsius normal saline The
left ventricle is entered through an apical stab with a 25 12 G needle immediately followed
by the Millar conductance-micromanometer The catheter is positioned correctly in the left
ventricle under guidance of the online pressure and volume signals The combination of
pressure and volume signals allows accurate positioning of the catheter in the left ventricle
Ventilation is stopped during data acquisition to avoid influence from ventilation of the lungs
on the pressure and volume signals The acquisition protocol consists of measurements of
Chapter 3 Murine left ventricular pressure-volume loops
11
baseline cardiac function hypertonic saline injection (3x) inferior caval vein occlusions with
and without β-adrenergic stimulation (isoproterenol 1000 pg)
This method is theoretically disadvantageous since collaps of the lungs and
destruction of myocardial integrity are induced through the relatively large surgical trauma
Furthermore in myocardial infarction studies the open-chest approach is hampered by
extensive left ventricular remodeling since the scar tissue is not accessible for the
conductance catheter and fails to provide a stable position
A closed-chest (CC) approach would theoretically circumvent several of these
disadvantages Firstly in a closed-chest the lungs remain untouched Secondly the cardiac
position and myocardial structures remain intact Thirdly surgical trauma and hemodynamic
stress would be reduced to a minimum Finally a closed-chest approach would allow accurate
assessment of left ventricular (LV) hemodynamic behavior in mice which underwent transient
or permanent occlusion of the left anterior descending coronary artery The surgical procedure
is similar to the open-chest approach except for the insertion of the conductance catheter into
the left ventricle In brief mice are anaesthetized and the neck and abdomen are shaved Care
is taken to maintain body temperature and ventilation support is provided as above Venous
catheters are placed after which the right common carotid is prepared for insertion of the
ultraminiature conductance-micromanometer The catheter is calibrated and subsequently
inserted into the left ventricle under guidance of the online pressure signal A transverse
abdominal incision without opening the thorax is performed to expose the inferior caval vein
The acquisition protocol is similar as in the open-chest approach
Chapter 3 Murine left ventricular pressure-volume loops
12
Explanation of the pressure-volume loop
The left ventricular PV loop is a two-dimensional representation of a single cardiac
cycle (figure 5) Beginning at end-diastole when the mitral valve closes the ejection phase
starts with pressure build up without actual volume ejection ie the isovolumic contraction
phase Blood is ejected out of the ventricle into the aorta upon opening of the aortic valve and
subsequently left ventricular volume decreases The end of ejection is defined by aortic valve
closure and followed by myocardial relaxation characterized by pressure decrease without
volume change ie the isovolumic relaxation phase The filling phase is initiated with
opening of the mitral valve and rise of ventricular volume The technique of simultaneous left
ventricular pressure and volume measurements provides continuous assessment of cardiac
function
Fig 5 The cardiac cycle in a single pressure-volume loop End-diastole is marked by the
closure of the mitral valves The hearts starts to build up pressure while all valves are closed
(isovolumetric contraction phase) before actual ejection begins following the opening of the
aortic valve Volume decreases while ejection progresses until the aortic valves close (end-
Closure aortic valve
VOLUME
PRES
SUR
E
Figure 5
Opening aortic valve
Isovolumicrelaxation
Isovolumiccontraction
Closure mitral valve
Openingmitral valve
Chapter 3 Murine left ventricular pressure-volume loops
13
systole) and relaxation starts Aortic and mitral valves are closed during relaxation
(isovolumic relaxation phase) The filling phase follows upon the opening of the mitral valve
and volume increase while pressure build up is minor
PV loops reveal in first instance the standard functional parameters (figure 6)
Fig 6 Cardiac performance parameters in the pressure-volume loop ED indicates end-
diastole ES end-systole Ved end-diastolic volume Ves end-systolic volume Ped end-
diastolic pressure Pes end-systolic pressure The area of the PV loop resembles stroke work
(SW) Stroke volume SV can be derived by subtracting Ves from Ved
However specific PV relationships are acquired too (table 2 figure 7) These
relationships describe the contractile and relaxative capabilities of the heart independent of
preload afterload or heart rate Transient occlusion of the inferior caval vein in mice is
performed to obtain these relationships Caval vein occlusion leads to a decrease in venous
return and thereby in preload of the left ventricle The response of the heart is typical as
Figure 6
VOLUME
PRES
SURE
ES
ED
Pes
Ved Ves
Ped
SV
SW
Chapter 3 Murine left ventricular pressure-volume loops
14
presented in figure 7 and shows the PV correlations Contractile parameters derived from PV-
correlations best detect small alterations in contractility in mice (15)
Fig 7 Pressure-volume relationships Variably loaded PV loops are used to define several PV
relationships The variable loading is derived by occluding the inferior caval vein and thereby
reducing venous return The end-systolic PV relationship (ESPVR) describes the contractile
performance of the left ventricle Contractility is linear correlated with the steepness of the
ESPVR slope ie Ees The end-diastolic PV relationship (EDPVR) describes diastolic
performance for instance diastolic distensibility The slope of the EDPVR (β) indicates the
passive chamber stiffness
The end-systolic PV relationship (ESPVR) describes the relation between volume and
pressure changes in systole Within the physiological range this relationship approximates a
straight line The relationship can be described in terms of its slope which reflects myocardial
contractility and its volume axis intercept V0 The volume intercept from the ESPVR line
Figure 7
PRES
SURE ESPVR
VOLUME
EesEes
EDPVRβ
V75
Chapter 3 Murine left ventricular pressure-volume loops
15
could better be taken at a constant pressure level in the physiological range for example
between 50 and 100 mm Hg (16) The volume intercept at a constant pressure (eg V75)
reflects myocardial contractility as it indicates the extent of contraction Increased myocardial
contractility for instance during beta-adrenergic stimulation with isoprenaline results in a
steeper ESPVR-slope and a leftward shift on the volume axis while attenuated contractility
for example during clinical heart failure results in a concomitantly plain slope and a
rightward shift on the volume axis The slope of the ESPVR (Ees) is used to describe the left
ventricular elastance Arterial elastance (Ea) a measure for ventricular afterload is described
by the slope of the relationship between stroke volume and end-systolic pressure (figure 8)
Fig 8 Arterial-ventricular coupling Ventricular elastance is estimated from the end-
systolic PV relationship (ESPVR) slope Ees Arterial elastance (Ea) is approximated by the
stroke volumeend-systolic pressure ratio (Ao Pes-SV relationship) The between Ea and Ees
reflects the coupling between the left ventricle and the arterial circulation The production of
stroke work is maximal when the Ea and Ees are approximately equal
Figure 8
Ea Ees
VOLUME
PRES
SURE
PRESSURE
PV-relat
ion Ao PES ndash SV relation
Chapter 3 Murine left ventricular pressure-volume loops
16
The production of stroke work is maximal when the Ees and Ea are approximately
equal Stroke work attenuates substantially in relation to its maximal value whenever Ea and
Ees differ markedly (1718) The preload-recruitable stroke work (PRSW) is the relationship
between end-diastolic volume and performed stroke work by the ventricle It is a load-
independent measure of contractility related to preload The contractile state of the heart is
resembled by the steepness of the PRSW-slope In a high contractile state the heart is able to
perform more stroke work at a constant end-diastolic volume for instance by augmenting the
ejection fraction
Diastolic function is derived from the end-diastolic PV relationship (EDPVR) which
correlates with the compliance of the ventricular myocardium Diastolic dysfunctioning or
failure is observed by an inappropriate upward shift of the ESPVR The slope of the EDPVR
(β) increases during augmented stiffness of the ventricular wall when pressure rises
progressively more during ventricular filling The opposite occurs in case of increased
compliance Certain cardiac diseases and remodeling processes are correlated with increased
stiffness of the ventricular wall by collagen deposition resulting in an increase of the
EDPVR-slope (19)
Numerous other relationships can be assessed The limits are determined by the
interests and the creativity of the investigator
Chapter 3 Murine left ventricular pressure-volume loops
17
Results of PV-measurements with the open- (OC) and closed-chest (CC) approach
A comparative study was performed to determine scientifically based arguments for
the choice between open- (OC) or closed-chest (CC) PV measurements to examine murine
cardiac function Comparing cardiac performance between OC and CC protocols revealed
overall relatively similar values for the investigated parameters (table 3) The values for LV
volumes were corrected for ρ determined at 124 Ωcm in the used setup (N = 10 12352 plusmn
088 Ωcm) α (N = 13 030) and Vc Vc was determined during all PV experiments by the
hypertonic saline injection method No significant differences could be detected between CC
and OC instrumentation (9469 plusmn 483 microl versus 9272 plusmn 205 microl respectively NS) The 4 microl
30 saline demonstrated to be sufficient to change blood conductivity Moreover as this
volume encompasses only 15 of the normal murine end-diastolic volume it proved to be too
small to influence LV end-diastolic and end-systolic pressures (figure 4) in either OC or CC
mice
Several differences were found between the OC and CC approaches (table 3) Cardiac
function in the OC approach was characterized by higher ejection fractions (EF 69 versus
48 respectively) larger stroke volume (1998 versus 1470 microl respectively) and a leftward
shift in ventricular volume On the contrary measuring cardiac function with an intact thorax
resulted in higher end-systolic pressures (ESP OC 52 versus CC 65 mmHg with urethane
anesthesia) and a higher rate of relaxation as indicated by the dPdtmin No differences were
found in the PV relationships ie the ESPVR EDPVR or PRSW Interestingly the OC
approach did result in a mismatch between arterial afterload and ventricular work The
arterial-ventricular elastance ratio (EaEes) was significantly depressed following opening of
the chest In contrast EaEes ratios were normal (ie ~ 10) in the CC approach under both
regimens This finding is consistently found in open-chest instrumented mice (8) The arterial-
ventricular coupling mismatch was depending on arterial resistance the slope of the ESPVR
Chapter 3 Murine left ventricular pressure-volume loops
18
Table 1 Comparison of volume derived by ultrasonography and conductance
Descriptive statistics of alphaN Min Max Mean SEM
EDV 13 018 045 030 002ESV 13 016 094 051 007SV 13 009 058 026 004
Regression analysis
N
RR2
Adjusted R2
SEE
EDV13
082068065179
ESV13
083069066172
SV13
041017009117
Chapter 3 Murine left ventricular pressure-volume loops
19
Left ventricular volume was measured by both ultrasonography
and conductance in adult C57Bl6 mice End-diastolic end-
systolic and stroke volume were used to obtain alpha (α)
Descriptive analysis shows that α determination at the end-
diastolic moment results in the most consistent mean α Also
the correlation of LV volume values between ultrasonography
and conductance is high as shown by the regression analysis
SEM indicates standard error of the mean SEE standard error
of the estimate
EDVECHO (microl)120100806040200
EDV C
ON
DUC
TAN
CE (micro
l)
18
16
14
12
10
8
6
SCATTERPLOT OF END-DIASTOLIC VOLUMECONDUCTANCE VS ULTRASONOGRAPHY
EDVECHO (microl)120100806040200
EDV C
ON
DUC
TAN
CE (micro
l)
18
16
14
12
10
8
6
EDVECHO (microl)120100806040200
EDV C
ON
DUC
TAN
CE (micro
l)
18
16
14
12
10
8
6
SCATTERPLOT OF END-DIASTOLIC VOLUMECONDUCTANCE VS ULTRASONOGRAPHY
Chapter 3 Murine left ventricular pressure-volume loops
20
Table 2 Parameters derived by pressure-volume loops
Abbreviations DefinitionsGeneral parameters
CI (CI = CObody wt) CO HR
Card iac indexCard iac outputHeart rate
PressuredPdtmax
dPdtmin
PedPesτ
Maximum derivative of change in systolic pressure in timeMaximum derivative of change in diastolic pressure in timeEnd-diastolic pressureEnd-systolic pressureTime constant of isovolumic relaxation
VolumeEFSI (SI = SVbody wt)SVVedVes
Ejection fractionStroke index Stroke volumeEnd-diastolic pressureEnd-systolic pressure
Pressure-volume relationshipsβEa (Ea = PesSV)EDPVREes
Slope of the end-diastolic pressure-volume relat ionshipArterial elastanceEnd-diastolic pressure-volume relat ionshipEnd-systolic ventricular elastance
EmaxESPVR
(slope of the end-systolic pressure-volume relationship)Maximum chamber elasticity (∆P∆V)End-systolic pressure-volume relat ionship
Pressure-volume areaEfficiencyEWPEPRSWPVASWSWI (SWI = SWbody wt)
EWPVAExternal work = SWPotential energyPreload-recruitable stroke workPressure-volume area = EW + PEStroke workStroke work index
Abbreviations DefinitionsGeneral parameters
CI (CI = CObody wt) CO HR
Card iac indexCard iac outputHeart rate
PressuredPdtmax
dPdtmin
PedPesτ
Maximum derivative of change in systolic pressure in timeMaximum derivative of change in diastolic pressure in timeEnd-diastolic pressureEnd-systolic pressureTime constant of isovolumic relaxation
VolumeEFSI (SI = SVbody wt)SVVedVes
Ejection fractionStroke index Stroke volumeEnd-diastolic pressureEnd-systolic pressure
Pressure-volume relationshipsβEa (Ea = PesSV)EDPVREes
Slope of the end-diastolic pressure-volume relat ionshipArterial elastanceEnd-diastolic pressure-volume relat ionshipEnd-systolic ventricular elastance
EmaxESPVR
(slope of the end-systolic pressure-volume relationship)Maximum chamber elasticity (∆P∆V)End-systolic pressure-volume relat ionship
Pressure-volume areaEfficiencyEWPEPRSWPVASWSWI (SWI = SWbody wt)
EWPVAExternal work = SWPotential energyPreload-recruitable stroke workPressure-volume area = EW + PEStroke workStroke work index
EmaxESPVR
(slope of the end-systolic pressure-volume (slope of the end-systolic pressure-volume relationship)Maximum chamber elasticity (∆P∆V)End-systolic pressure-volume relat ionship
Pressure-volume areaEfficiencyEWPEPRSWPVASWSWI (SWI = SWbody wt)
EWPVAExternal work = SWPotential energyPreload-recruitable stroke workPressure-volume area = EW + PEStroke workStroke work index
Chapter 3 Murine left ventricular pressure-volume loops
21
(Ees) proved to be equal in OC and CC instrumented mice The combination of enlarged
stroke volume with attenuated systolic pressures leads to a decrease in arterial elastance The
altered arterial elastance could be explained by the opening of the thorax A drop in overall
peripheral vascular resistance from baseline values has been described during thoracoscopy
(20)
Urethane
Volume (microl)
Pres
sure
(mm
Hg)
Pentobarbital
Volume (microl)
Pres
sure
(mm
Hg)
A
B
CCOCCCCCOCOC
CCOCCCCCOCOC
-100
102030405060708090
-10
0
10
20
30
40
50
60
0 5 10 15 20 25 30 35 400 5 10 15 20 25 30 35 40
0 5 10 15 20 25 30 35 400 5 10 15 20 25 30 35 40
Figure 9
Chapter 3 Murine left ventricular pressure-volume loops
22
Fig 9 Left ventricular pressure-volume loops Pressure presented in mmHg and volume microl
A Representative figure of PV loops acquired during urethane anesthesia in closed chest
(CC) and open chest (OC) instrumented mice B Representative figure of PV loops acquired
during pentobarbital anesthesia in CC and OC instrumented mice Loops are acquired during
an occlusion of the inferior caval vein Venous returns decreases which is represented in the
loops by attenuation of both pressure and volume The differences in ESP SW and ESPVR
between urethane and pentobarbital anesthesia can be observed by analyzing the loops in A
and B The loops show also the larger stroke volume and depressed systolic pressure in OC
instrumented mice
Figure 9 shows representative PV-loops while venous return was attenuated following
inferior caval vein occlusion Typical pressure and volume effects are depicted showing the
absence of apparent differences in PV relationships The mentioned differences in ESP SV
and EF are evident in the presented loops though
ECG recordings were made during both surgical protocols to detect possible heart rate
alterations and arrhythmias Murine left ventricular PV measurements could be distorted by
physiological responses to the catheterization Heart rate alterations could be anticipated
especially in relation to carotid sinus stimulation while cannulating of the carotid artery
However neither bradycardia nor other arrhythmias were observed during either CC or OC
procedures (figure 10) This finding indicates that cannulation of the right common carotid
artery does not alter heart rate by carotid sinus stimulation
Chapter 3 Murine left ventricular pressure-volume loops
23
Table 3 Functional parameters to determine baseline LV functioning in open- and closed-
chest protocols during steady-state measurement
URETHANE PENTOBARBITALOC CC OC CC
N = 5 N = 5 N = 10 N = 10
Mean plusmn SEM Mean plusmn SEM Mean plusmn SEM Mean plusmn SEM
HR 583 plusmn 20 658 plusmn 21 493 plusmn 25 481 plusmn 36SVdagger 1958 plusmn 351 1557 plusmn 254 2018 plusmn 183 1426 plusmn 103CO 12 plusmn 2 10 plusmn 2 10 plusmn 1 7 plusmn 0Vmaxdagger 1761 plusmn 053 2361 plusmn 223 3089 plusmn 289 3883 plusmn 230Vmindagger 215 plusmn 133 679 plusmn 180 1029 plusmn 189 2373 plusmn 199EFdagger 79 plusmn 6 66 plusmn 8 66 plusmn 4 39 plusmn 2
ESPdagger 52 plusmn 4 65 plusmn 5 42 plusmn 3 47 plusmn 4EDP 1 plusmn 1 -1 plusmn 1 -6 plusmn 2 1 plusmn 1
dPdtmax 7200 plusmn 1349 8252 plusmn 1685 4004 plusmn 629 3718 plusmn 684dPdtmindagger -4233 plusmn 531 -7577 plusmn 750 -3631 plusmn 424 -3348 plusmn 653Tau 10 plusmn 0 7 plusmn 0 12 plusmn 1 14 plusmn 2
SW 1066 plusmn 245 1147 plusmn 213 1076 plusmn 176 666 plusmn 116
EaEesdagger 065 plusmn 020 084 plusmn 016 060 plusmn 005 103 plusmn 015ESPVR 570 plusmn 094 589 plusmn 074 347 plusmn 027 318 plusmn 052EDPVR 009 plusmn 009 -008 plusmn 015 -015 plusmn 014 -005 plusmn 015PRSW 79 plusmn 14 64 plusmn 6 68 plusmn 10 53 plusmn 3
Results from LV pressure-volume measurements in C57Bl6 mice anesthetized by urethane or
pentobarbital Urethane versus pentobarbital P lt 005 dagger OC versus CC P lt 005 ρ Valued
124 Ωcm α 030 Open- (OC) and closed-chest (CC) protocols HR indicates heart rate in
bpm SV left ventricular stroke volume in microl CO cardiac output mlmin Vmin minimal left
ventricular volume in microl Vmax maximal left ventricular volume in microl EF ejection fraction in
ESP left ventricular end-systolic pressure in mmHg EDP left ventricular end-diastolic
pressure in mmHg dPdtmax maximal first derivative of left ventricular pressure in mmHgs
dPdtmin minimal first derivative of left ventricular pressure in mmHgs Tau time constant of
left ventricular relaxation in ms SW stroke work in mmHgmicrol Ea arterial elastance Ees
ventricular end-systolic elastance ESPVR left ventricular end-systolic PV relationship in
Chapter 3 Murine left ventricular pressure-volume loops
24
mmHgmicrol EDPVR left ventricular end-diastolic PV relationship in mmHgmicrol PRSW left
ventricular preload-recruitable stroke work in mmHg
The steady-state functional parameters from OC and CC instrumented mice during
either urethane or pentobarbital are also depicted in Table 2 The use of pentobarbital
anesthesia had a cardiodepressive effect that was represented by significant function decline
in most parameters EF dPdtMAX and ESPVR decreased respectively with 24 57 and 41
upon pentobarbital use compared to urethane anesthesia Pentobarbital therefore had strong
negative chronotropic and inotropic effects
Hear
trat
e(b
pm)
Heart rate trace in closed-chest animal
0
100
200
300
400
500
600
700
Time (minutes)
arterial canulation
A
0 1 2 3 4 5 6 7 8 9 10 11 12 13 14 15 16
Heart rate trace in open-chest animal
0
100
200
300
400
500
600
700
Time (minutes)
Hear
trat
e(b
pm)
Ventricular catheterisation
B
0 1 2 3 4 5 6 7 8 9 10 11 12 13 14
Figure 10
Chapter 3 Murine left ventricular pressure-volume loops
25
Fig 10 Heart rate tracings in closed chest and open chest instrumented mice
A Representative figure of a heart rate tracing in a closed-chest instrumented mouse The
moment of arterial cannulation is indicated Some arrhythmias are seen in response to
introduction of the catheter into the left ventricle Arrhythmias are only present in a short
time-period that is part of the stabilization period following catheter introduction Heart rate
remains unchanged during the measurements B Representative figure of a heart rate tracing
in an open-chest instrumented mouse Somewhat more pronounced chronotropic arrhythmias
are seen in response to ventricular introduction of the catheter by apical stab However no
significant brady- or tachycardias are present during the measurements
Chapter 3 Murine left ventricular pressure-volume loops
26
Discussion
In this chapter OC and CC protocols for in vivo left ventricular PV relationship
measurement are described and discussed Murine cardiac function determination via these
methods is sensitive reproducible and comparable The choice for open- or closed-chest PV
measurements in mice depends on the aim of the study with regards to the specific cardiac
pathology The OC approach is technically less complicated and less time consuming Main
characteristics of the OC model itself are low systolic pressures and arterial resistance The
OC approach could best be used in studies where myocardial integrity is not at stake
Particularly ischemiareperfusion studies regarding myocardial integrity are probably better
done using the CC approach
Assessment of cardiac performance in genetically engineered mice is indispensable to
understand human cardiovascular pathologies In general the synergistic features of cardiac
diseases such as hypertrophy and cell death affect cardiac function negatively The
contractile performance of the heart deteriorates which is reflected in the attenuation of
systolic parameters as ejection fraction stroke work and PV-relationships Furthermore
ventricular relaxation prolongs and diastolic filling becomes impaired The progression of
cardiac disease ultimately results in clinical heart failure which is defined by the inability of
the heart to meet hemodynamic demands of the body and is characterized by specific signs
and symptoms (21) The most important parameter of cardiac performance which defines
heart failure is cardiac output
The influence on cardiac performance of specific genes and proteins in the
development of cardiac diseases ought to be investigated extensively to assess their clinical
relevance Various techniques have been used to assess cardiac performance in mice The
main techniques will be discussed in brief
Chapter 3 Murine left ventricular pressure-volume loops
27
Echocardiography is the most widely used noninvasive technique to determine cardiac
performance in mice High-frequency transthoracic and transesophageal transducers are used
as effective tools for two-dimensional and Doppler imaging of ventricular wall structures
dimensions and volumes of cavum and cardiac function (2223) Full-conscious or gas-
anesthesia experiments are preferred for echocardiographic assessment of cardiac function in
mice (2425) There is no limit to the diversity of murine models investigated by this general
accepted method of cardiac performance assessment However the most questionable aspect
of these measurements is the significant inter- and intraobservator variance in the
measurements
Isolated working mouse heart measurements in a Langendorf perfusion setup are a
technique for ex vivo cardiac function measurements approximating the in vivo function level
(5) Cardiac output developed left ventricular pressure and first derivates of maximal and
minimal pressures are some of the parameters that can be derived Isolated working heart
measurements are especially useful to study the acute effects of ischemic preconditioning and
ischemia-induced apoptosis(2627) Metabolites of interest can be measured accurately in the
perfusion fluid Disadvantages are the impossibility of chronic studies and the
unphysiological situation of ex vivo cardiac function measurements
Aortic flow measurements by means of a flow-probe have been used in several
studies (2829) Aortic flow acquisition is a validated technique and reveals functional
parameters as cardiac output stroke volume and blood flow velocity However several
disadvantages oppose against this technique Firstly aortic flow measurements are invasive
(ie thoracotomy or laparotomy) and result solely in aortic derived volume parameters
Integrated ventricular function cannot be assessed More importantly the exact localization of
the flow probe around the aorta is the critical determinant of the systematic error made by
these measurements Flow probes have been placed around the ascending and descending
Chapter 3 Murine left ventricular pressure-volume loops
28
thoracic aorta and the abdominal aorta The percentage of total cardiac output passing the
flow probe on the specific location has to be estimated Flow probes located at the ascending
aorta correct for coronary circulation and for instance bloodvolume passing the descending
thoracic aorta has been estimated to be around 75 of total cardiac output (30) The estimated
correction factor provides lsquoabsolutersquo stroke volume instead of absolute LV cavum volumes
and does not correct for cardiophysiological changes Altered cardiophysiological situations
could theoretically influence the relative amount of bloodvolume passing the flow probe On
the other hand major advances are the possibility of chronic cardiac function measurements
and the relative facile manner of data acquirement(29) Moreover aortic flow probe
measurements are not hampered by deleterious cardiac remodeling in myocardial ischemia or
hypertrophy studies(2829)
The newly developed method of cardiac performance assessment by in vivo left
ventricular PV measurements in the CC model is introduced here Left ventricular PV
measurements in vivo provide an accurate assessment of murine cardiac function The method
is highly sensitive during open- and closed-chest approaches in determining alterations in left
ventricular function as result of cardiac disease or altered hemodynamic stress The
characteristics of simultaneous left ventricular pressure and volume measurements enable the
researcher to directly investigate pressure-related cardiac diseases as cardiac hypertrophy and
restrictive cardiomyopathy (31) or volume-related diseases as dilated cardiomyopathy (32)
Moreover the effective influence of both aspects of cardiac disease on each other can be
observed in detail For instance ventricular dilation and subsequent decrease in ventricular
systolic pressure is mapped accurately in PV-loops Continuous measurements provide
possibilities to investigate the complete cardiac cycle Basic aspects of cardiac physiology can
be visualized using PV-loops in mice (81533-35) For instance increase in ventricular filling
is followed by an increase in ejection fraction according to the Frank-Starling mechanism
Chapter 3 Murine left ventricular pressure-volume loops
29
The opposite is seen as a result of gradual venous return decrease in the case of transient caval
vein occlusion (figure 7 amp 9) Moreover the distinction between systolic and diastolic failure
can be made through continuous PV-measurements (19) Systolic heart failure encompasses
mainly an ejection dysfunction with impaired contractility Both aspects are obtained by and
directly visualized through PV-loops Additionally the definite diagnosis of diastolic failure
is dependent on the observation of an inappropriate upward shift of the (end-)diastolic PV
relationship requiring cardiac catheterization for continuous volume determinations using
impedance measurements and high-fidelity measurements of ventricular pressure with a
micromanometer (19) PV-loops are useful determining cardiac performance within the
complete continuum of healthy and diseased hearts
Chapter 3 Murine left ventricular pressure-volume loops
30
Conclusion
In vivo PV measurements provide an essential tool in the assessment of cardiac
function in genetically modified mice Open- and closed-chest surgical protocols for murine
cardiac function determination are sensitive reproducible and comparable PV-loops enable
the researcher to accurately investigate diverse murine models of cardiac pathology by
adequately visualizing the cause-and-effect relationship between genetic modification and
their functional outcome Changes in ventricular contractility are best detected by PV derived
parameters in comparison to other methods of cardiac function determination
Chapter 3 Murine left ventricular pressure-volume loops
31
References
1 Doevendans PA Daemen MJ de Muinck ED Smits JF Cardiovascular phenotypingin mice Cardiovasc Res 19983934-49
2 Hoit BD New approaches to phenotypic analysis in adult mice J Mol Cell Cardiol20013327-35
3 Chacko VP Aresta F Chacko SM Weiss RG MRIMRS assessment of in vivomurine cardiac metabolism morphology and function at physiological heart rates AmJ Physiol Heart Circ Physiol 2000279H2218-24
4 Tanaka N Dalton N Mao L et al Transthoracic echocardiography in models ofcardiac disease in the mouse Circulation 1996941109-17
5 De Windt LJ Willems J Reneman RS Van der Vusse GJ Arts T Van Bilsen M Animproved isolated left ventricular ejecting murine heart model Functional andmetabolic evaluation Pflugers Arch 1999437182-90
6 Palmen M Daemen MJ Buehler A et al Impaired cardiac remodeling and functionafter myocardial infarction in FGF-1 transgenic mice Circulation 1999100250
7 Rockman HA Hamilton RA Jones LR Milano CA Mao L Lefkowitz RJ Enhancedmyocardial relaxation in vivo in transgenic mice overexpressing the beta2-adrenergicreceptor is associated with reduced phospholamban protein J Clin Invest1996971618-23
8 Georgakopoulos D Mitzner WA Chen CH et al In vivo murine left ventricularpressure-volume relations by miniaturized conductance micromanometry Am JPhysiol 1998274H1416-22
9 Dekker AL Geskes GG Cramers AA et al Right ventricular support for off-pumpcoronary artery bypass grafting studied with bi-ventricular pressure-volume loops insheep Eur J Cardiothorac Surg 200119179-84
10 Schreuder JJ Steendijk P van der Veen FH et al Acute and short-term effects ofpartial left ventriculectomy in dilated cardiomyopathy assessment by pressure-volumeloops J Am Coll Cardiol 2000362104-14
11 Zimmer HG Measurement of left ventricular hemodynamic parameters in closed-chest rats under control and various pathophysiologic conditions Basic Res Cardiol19837877-84
12 Georgakopoulos D Kass DA Estimation of parallel conductance by dual-frequencyconductance catheter in mice Am J Physiol Heart Circ Physiol 2000279H443-50
13 Feldman MD Mao Y Valvano JW Pearce JA Freeman GL Development of amultifrequency conductance catheter-based system to determine LV function in miceAm J Physiol Heart Circ Physiol 2000279H1411-20
14 Kornet L Schreuder JJ Van de Velden ET Jansen JR The volume-dependency ofparallel conductance throughout the cardiac cycle and its consequence for volumeestimation of the left ventricle in patients Cardiovasc Res 200151729-35
15 Nemoto S DeFreitas G Mann DL Carabello BA Effects of changes in leftventricular contractility on indexes of contractility in mice Am J Physiol Heart CircPhysiol 2002283H2504-10
16 Baan J Van de Velden ET Steendijk P Ventricular pressure-volume relations in vivoEur Heart J 199213 SupplE2-6
17 Little WC Cheng CP Left ventricular-arterial coupling in conscious dogs Am JPhysiol 1991261H70-6
18 Sunagawa K Maughan WL Sagawa K Optimal arterial resistance for the maximalstroke work studied in isolated canine left ventricle Circ Res 198556586-95
Chapter 3 Murine left ventricular pressure-volume loops
32
19 Van Kraaij D Van Pol P Ruiters AW et al Diagnosing diastolic heart failure Eur JHeart Fail 20024419-30
20 Faunt KK Cohn LA Jones BD Dodam JR Cardiopulmonary effects of bilateralhemithorax ventilation and diagnostic thoracoscopy in dogs Am J Vet Res1998591494-8
21 Lips DJ Van Kraaij DL De Windt LJ Doevendans PA Molecular determinants ofmyocardial hypertrophy and failure alternative pathways for beneficial andmaladaptive hypertrophy Eur Heart J 200324883-96
22 Collins KA Korcarz CE Lang RM Use of echocardiography for the phenotypicassessment of genetically altered mice Physiol Genomics 200313227-39
23 Scherrer-Crosbie M Steudel W Hunziker PR et al Determination of right ventricularstructure and function in normoxic and hypoxic mice a transesophagealechocardiographic study Circulation 1998981015-21
24 Takuma S Suehiro K Cardinale C et al Anesthetic inhibition in ischemic andnonischemic murine heart comparison with conscious echocardiographic approachAm J Physiol Heart Circ Physiol 2001280H2364-70
25 Chaves AA Weinstein DM Bauer JA Non-invasive echocardiographic studies inmice influence of anesthetic regimen Life Sci 200169213-22
26 Yamaura G Turoczi T Yamamoto F Siddqui MA Maulik N Das DK STATsignaling in ischemic heart a role of STAT5A in ischemic preconditioning Am JPhysiol Heart Circ Physiol 2003285H476-82
27 Bell RM Yellon DM Atorvastatin administered at the onset of reperfusion andindependent of lipid lowering protects the myocardium by up-regulating a pro-survival pathway J Am Coll Cardiol 200341508-15
28 Aartsen WM Schuijt MP Danser AH Daemen MJ Smits JF The role of locallyexpressed angiotensin converting enzyme in cardiac remodeling after myocardialinfarction in mice Cardiovasc Res 200256205-13
29 Janssen B Debets J Leenders P Smits J Chronic measurement of cardiac output inconscious mice Am J Physiol Regul Integr Comp Physiol 2002282R928-35
30 Georgakopoulos D Christe ME Giewat M Seidman CM Seidman JG Kass DA Thepathogenesis of familial hypertrophic cardiomyopathy early and evolving effects froman alpha-cardiac myosin heavy chain missense mutation Nat Med 19995327-30
31 Liao P Georgakopoulos D Kovacs A et al The in vivo role of p38 MAP kinases incardiac remodeling and restrictive cardiomyopathy Proc Natl Acad Sci U S A20019812283-8
32 McConnell BK Jones KA Fatkin D et al Dilated cardiomyopathy in homozygousmyosin-binding protein-C mutant mice J Clin Invest 19991041235-44
33 Georgakopoulos D Kass DA Minimal force-frequency modulation of inotropy andrelaxation of in situ murine heart J Physiol 2001534535-45
34 Yang B Larson DF Watson R Age-related left ventricular function in the mouseanalysis based on in vivo pressure-volume relationships Am J Physiol1999277H1906-13
35 Reyes M Freeman GL Escobedo D Lee S Steinhelper ME Feldman MDEnhancement of contractility with sustained afterload in the intact murine heartblunting of length-dependent activation Circulation 20031072962-8

Chapter 3 Murine left ventricular pressure-volume loops
3
Introduction
The use of murine transgenic and gene-targeted models in the field of cardiovascular
research has shown an exponential growth since this approach provides essential genetic and
molecular insight into human congenital and acquired heart disease By manipulating and
investigating cardiac gene expression by means of accurate techniques to analyze the resultant
phenotype the molecular basis for cardiac dysfunction may be uncovered
To date multiple techniques allow assessment of murine left ventricular hemodynamic
behavior(12) such as MRI (3) transthoracic ultrasonography (4) Langendorff perfusion
systems (5) aortic flow probes (6) micromanometers (7) and more recently conductance-
micromanometers (8) The use of conductance-micromanometers allows generation of
instantaneous pressure and volume signals to create pressure-volume (PV) relations for highly
accurate assessment of left ventricular performance The PV-loop method is regarded as the
golden standard for assessment of intrinsic myocardial function in large animals (9) and
humans (10) Recently the development of miniaturized PV-catheters has made this
methodology applicable to small animals such as mice (8)
The method of PV-loop assessment will be discussed in the following paragraphs
More detailed information about the acquisition of left ventricular volume will be provided
and the concepts of parallel conductance and volume correction factors are introduced The
surgical protocols for open-chest and closed-chest PV measurements and the difference in
cardiac performance between these two protocols are part of the discussion How to read PV-
loops completes the chapter
Chapter 3 Murine left ventricular pressure-volume loops
4
Fig 1 Presentation of the size of the Millar conductance-micromanometer The catheter is
placed in the left ventricle from a longitudinal sliced murine heart The tip of the catheter is
placed in the apex of the heart while the proximal part runs through the aortic valves From
top to bottom are seen two volume electrodes the pressure sensor and at the bottom two
volume electrodes An index finger indicates the miniature size of the catheter
Figure 1
Chapter 3 Murine left ventricular pressure-volume loops
5
The assessment of pressure-volume loops
PV loops are obtained by the conductance-micromanometer miniaturized for invasive
use in rodents (figure 1) (11) The volume-signal is derived in accordance with Ohmrsquos Law
ldquoThe amount of current flowing in a circuit made up of pure resistances is directly
proportional to the electromotive forces impressed on the circuit and inversely proportional to
the total resistance of the circuitrdquo In the setting of a mouse heart is the circuit of pure
resistances an analogue for ventricular bloodvolume the electromotive forces for the applied
voltage and the amount of current for plain current Voltage and current are constant during
bloodvolume measurements in the heart Bloodvolume itself however is not It varies
according to the cardiac cycle The varying ventricular bloodvolume of the mouse heart is
inversely proportional with the measured resistanceimpedance Or ventricular bloodvolume
is direct proportional with the measured electrical conductance of the blood (figure 2)
VOLU
ME
LV Volume
conductance
impedance
TIME
α
VcVc
physiological zero volume level
Figure 2
Chapter 3 Murine left ventricular pressure-volume loops
6
Fig 2 The concept of conductance derived left ventricular volume Left ventricular
bloodvolume is linear proportional with the time-varying conductance signal which correlates
with the level of resistanceimpedance of the bloodvolume on the electric current produced by
the catheter The conductance-catheter underestimates the volume-signal due to inhomogenity
of the electrical field The slope factor α corrects for this underestimation The offset volume
that arises from the protrusion of the electrical current in tissues besides blood (parallel
conductance) is corrected by the correction volume Vc
The conductance catheter is equipped with four electrodes (figure 3) two current
electrodes and two sensor electrodes The current electrodes produce an electric field with a
magnitude of 30 microA
Fig 3 Position of the conductance catheter in the left ventricle The catheter is retrogradely
inserted in the left ventricle The catheter consists of one pressure sensor and four volume
Figure 3
PS
SE
SE
CE
CE
49 mm45 mm
Chapter 3 Murine left ventricular pressure-volume loops
7
electrodes two current electrodes and two sensor electrodes The height of the measured
volume segment depends on the distance between the sensing electrodes ie 45 mm The
mean length of the longitudinal axis of the heart from adult mice is approximately 49 mm
CE indicates current electrode SE sensing electrode and PS pressure sensor
This specific current is chosen to prevent interaction with the murine endogenous
conduction system of the heart The catheter measures conductance which is translated into
left ventricular volume by a software program Cycle-varying conductance correlates with
time-varying ventricular volume V(t) according to the following formula
V(t) = ρ L2 [G(t) ndash Gp]
where ρ (rho) is the mouse specific blood resistivity L indicates the distance between the
sensor electrodes (ie 45 mm) G(t) the instantaneous conductance and Gp parallel
conductance The mouse specific blood resistance is determined using a Rho-cuvette with a
length of 05 cm and a diameter of 02 cm resulting in a content of 150 microl Gp is the offset in
the volume signal that originates from an additional conductance signal Shortly an electric
field broadens theoretically without end and protrudes through the ventricular wall into other
intrathoracic structures and organs Therefore the ventricular-derived conductance signal
originates partly from lungs mediastinum and most notably from the left ventricular
myocardium All have a relative contribution to the addition in ventricular-derived
conductance signal This offset-volume is referred to as the correction volume Vc (figure 2)
Several methods are used to acquire Gp and subsequent Vc One method calculates Gp from
the differences between myocardial and blood conductances at catheter excitation frequencies
of 2 and 10 kHz (12) The second method estimates Gp by exploiting the differential
frequency-induced conductivity of myocardium and blood (13) In our experiments we used
the hypertonic saline injection (HSI) method The method comprises of the infusion of 4 microl
Chapter 3 Murine left ventricular pressure-volume loops
8
hypertonic (30 NaCl) saline solution into the external jugular vein (~ 15 of left ventricular
absolute end-diastolic volume) The saline mixes with the murine blood and increases
conductance of blood through its high content of electrolytes The result is a volume increase
as shown by figure 4 a representative figure of a common HSI procedure The amount of
saline infusion is limited to 4 microl to prevent hemodynamic changes due to the fluid injection
As shown in figure 4 there is no influence on pressure The correction volume Vc is derived
via computerized algorithms
Fig 4 Conductance and pressure signals during hypertonic saline injection The total
acquired time period was 584 seconds Ventilation was stopped at the mark () after which 4
microL of 30 saline was injected (arrow) into the external jugular vein The conductivity of
blood was increased by the hypertonic saline infusion as demonstrated by the increase in the
conductance signal Parallel conductance is calculated by analyzing the conductance signal
Volu
me
(RVU
) Volume signal
30
35
40
45
50
Pressure signal
-200
20406080
100
Time (s)
Pres
sure
(mm
Hg)
Volu
me
(RVU
) Volume signal
30
35
40
45
50
30
35
40
45
50
Pressure signal
-200
20406080
100
-200
20406080
020406080
100
Time (s)
Pres
sure
(mm
Hg)
Figure 4
Chapter 3 Murine left ventricular pressure-volume loops
9
obtained during wash-in of the saline The unchanged pressure indicates that hemodynamics
are stable
In practice the conductance-catheter tends to constantly underestimate the left
ventricular bloodvolume The slope factor α should be calculated to correct for this
discrepancy (figure 2) For this purpose an independent volume measurement is needed
obtained in mice by blood flow measurements or echocardiography The slope factor α then
follows from the ratio conductance volumeindependent measured volume Table 1 shows the
results of α determination by echocardiography Slope factor α varied from 03 - 05
depending on the moment of measurement within the cardiac cycle The variance could be
due to the relative inaccuracy of ultrasonographic analyses It could also be inherent to
conductance measurements in the manner as performed Slope factor α deviates from 1
primarily due to the dependency of Gp on left ventricular volume (14) Gp should therefore be
measured continuously within the cardiac cycle to be able to correct adequately for the
variance of α However as the result of technical limitations continuous Gp acquisition is not
yet possible Whenever echocardiography is used end-diastolic volume EDV should be used
for α determination The variance of this calculated α is minor (SEM = 002) and the
correlation relatively high (adjusted R2 = 065)
Chapter 3 Murine left ventricular pressure-volume loops
10
Surgical protocols for PV-loops acquisition
The Sigma SA (CDLeycom Zoetermeer the Netherlands) single segment data
acquisition module was used for assessment of PV-loops The system operated on a constant
excitation current of 30microA to prevent interaction with the murine cardiac conduction system
determined by hypertonic saline injection and subtracted offline CONDUCT 2000 software
(CDLeycom Zoetermeer The Netherlands) was used for data acquisition and Circlab
software (LUMC Leiden The Netherlands) was used for offline data analysis
Invasive hemodynamic measurements of the murine left ventricle can theoretically be
performed by several ways for To date the most frequently reported method is an open-chest
(OC) approach (8) In brief mice are anaesthetized and the anterior thorax and the neck of the
mouse are shaved The animals are fixed on a warming plate Care is taken to maintain body
temperature constant at 37deg Celsius The neck skin of the mouse is opened by a saggital
incision The trachea is exposed to visually guide the intratracheal cannula (20-Gauge) where
after the cannula is connected to a mouse ventilator Minivent type 845 (Hugo Sachs
Electronics Germany) set at 150 strokes per minute and a tidal volume of 250 microl The
external jugular veins are cannulated with a flame-stretched PE-50 catheter for infusion of
saline and drugs The abdomen is opened subcostally The diaphragm is incised by a
transverse substernal approach leaving the pericardium intact The micromanometer is
calibrated with a mercury manometer by placing the sensor in 37deg Celsius normal saline The
left ventricle is entered through an apical stab with a 25 12 G needle immediately followed
by the Millar conductance-micromanometer The catheter is positioned correctly in the left
ventricle under guidance of the online pressure and volume signals The combination of
pressure and volume signals allows accurate positioning of the catheter in the left ventricle
Ventilation is stopped during data acquisition to avoid influence from ventilation of the lungs
on the pressure and volume signals The acquisition protocol consists of measurements of
Chapter 3 Murine left ventricular pressure-volume loops
11
baseline cardiac function hypertonic saline injection (3x) inferior caval vein occlusions with
and without β-adrenergic stimulation (isoproterenol 1000 pg)
This method is theoretically disadvantageous since collaps of the lungs and
destruction of myocardial integrity are induced through the relatively large surgical trauma
Furthermore in myocardial infarction studies the open-chest approach is hampered by
extensive left ventricular remodeling since the scar tissue is not accessible for the
conductance catheter and fails to provide a stable position
A closed-chest (CC) approach would theoretically circumvent several of these
disadvantages Firstly in a closed-chest the lungs remain untouched Secondly the cardiac
position and myocardial structures remain intact Thirdly surgical trauma and hemodynamic
stress would be reduced to a minimum Finally a closed-chest approach would allow accurate
assessment of left ventricular (LV) hemodynamic behavior in mice which underwent transient
or permanent occlusion of the left anterior descending coronary artery The surgical procedure
is similar to the open-chest approach except for the insertion of the conductance catheter into
the left ventricle In brief mice are anaesthetized and the neck and abdomen are shaved Care
is taken to maintain body temperature and ventilation support is provided as above Venous
catheters are placed after which the right common carotid is prepared for insertion of the
ultraminiature conductance-micromanometer The catheter is calibrated and subsequently
inserted into the left ventricle under guidance of the online pressure signal A transverse
abdominal incision without opening the thorax is performed to expose the inferior caval vein
The acquisition protocol is similar as in the open-chest approach
Chapter 3 Murine left ventricular pressure-volume loops
12
Explanation of the pressure-volume loop
The left ventricular PV loop is a two-dimensional representation of a single cardiac
cycle (figure 5) Beginning at end-diastole when the mitral valve closes the ejection phase
starts with pressure build up without actual volume ejection ie the isovolumic contraction
phase Blood is ejected out of the ventricle into the aorta upon opening of the aortic valve and
subsequently left ventricular volume decreases The end of ejection is defined by aortic valve
closure and followed by myocardial relaxation characterized by pressure decrease without
volume change ie the isovolumic relaxation phase The filling phase is initiated with
opening of the mitral valve and rise of ventricular volume The technique of simultaneous left
ventricular pressure and volume measurements provides continuous assessment of cardiac
function
Fig 5 The cardiac cycle in a single pressure-volume loop End-diastole is marked by the
closure of the mitral valves The hearts starts to build up pressure while all valves are closed
(isovolumetric contraction phase) before actual ejection begins following the opening of the
aortic valve Volume decreases while ejection progresses until the aortic valves close (end-
Closure aortic valve
VOLUME
PRES
SUR
E
Figure 5
Opening aortic valve
Isovolumicrelaxation
Isovolumiccontraction
Closure mitral valve
Openingmitral valve
Chapter 3 Murine left ventricular pressure-volume loops
13
systole) and relaxation starts Aortic and mitral valves are closed during relaxation
(isovolumic relaxation phase) The filling phase follows upon the opening of the mitral valve
and volume increase while pressure build up is minor
PV loops reveal in first instance the standard functional parameters (figure 6)
Fig 6 Cardiac performance parameters in the pressure-volume loop ED indicates end-
diastole ES end-systole Ved end-diastolic volume Ves end-systolic volume Ped end-
diastolic pressure Pes end-systolic pressure The area of the PV loop resembles stroke work
(SW) Stroke volume SV can be derived by subtracting Ves from Ved
However specific PV relationships are acquired too (table 2 figure 7) These
relationships describe the contractile and relaxative capabilities of the heart independent of
preload afterload or heart rate Transient occlusion of the inferior caval vein in mice is
performed to obtain these relationships Caval vein occlusion leads to a decrease in venous
return and thereby in preload of the left ventricle The response of the heart is typical as
Figure 6
VOLUME
PRES
SURE
ES
ED
Pes
Ved Ves
Ped
SV
SW
Chapter 3 Murine left ventricular pressure-volume loops
14
presented in figure 7 and shows the PV correlations Contractile parameters derived from PV-
correlations best detect small alterations in contractility in mice (15)
Fig 7 Pressure-volume relationships Variably loaded PV loops are used to define several PV
relationships The variable loading is derived by occluding the inferior caval vein and thereby
reducing venous return The end-systolic PV relationship (ESPVR) describes the contractile
performance of the left ventricle Contractility is linear correlated with the steepness of the
ESPVR slope ie Ees The end-diastolic PV relationship (EDPVR) describes diastolic
performance for instance diastolic distensibility The slope of the EDPVR (β) indicates the
passive chamber stiffness
The end-systolic PV relationship (ESPVR) describes the relation between volume and
pressure changes in systole Within the physiological range this relationship approximates a
straight line The relationship can be described in terms of its slope which reflects myocardial
contractility and its volume axis intercept V0 The volume intercept from the ESPVR line
Figure 7
PRES
SURE ESPVR
VOLUME
EesEes
EDPVRβ
V75
Chapter 3 Murine left ventricular pressure-volume loops
15
could better be taken at a constant pressure level in the physiological range for example
between 50 and 100 mm Hg (16) The volume intercept at a constant pressure (eg V75)
reflects myocardial contractility as it indicates the extent of contraction Increased myocardial
contractility for instance during beta-adrenergic stimulation with isoprenaline results in a
steeper ESPVR-slope and a leftward shift on the volume axis while attenuated contractility
for example during clinical heart failure results in a concomitantly plain slope and a
rightward shift on the volume axis The slope of the ESPVR (Ees) is used to describe the left
ventricular elastance Arterial elastance (Ea) a measure for ventricular afterload is described
by the slope of the relationship between stroke volume and end-systolic pressure (figure 8)
Fig 8 Arterial-ventricular coupling Ventricular elastance is estimated from the end-
systolic PV relationship (ESPVR) slope Ees Arterial elastance (Ea) is approximated by the
stroke volumeend-systolic pressure ratio (Ao Pes-SV relationship) The between Ea and Ees
reflects the coupling between the left ventricle and the arterial circulation The production of
stroke work is maximal when the Ea and Ees are approximately equal
Figure 8
Ea Ees
VOLUME
PRES
SURE
PRESSURE
PV-relat
ion Ao PES ndash SV relation
Chapter 3 Murine left ventricular pressure-volume loops
16
The production of stroke work is maximal when the Ees and Ea are approximately
equal Stroke work attenuates substantially in relation to its maximal value whenever Ea and
Ees differ markedly (1718) The preload-recruitable stroke work (PRSW) is the relationship
between end-diastolic volume and performed stroke work by the ventricle It is a load-
independent measure of contractility related to preload The contractile state of the heart is
resembled by the steepness of the PRSW-slope In a high contractile state the heart is able to
perform more stroke work at a constant end-diastolic volume for instance by augmenting the
ejection fraction
Diastolic function is derived from the end-diastolic PV relationship (EDPVR) which
correlates with the compliance of the ventricular myocardium Diastolic dysfunctioning or
failure is observed by an inappropriate upward shift of the ESPVR The slope of the EDPVR
(β) increases during augmented stiffness of the ventricular wall when pressure rises
progressively more during ventricular filling The opposite occurs in case of increased
compliance Certain cardiac diseases and remodeling processes are correlated with increased
stiffness of the ventricular wall by collagen deposition resulting in an increase of the
EDPVR-slope (19)
Numerous other relationships can be assessed The limits are determined by the
interests and the creativity of the investigator
Chapter 3 Murine left ventricular pressure-volume loops
17
Results of PV-measurements with the open- (OC) and closed-chest (CC) approach
A comparative study was performed to determine scientifically based arguments for
the choice between open- (OC) or closed-chest (CC) PV measurements to examine murine
cardiac function Comparing cardiac performance between OC and CC protocols revealed
overall relatively similar values for the investigated parameters (table 3) The values for LV
volumes were corrected for ρ determined at 124 Ωcm in the used setup (N = 10 12352 plusmn
088 Ωcm) α (N = 13 030) and Vc Vc was determined during all PV experiments by the
hypertonic saline injection method No significant differences could be detected between CC
and OC instrumentation (9469 plusmn 483 microl versus 9272 plusmn 205 microl respectively NS) The 4 microl
30 saline demonstrated to be sufficient to change blood conductivity Moreover as this
volume encompasses only 15 of the normal murine end-diastolic volume it proved to be too
small to influence LV end-diastolic and end-systolic pressures (figure 4) in either OC or CC
mice
Several differences were found between the OC and CC approaches (table 3) Cardiac
function in the OC approach was characterized by higher ejection fractions (EF 69 versus
48 respectively) larger stroke volume (1998 versus 1470 microl respectively) and a leftward
shift in ventricular volume On the contrary measuring cardiac function with an intact thorax
resulted in higher end-systolic pressures (ESP OC 52 versus CC 65 mmHg with urethane
anesthesia) and a higher rate of relaxation as indicated by the dPdtmin No differences were
found in the PV relationships ie the ESPVR EDPVR or PRSW Interestingly the OC
approach did result in a mismatch between arterial afterload and ventricular work The
arterial-ventricular elastance ratio (EaEes) was significantly depressed following opening of
the chest In contrast EaEes ratios were normal (ie ~ 10) in the CC approach under both
regimens This finding is consistently found in open-chest instrumented mice (8) The arterial-
ventricular coupling mismatch was depending on arterial resistance the slope of the ESPVR
Chapter 3 Murine left ventricular pressure-volume loops
18
Table 1 Comparison of volume derived by ultrasonography and conductance
Descriptive statistics of alphaN Min Max Mean SEM
EDV 13 018 045 030 002ESV 13 016 094 051 007SV 13 009 058 026 004
Regression analysis
N
RR2
Adjusted R2
SEE
EDV13
082068065179
ESV13
083069066172
SV13
041017009117
Chapter 3 Murine left ventricular pressure-volume loops
19
Left ventricular volume was measured by both ultrasonography
and conductance in adult C57Bl6 mice End-diastolic end-
systolic and stroke volume were used to obtain alpha (α)
Descriptive analysis shows that α determination at the end-
diastolic moment results in the most consistent mean α Also
the correlation of LV volume values between ultrasonography
and conductance is high as shown by the regression analysis
SEM indicates standard error of the mean SEE standard error
of the estimate
EDVECHO (microl)120100806040200
EDV C
ON
DUC
TAN
CE (micro
l)
18
16
14
12
10
8
6
SCATTERPLOT OF END-DIASTOLIC VOLUMECONDUCTANCE VS ULTRASONOGRAPHY
EDVECHO (microl)120100806040200
EDV C
ON
DUC
TAN
CE (micro
l)
18
16
14
12
10
8
6
EDVECHO (microl)120100806040200
EDV C
ON
DUC
TAN
CE (micro
l)
18
16
14
12
10
8
6
SCATTERPLOT OF END-DIASTOLIC VOLUMECONDUCTANCE VS ULTRASONOGRAPHY
Chapter 3 Murine left ventricular pressure-volume loops
20
Table 2 Parameters derived by pressure-volume loops
Abbreviations DefinitionsGeneral parameters
CI (CI = CObody wt) CO HR
Card iac indexCard iac outputHeart rate
PressuredPdtmax
dPdtmin
PedPesτ
Maximum derivative of change in systolic pressure in timeMaximum derivative of change in diastolic pressure in timeEnd-diastolic pressureEnd-systolic pressureTime constant of isovolumic relaxation
VolumeEFSI (SI = SVbody wt)SVVedVes
Ejection fractionStroke index Stroke volumeEnd-diastolic pressureEnd-systolic pressure
Pressure-volume relationshipsβEa (Ea = PesSV)EDPVREes
Slope of the end-diastolic pressure-volume relat ionshipArterial elastanceEnd-diastolic pressure-volume relat ionshipEnd-systolic ventricular elastance
EmaxESPVR
(slope of the end-systolic pressure-volume relationship)Maximum chamber elasticity (∆P∆V)End-systolic pressure-volume relat ionship
Pressure-volume areaEfficiencyEWPEPRSWPVASWSWI (SWI = SWbody wt)
EWPVAExternal work = SWPotential energyPreload-recruitable stroke workPressure-volume area = EW + PEStroke workStroke work index
Abbreviations DefinitionsGeneral parameters
CI (CI = CObody wt) CO HR
Card iac indexCard iac outputHeart rate
PressuredPdtmax
dPdtmin
PedPesτ
Maximum derivative of change in systolic pressure in timeMaximum derivative of change in diastolic pressure in timeEnd-diastolic pressureEnd-systolic pressureTime constant of isovolumic relaxation
VolumeEFSI (SI = SVbody wt)SVVedVes
Ejection fractionStroke index Stroke volumeEnd-diastolic pressureEnd-systolic pressure
Pressure-volume relationshipsβEa (Ea = PesSV)EDPVREes
Slope of the end-diastolic pressure-volume relat ionshipArterial elastanceEnd-diastolic pressure-volume relat ionshipEnd-systolic ventricular elastance
EmaxESPVR
(slope of the end-systolic pressure-volume relationship)Maximum chamber elasticity (∆P∆V)End-systolic pressure-volume relat ionship
Pressure-volume areaEfficiencyEWPEPRSWPVASWSWI (SWI = SWbody wt)
EWPVAExternal work = SWPotential energyPreload-recruitable stroke workPressure-volume area = EW + PEStroke workStroke work index
EmaxESPVR
(slope of the end-systolic pressure-volume (slope of the end-systolic pressure-volume relationship)Maximum chamber elasticity (∆P∆V)End-systolic pressure-volume relat ionship
Pressure-volume areaEfficiencyEWPEPRSWPVASWSWI (SWI = SWbody wt)
EWPVAExternal work = SWPotential energyPreload-recruitable stroke workPressure-volume area = EW + PEStroke workStroke work index
Chapter 3 Murine left ventricular pressure-volume loops
21
(Ees) proved to be equal in OC and CC instrumented mice The combination of enlarged
stroke volume with attenuated systolic pressures leads to a decrease in arterial elastance The
altered arterial elastance could be explained by the opening of the thorax A drop in overall
peripheral vascular resistance from baseline values has been described during thoracoscopy
(20)
Urethane
Volume (microl)
Pres
sure
(mm
Hg)
Pentobarbital
Volume (microl)
Pres
sure
(mm
Hg)
A
B
CCOCCCCCOCOC
CCOCCCCCOCOC
-100
102030405060708090
-10
0
10
20
30
40
50
60
0 5 10 15 20 25 30 35 400 5 10 15 20 25 30 35 40
0 5 10 15 20 25 30 35 400 5 10 15 20 25 30 35 40
Figure 9
Chapter 3 Murine left ventricular pressure-volume loops
22
Fig 9 Left ventricular pressure-volume loops Pressure presented in mmHg and volume microl
A Representative figure of PV loops acquired during urethane anesthesia in closed chest
(CC) and open chest (OC) instrumented mice B Representative figure of PV loops acquired
during pentobarbital anesthesia in CC and OC instrumented mice Loops are acquired during
an occlusion of the inferior caval vein Venous returns decreases which is represented in the
loops by attenuation of both pressure and volume The differences in ESP SW and ESPVR
between urethane and pentobarbital anesthesia can be observed by analyzing the loops in A
and B The loops show also the larger stroke volume and depressed systolic pressure in OC
instrumented mice
Figure 9 shows representative PV-loops while venous return was attenuated following
inferior caval vein occlusion Typical pressure and volume effects are depicted showing the
absence of apparent differences in PV relationships The mentioned differences in ESP SV
and EF are evident in the presented loops though
ECG recordings were made during both surgical protocols to detect possible heart rate
alterations and arrhythmias Murine left ventricular PV measurements could be distorted by
physiological responses to the catheterization Heart rate alterations could be anticipated
especially in relation to carotid sinus stimulation while cannulating of the carotid artery
However neither bradycardia nor other arrhythmias were observed during either CC or OC
procedures (figure 10) This finding indicates that cannulation of the right common carotid
artery does not alter heart rate by carotid sinus stimulation
Chapter 3 Murine left ventricular pressure-volume loops
23
Table 3 Functional parameters to determine baseline LV functioning in open- and closed-
chest protocols during steady-state measurement
URETHANE PENTOBARBITALOC CC OC CC
N = 5 N = 5 N = 10 N = 10
Mean plusmn SEM Mean plusmn SEM Mean plusmn SEM Mean plusmn SEM
HR 583 plusmn 20 658 plusmn 21 493 plusmn 25 481 plusmn 36SVdagger 1958 plusmn 351 1557 plusmn 254 2018 plusmn 183 1426 plusmn 103CO 12 plusmn 2 10 plusmn 2 10 plusmn 1 7 plusmn 0Vmaxdagger 1761 plusmn 053 2361 plusmn 223 3089 plusmn 289 3883 plusmn 230Vmindagger 215 plusmn 133 679 plusmn 180 1029 plusmn 189 2373 plusmn 199EFdagger 79 plusmn 6 66 plusmn 8 66 plusmn 4 39 plusmn 2
ESPdagger 52 plusmn 4 65 plusmn 5 42 plusmn 3 47 plusmn 4EDP 1 plusmn 1 -1 plusmn 1 -6 plusmn 2 1 plusmn 1
dPdtmax 7200 plusmn 1349 8252 plusmn 1685 4004 plusmn 629 3718 plusmn 684dPdtmindagger -4233 plusmn 531 -7577 plusmn 750 -3631 plusmn 424 -3348 plusmn 653Tau 10 plusmn 0 7 plusmn 0 12 plusmn 1 14 plusmn 2
SW 1066 plusmn 245 1147 plusmn 213 1076 plusmn 176 666 plusmn 116
EaEesdagger 065 plusmn 020 084 plusmn 016 060 plusmn 005 103 plusmn 015ESPVR 570 plusmn 094 589 plusmn 074 347 plusmn 027 318 plusmn 052EDPVR 009 plusmn 009 -008 plusmn 015 -015 plusmn 014 -005 plusmn 015PRSW 79 plusmn 14 64 plusmn 6 68 plusmn 10 53 plusmn 3
Results from LV pressure-volume measurements in C57Bl6 mice anesthetized by urethane or
pentobarbital Urethane versus pentobarbital P lt 005 dagger OC versus CC P lt 005 ρ Valued
124 Ωcm α 030 Open- (OC) and closed-chest (CC) protocols HR indicates heart rate in
bpm SV left ventricular stroke volume in microl CO cardiac output mlmin Vmin minimal left
ventricular volume in microl Vmax maximal left ventricular volume in microl EF ejection fraction in
ESP left ventricular end-systolic pressure in mmHg EDP left ventricular end-diastolic
pressure in mmHg dPdtmax maximal first derivative of left ventricular pressure in mmHgs
dPdtmin minimal first derivative of left ventricular pressure in mmHgs Tau time constant of
left ventricular relaxation in ms SW stroke work in mmHgmicrol Ea arterial elastance Ees
ventricular end-systolic elastance ESPVR left ventricular end-systolic PV relationship in
Chapter 3 Murine left ventricular pressure-volume loops
24
mmHgmicrol EDPVR left ventricular end-diastolic PV relationship in mmHgmicrol PRSW left
ventricular preload-recruitable stroke work in mmHg
The steady-state functional parameters from OC and CC instrumented mice during
either urethane or pentobarbital are also depicted in Table 2 The use of pentobarbital
anesthesia had a cardiodepressive effect that was represented by significant function decline
in most parameters EF dPdtMAX and ESPVR decreased respectively with 24 57 and 41
upon pentobarbital use compared to urethane anesthesia Pentobarbital therefore had strong
negative chronotropic and inotropic effects
Hear
trat
e(b
pm)
Heart rate trace in closed-chest animal
0
100
200
300
400
500
600
700
Time (minutes)
arterial canulation
A
0 1 2 3 4 5 6 7 8 9 10 11 12 13 14 15 16
Heart rate trace in open-chest animal
0
100
200
300
400
500
600
700
Time (minutes)
Hear
trat
e(b
pm)
Ventricular catheterisation
B
0 1 2 3 4 5 6 7 8 9 10 11 12 13 14
Figure 10
Chapter 3 Murine left ventricular pressure-volume loops
25
Fig 10 Heart rate tracings in closed chest and open chest instrumented mice
A Representative figure of a heart rate tracing in a closed-chest instrumented mouse The
moment of arterial cannulation is indicated Some arrhythmias are seen in response to
introduction of the catheter into the left ventricle Arrhythmias are only present in a short
time-period that is part of the stabilization period following catheter introduction Heart rate
remains unchanged during the measurements B Representative figure of a heart rate tracing
in an open-chest instrumented mouse Somewhat more pronounced chronotropic arrhythmias
are seen in response to ventricular introduction of the catheter by apical stab However no
significant brady- or tachycardias are present during the measurements
Chapter 3 Murine left ventricular pressure-volume loops
26
Discussion
In this chapter OC and CC protocols for in vivo left ventricular PV relationship
measurement are described and discussed Murine cardiac function determination via these
methods is sensitive reproducible and comparable The choice for open- or closed-chest PV
measurements in mice depends on the aim of the study with regards to the specific cardiac
pathology The OC approach is technically less complicated and less time consuming Main
characteristics of the OC model itself are low systolic pressures and arterial resistance The
OC approach could best be used in studies where myocardial integrity is not at stake
Particularly ischemiareperfusion studies regarding myocardial integrity are probably better
done using the CC approach
Assessment of cardiac performance in genetically engineered mice is indispensable to
understand human cardiovascular pathologies In general the synergistic features of cardiac
diseases such as hypertrophy and cell death affect cardiac function negatively The
contractile performance of the heart deteriorates which is reflected in the attenuation of
systolic parameters as ejection fraction stroke work and PV-relationships Furthermore
ventricular relaxation prolongs and diastolic filling becomes impaired The progression of
cardiac disease ultimately results in clinical heart failure which is defined by the inability of
the heart to meet hemodynamic demands of the body and is characterized by specific signs
and symptoms (21) The most important parameter of cardiac performance which defines
heart failure is cardiac output
The influence on cardiac performance of specific genes and proteins in the
development of cardiac diseases ought to be investigated extensively to assess their clinical
relevance Various techniques have been used to assess cardiac performance in mice The
main techniques will be discussed in brief
Chapter 3 Murine left ventricular pressure-volume loops
27
Echocardiography is the most widely used noninvasive technique to determine cardiac
performance in mice High-frequency transthoracic and transesophageal transducers are used
as effective tools for two-dimensional and Doppler imaging of ventricular wall structures
dimensions and volumes of cavum and cardiac function (2223) Full-conscious or gas-
anesthesia experiments are preferred for echocardiographic assessment of cardiac function in
mice (2425) There is no limit to the diversity of murine models investigated by this general
accepted method of cardiac performance assessment However the most questionable aspect
of these measurements is the significant inter- and intraobservator variance in the
measurements
Isolated working mouse heart measurements in a Langendorf perfusion setup are a
technique for ex vivo cardiac function measurements approximating the in vivo function level
(5) Cardiac output developed left ventricular pressure and first derivates of maximal and
minimal pressures are some of the parameters that can be derived Isolated working heart
measurements are especially useful to study the acute effects of ischemic preconditioning and
ischemia-induced apoptosis(2627) Metabolites of interest can be measured accurately in the
perfusion fluid Disadvantages are the impossibility of chronic studies and the
unphysiological situation of ex vivo cardiac function measurements
Aortic flow measurements by means of a flow-probe have been used in several
studies (2829) Aortic flow acquisition is a validated technique and reveals functional
parameters as cardiac output stroke volume and blood flow velocity However several
disadvantages oppose against this technique Firstly aortic flow measurements are invasive
(ie thoracotomy or laparotomy) and result solely in aortic derived volume parameters
Integrated ventricular function cannot be assessed More importantly the exact localization of
the flow probe around the aorta is the critical determinant of the systematic error made by
these measurements Flow probes have been placed around the ascending and descending
Chapter 3 Murine left ventricular pressure-volume loops
28
thoracic aorta and the abdominal aorta The percentage of total cardiac output passing the
flow probe on the specific location has to be estimated Flow probes located at the ascending
aorta correct for coronary circulation and for instance bloodvolume passing the descending
thoracic aorta has been estimated to be around 75 of total cardiac output (30) The estimated
correction factor provides lsquoabsolutersquo stroke volume instead of absolute LV cavum volumes
and does not correct for cardiophysiological changes Altered cardiophysiological situations
could theoretically influence the relative amount of bloodvolume passing the flow probe On
the other hand major advances are the possibility of chronic cardiac function measurements
and the relative facile manner of data acquirement(29) Moreover aortic flow probe
measurements are not hampered by deleterious cardiac remodeling in myocardial ischemia or
hypertrophy studies(2829)
The newly developed method of cardiac performance assessment by in vivo left
ventricular PV measurements in the CC model is introduced here Left ventricular PV
measurements in vivo provide an accurate assessment of murine cardiac function The method
is highly sensitive during open- and closed-chest approaches in determining alterations in left
ventricular function as result of cardiac disease or altered hemodynamic stress The
characteristics of simultaneous left ventricular pressure and volume measurements enable the
researcher to directly investigate pressure-related cardiac diseases as cardiac hypertrophy and
restrictive cardiomyopathy (31) or volume-related diseases as dilated cardiomyopathy (32)
Moreover the effective influence of both aspects of cardiac disease on each other can be
observed in detail For instance ventricular dilation and subsequent decrease in ventricular
systolic pressure is mapped accurately in PV-loops Continuous measurements provide
possibilities to investigate the complete cardiac cycle Basic aspects of cardiac physiology can
be visualized using PV-loops in mice (81533-35) For instance increase in ventricular filling
is followed by an increase in ejection fraction according to the Frank-Starling mechanism
Chapter 3 Murine left ventricular pressure-volume loops
29
The opposite is seen as a result of gradual venous return decrease in the case of transient caval
vein occlusion (figure 7 amp 9) Moreover the distinction between systolic and diastolic failure
can be made through continuous PV-measurements (19) Systolic heart failure encompasses
mainly an ejection dysfunction with impaired contractility Both aspects are obtained by and
directly visualized through PV-loops Additionally the definite diagnosis of diastolic failure
is dependent on the observation of an inappropriate upward shift of the (end-)diastolic PV
relationship requiring cardiac catheterization for continuous volume determinations using
impedance measurements and high-fidelity measurements of ventricular pressure with a
micromanometer (19) PV-loops are useful determining cardiac performance within the
complete continuum of healthy and diseased hearts
Chapter 3 Murine left ventricular pressure-volume loops
30
Conclusion
In vivo PV measurements provide an essential tool in the assessment of cardiac
function in genetically modified mice Open- and closed-chest surgical protocols for murine
cardiac function determination are sensitive reproducible and comparable PV-loops enable
the researcher to accurately investigate diverse murine models of cardiac pathology by
adequately visualizing the cause-and-effect relationship between genetic modification and
their functional outcome Changes in ventricular contractility are best detected by PV derived
parameters in comparison to other methods of cardiac function determination
Chapter 3 Murine left ventricular pressure-volume loops
31
References
1 Doevendans PA Daemen MJ de Muinck ED Smits JF Cardiovascular phenotypingin mice Cardiovasc Res 19983934-49
2 Hoit BD New approaches to phenotypic analysis in adult mice J Mol Cell Cardiol20013327-35
3 Chacko VP Aresta F Chacko SM Weiss RG MRIMRS assessment of in vivomurine cardiac metabolism morphology and function at physiological heart rates AmJ Physiol Heart Circ Physiol 2000279H2218-24
4 Tanaka N Dalton N Mao L et al Transthoracic echocardiography in models ofcardiac disease in the mouse Circulation 1996941109-17
5 De Windt LJ Willems J Reneman RS Van der Vusse GJ Arts T Van Bilsen M Animproved isolated left ventricular ejecting murine heart model Functional andmetabolic evaluation Pflugers Arch 1999437182-90
6 Palmen M Daemen MJ Buehler A et al Impaired cardiac remodeling and functionafter myocardial infarction in FGF-1 transgenic mice Circulation 1999100250
7 Rockman HA Hamilton RA Jones LR Milano CA Mao L Lefkowitz RJ Enhancedmyocardial relaxation in vivo in transgenic mice overexpressing the beta2-adrenergicreceptor is associated with reduced phospholamban protein J Clin Invest1996971618-23
8 Georgakopoulos D Mitzner WA Chen CH et al In vivo murine left ventricularpressure-volume relations by miniaturized conductance micromanometry Am JPhysiol 1998274H1416-22
9 Dekker AL Geskes GG Cramers AA et al Right ventricular support for off-pumpcoronary artery bypass grafting studied with bi-ventricular pressure-volume loops insheep Eur J Cardiothorac Surg 200119179-84
10 Schreuder JJ Steendijk P van der Veen FH et al Acute and short-term effects ofpartial left ventriculectomy in dilated cardiomyopathy assessment by pressure-volumeloops J Am Coll Cardiol 2000362104-14
11 Zimmer HG Measurement of left ventricular hemodynamic parameters in closed-chest rats under control and various pathophysiologic conditions Basic Res Cardiol19837877-84
12 Georgakopoulos D Kass DA Estimation of parallel conductance by dual-frequencyconductance catheter in mice Am J Physiol Heart Circ Physiol 2000279H443-50
13 Feldman MD Mao Y Valvano JW Pearce JA Freeman GL Development of amultifrequency conductance catheter-based system to determine LV function in miceAm J Physiol Heart Circ Physiol 2000279H1411-20
14 Kornet L Schreuder JJ Van de Velden ET Jansen JR The volume-dependency ofparallel conductance throughout the cardiac cycle and its consequence for volumeestimation of the left ventricle in patients Cardiovasc Res 200151729-35
15 Nemoto S DeFreitas G Mann DL Carabello BA Effects of changes in leftventricular contractility on indexes of contractility in mice Am J Physiol Heart CircPhysiol 2002283H2504-10
16 Baan J Van de Velden ET Steendijk P Ventricular pressure-volume relations in vivoEur Heart J 199213 SupplE2-6
17 Little WC Cheng CP Left ventricular-arterial coupling in conscious dogs Am JPhysiol 1991261H70-6
18 Sunagawa K Maughan WL Sagawa K Optimal arterial resistance for the maximalstroke work studied in isolated canine left ventricle Circ Res 198556586-95
Chapter 3 Murine left ventricular pressure-volume loops
32
19 Van Kraaij D Van Pol P Ruiters AW et al Diagnosing diastolic heart failure Eur JHeart Fail 20024419-30
20 Faunt KK Cohn LA Jones BD Dodam JR Cardiopulmonary effects of bilateralhemithorax ventilation and diagnostic thoracoscopy in dogs Am J Vet Res1998591494-8
21 Lips DJ Van Kraaij DL De Windt LJ Doevendans PA Molecular determinants ofmyocardial hypertrophy and failure alternative pathways for beneficial andmaladaptive hypertrophy Eur Heart J 200324883-96
22 Collins KA Korcarz CE Lang RM Use of echocardiography for the phenotypicassessment of genetically altered mice Physiol Genomics 200313227-39
23 Scherrer-Crosbie M Steudel W Hunziker PR et al Determination of right ventricularstructure and function in normoxic and hypoxic mice a transesophagealechocardiographic study Circulation 1998981015-21
24 Takuma S Suehiro K Cardinale C et al Anesthetic inhibition in ischemic andnonischemic murine heart comparison with conscious echocardiographic approachAm J Physiol Heart Circ Physiol 2001280H2364-70
25 Chaves AA Weinstein DM Bauer JA Non-invasive echocardiographic studies inmice influence of anesthetic regimen Life Sci 200169213-22
26 Yamaura G Turoczi T Yamamoto F Siddqui MA Maulik N Das DK STATsignaling in ischemic heart a role of STAT5A in ischemic preconditioning Am JPhysiol Heart Circ Physiol 2003285H476-82
27 Bell RM Yellon DM Atorvastatin administered at the onset of reperfusion andindependent of lipid lowering protects the myocardium by up-regulating a pro-survival pathway J Am Coll Cardiol 200341508-15
28 Aartsen WM Schuijt MP Danser AH Daemen MJ Smits JF The role of locallyexpressed angiotensin converting enzyme in cardiac remodeling after myocardialinfarction in mice Cardiovasc Res 200256205-13
29 Janssen B Debets J Leenders P Smits J Chronic measurement of cardiac output inconscious mice Am J Physiol Regul Integr Comp Physiol 2002282R928-35
30 Georgakopoulos D Christe ME Giewat M Seidman CM Seidman JG Kass DA Thepathogenesis of familial hypertrophic cardiomyopathy early and evolving effects froman alpha-cardiac myosin heavy chain missense mutation Nat Med 19995327-30
31 Liao P Georgakopoulos D Kovacs A et al The in vivo role of p38 MAP kinases incardiac remodeling and restrictive cardiomyopathy Proc Natl Acad Sci U S A20019812283-8
32 McConnell BK Jones KA Fatkin D et al Dilated cardiomyopathy in homozygousmyosin-binding protein-C mutant mice J Clin Invest 19991041235-44
33 Georgakopoulos D Kass DA Minimal force-frequency modulation of inotropy andrelaxation of in situ murine heart J Physiol 2001534535-45
34 Yang B Larson DF Watson R Age-related left ventricular function in the mouseanalysis based on in vivo pressure-volume relationships Am J Physiol1999277H1906-13
35 Reyes M Freeman GL Escobedo D Lee S Steinhelper ME Feldman MDEnhancement of contractility with sustained afterload in the intact murine heartblunting of length-dependent activation Circulation 20031072962-8
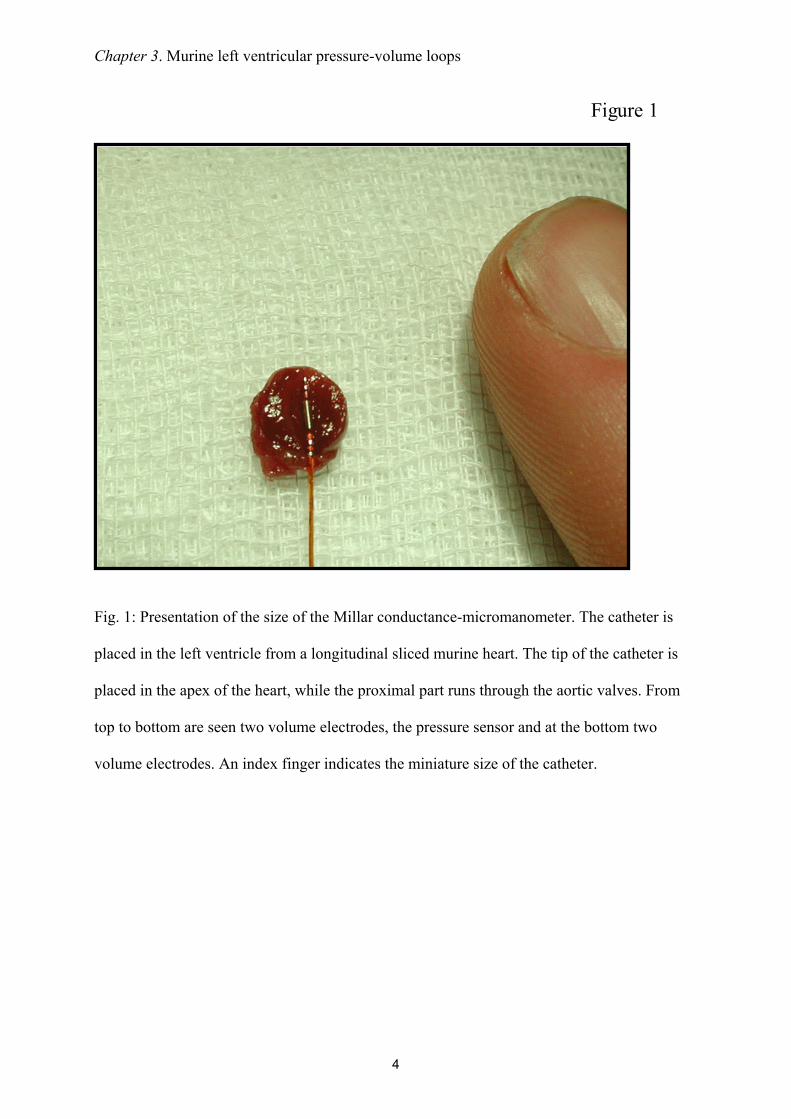
Chapter 3 Murine left ventricular pressure-volume loops
4
Fig 1 Presentation of the size of the Millar conductance-micromanometer The catheter is
placed in the left ventricle from a longitudinal sliced murine heart The tip of the catheter is
placed in the apex of the heart while the proximal part runs through the aortic valves From
top to bottom are seen two volume electrodes the pressure sensor and at the bottom two
volume electrodes An index finger indicates the miniature size of the catheter
Figure 1
Chapter 3 Murine left ventricular pressure-volume loops
5
The assessment of pressure-volume loops
PV loops are obtained by the conductance-micromanometer miniaturized for invasive
use in rodents (figure 1) (11) The volume-signal is derived in accordance with Ohmrsquos Law
ldquoThe amount of current flowing in a circuit made up of pure resistances is directly
proportional to the electromotive forces impressed on the circuit and inversely proportional to
the total resistance of the circuitrdquo In the setting of a mouse heart is the circuit of pure
resistances an analogue for ventricular bloodvolume the electromotive forces for the applied
voltage and the amount of current for plain current Voltage and current are constant during
bloodvolume measurements in the heart Bloodvolume itself however is not It varies
according to the cardiac cycle The varying ventricular bloodvolume of the mouse heart is
inversely proportional with the measured resistanceimpedance Or ventricular bloodvolume
is direct proportional with the measured electrical conductance of the blood (figure 2)
VOLU
ME
LV Volume
conductance
impedance
TIME
α
VcVc
physiological zero volume level
Figure 2
Chapter 3 Murine left ventricular pressure-volume loops
6
Fig 2 The concept of conductance derived left ventricular volume Left ventricular
bloodvolume is linear proportional with the time-varying conductance signal which correlates
with the level of resistanceimpedance of the bloodvolume on the electric current produced by
the catheter The conductance-catheter underestimates the volume-signal due to inhomogenity
of the electrical field The slope factor α corrects for this underestimation The offset volume
that arises from the protrusion of the electrical current in tissues besides blood (parallel
conductance) is corrected by the correction volume Vc
The conductance catheter is equipped with four electrodes (figure 3) two current
electrodes and two sensor electrodes The current electrodes produce an electric field with a
magnitude of 30 microA
Fig 3 Position of the conductance catheter in the left ventricle The catheter is retrogradely
inserted in the left ventricle The catheter consists of one pressure sensor and four volume
Figure 3
PS
SE
SE
CE
CE
49 mm45 mm
Chapter 3 Murine left ventricular pressure-volume loops
7
electrodes two current electrodes and two sensor electrodes The height of the measured
volume segment depends on the distance between the sensing electrodes ie 45 mm The
mean length of the longitudinal axis of the heart from adult mice is approximately 49 mm
CE indicates current electrode SE sensing electrode and PS pressure sensor
This specific current is chosen to prevent interaction with the murine endogenous
conduction system of the heart The catheter measures conductance which is translated into
left ventricular volume by a software program Cycle-varying conductance correlates with
time-varying ventricular volume V(t) according to the following formula
V(t) = ρ L2 [G(t) ndash Gp]
where ρ (rho) is the mouse specific blood resistivity L indicates the distance between the
sensor electrodes (ie 45 mm) G(t) the instantaneous conductance and Gp parallel
conductance The mouse specific blood resistance is determined using a Rho-cuvette with a
length of 05 cm and a diameter of 02 cm resulting in a content of 150 microl Gp is the offset in
the volume signal that originates from an additional conductance signal Shortly an electric
field broadens theoretically without end and protrudes through the ventricular wall into other
intrathoracic structures and organs Therefore the ventricular-derived conductance signal
originates partly from lungs mediastinum and most notably from the left ventricular
myocardium All have a relative contribution to the addition in ventricular-derived
conductance signal This offset-volume is referred to as the correction volume Vc (figure 2)
Several methods are used to acquire Gp and subsequent Vc One method calculates Gp from
the differences between myocardial and blood conductances at catheter excitation frequencies
of 2 and 10 kHz (12) The second method estimates Gp by exploiting the differential
frequency-induced conductivity of myocardium and blood (13) In our experiments we used
the hypertonic saline injection (HSI) method The method comprises of the infusion of 4 microl
Chapter 3 Murine left ventricular pressure-volume loops
8
hypertonic (30 NaCl) saline solution into the external jugular vein (~ 15 of left ventricular
absolute end-diastolic volume) The saline mixes with the murine blood and increases
conductance of blood through its high content of electrolytes The result is a volume increase
as shown by figure 4 a representative figure of a common HSI procedure The amount of
saline infusion is limited to 4 microl to prevent hemodynamic changes due to the fluid injection
As shown in figure 4 there is no influence on pressure The correction volume Vc is derived
via computerized algorithms
Fig 4 Conductance and pressure signals during hypertonic saline injection The total
acquired time period was 584 seconds Ventilation was stopped at the mark () after which 4
microL of 30 saline was injected (arrow) into the external jugular vein The conductivity of
blood was increased by the hypertonic saline infusion as demonstrated by the increase in the
conductance signal Parallel conductance is calculated by analyzing the conductance signal
Volu
me
(RVU
) Volume signal
30
35
40
45
50
Pressure signal
-200
20406080
100
Time (s)
Pres
sure
(mm
Hg)
Volu
me
(RVU
) Volume signal
30
35
40
45
50
30
35
40
45
50
Pressure signal
-200
20406080
100
-200
20406080
020406080
100
Time (s)
Pres
sure
(mm
Hg)
Figure 4
Chapter 3 Murine left ventricular pressure-volume loops
9
obtained during wash-in of the saline The unchanged pressure indicates that hemodynamics
are stable
In practice the conductance-catheter tends to constantly underestimate the left
ventricular bloodvolume The slope factor α should be calculated to correct for this
discrepancy (figure 2) For this purpose an independent volume measurement is needed
obtained in mice by blood flow measurements or echocardiography The slope factor α then
follows from the ratio conductance volumeindependent measured volume Table 1 shows the
results of α determination by echocardiography Slope factor α varied from 03 - 05
depending on the moment of measurement within the cardiac cycle The variance could be
due to the relative inaccuracy of ultrasonographic analyses It could also be inherent to
conductance measurements in the manner as performed Slope factor α deviates from 1
primarily due to the dependency of Gp on left ventricular volume (14) Gp should therefore be
measured continuously within the cardiac cycle to be able to correct adequately for the
variance of α However as the result of technical limitations continuous Gp acquisition is not
yet possible Whenever echocardiography is used end-diastolic volume EDV should be used
for α determination The variance of this calculated α is minor (SEM = 002) and the
correlation relatively high (adjusted R2 = 065)
Chapter 3 Murine left ventricular pressure-volume loops
10
Surgical protocols for PV-loops acquisition
The Sigma SA (CDLeycom Zoetermeer the Netherlands) single segment data
acquisition module was used for assessment of PV-loops The system operated on a constant
excitation current of 30microA to prevent interaction with the murine cardiac conduction system
determined by hypertonic saline injection and subtracted offline CONDUCT 2000 software
(CDLeycom Zoetermeer The Netherlands) was used for data acquisition and Circlab
software (LUMC Leiden The Netherlands) was used for offline data analysis
Invasive hemodynamic measurements of the murine left ventricle can theoretically be
performed by several ways for To date the most frequently reported method is an open-chest
(OC) approach (8) In brief mice are anaesthetized and the anterior thorax and the neck of the
mouse are shaved The animals are fixed on a warming plate Care is taken to maintain body
temperature constant at 37deg Celsius The neck skin of the mouse is opened by a saggital
incision The trachea is exposed to visually guide the intratracheal cannula (20-Gauge) where
after the cannula is connected to a mouse ventilator Minivent type 845 (Hugo Sachs
Electronics Germany) set at 150 strokes per minute and a tidal volume of 250 microl The
external jugular veins are cannulated with a flame-stretched PE-50 catheter for infusion of
saline and drugs The abdomen is opened subcostally The diaphragm is incised by a
transverse substernal approach leaving the pericardium intact The micromanometer is
calibrated with a mercury manometer by placing the sensor in 37deg Celsius normal saline The
left ventricle is entered through an apical stab with a 25 12 G needle immediately followed
by the Millar conductance-micromanometer The catheter is positioned correctly in the left
ventricle under guidance of the online pressure and volume signals The combination of
pressure and volume signals allows accurate positioning of the catheter in the left ventricle
Ventilation is stopped during data acquisition to avoid influence from ventilation of the lungs
on the pressure and volume signals The acquisition protocol consists of measurements of
Chapter 3 Murine left ventricular pressure-volume loops
11
baseline cardiac function hypertonic saline injection (3x) inferior caval vein occlusions with
and without β-adrenergic stimulation (isoproterenol 1000 pg)
This method is theoretically disadvantageous since collaps of the lungs and
destruction of myocardial integrity are induced through the relatively large surgical trauma
Furthermore in myocardial infarction studies the open-chest approach is hampered by
extensive left ventricular remodeling since the scar tissue is not accessible for the
conductance catheter and fails to provide a stable position
A closed-chest (CC) approach would theoretically circumvent several of these
disadvantages Firstly in a closed-chest the lungs remain untouched Secondly the cardiac
position and myocardial structures remain intact Thirdly surgical trauma and hemodynamic
stress would be reduced to a minimum Finally a closed-chest approach would allow accurate
assessment of left ventricular (LV) hemodynamic behavior in mice which underwent transient
or permanent occlusion of the left anterior descending coronary artery The surgical procedure
is similar to the open-chest approach except for the insertion of the conductance catheter into
the left ventricle In brief mice are anaesthetized and the neck and abdomen are shaved Care
is taken to maintain body temperature and ventilation support is provided as above Venous
catheters are placed after which the right common carotid is prepared for insertion of the
ultraminiature conductance-micromanometer The catheter is calibrated and subsequently
inserted into the left ventricle under guidance of the online pressure signal A transverse
abdominal incision without opening the thorax is performed to expose the inferior caval vein
The acquisition protocol is similar as in the open-chest approach
Chapter 3 Murine left ventricular pressure-volume loops
12
Explanation of the pressure-volume loop
The left ventricular PV loop is a two-dimensional representation of a single cardiac
cycle (figure 5) Beginning at end-diastole when the mitral valve closes the ejection phase
starts with pressure build up without actual volume ejection ie the isovolumic contraction
phase Blood is ejected out of the ventricle into the aorta upon opening of the aortic valve and
subsequently left ventricular volume decreases The end of ejection is defined by aortic valve
closure and followed by myocardial relaxation characterized by pressure decrease without
volume change ie the isovolumic relaxation phase The filling phase is initiated with
opening of the mitral valve and rise of ventricular volume The technique of simultaneous left
ventricular pressure and volume measurements provides continuous assessment of cardiac
function
Fig 5 The cardiac cycle in a single pressure-volume loop End-diastole is marked by the
closure of the mitral valves The hearts starts to build up pressure while all valves are closed
(isovolumetric contraction phase) before actual ejection begins following the opening of the
aortic valve Volume decreases while ejection progresses until the aortic valves close (end-
Closure aortic valve
VOLUME
PRES
SUR
E
Figure 5
Opening aortic valve
Isovolumicrelaxation
Isovolumiccontraction
Closure mitral valve
Openingmitral valve
Chapter 3 Murine left ventricular pressure-volume loops
13
systole) and relaxation starts Aortic and mitral valves are closed during relaxation
(isovolumic relaxation phase) The filling phase follows upon the opening of the mitral valve
and volume increase while pressure build up is minor
PV loops reveal in first instance the standard functional parameters (figure 6)
Fig 6 Cardiac performance parameters in the pressure-volume loop ED indicates end-
diastole ES end-systole Ved end-diastolic volume Ves end-systolic volume Ped end-
diastolic pressure Pes end-systolic pressure The area of the PV loop resembles stroke work
(SW) Stroke volume SV can be derived by subtracting Ves from Ved
However specific PV relationships are acquired too (table 2 figure 7) These
relationships describe the contractile and relaxative capabilities of the heart independent of
preload afterload or heart rate Transient occlusion of the inferior caval vein in mice is
performed to obtain these relationships Caval vein occlusion leads to a decrease in venous
return and thereby in preload of the left ventricle The response of the heart is typical as
Figure 6
VOLUME
PRES
SURE
ES
ED
Pes
Ved Ves
Ped
SV
SW
Chapter 3 Murine left ventricular pressure-volume loops
14
presented in figure 7 and shows the PV correlations Contractile parameters derived from PV-
correlations best detect small alterations in contractility in mice (15)
Fig 7 Pressure-volume relationships Variably loaded PV loops are used to define several PV
relationships The variable loading is derived by occluding the inferior caval vein and thereby
reducing venous return The end-systolic PV relationship (ESPVR) describes the contractile
performance of the left ventricle Contractility is linear correlated with the steepness of the
ESPVR slope ie Ees The end-diastolic PV relationship (EDPVR) describes diastolic
performance for instance diastolic distensibility The slope of the EDPVR (β) indicates the
passive chamber stiffness
The end-systolic PV relationship (ESPVR) describes the relation between volume and
pressure changes in systole Within the physiological range this relationship approximates a
straight line The relationship can be described in terms of its slope which reflects myocardial
contractility and its volume axis intercept V0 The volume intercept from the ESPVR line
Figure 7
PRES
SURE ESPVR
VOLUME
EesEes
EDPVRβ
V75
Chapter 3 Murine left ventricular pressure-volume loops
15
could better be taken at a constant pressure level in the physiological range for example
between 50 and 100 mm Hg (16) The volume intercept at a constant pressure (eg V75)
reflects myocardial contractility as it indicates the extent of contraction Increased myocardial
contractility for instance during beta-adrenergic stimulation with isoprenaline results in a
steeper ESPVR-slope and a leftward shift on the volume axis while attenuated contractility
for example during clinical heart failure results in a concomitantly plain slope and a
rightward shift on the volume axis The slope of the ESPVR (Ees) is used to describe the left
ventricular elastance Arterial elastance (Ea) a measure for ventricular afterload is described
by the slope of the relationship between stroke volume and end-systolic pressure (figure 8)
Fig 8 Arterial-ventricular coupling Ventricular elastance is estimated from the end-
systolic PV relationship (ESPVR) slope Ees Arterial elastance (Ea) is approximated by the
stroke volumeend-systolic pressure ratio (Ao Pes-SV relationship) The between Ea and Ees
reflects the coupling between the left ventricle and the arterial circulation The production of
stroke work is maximal when the Ea and Ees are approximately equal
Figure 8
Ea Ees
VOLUME
PRES
SURE
PRESSURE
PV-relat
ion Ao PES ndash SV relation
Chapter 3 Murine left ventricular pressure-volume loops
16
The production of stroke work is maximal when the Ees and Ea are approximately
equal Stroke work attenuates substantially in relation to its maximal value whenever Ea and
Ees differ markedly (1718) The preload-recruitable stroke work (PRSW) is the relationship
between end-diastolic volume and performed stroke work by the ventricle It is a load-
independent measure of contractility related to preload The contractile state of the heart is
resembled by the steepness of the PRSW-slope In a high contractile state the heart is able to
perform more stroke work at a constant end-diastolic volume for instance by augmenting the
ejection fraction
Diastolic function is derived from the end-diastolic PV relationship (EDPVR) which
correlates with the compliance of the ventricular myocardium Diastolic dysfunctioning or
failure is observed by an inappropriate upward shift of the ESPVR The slope of the EDPVR
(β) increases during augmented stiffness of the ventricular wall when pressure rises
progressively more during ventricular filling The opposite occurs in case of increased
compliance Certain cardiac diseases and remodeling processes are correlated with increased
stiffness of the ventricular wall by collagen deposition resulting in an increase of the
EDPVR-slope (19)
Numerous other relationships can be assessed The limits are determined by the
interests and the creativity of the investigator
Chapter 3 Murine left ventricular pressure-volume loops
17
Results of PV-measurements with the open- (OC) and closed-chest (CC) approach
A comparative study was performed to determine scientifically based arguments for
the choice between open- (OC) or closed-chest (CC) PV measurements to examine murine
cardiac function Comparing cardiac performance between OC and CC protocols revealed
overall relatively similar values for the investigated parameters (table 3) The values for LV
volumes were corrected for ρ determined at 124 Ωcm in the used setup (N = 10 12352 plusmn
088 Ωcm) α (N = 13 030) and Vc Vc was determined during all PV experiments by the
hypertonic saline injection method No significant differences could be detected between CC
and OC instrumentation (9469 plusmn 483 microl versus 9272 plusmn 205 microl respectively NS) The 4 microl
30 saline demonstrated to be sufficient to change blood conductivity Moreover as this
volume encompasses only 15 of the normal murine end-diastolic volume it proved to be too
small to influence LV end-diastolic and end-systolic pressures (figure 4) in either OC or CC
mice
Several differences were found between the OC and CC approaches (table 3) Cardiac
function in the OC approach was characterized by higher ejection fractions (EF 69 versus
48 respectively) larger stroke volume (1998 versus 1470 microl respectively) and a leftward
shift in ventricular volume On the contrary measuring cardiac function with an intact thorax
resulted in higher end-systolic pressures (ESP OC 52 versus CC 65 mmHg with urethane
anesthesia) and a higher rate of relaxation as indicated by the dPdtmin No differences were
found in the PV relationships ie the ESPVR EDPVR or PRSW Interestingly the OC
approach did result in a mismatch between arterial afterload and ventricular work The
arterial-ventricular elastance ratio (EaEes) was significantly depressed following opening of
the chest In contrast EaEes ratios were normal (ie ~ 10) in the CC approach under both
regimens This finding is consistently found in open-chest instrumented mice (8) The arterial-
ventricular coupling mismatch was depending on arterial resistance the slope of the ESPVR
Chapter 3 Murine left ventricular pressure-volume loops
18
Table 1 Comparison of volume derived by ultrasonography and conductance
Descriptive statistics of alphaN Min Max Mean SEM
EDV 13 018 045 030 002ESV 13 016 094 051 007SV 13 009 058 026 004
Regression analysis
N
RR2
Adjusted R2
SEE
EDV13
082068065179
ESV13
083069066172
SV13
041017009117
Chapter 3 Murine left ventricular pressure-volume loops
19
Left ventricular volume was measured by both ultrasonography
and conductance in adult C57Bl6 mice End-diastolic end-
systolic and stroke volume were used to obtain alpha (α)
Descriptive analysis shows that α determination at the end-
diastolic moment results in the most consistent mean α Also
the correlation of LV volume values between ultrasonography
and conductance is high as shown by the regression analysis
SEM indicates standard error of the mean SEE standard error
of the estimate
EDVECHO (microl)120100806040200
EDV C
ON
DUC
TAN
CE (micro
l)
18
16
14
12
10
8
6
SCATTERPLOT OF END-DIASTOLIC VOLUMECONDUCTANCE VS ULTRASONOGRAPHY
EDVECHO (microl)120100806040200
EDV C
ON
DUC
TAN
CE (micro
l)
18
16
14
12
10
8
6
EDVECHO (microl)120100806040200
EDV C
ON
DUC
TAN
CE (micro
l)
18
16
14
12
10
8
6
SCATTERPLOT OF END-DIASTOLIC VOLUMECONDUCTANCE VS ULTRASONOGRAPHY
Chapter 3 Murine left ventricular pressure-volume loops
20
Table 2 Parameters derived by pressure-volume loops
Abbreviations DefinitionsGeneral parameters
CI (CI = CObody wt) CO HR
Card iac indexCard iac outputHeart rate
PressuredPdtmax
dPdtmin
PedPesτ
Maximum derivative of change in systolic pressure in timeMaximum derivative of change in diastolic pressure in timeEnd-diastolic pressureEnd-systolic pressureTime constant of isovolumic relaxation
VolumeEFSI (SI = SVbody wt)SVVedVes
Ejection fractionStroke index Stroke volumeEnd-diastolic pressureEnd-systolic pressure
Pressure-volume relationshipsβEa (Ea = PesSV)EDPVREes
Slope of the end-diastolic pressure-volume relat ionshipArterial elastanceEnd-diastolic pressure-volume relat ionshipEnd-systolic ventricular elastance
EmaxESPVR
(slope of the end-systolic pressure-volume relationship)Maximum chamber elasticity (∆P∆V)End-systolic pressure-volume relat ionship
Pressure-volume areaEfficiencyEWPEPRSWPVASWSWI (SWI = SWbody wt)
EWPVAExternal work = SWPotential energyPreload-recruitable stroke workPressure-volume area = EW + PEStroke workStroke work index
Abbreviations DefinitionsGeneral parameters
CI (CI = CObody wt) CO HR
Card iac indexCard iac outputHeart rate
PressuredPdtmax
dPdtmin
PedPesτ
Maximum derivative of change in systolic pressure in timeMaximum derivative of change in diastolic pressure in timeEnd-diastolic pressureEnd-systolic pressureTime constant of isovolumic relaxation
VolumeEFSI (SI = SVbody wt)SVVedVes
Ejection fractionStroke index Stroke volumeEnd-diastolic pressureEnd-systolic pressure
Pressure-volume relationshipsβEa (Ea = PesSV)EDPVREes
Slope of the end-diastolic pressure-volume relat ionshipArterial elastanceEnd-diastolic pressure-volume relat ionshipEnd-systolic ventricular elastance
EmaxESPVR
(slope of the end-systolic pressure-volume relationship)Maximum chamber elasticity (∆P∆V)End-systolic pressure-volume relat ionship
Pressure-volume areaEfficiencyEWPEPRSWPVASWSWI (SWI = SWbody wt)
EWPVAExternal work = SWPotential energyPreload-recruitable stroke workPressure-volume area = EW + PEStroke workStroke work index
EmaxESPVR
(slope of the end-systolic pressure-volume (slope of the end-systolic pressure-volume relationship)Maximum chamber elasticity (∆P∆V)End-systolic pressure-volume relat ionship
Pressure-volume areaEfficiencyEWPEPRSWPVASWSWI (SWI = SWbody wt)
EWPVAExternal work = SWPotential energyPreload-recruitable stroke workPressure-volume area = EW + PEStroke workStroke work index
Chapter 3 Murine left ventricular pressure-volume loops
21
(Ees) proved to be equal in OC and CC instrumented mice The combination of enlarged
stroke volume with attenuated systolic pressures leads to a decrease in arterial elastance The
altered arterial elastance could be explained by the opening of the thorax A drop in overall
peripheral vascular resistance from baseline values has been described during thoracoscopy
(20)
Urethane
Volume (microl)
Pres
sure
(mm
Hg)
Pentobarbital
Volume (microl)
Pres
sure
(mm
Hg)
A
B
CCOCCCCCOCOC
CCOCCCCCOCOC
-100
102030405060708090
-10
0
10
20
30
40
50
60
0 5 10 15 20 25 30 35 400 5 10 15 20 25 30 35 40
0 5 10 15 20 25 30 35 400 5 10 15 20 25 30 35 40
Figure 9
Chapter 3 Murine left ventricular pressure-volume loops
22
Fig 9 Left ventricular pressure-volume loops Pressure presented in mmHg and volume microl
A Representative figure of PV loops acquired during urethane anesthesia in closed chest
(CC) and open chest (OC) instrumented mice B Representative figure of PV loops acquired
during pentobarbital anesthesia in CC and OC instrumented mice Loops are acquired during
an occlusion of the inferior caval vein Venous returns decreases which is represented in the
loops by attenuation of both pressure and volume The differences in ESP SW and ESPVR
between urethane and pentobarbital anesthesia can be observed by analyzing the loops in A
and B The loops show also the larger stroke volume and depressed systolic pressure in OC
instrumented mice
Figure 9 shows representative PV-loops while venous return was attenuated following
inferior caval vein occlusion Typical pressure and volume effects are depicted showing the
absence of apparent differences in PV relationships The mentioned differences in ESP SV
and EF are evident in the presented loops though
ECG recordings were made during both surgical protocols to detect possible heart rate
alterations and arrhythmias Murine left ventricular PV measurements could be distorted by
physiological responses to the catheterization Heart rate alterations could be anticipated
especially in relation to carotid sinus stimulation while cannulating of the carotid artery
However neither bradycardia nor other arrhythmias were observed during either CC or OC
procedures (figure 10) This finding indicates that cannulation of the right common carotid
artery does not alter heart rate by carotid sinus stimulation
Chapter 3 Murine left ventricular pressure-volume loops
23
Table 3 Functional parameters to determine baseline LV functioning in open- and closed-
chest protocols during steady-state measurement
URETHANE PENTOBARBITALOC CC OC CC
N = 5 N = 5 N = 10 N = 10
Mean plusmn SEM Mean plusmn SEM Mean plusmn SEM Mean plusmn SEM
HR 583 plusmn 20 658 plusmn 21 493 plusmn 25 481 plusmn 36SVdagger 1958 plusmn 351 1557 plusmn 254 2018 plusmn 183 1426 plusmn 103CO 12 plusmn 2 10 plusmn 2 10 plusmn 1 7 plusmn 0Vmaxdagger 1761 plusmn 053 2361 plusmn 223 3089 plusmn 289 3883 plusmn 230Vmindagger 215 plusmn 133 679 plusmn 180 1029 plusmn 189 2373 plusmn 199EFdagger 79 plusmn 6 66 plusmn 8 66 plusmn 4 39 plusmn 2
ESPdagger 52 plusmn 4 65 plusmn 5 42 plusmn 3 47 plusmn 4EDP 1 plusmn 1 -1 plusmn 1 -6 plusmn 2 1 plusmn 1
dPdtmax 7200 plusmn 1349 8252 plusmn 1685 4004 plusmn 629 3718 plusmn 684dPdtmindagger -4233 plusmn 531 -7577 plusmn 750 -3631 plusmn 424 -3348 plusmn 653Tau 10 plusmn 0 7 plusmn 0 12 plusmn 1 14 plusmn 2
SW 1066 plusmn 245 1147 plusmn 213 1076 plusmn 176 666 plusmn 116
EaEesdagger 065 plusmn 020 084 plusmn 016 060 plusmn 005 103 plusmn 015ESPVR 570 plusmn 094 589 plusmn 074 347 plusmn 027 318 plusmn 052EDPVR 009 plusmn 009 -008 plusmn 015 -015 plusmn 014 -005 plusmn 015PRSW 79 plusmn 14 64 plusmn 6 68 plusmn 10 53 plusmn 3
Results from LV pressure-volume measurements in C57Bl6 mice anesthetized by urethane or
pentobarbital Urethane versus pentobarbital P lt 005 dagger OC versus CC P lt 005 ρ Valued
124 Ωcm α 030 Open- (OC) and closed-chest (CC) protocols HR indicates heart rate in
bpm SV left ventricular stroke volume in microl CO cardiac output mlmin Vmin minimal left
ventricular volume in microl Vmax maximal left ventricular volume in microl EF ejection fraction in
ESP left ventricular end-systolic pressure in mmHg EDP left ventricular end-diastolic
pressure in mmHg dPdtmax maximal first derivative of left ventricular pressure in mmHgs
dPdtmin minimal first derivative of left ventricular pressure in mmHgs Tau time constant of
left ventricular relaxation in ms SW stroke work in mmHgmicrol Ea arterial elastance Ees
ventricular end-systolic elastance ESPVR left ventricular end-systolic PV relationship in
Chapter 3 Murine left ventricular pressure-volume loops
24
mmHgmicrol EDPVR left ventricular end-diastolic PV relationship in mmHgmicrol PRSW left
ventricular preload-recruitable stroke work in mmHg
The steady-state functional parameters from OC and CC instrumented mice during
either urethane or pentobarbital are also depicted in Table 2 The use of pentobarbital
anesthesia had a cardiodepressive effect that was represented by significant function decline
in most parameters EF dPdtMAX and ESPVR decreased respectively with 24 57 and 41
upon pentobarbital use compared to urethane anesthesia Pentobarbital therefore had strong
negative chronotropic and inotropic effects
Hear
trat
e(b
pm)
Heart rate trace in closed-chest animal
0
100
200
300
400
500
600
700
Time (minutes)
arterial canulation
A
0 1 2 3 4 5 6 7 8 9 10 11 12 13 14 15 16
Heart rate trace in open-chest animal
0
100
200
300
400
500
600
700
Time (minutes)
Hear
trat
e(b
pm)
Ventricular catheterisation
B
0 1 2 3 4 5 6 7 8 9 10 11 12 13 14
Figure 10
Chapter 3 Murine left ventricular pressure-volume loops
25
Fig 10 Heart rate tracings in closed chest and open chest instrumented mice
A Representative figure of a heart rate tracing in a closed-chest instrumented mouse The
moment of arterial cannulation is indicated Some arrhythmias are seen in response to
introduction of the catheter into the left ventricle Arrhythmias are only present in a short
time-period that is part of the stabilization period following catheter introduction Heart rate
remains unchanged during the measurements B Representative figure of a heart rate tracing
in an open-chest instrumented mouse Somewhat more pronounced chronotropic arrhythmias
are seen in response to ventricular introduction of the catheter by apical stab However no
significant brady- or tachycardias are present during the measurements
Chapter 3 Murine left ventricular pressure-volume loops
26
Discussion
In this chapter OC and CC protocols for in vivo left ventricular PV relationship
measurement are described and discussed Murine cardiac function determination via these
methods is sensitive reproducible and comparable The choice for open- or closed-chest PV
measurements in mice depends on the aim of the study with regards to the specific cardiac
pathology The OC approach is technically less complicated and less time consuming Main
characteristics of the OC model itself are low systolic pressures and arterial resistance The
OC approach could best be used in studies where myocardial integrity is not at stake
Particularly ischemiareperfusion studies regarding myocardial integrity are probably better
done using the CC approach
Assessment of cardiac performance in genetically engineered mice is indispensable to
understand human cardiovascular pathologies In general the synergistic features of cardiac
diseases such as hypertrophy and cell death affect cardiac function negatively The
contractile performance of the heart deteriorates which is reflected in the attenuation of
systolic parameters as ejection fraction stroke work and PV-relationships Furthermore
ventricular relaxation prolongs and diastolic filling becomes impaired The progression of
cardiac disease ultimately results in clinical heart failure which is defined by the inability of
the heart to meet hemodynamic demands of the body and is characterized by specific signs
and symptoms (21) The most important parameter of cardiac performance which defines
heart failure is cardiac output
The influence on cardiac performance of specific genes and proteins in the
development of cardiac diseases ought to be investigated extensively to assess their clinical
relevance Various techniques have been used to assess cardiac performance in mice The
main techniques will be discussed in brief
Chapter 3 Murine left ventricular pressure-volume loops
27
Echocardiography is the most widely used noninvasive technique to determine cardiac
performance in mice High-frequency transthoracic and transesophageal transducers are used
as effective tools for two-dimensional and Doppler imaging of ventricular wall structures
dimensions and volumes of cavum and cardiac function (2223) Full-conscious or gas-
anesthesia experiments are preferred for echocardiographic assessment of cardiac function in
mice (2425) There is no limit to the diversity of murine models investigated by this general
accepted method of cardiac performance assessment However the most questionable aspect
of these measurements is the significant inter- and intraobservator variance in the
measurements
Isolated working mouse heart measurements in a Langendorf perfusion setup are a
technique for ex vivo cardiac function measurements approximating the in vivo function level
(5) Cardiac output developed left ventricular pressure and first derivates of maximal and
minimal pressures are some of the parameters that can be derived Isolated working heart
measurements are especially useful to study the acute effects of ischemic preconditioning and
ischemia-induced apoptosis(2627) Metabolites of interest can be measured accurately in the
perfusion fluid Disadvantages are the impossibility of chronic studies and the
unphysiological situation of ex vivo cardiac function measurements
Aortic flow measurements by means of a flow-probe have been used in several
studies (2829) Aortic flow acquisition is a validated technique and reveals functional
parameters as cardiac output stroke volume and blood flow velocity However several
disadvantages oppose against this technique Firstly aortic flow measurements are invasive
(ie thoracotomy or laparotomy) and result solely in aortic derived volume parameters
Integrated ventricular function cannot be assessed More importantly the exact localization of
the flow probe around the aorta is the critical determinant of the systematic error made by
these measurements Flow probes have been placed around the ascending and descending
Chapter 3 Murine left ventricular pressure-volume loops
28
thoracic aorta and the abdominal aorta The percentage of total cardiac output passing the
flow probe on the specific location has to be estimated Flow probes located at the ascending
aorta correct for coronary circulation and for instance bloodvolume passing the descending
thoracic aorta has been estimated to be around 75 of total cardiac output (30) The estimated
correction factor provides lsquoabsolutersquo stroke volume instead of absolute LV cavum volumes
and does not correct for cardiophysiological changes Altered cardiophysiological situations
could theoretically influence the relative amount of bloodvolume passing the flow probe On
the other hand major advances are the possibility of chronic cardiac function measurements
and the relative facile manner of data acquirement(29) Moreover aortic flow probe
measurements are not hampered by deleterious cardiac remodeling in myocardial ischemia or
hypertrophy studies(2829)
The newly developed method of cardiac performance assessment by in vivo left
ventricular PV measurements in the CC model is introduced here Left ventricular PV
measurements in vivo provide an accurate assessment of murine cardiac function The method
is highly sensitive during open- and closed-chest approaches in determining alterations in left
ventricular function as result of cardiac disease or altered hemodynamic stress The
characteristics of simultaneous left ventricular pressure and volume measurements enable the
researcher to directly investigate pressure-related cardiac diseases as cardiac hypertrophy and
restrictive cardiomyopathy (31) or volume-related diseases as dilated cardiomyopathy (32)
Moreover the effective influence of both aspects of cardiac disease on each other can be
observed in detail For instance ventricular dilation and subsequent decrease in ventricular
systolic pressure is mapped accurately in PV-loops Continuous measurements provide
possibilities to investigate the complete cardiac cycle Basic aspects of cardiac physiology can
be visualized using PV-loops in mice (81533-35) For instance increase in ventricular filling
is followed by an increase in ejection fraction according to the Frank-Starling mechanism
Chapter 3 Murine left ventricular pressure-volume loops
29
The opposite is seen as a result of gradual venous return decrease in the case of transient caval
vein occlusion (figure 7 amp 9) Moreover the distinction between systolic and diastolic failure
can be made through continuous PV-measurements (19) Systolic heart failure encompasses
mainly an ejection dysfunction with impaired contractility Both aspects are obtained by and
directly visualized through PV-loops Additionally the definite diagnosis of diastolic failure
is dependent on the observation of an inappropriate upward shift of the (end-)diastolic PV
relationship requiring cardiac catheterization for continuous volume determinations using
impedance measurements and high-fidelity measurements of ventricular pressure with a
micromanometer (19) PV-loops are useful determining cardiac performance within the
complete continuum of healthy and diseased hearts
Chapter 3 Murine left ventricular pressure-volume loops
30
Conclusion
In vivo PV measurements provide an essential tool in the assessment of cardiac
function in genetically modified mice Open- and closed-chest surgical protocols for murine
cardiac function determination are sensitive reproducible and comparable PV-loops enable
the researcher to accurately investigate diverse murine models of cardiac pathology by
adequately visualizing the cause-and-effect relationship between genetic modification and
their functional outcome Changes in ventricular contractility are best detected by PV derived
parameters in comparison to other methods of cardiac function determination
Chapter 3 Murine left ventricular pressure-volume loops
31
References
1 Doevendans PA Daemen MJ de Muinck ED Smits JF Cardiovascular phenotypingin mice Cardiovasc Res 19983934-49
2 Hoit BD New approaches to phenotypic analysis in adult mice J Mol Cell Cardiol20013327-35
3 Chacko VP Aresta F Chacko SM Weiss RG MRIMRS assessment of in vivomurine cardiac metabolism morphology and function at physiological heart rates AmJ Physiol Heart Circ Physiol 2000279H2218-24
4 Tanaka N Dalton N Mao L et al Transthoracic echocardiography in models ofcardiac disease in the mouse Circulation 1996941109-17
5 De Windt LJ Willems J Reneman RS Van der Vusse GJ Arts T Van Bilsen M Animproved isolated left ventricular ejecting murine heart model Functional andmetabolic evaluation Pflugers Arch 1999437182-90
6 Palmen M Daemen MJ Buehler A et al Impaired cardiac remodeling and functionafter myocardial infarction in FGF-1 transgenic mice Circulation 1999100250
7 Rockman HA Hamilton RA Jones LR Milano CA Mao L Lefkowitz RJ Enhancedmyocardial relaxation in vivo in transgenic mice overexpressing the beta2-adrenergicreceptor is associated with reduced phospholamban protein J Clin Invest1996971618-23
8 Georgakopoulos D Mitzner WA Chen CH et al In vivo murine left ventricularpressure-volume relations by miniaturized conductance micromanometry Am JPhysiol 1998274H1416-22
9 Dekker AL Geskes GG Cramers AA et al Right ventricular support for off-pumpcoronary artery bypass grafting studied with bi-ventricular pressure-volume loops insheep Eur J Cardiothorac Surg 200119179-84
10 Schreuder JJ Steendijk P van der Veen FH et al Acute and short-term effects ofpartial left ventriculectomy in dilated cardiomyopathy assessment by pressure-volumeloops J Am Coll Cardiol 2000362104-14
11 Zimmer HG Measurement of left ventricular hemodynamic parameters in closed-chest rats under control and various pathophysiologic conditions Basic Res Cardiol19837877-84
12 Georgakopoulos D Kass DA Estimation of parallel conductance by dual-frequencyconductance catheter in mice Am J Physiol Heart Circ Physiol 2000279H443-50
13 Feldman MD Mao Y Valvano JW Pearce JA Freeman GL Development of amultifrequency conductance catheter-based system to determine LV function in miceAm J Physiol Heart Circ Physiol 2000279H1411-20
14 Kornet L Schreuder JJ Van de Velden ET Jansen JR The volume-dependency ofparallel conductance throughout the cardiac cycle and its consequence for volumeestimation of the left ventricle in patients Cardiovasc Res 200151729-35
15 Nemoto S DeFreitas G Mann DL Carabello BA Effects of changes in leftventricular contractility on indexes of contractility in mice Am J Physiol Heart CircPhysiol 2002283H2504-10
16 Baan J Van de Velden ET Steendijk P Ventricular pressure-volume relations in vivoEur Heart J 199213 SupplE2-6
17 Little WC Cheng CP Left ventricular-arterial coupling in conscious dogs Am JPhysiol 1991261H70-6
18 Sunagawa K Maughan WL Sagawa K Optimal arterial resistance for the maximalstroke work studied in isolated canine left ventricle Circ Res 198556586-95
Chapter 3 Murine left ventricular pressure-volume loops
32
19 Van Kraaij D Van Pol P Ruiters AW et al Diagnosing diastolic heart failure Eur JHeart Fail 20024419-30
20 Faunt KK Cohn LA Jones BD Dodam JR Cardiopulmonary effects of bilateralhemithorax ventilation and diagnostic thoracoscopy in dogs Am J Vet Res1998591494-8
21 Lips DJ Van Kraaij DL De Windt LJ Doevendans PA Molecular determinants ofmyocardial hypertrophy and failure alternative pathways for beneficial andmaladaptive hypertrophy Eur Heart J 200324883-96
22 Collins KA Korcarz CE Lang RM Use of echocardiography for the phenotypicassessment of genetically altered mice Physiol Genomics 200313227-39
23 Scherrer-Crosbie M Steudel W Hunziker PR et al Determination of right ventricularstructure and function in normoxic and hypoxic mice a transesophagealechocardiographic study Circulation 1998981015-21
24 Takuma S Suehiro K Cardinale C et al Anesthetic inhibition in ischemic andnonischemic murine heart comparison with conscious echocardiographic approachAm J Physiol Heart Circ Physiol 2001280H2364-70
25 Chaves AA Weinstein DM Bauer JA Non-invasive echocardiographic studies inmice influence of anesthetic regimen Life Sci 200169213-22
26 Yamaura G Turoczi T Yamamoto F Siddqui MA Maulik N Das DK STATsignaling in ischemic heart a role of STAT5A in ischemic preconditioning Am JPhysiol Heart Circ Physiol 2003285H476-82
27 Bell RM Yellon DM Atorvastatin administered at the onset of reperfusion andindependent of lipid lowering protects the myocardium by up-regulating a pro-survival pathway J Am Coll Cardiol 200341508-15
28 Aartsen WM Schuijt MP Danser AH Daemen MJ Smits JF The role of locallyexpressed angiotensin converting enzyme in cardiac remodeling after myocardialinfarction in mice Cardiovasc Res 200256205-13
29 Janssen B Debets J Leenders P Smits J Chronic measurement of cardiac output inconscious mice Am J Physiol Regul Integr Comp Physiol 2002282R928-35
30 Georgakopoulos D Christe ME Giewat M Seidman CM Seidman JG Kass DA Thepathogenesis of familial hypertrophic cardiomyopathy early and evolving effects froman alpha-cardiac myosin heavy chain missense mutation Nat Med 19995327-30
31 Liao P Georgakopoulos D Kovacs A et al The in vivo role of p38 MAP kinases incardiac remodeling and restrictive cardiomyopathy Proc Natl Acad Sci U S A20019812283-8
32 McConnell BK Jones KA Fatkin D et al Dilated cardiomyopathy in homozygousmyosin-binding protein-C mutant mice J Clin Invest 19991041235-44
33 Georgakopoulos D Kass DA Minimal force-frequency modulation of inotropy andrelaxation of in situ murine heart J Physiol 2001534535-45
34 Yang B Larson DF Watson R Age-related left ventricular function in the mouseanalysis based on in vivo pressure-volume relationships Am J Physiol1999277H1906-13
35 Reyes M Freeman GL Escobedo D Lee S Steinhelper ME Feldman MDEnhancement of contractility with sustained afterload in the intact murine heartblunting of length-dependent activation Circulation 20031072962-8
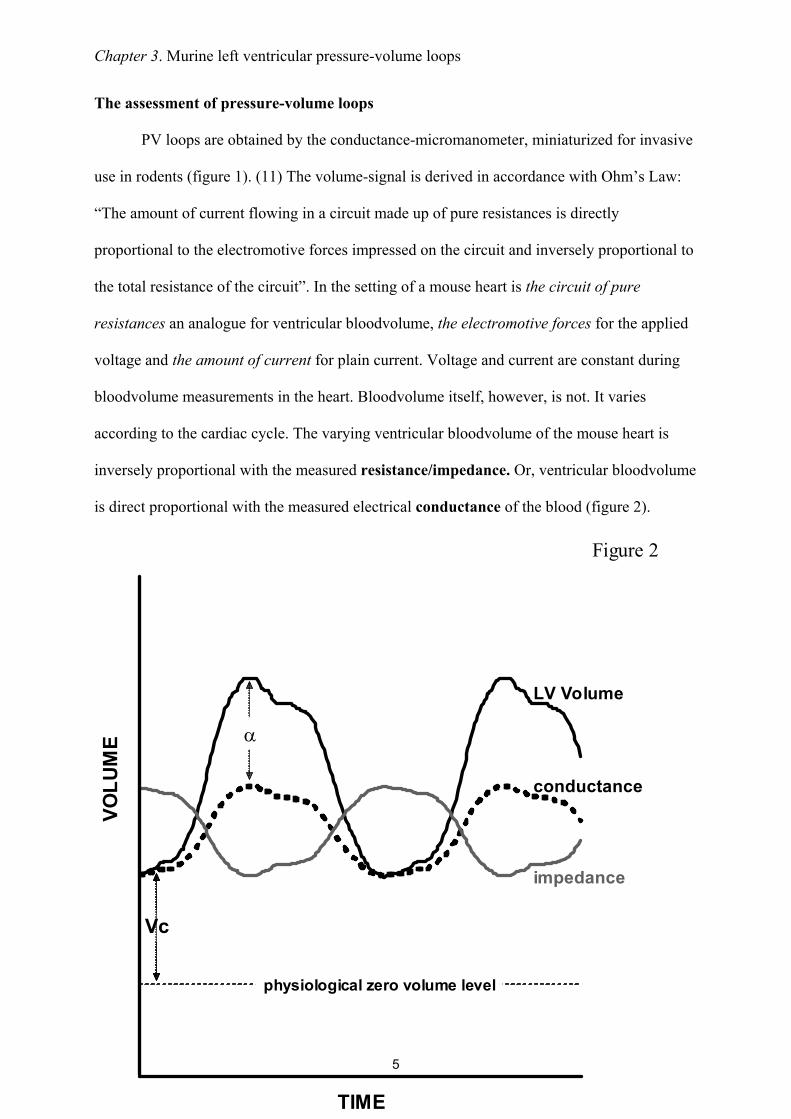
Chapter 3 Murine left ventricular pressure-volume loops
5
The assessment of pressure-volume loops
PV loops are obtained by the conductance-micromanometer miniaturized for invasive
use in rodents (figure 1) (11) The volume-signal is derived in accordance with Ohmrsquos Law
ldquoThe amount of current flowing in a circuit made up of pure resistances is directly
proportional to the electromotive forces impressed on the circuit and inversely proportional to
the total resistance of the circuitrdquo In the setting of a mouse heart is the circuit of pure
resistances an analogue for ventricular bloodvolume the electromotive forces for the applied
voltage and the amount of current for plain current Voltage and current are constant during
bloodvolume measurements in the heart Bloodvolume itself however is not It varies
according to the cardiac cycle The varying ventricular bloodvolume of the mouse heart is
inversely proportional with the measured resistanceimpedance Or ventricular bloodvolume
is direct proportional with the measured electrical conductance of the blood (figure 2)
VOLU
ME
LV Volume
conductance
impedance
TIME
α
VcVc
physiological zero volume level
Figure 2
Chapter 3 Murine left ventricular pressure-volume loops
6
Fig 2 The concept of conductance derived left ventricular volume Left ventricular
bloodvolume is linear proportional with the time-varying conductance signal which correlates
with the level of resistanceimpedance of the bloodvolume on the electric current produced by
the catheter The conductance-catheter underestimates the volume-signal due to inhomogenity
of the electrical field The slope factor α corrects for this underestimation The offset volume
that arises from the protrusion of the electrical current in tissues besides blood (parallel
conductance) is corrected by the correction volume Vc
The conductance catheter is equipped with four electrodes (figure 3) two current
electrodes and two sensor electrodes The current electrodes produce an electric field with a
magnitude of 30 microA
Fig 3 Position of the conductance catheter in the left ventricle The catheter is retrogradely
inserted in the left ventricle The catheter consists of one pressure sensor and four volume
Figure 3
PS
SE
SE
CE
CE
49 mm45 mm
Chapter 3 Murine left ventricular pressure-volume loops
7
electrodes two current electrodes and two sensor electrodes The height of the measured
volume segment depends on the distance between the sensing electrodes ie 45 mm The
mean length of the longitudinal axis of the heart from adult mice is approximately 49 mm
CE indicates current electrode SE sensing electrode and PS pressure sensor
This specific current is chosen to prevent interaction with the murine endogenous
conduction system of the heart The catheter measures conductance which is translated into
left ventricular volume by a software program Cycle-varying conductance correlates with
time-varying ventricular volume V(t) according to the following formula
V(t) = ρ L2 [G(t) ndash Gp]
where ρ (rho) is the mouse specific blood resistivity L indicates the distance between the
sensor electrodes (ie 45 mm) G(t) the instantaneous conductance and Gp parallel
conductance The mouse specific blood resistance is determined using a Rho-cuvette with a
length of 05 cm and a diameter of 02 cm resulting in a content of 150 microl Gp is the offset in
the volume signal that originates from an additional conductance signal Shortly an electric
field broadens theoretically without end and protrudes through the ventricular wall into other
intrathoracic structures and organs Therefore the ventricular-derived conductance signal
originates partly from lungs mediastinum and most notably from the left ventricular
myocardium All have a relative contribution to the addition in ventricular-derived
conductance signal This offset-volume is referred to as the correction volume Vc (figure 2)
Several methods are used to acquire Gp and subsequent Vc One method calculates Gp from
the differences between myocardial and blood conductances at catheter excitation frequencies
of 2 and 10 kHz (12) The second method estimates Gp by exploiting the differential
frequency-induced conductivity of myocardium and blood (13) In our experiments we used
the hypertonic saline injection (HSI) method The method comprises of the infusion of 4 microl
Chapter 3 Murine left ventricular pressure-volume loops
8
hypertonic (30 NaCl) saline solution into the external jugular vein (~ 15 of left ventricular
absolute end-diastolic volume) The saline mixes with the murine blood and increases
conductance of blood through its high content of electrolytes The result is a volume increase
as shown by figure 4 a representative figure of a common HSI procedure The amount of
saline infusion is limited to 4 microl to prevent hemodynamic changes due to the fluid injection
As shown in figure 4 there is no influence on pressure The correction volume Vc is derived
via computerized algorithms
Fig 4 Conductance and pressure signals during hypertonic saline injection The total
acquired time period was 584 seconds Ventilation was stopped at the mark () after which 4
microL of 30 saline was injected (arrow) into the external jugular vein The conductivity of
blood was increased by the hypertonic saline infusion as demonstrated by the increase in the
conductance signal Parallel conductance is calculated by analyzing the conductance signal
Volu
me
(RVU
) Volume signal
30
35
40
45
50
Pressure signal
-200
20406080
100
Time (s)
Pres
sure
(mm
Hg)
Volu
me
(RVU
) Volume signal
30
35
40
45
50
30
35
40
45
50
Pressure signal
-200
20406080
100
-200
20406080
020406080
100
Time (s)
Pres
sure
(mm
Hg)
Figure 4
Chapter 3 Murine left ventricular pressure-volume loops
9
obtained during wash-in of the saline The unchanged pressure indicates that hemodynamics
are stable
In practice the conductance-catheter tends to constantly underestimate the left
ventricular bloodvolume The slope factor α should be calculated to correct for this
discrepancy (figure 2) For this purpose an independent volume measurement is needed
obtained in mice by blood flow measurements or echocardiography The slope factor α then
follows from the ratio conductance volumeindependent measured volume Table 1 shows the
results of α determination by echocardiography Slope factor α varied from 03 - 05
depending on the moment of measurement within the cardiac cycle The variance could be
due to the relative inaccuracy of ultrasonographic analyses It could also be inherent to
conductance measurements in the manner as performed Slope factor α deviates from 1
primarily due to the dependency of Gp on left ventricular volume (14) Gp should therefore be
measured continuously within the cardiac cycle to be able to correct adequately for the
variance of α However as the result of technical limitations continuous Gp acquisition is not
yet possible Whenever echocardiography is used end-diastolic volume EDV should be used
for α determination The variance of this calculated α is minor (SEM = 002) and the
correlation relatively high (adjusted R2 = 065)
Chapter 3 Murine left ventricular pressure-volume loops
10
Surgical protocols for PV-loops acquisition
The Sigma SA (CDLeycom Zoetermeer the Netherlands) single segment data
acquisition module was used for assessment of PV-loops The system operated on a constant
excitation current of 30microA to prevent interaction with the murine cardiac conduction system
determined by hypertonic saline injection and subtracted offline CONDUCT 2000 software
(CDLeycom Zoetermeer The Netherlands) was used for data acquisition and Circlab
software (LUMC Leiden The Netherlands) was used for offline data analysis
Invasive hemodynamic measurements of the murine left ventricle can theoretically be
performed by several ways for To date the most frequently reported method is an open-chest
(OC) approach (8) In brief mice are anaesthetized and the anterior thorax and the neck of the
mouse are shaved The animals are fixed on a warming plate Care is taken to maintain body
temperature constant at 37deg Celsius The neck skin of the mouse is opened by a saggital
incision The trachea is exposed to visually guide the intratracheal cannula (20-Gauge) where
after the cannula is connected to a mouse ventilator Minivent type 845 (Hugo Sachs
Electronics Germany) set at 150 strokes per minute and a tidal volume of 250 microl The
external jugular veins are cannulated with a flame-stretched PE-50 catheter for infusion of
saline and drugs The abdomen is opened subcostally The diaphragm is incised by a
transverse substernal approach leaving the pericardium intact The micromanometer is
calibrated with a mercury manometer by placing the sensor in 37deg Celsius normal saline The
left ventricle is entered through an apical stab with a 25 12 G needle immediately followed
by the Millar conductance-micromanometer The catheter is positioned correctly in the left
ventricle under guidance of the online pressure and volume signals The combination of
pressure and volume signals allows accurate positioning of the catheter in the left ventricle
Ventilation is stopped during data acquisition to avoid influence from ventilation of the lungs
on the pressure and volume signals The acquisition protocol consists of measurements of
Chapter 3 Murine left ventricular pressure-volume loops
11
baseline cardiac function hypertonic saline injection (3x) inferior caval vein occlusions with
and without β-adrenergic stimulation (isoproterenol 1000 pg)
This method is theoretically disadvantageous since collaps of the lungs and
destruction of myocardial integrity are induced through the relatively large surgical trauma
Furthermore in myocardial infarction studies the open-chest approach is hampered by
extensive left ventricular remodeling since the scar tissue is not accessible for the
conductance catheter and fails to provide a stable position
A closed-chest (CC) approach would theoretically circumvent several of these
disadvantages Firstly in a closed-chest the lungs remain untouched Secondly the cardiac
position and myocardial structures remain intact Thirdly surgical trauma and hemodynamic
stress would be reduced to a minimum Finally a closed-chest approach would allow accurate
assessment of left ventricular (LV) hemodynamic behavior in mice which underwent transient
or permanent occlusion of the left anterior descending coronary artery The surgical procedure
is similar to the open-chest approach except for the insertion of the conductance catheter into
the left ventricle In brief mice are anaesthetized and the neck and abdomen are shaved Care
is taken to maintain body temperature and ventilation support is provided as above Venous
catheters are placed after which the right common carotid is prepared for insertion of the
ultraminiature conductance-micromanometer The catheter is calibrated and subsequently
inserted into the left ventricle under guidance of the online pressure signal A transverse
abdominal incision without opening the thorax is performed to expose the inferior caval vein
The acquisition protocol is similar as in the open-chest approach
Chapter 3 Murine left ventricular pressure-volume loops
12
Explanation of the pressure-volume loop
The left ventricular PV loop is a two-dimensional representation of a single cardiac
cycle (figure 5) Beginning at end-diastole when the mitral valve closes the ejection phase
starts with pressure build up without actual volume ejection ie the isovolumic contraction
phase Blood is ejected out of the ventricle into the aorta upon opening of the aortic valve and
subsequently left ventricular volume decreases The end of ejection is defined by aortic valve
closure and followed by myocardial relaxation characterized by pressure decrease without
volume change ie the isovolumic relaxation phase The filling phase is initiated with
opening of the mitral valve and rise of ventricular volume The technique of simultaneous left
ventricular pressure and volume measurements provides continuous assessment of cardiac
function
Fig 5 The cardiac cycle in a single pressure-volume loop End-diastole is marked by the
closure of the mitral valves The hearts starts to build up pressure while all valves are closed
(isovolumetric contraction phase) before actual ejection begins following the opening of the
aortic valve Volume decreases while ejection progresses until the aortic valves close (end-
Closure aortic valve
VOLUME
PRES
SUR
E
Figure 5
Opening aortic valve
Isovolumicrelaxation
Isovolumiccontraction
Closure mitral valve
Openingmitral valve
Chapter 3 Murine left ventricular pressure-volume loops
13
systole) and relaxation starts Aortic and mitral valves are closed during relaxation
(isovolumic relaxation phase) The filling phase follows upon the opening of the mitral valve
and volume increase while pressure build up is minor
PV loops reveal in first instance the standard functional parameters (figure 6)
Fig 6 Cardiac performance parameters in the pressure-volume loop ED indicates end-
diastole ES end-systole Ved end-diastolic volume Ves end-systolic volume Ped end-
diastolic pressure Pes end-systolic pressure The area of the PV loop resembles stroke work
(SW) Stroke volume SV can be derived by subtracting Ves from Ved
However specific PV relationships are acquired too (table 2 figure 7) These
relationships describe the contractile and relaxative capabilities of the heart independent of
preload afterload or heart rate Transient occlusion of the inferior caval vein in mice is
performed to obtain these relationships Caval vein occlusion leads to a decrease in venous
return and thereby in preload of the left ventricle The response of the heart is typical as
Figure 6
VOLUME
PRES
SURE
ES
ED
Pes
Ved Ves
Ped
SV
SW
Chapter 3 Murine left ventricular pressure-volume loops
14
presented in figure 7 and shows the PV correlations Contractile parameters derived from PV-
correlations best detect small alterations in contractility in mice (15)
Fig 7 Pressure-volume relationships Variably loaded PV loops are used to define several PV
relationships The variable loading is derived by occluding the inferior caval vein and thereby
reducing venous return The end-systolic PV relationship (ESPVR) describes the contractile
performance of the left ventricle Contractility is linear correlated with the steepness of the
ESPVR slope ie Ees The end-diastolic PV relationship (EDPVR) describes diastolic
performance for instance diastolic distensibility The slope of the EDPVR (β) indicates the
passive chamber stiffness
The end-systolic PV relationship (ESPVR) describes the relation between volume and
pressure changes in systole Within the physiological range this relationship approximates a
straight line The relationship can be described in terms of its slope which reflects myocardial
contractility and its volume axis intercept V0 The volume intercept from the ESPVR line
Figure 7
PRES
SURE ESPVR
VOLUME
EesEes
EDPVRβ
V75
Chapter 3 Murine left ventricular pressure-volume loops
15
could better be taken at a constant pressure level in the physiological range for example
between 50 and 100 mm Hg (16) The volume intercept at a constant pressure (eg V75)
reflects myocardial contractility as it indicates the extent of contraction Increased myocardial
contractility for instance during beta-adrenergic stimulation with isoprenaline results in a
steeper ESPVR-slope and a leftward shift on the volume axis while attenuated contractility
for example during clinical heart failure results in a concomitantly plain slope and a
rightward shift on the volume axis The slope of the ESPVR (Ees) is used to describe the left
ventricular elastance Arterial elastance (Ea) a measure for ventricular afterload is described
by the slope of the relationship between stroke volume and end-systolic pressure (figure 8)
Fig 8 Arterial-ventricular coupling Ventricular elastance is estimated from the end-
systolic PV relationship (ESPVR) slope Ees Arterial elastance (Ea) is approximated by the
stroke volumeend-systolic pressure ratio (Ao Pes-SV relationship) The between Ea and Ees
reflects the coupling between the left ventricle and the arterial circulation The production of
stroke work is maximal when the Ea and Ees are approximately equal
Figure 8
Ea Ees
VOLUME
PRES
SURE
PRESSURE
PV-relat
ion Ao PES ndash SV relation
Chapter 3 Murine left ventricular pressure-volume loops
16
The production of stroke work is maximal when the Ees and Ea are approximately
equal Stroke work attenuates substantially in relation to its maximal value whenever Ea and
Ees differ markedly (1718) The preload-recruitable stroke work (PRSW) is the relationship
between end-diastolic volume and performed stroke work by the ventricle It is a load-
independent measure of contractility related to preload The contractile state of the heart is
resembled by the steepness of the PRSW-slope In a high contractile state the heart is able to
perform more stroke work at a constant end-diastolic volume for instance by augmenting the
ejection fraction
Diastolic function is derived from the end-diastolic PV relationship (EDPVR) which
correlates with the compliance of the ventricular myocardium Diastolic dysfunctioning or
failure is observed by an inappropriate upward shift of the ESPVR The slope of the EDPVR
(β) increases during augmented stiffness of the ventricular wall when pressure rises
progressively more during ventricular filling The opposite occurs in case of increased
compliance Certain cardiac diseases and remodeling processes are correlated with increased
stiffness of the ventricular wall by collagen deposition resulting in an increase of the
EDPVR-slope (19)
Numerous other relationships can be assessed The limits are determined by the
interests and the creativity of the investigator
Chapter 3 Murine left ventricular pressure-volume loops
17
Results of PV-measurements with the open- (OC) and closed-chest (CC) approach
A comparative study was performed to determine scientifically based arguments for
the choice between open- (OC) or closed-chest (CC) PV measurements to examine murine
cardiac function Comparing cardiac performance between OC and CC protocols revealed
overall relatively similar values for the investigated parameters (table 3) The values for LV
volumes were corrected for ρ determined at 124 Ωcm in the used setup (N = 10 12352 plusmn
088 Ωcm) α (N = 13 030) and Vc Vc was determined during all PV experiments by the
hypertonic saline injection method No significant differences could be detected between CC
and OC instrumentation (9469 plusmn 483 microl versus 9272 plusmn 205 microl respectively NS) The 4 microl
30 saline demonstrated to be sufficient to change blood conductivity Moreover as this
volume encompasses only 15 of the normal murine end-diastolic volume it proved to be too
small to influence LV end-diastolic and end-systolic pressures (figure 4) in either OC or CC
mice
Several differences were found between the OC and CC approaches (table 3) Cardiac
function in the OC approach was characterized by higher ejection fractions (EF 69 versus
48 respectively) larger stroke volume (1998 versus 1470 microl respectively) and a leftward
shift in ventricular volume On the contrary measuring cardiac function with an intact thorax
resulted in higher end-systolic pressures (ESP OC 52 versus CC 65 mmHg with urethane
anesthesia) and a higher rate of relaxation as indicated by the dPdtmin No differences were
found in the PV relationships ie the ESPVR EDPVR or PRSW Interestingly the OC
approach did result in a mismatch between arterial afterload and ventricular work The
arterial-ventricular elastance ratio (EaEes) was significantly depressed following opening of
the chest In contrast EaEes ratios were normal (ie ~ 10) in the CC approach under both
regimens This finding is consistently found in open-chest instrumented mice (8) The arterial-
ventricular coupling mismatch was depending on arterial resistance the slope of the ESPVR
Chapter 3 Murine left ventricular pressure-volume loops
18
Table 1 Comparison of volume derived by ultrasonography and conductance
Descriptive statistics of alphaN Min Max Mean SEM
EDV 13 018 045 030 002ESV 13 016 094 051 007SV 13 009 058 026 004
Regression analysis
N
RR2
Adjusted R2
SEE
EDV13
082068065179
ESV13
083069066172
SV13
041017009117
Chapter 3 Murine left ventricular pressure-volume loops
19
Left ventricular volume was measured by both ultrasonography
and conductance in adult C57Bl6 mice End-diastolic end-
systolic and stroke volume were used to obtain alpha (α)
Descriptive analysis shows that α determination at the end-
diastolic moment results in the most consistent mean α Also
the correlation of LV volume values between ultrasonography
and conductance is high as shown by the regression analysis
SEM indicates standard error of the mean SEE standard error
of the estimate
EDVECHO (microl)120100806040200
EDV C
ON
DUC
TAN
CE (micro
l)
18
16
14
12
10
8
6
SCATTERPLOT OF END-DIASTOLIC VOLUMECONDUCTANCE VS ULTRASONOGRAPHY
EDVECHO (microl)120100806040200
EDV C
ON
DUC
TAN
CE (micro
l)
18
16
14
12
10
8
6
EDVECHO (microl)120100806040200
EDV C
ON
DUC
TAN
CE (micro
l)
18
16
14
12
10
8
6
SCATTERPLOT OF END-DIASTOLIC VOLUMECONDUCTANCE VS ULTRASONOGRAPHY
Chapter 3 Murine left ventricular pressure-volume loops
20
Table 2 Parameters derived by pressure-volume loops
Abbreviations DefinitionsGeneral parameters
CI (CI = CObody wt) CO HR
Card iac indexCard iac outputHeart rate
PressuredPdtmax
dPdtmin
PedPesτ
Maximum derivative of change in systolic pressure in timeMaximum derivative of change in diastolic pressure in timeEnd-diastolic pressureEnd-systolic pressureTime constant of isovolumic relaxation
VolumeEFSI (SI = SVbody wt)SVVedVes
Ejection fractionStroke index Stroke volumeEnd-diastolic pressureEnd-systolic pressure
Pressure-volume relationshipsβEa (Ea = PesSV)EDPVREes
Slope of the end-diastolic pressure-volume relat ionshipArterial elastanceEnd-diastolic pressure-volume relat ionshipEnd-systolic ventricular elastance
EmaxESPVR
(slope of the end-systolic pressure-volume relationship)Maximum chamber elasticity (∆P∆V)End-systolic pressure-volume relat ionship
Pressure-volume areaEfficiencyEWPEPRSWPVASWSWI (SWI = SWbody wt)
EWPVAExternal work = SWPotential energyPreload-recruitable stroke workPressure-volume area = EW + PEStroke workStroke work index
Abbreviations DefinitionsGeneral parameters
CI (CI = CObody wt) CO HR
Card iac indexCard iac outputHeart rate
PressuredPdtmax
dPdtmin
PedPesτ
Maximum derivative of change in systolic pressure in timeMaximum derivative of change in diastolic pressure in timeEnd-diastolic pressureEnd-systolic pressureTime constant of isovolumic relaxation
VolumeEFSI (SI = SVbody wt)SVVedVes
Ejection fractionStroke index Stroke volumeEnd-diastolic pressureEnd-systolic pressure
Pressure-volume relationshipsβEa (Ea = PesSV)EDPVREes
Slope of the end-diastolic pressure-volume relat ionshipArterial elastanceEnd-diastolic pressure-volume relat ionshipEnd-systolic ventricular elastance
EmaxESPVR
(slope of the end-systolic pressure-volume relationship)Maximum chamber elasticity (∆P∆V)End-systolic pressure-volume relat ionship
Pressure-volume areaEfficiencyEWPEPRSWPVASWSWI (SWI = SWbody wt)
EWPVAExternal work = SWPotential energyPreload-recruitable stroke workPressure-volume area = EW + PEStroke workStroke work index
EmaxESPVR
(slope of the end-systolic pressure-volume (slope of the end-systolic pressure-volume relationship)Maximum chamber elasticity (∆P∆V)End-systolic pressure-volume relat ionship
Pressure-volume areaEfficiencyEWPEPRSWPVASWSWI (SWI = SWbody wt)
EWPVAExternal work = SWPotential energyPreload-recruitable stroke workPressure-volume area = EW + PEStroke workStroke work index
Chapter 3 Murine left ventricular pressure-volume loops
21
(Ees) proved to be equal in OC and CC instrumented mice The combination of enlarged
stroke volume with attenuated systolic pressures leads to a decrease in arterial elastance The
altered arterial elastance could be explained by the opening of the thorax A drop in overall
peripheral vascular resistance from baseline values has been described during thoracoscopy
(20)
Urethane
Volume (microl)
Pres
sure
(mm
Hg)
Pentobarbital
Volume (microl)
Pres
sure
(mm
Hg)
A
B
CCOCCCCCOCOC
CCOCCCCCOCOC
-100
102030405060708090
-10
0
10
20
30
40
50
60
0 5 10 15 20 25 30 35 400 5 10 15 20 25 30 35 40
0 5 10 15 20 25 30 35 400 5 10 15 20 25 30 35 40
Figure 9
Chapter 3 Murine left ventricular pressure-volume loops
22
Fig 9 Left ventricular pressure-volume loops Pressure presented in mmHg and volume microl
A Representative figure of PV loops acquired during urethane anesthesia in closed chest
(CC) and open chest (OC) instrumented mice B Representative figure of PV loops acquired
during pentobarbital anesthesia in CC and OC instrumented mice Loops are acquired during
an occlusion of the inferior caval vein Venous returns decreases which is represented in the
loops by attenuation of both pressure and volume The differences in ESP SW and ESPVR
between urethane and pentobarbital anesthesia can be observed by analyzing the loops in A
and B The loops show also the larger stroke volume and depressed systolic pressure in OC
instrumented mice
Figure 9 shows representative PV-loops while venous return was attenuated following
inferior caval vein occlusion Typical pressure and volume effects are depicted showing the
absence of apparent differences in PV relationships The mentioned differences in ESP SV
and EF are evident in the presented loops though
ECG recordings were made during both surgical protocols to detect possible heart rate
alterations and arrhythmias Murine left ventricular PV measurements could be distorted by
physiological responses to the catheterization Heart rate alterations could be anticipated
especially in relation to carotid sinus stimulation while cannulating of the carotid artery
However neither bradycardia nor other arrhythmias were observed during either CC or OC
procedures (figure 10) This finding indicates that cannulation of the right common carotid
artery does not alter heart rate by carotid sinus stimulation
Chapter 3 Murine left ventricular pressure-volume loops
23
Table 3 Functional parameters to determine baseline LV functioning in open- and closed-
chest protocols during steady-state measurement
URETHANE PENTOBARBITALOC CC OC CC
N = 5 N = 5 N = 10 N = 10
Mean plusmn SEM Mean plusmn SEM Mean plusmn SEM Mean plusmn SEM
HR 583 plusmn 20 658 plusmn 21 493 plusmn 25 481 plusmn 36SVdagger 1958 plusmn 351 1557 plusmn 254 2018 plusmn 183 1426 plusmn 103CO 12 plusmn 2 10 plusmn 2 10 plusmn 1 7 plusmn 0Vmaxdagger 1761 plusmn 053 2361 plusmn 223 3089 plusmn 289 3883 plusmn 230Vmindagger 215 plusmn 133 679 plusmn 180 1029 plusmn 189 2373 plusmn 199EFdagger 79 plusmn 6 66 plusmn 8 66 plusmn 4 39 plusmn 2
ESPdagger 52 plusmn 4 65 plusmn 5 42 plusmn 3 47 plusmn 4EDP 1 plusmn 1 -1 plusmn 1 -6 plusmn 2 1 plusmn 1
dPdtmax 7200 plusmn 1349 8252 plusmn 1685 4004 plusmn 629 3718 plusmn 684dPdtmindagger -4233 plusmn 531 -7577 plusmn 750 -3631 plusmn 424 -3348 plusmn 653Tau 10 plusmn 0 7 plusmn 0 12 plusmn 1 14 plusmn 2
SW 1066 plusmn 245 1147 plusmn 213 1076 plusmn 176 666 plusmn 116
EaEesdagger 065 plusmn 020 084 plusmn 016 060 plusmn 005 103 plusmn 015ESPVR 570 plusmn 094 589 plusmn 074 347 plusmn 027 318 plusmn 052EDPVR 009 plusmn 009 -008 plusmn 015 -015 plusmn 014 -005 plusmn 015PRSW 79 plusmn 14 64 plusmn 6 68 plusmn 10 53 plusmn 3
Results from LV pressure-volume measurements in C57Bl6 mice anesthetized by urethane or
pentobarbital Urethane versus pentobarbital P lt 005 dagger OC versus CC P lt 005 ρ Valued
124 Ωcm α 030 Open- (OC) and closed-chest (CC) protocols HR indicates heart rate in
bpm SV left ventricular stroke volume in microl CO cardiac output mlmin Vmin minimal left
ventricular volume in microl Vmax maximal left ventricular volume in microl EF ejection fraction in
ESP left ventricular end-systolic pressure in mmHg EDP left ventricular end-diastolic
pressure in mmHg dPdtmax maximal first derivative of left ventricular pressure in mmHgs
dPdtmin minimal first derivative of left ventricular pressure in mmHgs Tau time constant of
left ventricular relaxation in ms SW stroke work in mmHgmicrol Ea arterial elastance Ees
ventricular end-systolic elastance ESPVR left ventricular end-systolic PV relationship in
Chapter 3 Murine left ventricular pressure-volume loops
24
mmHgmicrol EDPVR left ventricular end-diastolic PV relationship in mmHgmicrol PRSW left
ventricular preload-recruitable stroke work in mmHg
The steady-state functional parameters from OC and CC instrumented mice during
either urethane or pentobarbital are also depicted in Table 2 The use of pentobarbital
anesthesia had a cardiodepressive effect that was represented by significant function decline
in most parameters EF dPdtMAX and ESPVR decreased respectively with 24 57 and 41
upon pentobarbital use compared to urethane anesthesia Pentobarbital therefore had strong
negative chronotropic and inotropic effects
Hear
trat
e(b
pm)
Heart rate trace in closed-chest animal
0
100
200
300
400
500
600
700
Time (minutes)
arterial canulation
A
0 1 2 3 4 5 6 7 8 9 10 11 12 13 14 15 16
Heart rate trace in open-chest animal
0
100
200
300
400
500
600
700
Time (minutes)
Hear
trat
e(b
pm)
Ventricular catheterisation
B
0 1 2 3 4 5 6 7 8 9 10 11 12 13 14
Figure 10
Chapter 3 Murine left ventricular pressure-volume loops
25
Fig 10 Heart rate tracings in closed chest and open chest instrumented mice
A Representative figure of a heart rate tracing in a closed-chest instrumented mouse The
moment of arterial cannulation is indicated Some arrhythmias are seen in response to
introduction of the catheter into the left ventricle Arrhythmias are only present in a short
time-period that is part of the stabilization period following catheter introduction Heart rate
remains unchanged during the measurements B Representative figure of a heart rate tracing
in an open-chest instrumented mouse Somewhat more pronounced chronotropic arrhythmias
are seen in response to ventricular introduction of the catheter by apical stab However no
significant brady- or tachycardias are present during the measurements
Chapter 3 Murine left ventricular pressure-volume loops
26
Discussion
In this chapter OC and CC protocols for in vivo left ventricular PV relationship
measurement are described and discussed Murine cardiac function determination via these
methods is sensitive reproducible and comparable The choice for open- or closed-chest PV
measurements in mice depends on the aim of the study with regards to the specific cardiac
pathology The OC approach is technically less complicated and less time consuming Main
characteristics of the OC model itself are low systolic pressures and arterial resistance The
OC approach could best be used in studies where myocardial integrity is not at stake
Particularly ischemiareperfusion studies regarding myocardial integrity are probably better
done using the CC approach
Assessment of cardiac performance in genetically engineered mice is indispensable to
understand human cardiovascular pathologies In general the synergistic features of cardiac
diseases such as hypertrophy and cell death affect cardiac function negatively The
contractile performance of the heart deteriorates which is reflected in the attenuation of
systolic parameters as ejection fraction stroke work and PV-relationships Furthermore
ventricular relaxation prolongs and diastolic filling becomes impaired The progression of
cardiac disease ultimately results in clinical heart failure which is defined by the inability of
the heart to meet hemodynamic demands of the body and is characterized by specific signs
and symptoms (21) The most important parameter of cardiac performance which defines
heart failure is cardiac output
The influence on cardiac performance of specific genes and proteins in the
development of cardiac diseases ought to be investigated extensively to assess their clinical
relevance Various techniques have been used to assess cardiac performance in mice The
main techniques will be discussed in brief
Chapter 3 Murine left ventricular pressure-volume loops
27
Echocardiography is the most widely used noninvasive technique to determine cardiac
performance in mice High-frequency transthoracic and transesophageal transducers are used
as effective tools for two-dimensional and Doppler imaging of ventricular wall structures
dimensions and volumes of cavum and cardiac function (2223) Full-conscious or gas-
anesthesia experiments are preferred for echocardiographic assessment of cardiac function in
mice (2425) There is no limit to the diversity of murine models investigated by this general
accepted method of cardiac performance assessment However the most questionable aspect
of these measurements is the significant inter- and intraobservator variance in the
measurements
Isolated working mouse heart measurements in a Langendorf perfusion setup are a
technique for ex vivo cardiac function measurements approximating the in vivo function level
(5) Cardiac output developed left ventricular pressure and first derivates of maximal and
minimal pressures are some of the parameters that can be derived Isolated working heart
measurements are especially useful to study the acute effects of ischemic preconditioning and
ischemia-induced apoptosis(2627) Metabolites of interest can be measured accurately in the
perfusion fluid Disadvantages are the impossibility of chronic studies and the
unphysiological situation of ex vivo cardiac function measurements
Aortic flow measurements by means of a flow-probe have been used in several
studies (2829) Aortic flow acquisition is a validated technique and reveals functional
parameters as cardiac output stroke volume and blood flow velocity However several
disadvantages oppose against this technique Firstly aortic flow measurements are invasive
(ie thoracotomy or laparotomy) and result solely in aortic derived volume parameters
Integrated ventricular function cannot be assessed More importantly the exact localization of
the flow probe around the aorta is the critical determinant of the systematic error made by
these measurements Flow probes have been placed around the ascending and descending
Chapter 3 Murine left ventricular pressure-volume loops
28
thoracic aorta and the abdominal aorta The percentage of total cardiac output passing the
flow probe on the specific location has to be estimated Flow probes located at the ascending
aorta correct for coronary circulation and for instance bloodvolume passing the descending
thoracic aorta has been estimated to be around 75 of total cardiac output (30) The estimated
correction factor provides lsquoabsolutersquo stroke volume instead of absolute LV cavum volumes
and does not correct for cardiophysiological changes Altered cardiophysiological situations
could theoretically influence the relative amount of bloodvolume passing the flow probe On
the other hand major advances are the possibility of chronic cardiac function measurements
and the relative facile manner of data acquirement(29) Moreover aortic flow probe
measurements are not hampered by deleterious cardiac remodeling in myocardial ischemia or
hypertrophy studies(2829)
The newly developed method of cardiac performance assessment by in vivo left
ventricular PV measurements in the CC model is introduced here Left ventricular PV
measurements in vivo provide an accurate assessment of murine cardiac function The method
is highly sensitive during open- and closed-chest approaches in determining alterations in left
ventricular function as result of cardiac disease or altered hemodynamic stress The
characteristics of simultaneous left ventricular pressure and volume measurements enable the
researcher to directly investigate pressure-related cardiac diseases as cardiac hypertrophy and
restrictive cardiomyopathy (31) or volume-related diseases as dilated cardiomyopathy (32)
Moreover the effective influence of both aspects of cardiac disease on each other can be
observed in detail For instance ventricular dilation and subsequent decrease in ventricular
systolic pressure is mapped accurately in PV-loops Continuous measurements provide
possibilities to investigate the complete cardiac cycle Basic aspects of cardiac physiology can
be visualized using PV-loops in mice (81533-35) For instance increase in ventricular filling
is followed by an increase in ejection fraction according to the Frank-Starling mechanism
Chapter 3 Murine left ventricular pressure-volume loops
29
The opposite is seen as a result of gradual venous return decrease in the case of transient caval
vein occlusion (figure 7 amp 9) Moreover the distinction between systolic and diastolic failure
can be made through continuous PV-measurements (19) Systolic heart failure encompasses
mainly an ejection dysfunction with impaired contractility Both aspects are obtained by and
directly visualized through PV-loops Additionally the definite diagnosis of diastolic failure
is dependent on the observation of an inappropriate upward shift of the (end-)diastolic PV
relationship requiring cardiac catheterization for continuous volume determinations using
impedance measurements and high-fidelity measurements of ventricular pressure with a
micromanometer (19) PV-loops are useful determining cardiac performance within the
complete continuum of healthy and diseased hearts
Chapter 3 Murine left ventricular pressure-volume loops
30
Conclusion
In vivo PV measurements provide an essential tool in the assessment of cardiac
function in genetically modified mice Open- and closed-chest surgical protocols for murine
cardiac function determination are sensitive reproducible and comparable PV-loops enable
the researcher to accurately investigate diverse murine models of cardiac pathology by
adequately visualizing the cause-and-effect relationship between genetic modification and
their functional outcome Changes in ventricular contractility are best detected by PV derived
parameters in comparison to other methods of cardiac function determination
Chapter 3 Murine left ventricular pressure-volume loops
31
References
1 Doevendans PA Daemen MJ de Muinck ED Smits JF Cardiovascular phenotypingin mice Cardiovasc Res 19983934-49
2 Hoit BD New approaches to phenotypic analysis in adult mice J Mol Cell Cardiol20013327-35
3 Chacko VP Aresta F Chacko SM Weiss RG MRIMRS assessment of in vivomurine cardiac metabolism morphology and function at physiological heart rates AmJ Physiol Heart Circ Physiol 2000279H2218-24
4 Tanaka N Dalton N Mao L et al Transthoracic echocardiography in models ofcardiac disease in the mouse Circulation 1996941109-17
5 De Windt LJ Willems J Reneman RS Van der Vusse GJ Arts T Van Bilsen M Animproved isolated left ventricular ejecting murine heart model Functional andmetabolic evaluation Pflugers Arch 1999437182-90
6 Palmen M Daemen MJ Buehler A et al Impaired cardiac remodeling and functionafter myocardial infarction in FGF-1 transgenic mice Circulation 1999100250
7 Rockman HA Hamilton RA Jones LR Milano CA Mao L Lefkowitz RJ Enhancedmyocardial relaxation in vivo in transgenic mice overexpressing the beta2-adrenergicreceptor is associated with reduced phospholamban protein J Clin Invest1996971618-23
8 Georgakopoulos D Mitzner WA Chen CH et al In vivo murine left ventricularpressure-volume relations by miniaturized conductance micromanometry Am JPhysiol 1998274H1416-22
9 Dekker AL Geskes GG Cramers AA et al Right ventricular support for off-pumpcoronary artery bypass grafting studied with bi-ventricular pressure-volume loops insheep Eur J Cardiothorac Surg 200119179-84
10 Schreuder JJ Steendijk P van der Veen FH et al Acute and short-term effects ofpartial left ventriculectomy in dilated cardiomyopathy assessment by pressure-volumeloops J Am Coll Cardiol 2000362104-14
11 Zimmer HG Measurement of left ventricular hemodynamic parameters in closed-chest rats under control and various pathophysiologic conditions Basic Res Cardiol19837877-84
12 Georgakopoulos D Kass DA Estimation of parallel conductance by dual-frequencyconductance catheter in mice Am J Physiol Heart Circ Physiol 2000279H443-50
13 Feldman MD Mao Y Valvano JW Pearce JA Freeman GL Development of amultifrequency conductance catheter-based system to determine LV function in miceAm J Physiol Heart Circ Physiol 2000279H1411-20
14 Kornet L Schreuder JJ Van de Velden ET Jansen JR The volume-dependency ofparallel conductance throughout the cardiac cycle and its consequence for volumeestimation of the left ventricle in patients Cardiovasc Res 200151729-35
15 Nemoto S DeFreitas G Mann DL Carabello BA Effects of changes in leftventricular contractility on indexes of contractility in mice Am J Physiol Heart CircPhysiol 2002283H2504-10
16 Baan J Van de Velden ET Steendijk P Ventricular pressure-volume relations in vivoEur Heart J 199213 SupplE2-6
17 Little WC Cheng CP Left ventricular-arterial coupling in conscious dogs Am JPhysiol 1991261H70-6
18 Sunagawa K Maughan WL Sagawa K Optimal arterial resistance for the maximalstroke work studied in isolated canine left ventricle Circ Res 198556586-95
Chapter 3 Murine left ventricular pressure-volume loops
32
19 Van Kraaij D Van Pol P Ruiters AW et al Diagnosing diastolic heart failure Eur JHeart Fail 20024419-30
20 Faunt KK Cohn LA Jones BD Dodam JR Cardiopulmonary effects of bilateralhemithorax ventilation and diagnostic thoracoscopy in dogs Am J Vet Res1998591494-8
21 Lips DJ Van Kraaij DL De Windt LJ Doevendans PA Molecular determinants ofmyocardial hypertrophy and failure alternative pathways for beneficial andmaladaptive hypertrophy Eur Heart J 200324883-96
22 Collins KA Korcarz CE Lang RM Use of echocardiography for the phenotypicassessment of genetically altered mice Physiol Genomics 200313227-39
23 Scherrer-Crosbie M Steudel W Hunziker PR et al Determination of right ventricularstructure and function in normoxic and hypoxic mice a transesophagealechocardiographic study Circulation 1998981015-21
24 Takuma S Suehiro K Cardinale C et al Anesthetic inhibition in ischemic andnonischemic murine heart comparison with conscious echocardiographic approachAm J Physiol Heart Circ Physiol 2001280H2364-70
25 Chaves AA Weinstein DM Bauer JA Non-invasive echocardiographic studies inmice influence of anesthetic regimen Life Sci 200169213-22
26 Yamaura G Turoczi T Yamamoto F Siddqui MA Maulik N Das DK STATsignaling in ischemic heart a role of STAT5A in ischemic preconditioning Am JPhysiol Heart Circ Physiol 2003285H476-82
27 Bell RM Yellon DM Atorvastatin administered at the onset of reperfusion andindependent of lipid lowering protects the myocardium by up-regulating a pro-survival pathway J Am Coll Cardiol 200341508-15
28 Aartsen WM Schuijt MP Danser AH Daemen MJ Smits JF The role of locallyexpressed angiotensin converting enzyme in cardiac remodeling after myocardialinfarction in mice Cardiovasc Res 200256205-13
29 Janssen B Debets J Leenders P Smits J Chronic measurement of cardiac output inconscious mice Am J Physiol Regul Integr Comp Physiol 2002282R928-35
30 Georgakopoulos D Christe ME Giewat M Seidman CM Seidman JG Kass DA Thepathogenesis of familial hypertrophic cardiomyopathy early and evolving effects froman alpha-cardiac myosin heavy chain missense mutation Nat Med 19995327-30
31 Liao P Georgakopoulos D Kovacs A et al The in vivo role of p38 MAP kinases incardiac remodeling and restrictive cardiomyopathy Proc Natl Acad Sci U S A20019812283-8
32 McConnell BK Jones KA Fatkin D et al Dilated cardiomyopathy in homozygousmyosin-binding protein-C mutant mice J Clin Invest 19991041235-44
33 Georgakopoulos D Kass DA Minimal force-frequency modulation of inotropy andrelaxation of in situ murine heart J Physiol 2001534535-45
34 Yang B Larson DF Watson R Age-related left ventricular function in the mouseanalysis based on in vivo pressure-volume relationships Am J Physiol1999277H1906-13
35 Reyes M Freeman GL Escobedo D Lee S Steinhelper ME Feldman MDEnhancement of contractility with sustained afterload in the intact murine heartblunting of length-dependent activation Circulation 20031072962-8
Chapter 3 Murine left ventricular pressure-volume loops
6
Fig 2 The concept of conductance derived left ventricular volume Left ventricular
bloodvolume is linear proportional with the time-varying conductance signal which correlates
with the level of resistanceimpedance of the bloodvolume on the electric current produced by
the catheter The conductance-catheter underestimates the volume-signal due to inhomogenity
of the electrical field The slope factor α corrects for this underestimation The offset volume
that arises from the protrusion of the electrical current in tissues besides blood (parallel
conductance) is corrected by the correction volume Vc
The conductance catheter is equipped with four electrodes (figure 3) two current
electrodes and two sensor electrodes The current electrodes produce an electric field with a
magnitude of 30 microA
Fig 3 Position of the conductance catheter in the left ventricle The catheter is retrogradely
inserted in the left ventricle The catheter consists of one pressure sensor and four volume
Figure 3
PS
SE
SE
CE
CE
49 mm45 mm
Chapter 3 Murine left ventricular pressure-volume loops
7
electrodes two current electrodes and two sensor electrodes The height of the measured
volume segment depends on the distance between the sensing electrodes ie 45 mm The
mean length of the longitudinal axis of the heart from adult mice is approximately 49 mm
CE indicates current electrode SE sensing electrode and PS pressure sensor
This specific current is chosen to prevent interaction with the murine endogenous
conduction system of the heart The catheter measures conductance which is translated into
left ventricular volume by a software program Cycle-varying conductance correlates with
time-varying ventricular volume V(t) according to the following formula
V(t) = ρ L2 [G(t) ndash Gp]
where ρ (rho) is the mouse specific blood resistivity L indicates the distance between the
sensor electrodes (ie 45 mm) G(t) the instantaneous conductance and Gp parallel
conductance The mouse specific blood resistance is determined using a Rho-cuvette with a
length of 05 cm and a diameter of 02 cm resulting in a content of 150 microl Gp is the offset in
the volume signal that originates from an additional conductance signal Shortly an electric
field broadens theoretically without end and protrudes through the ventricular wall into other
intrathoracic structures and organs Therefore the ventricular-derived conductance signal
originates partly from lungs mediastinum and most notably from the left ventricular
myocardium All have a relative contribution to the addition in ventricular-derived
conductance signal This offset-volume is referred to as the correction volume Vc (figure 2)
Several methods are used to acquire Gp and subsequent Vc One method calculates Gp from
the differences between myocardial and blood conductances at catheter excitation frequencies
of 2 and 10 kHz (12) The second method estimates Gp by exploiting the differential
frequency-induced conductivity of myocardium and blood (13) In our experiments we used
the hypertonic saline injection (HSI) method The method comprises of the infusion of 4 microl
Chapter 3 Murine left ventricular pressure-volume loops
8
hypertonic (30 NaCl) saline solution into the external jugular vein (~ 15 of left ventricular
absolute end-diastolic volume) The saline mixes with the murine blood and increases
conductance of blood through its high content of electrolytes The result is a volume increase
as shown by figure 4 a representative figure of a common HSI procedure The amount of
saline infusion is limited to 4 microl to prevent hemodynamic changes due to the fluid injection
As shown in figure 4 there is no influence on pressure The correction volume Vc is derived
via computerized algorithms
Fig 4 Conductance and pressure signals during hypertonic saline injection The total
acquired time period was 584 seconds Ventilation was stopped at the mark () after which 4
microL of 30 saline was injected (arrow) into the external jugular vein The conductivity of
blood was increased by the hypertonic saline infusion as demonstrated by the increase in the
conductance signal Parallel conductance is calculated by analyzing the conductance signal
Volu
me
(RVU
) Volume signal
30
35
40
45
50
Pressure signal
-200
20406080
100
Time (s)
Pres
sure
(mm
Hg)
Volu
me
(RVU
) Volume signal
30
35
40
45
50
30
35
40
45
50
Pressure signal
-200
20406080
100
-200
20406080
020406080
100
Time (s)
Pres
sure
(mm
Hg)
Figure 4
Chapter 3 Murine left ventricular pressure-volume loops
9
obtained during wash-in of the saline The unchanged pressure indicates that hemodynamics
are stable
In practice the conductance-catheter tends to constantly underestimate the left
ventricular bloodvolume The slope factor α should be calculated to correct for this
discrepancy (figure 2) For this purpose an independent volume measurement is needed
obtained in mice by blood flow measurements or echocardiography The slope factor α then
follows from the ratio conductance volumeindependent measured volume Table 1 shows the
results of α determination by echocardiography Slope factor α varied from 03 - 05
depending on the moment of measurement within the cardiac cycle The variance could be
due to the relative inaccuracy of ultrasonographic analyses It could also be inherent to
conductance measurements in the manner as performed Slope factor α deviates from 1
primarily due to the dependency of Gp on left ventricular volume (14) Gp should therefore be
measured continuously within the cardiac cycle to be able to correct adequately for the
variance of α However as the result of technical limitations continuous Gp acquisition is not
yet possible Whenever echocardiography is used end-diastolic volume EDV should be used
for α determination The variance of this calculated α is minor (SEM = 002) and the
correlation relatively high (adjusted R2 = 065)
Chapter 3 Murine left ventricular pressure-volume loops
10
Surgical protocols for PV-loops acquisition
The Sigma SA (CDLeycom Zoetermeer the Netherlands) single segment data
acquisition module was used for assessment of PV-loops The system operated on a constant
excitation current of 30microA to prevent interaction with the murine cardiac conduction system
determined by hypertonic saline injection and subtracted offline CONDUCT 2000 software
(CDLeycom Zoetermeer The Netherlands) was used for data acquisition and Circlab
software (LUMC Leiden The Netherlands) was used for offline data analysis
Invasive hemodynamic measurements of the murine left ventricle can theoretically be
performed by several ways for To date the most frequently reported method is an open-chest
(OC) approach (8) In brief mice are anaesthetized and the anterior thorax and the neck of the
mouse are shaved The animals are fixed on a warming plate Care is taken to maintain body
temperature constant at 37deg Celsius The neck skin of the mouse is opened by a saggital
incision The trachea is exposed to visually guide the intratracheal cannula (20-Gauge) where
after the cannula is connected to a mouse ventilator Minivent type 845 (Hugo Sachs
Electronics Germany) set at 150 strokes per minute and a tidal volume of 250 microl The
external jugular veins are cannulated with a flame-stretched PE-50 catheter for infusion of
saline and drugs The abdomen is opened subcostally The diaphragm is incised by a
transverse substernal approach leaving the pericardium intact The micromanometer is
calibrated with a mercury manometer by placing the sensor in 37deg Celsius normal saline The
left ventricle is entered through an apical stab with a 25 12 G needle immediately followed
by the Millar conductance-micromanometer The catheter is positioned correctly in the left
ventricle under guidance of the online pressure and volume signals The combination of
pressure and volume signals allows accurate positioning of the catheter in the left ventricle
Ventilation is stopped during data acquisition to avoid influence from ventilation of the lungs
on the pressure and volume signals The acquisition protocol consists of measurements of
Chapter 3 Murine left ventricular pressure-volume loops
11
baseline cardiac function hypertonic saline injection (3x) inferior caval vein occlusions with
and without β-adrenergic stimulation (isoproterenol 1000 pg)
This method is theoretically disadvantageous since collaps of the lungs and
destruction of myocardial integrity are induced through the relatively large surgical trauma
Furthermore in myocardial infarction studies the open-chest approach is hampered by
extensive left ventricular remodeling since the scar tissue is not accessible for the
conductance catheter and fails to provide a stable position
A closed-chest (CC) approach would theoretically circumvent several of these
disadvantages Firstly in a closed-chest the lungs remain untouched Secondly the cardiac
position and myocardial structures remain intact Thirdly surgical trauma and hemodynamic
stress would be reduced to a minimum Finally a closed-chest approach would allow accurate
assessment of left ventricular (LV) hemodynamic behavior in mice which underwent transient
or permanent occlusion of the left anterior descending coronary artery The surgical procedure
is similar to the open-chest approach except for the insertion of the conductance catheter into
the left ventricle In brief mice are anaesthetized and the neck and abdomen are shaved Care
is taken to maintain body temperature and ventilation support is provided as above Venous
catheters are placed after which the right common carotid is prepared for insertion of the
ultraminiature conductance-micromanometer The catheter is calibrated and subsequently
inserted into the left ventricle under guidance of the online pressure signal A transverse
abdominal incision without opening the thorax is performed to expose the inferior caval vein
The acquisition protocol is similar as in the open-chest approach
Chapter 3 Murine left ventricular pressure-volume loops
12
Explanation of the pressure-volume loop
The left ventricular PV loop is a two-dimensional representation of a single cardiac
cycle (figure 5) Beginning at end-diastole when the mitral valve closes the ejection phase
starts with pressure build up without actual volume ejection ie the isovolumic contraction
phase Blood is ejected out of the ventricle into the aorta upon opening of the aortic valve and
subsequently left ventricular volume decreases The end of ejection is defined by aortic valve
closure and followed by myocardial relaxation characterized by pressure decrease without
volume change ie the isovolumic relaxation phase The filling phase is initiated with
opening of the mitral valve and rise of ventricular volume The technique of simultaneous left
ventricular pressure and volume measurements provides continuous assessment of cardiac
function
Fig 5 The cardiac cycle in a single pressure-volume loop End-diastole is marked by the
closure of the mitral valves The hearts starts to build up pressure while all valves are closed
(isovolumetric contraction phase) before actual ejection begins following the opening of the
aortic valve Volume decreases while ejection progresses until the aortic valves close (end-
Closure aortic valve
VOLUME
PRES
SUR
E
Figure 5
Opening aortic valve
Isovolumicrelaxation
Isovolumiccontraction
Closure mitral valve
Openingmitral valve
Chapter 3 Murine left ventricular pressure-volume loops
13
systole) and relaxation starts Aortic and mitral valves are closed during relaxation
(isovolumic relaxation phase) The filling phase follows upon the opening of the mitral valve
and volume increase while pressure build up is minor
PV loops reveal in first instance the standard functional parameters (figure 6)
Fig 6 Cardiac performance parameters in the pressure-volume loop ED indicates end-
diastole ES end-systole Ved end-diastolic volume Ves end-systolic volume Ped end-
diastolic pressure Pes end-systolic pressure The area of the PV loop resembles stroke work
(SW) Stroke volume SV can be derived by subtracting Ves from Ved
However specific PV relationships are acquired too (table 2 figure 7) These
relationships describe the contractile and relaxative capabilities of the heart independent of
preload afterload or heart rate Transient occlusion of the inferior caval vein in mice is
performed to obtain these relationships Caval vein occlusion leads to a decrease in venous
return and thereby in preload of the left ventricle The response of the heart is typical as
Figure 6
VOLUME
PRES
SURE
ES
ED
Pes
Ved Ves
Ped
SV
SW
Chapter 3 Murine left ventricular pressure-volume loops
14
presented in figure 7 and shows the PV correlations Contractile parameters derived from PV-
correlations best detect small alterations in contractility in mice (15)
Fig 7 Pressure-volume relationships Variably loaded PV loops are used to define several PV
relationships The variable loading is derived by occluding the inferior caval vein and thereby
reducing venous return The end-systolic PV relationship (ESPVR) describes the contractile
performance of the left ventricle Contractility is linear correlated with the steepness of the
ESPVR slope ie Ees The end-diastolic PV relationship (EDPVR) describes diastolic
performance for instance diastolic distensibility The slope of the EDPVR (β) indicates the
passive chamber stiffness
The end-systolic PV relationship (ESPVR) describes the relation between volume and
pressure changes in systole Within the physiological range this relationship approximates a
straight line The relationship can be described in terms of its slope which reflects myocardial
contractility and its volume axis intercept V0 The volume intercept from the ESPVR line
Figure 7
PRES
SURE ESPVR
VOLUME
EesEes
EDPVRβ
V75
Chapter 3 Murine left ventricular pressure-volume loops
15
could better be taken at a constant pressure level in the physiological range for example
between 50 and 100 mm Hg (16) The volume intercept at a constant pressure (eg V75)
reflects myocardial contractility as it indicates the extent of contraction Increased myocardial
contractility for instance during beta-adrenergic stimulation with isoprenaline results in a
steeper ESPVR-slope and a leftward shift on the volume axis while attenuated contractility
for example during clinical heart failure results in a concomitantly plain slope and a
rightward shift on the volume axis The slope of the ESPVR (Ees) is used to describe the left
ventricular elastance Arterial elastance (Ea) a measure for ventricular afterload is described
by the slope of the relationship between stroke volume and end-systolic pressure (figure 8)
Fig 8 Arterial-ventricular coupling Ventricular elastance is estimated from the end-
systolic PV relationship (ESPVR) slope Ees Arterial elastance (Ea) is approximated by the
stroke volumeend-systolic pressure ratio (Ao Pes-SV relationship) The between Ea and Ees
reflects the coupling between the left ventricle and the arterial circulation The production of
stroke work is maximal when the Ea and Ees are approximately equal
Figure 8
Ea Ees
VOLUME
PRES
SURE
PRESSURE
PV-relat
ion Ao PES ndash SV relation
Chapter 3 Murine left ventricular pressure-volume loops
16
The production of stroke work is maximal when the Ees and Ea are approximately
equal Stroke work attenuates substantially in relation to its maximal value whenever Ea and
Ees differ markedly (1718) The preload-recruitable stroke work (PRSW) is the relationship
between end-diastolic volume and performed stroke work by the ventricle It is a load-
independent measure of contractility related to preload The contractile state of the heart is
resembled by the steepness of the PRSW-slope In a high contractile state the heart is able to
perform more stroke work at a constant end-diastolic volume for instance by augmenting the
ejection fraction
Diastolic function is derived from the end-diastolic PV relationship (EDPVR) which
correlates with the compliance of the ventricular myocardium Diastolic dysfunctioning or
failure is observed by an inappropriate upward shift of the ESPVR The slope of the EDPVR
(β) increases during augmented stiffness of the ventricular wall when pressure rises
progressively more during ventricular filling The opposite occurs in case of increased
compliance Certain cardiac diseases and remodeling processes are correlated with increased
stiffness of the ventricular wall by collagen deposition resulting in an increase of the
EDPVR-slope (19)
Numerous other relationships can be assessed The limits are determined by the
interests and the creativity of the investigator
Chapter 3 Murine left ventricular pressure-volume loops
17
Results of PV-measurements with the open- (OC) and closed-chest (CC) approach
A comparative study was performed to determine scientifically based arguments for
the choice between open- (OC) or closed-chest (CC) PV measurements to examine murine
cardiac function Comparing cardiac performance between OC and CC protocols revealed
overall relatively similar values for the investigated parameters (table 3) The values for LV
volumes were corrected for ρ determined at 124 Ωcm in the used setup (N = 10 12352 plusmn
088 Ωcm) α (N = 13 030) and Vc Vc was determined during all PV experiments by the
hypertonic saline injection method No significant differences could be detected between CC
and OC instrumentation (9469 plusmn 483 microl versus 9272 plusmn 205 microl respectively NS) The 4 microl
30 saline demonstrated to be sufficient to change blood conductivity Moreover as this
volume encompasses only 15 of the normal murine end-diastolic volume it proved to be too
small to influence LV end-diastolic and end-systolic pressures (figure 4) in either OC or CC
mice
Several differences were found between the OC and CC approaches (table 3) Cardiac
function in the OC approach was characterized by higher ejection fractions (EF 69 versus
48 respectively) larger stroke volume (1998 versus 1470 microl respectively) and a leftward
shift in ventricular volume On the contrary measuring cardiac function with an intact thorax
resulted in higher end-systolic pressures (ESP OC 52 versus CC 65 mmHg with urethane
anesthesia) and a higher rate of relaxation as indicated by the dPdtmin No differences were
found in the PV relationships ie the ESPVR EDPVR or PRSW Interestingly the OC
approach did result in a mismatch between arterial afterload and ventricular work The
arterial-ventricular elastance ratio (EaEes) was significantly depressed following opening of
the chest In contrast EaEes ratios were normal (ie ~ 10) in the CC approach under both
regimens This finding is consistently found in open-chest instrumented mice (8) The arterial-
ventricular coupling mismatch was depending on arterial resistance the slope of the ESPVR
Chapter 3 Murine left ventricular pressure-volume loops
18
Table 1 Comparison of volume derived by ultrasonography and conductance
Descriptive statistics of alphaN Min Max Mean SEM
EDV 13 018 045 030 002ESV 13 016 094 051 007SV 13 009 058 026 004
Regression analysis
N
RR2
Adjusted R2
SEE
EDV13
082068065179
ESV13
083069066172
SV13
041017009117
Chapter 3 Murine left ventricular pressure-volume loops
19
Left ventricular volume was measured by both ultrasonography
and conductance in adult C57Bl6 mice End-diastolic end-
systolic and stroke volume were used to obtain alpha (α)
Descriptive analysis shows that α determination at the end-
diastolic moment results in the most consistent mean α Also
the correlation of LV volume values between ultrasonography
and conductance is high as shown by the regression analysis
SEM indicates standard error of the mean SEE standard error
of the estimate
EDVECHO (microl)120100806040200
EDV C
ON
DUC
TAN
CE (micro
l)
18
16
14
12
10
8
6
SCATTERPLOT OF END-DIASTOLIC VOLUMECONDUCTANCE VS ULTRASONOGRAPHY
EDVECHO (microl)120100806040200
EDV C
ON
DUC
TAN
CE (micro
l)
18
16
14
12
10
8
6
EDVECHO (microl)120100806040200
EDV C
ON
DUC
TAN
CE (micro
l)
18
16
14
12
10
8
6
SCATTERPLOT OF END-DIASTOLIC VOLUMECONDUCTANCE VS ULTRASONOGRAPHY
Chapter 3 Murine left ventricular pressure-volume loops
20
Table 2 Parameters derived by pressure-volume loops
Abbreviations DefinitionsGeneral parameters
CI (CI = CObody wt) CO HR
Card iac indexCard iac outputHeart rate
PressuredPdtmax
dPdtmin
PedPesτ
Maximum derivative of change in systolic pressure in timeMaximum derivative of change in diastolic pressure in timeEnd-diastolic pressureEnd-systolic pressureTime constant of isovolumic relaxation
VolumeEFSI (SI = SVbody wt)SVVedVes
Ejection fractionStroke index Stroke volumeEnd-diastolic pressureEnd-systolic pressure
Pressure-volume relationshipsβEa (Ea = PesSV)EDPVREes
Slope of the end-diastolic pressure-volume relat ionshipArterial elastanceEnd-diastolic pressure-volume relat ionshipEnd-systolic ventricular elastance
EmaxESPVR
(slope of the end-systolic pressure-volume relationship)Maximum chamber elasticity (∆P∆V)End-systolic pressure-volume relat ionship
Pressure-volume areaEfficiencyEWPEPRSWPVASWSWI (SWI = SWbody wt)
EWPVAExternal work = SWPotential energyPreload-recruitable stroke workPressure-volume area = EW + PEStroke workStroke work index
Abbreviations DefinitionsGeneral parameters
CI (CI = CObody wt) CO HR
Card iac indexCard iac outputHeart rate
PressuredPdtmax
dPdtmin
PedPesτ
Maximum derivative of change in systolic pressure in timeMaximum derivative of change in diastolic pressure in timeEnd-diastolic pressureEnd-systolic pressureTime constant of isovolumic relaxation
VolumeEFSI (SI = SVbody wt)SVVedVes
Ejection fractionStroke index Stroke volumeEnd-diastolic pressureEnd-systolic pressure
Pressure-volume relationshipsβEa (Ea = PesSV)EDPVREes
Slope of the end-diastolic pressure-volume relat ionshipArterial elastanceEnd-diastolic pressure-volume relat ionshipEnd-systolic ventricular elastance
EmaxESPVR
(slope of the end-systolic pressure-volume relationship)Maximum chamber elasticity (∆P∆V)End-systolic pressure-volume relat ionship
Pressure-volume areaEfficiencyEWPEPRSWPVASWSWI (SWI = SWbody wt)
EWPVAExternal work = SWPotential energyPreload-recruitable stroke workPressure-volume area = EW + PEStroke workStroke work index
EmaxESPVR
(slope of the end-systolic pressure-volume (slope of the end-systolic pressure-volume relationship)Maximum chamber elasticity (∆P∆V)End-systolic pressure-volume relat ionship
Pressure-volume areaEfficiencyEWPEPRSWPVASWSWI (SWI = SWbody wt)
EWPVAExternal work = SWPotential energyPreload-recruitable stroke workPressure-volume area = EW + PEStroke workStroke work index
Chapter 3 Murine left ventricular pressure-volume loops
21
(Ees) proved to be equal in OC and CC instrumented mice The combination of enlarged
stroke volume with attenuated systolic pressures leads to a decrease in arterial elastance The
altered arterial elastance could be explained by the opening of the thorax A drop in overall
peripheral vascular resistance from baseline values has been described during thoracoscopy
(20)
Urethane
Volume (microl)
Pres
sure
(mm
Hg)
Pentobarbital
Volume (microl)
Pres
sure
(mm
Hg)
A
B
CCOCCCCCOCOC
CCOCCCCCOCOC
-100
102030405060708090
-10
0
10
20
30
40
50
60
0 5 10 15 20 25 30 35 400 5 10 15 20 25 30 35 40
0 5 10 15 20 25 30 35 400 5 10 15 20 25 30 35 40
Figure 9
Chapter 3 Murine left ventricular pressure-volume loops
22
Fig 9 Left ventricular pressure-volume loops Pressure presented in mmHg and volume microl
A Representative figure of PV loops acquired during urethane anesthesia in closed chest
(CC) and open chest (OC) instrumented mice B Representative figure of PV loops acquired
during pentobarbital anesthesia in CC and OC instrumented mice Loops are acquired during
an occlusion of the inferior caval vein Venous returns decreases which is represented in the
loops by attenuation of both pressure and volume The differences in ESP SW and ESPVR
between urethane and pentobarbital anesthesia can be observed by analyzing the loops in A
and B The loops show also the larger stroke volume and depressed systolic pressure in OC
instrumented mice
Figure 9 shows representative PV-loops while venous return was attenuated following
inferior caval vein occlusion Typical pressure and volume effects are depicted showing the
absence of apparent differences in PV relationships The mentioned differences in ESP SV
and EF are evident in the presented loops though
ECG recordings were made during both surgical protocols to detect possible heart rate
alterations and arrhythmias Murine left ventricular PV measurements could be distorted by
physiological responses to the catheterization Heart rate alterations could be anticipated
especially in relation to carotid sinus stimulation while cannulating of the carotid artery
However neither bradycardia nor other arrhythmias were observed during either CC or OC
procedures (figure 10) This finding indicates that cannulation of the right common carotid
artery does not alter heart rate by carotid sinus stimulation
Chapter 3 Murine left ventricular pressure-volume loops
23
Table 3 Functional parameters to determine baseline LV functioning in open- and closed-
chest protocols during steady-state measurement
URETHANE PENTOBARBITALOC CC OC CC
N = 5 N = 5 N = 10 N = 10
Mean plusmn SEM Mean plusmn SEM Mean plusmn SEM Mean plusmn SEM
HR 583 plusmn 20 658 plusmn 21 493 plusmn 25 481 plusmn 36SVdagger 1958 plusmn 351 1557 plusmn 254 2018 plusmn 183 1426 plusmn 103CO 12 plusmn 2 10 plusmn 2 10 plusmn 1 7 plusmn 0Vmaxdagger 1761 plusmn 053 2361 plusmn 223 3089 plusmn 289 3883 plusmn 230Vmindagger 215 plusmn 133 679 plusmn 180 1029 plusmn 189 2373 plusmn 199EFdagger 79 plusmn 6 66 plusmn 8 66 plusmn 4 39 plusmn 2
ESPdagger 52 plusmn 4 65 plusmn 5 42 plusmn 3 47 plusmn 4EDP 1 plusmn 1 -1 plusmn 1 -6 plusmn 2 1 plusmn 1
dPdtmax 7200 plusmn 1349 8252 plusmn 1685 4004 plusmn 629 3718 plusmn 684dPdtmindagger -4233 plusmn 531 -7577 plusmn 750 -3631 plusmn 424 -3348 plusmn 653Tau 10 plusmn 0 7 plusmn 0 12 plusmn 1 14 plusmn 2
SW 1066 plusmn 245 1147 plusmn 213 1076 plusmn 176 666 plusmn 116
EaEesdagger 065 plusmn 020 084 plusmn 016 060 plusmn 005 103 plusmn 015ESPVR 570 plusmn 094 589 plusmn 074 347 plusmn 027 318 plusmn 052EDPVR 009 plusmn 009 -008 plusmn 015 -015 plusmn 014 -005 plusmn 015PRSW 79 plusmn 14 64 plusmn 6 68 plusmn 10 53 plusmn 3
Results from LV pressure-volume measurements in C57Bl6 mice anesthetized by urethane or
pentobarbital Urethane versus pentobarbital P lt 005 dagger OC versus CC P lt 005 ρ Valued
124 Ωcm α 030 Open- (OC) and closed-chest (CC) protocols HR indicates heart rate in
bpm SV left ventricular stroke volume in microl CO cardiac output mlmin Vmin minimal left
ventricular volume in microl Vmax maximal left ventricular volume in microl EF ejection fraction in
ESP left ventricular end-systolic pressure in mmHg EDP left ventricular end-diastolic
pressure in mmHg dPdtmax maximal first derivative of left ventricular pressure in mmHgs
dPdtmin minimal first derivative of left ventricular pressure in mmHgs Tau time constant of
left ventricular relaxation in ms SW stroke work in mmHgmicrol Ea arterial elastance Ees
ventricular end-systolic elastance ESPVR left ventricular end-systolic PV relationship in
Chapter 3 Murine left ventricular pressure-volume loops
24
mmHgmicrol EDPVR left ventricular end-diastolic PV relationship in mmHgmicrol PRSW left
ventricular preload-recruitable stroke work in mmHg
The steady-state functional parameters from OC and CC instrumented mice during
either urethane or pentobarbital are also depicted in Table 2 The use of pentobarbital
anesthesia had a cardiodepressive effect that was represented by significant function decline
in most parameters EF dPdtMAX and ESPVR decreased respectively with 24 57 and 41
upon pentobarbital use compared to urethane anesthesia Pentobarbital therefore had strong
negative chronotropic and inotropic effects
Hear
trat
e(b
pm)
Heart rate trace in closed-chest animal
0
100
200
300
400
500
600
700
Time (minutes)
arterial canulation
A
0 1 2 3 4 5 6 7 8 9 10 11 12 13 14 15 16
Heart rate trace in open-chest animal
0
100
200
300
400
500
600
700
Time (minutes)
Hear
trat
e(b
pm)
Ventricular catheterisation
B
0 1 2 3 4 5 6 7 8 9 10 11 12 13 14
Figure 10
Chapter 3 Murine left ventricular pressure-volume loops
25
Fig 10 Heart rate tracings in closed chest and open chest instrumented mice
A Representative figure of a heart rate tracing in a closed-chest instrumented mouse The
moment of arterial cannulation is indicated Some arrhythmias are seen in response to
introduction of the catheter into the left ventricle Arrhythmias are only present in a short
time-period that is part of the stabilization period following catheter introduction Heart rate
remains unchanged during the measurements B Representative figure of a heart rate tracing
in an open-chest instrumented mouse Somewhat more pronounced chronotropic arrhythmias
are seen in response to ventricular introduction of the catheter by apical stab However no
significant brady- or tachycardias are present during the measurements
Chapter 3 Murine left ventricular pressure-volume loops
26
Discussion
In this chapter OC and CC protocols for in vivo left ventricular PV relationship
measurement are described and discussed Murine cardiac function determination via these
methods is sensitive reproducible and comparable The choice for open- or closed-chest PV
measurements in mice depends on the aim of the study with regards to the specific cardiac
pathology The OC approach is technically less complicated and less time consuming Main
characteristics of the OC model itself are low systolic pressures and arterial resistance The
OC approach could best be used in studies where myocardial integrity is not at stake
Particularly ischemiareperfusion studies regarding myocardial integrity are probably better
done using the CC approach
Assessment of cardiac performance in genetically engineered mice is indispensable to
understand human cardiovascular pathologies In general the synergistic features of cardiac
diseases such as hypertrophy and cell death affect cardiac function negatively The
contractile performance of the heart deteriorates which is reflected in the attenuation of
systolic parameters as ejection fraction stroke work and PV-relationships Furthermore
ventricular relaxation prolongs and diastolic filling becomes impaired The progression of
cardiac disease ultimately results in clinical heart failure which is defined by the inability of
the heart to meet hemodynamic demands of the body and is characterized by specific signs
and symptoms (21) The most important parameter of cardiac performance which defines
heart failure is cardiac output
The influence on cardiac performance of specific genes and proteins in the
development of cardiac diseases ought to be investigated extensively to assess their clinical
relevance Various techniques have been used to assess cardiac performance in mice The
main techniques will be discussed in brief
Chapter 3 Murine left ventricular pressure-volume loops
27
Echocardiography is the most widely used noninvasive technique to determine cardiac
performance in mice High-frequency transthoracic and transesophageal transducers are used
as effective tools for two-dimensional and Doppler imaging of ventricular wall structures
dimensions and volumes of cavum and cardiac function (2223) Full-conscious or gas-
anesthesia experiments are preferred for echocardiographic assessment of cardiac function in
mice (2425) There is no limit to the diversity of murine models investigated by this general
accepted method of cardiac performance assessment However the most questionable aspect
of these measurements is the significant inter- and intraobservator variance in the
measurements
Isolated working mouse heart measurements in a Langendorf perfusion setup are a
technique for ex vivo cardiac function measurements approximating the in vivo function level
(5) Cardiac output developed left ventricular pressure and first derivates of maximal and
minimal pressures are some of the parameters that can be derived Isolated working heart
measurements are especially useful to study the acute effects of ischemic preconditioning and
ischemia-induced apoptosis(2627) Metabolites of interest can be measured accurately in the
perfusion fluid Disadvantages are the impossibility of chronic studies and the
unphysiological situation of ex vivo cardiac function measurements
Aortic flow measurements by means of a flow-probe have been used in several
studies (2829) Aortic flow acquisition is a validated technique and reveals functional
parameters as cardiac output stroke volume and blood flow velocity However several
disadvantages oppose against this technique Firstly aortic flow measurements are invasive
(ie thoracotomy or laparotomy) and result solely in aortic derived volume parameters
Integrated ventricular function cannot be assessed More importantly the exact localization of
the flow probe around the aorta is the critical determinant of the systematic error made by
these measurements Flow probes have been placed around the ascending and descending
Chapter 3 Murine left ventricular pressure-volume loops
28
thoracic aorta and the abdominal aorta The percentage of total cardiac output passing the
flow probe on the specific location has to be estimated Flow probes located at the ascending
aorta correct for coronary circulation and for instance bloodvolume passing the descending
thoracic aorta has been estimated to be around 75 of total cardiac output (30) The estimated
correction factor provides lsquoabsolutersquo stroke volume instead of absolute LV cavum volumes
and does not correct for cardiophysiological changes Altered cardiophysiological situations
could theoretically influence the relative amount of bloodvolume passing the flow probe On
the other hand major advances are the possibility of chronic cardiac function measurements
and the relative facile manner of data acquirement(29) Moreover aortic flow probe
measurements are not hampered by deleterious cardiac remodeling in myocardial ischemia or
hypertrophy studies(2829)
The newly developed method of cardiac performance assessment by in vivo left
ventricular PV measurements in the CC model is introduced here Left ventricular PV
measurements in vivo provide an accurate assessment of murine cardiac function The method
is highly sensitive during open- and closed-chest approaches in determining alterations in left
ventricular function as result of cardiac disease or altered hemodynamic stress The
characteristics of simultaneous left ventricular pressure and volume measurements enable the
researcher to directly investigate pressure-related cardiac diseases as cardiac hypertrophy and
restrictive cardiomyopathy (31) or volume-related diseases as dilated cardiomyopathy (32)
Moreover the effective influence of both aspects of cardiac disease on each other can be
observed in detail For instance ventricular dilation and subsequent decrease in ventricular
systolic pressure is mapped accurately in PV-loops Continuous measurements provide
possibilities to investigate the complete cardiac cycle Basic aspects of cardiac physiology can
be visualized using PV-loops in mice (81533-35) For instance increase in ventricular filling
is followed by an increase in ejection fraction according to the Frank-Starling mechanism
Chapter 3 Murine left ventricular pressure-volume loops
29
The opposite is seen as a result of gradual venous return decrease in the case of transient caval
vein occlusion (figure 7 amp 9) Moreover the distinction between systolic and diastolic failure
can be made through continuous PV-measurements (19) Systolic heart failure encompasses
mainly an ejection dysfunction with impaired contractility Both aspects are obtained by and
directly visualized through PV-loops Additionally the definite diagnosis of diastolic failure
is dependent on the observation of an inappropriate upward shift of the (end-)diastolic PV
relationship requiring cardiac catheterization for continuous volume determinations using
impedance measurements and high-fidelity measurements of ventricular pressure with a
micromanometer (19) PV-loops are useful determining cardiac performance within the
complete continuum of healthy and diseased hearts
Chapter 3 Murine left ventricular pressure-volume loops
30
Conclusion
In vivo PV measurements provide an essential tool in the assessment of cardiac
function in genetically modified mice Open- and closed-chest surgical protocols for murine
cardiac function determination are sensitive reproducible and comparable PV-loops enable
the researcher to accurately investigate diverse murine models of cardiac pathology by
adequately visualizing the cause-and-effect relationship between genetic modification and
their functional outcome Changes in ventricular contractility are best detected by PV derived
parameters in comparison to other methods of cardiac function determination
Chapter 3 Murine left ventricular pressure-volume loops
31
References
1 Doevendans PA Daemen MJ de Muinck ED Smits JF Cardiovascular phenotypingin mice Cardiovasc Res 19983934-49
2 Hoit BD New approaches to phenotypic analysis in adult mice J Mol Cell Cardiol20013327-35
3 Chacko VP Aresta F Chacko SM Weiss RG MRIMRS assessment of in vivomurine cardiac metabolism morphology and function at physiological heart rates AmJ Physiol Heart Circ Physiol 2000279H2218-24
4 Tanaka N Dalton N Mao L et al Transthoracic echocardiography in models ofcardiac disease in the mouse Circulation 1996941109-17
5 De Windt LJ Willems J Reneman RS Van der Vusse GJ Arts T Van Bilsen M Animproved isolated left ventricular ejecting murine heart model Functional andmetabolic evaluation Pflugers Arch 1999437182-90
6 Palmen M Daemen MJ Buehler A et al Impaired cardiac remodeling and functionafter myocardial infarction in FGF-1 transgenic mice Circulation 1999100250
7 Rockman HA Hamilton RA Jones LR Milano CA Mao L Lefkowitz RJ Enhancedmyocardial relaxation in vivo in transgenic mice overexpressing the beta2-adrenergicreceptor is associated with reduced phospholamban protein J Clin Invest1996971618-23
8 Georgakopoulos D Mitzner WA Chen CH et al In vivo murine left ventricularpressure-volume relations by miniaturized conductance micromanometry Am JPhysiol 1998274H1416-22
9 Dekker AL Geskes GG Cramers AA et al Right ventricular support for off-pumpcoronary artery bypass grafting studied with bi-ventricular pressure-volume loops insheep Eur J Cardiothorac Surg 200119179-84
10 Schreuder JJ Steendijk P van der Veen FH et al Acute and short-term effects ofpartial left ventriculectomy in dilated cardiomyopathy assessment by pressure-volumeloops J Am Coll Cardiol 2000362104-14
11 Zimmer HG Measurement of left ventricular hemodynamic parameters in closed-chest rats under control and various pathophysiologic conditions Basic Res Cardiol19837877-84
12 Georgakopoulos D Kass DA Estimation of parallel conductance by dual-frequencyconductance catheter in mice Am J Physiol Heart Circ Physiol 2000279H443-50
13 Feldman MD Mao Y Valvano JW Pearce JA Freeman GL Development of amultifrequency conductance catheter-based system to determine LV function in miceAm J Physiol Heart Circ Physiol 2000279H1411-20
14 Kornet L Schreuder JJ Van de Velden ET Jansen JR The volume-dependency ofparallel conductance throughout the cardiac cycle and its consequence for volumeestimation of the left ventricle in patients Cardiovasc Res 200151729-35
15 Nemoto S DeFreitas G Mann DL Carabello BA Effects of changes in leftventricular contractility on indexes of contractility in mice Am J Physiol Heart CircPhysiol 2002283H2504-10
16 Baan J Van de Velden ET Steendijk P Ventricular pressure-volume relations in vivoEur Heart J 199213 SupplE2-6
17 Little WC Cheng CP Left ventricular-arterial coupling in conscious dogs Am JPhysiol 1991261H70-6
18 Sunagawa K Maughan WL Sagawa K Optimal arterial resistance for the maximalstroke work studied in isolated canine left ventricle Circ Res 198556586-95
Chapter 3 Murine left ventricular pressure-volume loops
32
19 Van Kraaij D Van Pol P Ruiters AW et al Diagnosing diastolic heart failure Eur JHeart Fail 20024419-30
20 Faunt KK Cohn LA Jones BD Dodam JR Cardiopulmonary effects of bilateralhemithorax ventilation and diagnostic thoracoscopy in dogs Am J Vet Res1998591494-8
21 Lips DJ Van Kraaij DL De Windt LJ Doevendans PA Molecular determinants ofmyocardial hypertrophy and failure alternative pathways for beneficial andmaladaptive hypertrophy Eur Heart J 200324883-96
22 Collins KA Korcarz CE Lang RM Use of echocardiography for the phenotypicassessment of genetically altered mice Physiol Genomics 200313227-39
23 Scherrer-Crosbie M Steudel W Hunziker PR et al Determination of right ventricularstructure and function in normoxic and hypoxic mice a transesophagealechocardiographic study Circulation 1998981015-21
24 Takuma S Suehiro K Cardinale C et al Anesthetic inhibition in ischemic andnonischemic murine heart comparison with conscious echocardiographic approachAm J Physiol Heart Circ Physiol 2001280H2364-70
25 Chaves AA Weinstein DM Bauer JA Non-invasive echocardiographic studies inmice influence of anesthetic regimen Life Sci 200169213-22
26 Yamaura G Turoczi T Yamamoto F Siddqui MA Maulik N Das DK STATsignaling in ischemic heart a role of STAT5A in ischemic preconditioning Am JPhysiol Heart Circ Physiol 2003285H476-82
27 Bell RM Yellon DM Atorvastatin administered at the onset of reperfusion andindependent of lipid lowering protects the myocardium by up-regulating a pro-survival pathway J Am Coll Cardiol 200341508-15
28 Aartsen WM Schuijt MP Danser AH Daemen MJ Smits JF The role of locallyexpressed angiotensin converting enzyme in cardiac remodeling after myocardialinfarction in mice Cardiovasc Res 200256205-13
29 Janssen B Debets J Leenders P Smits J Chronic measurement of cardiac output inconscious mice Am J Physiol Regul Integr Comp Physiol 2002282R928-35
30 Georgakopoulos D Christe ME Giewat M Seidman CM Seidman JG Kass DA Thepathogenesis of familial hypertrophic cardiomyopathy early and evolving effects froman alpha-cardiac myosin heavy chain missense mutation Nat Med 19995327-30
31 Liao P Georgakopoulos D Kovacs A et al The in vivo role of p38 MAP kinases incardiac remodeling and restrictive cardiomyopathy Proc Natl Acad Sci U S A20019812283-8
32 McConnell BK Jones KA Fatkin D et al Dilated cardiomyopathy in homozygousmyosin-binding protein-C mutant mice J Clin Invest 19991041235-44
33 Georgakopoulos D Kass DA Minimal force-frequency modulation of inotropy andrelaxation of in situ murine heart J Physiol 2001534535-45
34 Yang B Larson DF Watson R Age-related left ventricular function in the mouseanalysis based on in vivo pressure-volume relationships Am J Physiol1999277H1906-13
35 Reyes M Freeman GL Escobedo D Lee S Steinhelper ME Feldman MDEnhancement of contractility with sustained afterload in the intact murine heartblunting of length-dependent activation Circulation 20031072962-8
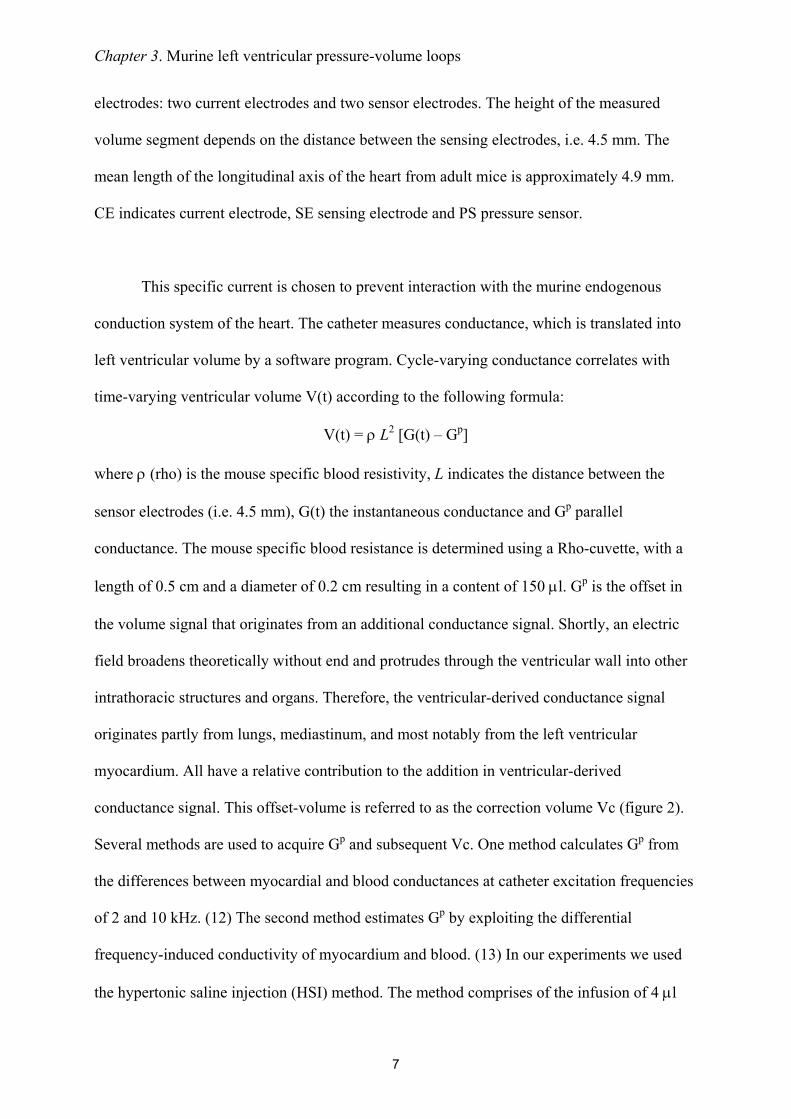
Chapter 3 Murine left ventricular pressure-volume loops
7
electrodes two current electrodes and two sensor electrodes The height of the measured
volume segment depends on the distance between the sensing electrodes ie 45 mm The
mean length of the longitudinal axis of the heart from adult mice is approximately 49 mm
CE indicates current electrode SE sensing electrode and PS pressure sensor
This specific current is chosen to prevent interaction with the murine endogenous
conduction system of the heart The catheter measures conductance which is translated into
left ventricular volume by a software program Cycle-varying conductance correlates with
time-varying ventricular volume V(t) according to the following formula
V(t) = ρ L2 [G(t) ndash Gp]
where ρ (rho) is the mouse specific blood resistivity L indicates the distance between the
sensor electrodes (ie 45 mm) G(t) the instantaneous conductance and Gp parallel
conductance The mouse specific blood resistance is determined using a Rho-cuvette with a
length of 05 cm and a diameter of 02 cm resulting in a content of 150 microl Gp is the offset in
the volume signal that originates from an additional conductance signal Shortly an electric
field broadens theoretically without end and protrudes through the ventricular wall into other
intrathoracic structures and organs Therefore the ventricular-derived conductance signal
originates partly from lungs mediastinum and most notably from the left ventricular
myocardium All have a relative contribution to the addition in ventricular-derived
conductance signal This offset-volume is referred to as the correction volume Vc (figure 2)
Several methods are used to acquire Gp and subsequent Vc One method calculates Gp from
the differences between myocardial and blood conductances at catheter excitation frequencies
of 2 and 10 kHz (12) The second method estimates Gp by exploiting the differential
frequency-induced conductivity of myocardium and blood (13) In our experiments we used
the hypertonic saline injection (HSI) method The method comprises of the infusion of 4 microl
Chapter 3 Murine left ventricular pressure-volume loops
8
hypertonic (30 NaCl) saline solution into the external jugular vein (~ 15 of left ventricular
absolute end-diastolic volume) The saline mixes with the murine blood and increases
conductance of blood through its high content of electrolytes The result is a volume increase
as shown by figure 4 a representative figure of a common HSI procedure The amount of
saline infusion is limited to 4 microl to prevent hemodynamic changes due to the fluid injection
As shown in figure 4 there is no influence on pressure The correction volume Vc is derived
via computerized algorithms
Fig 4 Conductance and pressure signals during hypertonic saline injection The total
acquired time period was 584 seconds Ventilation was stopped at the mark () after which 4
microL of 30 saline was injected (arrow) into the external jugular vein The conductivity of
blood was increased by the hypertonic saline infusion as demonstrated by the increase in the
conductance signal Parallel conductance is calculated by analyzing the conductance signal
Volu
me
(RVU
) Volume signal
30
35
40
45
50
Pressure signal
-200
20406080
100
Time (s)
Pres
sure
(mm
Hg)
Volu
me
(RVU
) Volume signal
30
35
40
45
50
30
35
40
45
50
Pressure signal
-200
20406080
100
-200
20406080
020406080
100
Time (s)
Pres
sure
(mm
Hg)
Figure 4
Chapter 3 Murine left ventricular pressure-volume loops
9
obtained during wash-in of the saline The unchanged pressure indicates that hemodynamics
are stable
In practice the conductance-catheter tends to constantly underestimate the left
ventricular bloodvolume The slope factor α should be calculated to correct for this
discrepancy (figure 2) For this purpose an independent volume measurement is needed
obtained in mice by blood flow measurements or echocardiography The slope factor α then
follows from the ratio conductance volumeindependent measured volume Table 1 shows the
results of α determination by echocardiography Slope factor α varied from 03 - 05
depending on the moment of measurement within the cardiac cycle The variance could be
due to the relative inaccuracy of ultrasonographic analyses It could also be inherent to
conductance measurements in the manner as performed Slope factor α deviates from 1
primarily due to the dependency of Gp on left ventricular volume (14) Gp should therefore be
measured continuously within the cardiac cycle to be able to correct adequately for the
variance of α However as the result of technical limitations continuous Gp acquisition is not
yet possible Whenever echocardiography is used end-diastolic volume EDV should be used
for α determination The variance of this calculated α is minor (SEM = 002) and the
correlation relatively high (adjusted R2 = 065)
Chapter 3 Murine left ventricular pressure-volume loops
10
Surgical protocols for PV-loops acquisition
The Sigma SA (CDLeycom Zoetermeer the Netherlands) single segment data
acquisition module was used for assessment of PV-loops The system operated on a constant
excitation current of 30microA to prevent interaction with the murine cardiac conduction system
determined by hypertonic saline injection and subtracted offline CONDUCT 2000 software
(CDLeycom Zoetermeer The Netherlands) was used for data acquisition and Circlab
software (LUMC Leiden The Netherlands) was used for offline data analysis
Invasive hemodynamic measurements of the murine left ventricle can theoretically be
performed by several ways for To date the most frequently reported method is an open-chest
(OC) approach (8) In brief mice are anaesthetized and the anterior thorax and the neck of the
mouse are shaved The animals are fixed on a warming plate Care is taken to maintain body
temperature constant at 37deg Celsius The neck skin of the mouse is opened by a saggital
incision The trachea is exposed to visually guide the intratracheal cannula (20-Gauge) where
after the cannula is connected to a mouse ventilator Minivent type 845 (Hugo Sachs
Electronics Germany) set at 150 strokes per minute and a tidal volume of 250 microl The
external jugular veins are cannulated with a flame-stretched PE-50 catheter for infusion of
saline and drugs The abdomen is opened subcostally The diaphragm is incised by a
transverse substernal approach leaving the pericardium intact The micromanometer is
calibrated with a mercury manometer by placing the sensor in 37deg Celsius normal saline The
left ventricle is entered through an apical stab with a 25 12 G needle immediately followed
by the Millar conductance-micromanometer The catheter is positioned correctly in the left
ventricle under guidance of the online pressure and volume signals The combination of
pressure and volume signals allows accurate positioning of the catheter in the left ventricle
Ventilation is stopped during data acquisition to avoid influence from ventilation of the lungs
on the pressure and volume signals The acquisition protocol consists of measurements of
Chapter 3 Murine left ventricular pressure-volume loops
11
baseline cardiac function hypertonic saline injection (3x) inferior caval vein occlusions with
and without β-adrenergic stimulation (isoproterenol 1000 pg)
This method is theoretically disadvantageous since collaps of the lungs and
destruction of myocardial integrity are induced through the relatively large surgical trauma
Furthermore in myocardial infarction studies the open-chest approach is hampered by
extensive left ventricular remodeling since the scar tissue is not accessible for the
conductance catheter and fails to provide a stable position
A closed-chest (CC) approach would theoretically circumvent several of these
disadvantages Firstly in a closed-chest the lungs remain untouched Secondly the cardiac
position and myocardial structures remain intact Thirdly surgical trauma and hemodynamic
stress would be reduced to a minimum Finally a closed-chest approach would allow accurate
assessment of left ventricular (LV) hemodynamic behavior in mice which underwent transient
or permanent occlusion of the left anterior descending coronary artery The surgical procedure
is similar to the open-chest approach except for the insertion of the conductance catheter into
the left ventricle In brief mice are anaesthetized and the neck and abdomen are shaved Care
is taken to maintain body temperature and ventilation support is provided as above Venous
catheters are placed after which the right common carotid is prepared for insertion of the
ultraminiature conductance-micromanometer The catheter is calibrated and subsequently
inserted into the left ventricle under guidance of the online pressure signal A transverse
abdominal incision without opening the thorax is performed to expose the inferior caval vein
The acquisition protocol is similar as in the open-chest approach
Chapter 3 Murine left ventricular pressure-volume loops
12
Explanation of the pressure-volume loop
The left ventricular PV loop is a two-dimensional representation of a single cardiac
cycle (figure 5) Beginning at end-diastole when the mitral valve closes the ejection phase
starts with pressure build up without actual volume ejection ie the isovolumic contraction
phase Blood is ejected out of the ventricle into the aorta upon opening of the aortic valve and
subsequently left ventricular volume decreases The end of ejection is defined by aortic valve
closure and followed by myocardial relaxation characterized by pressure decrease without
volume change ie the isovolumic relaxation phase The filling phase is initiated with
opening of the mitral valve and rise of ventricular volume The technique of simultaneous left
ventricular pressure and volume measurements provides continuous assessment of cardiac
function
Fig 5 The cardiac cycle in a single pressure-volume loop End-diastole is marked by the
closure of the mitral valves The hearts starts to build up pressure while all valves are closed
(isovolumetric contraction phase) before actual ejection begins following the opening of the
aortic valve Volume decreases while ejection progresses until the aortic valves close (end-
Closure aortic valve
VOLUME
PRES
SUR
E
Figure 5
Opening aortic valve
Isovolumicrelaxation
Isovolumiccontraction
Closure mitral valve
Openingmitral valve
Chapter 3 Murine left ventricular pressure-volume loops
13
systole) and relaxation starts Aortic and mitral valves are closed during relaxation
(isovolumic relaxation phase) The filling phase follows upon the opening of the mitral valve
and volume increase while pressure build up is minor
PV loops reveal in first instance the standard functional parameters (figure 6)
Fig 6 Cardiac performance parameters in the pressure-volume loop ED indicates end-
diastole ES end-systole Ved end-diastolic volume Ves end-systolic volume Ped end-
diastolic pressure Pes end-systolic pressure The area of the PV loop resembles stroke work
(SW) Stroke volume SV can be derived by subtracting Ves from Ved
However specific PV relationships are acquired too (table 2 figure 7) These
relationships describe the contractile and relaxative capabilities of the heart independent of
preload afterload or heart rate Transient occlusion of the inferior caval vein in mice is
performed to obtain these relationships Caval vein occlusion leads to a decrease in venous
return and thereby in preload of the left ventricle The response of the heart is typical as
Figure 6
VOLUME
PRES
SURE
ES
ED
Pes
Ved Ves
Ped
SV
SW
Chapter 3 Murine left ventricular pressure-volume loops
14
presented in figure 7 and shows the PV correlations Contractile parameters derived from PV-
correlations best detect small alterations in contractility in mice (15)
Fig 7 Pressure-volume relationships Variably loaded PV loops are used to define several PV
relationships The variable loading is derived by occluding the inferior caval vein and thereby
reducing venous return The end-systolic PV relationship (ESPVR) describes the contractile
performance of the left ventricle Contractility is linear correlated with the steepness of the
ESPVR slope ie Ees The end-diastolic PV relationship (EDPVR) describes diastolic
performance for instance diastolic distensibility The slope of the EDPVR (β) indicates the
passive chamber stiffness
The end-systolic PV relationship (ESPVR) describes the relation between volume and
pressure changes in systole Within the physiological range this relationship approximates a
straight line The relationship can be described in terms of its slope which reflects myocardial
contractility and its volume axis intercept V0 The volume intercept from the ESPVR line
Figure 7
PRES
SURE ESPVR
VOLUME
EesEes
EDPVRβ
V75
Chapter 3 Murine left ventricular pressure-volume loops
15
could better be taken at a constant pressure level in the physiological range for example
between 50 and 100 mm Hg (16) The volume intercept at a constant pressure (eg V75)
reflects myocardial contractility as it indicates the extent of contraction Increased myocardial
contractility for instance during beta-adrenergic stimulation with isoprenaline results in a
steeper ESPVR-slope and a leftward shift on the volume axis while attenuated contractility
for example during clinical heart failure results in a concomitantly plain slope and a
rightward shift on the volume axis The slope of the ESPVR (Ees) is used to describe the left
ventricular elastance Arterial elastance (Ea) a measure for ventricular afterload is described
by the slope of the relationship between stroke volume and end-systolic pressure (figure 8)
Fig 8 Arterial-ventricular coupling Ventricular elastance is estimated from the end-
systolic PV relationship (ESPVR) slope Ees Arterial elastance (Ea) is approximated by the
stroke volumeend-systolic pressure ratio (Ao Pes-SV relationship) The between Ea and Ees
reflects the coupling between the left ventricle and the arterial circulation The production of
stroke work is maximal when the Ea and Ees are approximately equal
Figure 8
Ea Ees
VOLUME
PRES
SURE
PRESSURE
PV-relat
ion Ao PES ndash SV relation
Chapter 3 Murine left ventricular pressure-volume loops
16
The production of stroke work is maximal when the Ees and Ea are approximately
equal Stroke work attenuates substantially in relation to its maximal value whenever Ea and
Ees differ markedly (1718) The preload-recruitable stroke work (PRSW) is the relationship
between end-diastolic volume and performed stroke work by the ventricle It is a load-
independent measure of contractility related to preload The contractile state of the heart is
resembled by the steepness of the PRSW-slope In a high contractile state the heart is able to
perform more stroke work at a constant end-diastolic volume for instance by augmenting the
ejection fraction
Diastolic function is derived from the end-diastolic PV relationship (EDPVR) which
correlates with the compliance of the ventricular myocardium Diastolic dysfunctioning or
failure is observed by an inappropriate upward shift of the ESPVR The slope of the EDPVR
(β) increases during augmented stiffness of the ventricular wall when pressure rises
progressively more during ventricular filling The opposite occurs in case of increased
compliance Certain cardiac diseases and remodeling processes are correlated with increased
stiffness of the ventricular wall by collagen deposition resulting in an increase of the
EDPVR-slope (19)
Numerous other relationships can be assessed The limits are determined by the
interests and the creativity of the investigator
Chapter 3 Murine left ventricular pressure-volume loops
17
Results of PV-measurements with the open- (OC) and closed-chest (CC) approach
A comparative study was performed to determine scientifically based arguments for
the choice between open- (OC) or closed-chest (CC) PV measurements to examine murine
cardiac function Comparing cardiac performance between OC and CC protocols revealed
overall relatively similar values for the investigated parameters (table 3) The values for LV
volumes were corrected for ρ determined at 124 Ωcm in the used setup (N = 10 12352 plusmn
088 Ωcm) α (N = 13 030) and Vc Vc was determined during all PV experiments by the
hypertonic saline injection method No significant differences could be detected between CC
and OC instrumentation (9469 plusmn 483 microl versus 9272 plusmn 205 microl respectively NS) The 4 microl
30 saline demonstrated to be sufficient to change blood conductivity Moreover as this
volume encompasses only 15 of the normal murine end-diastolic volume it proved to be too
small to influence LV end-diastolic and end-systolic pressures (figure 4) in either OC or CC
mice
Several differences were found between the OC and CC approaches (table 3) Cardiac
function in the OC approach was characterized by higher ejection fractions (EF 69 versus
48 respectively) larger stroke volume (1998 versus 1470 microl respectively) and a leftward
shift in ventricular volume On the contrary measuring cardiac function with an intact thorax
resulted in higher end-systolic pressures (ESP OC 52 versus CC 65 mmHg with urethane
anesthesia) and a higher rate of relaxation as indicated by the dPdtmin No differences were
found in the PV relationships ie the ESPVR EDPVR or PRSW Interestingly the OC
approach did result in a mismatch between arterial afterload and ventricular work The
arterial-ventricular elastance ratio (EaEes) was significantly depressed following opening of
the chest In contrast EaEes ratios were normal (ie ~ 10) in the CC approach under both
regimens This finding is consistently found in open-chest instrumented mice (8) The arterial-
ventricular coupling mismatch was depending on arterial resistance the slope of the ESPVR
Chapter 3 Murine left ventricular pressure-volume loops
18
Table 1 Comparison of volume derived by ultrasonography and conductance
Descriptive statistics of alphaN Min Max Mean SEM
EDV 13 018 045 030 002ESV 13 016 094 051 007SV 13 009 058 026 004
Regression analysis
N
RR2
Adjusted R2
SEE
EDV13
082068065179
ESV13
083069066172
SV13
041017009117
Chapter 3 Murine left ventricular pressure-volume loops
19
Left ventricular volume was measured by both ultrasonography
and conductance in adult C57Bl6 mice End-diastolic end-
systolic and stroke volume were used to obtain alpha (α)
Descriptive analysis shows that α determination at the end-
diastolic moment results in the most consistent mean α Also
the correlation of LV volume values between ultrasonography
and conductance is high as shown by the regression analysis
SEM indicates standard error of the mean SEE standard error
of the estimate
EDVECHO (microl)120100806040200
EDV C
ON
DUC
TAN
CE (micro
l)
18
16
14
12
10
8
6
SCATTERPLOT OF END-DIASTOLIC VOLUMECONDUCTANCE VS ULTRASONOGRAPHY
EDVECHO (microl)120100806040200
EDV C
ON
DUC
TAN
CE (micro
l)
18
16
14
12
10
8
6
EDVECHO (microl)120100806040200
EDV C
ON
DUC
TAN
CE (micro
l)
18
16
14
12
10
8
6
SCATTERPLOT OF END-DIASTOLIC VOLUMECONDUCTANCE VS ULTRASONOGRAPHY
Chapter 3 Murine left ventricular pressure-volume loops
20
Table 2 Parameters derived by pressure-volume loops
Abbreviations DefinitionsGeneral parameters
CI (CI = CObody wt) CO HR
Card iac indexCard iac outputHeart rate
PressuredPdtmax
dPdtmin
PedPesτ
Maximum derivative of change in systolic pressure in timeMaximum derivative of change in diastolic pressure in timeEnd-diastolic pressureEnd-systolic pressureTime constant of isovolumic relaxation
VolumeEFSI (SI = SVbody wt)SVVedVes
Ejection fractionStroke index Stroke volumeEnd-diastolic pressureEnd-systolic pressure
Pressure-volume relationshipsβEa (Ea = PesSV)EDPVREes
Slope of the end-diastolic pressure-volume relat ionshipArterial elastanceEnd-diastolic pressure-volume relat ionshipEnd-systolic ventricular elastance
EmaxESPVR
(slope of the end-systolic pressure-volume relationship)Maximum chamber elasticity (∆P∆V)End-systolic pressure-volume relat ionship
Pressure-volume areaEfficiencyEWPEPRSWPVASWSWI (SWI = SWbody wt)
EWPVAExternal work = SWPotential energyPreload-recruitable stroke workPressure-volume area = EW + PEStroke workStroke work index
Abbreviations DefinitionsGeneral parameters
CI (CI = CObody wt) CO HR
Card iac indexCard iac outputHeart rate
PressuredPdtmax
dPdtmin
PedPesτ
Maximum derivative of change in systolic pressure in timeMaximum derivative of change in diastolic pressure in timeEnd-diastolic pressureEnd-systolic pressureTime constant of isovolumic relaxation
VolumeEFSI (SI = SVbody wt)SVVedVes
Ejection fractionStroke index Stroke volumeEnd-diastolic pressureEnd-systolic pressure
Pressure-volume relationshipsβEa (Ea = PesSV)EDPVREes
Slope of the end-diastolic pressure-volume relat ionshipArterial elastanceEnd-diastolic pressure-volume relat ionshipEnd-systolic ventricular elastance
EmaxESPVR
(slope of the end-systolic pressure-volume relationship)Maximum chamber elasticity (∆P∆V)End-systolic pressure-volume relat ionship
Pressure-volume areaEfficiencyEWPEPRSWPVASWSWI (SWI = SWbody wt)
EWPVAExternal work = SWPotential energyPreload-recruitable stroke workPressure-volume area = EW + PEStroke workStroke work index
EmaxESPVR
(slope of the end-systolic pressure-volume (slope of the end-systolic pressure-volume relationship)Maximum chamber elasticity (∆P∆V)End-systolic pressure-volume relat ionship
Pressure-volume areaEfficiencyEWPEPRSWPVASWSWI (SWI = SWbody wt)
EWPVAExternal work = SWPotential energyPreload-recruitable stroke workPressure-volume area = EW + PEStroke workStroke work index
Chapter 3 Murine left ventricular pressure-volume loops
21
(Ees) proved to be equal in OC and CC instrumented mice The combination of enlarged
stroke volume with attenuated systolic pressures leads to a decrease in arterial elastance The
altered arterial elastance could be explained by the opening of the thorax A drop in overall
peripheral vascular resistance from baseline values has been described during thoracoscopy
(20)
Urethane
Volume (microl)
Pres
sure
(mm
Hg)
Pentobarbital
Volume (microl)
Pres
sure
(mm
Hg)
A
B
CCOCCCCCOCOC
CCOCCCCCOCOC
-100
102030405060708090
-10
0
10
20
30
40
50
60
0 5 10 15 20 25 30 35 400 5 10 15 20 25 30 35 40
0 5 10 15 20 25 30 35 400 5 10 15 20 25 30 35 40
Figure 9
Chapter 3 Murine left ventricular pressure-volume loops
22
Fig 9 Left ventricular pressure-volume loops Pressure presented in mmHg and volume microl
A Representative figure of PV loops acquired during urethane anesthesia in closed chest
(CC) and open chest (OC) instrumented mice B Representative figure of PV loops acquired
during pentobarbital anesthesia in CC and OC instrumented mice Loops are acquired during
an occlusion of the inferior caval vein Venous returns decreases which is represented in the
loops by attenuation of both pressure and volume The differences in ESP SW and ESPVR
between urethane and pentobarbital anesthesia can be observed by analyzing the loops in A
and B The loops show also the larger stroke volume and depressed systolic pressure in OC
instrumented mice
Figure 9 shows representative PV-loops while venous return was attenuated following
inferior caval vein occlusion Typical pressure and volume effects are depicted showing the
absence of apparent differences in PV relationships The mentioned differences in ESP SV
and EF are evident in the presented loops though
ECG recordings were made during both surgical protocols to detect possible heart rate
alterations and arrhythmias Murine left ventricular PV measurements could be distorted by
physiological responses to the catheterization Heart rate alterations could be anticipated
especially in relation to carotid sinus stimulation while cannulating of the carotid artery
However neither bradycardia nor other arrhythmias were observed during either CC or OC
procedures (figure 10) This finding indicates that cannulation of the right common carotid
artery does not alter heart rate by carotid sinus stimulation
Chapter 3 Murine left ventricular pressure-volume loops
23
Table 3 Functional parameters to determine baseline LV functioning in open- and closed-
chest protocols during steady-state measurement
URETHANE PENTOBARBITALOC CC OC CC
N = 5 N = 5 N = 10 N = 10
Mean plusmn SEM Mean plusmn SEM Mean plusmn SEM Mean plusmn SEM
HR 583 plusmn 20 658 plusmn 21 493 plusmn 25 481 plusmn 36SVdagger 1958 plusmn 351 1557 plusmn 254 2018 plusmn 183 1426 plusmn 103CO 12 plusmn 2 10 plusmn 2 10 plusmn 1 7 plusmn 0Vmaxdagger 1761 plusmn 053 2361 plusmn 223 3089 plusmn 289 3883 plusmn 230Vmindagger 215 plusmn 133 679 plusmn 180 1029 plusmn 189 2373 plusmn 199EFdagger 79 plusmn 6 66 plusmn 8 66 plusmn 4 39 plusmn 2
ESPdagger 52 plusmn 4 65 plusmn 5 42 plusmn 3 47 plusmn 4EDP 1 plusmn 1 -1 plusmn 1 -6 plusmn 2 1 plusmn 1
dPdtmax 7200 plusmn 1349 8252 plusmn 1685 4004 plusmn 629 3718 plusmn 684dPdtmindagger -4233 plusmn 531 -7577 plusmn 750 -3631 plusmn 424 -3348 plusmn 653Tau 10 plusmn 0 7 plusmn 0 12 plusmn 1 14 plusmn 2
SW 1066 plusmn 245 1147 plusmn 213 1076 plusmn 176 666 plusmn 116
EaEesdagger 065 plusmn 020 084 plusmn 016 060 plusmn 005 103 plusmn 015ESPVR 570 plusmn 094 589 plusmn 074 347 plusmn 027 318 plusmn 052EDPVR 009 plusmn 009 -008 plusmn 015 -015 plusmn 014 -005 plusmn 015PRSW 79 plusmn 14 64 plusmn 6 68 plusmn 10 53 plusmn 3
Results from LV pressure-volume measurements in C57Bl6 mice anesthetized by urethane or
pentobarbital Urethane versus pentobarbital P lt 005 dagger OC versus CC P lt 005 ρ Valued
124 Ωcm α 030 Open- (OC) and closed-chest (CC) protocols HR indicates heart rate in
bpm SV left ventricular stroke volume in microl CO cardiac output mlmin Vmin minimal left
ventricular volume in microl Vmax maximal left ventricular volume in microl EF ejection fraction in
ESP left ventricular end-systolic pressure in mmHg EDP left ventricular end-diastolic
pressure in mmHg dPdtmax maximal first derivative of left ventricular pressure in mmHgs
dPdtmin minimal first derivative of left ventricular pressure in mmHgs Tau time constant of
left ventricular relaxation in ms SW stroke work in mmHgmicrol Ea arterial elastance Ees
ventricular end-systolic elastance ESPVR left ventricular end-systolic PV relationship in
Chapter 3 Murine left ventricular pressure-volume loops
24
mmHgmicrol EDPVR left ventricular end-diastolic PV relationship in mmHgmicrol PRSW left
ventricular preload-recruitable stroke work in mmHg
The steady-state functional parameters from OC and CC instrumented mice during
either urethane or pentobarbital are also depicted in Table 2 The use of pentobarbital
anesthesia had a cardiodepressive effect that was represented by significant function decline
in most parameters EF dPdtMAX and ESPVR decreased respectively with 24 57 and 41
upon pentobarbital use compared to urethane anesthesia Pentobarbital therefore had strong
negative chronotropic and inotropic effects
Hear
trat
e(b
pm)
Heart rate trace in closed-chest animal
0
100
200
300
400
500
600
700
Time (minutes)
arterial canulation
A
0 1 2 3 4 5 6 7 8 9 10 11 12 13 14 15 16
Heart rate trace in open-chest animal
0
100
200
300
400
500
600
700
Time (minutes)
Hear
trat
e(b
pm)
Ventricular catheterisation
B
0 1 2 3 4 5 6 7 8 9 10 11 12 13 14
Figure 10
Chapter 3 Murine left ventricular pressure-volume loops
25
Fig 10 Heart rate tracings in closed chest and open chest instrumented mice
A Representative figure of a heart rate tracing in a closed-chest instrumented mouse The
moment of arterial cannulation is indicated Some arrhythmias are seen in response to
introduction of the catheter into the left ventricle Arrhythmias are only present in a short
time-period that is part of the stabilization period following catheter introduction Heart rate
remains unchanged during the measurements B Representative figure of a heart rate tracing
in an open-chest instrumented mouse Somewhat more pronounced chronotropic arrhythmias
are seen in response to ventricular introduction of the catheter by apical stab However no
significant brady- or tachycardias are present during the measurements
Chapter 3 Murine left ventricular pressure-volume loops
26
Discussion
In this chapter OC and CC protocols for in vivo left ventricular PV relationship
measurement are described and discussed Murine cardiac function determination via these
methods is sensitive reproducible and comparable The choice for open- or closed-chest PV
measurements in mice depends on the aim of the study with regards to the specific cardiac
pathology The OC approach is technically less complicated and less time consuming Main
characteristics of the OC model itself are low systolic pressures and arterial resistance The
OC approach could best be used in studies where myocardial integrity is not at stake
Particularly ischemiareperfusion studies regarding myocardial integrity are probably better
done using the CC approach
Assessment of cardiac performance in genetically engineered mice is indispensable to
understand human cardiovascular pathologies In general the synergistic features of cardiac
diseases such as hypertrophy and cell death affect cardiac function negatively The
contractile performance of the heart deteriorates which is reflected in the attenuation of
systolic parameters as ejection fraction stroke work and PV-relationships Furthermore
ventricular relaxation prolongs and diastolic filling becomes impaired The progression of
cardiac disease ultimately results in clinical heart failure which is defined by the inability of
the heart to meet hemodynamic demands of the body and is characterized by specific signs
and symptoms (21) The most important parameter of cardiac performance which defines
heart failure is cardiac output
The influence on cardiac performance of specific genes and proteins in the
development of cardiac diseases ought to be investigated extensively to assess their clinical
relevance Various techniques have been used to assess cardiac performance in mice The
main techniques will be discussed in brief
Chapter 3 Murine left ventricular pressure-volume loops
27
Echocardiography is the most widely used noninvasive technique to determine cardiac
performance in mice High-frequency transthoracic and transesophageal transducers are used
as effective tools for two-dimensional and Doppler imaging of ventricular wall structures
dimensions and volumes of cavum and cardiac function (2223) Full-conscious or gas-
anesthesia experiments are preferred for echocardiographic assessment of cardiac function in
mice (2425) There is no limit to the diversity of murine models investigated by this general
accepted method of cardiac performance assessment However the most questionable aspect
of these measurements is the significant inter- and intraobservator variance in the
measurements
Isolated working mouse heart measurements in a Langendorf perfusion setup are a
technique for ex vivo cardiac function measurements approximating the in vivo function level
(5) Cardiac output developed left ventricular pressure and first derivates of maximal and
minimal pressures are some of the parameters that can be derived Isolated working heart
measurements are especially useful to study the acute effects of ischemic preconditioning and
ischemia-induced apoptosis(2627) Metabolites of interest can be measured accurately in the
perfusion fluid Disadvantages are the impossibility of chronic studies and the
unphysiological situation of ex vivo cardiac function measurements
Aortic flow measurements by means of a flow-probe have been used in several
studies (2829) Aortic flow acquisition is a validated technique and reveals functional
parameters as cardiac output stroke volume and blood flow velocity However several
disadvantages oppose against this technique Firstly aortic flow measurements are invasive
(ie thoracotomy or laparotomy) and result solely in aortic derived volume parameters
Integrated ventricular function cannot be assessed More importantly the exact localization of
the flow probe around the aorta is the critical determinant of the systematic error made by
these measurements Flow probes have been placed around the ascending and descending
Chapter 3 Murine left ventricular pressure-volume loops
28
thoracic aorta and the abdominal aorta The percentage of total cardiac output passing the
flow probe on the specific location has to be estimated Flow probes located at the ascending
aorta correct for coronary circulation and for instance bloodvolume passing the descending
thoracic aorta has been estimated to be around 75 of total cardiac output (30) The estimated
correction factor provides lsquoabsolutersquo stroke volume instead of absolute LV cavum volumes
and does not correct for cardiophysiological changes Altered cardiophysiological situations
could theoretically influence the relative amount of bloodvolume passing the flow probe On
the other hand major advances are the possibility of chronic cardiac function measurements
and the relative facile manner of data acquirement(29) Moreover aortic flow probe
measurements are not hampered by deleterious cardiac remodeling in myocardial ischemia or
hypertrophy studies(2829)
The newly developed method of cardiac performance assessment by in vivo left
ventricular PV measurements in the CC model is introduced here Left ventricular PV
measurements in vivo provide an accurate assessment of murine cardiac function The method
is highly sensitive during open- and closed-chest approaches in determining alterations in left
ventricular function as result of cardiac disease or altered hemodynamic stress The
characteristics of simultaneous left ventricular pressure and volume measurements enable the
researcher to directly investigate pressure-related cardiac diseases as cardiac hypertrophy and
restrictive cardiomyopathy (31) or volume-related diseases as dilated cardiomyopathy (32)
Moreover the effective influence of both aspects of cardiac disease on each other can be
observed in detail For instance ventricular dilation and subsequent decrease in ventricular
systolic pressure is mapped accurately in PV-loops Continuous measurements provide
possibilities to investigate the complete cardiac cycle Basic aspects of cardiac physiology can
be visualized using PV-loops in mice (81533-35) For instance increase in ventricular filling
is followed by an increase in ejection fraction according to the Frank-Starling mechanism
Chapter 3 Murine left ventricular pressure-volume loops
29
The opposite is seen as a result of gradual venous return decrease in the case of transient caval
vein occlusion (figure 7 amp 9) Moreover the distinction between systolic and diastolic failure
can be made through continuous PV-measurements (19) Systolic heart failure encompasses
mainly an ejection dysfunction with impaired contractility Both aspects are obtained by and
directly visualized through PV-loops Additionally the definite diagnosis of diastolic failure
is dependent on the observation of an inappropriate upward shift of the (end-)diastolic PV
relationship requiring cardiac catheterization for continuous volume determinations using
impedance measurements and high-fidelity measurements of ventricular pressure with a
micromanometer (19) PV-loops are useful determining cardiac performance within the
complete continuum of healthy and diseased hearts
Chapter 3 Murine left ventricular pressure-volume loops
30
Conclusion
In vivo PV measurements provide an essential tool in the assessment of cardiac
function in genetically modified mice Open- and closed-chest surgical protocols for murine
cardiac function determination are sensitive reproducible and comparable PV-loops enable
the researcher to accurately investigate diverse murine models of cardiac pathology by
adequately visualizing the cause-and-effect relationship between genetic modification and
their functional outcome Changes in ventricular contractility are best detected by PV derived
parameters in comparison to other methods of cardiac function determination
Chapter 3 Murine left ventricular pressure-volume loops
31
References
1 Doevendans PA Daemen MJ de Muinck ED Smits JF Cardiovascular phenotypingin mice Cardiovasc Res 19983934-49
2 Hoit BD New approaches to phenotypic analysis in adult mice J Mol Cell Cardiol20013327-35
3 Chacko VP Aresta F Chacko SM Weiss RG MRIMRS assessment of in vivomurine cardiac metabolism morphology and function at physiological heart rates AmJ Physiol Heart Circ Physiol 2000279H2218-24
4 Tanaka N Dalton N Mao L et al Transthoracic echocardiography in models ofcardiac disease in the mouse Circulation 1996941109-17
5 De Windt LJ Willems J Reneman RS Van der Vusse GJ Arts T Van Bilsen M Animproved isolated left ventricular ejecting murine heart model Functional andmetabolic evaluation Pflugers Arch 1999437182-90
6 Palmen M Daemen MJ Buehler A et al Impaired cardiac remodeling and functionafter myocardial infarction in FGF-1 transgenic mice Circulation 1999100250
7 Rockman HA Hamilton RA Jones LR Milano CA Mao L Lefkowitz RJ Enhancedmyocardial relaxation in vivo in transgenic mice overexpressing the beta2-adrenergicreceptor is associated with reduced phospholamban protein J Clin Invest1996971618-23
8 Georgakopoulos D Mitzner WA Chen CH et al In vivo murine left ventricularpressure-volume relations by miniaturized conductance micromanometry Am JPhysiol 1998274H1416-22
9 Dekker AL Geskes GG Cramers AA et al Right ventricular support for off-pumpcoronary artery bypass grafting studied with bi-ventricular pressure-volume loops insheep Eur J Cardiothorac Surg 200119179-84
10 Schreuder JJ Steendijk P van der Veen FH et al Acute and short-term effects ofpartial left ventriculectomy in dilated cardiomyopathy assessment by pressure-volumeloops J Am Coll Cardiol 2000362104-14
11 Zimmer HG Measurement of left ventricular hemodynamic parameters in closed-chest rats under control and various pathophysiologic conditions Basic Res Cardiol19837877-84
12 Georgakopoulos D Kass DA Estimation of parallel conductance by dual-frequencyconductance catheter in mice Am J Physiol Heart Circ Physiol 2000279H443-50
13 Feldman MD Mao Y Valvano JW Pearce JA Freeman GL Development of amultifrequency conductance catheter-based system to determine LV function in miceAm J Physiol Heart Circ Physiol 2000279H1411-20
14 Kornet L Schreuder JJ Van de Velden ET Jansen JR The volume-dependency ofparallel conductance throughout the cardiac cycle and its consequence for volumeestimation of the left ventricle in patients Cardiovasc Res 200151729-35
15 Nemoto S DeFreitas G Mann DL Carabello BA Effects of changes in leftventricular contractility on indexes of contractility in mice Am J Physiol Heart CircPhysiol 2002283H2504-10
16 Baan J Van de Velden ET Steendijk P Ventricular pressure-volume relations in vivoEur Heart J 199213 SupplE2-6
17 Little WC Cheng CP Left ventricular-arterial coupling in conscious dogs Am JPhysiol 1991261H70-6
18 Sunagawa K Maughan WL Sagawa K Optimal arterial resistance for the maximalstroke work studied in isolated canine left ventricle Circ Res 198556586-95
Chapter 3 Murine left ventricular pressure-volume loops
32
19 Van Kraaij D Van Pol P Ruiters AW et al Diagnosing diastolic heart failure Eur JHeart Fail 20024419-30
20 Faunt KK Cohn LA Jones BD Dodam JR Cardiopulmonary effects of bilateralhemithorax ventilation and diagnostic thoracoscopy in dogs Am J Vet Res1998591494-8
21 Lips DJ Van Kraaij DL De Windt LJ Doevendans PA Molecular determinants ofmyocardial hypertrophy and failure alternative pathways for beneficial andmaladaptive hypertrophy Eur Heart J 200324883-96
22 Collins KA Korcarz CE Lang RM Use of echocardiography for the phenotypicassessment of genetically altered mice Physiol Genomics 200313227-39
23 Scherrer-Crosbie M Steudel W Hunziker PR et al Determination of right ventricularstructure and function in normoxic and hypoxic mice a transesophagealechocardiographic study Circulation 1998981015-21
24 Takuma S Suehiro K Cardinale C et al Anesthetic inhibition in ischemic andnonischemic murine heart comparison with conscious echocardiographic approachAm J Physiol Heart Circ Physiol 2001280H2364-70
25 Chaves AA Weinstein DM Bauer JA Non-invasive echocardiographic studies inmice influence of anesthetic regimen Life Sci 200169213-22
26 Yamaura G Turoczi T Yamamoto F Siddqui MA Maulik N Das DK STATsignaling in ischemic heart a role of STAT5A in ischemic preconditioning Am JPhysiol Heart Circ Physiol 2003285H476-82
27 Bell RM Yellon DM Atorvastatin administered at the onset of reperfusion andindependent of lipid lowering protects the myocardium by up-regulating a pro-survival pathway J Am Coll Cardiol 200341508-15
28 Aartsen WM Schuijt MP Danser AH Daemen MJ Smits JF The role of locallyexpressed angiotensin converting enzyme in cardiac remodeling after myocardialinfarction in mice Cardiovasc Res 200256205-13
29 Janssen B Debets J Leenders P Smits J Chronic measurement of cardiac output inconscious mice Am J Physiol Regul Integr Comp Physiol 2002282R928-35
30 Georgakopoulos D Christe ME Giewat M Seidman CM Seidman JG Kass DA Thepathogenesis of familial hypertrophic cardiomyopathy early and evolving effects froman alpha-cardiac myosin heavy chain missense mutation Nat Med 19995327-30
31 Liao P Georgakopoulos D Kovacs A et al The in vivo role of p38 MAP kinases incardiac remodeling and restrictive cardiomyopathy Proc Natl Acad Sci U S A20019812283-8
32 McConnell BK Jones KA Fatkin D et al Dilated cardiomyopathy in homozygousmyosin-binding protein-C mutant mice J Clin Invest 19991041235-44
33 Georgakopoulos D Kass DA Minimal force-frequency modulation of inotropy andrelaxation of in situ murine heart J Physiol 2001534535-45
34 Yang B Larson DF Watson R Age-related left ventricular function in the mouseanalysis based on in vivo pressure-volume relationships Am J Physiol1999277H1906-13
35 Reyes M Freeman GL Escobedo D Lee S Steinhelper ME Feldman MDEnhancement of contractility with sustained afterload in the intact murine heartblunting of length-dependent activation Circulation 20031072962-8
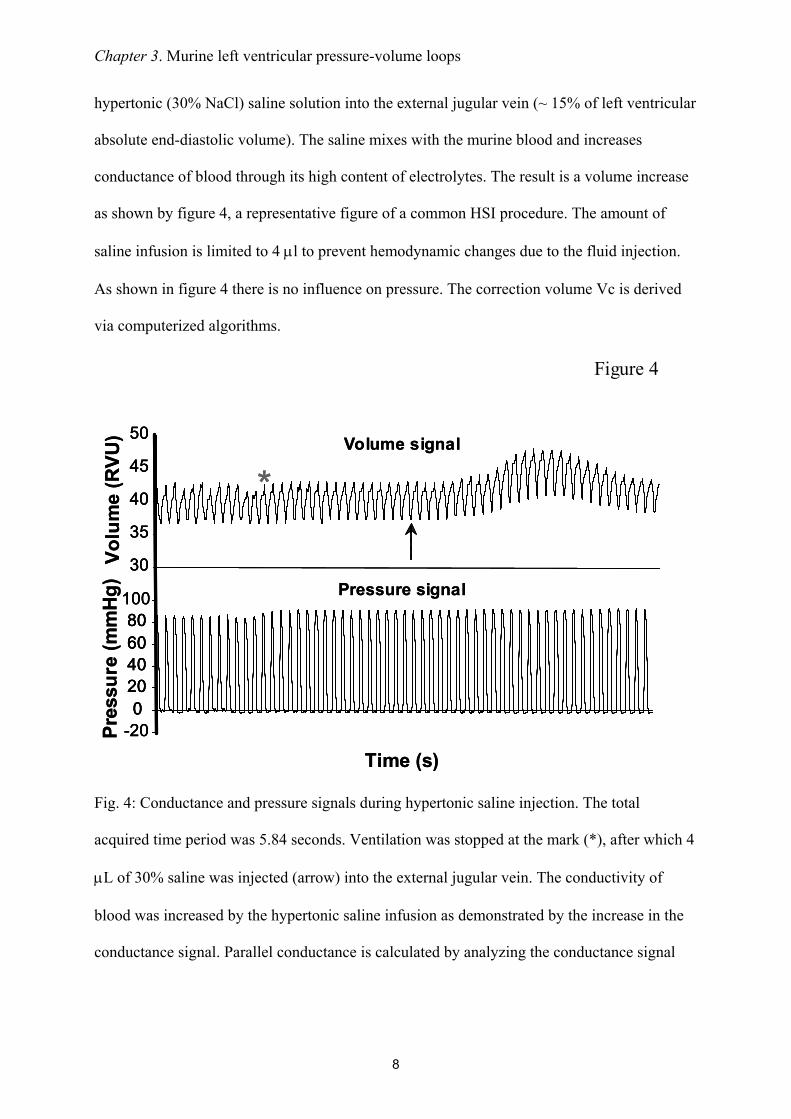
Chapter 3 Murine left ventricular pressure-volume loops
8
hypertonic (30 NaCl) saline solution into the external jugular vein (~ 15 of left ventricular
absolute end-diastolic volume) The saline mixes with the murine blood and increases
conductance of blood through its high content of electrolytes The result is a volume increase
as shown by figure 4 a representative figure of a common HSI procedure The amount of
saline infusion is limited to 4 microl to prevent hemodynamic changes due to the fluid injection
As shown in figure 4 there is no influence on pressure The correction volume Vc is derived
via computerized algorithms
Fig 4 Conductance and pressure signals during hypertonic saline injection The total
acquired time period was 584 seconds Ventilation was stopped at the mark () after which 4
microL of 30 saline was injected (arrow) into the external jugular vein The conductivity of
blood was increased by the hypertonic saline infusion as demonstrated by the increase in the
conductance signal Parallel conductance is calculated by analyzing the conductance signal
Volu
me
(RVU
) Volume signal
30
35
40
45
50
Pressure signal
-200
20406080
100
Time (s)
Pres
sure
(mm
Hg)
Volu
me
(RVU
) Volume signal
30
35
40
45
50
30
35
40
45
50
Pressure signal
-200
20406080
100
-200
20406080
020406080
100
Time (s)
Pres
sure
(mm
Hg)
Figure 4
Chapter 3 Murine left ventricular pressure-volume loops
9
obtained during wash-in of the saline The unchanged pressure indicates that hemodynamics
are stable
In practice the conductance-catheter tends to constantly underestimate the left
ventricular bloodvolume The slope factor α should be calculated to correct for this
discrepancy (figure 2) For this purpose an independent volume measurement is needed
obtained in mice by blood flow measurements or echocardiography The slope factor α then
follows from the ratio conductance volumeindependent measured volume Table 1 shows the
results of α determination by echocardiography Slope factor α varied from 03 - 05
depending on the moment of measurement within the cardiac cycle The variance could be
due to the relative inaccuracy of ultrasonographic analyses It could also be inherent to
conductance measurements in the manner as performed Slope factor α deviates from 1
primarily due to the dependency of Gp on left ventricular volume (14) Gp should therefore be
measured continuously within the cardiac cycle to be able to correct adequately for the
variance of α However as the result of technical limitations continuous Gp acquisition is not
yet possible Whenever echocardiography is used end-diastolic volume EDV should be used
for α determination The variance of this calculated α is minor (SEM = 002) and the
correlation relatively high (adjusted R2 = 065)
Chapter 3 Murine left ventricular pressure-volume loops
10
Surgical protocols for PV-loops acquisition
The Sigma SA (CDLeycom Zoetermeer the Netherlands) single segment data
acquisition module was used for assessment of PV-loops The system operated on a constant
excitation current of 30microA to prevent interaction with the murine cardiac conduction system
determined by hypertonic saline injection and subtracted offline CONDUCT 2000 software
(CDLeycom Zoetermeer The Netherlands) was used for data acquisition and Circlab
software (LUMC Leiden The Netherlands) was used for offline data analysis
Invasive hemodynamic measurements of the murine left ventricle can theoretically be
performed by several ways for To date the most frequently reported method is an open-chest
(OC) approach (8) In brief mice are anaesthetized and the anterior thorax and the neck of the
mouse are shaved The animals are fixed on a warming plate Care is taken to maintain body
temperature constant at 37deg Celsius The neck skin of the mouse is opened by a saggital
incision The trachea is exposed to visually guide the intratracheal cannula (20-Gauge) where
after the cannula is connected to a mouse ventilator Minivent type 845 (Hugo Sachs
Electronics Germany) set at 150 strokes per minute and a tidal volume of 250 microl The
external jugular veins are cannulated with a flame-stretched PE-50 catheter for infusion of
saline and drugs The abdomen is opened subcostally The diaphragm is incised by a
transverse substernal approach leaving the pericardium intact The micromanometer is
calibrated with a mercury manometer by placing the sensor in 37deg Celsius normal saline The
left ventricle is entered through an apical stab with a 25 12 G needle immediately followed
by the Millar conductance-micromanometer The catheter is positioned correctly in the left
ventricle under guidance of the online pressure and volume signals The combination of
pressure and volume signals allows accurate positioning of the catheter in the left ventricle
Ventilation is stopped during data acquisition to avoid influence from ventilation of the lungs
on the pressure and volume signals The acquisition protocol consists of measurements of
Chapter 3 Murine left ventricular pressure-volume loops
11
baseline cardiac function hypertonic saline injection (3x) inferior caval vein occlusions with
and without β-adrenergic stimulation (isoproterenol 1000 pg)
This method is theoretically disadvantageous since collaps of the lungs and
destruction of myocardial integrity are induced through the relatively large surgical trauma
Furthermore in myocardial infarction studies the open-chest approach is hampered by
extensive left ventricular remodeling since the scar tissue is not accessible for the
conductance catheter and fails to provide a stable position
A closed-chest (CC) approach would theoretically circumvent several of these
disadvantages Firstly in a closed-chest the lungs remain untouched Secondly the cardiac
position and myocardial structures remain intact Thirdly surgical trauma and hemodynamic
stress would be reduced to a minimum Finally a closed-chest approach would allow accurate
assessment of left ventricular (LV) hemodynamic behavior in mice which underwent transient
or permanent occlusion of the left anterior descending coronary artery The surgical procedure
is similar to the open-chest approach except for the insertion of the conductance catheter into
the left ventricle In brief mice are anaesthetized and the neck and abdomen are shaved Care
is taken to maintain body temperature and ventilation support is provided as above Venous
catheters are placed after which the right common carotid is prepared for insertion of the
ultraminiature conductance-micromanometer The catheter is calibrated and subsequently
inserted into the left ventricle under guidance of the online pressure signal A transverse
abdominal incision without opening the thorax is performed to expose the inferior caval vein
The acquisition protocol is similar as in the open-chest approach
Chapter 3 Murine left ventricular pressure-volume loops
12
Explanation of the pressure-volume loop
The left ventricular PV loop is a two-dimensional representation of a single cardiac
cycle (figure 5) Beginning at end-diastole when the mitral valve closes the ejection phase
starts with pressure build up without actual volume ejection ie the isovolumic contraction
phase Blood is ejected out of the ventricle into the aorta upon opening of the aortic valve and
subsequently left ventricular volume decreases The end of ejection is defined by aortic valve
closure and followed by myocardial relaxation characterized by pressure decrease without
volume change ie the isovolumic relaxation phase The filling phase is initiated with
opening of the mitral valve and rise of ventricular volume The technique of simultaneous left
ventricular pressure and volume measurements provides continuous assessment of cardiac
function
Fig 5 The cardiac cycle in a single pressure-volume loop End-diastole is marked by the
closure of the mitral valves The hearts starts to build up pressure while all valves are closed
(isovolumetric contraction phase) before actual ejection begins following the opening of the
aortic valve Volume decreases while ejection progresses until the aortic valves close (end-
Closure aortic valve
VOLUME
PRES
SUR
E
Figure 5
Opening aortic valve
Isovolumicrelaxation
Isovolumiccontraction
Closure mitral valve
Openingmitral valve
Chapter 3 Murine left ventricular pressure-volume loops
13
systole) and relaxation starts Aortic and mitral valves are closed during relaxation
(isovolumic relaxation phase) The filling phase follows upon the opening of the mitral valve
and volume increase while pressure build up is minor
PV loops reveal in first instance the standard functional parameters (figure 6)
Fig 6 Cardiac performance parameters in the pressure-volume loop ED indicates end-
diastole ES end-systole Ved end-diastolic volume Ves end-systolic volume Ped end-
diastolic pressure Pes end-systolic pressure The area of the PV loop resembles stroke work
(SW) Stroke volume SV can be derived by subtracting Ves from Ved
However specific PV relationships are acquired too (table 2 figure 7) These
relationships describe the contractile and relaxative capabilities of the heart independent of
preload afterload or heart rate Transient occlusion of the inferior caval vein in mice is
performed to obtain these relationships Caval vein occlusion leads to a decrease in venous
return and thereby in preload of the left ventricle The response of the heart is typical as
Figure 6
VOLUME
PRES
SURE
ES
ED
Pes
Ved Ves
Ped
SV
SW
Chapter 3 Murine left ventricular pressure-volume loops
14
presented in figure 7 and shows the PV correlations Contractile parameters derived from PV-
correlations best detect small alterations in contractility in mice (15)
Fig 7 Pressure-volume relationships Variably loaded PV loops are used to define several PV
relationships The variable loading is derived by occluding the inferior caval vein and thereby
reducing venous return The end-systolic PV relationship (ESPVR) describes the contractile
performance of the left ventricle Contractility is linear correlated with the steepness of the
ESPVR slope ie Ees The end-diastolic PV relationship (EDPVR) describes diastolic
performance for instance diastolic distensibility The slope of the EDPVR (β) indicates the
passive chamber stiffness
The end-systolic PV relationship (ESPVR) describes the relation between volume and
pressure changes in systole Within the physiological range this relationship approximates a
straight line The relationship can be described in terms of its slope which reflects myocardial
contractility and its volume axis intercept V0 The volume intercept from the ESPVR line
Figure 7
PRES
SURE ESPVR
VOLUME
EesEes
EDPVRβ
V75
Chapter 3 Murine left ventricular pressure-volume loops
15
could better be taken at a constant pressure level in the physiological range for example
between 50 and 100 mm Hg (16) The volume intercept at a constant pressure (eg V75)
reflects myocardial contractility as it indicates the extent of contraction Increased myocardial
contractility for instance during beta-adrenergic stimulation with isoprenaline results in a
steeper ESPVR-slope and a leftward shift on the volume axis while attenuated contractility
for example during clinical heart failure results in a concomitantly plain slope and a
rightward shift on the volume axis The slope of the ESPVR (Ees) is used to describe the left
ventricular elastance Arterial elastance (Ea) a measure for ventricular afterload is described
by the slope of the relationship between stroke volume and end-systolic pressure (figure 8)
Fig 8 Arterial-ventricular coupling Ventricular elastance is estimated from the end-
systolic PV relationship (ESPVR) slope Ees Arterial elastance (Ea) is approximated by the
stroke volumeend-systolic pressure ratio (Ao Pes-SV relationship) The between Ea and Ees
reflects the coupling between the left ventricle and the arterial circulation The production of
stroke work is maximal when the Ea and Ees are approximately equal
Figure 8
Ea Ees
VOLUME
PRES
SURE
PRESSURE
PV-relat
ion Ao PES ndash SV relation
Chapter 3 Murine left ventricular pressure-volume loops
16
The production of stroke work is maximal when the Ees and Ea are approximately
equal Stroke work attenuates substantially in relation to its maximal value whenever Ea and
Ees differ markedly (1718) The preload-recruitable stroke work (PRSW) is the relationship
between end-diastolic volume and performed stroke work by the ventricle It is a load-
independent measure of contractility related to preload The contractile state of the heart is
resembled by the steepness of the PRSW-slope In a high contractile state the heart is able to
perform more stroke work at a constant end-diastolic volume for instance by augmenting the
ejection fraction
Diastolic function is derived from the end-diastolic PV relationship (EDPVR) which
correlates with the compliance of the ventricular myocardium Diastolic dysfunctioning or
failure is observed by an inappropriate upward shift of the ESPVR The slope of the EDPVR
(β) increases during augmented stiffness of the ventricular wall when pressure rises
progressively more during ventricular filling The opposite occurs in case of increased
compliance Certain cardiac diseases and remodeling processes are correlated with increased
stiffness of the ventricular wall by collagen deposition resulting in an increase of the
EDPVR-slope (19)
Numerous other relationships can be assessed The limits are determined by the
interests and the creativity of the investigator
Chapter 3 Murine left ventricular pressure-volume loops
17
Results of PV-measurements with the open- (OC) and closed-chest (CC) approach
A comparative study was performed to determine scientifically based arguments for
the choice between open- (OC) or closed-chest (CC) PV measurements to examine murine
cardiac function Comparing cardiac performance between OC and CC protocols revealed
overall relatively similar values for the investigated parameters (table 3) The values for LV
volumes were corrected for ρ determined at 124 Ωcm in the used setup (N = 10 12352 plusmn
088 Ωcm) α (N = 13 030) and Vc Vc was determined during all PV experiments by the
hypertonic saline injection method No significant differences could be detected between CC
and OC instrumentation (9469 plusmn 483 microl versus 9272 plusmn 205 microl respectively NS) The 4 microl
30 saline demonstrated to be sufficient to change blood conductivity Moreover as this
volume encompasses only 15 of the normal murine end-diastolic volume it proved to be too
small to influence LV end-diastolic and end-systolic pressures (figure 4) in either OC or CC
mice
Several differences were found between the OC and CC approaches (table 3) Cardiac
function in the OC approach was characterized by higher ejection fractions (EF 69 versus
48 respectively) larger stroke volume (1998 versus 1470 microl respectively) and a leftward
shift in ventricular volume On the contrary measuring cardiac function with an intact thorax
resulted in higher end-systolic pressures (ESP OC 52 versus CC 65 mmHg with urethane
anesthesia) and a higher rate of relaxation as indicated by the dPdtmin No differences were
found in the PV relationships ie the ESPVR EDPVR or PRSW Interestingly the OC
approach did result in a mismatch between arterial afterload and ventricular work The
arterial-ventricular elastance ratio (EaEes) was significantly depressed following opening of
the chest In contrast EaEes ratios were normal (ie ~ 10) in the CC approach under both
regimens This finding is consistently found in open-chest instrumented mice (8) The arterial-
ventricular coupling mismatch was depending on arterial resistance the slope of the ESPVR
Chapter 3 Murine left ventricular pressure-volume loops
18
Table 1 Comparison of volume derived by ultrasonography and conductance
Descriptive statistics of alphaN Min Max Mean SEM
EDV 13 018 045 030 002ESV 13 016 094 051 007SV 13 009 058 026 004
Regression analysis
N
RR2
Adjusted R2
SEE
EDV13
082068065179
ESV13
083069066172
SV13
041017009117
Chapter 3 Murine left ventricular pressure-volume loops
19
Left ventricular volume was measured by both ultrasonography
and conductance in adult C57Bl6 mice End-diastolic end-
systolic and stroke volume were used to obtain alpha (α)
Descriptive analysis shows that α determination at the end-
diastolic moment results in the most consistent mean α Also
the correlation of LV volume values between ultrasonography
and conductance is high as shown by the regression analysis
SEM indicates standard error of the mean SEE standard error
of the estimate
EDVECHO (microl)120100806040200
EDV C
ON
DUC
TAN
CE (micro
l)
18
16
14
12
10
8
6
SCATTERPLOT OF END-DIASTOLIC VOLUMECONDUCTANCE VS ULTRASONOGRAPHY
EDVECHO (microl)120100806040200
EDV C
ON
DUC
TAN
CE (micro
l)
18
16
14
12
10
8
6
EDVECHO (microl)120100806040200
EDV C
ON
DUC
TAN
CE (micro
l)
18
16
14
12
10
8
6
SCATTERPLOT OF END-DIASTOLIC VOLUMECONDUCTANCE VS ULTRASONOGRAPHY
Chapter 3 Murine left ventricular pressure-volume loops
20
Table 2 Parameters derived by pressure-volume loops
Abbreviations DefinitionsGeneral parameters
CI (CI = CObody wt) CO HR
Card iac indexCard iac outputHeart rate
PressuredPdtmax
dPdtmin
PedPesτ
Maximum derivative of change in systolic pressure in timeMaximum derivative of change in diastolic pressure in timeEnd-diastolic pressureEnd-systolic pressureTime constant of isovolumic relaxation
VolumeEFSI (SI = SVbody wt)SVVedVes
Ejection fractionStroke index Stroke volumeEnd-diastolic pressureEnd-systolic pressure
Pressure-volume relationshipsβEa (Ea = PesSV)EDPVREes
Slope of the end-diastolic pressure-volume relat ionshipArterial elastanceEnd-diastolic pressure-volume relat ionshipEnd-systolic ventricular elastance
EmaxESPVR
(slope of the end-systolic pressure-volume relationship)Maximum chamber elasticity (∆P∆V)End-systolic pressure-volume relat ionship
Pressure-volume areaEfficiencyEWPEPRSWPVASWSWI (SWI = SWbody wt)
EWPVAExternal work = SWPotential energyPreload-recruitable stroke workPressure-volume area = EW + PEStroke workStroke work index
Abbreviations DefinitionsGeneral parameters
CI (CI = CObody wt) CO HR
Card iac indexCard iac outputHeart rate
PressuredPdtmax
dPdtmin
PedPesτ
Maximum derivative of change in systolic pressure in timeMaximum derivative of change in diastolic pressure in timeEnd-diastolic pressureEnd-systolic pressureTime constant of isovolumic relaxation
VolumeEFSI (SI = SVbody wt)SVVedVes
Ejection fractionStroke index Stroke volumeEnd-diastolic pressureEnd-systolic pressure
Pressure-volume relationshipsβEa (Ea = PesSV)EDPVREes
Slope of the end-diastolic pressure-volume relat ionshipArterial elastanceEnd-diastolic pressure-volume relat ionshipEnd-systolic ventricular elastance
EmaxESPVR
(slope of the end-systolic pressure-volume relationship)Maximum chamber elasticity (∆P∆V)End-systolic pressure-volume relat ionship
Pressure-volume areaEfficiencyEWPEPRSWPVASWSWI (SWI = SWbody wt)
EWPVAExternal work = SWPotential energyPreload-recruitable stroke workPressure-volume area = EW + PEStroke workStroke work index
EmaxESPVR
(slope of the end-systolic pressure-volume (slope of the end-systolic pressure-volume relationship)Maximum chamber elasticity (∆P∆V)End-systolic pressure-volume relat ionship
Pressure-volume areaEfficiencyEWPEPRSWPVASWSWI (SWI = SWbody wt)
EWPVAExternal work = SWPotential energyPreload-recruitable stroke workPressure-volume area = EW + PEStroke workStroke work index
Chapter 3 Murine left ventricular pressure-volume loops
21
(Ees) proved to be equal in OC and CC instrumented mice The combination of enlarged
stroke volume with attenuated systolic pressures leads to a decrease in arterial elastance The
altered arterial elastance could be explained by the opening of the thorax A drop in overall
peripheral vascular resistance from baseline values has been described during thoracoscopy
(20)
Urethane
Volume (microl)
Pres
sure
(mm
Hg)
Pentobarbital
Volume (microl)
Pres
sure
(mm
Hg)
A
B
CCOCCCCCOCOC
CCOCCCCCOCOC
-100
102030405060708090
-10
0
10
20
30
40
50
60
0 5 10 15 20 25 30 35 400 5 10 15 20 25 30 35 40
0 5 10 15 20 25 30 35 400 5 10 15 20 25 30 35 40
Figure 9
Chapter 3 Murine left ventricular pressure-volume loops
22
Fig 9 Left ventricular pressure-volume loops Pressure presented in mmHg and volume microl
A Representative figure of PV loops acquired during urethane anesthesia in closed chest
(CC) and open chest (OC) instrumented mice B Representative figure of PV loops acquired
during pentobarbital anesthesia in CC and OC instrumented mice Loops are acquired during
an occlusion of the inferior caval vein Venous returns decreases which is represented in the
loops by attenuation of both pressure and volume The differences in ESP SW and ESPVR
between urethane and pentobarbital anesthesia can be observed by analyzing the loops in A
and B The loops show also the larger stroke volume and depressed systolic pressure in OC
instrumented mice
Figure 9 shows representative PV-loops while venous return was attenuated following
inferior caval vein occlusion Typical pressure and volume effects are depicted showing the
absence of apparent differences in PV relationships The mentioned differences in ESP SV
and EF are evident in the presented loops though
ECG recordings were made during both surgical protocols to detect possible heart rate
alterations and arrhythmias Murine left ventricular PV measurements could be distorted by
physiological responses to the catheterization Heart rate alterations could be anticipated
especially in relation to carotid sinus stimulation while cannulating of the carotid artery
However neither bradycardia nor other arrhythmias were observed during either CC or OC
procedures (figure 10) This finding indicates that cannulation of the right common carotid
artery does not alter heart rate by carotid sinus stimulation
Chapter 3 Murine left ventricular pressure-volume loops
23
Table 3 Functional parameters to determine baseline LV functioning in open- and closed-
chest protocols during steady-state measurement
URETHANE PENTOBARBITALOC CC OC CC
N = 5 N = 5 N = 10 N = 10
Mean plusmn SEM Mean plusmn SEM Mean plusmn SEM Mean plusmn SEM
HR 583 plusmn 20 658 plusmn 21 493 plusmn 25 481 plusmn 36SVdagger 1958 plusmn 351 1557 plusmn 254 2018 plusmn 183 1426 plusmn 103CO 12 plusmn 2 10 plusmn 2 10 plusmn 1 7 plusmn 0Vmaxdagger 1761 plusmn 053 2361 plusmn 223 3089 plusmn 289 3883 plusmn 230Vmindagger 215 plusmn 133 679 plusmn 180 1029 plusmn 189 2373 plusmn 199EFdagger 79 plusmn 6 66 plusmn 8 66 plusmn 4 39 plusmn 2
ESPdagger 52 plusmn 4 65 plusmn 5 42 plusmn 3 47 plusmn 4EDP 1 plusmn 1 -1 plusmn 1 -6 plusmn 2 1 plusmn 1
dPdtmax 7200 plusmn 1349 8252 plusmn 1685 4004 plusmn 629 3718 plusmn 684dPdtmindagger -4233 plusmn 531 -7577 plusmn 750 -3631 plusmn 424 -3348 plusmn 653Tau 10 plusmn 0 7 plusmn 0 12 plusmn 1 14 plusmn 2
SW 1066 plusmn 245 1147 plusmn 213 1076 plusmn 176 666 plusmn 116
EaEesdagger 065 plusmn 020 084 plusmn 016 060 plusmn 005 103 plusmn 015ESPVR 570 plusmn 094 589 plusmn 074 347 plusmn 027 318 plusmn 052EDPVR 009 plusmn 009 -008 plusmn 015 -015 plusmn 014 -005 plusmn 015PRSW 79 plusmn 14 64 plusmn 6 68 plusmn 10 53 plusmn 3
Results from LV pressure-volume measurements in C57Bl6 mice anesthetized by urethane or
pentobarbital Urethane versus pentobarbital P lt 005 dagger OC versus CC P lt 005 ρ Valued
124 Ωcm α 030 Open- (OC) and closed-chest (CC) protocols HR indicates heart rate in
bpm SV left ventricular stroke volume in microl CO cardiac output mlmin Vmin minimal left
ventricular volume in microl Vmax maximal left ventricular volume in microl EF ejection fraction in
ESP left ventricular end-systolic pressure in mmHg EDP left ventricular end-diastolic
pressure in mmHg dPdtmax maximal first derivative of left ventricular pressure in mmHgs
dPdtmin minimal first derivative of left ventricular pressure in mmHgs Tau time constant of
left ventricular relaxation in ms SW stroke work in mmHgmicrol Ea arterial elastance Ees
ventricular end-systolic elastance ESPVR left ventricular end-systolic PV relationship in
Chapter 3 Murine left ventricular pressure-volume loops
24
mmHgmicrol EDPVR left ventricular end-diastolic PV relationship in mmHgmicrol PRSW left
ventricular preload-recruitable stroke work in mmHg
The steady-state functional parameters from OC and CC instrumented mice during
either urethane or pentobarbital are also depicted in Table 2 The use of pentobarbital
anesthesia had a cardiodepressive effect that was represented by significant function decline
in most parameters EF dPdtMAX and ESPVR decreased respectively with 24 57 and 41
upon pentobarbital use compared to urethane anesthesia Pentobarbital therefore had strong
negative chronotropic and inotropic effects
Hear
trat
e(b
pm)
Heart rate trace in closed-chest animal
0
100
200
300
400
500
600
700
Time (minutes)
arterial canulation
A
0 1 2 3 4 5 6 7 8 9 10 11 12 13 14 15 16
Heart rate trace in open-chest animal
0
100
200
300
400
500
600
700
Time (minutes)
Hear
trat
e(b
pm)
Ventricular catheterisation
B
0 1 2 3 4 5 6 7 8 9 10 11 12 13 14
Figure 10
Chapter 3 Murine left ventricular pressure-volume loops
25
Fig 10 Heart rate tracings in closed chest and open chest instrumented mice
A Representative figure of a heart rate tracing in a closed-chest instrumented mouse The
moment of arterial cannulation is indicated Some arrhythmias are seen in response to
introduction of the catheter into the left ventricle Arrhythmias are only present in a short
time-period that is part of the stabilization period following catheter introduction Heart rate
remains unchanged during the measurements B Representative figure of a heart rate tracing
in an open-chest instrumented mouse Somewhat more pronounced chronotropic arrhythmias
are seen in response to ventricular introduction of the catheter by apical stab However no
significant brady- or tachycardias are present during the measurements
Chapter 3 Murine left ventricular pressure-volume loops
26
Discussion
In this chapter OC and CC protocols for in vivo left ventricular PV relationship
measurement are described and discussed Murine cardiac function determination via these
methods is sensitive reproducible and comparable The choice for open- or closed-chest PV
measurements in mice depends on the aim of the study with regards to the specific cardiac
pathology The OC approach is technically less complicated and less time consuming Main
characteristics of the OC model itself are low systolic pressures and arterial resistance The
OC approach could best be used in studies where myocardial integrity is not at stake
Particularly ischemiareperfusion studies regarding myocardial integrity are probably better
done using the CC approach
Assessment of cardiac performance in genetically engineered mice is indispensable to
understand human cardiovascular pathologies In general the synergistic features of cardiac
diseases such as hypertrophy and cell death affect cardiac function negatively The
contractile performance of the heart deteriorates which is reflected in the attenuation of
systolic parameters as ejection fraction stroke work and PV-relationships Furthermore
ventricular relaxation prolongs and diastolic filling becomes impaired The progression of
cardiac disease ultimately results in clinical heart failure which is defined by the inability of
the heart to meet hemodynamic demands of the body and is characterized by specific signs
and symptoms (21) The most important parameter of cardiac performance which defines
heart failure is cardiac output
The influence on cardiac performance of specific genes and proteins in the
development of cardiac diseases ought to be investigated extensively to assess their clinical
relevance Various techniques have been used to assess cardiac performance in mice The
main techniques will be discussed in brief
Chapter 3 Murine left ventricular pressure-volume loops
27
Echocardiography is the most widely used noninvasive technique to determine cardiac
performance in mice High-frequency transthoracic and transesophageal transducers are used
as effective tools for two-dimensional and Doppler imaging of ventricular wall structures
dimensions and volumes of cavum and cardiac function (2223) Full-conscious or gas-
anesthesia experiments are preferred for echocardiographic assessment of cardiac function in
mice (2425) There is no limit to the diversity of murine models investigated by this general
accepted method of cardiac performance assessment However the most questionable aspect
of these measurements is the significant inter- and intraobservator variance in the
measurements
Isolated working mouse heart measurements in a Langendorf perfusion setup are a
technique for ex vivo cardiac function measurements approximating the in vivo function level
(5) Cardiac output developed left ventricular pressure and first derivates of maximal and
minimal pressures are some of the parameters that can be derived Isolated working heart
measurements are especially useful to study the acute effects of ischemic preconditioning and
ischemia-induced apoptosis(2627) Metabolites of interest can be measured accurately in the
perfusion fluid Disadvantages are the impossibility of chronic studies and the
unphysiological situation of ex vivo cardiac function measurements
Aortic flow measurements by means of a flow-probe have been used in several
studies (2829) Aortic flow acquisition is a validated technique and reveals functional
parameters as cardiac output stroke volume and blood flow velocity However several
disadvantages oppose against this technique Firstly aortic flow measurements are invasive
(ie thoracotomy or laparotomy) and result solely in aortic derived volume parameters
Integrated ventricular function cannot be assessed More importantly the exact localization of
the flow probe around the aorta is the critical determinant of the systematic error made by
these measurements Flow probes have been placed around the ascending and descending
Chapter 3 Murine left ventricular pressure-volume loops
28
thoracic aorta and the abdominal aorta The percentage of total cardiac output passing the
flow probe on the specific location has to be estimated Flow probes located at the ascending
aorta correct for coronary circulation and for instance bloodvolume passing the descending
thoracic aorta has been estimated to be around 75 of total cardiac output (30) The estimated
correction factor provides lsquoabsolutersquo stroke volume instead of absolute LV cavum volumes
and does not correct for cardiophysiological changes Altered cardiophysiological situations
could theoretically influence the relative amount of bloodvolume passing the flow probe On
the other hand major advances are the possibility of chronic cardiac function measurements
and the relative facile manner of data acquirement(29) Moreover aortic flow probe
measurements are not hampered by deleterious cardiac remodeling in myocardial ischemia or
hypertrophy studies(2829)
The newly developed method of cardiac performance assessment by in vivo left
ventricular PV measurements in the CC model is introduced here Left ventricular PV
measurements in vivo provide an accurate assessment of murine cardiac function The method
is highly sensitive during open- and closed-chest approaches in determining alterations in left
ventricular function as result of cardiac disease or altered hemodynamic stress The
characteristics of simultaneous left ventricular pressure and volume measurements enable the
researcher to directly investigate pressure-related cardiac diseases as cardiac hypertrophy and
restrictive cardiomyopathy (31) or volume-related diseases as dilated cardiomyopathy (32)
Moreover the effective influence of both aspects of cardiac disease on each other can be
observed in detail For instance ventricular dilation and subsequent decrease in ventricular
systolic pressure is mapped accurately in PV-loops Continuous measurements provide
possibilities to investigate the complete cardiac cycle Basic aspects of cardiac physiology can
be visualized using PV-loops in mice (81533-35) For instance increase in ventricular filling
is followed by an increase in ejection fraction according to the Frank-Starling mechanism
Chapter 3 Murine left ventricular pressure-volume loops
29
The opposite is seen as a result of gradual venous return decrease in the case of transient caval
vein occlusion (figure 7 amp 9) Moreover the distinction between systolic and diastolic failure
can be made through continuous PV-measurements (19) Systolic heart failure encompasses
mainly an ejection dysfunction with impaired contractility Both aspects are obtained by and
directly visualized through PV-loops Additionally the definite diagnosis of diastolic failure
is dependent on the observation of an inappropriate upward shift of the (end-)diastolic PV
relationship requiring cardiac catheterization for continuous volume determinations using
impedance measurements and high-fidelity measurements of ventricular pressure with a
micromanometer (19) PV-loops are useful determining cardiac performance within the
complete continuum of healthy and diseased hearts
Chapter 3 Murine left ventricular pressure-volume loops
30
Conclusion
In vivo PV measurements provide an essential tool in the assessment of cardiac
function in genetically modified mice Open- and closed-chest surgical protocols for murine
cardiac function determination are sensitive reproducible and comparable PV-loops enable
the researcher to accurately investigate diverse murine models of cardiac pathology by
adequately visualizing the cause-and-effect relationship between genetic modification and
their functional outcome Changes in ventricular contractility are best detected by PV derived
parameters in comparison to other methods of cardiac function determination
Chapter 3 Murine left ventricular pressure-volume loops
31
References
1 Doevendans PA Daemen MJ de Muinck ED Smits JF Cardiovascular phenotypingin mice Cardiovasc Res 19983934-49
2 Hoit BD New approaches to phenotypic analysis in adult mice J Mol Cell Cardiol20013327-35
3 Chacko VP Aresta F Chacko SM Weiss RG MRIMRS assessment of in vivomurine cardiac metabolism morphology and function at physiological heart rates AmJ Physiol Heart Circ Physiol 2000279H2218-24
4 Tanaka N Dalton N Mao L et al Transthoracic echocardiography in models ofcardiac disease in the mouse Circulation 1996941109-17
5 De Windt LJ Willems J Reneman RS Van der Vusse GJ Arts T Van Bilsen M Animproved isolated left ventricular ejecting murine heart model Functional andmetabolic evaluation Pflugers Arch 1999437182-90
6 Palmen M Daemen MJ Buehler A et al Impaired cardiac remodeling and functionafter myocardial infarction in FGF-1 transgenic mice Circulation 1999100250
7 Rockman HA Hamilton RA Jones LR Milano CA Mao L Lefkowitz RJ Enhancedmyocardial relaxation in vivo in transgenic mice overexpressing the beta2-adrenergicreceptor is associated with reduced phospholamban protein J Clin Invest1996971618-23
8 Georgakopoulos D Mitzner WA Chen CH et al In vivo murine left ventricularpressure-volume relations by miniaturized conductance micromanometry Am JPhysiol 1998274H1416-22
9 Dekker AL Geskes GG Cramers AA et al Right ventricular support for off-pumpcoronary artery bypass grafting studied with bi-ventricular pressure-volume loops insheep Eur J Cardiothorac Surg 200119179-84
10 Schreuder JJ Steendijk P van der Veen FH et al Acute and short-term effects ofpartial left ventriculectomy in dilated cardiomyopathy assessment by pressure-volumeloops J Am Coll Cardiol 2000362104-14
11 Zimmer HG Measurement of left ventricular hemodynamic parameters in closed-chest rats under control and various pathophysiologic conditions Basic Res Cardiol19837877-84
12 Georgakopoulos D Kass DA Estimation of parallel conductance by dual-frequencyconductance catheter in mice Am J Physiol Heart Circ Physiol 2000279H443-50
13 Feldman MD Mao Y Valvano JW Pearce JA Freeman GL Development of amultifrequency conductance catheter-based system to determine LV function in miceAm J Physiol Heart Circ Physiol 2000279H1411-20
14 Kornet L Schreuder JJ Van de Velden ET Jansen JR The volume-dependency ofparallel conductance throughout the cardiac cycle and its consequence for volumeestimation of the left ventricle in patients Cardiovasc Res 200151729-35
15 Nemoto S DeFreitas G Mann DL Carabello BA Effects of changes in leftventricular contractility on indexes of contractility in mice Am J Physiol Heart CircPhysiol 2002283H2504-10
16 Baan J Van de Velden ET Steendijk P Ventricular pressure-volume relations in vivoEur Heart J 199213 SupplE2-6
17 Little WC Cheng CP Left ventricular-arterial coupling in conscious dogs Am JPhysiol 1991261H70-6
18 Sunagawa K Maughan WL Sagawa K Optimal arterial resistance for the maximalstroke work studied in isolated canine left ventricle Circ Res 198556586-95
Chapter 3 Murine left ventricular pressure-volume loops
32
19 Van Kraaij D Van Pol P Ruiters AW et al Diagnosing diastolic heart failure Eur JHeart Fail 20024419-30
20 Faunt KK Cohn LA Jones BD Dodam JR Cardiopulmonary effects of bilateralhemithorax ventilation and diagnostic thoracoscopy in dogs Am J Vet Res1998591494-8
21 Lips DJ Van Kraaij DL De Windt LJ Doevendans PA Molecular determinants ofmyocardial hypertrophy and failure alternative pathways for beneficial andmaladaptive hypertrophy Eur Heart J 200324883-96
22 Collins KA Korcarz CE Lang RM Use of echocardiography for the phenotypicassessment of genetically altered mice Physiol Genomics 200313227-39
23 Scherrer-Crosbie M Steudel W Hunziker PR et al Determination of right ventricularstructure and function in normoxic and hypoxic mice a transesophagealechocardiographic study Circulation 1998981015-21
24 Takuma S Suehiro K Cardinale C et al Anesthetic inhibition in ischemic andnonischemic murine heart comparison with conscious echocardiographic approachAm J Physiol Heart Circ Physiol 2001280H2364-70
25 Chaves AA Weinstein DM Bauer JA Non-invasive echocardiographic studies inmice influence of anesthetic regimen Life Sci 200169213-22
26 Yamaura G Turoczi T Yamamoto F Siddqui MA Maulik N Das DK STATsignaling in ischemic heart a role of STAT5A in ischemic preconditioning Am JPhysiol Heart Circ Physiol 2003285H476-82
27 Bell RM Yellon DM Atorvastatin administered at the onset of reperfusion andindependent of lipid lowering protects the myocardium by up-regulating a pro-survival pathway J Am Coll Cardiol 200341508-15
28 Aartsen WM Schuijt MP Danser AH Daemen MJ Smits JF The role of locallyexpressed angiotensin converting enzyme in cardiac remodeling after myocardialinfarction in mice Cardiovasc Res 200256205-13
29 Janssen B Debets J Leenders P Smits J Chronic measurement of cardiac output inconscious mice Am J Physiol Regul Integr Comp Physiol 2002282R928-35
30 Georgakopoulos D Christe ME Giewat M Seidman CM Seidman JG Kass DA Thepathogenesis of familial hypertrophic cardiomyopathy early and evolving effects froman alpha-cardiac myosin heavy chain missense mutation Nat Med 19995327-30
31 Liao P Georgakopoulos D Kovacs A et al The in vivo role of p38 MAP kinases incardiac remodeling and restrictive cardiomyopathy Proc Natl Acad Sci U S A20019812283-8
32 McConnell BK Jones KA Fatkin D et al Dilated cardiomyopathy in homozygousmyosin-binding protein-C mutant mice J Clin Invest 19991041235-44
33 Georgakopoulos D Kass DA Minimal force-frequency modulation of inotropy andrelaxation of in situ murine heart J Physiol 2001534535-45
34 Yang B Larson DF Watson R Age-related left ventricular function in the mouseanalysis based on in vivo pressure-volume relationships Am J Physiol1999277H1906-13
35 Reyes M Freeman GL Escobedo D Lee S Steinhelper ME Feldman MDEnhancement of contractility with sustained afterload in the intact murine heartblunting of length-dependent activation Circulation 20031072962-8
Chapter 3 Murine left ventricular pressure-volume loops
10
Surgical protocols for PV-loops acquisition
The Sigma SA (CDLeycom Zoetermeer the Netherlands) single segment data
acquisition module was used for assessment of PV-loops The system operated on a constant
excitation current of 30microA to prevent interaction with the murine cardiac conduction system
determined by hypertonic saline injection and subtracted offline CONDUCT 2000 software
(CDLeycom Zoetermeer The Netherlands) was used for data acquisition and Circlab
software (LUMC Leiden The Netherlands) was used for offline data analysis
Invasive hemodynamic measurements of the murine left ventricle can theoretically be
performed by several ways for To date the most frequently reported method is an open-chest
(OC) approach (8) In brief mice are anaesthetized and the anterior thorax and the neck of the
mouse are shaved The animals are fixed on a warming plate Care is taken to maintain body
temperature constant at 37deg Celsius The neck skin of the mouse is opened by a saggital
incision The trachea is exposed to visually guide the intratracheal cannula (20-Gauge) where
after the cannula is connected to a mouse ventilator Minivent type 845 (Hugo Sachs
Electronics Germany) set at 150 strokes per minute and a tidal volume of 250 microl The
external jugular veins are cannulated with a flame-stretched PE-50 catheter for infusion of
saline and drugs The abdomen is opened subcostally The diaphragm is incised by a
transverse substernal approach leaving the pericardium intact The micromanometer is
calibrated with a mercury manometer by placing the sensor in 37deg Celsius normal saline The
left ventricle is entered through an apical stab with a 25 12 G needle immediately followed
by the Millar conductance-micromanometer The catheter is positioned correctly in the left
ventricle under guidance of the online pressure and volume signals The combination of
pressure and volume signals allows accurate positioning of the catheter in the left ventricle
Ventilation is stopped during data acquisition to avoid influence from ventilation of the lungs
on the pressure and volume signals The acquisition protocol consists of measurements of
Chapter 3 Murine left ventricular pressure-volume loops
11
baseline cardiac function hypertonic saline injection (3x) inferior caval vein occlusions with
and without β-adrenergic stimulation (isoproterenol 1000 pg)
This method is theoretically disadvantageous since collaps of the lungs and
destruction of myocardial integrity are induced through the relatively large surgical trauma
Furthermore in myocardial infarction studies the open-chest approach is hampered by
extensive left ventricular remodeling since the scar tissue is not accessible for the
conductance catheter and fails to provide a stable position
A closed-chest (CC) approach would theoretically circumvent several of these
disadvantages Firstly in a closed-chest the lungs remain untouched Secondly the cardiac
position and myocardial structures remain intact Thirdly surgical trauma and hemodynamic
stress would be reduced to a minimum Finally a closed-chest approach would allow accurate
assessment of left ventricular (LV) hemodynamic behavior in mice which underwent transient
or permanent occlusion of the left anterior descending coronary artery The surgical procedure
is similar to the open-chest approach except for the insertion of the conductance catheter into
the left ventricle In brief mice are anaesthetized and the neck and abdomen are shaved Care
is taken to maintain body temperature and ventilation support is provided as above Venous
catheters are placed after which the right common carotid is prepared for insertion of the
ultraminiature conductance-micromanometer The catheter is calibrated and subsequently
inserted into the left ventricle under guidance of the online pressure signal A transverse
abdominal incision without opening the thorax is performed to expose the inferior caval vein
The acquisition protocol is similar as in the open-chest approach
Chapter 3 Murine left ventricular pressure-volume loops
12
Explanation of the pressure-volume loop
The left ventricular PV loop is a two-dimensional representation of a single cardiac
cycle (figure 5) Beginning at end-diastole when the mitral valve closes the ejection phase
starts with pressure build up without actual volume ejection ie the isovolumic contraction
phase Blood is ejected out of the ventricle into the aorta upon opening of the aortic valve and
subsequently left ventricular volume decreases The end of ejection is defined by aortic valve
closure and followed by myocardial relaxation characterized by pressure decrease without
volume change ie the isovolumic relaxation phase The filling phase is initiated with
opening of the mitral valve and rise of ventricular volume The technique of simultaneous left
ventricular pressure and volume measurements provides continuous assessment of cardiac
function
Fig 5 The cardiac cycle in a single pressure-volume loop End-diastole is marked by the
closure of the mitral valves The hearts starts to build up pressure while all valves are closed
(isovolumetric contraction phase) before actual ejection begins following the opening of the
aortic valve Volume decreases while ejection progresses until the aortic valves close (end-
Closure aortic valve
VOLUME
PRES
SUR
E
Figure 5
Opening aortic valve
Isovolumicrelaxation
Isovolumiccontraction
Closure mitral valve
Openingmitral valve
Chapter 3 Murine left ventricular pressure-volume loops
13
systole) and relaxation starts Aortic and mitral valves are closed during relaxation
(isovolumic relaxation phase) The filling phase follows upon the opening of the mitral valve
and volume increase while pressure build up is minor
PV loops reveal in first instance the standard functional parameters (figure 6)
Fig 6 Cardiac performance parameters in the pressure-volume loop ED indicates end-
diastole ES end-systole Ved end-diastolic volume Ves end-systolic volume Ped end-
diastolic pressure Pes end-systolic pressure The area of the PV loop resembles stroke work
(SW) Stroke volume SV can be derived by subtracting Ves from Ved
However specific PV relationships are acquired too (table 2 figure 7) These
relationships describe the contractile and relaxative capabilities of the heart independent of
preload afterload or heart rate Transient occlusion of the inferior caval vein in mice is
performed to obtain these relationships Caval vein occlusion leads to a decrease in venous
return and thereby in preload of the left ventricle The response of the heart is typical as
Figure 6
VOLUME
PRES
SURE
ES
ED
Pes
Ved Ves
Ped
SV
SW
Chapter 3 Murine left ventricular pressure-volume loops
14
presented in figure 7 and shows the PV correlations Contractile parameters derived from PV-
correlations best detect small alterations in contractility in mice (15)
Fig 7 Pressure-volume relationships Variably loaded PV loops are used to define several PV
relationships The variable loading is derived by occluding the inferior caval vein and thereby
reducing venous return The end-systolic PV relationship (ESPVR) describes the contractile
performance of the left ventricle Contractility is linear correlated with the steepness of the
ESPVR slope ie Ees The end-diastolic PV relationship (EDPVR) describes diastolic
performance for instance diastolic distensibility The slope of the EDPVR (β) indicates the
passive chamber stiffness
The end-systolic PV relationship (ESPVR) describes the relation between volume and
pressure changes in systole Within the physiological range this relationship approximates a
straight line The relationship can be described in terms of its slope which reflects myocardial
contractility and its volume axis intercept V0 The volume intercept from the ESPVR line
Figure 7
PRES
SURE ESPVR
VOLUME
EesEes
EDPVRβ
V75
Chapter 3 Murine left ventricular pressure-volume loops
15
could better be taken at a constant pressure level in the physiological range for example
between 50 and 100 mm Hg (16) The volume intercept at a constant pressure (eg V75)
reflects myocardial contractility as it indicates the extent of contraction Increased myocardial
contractility for instance during beta-adrenergic stimulation with isoprenaline results in a
steeper ESPVR-slope and a leftward shift on the volume axis while attenuated contractility
for example during clinical heart failure results in a concomitantly plain slope and a
rightward shift on the volume axis The slope of the ESPVR (Ees) is used to describe the left
ventricular elastance Arterial elastance (Ea) a measure for ventricular afterload is described
by the slope of the relationship between stroke volume and end-systolic pressure (figure 8)
Fig 8 Arterial-ventricular coupling Ventricular elastance is estimated from the end-
systolic PV relationship (ESPVR) slope Ees Arterial elastance (Ea) is approximated by the
stroke volumeend-systolic pressure ratio (Ao Pes-SV relationship) The between Ea and Ees
reflects the coupling between the left ventricle and the arterial circulation The production of
stroke work is maximal when the Ea and Ees are approximately equal
Figure 8
Ea Ees
VOLUME
PRES
SURE
PRESSURE
PV-relat
ion Ao PES ndash SV relation
Chapter 3 Murine left ventricular pressure-volume loops
16
The production of stroke work is maximal when the Ees and Ea are approximately
equal Stroke work attenuates substantially in relation to its maximal value whenever Ea and
Ees differ markedly (1718) The preload-recruitable stroke work (PRSW) is the relationship
between end-diastolic volume and performed stroke work by the ventricle It is a load-
independent measure of contractility related to preload The contractile state of the heart is
resembled by the steepness of the PRSW-slope In a high contractile state the heart is able to
perform more stroke work at a constant end-diastolic volume for instance by augmenting the
ejection fraction
Diastolic function is derived from the end-diastolic PV relationship (EDPVR) which
correlates with the compliance of the ventricular myocardium Diastolic dysfunctioning or
failure is observed by an inappropriate upward shift of the ESPVR The slope of the EDPVR
(β) increases during augmented stiffness of the ventricular wall when pressure rises
progressively more during ventricular filling The opposite occurs in case of increased
compliance Certain cardiac diseases and remodeling processes are correlated with increased
stiffness of the ventricular wall by collagen deposition resulting in an increase of the
EDPVR-slope (19)
Numerous other relationships can be assessed The limits are determined by the
interests and the creativity of the investigator
Chapter 3 Murine left ventricular pressure-volume loops
17
Results of PV-measurements with the open- (OC) and closed-chest (CC) approach
A comparative study was performed to determine scientifically based arguments for
the choice between open- (OC) or closed-chest (CC) PV measurements to examine murine
cardiac function Comparing cardiac performance between OC and CC protocols revealed
overall relatively similar values for the investigated parameters (table 3) The values for LV
volumes were corrected for ρ determined at 124 Ωcm in the used setup (N = 10 12352 plusmn
088 Ωcm) α (N = 13 030) and Vc Vc was determined during all PV experiments by the
hypertonic saline injection method No significant differences could be detected between CC
and OC instrumentation (9469 plusmn 483 microl versus 9272 plusmn 205 microl respectively NS) The 4 microl
30 saline demonstrated to be sufficient to change blood conductivity Moreover as this
volume encompasses only 15 of the normal murine end-diastolic volume it proved to be too
small to influence LV end-diastolic and end-systolic pressures (figure 4) in either OC or CC
mice
Several differences were found between the OC and CC approaches (table 3) Cardiac
function in the OC approach was characterized by higher ejection fractions (EF 69 versus
48 respectively) larger stroke volume (1998 versus 1470 microl respectively) and a leftward
shift in ventricular volume On the contrary measuring cardiac function with an intact thorax
resulted in higher end-systolic pressures (ESP OC 52 versus CC 65 mmHg with urethane
anesthesia) and a higher rate of relaxation as indicated by the dPdtmin No differences were
found in the PV relationships ie the ESPVR EDPVR or PRSW Interestingly the OC
approach did result in a mismatch between arterial afterload and ventricular work The
arterial-ventricular elastance ratio (EaEes) was significantly depressed following opening of
the chest In contrast EaEes ratios were normal (ie ~ 10) in the CC approach under both
regimens This finding is consistently found in open-chest instrumented mice (8) The arterial-
ventricular coupling mismatch was depending on arterial resistance the slope of the ESPVR
Chapter 3 Murine left ventricular pressure-volume loops
18
Table 1 Comparison of volume derived by ultrasonography and conductance
Descriptive statistics of alphaN Min Max Mean SEM
EDV 13 018 045 030 002ESV 13 016 094 051 007SV 13 009 058 026 004
Regression analysis
N
RR2
Adjusted R2
SEE
EDV13
082068065179
ESV13
083069066172
SV13
041017009117
Chapter 3 Murine left ventricular pressure-volume loops
19
Left ventricular volume was measured by both ultrasonography
and conductance in adult C57Bl6 mice End-diastolic end-
systolic and stroke volume were used to obtain alpha (α)
Descriptive analysis shows that α determination at the end-
diastolic moment results in the most consistent mean α Also
the correlation of LV volume values between ultrasonography
and conductance is high as shown by the regression analysis
SEM indicates standard error of the mean SEE standard error
of the estimate
EDVECHO (microl)120100806040200
EDV C
ON
DUC
TAN
CE (micro
l)
18
16
14
12
10
8
6
SCATTERPLOT OF END-DIASTOLIC VOLUMECONDUCTANCE VS ULTRASONOGRAPHY
EDVECHO (microl)120100806040200
EDV C
ON
DUC
TAN
CE (micro
l)
18
16
14
12
10
8
6
EDVECHO (microl)120100806040200
EDV C
ON
DUC
TAN
CE (micro
l)
18
16
14
12
10
8
6
SCATTERPLOT OF END-DIASTOLIC VOLUMECONDUCTANCE VS ULTRASONOGRAPHY
Chapter 3 Murine left ventricular pressure-volume loops
20
Table 2 Parameters derived by pressure-volume loops
Abbreviations DefinitionsGeneral parameters
CI (CI = CObody wt) CO HR
Card iac indexCard iac outputHeart rate
PressuredPdtmax
dPdtmin
PedPesτ
Maximum derivative of change in systolic pressure in timeMaximum derivative of change in diastolic pressure in timeEnd-diastolic pressureEnd-systolic pressureTime constant of isovolumic relaxation
VolumeEFSI (SI = SVbody wt)SVVedVes
Ejection fractionStroke index Stroke volumeEnd-diastolic pressureEnd-systolic pressure
Pressure-volume relationshipsβEa (Ea = PesSV)EDPVREes
Slope of the end-diastolic pressure-volume relat ionshipArterial elastanceEnd-diastolic pressure-volume relat ionshipEnd-systolic ventricular elastance
EmaxESPVR
(slope of the end-systolic pressure-volume relationship)Maximum chamber elasticity (∆P∆V)End-systolic pressure-volume relat ionship
Pressure-volume areaEfficiencyEWPEPRSWPVASWSWI (SWI = SWbody wt)
EWPVAExternal work = SWPotential energyPreload-recruitable stroke workPressure-volume area = EW + PEStroke workStroke work index
Abbreviations DefinitionsGeneral parameters
CI (CI = CObody wt) CO HR
Card iac indexCard iac outputHeart rate
PressuredPdtmax
dPdtmin
PedPesτ
Maximum derivative of change in systolic pressure in timeMaximum derivative of change in diastolic pressure in timeEnd-diastolic pressureEnd-systolic pressureTime constant of isovolumic relaxation
VolumeEFSI (SI = SVbody wt)SVVedVes
Ejection fractionStroke index Stroke volumeEnd-diastolic pressureEnd-systolic pressure
Pressure-volume relationshipsβEa (Ea = PesSV)EDPVREes
Slope of the end-diastolic pressure-volume relat ionshipArterial elastanceEnd-diastolic pressure-volume relat ionshipEnd-systolic ventricular elastance
EmaxESPVR
(slope of the end-systolic pressure-volume relationship)Maximum chamber elasticity (∆P∆V)End-systolic pressure-volume relat ionship
Pressure-volume areaEfficiencyEWPEPRSWPVASWSWI (SWI = SWbody wt)
EWPVAExternal work = SWPotential energyPreload-recruitable stroke workPressure-volume area = EW + PEStroke workStroke work index
EmaxESPVR
(slope of the end-systolic pressure-volume (slope of the end-systolic pressure-volume relationship)Maximum chamber elasticity (∆P∆V)End-systolic pressure-volume relat ionship
Pressure-volume areaEfficiencyEWPEPRSWPVASWSWI (SWI = SWbody wt)
EWPVAExternal work = SWPotential energyPreload-recruitable stroke workPressure-volume area = EW + PEStroke workStroke work index
Chapter 3 Murine left ventricular pressure-volume loops
21
(Ees) proved to be equal in OC and CC instrumented mice The combination of enlarged
stroke volume with attenuated systolic pressures leads to a decrease in arterial elastance The
altered arterial elastance could be explained by the opening of the thorax A drop in overall
peripheral vascular resistance from baseline values has been described during thoracoscopy
(20)
Urethane
Volume (microl)
Pres
sure
(mm
Hg)
Pentobarbital
Volume (microl)
Pres
sure
(mm
Hg)
A
B
CCOCCCCCOCOC
CCOCCCCCOCOC
-100
102030405060708090
-10
0
10
20
30
40
50
60
0 5 10 15 20 25 30 35 400 5 10 15 20 25 30 35 40
0 5 10 15 20 25 30 35 400 5 10 15 20 25 30 35 40
Figure 9
Chapter 3 Murine left ventricular pressure-volume loops
22
Fig 9 Left ventricular pressure-volume loops Pressure presented in mmHg and volume microl
A Representative figure of PV loops acquired during urethane anesthesia in closed chest
(CC) and open chest (OC) instrumented mice B Representative figure of PV loops acquired
during pentobarbital anesthesia in CC and OC instrumented mice Loops are acquired during
an occlusion of the inferior caval vein Venous returns decreases which is represented in the
loops by attenuation of both pressure and volume The differences in ESP SW and ESPVR
between urethane and pentobarbital anesthesia can be observed by analyzing the loops in A
and B The loops show also the larger stroke volume and depressed systolic pressure in OC
instrumented mice
Figure 9 shows representative PV-loops while venous return was attenuated following
inferior caval vein occlusion Typical pressure and volume effects are depicted showing the
absence of apparent differences in PV relationships The mentioned differences in ESP SV
and EF are evident in the presented loops though
ECG recordings were made during both surgical protocols to detect possible heart rate
alterations and arrhythmias Murine left ventricular PV measurements could be distorted by
physiological responses to the catheterization Heart rate alterations could be anticipated
especially in relation to carotid sinus stimulation while cannulating of the carotid artery
However neither bradycardia nor other arrhythmias were observed during either CC or OC
procedures (figure 10) This finding indicates that cannulation of the right common carotid
artery does not alter heart rate by carotid sinus stimulation
Chapter 3 Murine left ventricular pressure-volume loops
23
Table 3 Functional parameters to determine baseline LV functioning in open- and closed-
chest protocols during steady-state measurement
URETHANE PENTOBARBITALOC CC OC CC
N = 5 N = 5 N = 10 N = 10
Mean plusmn SEM Mean plusmn SEM Mean plusmn SEM Mean plusmn SEM
HR 583 plusmn 20 658 plusmn 21 493 plusmn 25 481 plusmn 36SVdagger 1958 plusmn 351 1557 plusmn 254 2018 plusmn 183 1426 plusmn 103CO 12 plusmn 2 10 plusmn 2 10 plusmn 1 7 plusmn 0Vmaxdagger 1761 plusmn 053 2361 plusmn 223 3089 plusmn 289 3883 plusmn 230Vmindagger 215 plusmn 133 679 plusmn 180 1029 plusmn 189 2373 plusmn 199EFdagger 79 plusmn 6 66 plusmn 8 66 plusmn 4 39 plusmn 2
ESPdagger 52 plusmn 4 65 plusmn 5 42 plusmn 3 47 plusmn 4EDP 1 plusmn 1 -1 plusmn 1 -6 plusmn 2 1 plusmn 1
dPdtmax 7200 plusmn 1349 8252 plusmn 1685 4004 plusmn 629 3718 plusmn 684dPdtmindagger -4233 plusmn 531 -7577 plusmn 750 -3631 plusmn 424 -3348 plusmn 653Tau 10 plusmn 0 7 plusmn 0 12 plusmn 1 14 plusmn 2
SW 1066 plusmn 245 1147 plusmn 213 1076 plusmn 176 666 plusmn 116
EaEesdagger 065 plusmn 020 084 plusmn 016 060 plusmn 005 103 plusmn 015ESPVR 570 plusmn 094 589 plusmn 074 347 plusmn 027 318 plusmn 052EDPVR 009 plusmn 009 -008 plusmn 015 -015 plusmn 014 -005 plusmn 015PRSW 79 plusmn 14 64 plusmn 6 68 plusmn 10 53 plusmn 3
Results from LV pressure-volume measurements in C57Bl6 mice anesthetized by urethane or
pentobarbital Urethane versus pentobarbital P lt 005 dagger OC versus CC P lt 005 ρ Valued
124 Ωcm α 030 Open- (OC) and closed-chest (CC) protocols HR indicates heart rate in
bpm SV left ventricular stroke volume in microl CO cardiac output mlmin Vmin minimal left
ventricular volume in microl Vmax maximal left ventricular volume in microl EF ejection fraction in
ESP left ventricular end-systolic pressure in mmHg EDP left ventricular end-diastolic
pressure in mmHg dPdtmax maximal first derivative of left ventricular pressure in mmHgs
dPdtmin minimal first derivative of left ventricular pressure in mmHgs Tau time constant of
left ventricular relaxation in ms SW stroke work in mmHgmicrol Ea arterial elastance Ees
ventricular end-systolic elastance ESPVR left ventricular end-systolic PV relationship in
Chapter 3 Murine left ventricular pressure-volume loops
24
mmHgmicrol EDPVR left ventricular end-diastolic PV relationship in mmHgmicrol PRSW left
ventricular preload-recruitable stroke work in mmHg
The steady-state functional parameters from OC and CC instrumented mice during
either urethane or pentobarbital are also depicted in Table 2 The use of pentobarbital
anesthesia had a cardiodepressive effect that was represented by significant function decline
in most parameters EF dPdtMAX and ESPVR decreased respectively with 24 57 and 41
upon pentobarbital use compared to urethane anesthesia Pentobarbital therefore had strong
negative chronotropic and inotropic effects
Hear
trat
e(b
pm)
Heart rate trace in closed-chest animal
0
100
200
300
400
500
600
700
Time (minutes)
arterial canulation
A
0 1 2 3 4 5 6 7 8 9 10 11 12 13 14 15 16
Heart rate trace in open-chest animal
0
100
200
300
400
500
600
700
Time (minutes)
Hear
trat
e(b
pm)
Ventricular catheterisation
B
0 1 2 3 4 5 6 7 8 9 10 11 12 13 14
Figure 10
Chapter 3 Murine left ventricular pressure-volume loops
25
Fig 10 Heart rate tracings in closed chest and open chest instrumented mice
A Representative figure of a heart rate tracing in a closed-chest instrumented mouse The
moment of arterial cannulation is indicated Some arrhythmias are seen in response to
introduction of the catheter into the left ventricle Arrhythmias are only present in a short
time-period that is part of the stabilization period following catheter introduction Heart rate
remains unchanged during the measurements B Representative figure of a heart rate tracing
in an open-chest instrumented mouse Somewhat more pronounced chronotropic arrhythmias
are seen in response to ventricular introduction of the catheter by apical stab However no
significant brady- or tachycardias are present during the measurements
Chapter 3 Murine left ventricular pressure-volume loops
26
Discussion
In this chapter OC and CC protocols for in vivo left ventricular PV relationship
measurement are described and discussed Murine cardiac function determination via these
methods is sensitive reproducible and comparable The choice for open- or closed-chest PV
measurements in mice depends on the aim of the study with regards to the specific cardiac
pathology The OC approach is technically less complicated and less time consuming Main
characteristics of the OC model itself are low systolic pressures and arterial resistance The
OC approach could best be used in studies where myocardial integrity is not at stake
Particularly ischemiareperfusion studies regarding myocardial integrity are probably better
done using the CC approach
Assessment of cardiac performance in genetically engineered mice is indispensable to
understand human cardiovascular pathologies In general the synergistic features of cardiac
diseases such as hypertrophy and cell death affect cardiac function negatively The
contractile performance of the heart deteriorates which is reflected in the attenuation of
systolic parameters as ejection fraction stroke work and PV-relationships Furthermore
ventricular relaxation prolongs and diastolic filling becomes impaired The progression of
cardiac disease ultimately results in clinical heart failure which is defined by the inability of
the heart to meet hemodynamic demands of the body and is characterized by specific signs
and symptoms (21) The most important parameter of cardiac performance which defines
heart failure is cardiac output
The influence on cardiac performance of specific genes and proteins in the
development of cardiac diseases ought to be investigated extensively to assess their clinical
relevance Various techniques have been used to assess cardiac performance in mice The
main techniques will be discussed in brief
Chapter 3 Murine left ventricular pressure-volume loops
27
Echocardiography is the most widely used noninvasive technique to determine cardiac
performance in mice High-frequency transthoracic and transesophageal transducers are used
as effective tools for two-dimensional and Doppler imaging of ventricular wall structures
dimensions and volumes of cavum and cardiac function (2223) Full-conscious or gas-
anesthesia experiments are preferred for echocardiographic assessment of cardiac function in
mice (2425) There is no limit to the diversity of murine models investigated by this general
accepted method of cardiac performance assessment However the most questionable aspect
of these measurements is the significant inter- and intraobservator variance in the
measurements
Isolated working mouse heart measurements in a Langendorf perfusion setup are a
technique for ex vivo cardiac function measurements approximating the in vivo function level
(5) Cardiac output developed left ventricular pressure and first derivates of maximal and
minimal pressures are some of the parameters that can be derived Isolated working heart
measurements are especially useful to study the acute effects of ischemic preconditioning and
ischemia-induced apoptosis(2627) Metabolites of interest can be measured accurately in the
perfusion fluid Disadvantages are the impossibility of chronic studies and the
unphysiological situation of ex vivo cardiac function measurements
Aortic flow measurements by means of a flow-probe have been used in several
studies (2829) Aortic flow acquisition is a validated technique and reveals functional
parameters as cardiac output stroke volume and blood flow velocity However several
disadvantages oppose against this technique Firstly aortic flow measurements are invasive
(ie thoracotomy or laparotomy) and result solely in aortic derived volume parameters
Integrated ventricular function cannot be assessed More importantly the exact localization of
the flow probe around the aorta is the critical determinant of the systematic error made by
these measurements Flow probes have been placed around the ascending and descending
Chapter 3 Murine left ventricular pressure-volume loops
28
thoracic aorta and the abdominal aorta The percentage of total cardiac output passing the
flow probe on the specific location has to be estimated Flow probes located at the ascending
aorta correct for coronary circulation and for instance bloodvolume passing the descending
thoracic aorta has been estimated to be around 75 of total cardiac output (30) The estimated
correction factor provides lsquoabsolutersquo stroke volume instead of absolute LV cavum volumes
and does not correct for cardiophysiological changes Altered cardiophysiological situations
could theoretically influence the relative amount of bloodvolume passing the flow probe On
the other hand major advances are the possibility of chronic cardiac function measurements
and the relative facile manner of data acquirement(29) Moreover aortic flow probe
measurements are not hampered by deleterious cardiac remodeling in myocardial ischemia or
hypertrophy studies(2829)
The newly developed method of cardiac performance assessment by in vivo left
ventricular PV measurements in the CC model is introduced here Left ventricular PV
measurements in vivo provide an accurate assessment of murine cardiac function The method
is highly sensitive during open- and closed-chest approaches in determining alterations in left
ventricular function as result of cardiac disease or altered hemodynamic stress The
characteristics of simultaneous left ventricular pressure and volume measurements enable the
researcher to directly investigate pressure-related cardiac diseases as cardiac hypertrophy and
restrictive cardiomyopathy (31) or volume-related diseases as dilated cardiomyopathy (32)
Moreover the effective influence of both aspects of cardiac disease on each other can be
observed in detail For instance ventricular dilation and subsequent decrease in ventricular
systolic pressure is mapped accurately in PV-loops Continuous measurements provide
possibilities to investigate the complete cardiac cycle Basic aspects of cardiac physiology can
be visualized using PV-loops in mice (81533-35) For instance increase in ventricular filling
is followed by an increase in ejection fraction according to the Frank-Starling mechanism
Chapter 3 Murine left ventricular pressure-volume loops
29
The opposite is seen as a result of gradual venous return decrease in the case of transient caval
vein occlusion (figure 7 amp 9) Moreover the distinction between systolic and diastolic failure
can be made through continuous PV-measurements (19) Systolic heart failure encompasses
mainly an ejection dysfunction with impaired contractility Both aspects are obtained by and
directly visualized through PV-loops Additionally the definite diagnosis of diastolic failure
is dependent on the observation of an inappropriate upward shift of the (end-)diastolic PV
relationship requiring cardiac catheterization for continuous volume determinations using
impedance measurements and high-fidelity measurements of ventricular pressure with a
micromanometer (19) PV-loops are useful determining cardiac performance within the
complete continuum of healthy and diseased hearts
Chapter 3 Murine left ventricular pressure-volume loops
30
Conclusion
In vivo PV measurements provide an essential tool in the assessment of cardiac
function in genetically modified mice Open- and closed-chest surgical protocols for murine
cardiac function determination are sensitive reproducible and comparable PV-loops enable
the researcher to accurately investigate diverse murine models of cardiac pathology by
adequately visualizing the cause-and-effect relationship between genetic modification and
their functional outcome Changes in ventricular contractility are best detected by PV derived
parameters in comparison to other methods of cardiac function determination
Chapter 3 Murine left ventricular pressure-volume loops
31
References
1 Doevendans PA Daemen MJ de Muinck ED Smits JF Cardiovascular phenotypingin mice Cardiovasc Res 19983934-49
2 Hoit BD New approaches to phenotypic analysis in adult mice J Mol Cell Cardiol20013327-35
3 Chacko VP Aresta F Chacko SM Weiss RG MRIMRS assessment of in vivomurine cardiac metabolism morphology and function at physiological heart rates AmJ Physiol Heart Circ Physiol 2000279H2218-24
4 Tanaka N Dalton N Mao L et al Transthoracic echocardiography in models ofcardiac disease in the mouse Circulation 1996941109-17
5 De Windt LJ Willems J Reneman RS Van der Vusse GJ Arts T Van Bilsen M Animproved isolated left ventricular ejecting murine heart model Functional andmetabolic evaluation Pflugers Arch 1999437182-90
6 Palmen M Daemen MJ Buehler A et al Impaired cardiac remodeling and functionafter myocardial infarction in FGF-1 transgenic mice Circulation 1999100250
7 Rockman HA Hamilton RA Jones LR Milano CA Mao L Lefkowitz RJ Enhancedmyocardial relaxation in vivo in transgenic mice overexpressing the beta2-adrenergicreceptor is associated with reduced phospholamban protein J Clin Invest1996971618-23
8 Georgakopoulos D Mitzner WA Chen CH et al In vivo murine left ventricularpressure-volume relations by miniaturized conductance micromanometry Am JPhysiol 1998274H1416-22
9 Dekker AL Geskes GG Cramers AA et al Right ventricular support for off-pumpcoronary artery bypass grafting studied with bi-ventricular pressure-volume loops insheep Eur J Cardiothorac Surg 200119179-84
10 Schreuder JJ Steendijk P van der Veen FH et al Acute and short-term effects ofpartial left ventriculectomy in dilated cardiomyopathy assessment by pressure-volumeloops J Am Coll Cardiol 2000362104-14
11 Zimmer HG Measurement of left ventricular hemodynamic parameters in closed-chest rats under control and various pathophysiologic conditions Basic Res Cardiol19837877-84
12 Georgakopoulos D Kass DA Estimation of parallel conductance by dual-frequencyconductance catheter in mice Am J Physiol Heart Circ Physiol 2000279H443-50
13 Feldman MD Mao Y Valvano JW Pearce JA Freeman GL Development of amultifrequency conductance catheter-based system to determine LV function in miceAm J Physiol Heart Circ Physiol 2000279H1411-20
14 Kornet L Schreuder JJ Van de Velden ET Jansen JR The volume-dependency ofparallel conductance throughout the cardiac cycle and its consequence for volumeestimation of the left ventricle in patients Cardiovasc Res 200151729-35
15 Nemoto S DeFreitas G Mann DL Carabello BA Effects of changes in leftventricular contractility on indexes of contractility in mice Am J Physiol Heart CircPhysiol 2002283H2504-10
16 Baan J Van de Velden ET Steendijk P Ventricular pressure-volume relations in vivoEur Heart J 199213 SupplE2-6
17 Little WC Cheng CP Left ventricular-arterial coupling in conscious dogs Am JPhysiol 1991261H70-6
18 Sunagawa K Maughan WL Sagawa K Optimal arterial resistance for the maximalstroke work studied in isolated canine left ventricle Circ Res 198556586-95
Chapter 3 Murine left ventricular pressure-volume loops
32
19 Van Kraaij D Van Pol P Ruiters AW et al Diagnosing diastolic heart failure Eur JHeart Fail 20024419-30
20 Faunt KK Cohn LA Jones BD Dodam JR Cardiopulmonary effects of bilateralhemithorax ventilation and diagnostic thoracoscopy in dogs Am J Vet Res1998591494-8
21 Lips DJ Van Kraaij DL De Windt LJ Doevendans PA Molecular determinants ofmyocardial hypertrophy and failure alternative pathways for beneficial andmaladaptive hypertrophy Eur Heart J 200324883-96
22 Collins KA Korcarz CE Lang RM Use of echocardiography for the phenotypicassessment of genetically altered mice Physiol Genomics 200313227-39
23 Scherrer-Crosbie M Steudel W Hunziker PR et al Determination of right ventricularstructure and function in normoxic and hypoxic mice a transesophagealechocardiographic study Circulation 1998981015-21
24 Takuma S Suehiro K Cardinale C et al Anesthetic inhibition in ischemic andnonischemic murine heart comparison with conscious echocardiographic approachAm J Physiol Heart Circ Physiol 2001280H2364-70
25 Chaves AA Weinstein DM Bauer JA Non-invasive echocardiographic studies inmice influence of anesthetic regimen Life Sci 200169213-22
26 Yamaura G Turoczi T Yamamoto F Siddqui MA Maulik N Das DK STATsignaling in ischemic heart a role of STAT5A in ischemic preconditioning Am JPhysiol Heart Circ Physiol 2003285H476-82
27 Bell RM Yellon DM Atorvastatin administered at the onset of reperfusion andindependent of lipid lowering protects the myocardium by up-regulating a pro-survival pathway J Am Coll Cardiol 200341508-15
28 Aartsen WM Schuijt MP Danser AH Daemen MJ Smits JF The role of locallyexpressed angiotensin converting enzyme in cardiac remodeling after myocardialinfarction in mice Cardiovasc Res 200256205-13
29 Janssen B Debets J Leenders P Smits J Chronic measurement of cardiac output inconscious mice Am J Physiol Regul Integr Comp Physiol 2002282R928-35
30 Georgakopoulos D Christe ME Giewat M Seidman CM Seidman JG Kass DA Thepathogenesis of familial hypertrophic cardiomyopathy early and evolving effects froman alpha-cardiac myosin heavy chain missense mutation Nat Med 19995327-30
31 Liao P Georgakopoulos D Kovacs A et al The in vivo role of p38 MAP kinases incardiac remodeling and restrictive cardiomyopathy Proc Natl Acad Sci U S A20019812283-8
32 McConnell BK Jones KA Fatkin D et al Dilated cardiomyopathy in homozygousmyosin-binding protein-C mutant mice J Clin Invest 19991041235-44
33 Georgakopoulos D Kass DA Minimal force-frequency modulation of inotropy andrelaxation of in situ murine heart J Physiol 2001534535-45
34 Yang B Larson DF Watson R Age-related left ventricular function in the mouseanalysis based on in vivo pressure-volume relationships Am J Physiol1999277H1906-13
35 Reyes M Freeman GL Escobedo D Lee S Steinhelper ME Feldman MDEnhancement of contractility with sustained afterload in the intact murine heartblunting of length-dependent activation Circulation 20031072962-8
Chapter 3 Murine left ventricular pressure-volume loops
11
baseline cardiac function hypertonic saline injection (3x) inferior caval vein occlusions with
and without β-adrenergic stimulation (isoproterenol 1000 pg)
This method is theoretically disadvantageous since collaps of the lungs and
destruction of myocardial integrity are induced through the relatively large surgical trauma
Furthermore in myocardial infarction studies the open-chest approach is hampered by
extensive left ventricular remodeling since the scar tissue is not accessible for the
conductance catheter and fails to provide a stable position
A closed-chest (CC) approach would theoretically circumvent several of these
disadvantages Firstly in a closed-chest the lungs remain untouched Secondly the cardiac
position and myocardial structures remain intact Thirdly surgical trauma and hemodynamic
stress would be reduced to a minimum Finally a closed-chest approach would allow accurate
assessment of left ventricular (LV) hemodynamic behavior in mice which underwent transient
or permanent occlusion of the left anterior descending coronary artery The surgical procedure
is similar to the open-chest approach except for the insertion of the conductance catheter into
the left ventricle In brief mice are anaesthetized and the neck and abdomen are shaved Care
is taken to maintain body temperature and ventilation support is provided as above Venous
catheters are placed after which the right common carotid is prepared for insertion of the
ultraminiature conductance-micromanometer The catheter is calibrated and subsequently
inserted into the left ventricle under guidance of the online pressure signal A transverse
abdominal incision without opening the thorax is performed to expose the inferior caval vein
The acquisition protocol is similar as in the open-chest approach
Chapter 3 Murine left ventricular pressure-volume loops
12
Explanation of the pressure-volume loop
The left ventricular PV loop is a two-dimensional representation of a single cardiac
cycle (figure 5) Beginning at end-diastole when the mitral valve closes the ejection phase
starts with pressure build up without actual volume ejection ie the isovolumic contraction
phase Blood is ejected out of the ventricle into the aorta upon opening of the aortic valve and
subsequently left ventricular volume decreases The end of ejection is defined by aortic valve
closure and followed by myocardial relaxation characterized by pressure decrease without
volume change ie the isovolumic relaxation phase The filling phase is initiated with
opening of the mitral valve and rise of ventricular volume The technique of simultaneous left
ventricular pressure and volume measurements provides continuous assessment of cardiac
function
Fig 5 The cardiac cycle in a single pressure-volume loop End-diastole is marked by the
closure of the mitral valves The hearts starts to build up pressure while all valves are closed
(isovolumetric contraction phase) before actual ejection begins following the opening of the
aortic valve Volume decreases while ejection progresses until the aortic valves close (end-
Closure aortic valve
VOLUME
PRES
SUR
E
Figure 5
Opening aortic valve
Isovolumicrelaxation
Isovolumiccontraction
Closure mitral valve
Openingmitral valve
Chapter 3 Murine left ventricular pressure-volume loops
13
systole) and relaxation starts Aortic and mitral valves are closed during relaxation
(isovolumic relaxation phase) The filling phase follows upon the opening of the mitral valve
and volume increase while pressure build up is minor
PV loops reveal in first instance the standard functional parameters (figure 6)
Fig 6 Cardiac performance parameters in the pressure-volume loop ED indicates end-
diastole ES end-systole Ved end-diastolic volume Ves end-systolic volume Ped end-
diastolic pressure Pes end-systolic pressure The area of the PV loop resembles stroke work
(SW) Stroke volume SV can be derived by subtracting Ves from Ved
However specific PV relationships are acquired too (table 2 figure 7) These
relationships describe the contractile and relaxative capabilities of the heart independent of
preload afterload or heart rate Transient occlusion of the inferior caval vein in mice is
performed to obtain these relationships Caval vein occlusion leads to a decrease in venous
return and thereby in preload of the left ventricle The response of the heart is typical as
Figure 6
VOLUME
PRES
SURE
ES
ED
Pes
Ved Ves
Ped
SV
SW
Chapter 3 Murine left ventricular pressure-volume loops
14
presented in figure 7 and shows the PV correlations Contractile parameters derived from PV-
correlations best detect small alterations in contractility in mice (15)
Fig 7 Pressure-volume relationships Variably loaded PV loops are used to define several PV
relationships The variable loading is derived by occluding the inferior caval vein and thereby
reducing venous return The end-systolic PV relationship (ESPVR) describes the contractile
performance of the left ventricle Contractility is linear correlated with the steepness of the
ESPVR slope ie Ees The end-diastolic PV relationship (EDPVR) describes diastolic
performance for instance diastolic distensibility The slope of the EDPVR (β) indicates the
passive chamber stiffness
The end-systolic PV relationship (ESPVR) describes the relation between volume and
pressure changes in systole Within the physiological range this relationship approximates a
straight line The relationship can be described in terms of its slope which reflects myocardial
contractility and its volume axis intercept V0 The volume intercept from the ESPVR line
Figure 7
PRES
SURE ESPVR
VOLUME
EesEes
EDPVRβ
V75
Chapter 3 Murine left ventricular pressure-volume loops
15
could better be taken at a constant pressure level in the physiological range for example
between 50 and 100 mm Hg (16) The volume intercept at a constant pressure (eg V75)
reflects myocardial contractility as it indicates the extent of contraction Increased myocardial
contractility for instance during beta-adrenergic stimulation with isoprenaline results in a
steeper ESPVR-slope and a leftward shift on the volume axis while attenuated contractility
for example during clinical heart failure results in a concomitantly plain slope and a
rightward shift on the volume axis The slope of the ESPVR (Ees) is used to describe the left
ventricular elastance Arterial elastance (Ea) a measure for ventricular afterload is described
by the slope of the relationship between stroke volume and end-systolic pressure (figure 8)
Fig 8 Arterial-ventricular coupling Ventricular elastance is estimated from the end-
systolic PV relationship (ESPVR) slope Ees Arterial elastance (Ea) is approximated by the
stroke volumeend-systolic pressure ratio (Ao Pes-SV relationship) The between Ea and Ees
reflects the coupling between the left ventricle and the arterial circulation The production of
stroke work is maximal when the Ea and Ees are approximately equal
Figure 8
Ea Ees
VOLUME
PRES
SURE
PRESSURE
PV-relat
ion Ao PES ndash SV relation
Chapter 3 Murine left ventricular pressure-volume loops
16
The production of stroke work is maximal when the Ees and Ea are approximately
equal Stroke work attenuates substantially in relation to its maximal value whenever Ea and
Ees differ markedly (1718) The preload-recruitable stroke work (PRSW) is the relationship
between end-diastolic volume and performed stroke work by the ventricle It is a load-
independent measure of contractility related to preload The contractile state of the heart is
resembled by the steepness of the PRSW-slope In a high contractile state the heart is able to
perform more stroke work at a constant end-diastolic volume for instance by augmenting the
ejection fraction
Diastolic function is derived from the end-diastolic PV relationship (EDPVR) which
correlates with the compliance of the ventricular myocardium Diastolic dysfunctioning or
failure is observed by an inappropriate upward shift of the ESPVR The slope of the EDPVR
(β) increases during augmented stiffness of the ventricular wall when pressure rises
progressively more during ventricular filling The opposite occurs in case of increased
compliance Certain cardiac diseases and remodeling processes are correlated with increased
stiffness of the ventricular wall by collagen deposition resulting in an increase of the
EDPVR-slope (19)
Numerous other relationships can be assessed The limits are determined by the
interests and the creativity of the investigator
Chapter 3 Murine left ventricular pressure-volume loops
17
Results of PV-measurements with the open- (OC) and closed-chest (CC) approach
A comparative study was performed to determine scientifically based arguments for
the choice between open- (OC) or closed-chest (CC) PV measurements to examine murine
cardiac function Comparing cardiac performance between OC and CC protocols revealed
overall relatively similar values for the investigated parameters (table 3) The values for LV
volumes were corrected for ρ determined at 124 Ωcm in the used setup (N = 10 12352 plusmn
088 Ωcm) α (N = 13 030) and Vc Vc was determined during all PV experiments by the
hypertonic saline injection method No significant differences could be detected between CC
and OC instrumentation (9469 plusmn 483 microl versus 9272 plusmn 205 microl respectively NS) The 4 microl
30 saline demonstrated to be sufficient to change blood conductivity Moreover as this
volume encompasses only 15 of the normal murine end-diastolic volume it proved to be too
small to influence LV end-diastolic and end-systolic pressures (figure 4) in either OC or CC
mice
Several differences were found between the OC and CC approaches (table 3) Cardiac
function in the OC approach was characterized by higher ejection fractions (EF 69 versus
48 respectively) larger stroke volume (1998 versus 1470 microl respectively) and a leftward
shift in ventricular volume On the contrary measuring cardiac function with an intact thorax
resulted in higher end-systolic pressures (ESP OC 52 versus CC 65 mmHg with urethane
anesthesia) and a higher rate of relaxation as indicated by the dPdtmin No differences were
found in the PV relationships ie the ESPVR EDPVR or PRSW Interestingly the OC
approach did result in a mismatch between arterial afterload and ventricular work The
arterial-ventricular elastance ratio (EaEes) was significantly depressed following opening of
the chest In contrast EaEes ratios were normal (ie ~ 10) in the CC approach under both
regimens This finding is consistently found in open-chest instrumented mice (8) The arterial-
ventricular coupling mismatch was depending on arterial resistance the slope of the ESPVR
Chapter 3 Murine left ventricular pressure-volume loops
18
Table 1 Comparison of volume derived by ultrasonography and conductance
Descriptive statistics of alphaN Min Max Mean SEM
EDV 13 018 045 030 002ESV 13 016 094 051 007SV 13 009 058 026 004
Regression analysis
N
RR2
Adjusted R2
SEE
EDV13
082068065179
ESV13
083069066172
SV13
041017009117
Chapter 3 Murine left ventricular pressure-volume loops
19
Left ventricular volume was measured by both ultrasonography
and conductance in adult C57Bl6 mice End-diastolic end-
systolic and stroke volume were used to obtain alpha (α)
Descriptive analysis shows that α determination at the end-
diastolic moment results in the most consistent mean α Also
the correlation of LV volume values between ultrasonography
and conductance is high as shown by the regression analysis
SEM indicates standard error of the mean SEE standard error
of the estimate
EDVECHO (microl)120100806040200
EDV C
ON
DUC
TAN
CE (micro
l)
18
16
14
12
10
8
6
SCATTERPLOT OF END-DIASTOLIC VOLUMECONDUCTANCE VS ULTRASONOGRAPHY
EDVECHO (microl)120100806040200
EDV C
ON
DUC
TAN
CE (micro
l)
18
16
14
12
10
8
6
EDVECHO (microl)120100806040200
EDV C
ON
DUC
TAN
CE (micro
l)
18
16
14
12
10
8
6
SCATTERPLOT OF END-DIASTOLIC VOLUMECONDUCTANCE VS ULTRASONOGRAPHY
Chapter 3 Murine left ventricular pressure-volume loops
20
Table 2 Parameters derived by pressure-volume loops
Abbreviations DefinitionsGeneral parameters
CI (CI = CObody wt) CO HR
Card iac indexCard iac outputHeart rate
PressuredPdtmax
dPdtmin
PedPesτ
Maximum derivative of change in systolic pressure in timeMaximum derivative of change in diastolic pressure in timeEnd-diastolic pressureEnd-systolic pressureTime constant of isovolumic relaxation
VolumeEFSI (SI = SVbody wt)SVVedVes
Ejection fractionStroke index Stroke volumeEnd-diastolic pressureEnd-systolic pressure
Pressure-volume relationshipsβEa (Ea = PesSV)EDPVREes
Slope of the end-diastolic pressure-volume relat ionshipArterial elastanceEnd-diastolic pressure-volume relat ionshipEnd-systolic ventricular elastance
EmaxESPVR
(slope of the end-systolic pressure-volume relationship)Maximum chamber elasticity (∆P∆V)End-systolic pressure-volume relat ionship
Pressure-volume areaEfficiencyEWPEPRSWPVASWSWI (SWI = SWbody wt)
EWPVAExternal work = SWPotential energyPreload-recruitable stroke workPressure-volume area = EW + PEStroke workStroke work index
Abbreviations DefinitionsGeneral parameters
CI (CI = CObody wt) CO HR
Card iac indexCard iac outputHeart rate
PressuredPdtmax
dPdtmin
PedPesτ
Maximum derivative of change in systolic pressure in timeMaximum derivative of change in diastolic pressure in timeEnd-diastolic pressureEnd-systolic pressureTime constant of isovolumic relaxation
VolumeEFSI (SI = SVbody wt)SVVedVes
Ejection fractionStroke index Stroke volumeEnd-diastolic pressureEnd-systolic pressure
Pressure-volume relationshipsβEa (Ea = PesSV)EDPVREes
Slope of the end-diastolic pressure-volume relat ionshipArterial elastanceEnd-diastolic pressure-volume relat ionshipEnd-systolic ventricular elastance
EmaxESPVR
(slope of the end-systolic pressure-volume relationship)Maximum chamber elasticity (∆P∆V)End-systolic pressure-volume relat ionship
Pressure-volume areaEfficiencyEWPEPRSWPVASWSWI (SWI = SWbody wt)
EWPVAExternal work = SWPotential energyPreload-recruitable stroke workPressure-volume area = EW + PEStroke workStroke work index
EmaxESPVR
(slope of the end-systolic pressure-volume (slope of the end-systolic pressure-volume relationship)Maximum chamber elasticity (∆P∆V)End-systolic pressure-volume relat ionship
Pressure-volume areaEfficiencyEWPEPRSWPVASWSWI (SWI = SWbody wt)
EWPVAExternal work = SWPotential energyPreload-recruitable stroke workPressure-volume area = EW + PEStroke workStroke work index
Chapter 3 Murine left ventricular pressure-volume loops
21
(Ees) proved to be equal in OC and CC instrumented mice The combination of enlarged
stroke volume with attenuated systolic pressures leads to a decrease in arterial elastance The
altered arterial elastance could be explained by the opening of the thorax A drop in overall
peripheral vascular resistance from baseline values has been described during thoracoscopy
(20)
Urethane
Volume (microl)
Pres
sure
(mm
Hg)
Pentobarbital
Volume (microl)
Pres
sure
(mm
Hg)
A
B
CCOCCCCCOCOC
CCOCCCCCOCOC
-100
102030405060708090
-10
0
10
20
30
40
50
60
0 5 10 15 20 25 30 35 400 5 10 15 20 25 30 35 40
0 5 10 15 20 25 30 35 400 5 10 15 20 25 30 35 40
Figure 9
Chapter 3 Murine left ventricular pressure-volume loops
22
Fig 9 Left ventricular pressure-volume loops Pressure presented in mmHg and volume microl
A Representative figure of PV loops acquired during urethane anesthesia in closed chest
(CC) and open chest (OC) instrumented mice B Representative figure of PV loops acquired
during pentobarbital anesthesia in CC and OC instrumented mice Loops are acquired during
an occlusion of the inferior caval vein Venous returns decreases which is represented in the
loops by attenuation of both pressure and volume The differences in ESP SW and ESPVR
between urethane and pentobarbital anesthesia can be observed by analyzing the loops in A
and B The loops show also the larger stroke volume and depressed systolic pressure in OC
instrumented mice
Figure 9 shows representative PV-loops while venous return was attenuated following
inferior caval vein occlusion Typical pressure and volume effects are depicted showing the
absence of apparent differences in PV relationships The mentioned differences in ESP SV
and EF are evident in the presented loops though
ECG recordings were made during both surgical protocols to detect possible heart rate
alterations and arrhythmias Murine left ventricular PV measurements could be distorted by
physiological responses to the catheterization Heart rate alterations could be anticipated
especially in relation to carotid sinus stimulation while cannulating of the carotid artery
However neither bradycardia nor other arrhythmias were observed during either CC or OC
procedures (figure 10) This finding indicates that cannulation of the right common carotid
artery does not alter heart rate by carotid sinus stimulation
Chapter 3 Murine left ventricular pressure-volume loops
23
Table 3 Functional parameters to determine baseline LV functioning in open- and closed-
chest protocols during steady-state measurement
URETHANE PENTOBARBITALOC CC OC CC
N = 5 N = 5 N = 10 N = 10
Mean plusmn SEM Mean plusmn SEM Mean plusmn SEM Mean plusmn SEM
HR 583 plusmn 20 658 plusmn 21 493 plusmn 25 481 plusmn 36SVdagger 1958 plusmn 351 1557 plusmn 254 2018 plusmn 183 1426 plusmn 103CO 12 plusmn 2 10 plusmn 2 10 plusmn 1 7 plusmn 0Vmaxdagger 1761 plusmn 053 2361 plusmn 223 3089 plusmn 289 3883 plusmn 230Vmindagger 215 plusmn 133 679 plusmn 180 1029 plusmn 189 2373 plusmn 199EFdagger 79 plusmn 6 66 plusmn 8 66 plusmn 4 39 plusmn 2
ESPdagger 52 plusmn 4 65 plusmn 5 42 plusmn 3 47 plusmn 4EDP 1 plusmn 1 -1 plusmn 1 -6 plusmn 2 1 plusmn 1
dPdtmax 7200 plusmn 1349 8252 plusmn 1685 4004 plusmn 629 3718 plusmn 684dPdtmindagger -4233 plusmn 531 -7577 plusmn 750 -3631 plusmn 424 -3348 plusmn 653Tau 10 plusmn 0 7 plusmn 0 12 plusmn 1 14 plusmn 2
SW 1066 plusmn 245 1147 plusmn 213 1076 plusmn 176 666 plusmn 116
EaEesdagger 065 plusmn 020 084 plusmn 016 060 plusmn 005 103 plusmn 015ESPVR 570 plusmn 094 589 plusmn 074 347 plusmn 027 318 plusmn 052EDPVR 009 plusmn 009 -008 plusmn 015 -015 plusmn 014 -005 plusmn 015PRSW 79 plusmn 14 64 plusmn 6 68 plusmn 10 53 plusmn 3
Results from LV pressure-volume measurements in C57Bl6 mice anesthetized by urethane or
pentobarbital Urethane versus pentobarbital P lt 005 dagger OC versus CC P lt 005 ρ Valued
124 Ωcm α 030 Open- (OC) and closed-chest (CC) protocols HR indicates heart rate in
bpm SV left ventricular stroke volume in microl CO cardiac output mlmin Vmin minimal left
ventricular volume in microl Vmax maximal left ventricular volume in microl EF ejection fraction in
ESP left ventricular end-systolic pressure in mmHg EDP left ventricular end-diastolic
pressure in mmHg dPdtmax maximal first derivative of left ventricular pressure in mmHgs
dPdtmin minimal first derivative of left ventricular pressure in mmHgs Tau time constant of
left ventricular relaxation in ms SW stroke work in mmHgmicrol Ea arterial elastance Ees
ventricular end-systolic elastance ESPVR left ventricular end-systolic PV relationship in
Chapter 3 Murine left ventricular pressure-volume loops
24
mmHgmicrol EDPVR left ventricular end-diastolic PV relationship in mmHgmicrol PRSW left
ventricular preload-recruitable stroke work in mmHg
The steady-state functional parameters from OC and CC instrumented mice during
either urethane or pentobarbital are also depicted in Table 2 The use of pentobarbital
anesthesia had a cardiodepressive effect that was represented by significant function decline
in most parameters EF dPdtMAX and ESPVR decreased respectively with 24 57 and 41
upon pentobarbital use compared to urethane anesthesia Pentobarbital therefore had strong
negative chronotropic and inotropic effects
Hear
trat
e(b
pm)
Heart rate trace in closed-chest animal
0
100
200
300
400
500
600
700
Time (minutes)
arterial canulation
A
0 1 2 3 4 5 6 7 8 9 10 11 12 13 14 15 16
Heart rate trace in open-chest animal
0
100
200
300
400
500
600
700
Time (minutes)
Hear
trat
e(b
pm)
Ventricular catheterisation
B
0 1 2 3 4 5 6 7 8 9 10 11 12 13 14
Figure 10
Chapter 3 Murine left ventricular pressure-volume loops
25
Fig 10 Heart rate tracings in closed chest and open chest instrumented mice
A Representative figure of a heart rate tracing in a closed-chest instrumented mouse The
moment of arterial cannulation is indicated Some arrhythmias are seen in response to
introduction of the catheter into the left ventricle Arrhythmias are only present in a short
time-period that is part of the stabilization period following catheter introduction Heart rate
remains unchanged during the measurements B Representative figure of a heart rate tracing
in an open-chest instrumented mouse Somewhat more pronounced chronotropic arrhythmias
are seen in response to ventricular introduction of the catheter by apical stab However no
significant brady- or tachycardias are present during the measurements
Chapter 3 Murine left ventricular pressure-volume loops
26
Discussion
In this chapter OC and CC protocols for in vivo left ventricular PV relationship
measurement are described and discussed Murine cardiac function determination via these
methods is sensitive reproducible and comparable The choice for open- or closed-chest PV
measurements in mice depends on the aim of the study with regards to the specific cardiac
pathology The OC approach is technically less complicated and less time consuming Main
characteristics of the OC model itself are low systolic pressures and arterial resistance The
OC approach could best be used in studies where myocardial integrity is not at stake
Particularly ischemiareperfusion studies regarding myocardial integrity are probably better
done using the CC approach
Assessment of cardiac performance in genetically engineered mice is indispensable to
understand human cardiovascular pathologies In general the synergistic features of cardiac
diseases such as hypertrophy and cell death affect cardiac function negatively The
contractile performance of the heart deteriorates which is reflected in the attenuation of
systolic parameters as ejection fraction stroke work and PV-relationships Furthermore
ventricular relaxation prolongs and diastolic filling becomes impaired The progression of
cardiac disease ultimately results in clinical heart failure which is defined by the inability of
the heart to meet hemodynamic demands of the body and is characterized by specific signs
and symptoms (21) The most important parameter of cardiac performance which defines
heart failure is cardiac output
The influence on cardiac performance of specific genes and proteins in the
development of cardiac diseases ought to be investigated extensively to assess their clinical
relevance Various techniques have been used to assess cardiac performance in mice The
main techniques will be discussed in brief
Chapter 3 Murine left ventricular pressure-volume loops
27
Echocardiography is the most widely used noninvasive technique to determine cardiac
performance in mice High-frequency transthoracic and transesophageal transducers are used
as effective tools for two-dimensional and Doppler imaging of ventricular wall structures
dimensions and volumes of cavum and cardiac function (2223) Full-conscious or gas-
anesthesia experiments are preferred for echocardiographic assessment of cardiac function in
mice (2425) There is no limit to the diversity of murine models investigated by this general
accepted method of cardiac performance assessment However the most questionable aspect
of these measurements is the significant inter- and intraobservator variance in the
measurements
Isolated working mouse heart measurements in a Langendorf perfusion setup are a
technique for ex vivo cardiac function measurements approximating the in vivo function level
(5) Cardiac output developed left ventricular pressure and first derivates of maximal and
minimal pressures are some of the parameters that can be derived Isolated working heart
measurements are especially useful to study the acute effects of ischemic preconditioning and
ischemia-induced apoptosis(2627) Metabolites of interest can be measured accurately in the
perfusion fluid Disadvantages are the impossibility of chronic studies and the
unphysiological situation of ex vivo cardiac function measurements
Aortic flow measurements by means of a flow-probe have been used in several
studies (2829) Aortic flow acquisition is a validated technique and reveals functional
parameters as cardiac output stroke volume and blood flow velocity However several
disadvantages oppose against this technique Firstly aortic flow measurements are invasive
(ie thoracotomy or laparotomy) and result solely in aortic derived volume parameters
Integrated ventricular function cannot be assessed More importantly the exact localization of
the flow probe around the aorta is the critical determinant of the systematic error made by
these measurements Flow probes have been placed around the ascending and descending
Chapter 3 Murine left ventricular pressure-volume loops
28
thoracic aorta and the abdominal aorta The percentage of total cardiac output passing the
flow probe on the specific location has to be estimated Flow probes located at the ascending
aorta correct for coronary circulation and for instance bloodvolume passing the descending
thoracic aorta has been estimated to be around 75 of total cardiac output (30) The estimated
correction factor provides lsquoabsolutersquo stroke volume instead of absolute LV cavum volumes
and does not correct for cardiophysiological changes Altered cardiophysiological situations
could theoretically influence the relative amount of bloodvolume passing the flow probe On
the other hand major advances are the possibility of chronic cardiac function measurements
and the relative facile manner of data acquirement(29) Moreover aortic flow probe
measurements are not hampered by deleterious cardiac remodeling in myocardial ischemia or
hypertrophy studies(2829)
The newly developed method of cardiac performance assessment by in vivo left
ventricular PV measurements in the CC model is introduced here Left ventricular PV
measurements in vivo provide an accurate assessment of murine cardiac function The method
is highly sensitive during open- and closed-chest approaches in determining alterations in left
ventricular function as result of cardiac disease or altered hemodynamic stress The
characteristics of simultaneous left ventricular pressure and volume measurements enable the
researcher to directly investigate pressure-related cardiac diseases as cardiac hypertrophy and
restrictive cardiomyopathy (31) or volume-related diseases as dilated cardiomyopathy (32)
Moreover the effective influence of both aspects of cardiac disease on each other can be
observed in detail For instance ventricular dilation and subsequent decrease in ventricular
systolic pressure is mapped accurately in PV-loops Continuous measurements provide
possibilities to investigate the complete cardiac cycle Basic aspects of cardiac physiology can
be visualized using PV-loops in mice (81533-35) For instance increase in ventricular filling
is followed by an increase in ejection fraction according to the Frank-Starling mechanism
Chapter 3 Murine left ventricular pressure-volume loops
29
The opposite is seen as a result of gradual venous return decrease in the case of transient caval
vein occlusion (figure 7 amp 9) Moreover the distinction between systolic and diastolic failure
can be made through continuous PV-measurements (19) Systolic heart failure encompasses
mainly an ejection dysfunction with impaired contractility Both aspects are obtained by and
directly visualized through PV-loops Additionally the definite diagnosis of diastolic failure
is dependent on the observation of an inappropriate upward shift of the (end-)diastolic PV
relationship requiring cardiac catheterization for continuous volume determinations using
impedance measurements and high-fidelity measurements of ventricular pressure with a
micromanometer (19) PV-loops are useful determining cardiac performance within the
complete continuum of healthy and diseased hearts
Chapter 3 Murine left ventricular pressure-volume loops
30
Conclusion
In vivo PV measurements provide an essential tool in the assessment of cardiac
function in genetically modified mice Open- and closed-chest surgical protocols for murine
cardiac function determination are sensitive reproducible and comparable PV-loops enable
the researcher to accurately investigate diverse murine models of cardiac pathology by
adequately visualizing the cause-and-effect relationship between genetic modification and
their functional outcome Changes in ventricular contractility are best detected by PV derived
parameters in comparison to other methods of cardiac function determination
Chapter 3 Murine left ventricular pressure-volume loops
31
References
1 Doevendans PA Daemen MJ de Muinck ED Smits JF Cardiovascular phenotypingin mice Cardiovasc Res 19983934-49
2 Hoit BD New approaches to phenotypic analysis in adult mice J Mol Cell Cardiol20013327-35
3 Chacko VP Aresta F Chacko SM Weiss RG MRIMRS assessment of in vivomurine cardiac metabolism morphology and function at physiological heart rates AmJ Physiol Heart Circ Physiol 2000279H2218-24
4 Tanaka N Dalton N Mao L et al Transthoracic echocardiography in models ofcardiac disease in the mouse Circulation 1996941109-17
5 De Windt LJ Willems J Reneman RS Van der Vusse GJ Arts T Van Bilsen M Animproved isolated left ventricular ejecting murine heart model Functional andmetabolic evaluation Pflugers Arch 1999437182-90
6 Palmen M Daemen MJ Buehler A et al Impaired cardiac remodeling and functionafter myocardial infarction in FGF-1 transgenic mice Circulation 1999100250
7 Rockman HA Hamilton RA Jones LR Milano CA Mao L Lefkowitz RJ Enhancedmyocardial relaxation in vivo in transgenic mice overexpressing the beta2-adrenergicreceptor is associated with reduced phospholamban protein J Clin Invest1996971618-23
8 Georgakopoulos D Mitzner WA Chen CH et al In vivo murine left ventricularpressure-volume relations by miniaturized conductance micromanometry Am JPhysiol 1998274H1416-22
9 Dekker AL Geskes GG Cramers AA et al Right ventricular support for off-pumpcoronary artery bypass grafting studied with bi-ventricular pressure-volume loops insheep Eur J Cardiothorac Surg 200119179-84
10 Schreuder JJ Steendijk P van der Veen FH et al Acute and short-term effects ofpartial left ventriculectomy in dilated cardiomyopathy assessment by pressure-volumeloops J Am Coll Cardiol 2000362104-14
11 Zimmer HG Measurement of left ventricular hemodynamic parameters in closed-chest rats under control and various pathophysiologic conditions Basic Res Cardiol19837877-84
12 Georgakopoulos D Kass DA Estimation of parallel conductance by dual-frequencyconductance catheter in mice Am J Physiol Heart Circ Physiol 2000279H443-50
13 Feldman MD Mao Y Valvano JW Pearce JA Freeman GL Development of amultifrequency conductance catheter-based system to determine LV function in miceAm J Physiol Heart Circ Physiol 2000279H1411-20
14 Kornet L Schreuder JJ Van de Velden ET Jansen JR The volume-dependency ofparallel conductance throughout the cardiac cycle and its consequence for volumeestimation of the left ventricle in patients Cardiovasc Res 200151729-35
15 Nemoto S DeFreitas G Mann DL Carabello BA Effects of changes in leftventricular contractility on indexes of contractility in mice Am J Physiol Heart CircPhysiol 2002283H2504-10
16 Baan J Van de Velden ET Steendijk P Ventricular pressure-volume relations in vivoEur Heart J 199213 SupplE2-6
17 Little WC Cheng CP Left ventricular-arterial coupling in conscious dogs Am JPhysiol 1991261H70-6
18 Sunagawa K Maughan WL Sagawa K Optimal arterial resistance for the maximalstroke work studied in isolated canine left ventricle Circ Res 198556586-95
Chapter 3 Murine left ventricular pressure-volume loops
32
19 Van Kraaij D Van Pol P Ruiters AW et al Diagnosing diastolic heart failure Eur JHeart Fail 20024419-30
20 Faunt KK Cohn LA Jones BD Dodam JR Cardiopulmonary effects of bilateralhemithorax ventilation and diagnostic thoracoscopy in dogs Am J Vet Res1998591494-8
21 Lips DJ Van Kraaij DL De Windt LJ Doevendans PA Molecular determinants ofmyocardial hypertrophy and failure alternative pathways for beneficial andmaladaptive hypertrophy Eur Heart J 200324883-96
22 Collins KA Korcarz CE Lang RM Use of echocardiography for the phenotypicassessment of genetically altered mice Physiol Genomics 200313227-39
23 Scherrer-Crosbie M Steudel W Hunziker PR et al Determination of right ventricularstructure and function in normoxic and hypoxic mice a transesophagealechocardiographic study Circulation 1998981015-21
24 Takuma S Suehiro K Cardinale C et al Anesthetic inhibition in ischemic andnonischemic murine heart comparison with conscious echocardiographic approachAm J Physiol Heart Circ Physiol 2001280H2364-70
25 Chaves AA Weinstein DM Bauer JA Non-invasive echocardiographic studies inmice influence of anesthetic regimen Life Sci 200169213-22
26 Yamaura G Turoczi T Yamamoto F Siddqui MA Maulik N Das DK STATsignaling in ischemic heart a role of STAT5A in ischemic preconditioning Am JPhysiol Heart Circ Physiol 2003285H476-82
27 Bell RM Yellon DM Atorvastatin administered at the onset of reperfusion andindependent of lipid lowering protects the myocardium by up-regulating a pro-survival pathway J Am Coll Cardiol 200341508-15
28 Aartsen WM Schuijt MP Danser AH Daemen MJ Smits JF The role of locallyexpressed angiotensin converting enzyme in cardiac remodeling after myocardialinfarction in mice Cardiovasc Res 200256205-13
29 Janssen B Debets J Leenders P Smits J Chronic measurement of cardiac output inconscious mice Am J Physiol Regul Integr Comp Physiol 2002282R928-35
30 Georgakopoulos D Christe ME Giewat M Seidman CM Seidman JG Kass DA Thepathogenesis of familial hypertrophic cardiomyopathy early and evolving effects froman alpha-cardiac myosin heavy chain missense mutation Nat Med 19995327-30
31 Liao P Georgakopoulos D Kovacs A et al The in vivo role of p38 MAP kinases incardiac remodeling and restrictive cardiomyopathy Proc Natl Acad Sci U S A20019812283-8
32 McConnell BK Jones KA Fatkin D et al Dilated cardiomyopathy in homozygousmyosin-binding protein-C mutant mice J Clin Invest 19991041235-44
33 Georgakopoulos D Kass DA Minimal force-frequency modulation of inotropy andrelaxation of in situ murine heart J Physiol 2001534535-45
34 Yang B Larson DF Watson R Age-related left ventricular function in the mouseanalysis based on in vivo pressure-volume relationships Am J Physiol1999277H1906-13
35 Reyes M Freeman GL Escobedo D Lee S Steinhelper ME Feldman MDEnhancement of contractility with sustained afterload in the intact murine heartblunting of length-dependent activation Circulation 20031072962-8
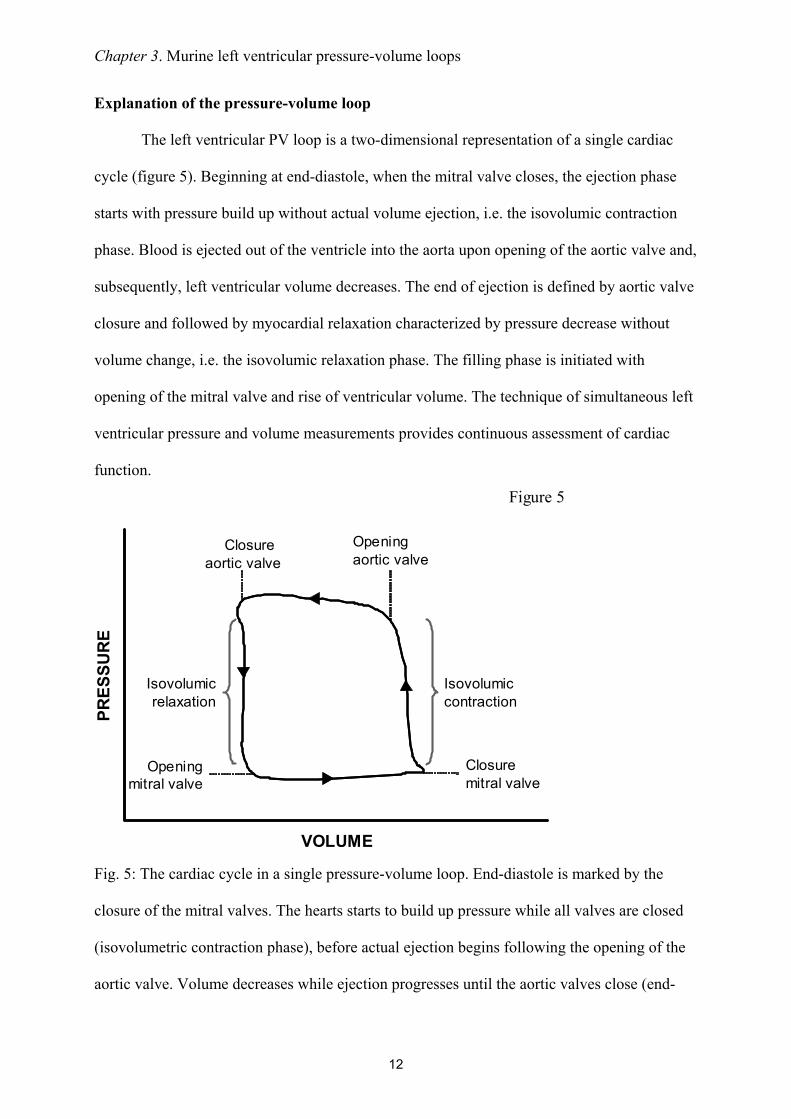
Chapter 3 Murine left ventricular pressure-volume loops
12
Explanation of the pressure-volume loop
The left ventricular PV loop is a two-dimensional representation of a single cardiac
cycle (figure 5) Beginning at end-diastole when the mitral valve closes the ejection phase
starts with pressure build up without actual volume ejection ie the isovolumic contraction
phase Blood is ejected out of the ventricle into the aorta upon opening of the aortic valve and
subsequently left ventricular volume decreases The end of ejection is defined by aortic valve
closure and followed by myocardial relaxation characterized by pressure decrease without
volume change ie the isovolumic relaxation phase The filling phase is initiated with
opening of the mitral valve and rise of ventricular volume The technique of simultaneous left
ventricular pressure and volume measurements provides continuous assessment of cardiac
function
Fig 5 The cardiac cycle in a single pressure-volume loop End-diastole is marked by the
closure of the mitral valves The hearts starts to build up pressure while all valves are closed
(isovolumetric contraction phase) before actual ejection begins following the opening of the
aortic valve Volume decreases while ejection progresses until the aortic valves close (end-
Closure aortic valve
VOLUME
PRES
SUR
E
Figure 5
Opening aortic valve
Isovolumicrelaxation
Isovolumiccontraction
Closure mitral valve
Openingmitral valve
Chapter 3 Murine left ventricular pressure-volume loops
13
systole) and relaxation starts Aortic and mitral valves are closed during relaxation
(isovolumic relaxation phase) The filling phase follows upon the opening of the mitral valve
and volume increase while pressure build up is minor
PV loops reveal in first instance the standard functional parameters (figure 6)
Fig 6 Cardiac performance parameters in the pressure-volume loop ED indicates end-
diastole ES end-systole Ved end-diastolic volume Ves end-systolic volume Ped end-
diastolic pressure Pes end-systolic pressure The area of the PV loop resembles stroke work
(SW) Stroke volume SV can be derived by subtracting Ves from Ved
However specific PV relationships are acquired too (table 2 figure 7) These
relationships describe the contractile and relaxative capabilities of the heart independent of
preload afterload or heart rate Transient occlusion of the inferior caval vein in mice is
performed to obtain these relationships Caval vein occlusion leads to a decrease in venous
return and thereby in preload of the left ventricle The response of the heart is typical as
Figure 6
VOLUME
PRES
SURE
ES
ED
Pes
Ved Ves
Ped
SV
SW
Chapter 3 Murine left ventricular pressure-volume loops
14
presented in figure 7 and shows the PV correlations Contractile parameters derived from PV-
correlations best detect small alterations in contractility in mice (15)
Fig 7 Pressure-volume relationships Variably loaded PV loops are used to define several PV
relationships The variable loading is derived by occluding the inferior caval vein and thereby
reducing venous return The end-systolic PV relationship (ESPVR) describes the contractile
performance of the left ventricle Contractility is linear correlated with the steepness of the
ESPVR slope ie Ees The end-diastolic PV relationship (EDPVR) describes diastolic
performance for instance diastolic distensibility The slope of the EDPVR (β) indicates the
passive chamber stiffness
The end-systolic PV relationship (ESPVR) describes the relation between volume and
pressure changes in systole Within the physiological range this relationship approximates a
straight line The relationship can be described in terms of its slope which reflects myocardial
contractility and its volume axis intercept V0 The volume intercept from the ESPVR line
Figure 7
PRES
SURE ESPVR
VOLUME
EesEes
EDPVRβ
V75
Chapter 3 Murine left ventricular pressure-volume loops
15
could better be taken at a constant pressure level in the physiological range for example
between 50 and 100 mm Hg (16) The volume intercept at a constant pressure (eg V75)
reflects myocardial contractility as it indicates the extent of contraction Increased myocardial
contractility for instance during beta-adrenergic stimulation with isoprenaline results in a
steeper ESPVR-slope and a leftward shift on the volume axis while attenuated contractility
for example during clinical heart failure results in a concomitantly plain slope and a
rightward shift on the volume axis The slope of the ESPVR (Ees) is used to describe the left
ventricular elastance Arterial elastance (Ea) a measure for ventricular afterload is described
by the slope of the relationship between stroke volume and end-systolic pressure (figure 8)
Fig 8 Arterial-ventricular coupling Ventricular elastance is estimated from the end-
systolic PV relationship (ESPVR) slope Ees Arterial elastance (Ea) is approximated by the
stroke volumeend-systolic pressure ratio (Ao Pes-SV relationship) The between Ea and Ees
reflects the coupling between the left ventricle and the arterial circulation The production of
stroke work is maximal when the Ea and Ees are approximately equal
Figure 8
Ea Ees
VOLUME
PRES
SURE
PRESSURE
PV-relat
ion Ao PES ndash SV relation
Chapter 3 Murine left ventricular pressure-volume loops
16
The production of stroke work is maximal when the Ees and Ea are approximately
equal Stroke work attenuates substantially in relation to its maximal value whenever Ea and
Ees differ markedly (1718) The preload-recruitable stroke work (PRSW) is the relationship
between end-diastolic volume and performed stroke work by the ventricle It is a load-
independent measure of contractility related to preload The contractile state of the heart is
resembled by the steepness of the PRSW-slope In a high contractile state the heart is able to
perform more stroke work at a constant end-diastolic volume for instance by augmenting the
ejection fraction
Diastolic function is derived from the end-diastolic PV relationship (EDPVR) which
correlates with the compliance of the ventricular myocardium Diastolic dysfunctioning or
failure is observed by an inappropriate upward shift of the ESPVR The slope of the EDPVR
(β) increases during augmented stiffness of the ventricular wall when pressure rises
progressively more during ventricular filling The opposite occurs in case of increased
compliance Certain cardiac diseases and remodeling processes are correlated with increased
stiffness of the ventricular wall by collagen deposition resulting in an increase of the
EDPVR-slope (19)
Numerous other relationships can be assessed The limits are determined by the
interests and the creativity of the investigator
Chapter 3 Murine left ventricular pressure-volume loops
17
Results of PV-measurements with the open- (OC) and closed-chest (CC) approach
A comparative study was performed to determine scientifically based arguments for
the choice between open- (OC) or closed-chest (CC) PV measurements to examine murine
cardiac function Comparing cardiac performance between OC and CC protocols revealed
overall relatively similar values for the investigated parameters (table 3) The values for LV
volumes were corrected for ρ determined at 124 Ωcm in the used setup (N = 10 12352 plusmn
088 Ωcm) α (N = 13 030) and Vc Vc was determined during all PV experiments by the
hypertonic saline injection method No significant differences could be detected between CC
and OC instrumentation (9469 plusmn 483 microl versus 9272 plusmn 205 microl respectively NS) The 4 microl
30 saline demonstrated to be sufficient to change blood conductivity Moreover as this
volume encompasses only 15 of the normal murine end-diastolic volume it proved to be too
small to influence LV end-diastolic and end-systolic pressures (figure 4) in either OC or CC
mice
Several differences were found between the OC and CC approaches (table 3) Cardiac
function in the OC approach was characterized by higher ejection fractions (EF 69 versus
48 respectively) larger stroke volume (1998 versus 1470 microl respectively) and a leftward
shift in ventricular volume On the contrary measuring cardiac function with an intact thorax
resulted in higher end-systolic pressures (ESP OC 52 versus CC 65 mmHg with urethane
anesthesia) and a higher rate of relaxation as indicated by the dPdtmin No differences were
found in the PV relationships ie the ESPVR EDPVR or PRSW Interestingly the OC
approach did result in a mismatch between arterial afterload and ventricular work The
arterial-ventricular elastance ratio (EaEes) was significantly depressed following opening of
the chest In contrast EaEes ratios were normal (ie ~ 10) in the CC approach under both
regimens This finding is consistently found in open-chest instrumented mice (8) The arterial-
ventricular coupling mismatch was depending on arterial resistance the slope of the ESPVR
Chapter 3 Murine left ventricular pressure-volume loops
18
Table 1 Comparison of volume derived by ultrasonography and conductance
Descriptive statistics of alphaN Min Max Mean SEM
EDV 13 018 045 030 002ESV 13 016 094 051 007SV 13 009 058 026 004
Regression analysis
N
RR2
Adjusted R2
SEE
EDV13
082068065179
ESV13
083069066172
SV13
041017009117
Chapter 3 Murine left ventricular pressure-volume loops
19
Left ventricular volume was measured by both ultrasonography
and conductance in adult C57Bl6 mice End-diastolic end-
systolic and stroke volume were used to obtain alpha (α)
Descriptive analysis shows that α determination at the end-
diastolic moment results in the most consistent mean α Also
the correlation of LV volume values between ultrasonography
and conductance is high as shown by the regression analysis
SEM indicates standard error of the mean SEE standard error
of the estimate
EDVECHO (microl)120100806040200
EDV C
ON
DUC
TAN
CE (micro
l)
18
16
14
12
10
8
6
SCATTERPLOT OF END-DIASTOLIC VOLUMECONDUCTANCE VS ULTRASONOGRAPHY
EDVECHO (microl)120100806040200
EDV C
ON
DUC
TAN
CE (micro
l)
18
16
14
12
10
8
6
EDVECHO (microl)120100806040200
EDV C
ON
DUC
TAN
CE (micro
l)
18
16
14
12
10
8
6
SCATTERPLOT OF END-DIASTOLIC VOLUMECONDUCTANCE VS ULTRASONOGRAPHY
Chapter 3 Murine left ventricular pressure-volume loops
20
Table 2 Parameters derived by pressure-volume loops
Abbreviations DefinitionsGeneral parameters
CI (CI = CObody wt) CO HR
Card iac indexCard iac outputHeart rate
PressuredPdtmax
dPdtmin
PedPesτ
Maximum derivative of change in systolic pressure in timeMaximum derivative of change in diastolic pressure in timeEnd-diastolic pressureEnd-systolic pressureTime constant of isovolumic relaxation
VolumeEFSI (SI = SVbody wt)SVVedVes
Ejection fractionStroke index Stroke volumeEnd-diastolic pressureEnd-systolic pressure
Pressure-volume relationshipsβEa (Ea = PesSV)EDPVREes
Slope of the end-diastolic pressure-volume relat ionshipArterial elastanceEnd-diastolic pressure-volume relat ionshipEnd-systolic ventricular elastance
EmaxESPVR
(slope of the end-systolic pressure-volume relationship)Maximum chamber elasticity (∆P∆V)End-systolic pressure-volume relat ionship
Pressure-volume areaEfficiencyEWPEPRSWPVASWSWI (SWI = SWbody wt)
EWPVAExternal work = SWPotential energyPreload-recruitable stroke workPressure-volume area = EW + PEStroke workStroke work index
Abbreviations DefinitionsGeneral parameters
CI (CI = CObody wt) CO HR
Card iac indexCard iac outputHeart rate
PressuredPdtmax
dPdtmin
PedPesτ
Maximum derivative of change in systolic pressure in timeMaximum derivative of change in diastolic pressure in timeEnd-diastolic pressureEnd-systolic pressureTime constant of isovolumic relaxation
VolumeEFSI (SI = SVbody wt)SVVedVes
Ejection fractionStroke index Stroke volumeEnd-diastolic pressureEnd-systolic pressure
Pressure-volume relationshipsβEa (Ea = PesSV)EDPVREes
Slope of the end-diastolic pressure-volume relat ionshipArterial elastanceEnd-diastolic pressure-volume relat ionshipEnd-systolic ventricular elastance
EmaxESPVR
(slope of the end-systolic pressure-volume relationship)Maximum chamber elasticity (∆P∆V)End-systolic pressure-volume relat ionship
Pressure-volume areaEfficiencyEWPEPRSWPVASWSWI (SWI = SWbody wt)
EWPVAExternal work = SWPotential energyPreload-recruitable stroke workPressure-volume area = EW + PEStroke workStroke work index
EmaxESPVR
(slope of the end-systolic pressure-volume (slope of the end-systolic pressure-volume relationship)Maximum chamber elasticity (∆P∆V)End-systolic pressure-volume relat ionship
Pressure-volume areaEfficiencyEWPEPRSWPVASWSWI (SWI = SWbody wt)
EWPVAExternal work = SWPotential energyPreload-recruitable stroke workPressure-volume area = EW + PEStroke workStroke work index
Chapter 3 Murine left ventricular pressure-volume loops
21
(Ees) proved to be equal in OC and CC instrumented mice The combination of enlarged
stroke volume with attenuated systolic pressures leads to a decrease in arterial elastance The
altered arterial elastance could be explained by the opening of the thorax A drop in overall
peripheral vascular resistance from baseline values has been described during thoracoscopy
(20)
Urethane
Volume (microl)
Pres
sure
(mm
Hg)
Pentobarbital
Volume (microl)
Pres
sure
(mm
Hg)
A
B
CCOCCCCCOCOC
CCOCCCCCOCOC
-100
102030405060708090
-10
0
10
20
30
40
50
60
0 5 10 15 20 25 30 35 400 5 10 15 20 25 30 35 40
0 5 10 15 20 25 30 35 400 5 10 15 20 25 30 35 40
Figure 9
Chapter 3 Murine left ventricular pressure-volume loops
22
Fig 9 Left ventricular pressure-volume loops Pressure presented in mmHg and volume microl
A Representative figure of PV loops acquired during urethane anesthesia in closed chest
(CC) and open chest (OC) instrumented mice B Representative figure of PV loops acquired
during pentobarbital anesthesia in CC and OC instrumented mice Loops are acquired during
an occlusion of the inferior caval vein Venous returns decreases which is represented in the
loops by attenuation of both pressure and volume The differences in ESP SW and ESPVR
between urethane and pentobarbital anesthesia can be observed by analyzing the loops in A
and B The loops show also the larger stroke volume and depressed systolic pressure in OC
instrumented mice
Figure 9 shows representative PV-loops while venous return was attenuated following
inferior caval vein occlusion Typical pressure and volume effects are depicted showing the
absence of apparent differences in PV relationships The mentioned differences in ESP SV
and EF are evident in the presented loops though
ECG recordings were made during both surgical protocols to detect possible heart rate
alterations and arrhythmias Murine left ventricular PV measurements could be distorted by
physiological responses to the catheterization Heart rate alterations could be anticipated
especially in relation to carotid sinus stimulation while cannulating of the carotid artery
However neither bradycardia nor other arrhythmias were observed during either CC or OC
procedures (figure 10) This finding indicates that cannulation of the right common carotid
artery does not alter heart rate by carotid sinus stimulation
Chapter 3 Murine left ventricular pressure-volume loops
23
Table 3 Functional parameters to determine baseline LV functioning in open- and closed-
chest protocols during steady-state measurement
URETHANE PENTOBARBITALOC CC OC CC
N = 5 N = 5 N = 10 N = 10
Mean plusmn SEM Mean plusmn SEM Mean plusmn SEM Mean plusmn SEM
HR 583 plusmn 20 658 plusmn 21 493 plusmn 25 481 plusmn 36SVdagger 1958 plusmn 351 1557 plusmn 254 2018 plusmn 183 1426 plusmn 103CO 12 plusmn 2 10 plusmn 2 10 plusmn 1 7 plusmn 0Vmaxdagger 1761 plusmn 053 2361 plusmn 223 3089 plusmn 289 3883 plusmn 230Vmindagger 215 plusmn 133 679 plusmn 180 1029 plusmn 189 2373 plusmn 199EFdagger 79 plusmn 6 66 plusmn 8 66 plusmn 4 39 plusmn 2
ESPdagger 52 plusmn 4 65 plusmn 5 42 plusmn 3 47 plusmn 4EDP 1 plusmn 1 -1 plusmn 1 -6 plusmn 2 1 plusmn 1
dPdtmax 7200 plusmn 1349 8252 plusmn 1685 4004 plusmn 629 3718 plusmn 684dPdtmindagger -4233 plusmn 531 -7577 plusmn 750 -3631 plusmn 424 -3348 plusmn 653Tau 10 plusmn 0 7 plusmn 0 12 plusmn 1 14 plusmn 2
SW 1066 plusmn 245 1147 plusmn 213 1076 plusmn 176 666 plusmn 116
EaEesdagger 065 plusmn 020 084 plusmn 016 060 plusmn 005 103 plusmn 015ESPVR 570 plusmn 094 589 plusmn 074 347 plusmn 027 318 plusmn 052EDPVR 009 plusmn 009 -008 plusmn 015 -015 plusmn 014 -005 plusmn 015PRSW 79 plusmn 14 64 plusmn 6 68 plusmn 10 53 plusmn 3
Results from LV pressure-volume measurements in C57Bl6 mice anesthetized by urethane or
pentobarbital Urethane versus pentobarbital P lt 005 dagger OC versus CC P lt 005 ρ Valued
124 Ωcm α 030 Open- (OC) and closed-chest (CC) protocols HR indicates heart rate in
bpm SV left ventricular stroke volume in microl CO cardiac output mlmin Vmin minimal left
ventricular volume in microl Vmax maximal left ventricular volume in microl EF ejection fraction in
ESP left ventricular end-systolic pressure in mmHg EDP left ventricular end-diastolic
pressure in mmHg dPdtmax maximal first derivative of left ventricular pressure in mmHgs
dPdtmin minimal first derivative of left ventricular pressure in mmHgs Tau time constant of
left ventricular relaxation in ms SW stroke work in mmHgmicrol Ea arterial elastance Ees
ventricular end-systolic elastance ESPVR left ventricular end-systolic PV relationship in
Chapter 3 Murine left ventricular pressure-volume loops
24
mmHgmicrol EDPVR left ventricular end-diastolic PV relationship in mmHgmicrol PRSW left
ventricular preload-recruitable stroke work in mmHg
The steady-state functional parameters from OC and CC instrumented mice during
either urethane or pentobarbital are also depicted in Table 2 The use of pentobarbital
anesthesia had a cardiodepressive effect that was represented by significant function decline
in most parameters EF dPdtMAX and ESPVR decreased respectively with 24 57 and 41
upon pentobarbital use compared to urethane anesthesia Pentobarbital therefore had strong
negative chronotropic and inotropic effects
Hear
trat
e(b
pm)
Heart rate trace in closed-chest animal
0
100
200
300
400
500
600
700
Time (minutes)
arterial canulation
A
0 1 2 3 4 5 6 7 8 9 10 11 12 13 14 15 16
Heart rate trace in open-chest animal
0
100
200
300
400
500
600
700
Time (minutes)
Hear
trat
e(b
pm)
Ventricular catheterisation
B
0 1 2 3 4 5 6 7 8 9 10 11 12 13 14
Figure 10
Chapter 3 Murine left ventricular pressure-volume loops
25
Fig 10 Heart rate tracings in closed chest and open chest instrumented mice
A Representative figure of a heart rate tracing in a closed-chest instrumented mouse The
moment of arterial cannulation is indicated Some arrhythmias are seen in response to
introduction of the catheter into the left ventricle Arrhythmias are only present in a short
time-period that is part of the stabilization period following catheter introduction Heart rate
remains unchanged during the measurements B Representative figure of a heart rate tracing
in an open-chest instrumented mouse Somewhat more pronounced chronotropic arrhythmias
are seen in response to ventricular introduction of the catheter by apical stab However no
significant brady- or tachycardias are present during the measurements
Chapter 3 Murine left ventricular pressure-volume loops
26
Discussion
In this chapter OC and CC protocols for in vivo left ventricular PV relationship
measurement are described and discussed Murine cardiac function determination via these
methods is sensitive reproducible and comparable The choice for open- or closed-chest PV
measurements in mice depends on the aim of the study with regards to the specific cardiac
pathology The OC approach is technically less complicated and less time consuming Main
characteristics of the OC model itself are low systolic pressures and arterial resistance The
OC approach could best be used in studies where myocardial integrity is not at stake
Particularly ischemiareperfusion studies regarding myocardial integrity are probably better
done using the CC approach
Assessment of cardiac performance in genetically engineered mice is indispensable to
understand human cardiovascular pathologies In general the synergistic features of cardiac
diseases such as hypertrophy and cell death affect cardiac function negatively The
contractile performance of the heart deteriorates which is reflected in the attenuation of
systolic parameters as ejection fraction stroke work and PV-relationships Furthermore
ventricular relaxation prolongs and diastolic filling becomes impaired The progression of
cardiac disease ultimately results in clinical heart failure which is defined by the inability of
the heart to meet hemodynamic demands of the body and is characterized by specific signs
and symptoms (21) The most important parameter of cardiac performance which defines
heart failure is cardiac output
The influence on cardiac performance of specific genes and proteins in the
development of cardiac diseases ought to be investigated extensively to assess their clinical
relevance Various techniques have been used to assess cardiac performance in mice The
main techniques will be discussed in brief
Chapter 3 Murine left ventricular pressure-volume loops
27
Echocardiography is the most widely used noninvasive technique to determine cardiac
performance in mice High-frequency transthoracic and transesophageal transducers are used
as effective tools for two-dimensional and Doppler imaging of ventricular wall structures
dimensions and volumes of cavum and cardiac function (2223) Full-conscious or gas-
anesthesia experiments are preferred for echocardiographic assessment of cardiac function in
mice (2425) There is no limit to the diversity of murine models investigated by this general
accepted method of cardiac performance assessment However the most questionable aspect
of these measurements is the significant inter- and intraobservator variance in the
measurements
Isolated working mouse heart measurements in a Langendorf perfusion setup are a
technique for ex vivo cardiac function measurements approximating the in vivo function level
(5) Cardiac output developed left ventricular pressure and first derivates of maximal and
minimal pressures are some of the parameters that can be derived Isolated working heart
measurements are especially useful to study the acute effects of ischemic preconditioning and
ischemia-induced apoptosis(2627) Metabolites of interest can be measured accurately in the
perfusion fluid Disadvantages are the impossibility of chronic studies and the
unphysiological situation of ex vivo cardiac function measurements
Aortic flow measurements by means of a flow-probe have been used in several
studies (2829) Aortic flow acquisition is a validated technique and reveals functional
parameters as cardiac output stroke volume and blood flow velocity However several
disadvantages oppose against this technique Firstly aortic flow measurements are invasive
(ie thoracotomy or laparotomy) and result solely in aortic derived volume parameters
Integrated ventricular function cannot be assessed More importantly the exact localization of
the flow probe around the aorta is the critical determinant of the systematic error made by
these measurements Flow probes have been placed around the ascending and descending
Chapter 3 Murine left ventricular pressure-volume loops
28
thoracic aorta and the abdominal aorta The percentage of total cardiac output passing the
flow probe on the specific location has to be estimated Flow probes located at the ascending
aorta correct for coronary circulation and for instance bloodvolume passing the descending
thoracic aorta has been estimated to be around 75 of total cardiac output (30) The estimated
correction factor provides lsquoabsolutersquo stroke volume instead of absolute LV cavum volumes
and does not correct for cardiophysiological changes Altered cardiophysiological situations
could theoretically influence the relative amount of bloodvolume passing the flow probe On
the other hand major advances are the possibility of chronic cardiac function measurements
and the relative facile manner of data acquirement(29) Moreover aortic flow probe
measurements are not hampered by deleterious cardiac remodeling in myocardial ischemia or
hypertrophy studies(2829)
The newly developed method of cardiac performance assessment by in vivo left
ventricular PV measurements in the CC model is introduced here Left ventricular PV
measurements in vivo provide an accurate assessment of murine cardiac function The method
is highly sensitive during open- and closed-chest approaches in determining alterations in left
ventricular function as result of cardiac disease or altered hemodynamic stress The
characteristics of simultaneous left ventricular pressure and volume measurements enable the
researcher to directly investigate pressure-related cardiac diseases as cardiac hypertrophy and
restrictive cardiomyopathy (31) or volume-related diseases as dilated cardiomyopathy (32)
Moreover the effective influence of both aspects of cardiac disease on each other can be
observed in detail For instance ventricular dilation and subsequent decrease in ventricular
systolic pressure is mapped accurately in PV-loops Continuous measurements provide
possibilities to investigate the complete cardiac cycle Basic aspects of cardiac physiology can
be visualized using PV-loops in mice (81533-35) For instance increase in ventricular filling
is followed by an increase in ejection fraction according to the Frank-Starling mechanism
Chapter 3 Murine left ventricular pressure-volume loops
29
The opposite is seen as a result of gradual venous return decrease in the case of transient caval
vein occlusion (figure 7 amp 9) Moreover the distinction between systolic and diastolic failure
can be made through continuous PV-measurements (19) Systolic heart failure encompasses
mainly an ejection dysfunction with impaired contractility Both aspects are obtained by and
directly visualized through PV-loops Additionally the definite diagnosis of diastolic failure
is dependent on the observation of an inappropriate upward shift of the (end-)diastolic PV
relationship requiring cardiac catheterization for continuous volume determinations using
impedance measurements and high-fidelity measurements of ventricular pressure with a
micromanometer (19) PV-loops are useful determining cardiac performance within the
complete continuum of healthy and diseased hearts
Chapter 3 Murine left ventricular pressure-volume loops
30
Conclusion
In vivo PV measurements provide an essential tool in the assessment of cardiac
function in genetically modified mice Open- and closed-chest surgical protocols for murine
cardiac function determination are sensitive reproducible and comparable PV-loops enable
the researcher to accurately investigate diverse murine models of cardiac pathology by
adequately visualizing the cause-and-effect relationship between genetic modification and
their functional outcome Changes in ventricular contractility are best detected by PV derived
parameters in comparison to other methods of cardiac function determination
Chapter 3 Murine left ventricular pressure-volume loops
31
References
1 Doevendans PA Daemen MJ de Muinck ED Smits JF Cardiovascular phenotypingin mice Cardiovasc Res 19983934-49
2 Hoit BD New approaches to phenotypic analysis in adult mice J Mol Cell Cardiol20013327-35
3 Chacko VP Aresta F Chacko SM Weiss RG MRIMRS assessment of in vivomurine cardiac metabolism morphology and function at physiological heart rates AmJ Physiol Heart Circ Physiol 2000279H2218-24
4 Tanaka N Dalton N Mao L et al Transthoracic echocardiography in models ofcardiac disease in the mouse Circulation 1996941109-17
5 De Windt LJ Willems J Reneman RS Van der Vusse GJ Arts T Van Bilsen M Animproved isolated left ventricular ejecting murine heart model Functional andmetabolic evaluation Pflugers Arch 1999437182-90
6 Palmen M Daemen MJ Buehler A et al Impaired cardiac remodeling and functionafter myocardial infarction in FGF-1 transgenic mice Circulation 1999100250
7 Rockman HA Hamilton RA Jones LR Milano CA Mao L Lefkowitz RJ Enhancedmyocardial relaxation in vivo in transgenic mice overexpressing the beta2-adrenergicreceptor is associated with reduced phospholamban protein J Clin Invest1996971618-23
8 Georgakopoulos D Mitzner WA Chen CH et al In vivo murine left ventricularpressure-volume relations by miniaturized conductance micromanometry Am JPhysiol 1998274H1416-22
9 Dekker AL Geskes GG Cramers AA et al Right ventricular support for off-pumpcoronary artery bypass grafting studied with bi-ventricular pressure-volume loops insheep Eur J Cardiothorac Surg 200119179-84
10 Schreuder JJ Steendijk P van der Veen FH et al Acute and short-term effects ofpartial left ventriculectomy in dilated cardiomyopathy assessment by pressure-volumeloops J Am Coll Cardiol 2000362104-14
11 Zimmer HG Measurement of left ventricular hemodynamic parameters in closed-chest rats under control and various pathophysiologic conditions Basic Res Cardiol19837877-84
12 Georgakopoulos D Kass DA Estimation of parallel conductance by dual-frequencyconductance catheter in mice Am J Physiol Heart Circ Physiol 2000279H443-50
13 Feldman MD Mao Y Valvano JW Pearce JA Freeman GL Development of amultifrequency conductance catheter-based system to determine LV function in miceAm J Physiol Heart Circ Physiol 2000279H1411-20
14 Kornet L Schreuder JJ Van de Velden ET Jansen JR The volume-dependency ofparallel conductance throughout the cardiac cycle and its consequence for volumeestimation of the left ventricle in patients Cardiovasc Res 200151729-35
15 Nemoto S DeFreitas G Mann DL Carabello BA Effects of changes in leftventricular contractility on indexes of contractility in mice Am J Physiol Heart CircPhysiol 2002283H2504-10
16 Baan J Van de Velden ET Steendijk P Ventricular pressure-volume relations in vivoEur Heart J 199213 SupplE2-6
17 Little WC Cheng CP Left ventricular-arterial coupling in conscious dogs Am JPhysiol 1991261H70-6
18 Sunagawa K Maughan WL Sagawa K Optimal arterial resistance for the maximalstroke work studied in isolated canine left ventricle Circ Res 198556586-95
Chapter 3 Murine left ventricular pressure-volume loops
32
19 Van Kraaij D Van Pol P Ruiters AW et al Diagnosing diastolic heart failure Eur JHeart Fail 20024419-30
20 Faunt KK Cohn LA Jones BD Dodam JR Cardiopulmonary effects of bilateralhemithorax ventilation and diagnostic thoracoscopy in dogs Am J Vet Res1998591494-8
21 Lips DJ Van Kraaij DL De Windt LJ Doevendans PA Molecular determinants ofmyocardial hypertrophy and failure alternative pathways for beneficial andmaladaptive hypertrophy Eur Heart J 200324883-96
22 Collins KA Korcarz CE Lang RM Use of echocardiography for the phenotypicassessment of genetically altered mice Physiol Genomics 200313227-39
23 Scherrer-Crosbie M Steudel W Hunziker PR et al Determination of right ventricularstructure and function in normoxic and hypoxic mice a transesophagealechocardiographic study Circulation 1998981015-21
24 Takuma S Suehiro K Cardinale C et al Anesthetic inhibition in ischemic andnonischemic murine heart comparison with conscious echocardiographic approachAm J Physiol Heart Circ Physiol 2001280H2364-70
25 Chaves AA Weinstein DM Bauer JA Non-invasive echocardiographic studies inmice influence of anesthetic regimen Life Sci 200169213-22
26 Yamaura G Turoczi T Yamamoto F Siddqui MA Maulik N Das DK STATsignaling in ischemic heart a role of STAT5A in ischemic preconditioning Am JPhysiol Heart Circ Physiol 2003285H476-82
27 Bell RM Yellon DM Atorvastatin administered at the onset of reperfusion andindependent of lipid lowering protects the myocardium by up-regulating a pro-survival pathway J Am Coll Cardiol 200341508-15
28 Aartsen WM Schuijt MP Danser AH Daemen MJ Smits JF The role of locallyexpressed angiotensin converting enzyme in cardiac remodeling after myocardialinfarction in mice Cardiovasc Res 200256205-13
29 Janssen B Debets J Leenders P Smits J Chronic measurement of cardiac output inconscious mice Am J Physiol Regul Integr Comp Physiol 2002282R928-35
30 Georgakopoulos D Christe ME Giewat M Seidman CM Seidman JG Kass DA Thepathogenesis of familial hypertrophic cardiomyopathy early and evolving effects froman alpha-cardiac myosin heavy chain missense mutation Nat Med 19995327-30
31 Liao P Georgakopoulos D Kovacs A et al The in vivo role of p38 MAP kinases incardiac remodeling and restrictive cardiomyopathy Proc Natl Acad Sci U S A20019812283-8
32 McConnell BK Jones KA Fatkin D et al Dilated cardiomyopathy in homozygousmyosin-binding protein-C mutant mice J Clin Invest 19991041235-44
33 Georgakopoulos D Kass DA Minimal force-frequency modulation of inotropy andrelaxation of in situ murine heart J Physiol 2001534535-45
34 Yang B Larson DF Watson R Age-related left ventricular function in the mouseanalysis based on in vivo pressure-volume relationships Am J Physiol1999277H1906-13
35 Reyes M Freeman GL Escobedo D Lee S Steinhelper ME Feldman MDEnhancement of contractility with sustained afterload in the intact murine heartblunting of length-dependent activation Circulation 20031072962-8
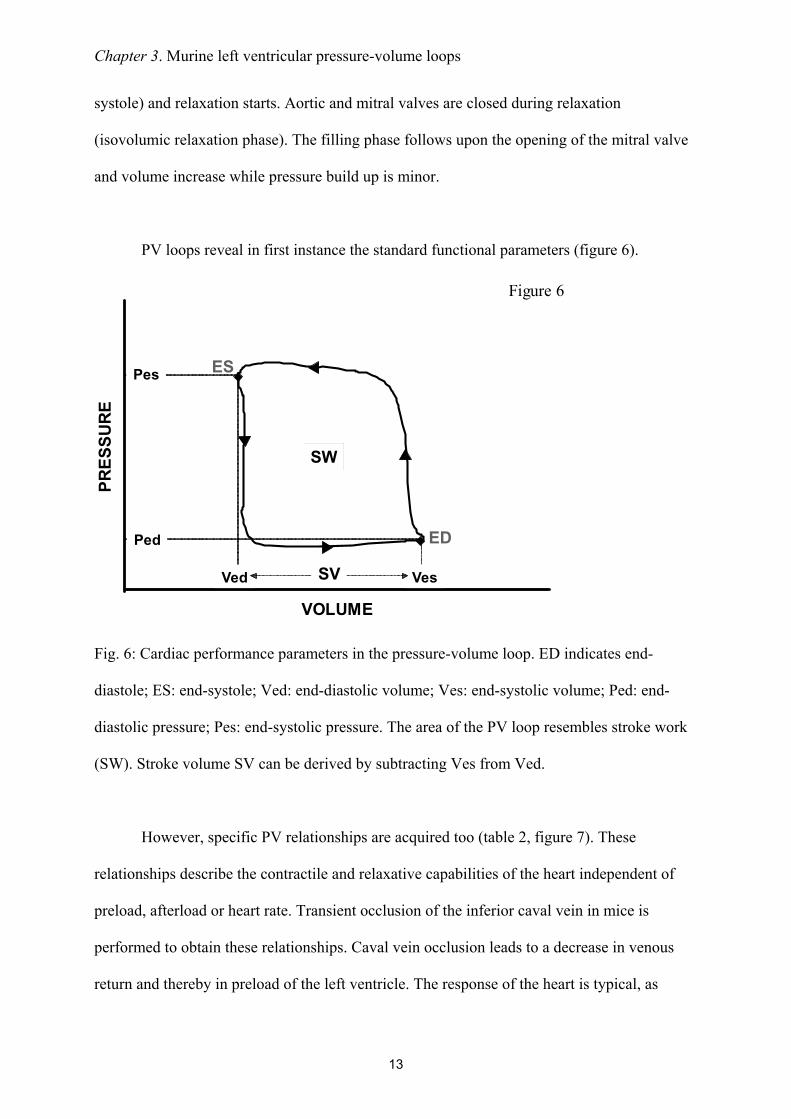
Chapter 3 Murine left ventricular pressure-volume loops
13
systole) and relaxation starts Aortic and mitral valves are closed during relaxation
(isovolumic relaxation phase) The filling phase follows upon the opening of the mitral valve
and volume increase while pressure build up is minor
PV loops reveal in first instance the standard functional parameters (figure 6)
Fig 6 Cardiac performance parameters in the pressure-volume loop ED indicates end-
diastole ES end-systole Ved end-diastolic volume Ves end-systolic volume Ped end-
diastolic pressure Pes end-systolic pressure The area of the PV loop resembles stroke work
(SW) Stroke volume SV can be derived by subtracting Ves from Ved
However specific PV relationships are acquired too (table 2 figure 7) These
relationships describe the contractile and relaxative capabilities of the heart independent of
preload afterload or heart rate Transient occlusion of the inferior caval vein in mice is
performed to obtain these relationships Caval vein occlusion leads to a decrease in venous
return and thereby in preload of the left ventricle The response of the heart is typical as
Figure 6
VOLUME
PRES
SURE
ES
ED
Pes
Ved Ves
Ped
SV
SW
Chapter 3 Murine left ventricular pressure-volume loops
14
presented in figure 7 and shows the PV correlations Contractile parameters derived from PV-
correlations best detect small alterations in contractility in mice (15)
Fig 7 Pressure-volume relationships Variably loaded PV loops are used to define several PV
relationships The variable loading is derived by occluding the inferior caval vein and thereby
reducing venous return The end-systolic PV relationship (ESPVR) describes the contractile
performance of the left ventricle Contractility is linear correlated with the steepness of the
ESPVR slope ie Ees The end-diastolic PV relationship (EDPVR) describes diastolic
performance for instance diastolic distensibility The slope of the EDPVR (β) indicates the
passive chamber stiffness
The end-systolic PV relationship (ESPVR) describes the relation between volume and
pressure changes in systole Within the physiological range this relationship approximates a
straight line The relationship can be described in terms of its slope which reflects myocardial
contractility and its volume axis intercept V0 The volume intercept from the ESPVR line
Figure 7
PRES
SURE ESPVR
VOLUME
EesEes
EDPVRβ
V75
Chapter 3 Murine left ventricular pressure-volume loops
15
could better be taken at a constant pressure level in the physiological range for example
between 50 and 100 mm Hg (16) The volume intercept at a constant pressure (eg V75)
reflects myocardial contractility as it indicates the extent of contraction Increased myocardial
contractility for instance during beta-adrenergic stimulation with isoprenaline results in a
steeper ESPVR-slope and a leftward shift on the volume axis while attenuated contractility
for example during clinical heart failure results in a concomitantly plain slope and a
rightward shift on the volume axis The slope of the ESPVR (Ees) is used to describe the left
ventricular elastance Arterial elastance (Ea) a measure for ventricular afterload is described
by the slope of the relationship between stroke volume and end-systolic pressure (figure 8)
Fig 8 Arterial-ventricular coupling Ventricular elastance is estimated from the end-
systolic PV relationship (ESPVR) slope Ees Arterial elastance (Ea) is approximated by the
stroke volumeend-systolic pressure ratio (Ao Pes-SV relationship) The between Ea and Ees
reflects the coupling between the left ventricle and the arterial circulation The production of
stroke work is maximal when the Ea and Ees are approximately equal
Figure 8
Ea Ees
VOLUME
PRES
SURE
PRESSURE
PV-relat
ion Ao PES ndash SV relation
Chapter 3 Murine left ventricular pressure-volume loops
16
The production of stroke work is maximal when the Ees and Ea are approximately
equal Stroke work attenuates substantially in relation to its maximal value whenever Ea and
Ees differ markedly (1718) The preload-recruitable stroke work (PRSW) is the relationship
between end-diastolic volume and performed stroke work by the ventricle It is a load-
independent measure of contractility related to preload The contractile state of the heart is
resembled by the steepness of the PRSW-slope In a high contractile state the heart is able to
perform more stroke work at a constant end-diastolic volume for instance by augmenting the
ejection fraction
Diastolic function is derived from the end-diastolic PV relationship (EDPVR) which
correlates with the compliance of the ventricular myocardium Diastolic dysfunctioning or
failure is observed by an inappropriate upward shift of the ESPVR The slope of the EDPVR
(β) increases during augmented stiffness of the ventricular wall when pressure rises
progressively more during ventricular filling The opposite occurs in case of increased
compliance Certain cardiac diseases and remodeling processes are correlated with increased
stiffness of the ventricular wall by collagen deposition resulting in an increase of the
EDPVR-slope (19)
Numerous other relationships can be assessed The limits are determined by the
interests and the creativity of the investigator
Chapter 3 Murine left ventricular pressure-volume loops
17
Results of PV-measurements with the open- (OC) and closed-chest (CC) approach
A comparative study was performed to determine scientifically based arguments for
the choice between open- (OC) or closed-chest (CC) PV measurements to examine murine
cardiac function Comparing cardiac performance between OC and CC protocols revealed
overall relatively similar values for the investigated parameters (table 3) The values for LV
volumes were corrected for ρ determined at 124 Ωcm in the used setup (N = 10 12352 plusmn
088 Ωcm) α (N = 13 030) and Vc Vc was determined during all PV experiments by the
hypertonic saline injection method No significant differences could be detected between CC
and OC instrumentation (9469 plusmn 483 microl versus 9272 plusmn 205 microl respectively NS) The 4 microl
30 saline demonstrated to be sufficient to change blood conductivity Moreover as this
volume encompasses only 15 of the normal murine end-diastolic volume it proved to be too
small to influence LV end-diastolic and end-systolic pressures (figure 4) in either OC or CC
mice
Several differences were found between the OC and CC approaches (table 3) Cardiac
function in the OC approach was characterized by higher ejection fractions (EF 69 versus
48 respectively) larger stroke volume (1998 versus 1470 microl respectively) and a leftward
shift in ventricular volume On the contrary measuring cardiac function with an intact thorax
resulted in higher end-systolic pressures (ESP OC 52 versus CC 65 mmHg with urethane
anesthesia) and a higher rate of relaxation as indicated by the dPdtmin No differences were
found in the PV relationships ie the ESPVR EDPVR or PRSW Interestingly the OC
approach did result in a mismatch between arterial afterload and ventricular work The
arterial-ventricular elastance ratio (EaEes) was significantly depressed following opening of
the chest In contrast EaEes ratios were normal (ie ~ 10) in the CC approach under both
regimens This finding is consistently found in open-chest instrumented mice (8) The arterial-
ventricular coupling mismatch was depending on arterial resistance the slope of the ESPVR
Chapter 3 Murine left ventricular pressure-volume loops
18
Table 1 Comparison of volume derived by ultrasonography and conductance
Descriptive statistics of alphaN Min Max Mean SEM
EDV 13 018 045 030 002ESV 13 016 094 051 007SV 13 009 058 026 004
Regression analysis
N
RR2
Adjusted R2
SEE
EDV13
082068065179
ESV13
083069066172
SV13
041017009117
Chapter 3 Murine left ventricular pressure-volume loops
19
Left ventricular volume was measured by both ultrasonography
and conductance in adult C57Bl6 mice End-diastolic end-
systolic and stroke volume were used to obtain alpha (α)
Descriptive analysis shows that α determination at the end-
diastolic moment results in the most consistent mean α Also
the correlation of LV volume values between ultrasonography
and conductance is high as shown by the regression analysis
SEM indicates standard error of the mean SEE standard error
of the estimate
EDVECHO (microl)120100806040200
EDV C
ON
DUC
TAN
CE (micro
l)
18
16
14
12
10
8
6
SCATTERPLOT OF END-DIASTOLIC VOLUMECONDUCTANCE VS ULTRASONOGRAPHY
EDVECHO (microl)120100806040200
EDV C
ON
DUC
TAN
CE (micro
l)
18
16
14
12
10
8
6
EDVECHO (microl)120100806040200
EDV C
ON
DUC
TAN
CE (micro
l)
18
16
14
12
10
8
6
SCATTERPLOT OF END-DIASTOLIC VOLUMECONDUCTANCE VS ULTRASONOGRAPHY
Chapter 3 Murine left ventricular pressure-volume loops
20
Table 2 Parameters derived by pressure-volume loops
Abbreviations DefinitionsGeneral parameters
CI (CI = CObody wt) CO HR
Card iac indexCard iac outputHeart rate
PressuredPdtmax
dPdtmin
PedPesτ
Maximum derivative of change in systolic pressure in timeMaximum derivative of change in diastolic pressure in timeEnd-diastolic pressureEnd-systolic pressureTime constant of isovolumic relaxation
VolumeEFSI (SI = SVbody wt)SVVedVes
Ejection fractionStroke index Stroke volumeEnd-diastolic pressureEnd-systolic pressure
Pressure-volume relationshipsβEa (Ea = PesSV)EDPVREes
Slope of the end-diastolic pressure-volume relat ionshipArterial elastanceEnd-diastolic pressure-volume relat ionshipEnd-systolic ventricular elastance
EmaxESPVR
(slope of the end-systolic pressure-volume relationship)Maximum chamber elasticity (∆P∆V)End-systolic pressure-volume relat ionship
Pressure-volume areaEfficiencyEWPEPRSWPVASWSWI (SWI = SWbody wt)
EWPVAExternal work = SWPotential energyPreload-recruitable stroke workPressure-volume area = EW + PEStroke workStroke work index
Abbreviations DefinitionsGeneral parameters
CI (CI = CObody wt) CO HR
Card iac indexCard iac outputHeart rate
PressuredPdtmax
dPdtmin
PedPesτ
Maximum derivative of change in systolic pressure in timeMaximum derivative of change in diastolic pressure in timeEnd-diastolic pressureEnd-systolic pressureTime constant of isovolumic relaxation
VolumeEFSI (SI = SVbody wt)SVVedVes
Ejection fractionStroke index Stroke volumeEnd-diastolic pressureEnd-systolic pressure
Pressure-volume relationshipsβEa (Ea = PesSV)EDPVREes
Slope of the end-diastolic pressure-volume relat ionshipArterial elastanceEnd-diastolic pressure-volume relat ionshipEnd-systolic ventricular elastance
EmaxESPVR
(slope of the end-systolic pressure-volume relationship)Maximum chamber elasticity (∆P∆V)End-systolic pressure-volume relat ionship
Pressure-volume areaEfficiencyEWPEPRSWPVASWSWI (SWI = SWbody wt)
EWPVAExternal work = SWPotential energyPreload-recruitable stroke workPressure-volume area = EW + PEStroke workStroke work index
EmaxESPVR
(slope of the end-systolic pressure-volume (slope of the end-systolic pressure-volume relationship)Maximum chamber elasticity (∆P∆V)End-systolic pressure-volume relat ionship
Pressure-volume areaEfficiencyEWPEPRSWPVASWSWI (SWI = SWbody wt)
EWPVAExternal work = SWPotential energyPreload-recruitable stroke workPressure-volume area = EW + PEStroke workStroke work index
Chapter 3 Murine left ventricular pressure-volume loops
21
(Ees) proved to be equal in OC and CC instrumented mice The combination of enlarged
stroke volume with attenuated systolic pressures leads to a decrease in arterial elastance The
altered arterial elastance could be explained by the opening of the thorax A drop in overall
peripheral vascular resistance from baseline values has been described during thoracoscopy
(20)
Urethane
Volume (microl)
Pres
sure
(mm
Hg)
Pentobarbital
Volume (microl)
Pres
sure
(mm
Hg)
A
B
CCOCCCCCOCOC
CCOCCCCCOCOC
-100
102030405060708090
-10
0
10
20
30
40
50
60
0 5 10 15 20 25 30 35 400 5 10 15 20 25 30 35 40
0 5 10 15 20 25 30 35 400 5 10 15 20 25 30 35 40
Figure 9
Chapter 3 Murine left ventricular pressure-volume loops
22
Fig 9 Left ventricular pressure-volume loops Pressure presented in mmHg and volume microl
A Representative figure of PV loops acquired during urethane anesthesia in closed chest
(CC) and open chest (OC) instrumented mice B Representative figure of PV loops acquired
during pentobarbital anesthesia in CC and OC instrumented mice Loops are acquired during
an occlusion of the inferior caval vein Venous returns decreases which is represented in the
loops by attenuation of both pressure and volume The differences in ESP SW and ESPVR
between urethane and pentobarbital anesthesia can be observed by analyzing the loops in A
and B The loops show also the larger stroke volume and depressed systolic pressure in OC
instrumented mice
Figure 9 shows representative PV-loops while venous return was attenuated following
inferior caval vein occlusion Typical pressure and volume effects are depicted showing the
absence of apparent differences in PV relationships The mentioned differences in ESP SV
and EF are evident in the presented loops though
ECG recordings were made during both surgical protocols to detect possible heart rate
alterations and arrhythmias Murine left ventricular PV measurements could be distorted by
physiological responses to the catheterization Heart rate alterations could be anticipated
especially in relation to carotid sinus stimulation while cannulating of the carotid artery
However neither bradycardia nor other arrhythmias were observed during either CC or OC
procedures (figure 10) This finding indicates that cannulation of the right common carotid
artery does not alter heart rate by carotid sinus stimulation
Chapter 3 Murine left ventricular pressure-volume loops
23
Table 3 Functional parameters to determine baseline LV functioning in open- and closed-
chest protocols during steady-state measurement
URETHANE PENTOBARBITALOC CC OC CC
N = 5 N = 5 N = 10 N = 10
Mean plusmn SEM Mean plusmn SEM Mean plusmn SEM Mean plusmn SEM
HR 583 plusmn 20 658 plusmn 21 493 plusmn 25 481 plusmn 36SVdagger 1958 plusmn 351 1557 plusmn 254 2018 plusmn 183 1426 plusmn 103CO 12 plusmn 2 10 plusmn 2 10 plusmn 1 7 plusmn 0Vmaxdagger 1761 plusmn 053 2361 plusmn 223 3089 plusmn 289 3883 plusmn 230Vmindagger 215 plusmn 133 679 plusmn 180 1029 plusmn 189 2373 plusmn 199EFdagger 79 plusmn 6 66 plusmn 8 66 plusmn 4 39 plusmn 2
ESPdagger 52 plusmn 4 65 plusmn 5 42 plusmn 3 47 plusmn 4EDP 1 plusmn 1 -1 plusmn 1 -6 plusmn 2 1 plusmn 1
dPdtmax 7200 plusmn 1349 8252 plusmn 1685 4004 plusmn 629 3718 plusmn 684dPdtmindagger -4233 plusmn 531 -7577 plusmn 750 -3631 plusmn 424 -3348 plusmn 653Tau 10 plusmn 0 7 plusmn 0 12 plusmn 1 14 plusmn 2
SW 1066 plusmn 245 1147 plusmn 213 1076 plusmn 176 666 plusmn 116
EaEesdagger 065 plusmn 020 084 plusmn 016 060 plusmn 005 103 plusmn 015ESPVR 570 plusmn 094 589 plusmn 074 347 plusmn 027 318 plusmn 052EDPVR 009 plusmn 009 -008 plusmn 015 -015 plusmn 014 -005 plusmn 015PRSW 79 plusmn 14 64 plusmn 6 68 plusmn 10 53 plusmn 3
Results from LV pressure-volume measurements in C57Bl6 mice anesthetized by urethane or
pentobarbital Urethane versus pentobarbital P lt 005 dagger OC versus CC P lt 005 ρ Valued
124 Ωcm α 030 Open- (OC) and closed-chest (CC) protocols HR indicates heart rate in
bpm SV left ventricular stroke volume in microl CO cardiac output mlmin Vmin minimal left
ventricular volume in microl Vmax maximal left ventricular volume in microl EF ejection fraction in
ESP left ventricular end-systolic pressure in mmHg EDP left ventricular end-diastolic
pressure in mmHg dPdtmax maximal first derivative of left ventricular pressure in mmHgs
dPdtmin minimal first derivative of left ventricular pressure in mmHgs Tau time constant of
left ventricular relaxation in ms SW stroke work in mmHgmicrol Ea arterial elastance Ees
ventricular end-systolic elastance ESPVR left ventricular end-systolic PV relationship in
Chapter 3 Murine left ventricular pressure-volume loops
24
mmHgmicrol EDPVR left ventricular end-diastolic PV relationship in mmHgmicrol PRSW left
ventricular preload-recruitable stroke work in mmHg
The steady-state functional parameters from OC and CC instrumented mice during
either urethane or pentobarbital are also depicted in Table 2 The use of pentobarbital
anesthesia had a cardiodepressive effect that was represented by significant function decline
in most parameters EF dPdtMAX and ESPVR decreased respectively with 24 57 and 41
upon pentobarbital use compared to urethane anesthesia Pentobarbital therefore had strong
negative chronotropic and inotropic effects
Hear
trat
e(b
pm)
Heart rate trace in closed-chest animal
0
100
200
300
400
500
600
700
Time (minutes)
arterial canulation
A
0 1 2 3 4 5 6 7 8 9 10 11 12 13 14 15 16
Heart rate trace in open-chest animal
0
100
200
300
400
500
600
700
Time (minutes)
Hear
trat
e(b
pm)
Ventricular catheterisation
B
0 1 2 3 4 5 6 7 8 9 10 11 12 13 14
Figure 10
Chapter 3 Murine left ventricular pressure-volume loops
25
Fig 10 Heart rate tracings in closed chest and open chest instrumented mice
A Representative figure of a heart rate tracing in a closed-chest instrumented mouse The
moment of arterial cannulation is indicated Some arrhythmias are seen in response to
introduction of the catheter into the left ventricle Arrhythmias are only present in a short
time-period that is part of the stabilization period following catheter introduction Heart rate
remains unchanged during the measurements B Representative figure of a heart rate tracing
in an open-chest instrumented mouse Somewhat more pronounced chronotropic arrhythmias
are seen in response to ventricular introduction of the catheter by apical stab However no
significant brady- or tachycardias are present during the measurements
Chapter 3 Murine left ventricular pressure-volume loops
26
Discussion
In this chapter OC and CC protocols for in vivo left ventricular PV relationship
measurement are described and discussed Murine cardiac function determination via these
methods is sensitive reproducible and comparable The choice for open- or closed-chest PV
measurements in mice depends on the aim of the study with regards to the specific cardiac
pathology The OC approach is technically less complicated and less time consuming Main
characteristics of the OC model itself are low systolic pressures and arterial resistance The
OC approach could best be used in studies where myocardial integrity is not at stake
Particularly ischemiareperfusion studies regarding myocardial integrity are probably better
done using the CC approach
Assessment of cardiac performance in genetically engineered mice is indispensable to
understand human cardiovascular pathologies In general the synergistic features of cardiac
diseases such as hypertrophy and cell death affect cardiac function negatively The
contractile performance of the heart deteriorates which is reflected in the attenuation of
systolic parameters as ejection fraction stroke work and PV-relationships Furthermore
ventricular relaxation prolongs and diastolic filling becomes impaired The progression of
cardiac disease ultimately results in clinical heart failure which is defined by the inability of
the heart to meet hemodynamic demands of the body and is characterized by specific signs
and symptoms (21) The most important parameter of cardiac performance which defines
heart failure is cardiac output
The influence on cardiac performance of specific genes and proteins in the
development of cardiac diseases ought to be investigated extensively to assess their clinical
relevance Various techniques have been used to assess cardiac performance in mice The
main techniques will be discussed in brief
Chapter 3 Murine left ventricular pressure-volume loops
27
Echocardiography is the most widely used noninvasive technique to determine cardiac
performance in mice High-frequency transthoracic and transesophageal transducers are used
as effective tools for two-dimensional and Doppler imaging of ventricular wall structures
dimensions and volumes of cavum and cardiac function (2223) Full-conscious or gas-
anesthesia experiments are preferred for echocardiographic assessment of cardiac function in
mice (2425) There is no limit to the diversity of murine models investigated by this general
accepted method of cardiac performance assessment However the most questionable aspect
of these measurements is the significant inter- and intraobservator variance in the
measurements
Isolated working mouse heart measurements in a Langendorf perfusion setup are a
technique for ex vivo cardiac function measurements approximating the in vivo function level
(5) Cardiac output developed left ventricular pressure and first derivates of maximal and
minimal pressures are some of the parameters that can be derived Isolated working heart
measurements are especially useful to study the acute effects of ischemic preconditioning and
ischemia-induced apoptosis(2627) Metabolites of interest can be measured accurately in the
perfusion fluid Disadvantages are the impossibility of chronic studies and the
unphysiological situation of ex vivo cardiac function measurements
Aortic flow measurements by means of a flow-probe have been used in several
studies (2829) Aortic flow acquisition is a validated technique and reveals functional
parameters as cardiac output stroke volume and blood flow velocity However several
disadvantages oppose against this technique Firstly aortic flow measurements are invasive
(ie thoracotomy or laparotomy) and result solely in aortic derived volume parameters
Integrated ventricular function cannot be assessed More importantly the exact localization of
the flow probe around the aorta is the critical determinant of the systematic error made by
these measurements Flow probes have been placed around the ascending and descending
Chapter 3 Murine left ventricular pressure-volume loops
28
thoracic aorta and the abdominal aorta The percentage of total cardiac output passing the
flow probe on the specific location has to be estimated Flow probes located at the ascending
aorta correct for coronary circulation and for instance bloodvolume passing the descending
thoracic aorta has been estimated to be around 75 of total cardiac output (30) The estimated
correction factor provides lsquoabsolutersquo stroke volume instead of absolute LV cavum volumes
and does not correct for cardiophysiological changes Altered cardiophysiological situations
could theoretically influence the relative amount of bloodvolume passing the flow probe On
the other hand major advances are the possibility of chronic cardiac function measurements
and the relative facile manner of data acquirement(29) Moreover aortic flow probe
measurements are not hampered by deleterious cardiac remodeling in myocardial ischemia or
hypertrophy studies(2829)
The newly developed method of cardiac performance assessment by in vivo left
ventricular PV measurements in the CC model is introduced here Left ventricular PV
measurements in vivo provide an accurate assessment of murine cardiac function The method
is highly sensitive during open- and closed-chest approaches in determining alterations in left
ventricular function as result of cardiac disease or altered hemodynamic stress The
characteristics of simultaneous left ventricular pressure and volume measurements enable the
researcher to directly investigate pressure-related cardiac diseases as cardiac hypertrophy and
restrictive cardiomyopathy (31) or volume-related diseases as dilated cardiomyopathy (32)
Moreover the effective influence of both aspects of cardiac disease on each other can be
observed in detail For instance ventricular dilation and subsequent decrease in ventricular
systolic pressure is mapped accurately in PV-loops Continuous measurements provide
possibilities to investigate the complete cardiac cycle Basic aspects of cardiac physiology can
be visualized using PV-loops in mice (81533-35) For instance increase in ventricular filling
is followed by an increase in ejection fraction according to the Frank-Starling mechanism
Chapter 3 Murine left ventricular pressure-volume loops
29
The opposite is seen as a result of gradual venous return decrease in the case of transient caval
vein occlusion (figure 7 amp 9) Moreover the distinction between systolic and diastolic failure
can be made through continuous PV-measurements (19) Systolic heart failure encompasses
mainly an ejection dysfunction with impaired contractility Both aspects are obtained by and
directly visualized through PV-loops Additionally the definite diagnosis of diastolic failure
is dependent on the observation of an inappropriate upward shift of the (end-)diastolic PV
relationship requiring cardiac catheterization for continuous volume determinations using
impedance measurements and high-fidelity measurements of ventricular pressure with a
micromanometer (19) PV-loops are useful determining cardiac performance within the
complete continuum of healthy and diseased hearts
Chapter 3 Murine left ventricular pressure-volume loops
30
Conclusion
In vivo PV measurements provide an essential tool in the assessment of cardiac
function in genetically modified mice Open- and closed-chest surgical protocols for murine
cardiac function determination are sensitive reproducible and comparable PV-loops enable
the researcher to accurately investigate diverse murine models of cardiac pathology by
adequately visualizing the cause-and-effect relationship between genetic modification and
their functional outcome Changes in ventricular contractility are best detected by PV derived
parameters in comparison to other methods of cardiac function determination
Chapter 3 Murine left ventricular pressure-volume loops
31
References
1 Doevendans PA Daemen MJ de Muinck ED Smits JF Cardiovascular phenotypingin mice Cardiovasc Res 19983934-49
2 Hoit BD New approaches to phenotypic analysis in adult mice J Mol Cell Cardiol20013327-35
3 Chacko VP Aresta F Chacko SM Weiss RG MRIMRS assessment of in vivomurine cardiac metabolism morphology and function at physiological heart rates AmJ Physiol Heart Circ Physiol 2000279H2218-24
4 Tanaka N Dalton N Mao L et al Transthoracic echocardiography in models ofcardiac disease in the mouse Circulation 1996941109-17
5 De Windt LJ Willems J Reneman RS Van der Vusse GJ Arts T Van Bilsen M Animproved isolated left ventricular ejecting murine heart model Functional andmetabolic evaluation Pflugers Arch 1999437182-90
6 Palmen M Daemen MJ Buehler A et al Impaired cardiac remodeling and functionafter myocardial infarction in FGF-1 transgenic mice Circulation 1999100250
7 Rockman HA Hamilton RA Jones LR Milano CA Mao L Lefkowitz RJ Enhancedmyocardial relaxation in vivo in transgenic mice overexpressing the beta2-adrenergicreceptor is associated with reduced phospholamban protein J Clin Invest1996971618-23
8 Georgakopoulos D Mitzner WA Chen CH et al In vivo murine left ventricularpressure-volume relations by miniaturized conductance micromanometry Am JPhysiol 1998274H1416-22
9 Dekker AL Geskes GG Cramers AA et al Right ventricular support for off-pumpcoronary artery bypass grafting studied with bi-ventricular pressure-volume loops insheep Eur J Cardiothorac Surg 200119179-84
10 Schreuder JJ Steendijk P van der Veen FH et al Acute and short-term effects ofpartial left ventriculectomy in dilated cardiomyopathy assessment by pressure-volumeloops J Am Coll Cardiol 2000362104-14
11 Zimmer HG Measurement of left ventricular hemodynamic parameters in closed-chest rats under control and various pathophysiologic conditions Basic Res Cardiol19837877-84
12 Georgakopoulos D Kass DA Estimation of parallel conductance by dual-frequencyconductance catheter in mice Am J Physiol Heart Circ Physiol 2000279H443-50
13 Feldman MD Mao Y Valvano JW Pearce JA Freeman GL Development of amultifrequency conductance catheter-based system to determine LV function in miceAm J Physiol Heart Circ Physiol 2000279H1411-20
14 Kornet L Schreuder JJ Van de Velden ET Jansen JR The volume-dependency ofparallel conductance throughout the cardiac cycle and its consequence for volumeestimation of the left ventricle in patients Cardiovasc Res 200151729-35
15 Nemoto S DeFreitas G Mann DL Carabello BA Effects of changes in leftventricular contractility on indexes of contractility in mice Am J Physiol Heart CircPhysiol 2002283H2504-10
16 Baan J Van de Velden ET Steendijk P Ventricular pressure-volume relations in vivoEur Heart J 199213 SupplE2-6
17 Little WC Cheng CP Left ventricular-arterial coupling in conscious dogs Am JPhysiol 1991261H70-6
18 Sunagawa K Maughan WL Sagawa K Optimal arterial resistance for the maximalstroke work studied in isolated canine left ventricle Circ Res 198556586-95
Chapter 3 Murine left ventricular pressure-volume loops
32
19 Van Kraaij D Van Pol P Ruiters AW et al Diagnosing diastolic heart failure Eur JHeart Fail 20024419-30
20 Faunt KK Cohn LA Jones BD Dodam JR Cardiopulmonary effects of bilateralhemithorax ventilation and diagnostic thoracoscopy in dogs Am J Vet Res1998591494-8
21 Lips DJ Van Kraaij DL De Windt LJ Doevendans PA Molecular determinants ofmyocardial hypertrophy and failure alternative pathways for beneficial andmaladaptive hypertrophy Eur Heart J 200324883-96
22 Collins KA Korcarz CE Lang RM Use of echocardiography for the phenotypicassessment of genetically altered mice Physiol Genomics 200313227-39
23 Scherrer-Crosbie M Steudel W Hunziker PR et al Determination of right ventricularstructure and function in normoxic and hypoxic mice a transesophagealechocardiographic study Circulation 1998981015-21
24 Takuma S Suehiro K Cardinale C et al Anesthetic inhibition in ischemic andnonischemic murine heart comparison with conscious echocardiographic approachAm J Physiol Heart Circ Physiol 2001280H2364-70
25 Chaves AA Weinstein DM Bauer JA Non-invasive echocardiographic studies inmice influence of anesthetic regimen Life Sci 200169213-22
26 Yamaura G Turoczi T Yamamoto F Siddqui MA Maulik N Das DK STATsignaling in ischemic heart a role of STAT5A in ischemic preconditioning Am JPhysiol Heart Circ Physiol 2003285H476-82
27 Bell RM Yellon DM Atorvastatin administered at the onset of reperfusion andindependent of lipid lowering protects the myocardium by up-regulating a pro-survival pathway J Am Coll Cardiol 200341508-15
28 Aartsen WM Schuijt MP Danser AH Daemen MJ Smits JF The role of locallyexpressed angiotensin converting enzyme in cardiac remodeling after myocardialinfarction in mice Cardiovasc Res 200256205-13
29 Janssen B Debets J Leenders P Smits J Chronic measurement of cardiac output inconscious mice Am J Physiol Regul Integr Comp Physiol 2002282R928-35
30 Georgakopoulos D Christe ME Giewat M Seidman CM Seidman JG Kass DA Thepathogenesis of familial hypertrophic cardiomyopathy early and evolving effects froman alpha-cardiac myosin heavy chain missense mutation Nat Med 19995327-30
31 Liao P Georgakopoulos D Kovacs A et al The in vivo role of p38 MAP kinases incardiac remodeling and restrictive cardiomyopathy Proc Natl Acad Sci U S A20019812283-8
32 McConnell BK Jones KA Fatkin D et al Dilated cardiomyopathy in homozygousmyosin-binding protein-C mutant mice J Clin Invest 19991041235-44
33 Georgakopoulos D Kass DA Minimal force-frequency modulation of inotropy andrelaxation of in situ murine heart J Physiol 2001534535-45
34 Yang B Larson DF Watson R Age-related left ventricular function in the mouseanalysis based on in vivo pressure-volume relationships Am J Physiol1999277H1906-13
35 Reyes M Freeman GL Escobedo D Lee S Steinhelper ME Feldman MDEnhancement of contractility with sustained afterload in the intact murine heartblunting of length-dependent activation Circulation 20031072962-8
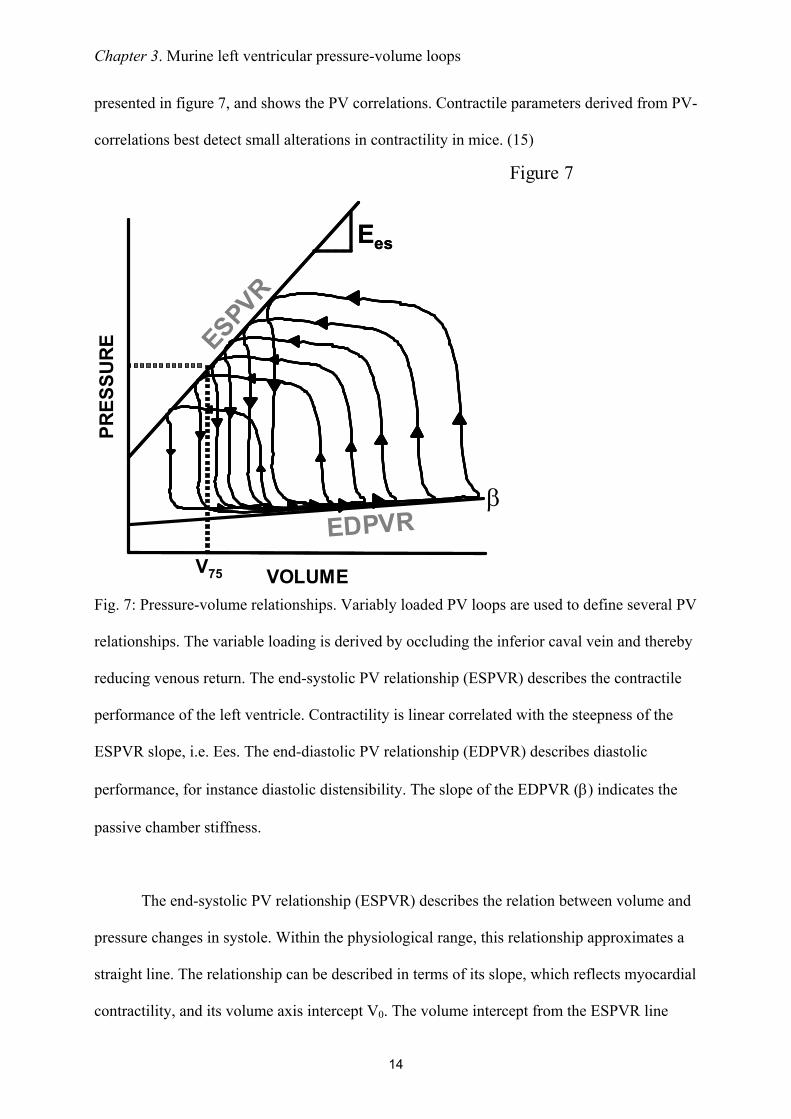
Chapter 3 Murine left ventricular pressure-volume loops
14
presented in figure 7 and shows the PV correlations Contractile parameters derived from PV-
correlations best detect small alterations in contractility in mice (15)
Fig 7 Pressure-volume relationships Variably loaded PV loops are used to define several PV
relationships The variable loading is derived by occluding the inferior caval vein and thereby
reducing venous return The end-systolic PV relationship (ESPVR) describes the contractile
performance of the left ventricle Contractility is linear correlated with the steepness of the
ESPVR slope ie Ees The end-diastolic PV relationship (EDPVR) describes diastolic
performance for instance diastolic distensibility The slope of the EDPVR (β) indicates the
passive chamber stiffness
The end-systolic PV relationship (ESPVR) describes the relation between volume and
pressure changes in systole Within the physiological range this relationship approximates a
straight line The relationship can be described in terms of its slope which reflects myocardial
contractility and its volume axis intercept V0 The volume intercept from the ESPVR line
Figure 7
PRES
SURE ESPVR
VOLUME
EesEes
EDPVRβ
V75
Chapter 3 Murine left ventricular pressure-volume loops
15
could better be taken at a constant pressure level in the physiological range for example
between 50 and 100 mm Hg (16) The volume intercept at a constant pressure (eg V75)
reflects myocardial contractility as it indicates the extent of contraction Increased myocardial
contractility for instance during beta-adrenergic stimulation with isoprenaline results in a
steeper ESPVR-slope and a leftward shift on the volume axis while attenuated contractility
for example during clinical heart failure results in a concomitantly plain slope and a
rightward shift on the volume axis The slope of the ESPVR (Ees) is used to describe the left
ventricular elastance Arterial elastance (Ea) a measure for ventricular afterload is described
by the slope of the relationship between stroke volume and end-systolic pressure (figure 8)
Fig 8 Arterial-ventricular coupling Ventricular elastance is estimated from the end-
systolic PV relationship (ESPVR) slope Ees Arterial elastance (Ea) is approximated by the
stroke volumeend-systolic pressure ratio (Ao Pes-SV relationship) The between Ea and Ees
reflects the coupling between the left ventricle and the arterial circulation The production of
stroke work is maximal when the Ea and Ees are approximately equal
Figure 8
Ea Ees
VOLUME
PRES
SURE
PRESSURE
PV-relat
ion Ao PES ndash SV relation
Chapter 3 Murine left ventricular pressure-volume loops
16
The production of stroke work is maximal when the Ees and Ea are approximately
equal Stroke work attenuates substantially in relation to its maximal value whenever Ea and
Ees differ markedly (1718) The preload-recruitable stroke work (PRSW) is the relationship
between end-diastolic volume and performed stroke work by the ventricle It is a load-
independent measure of contractility related to preload The contractile state of the heart is
resembled by the steepness of the PRSW-slope In a high contractile state the heart is able to
perform more stroke work at a constant end-diastolic volume for instance by augmenting the
ejection fraction
Diastolic function is derived from the end-diastolic PV relationship (EDPVR) which
correlates with the compliance of the ventricular myocardium Diastolic dysfunctioning or
failure is observed by an inappropriate upward shift of the ESPVR The slope of the EDPVR
(β) increases during augmented stiffness of the ventricular wall when pressure rises
progressively more during ventricular filling The opposite occurs in case of increased
compliance Certain cardiac diseases and remodeling processes are correlated with increased
stiffness of the ventricular wall by collagen deposition resulting in an increase of the
EDPVR-slope (19)
Numerous other relationships can be assessed The limits are determined by the
interests and the creativity of the investigator
Chapter 3 Murine left ventricular pressure-volume loops
17
Results of PV-measurements with the open- (OC) and closed-chest (CC) approach
A comparative study was performed to determine scientifically based arguments for
the choice between open- (OC) or closed-chest (CC) PV measurements to examine murine
cardiac function Comparing cardiac performance between OC and CC protocols revealed
overall relatively similar values for the investigated parameters (table 3) The values for LV
volumes were corrected for ρ determined at 124 Ωcm in the used setup (N = 10 12352 plusmn
088 Ωcm) α (N = 13 030) and Vc Vc was determined during all PV experiments by the
hypertonic saline injection method No significant differences could be detected between CC
and OC instrumentation (9469 plusmn 483 microl versus 9272 plusmn 205 microl respectively NS) The 4 microl
30 saline demonstrated to be sufficient to change blood conductivity Moreover as this
volume encompasses only 15 of the normal murine end-diastolic volume it proved to be too
small to influence LV end-diastolic and end-systolic pressures (figure 4) in either OC or CC
mice
Several differences were found between the OC and CC approaches (table 3) Cardiac
function in the OC approach was characterized by higher ejection fractions (EF 69 versus
48 respectively) larger stroke volume (1998 versus 1470 microl respectively) and a leftward
shift in ventricular volume On the contrary measuring cardiac function with an intact thorax
resulted in higher end-systolic pressures (ESP OC 52 versus CC 65 mmHg with urethane
anesthesia) and a higher rate of relaxation as indicated by the dPdtmin No differences were
found in the PV relationships ie the ESPVR EDPVR or PRSW Interestingly the OC
approach did result in a mismatch between arterial afterload and ventricular work The
arterial-ventricular elastance ratio (EaEes) was significantly depressed following opening of
the chest In contrast EaEes ratios were normal (ie ~ 10) in the CC approach under both
regimens This finding is consistently found in open-chest instrumented mice (8) The arterial-
ventricular coupling mismatch was depending on arterial resistance the slope of the ESPVR
Chapter 3 Murine left ventricular pressure-volume loops
18
Table 1 Comparison of volume derived by ultrasonography and conductance
Descriptive statistics of alphaN Min Max Mean SEM
EDV 13 018 045 030 002ESV 13 016 094 051 007SV 13 009 058 026 004
Regression analysis
N
RR2
Adjusted R2
SEE
EDV13
082068065179
ESV13
083069066172
SV13
041017009117
Chapter 3 Murine left ventricular pressure-volume loops
19
Left ventricular volume was measured by both ultrasonography
and conductance in adult C57Bl6 mice End-diastolic end-
systolic and stroke volume were used to obtain alpha (α)
Descriptive analysis shows that α determination at the end-
diastolic moment results in the most consistent mean α Also
the correlation of LV volume values between ultrasonography
and conductance is high as shown by the regression analysis
SEM indicates standard error of the mean SEE standard error
of the estimate
EDVECHO (microl)120100806040200
EDV C
ON
DUC
TAN
CE (micro
l)
18
16
14
12
10
8
6
SCATTERPLOT OF END-DIASTOLIC VOLUMECONDUCTANCE VS ULTRASONOGRAPHY
EDVECHO (microl)120100806040200
EDV C
ON
DUC
TAN
CE (micro
l)
18
16
14
12
10
8
6
EDVECHO (microl)120100806040200
EDV C
ON
DUC
TAN
CE (micro
l)
18
16
14
12
10
8
6
SCATTERPLOT OF END-DIASTOLIC VOLUMECONDUCTANCE VS ULTRASONOGRAPHY
Chapter 3 Murine left ventricular pressure-volume loops
20
Table 2 Parameters derived by pressure-volume loops
Abbreviations DefinitionsGeneral parameters
CI (CI = CObody wt) CO HR
Card iac indexCard iac outputHeart rate
PressuredPdtmax
dPdtmin
PedPesτ
Maximum derivative of change in systolic pressure in timeMaximum derivative of change in diastolic pressure in timeEnd-diastolic pressureEnd-systolic pressureTime constant of isovolumic relaxation
VolumeEFSI (SI = SVbody wt)SVVedVes
Ejection fractionStroke index Stroke volumeEnd-diastolic pressureEnd-systolic pressure
Pressure-volume relationshipsβEa (Ea = PesSV)EDPVREes
Slope of the end-diastolic pressure-volume relat ionshipArterial elastanceEnd-diastolic pressure-volume relat ionshipEnd-systolic ventricular elastance
EmaxESPVR
(slope of the end-systolic pressure-volume relationship)Maximum chamber elasticity (∆P∆V)End-systolic pressure-volume relat ionship
Pressure-volume areaEfficiencyEWPEPRSWPVASWSWI (SWI = SWbody wt)
EWPVAExternal work = SWPotential energyPreload-recruitable stroke workPressure-volume area = EW + PEStroke workStroke work index
Abbreviations DefinitionsGeneral parameters
CI (CI = CObody wt) CO HR
Card iac indexCard iac outputHeart rate
PressuredPdtmax
dPdtmin
PedPesτ
Maximum derivative of change in systolic pressure in timeMaximum derivative of change in diastolic pressure in timeEnd-diastolic pressureEnd-systolic pressureTime constant of isovolumic relaxation
VolumeEFSI (SI = SVbody wt)SVVedVes
Ejection fractionStroke index Stroke volumeEnd-diastolic pressureEnd-systolic pressure
Pressure-volume relationshipsβEa (Ea = PesSV)EDPVREes
Slope of the end-diastolic pressure-volume relat ionshipArterial elastanceEnd-diastolic pressure-volume relat ionshipEnd-systolic ventricular elastance
EmaxESPVR
(slope of the end-systolic pressure-volume relationship)Maximum chamber elasticity (∆P∆V)End-systolic pressure-volume relat ionship
Pressure-volume areaEfficiencyEWPEPRSWPVASWSWI (SWI = SWbody wt)
EWPVAExternal work = SWPotential energyPreload-recruitable stroke workPressure-volume area = EW + PEStroke workStroke work index
EmaxESPVR
(slope of the end-systolic pressure-volume (slope of the end-systolic pressure-volume relationship)Maximum chamber elasticity (∆P∆V)End-systolic pressure-volume relat ionship
Pressure-volume areaEfficiencyEWPEPRSWPVASWSWI (SWI = SWbody wt)
EWPVAExternal work = SWPotential energyPreload-recruitable stroke workPressure-volume area = EW + PEStroke workStroke work index
Chapter 3 Murine left ventricular pressure-volume loops
21
(Ees) proved to be equal in OC and CC instrumented mice The combination of enlarged
stroke volume with attenuated systolic pressures leads to a decrease in arterial elastance The
altered arterial elastance could be explained by the opening of the thorax A drop in overall
peripheral vascular resistance from baseline values has been described during thoracoscopy
(20)
Urethane
Volume (microl)
Pres
sure
(mm
Hg)
Pentobarbital
Volume (microl)
Pres
sure
(mm
Hg)
A
B
CCOCCCCCOCOC
CCOCCCCCOCOC
-100
102030405060708090
-10
0
10
20
30
40
50
60
0 5 10 15 20 25 30 35 400 5 10 15 20 25 30 35 40
0 5 10 15 20 25 30 35 400 5 10 15 20 25 30 35 40
Figure 9
Chapter 3 Murine left ventricular pressure-volume loops
22
Fig 9 Left ventricular pressure-volume loops Pressure presented in mmHg and volume microl
A Representative figure of PV loops acquired during urethane anesthesia in closed chest
(CC) and open chest (OC) instrumented mice B Representative figure of PV loops acquired
during pentobarbital anesthesia in CC and OC instrumented mice Loops are acquired during
an occlusion of the inferior caval vein Venous returns decreases which is represented in the
loops by attenuation of both pressure and volume The differences in ESP SW and ESPVR
between urethane and pentobarbital anesthesia can be observed by analyzing the loops in A
and B The loops show also the larger stroke volume and depressed systolic pressure in OC
instrumented mice
Figure 9 shows representative PV-loops while venous return was attenuated following
inferior caval vein occlusion Typical pressure and volume effects are depicted showing the
absence of apparent differences in PV relationships The mentioned differences in ESP SV
and EF are evident in the presented loops though
ECG recordings were made during both surgical protocols to detect possible heart rate
alterations and arrhythmias Murine left ventricular PV measurements could be distorted by
physiological responses to the catheterization Heart rate alterations could be anticipated
especially in relation to carotid sinus stimulation while cannulating of the carotid artery
However neither bradycardia nor other arrhythmias were observed during either CC or OC
procedures (figure 10) This finding indicates that cannulation of the right common carotid
artery does not alter heart rate by carotid sinus stimulation
Chapter 3 Murine left ventricular pressure-volume loops
23
Table 3 Functional parameters to determine baseline LV functioning in open- and closed-
chest protocols during steady-state measurement
URETHANE PENTOBARBITALOC CC OC CC
N = 5 N = 5 N = 10 N = 10
Mean plusmn SEM Mean plusmn SEM Mean plusmn SEM Mean plusmn SEM
HR 583 plusmn 20 658 plusmn 21 493 plusmn 25 481 plusmn 36SVdagger 1958 plusmn 351 1557 plusmn 254 2018 plusmn 183 1426 plusmn 103CO 12 plusmn 2 10 plusmn 2 10 plusmn 1 7 plusmn 0Vmaxdagger 1761 plusmn 053 2361 plusmn 223 3089 plusmn 289 3883 plusmn 230Vmindagger 215 plusmn 133 679 plusmn 180 1029 plusmn 189 2373 plusmn 199EFdagger 79 plusmn 6 66 plusmn 8 66 plusmn 4 39 plusmn 2
ESPdagger 52 plusmn 4 65 plusmn 5 42 plusmn 3 47 plusmn 4EDP 1 plusmn 1 -1 plusmn 1 -6 plusmn 2 1 plusmn 1
dPdtmax 7200 plusmn 1349 8252 plusmn 1685 4004 plusmn 629 3718 plusmn 684dPdtmindagger -4233 plusmn 531 -7577 plusmn 750 -3631 plusmn 424 -3348 plusmn 653Tau 10 plusmn 0 7 plusmn 0 12 plusmn 1 14 plusmn 2
SW 1066 plusmn 245 1147 plusmn 213 1076 plusmn 176 666 plusmn 116
EaEesdagger 065 plusmn 020 084 plusmn 016 060 plusmn 005 103 plusmn 015ESPVR 570 plusmn 094 589 plusmn 074 347 plusmn 027 318 plusmn 052EDPVR 009 plusmn 009 -008 plusmn 015 -015 plusmn 014 -005 plusmn 015PRSW 79 plusmn 14 64 plusmn 6 68 plusmn 10 53 plusmn 3
Results from LV pressure-volume measurements in C57Bl6 mice anesthetized by urethane or
pentobarbital Urethane versus pentobarbital P lt 005 dagger OC versus CC P lt 005 ρ Valued
124 Ωcm α 030 Open- (OC) and closed-chest (CC) protocols HR indicates heart rate in
bpm SV left ventricular stroke volume in microl CO cardiac output mlmin Vmin minimal left
ventricular volume in microl Vmax maximal left ventricular volume in microl EF ejection fraction in
ESP left ventricular end-systolic pressure in mmHg EDP left ventricular end-diastolic
pressure in mmHg dPdtmax maximal first derivative of left ventricular pressure in mmHgs
dPdtmin minimal first derivative of left ventricular pressure in mmHgs Tau time constant of
left ventricular relaxation in ms SW stroke work in mmHgmicrol Ea arterial elastance Ees
ventricular end-systolic elastance ESPVR left ventricular end-systolic PV relationship in
Chapter 3 Murine left ventricular pressure-volume loops
24
mmHgmicrol EDPVR left ventricular end-diastolic PV relationship in mmHgmicrol PRSW left
ventricular preload-recruitable stroke work in mmHg
The steady-state functional parameters from OC and CC instrumented mice during
either urethane or pentobarbital are also depicted in Table 2 The use of pentobarbital
anesthesia had a cardiodepressive effect that was represented by significant function decline
in most parameters EF dPdtMAX and ESPVR decreased respectively with 24 57 and 41
upon pentobarbital use compared to urethane anesthesia Pentobarbital therefore had strong
negative chronotropic and inotropic effects
Hear
trat
e(b
pm)
Heart rate trace in closed-chest animal
0
100
200
300
400
500
600
700
Time (minutes)
arterial canulation
A
0 1 2 3 4 5 6 7 8 9 10 11 12 13 14 15 16
Heart rate trace in open-chest animal
0
100
200
300
400
500
600
700
Time (minutes)
Hear
trat
e(b
pm)
Ventricular catheterisation
B
0 1 2 3 4 5 6 7 8 9 10 11 12 13 14
Figure 10
Chapter 3 Murine left ventricular pressure-volume loops
25
Fig 10 Heart rate tracings in closed chest and open chest instrumented mice
A Representative figure of a heart rate tracing in a closed-chest instrumented mouse The
moment of arterial cannulation is indicated Some arrhythmias are seen in response to
introduction of the catheter into the left ventricle Arrhythmias are only present in a short
time-period that is part of the stabilization period following catheter introduction Heart rate
remains unchanged during the measurements B Representative figure of a heart rate tracing
in an open-chest instrumented mouse Somewhat more pronounced chronotropic arrhythmias
are seen in response to ventricular introduction of the catheter by apical stab However no
significant brady- or tachycardias are present during the measurements
Chapter 3 Murine left ventricular pressure-volume loops
26
Discussion
In this chapter OC and CC protocols for in vivo left ventricular PV relationship
measurement are described and discussed Murine cardiac function determination via these
methods is sensitive reproducible and comparable The choice for open- or closed-chest PV
measurements in mice depends on the aim of the study with regards to the specific cardiac
pathology The OC approach is technically less complicated and less time consuming Main
characteristics of the OC model itself are low systolic pressures and arterial resistance The
OC approach could best be used in studies where myocardial integrity is not at stake
Particularly ischemiareperfusion studies regarding myocardial integrity are probably better
done using the CC approach
Assessment of cardiac performance in genetically engineered mice is indispensable to
understand human cardiovascular pathologies In general the synergistic features of cardiac
diseases such as hypertrophy and cell death affect cardiac function negatively The
contractile performance of the heart deteriorates which is reflected in the attenuation of
systolic parameters as ejection fraction stroke work and PV-relationships Furthermore
ventricular relaxation prolongs and diastolic filling becomes impaired The progression of
cardiac disease ultimately results in clinical heart failure which is defined by the inability of
the heart to meet hemodynamic demands of the body and is characterized by specific signs
and symptoms (21) The most important parameter of cardiac performance which defines
heart failure is cardiac output
The influence on cardiac performance of specific genes and proteins in the
development of cardiac diseases ought to be investigated extensively to assess their clinical
relevance Various techniques have been used to assess cardiac performance in mice The
main techniques will be discussed in brief
Chapter 3 Murine left ventricular pressure-volume loops
27
Echocardiography is the most widely used noninvasive technique to determine cardiac
performance in mice High-frequency transthoracic and transesophageal transducers are used
as effective tools for two-dimensional and Doppler imaging of ventricular wall structures
dimensions and volumes of cavum and cardiac function (2223) Full-conscious or gas-
anesthesia experiments are preferred for echocardiographic assessment of cardiac function in
mice (2425) There is no limit to the diversity of murine models investigated by this general
accepted method of cardiac performance assessment However the most questionable aspect
of these measurements is the significant inter- and intraobservator variance in the
measurements
Isolated working mouse heart measurements in a Langendorf perfusion setup are a
technique for ex vivo cardiac function measurements approximating the in vivo function level
(5) Cardiac output developed left ventricular pressure and first derivates of maximal and
minimal pressures are some of the parameters that can be derived Isolated working heart
measurements are especially useful to study the acute effects of ischemic preconditioning and
ischemia-induced apoptosis(2627) Metabolites of interest can be measured accurately in the
perfusion fluid Disadvantages are the impossibility of chronic studies and the
unphysiological situation of ex vivo cardiac function measurements
Aortic flow measurements by means of a flow-probe have been used in several
studies (2829) Aortic flow acquisition is a validated technique and reveals functional
parameters as cardiac output stroke volume and blood flow velocity However several
disadvantages oppose against this technique Firstly aortic flow measurements are invasive
(ie thoracotomy or laparotomy) and result solely in aortic derived volume parameters
Integrated ventricular function cannot be assessed More importantly the exact localization of
the flow probe around the aorta is the critical determinant of the systematic error made by
these measurements Flow probes have been placed around the ascending and descending
Chapter 3 Murine left ventricular pressure-volume loops
28
thoracic aorta and the abdominal aorta The percentage of total cardiac output passing the
flow probe on the specific location has to be estimated Flow probes located at the ascending
aorta correct for coronary circulation and for instance bloodvolume passing the descending
thoracic aorta has been estimated to be around 75 of total cardiac output (30) The estimated
correction factor provides lsquoabsolutersquo stroke volume instead of absolute LV cavum volumes
and does not correct for cardiophysiological changes Altered cardiophysiological situations
could theoretically influence the relative amount of bloodvolume passing the flow probe On
the other hand major advances are the possibility of chronic cardiac function measurements
and the relative facile manner of data acquirement(29) Moreover aortic flow probe
measurements are not hampered by deleterious cardiac remodeling in myocardial ischemia or
hypertrophy studies(2829)
The newly developed method of cardiac performance assessment by in vivo left
ventricular PV measurements in the CC model is introduced here Left ventricular PV
measurements in vivo provide an accurate assessment of murine cardiac function The method
is highly sensitive during open- and closed-chest approaches in determining alterations in left
ventricular function as result of cardiac disease or altered hemodynamic stress The
characteristics of simultaneous left ventricular pressure and volume measurements enable the
researcher to directly investigate pressure-related cardiac diseases as cardiac hypertrophy and
restrictive cardiomyopathy (31) or volume-related diseases as dilated cardiomyopathy (32)
Moreover the effective influence of both aspects of cardiac disease on each other can be
observed in detail For instance ventricular dilation and subsequent decrease in ventricular
systolic pressure is mapped accurately in PV-loops Continuous measurements provide
possibilities to investigate the complete cardiac cycle Basic aspects of cardiac physiology can
be visualized using PV-loops in mice (81533-35) For instance increase in ventricular filling
is followed by an increase in ejection fraction according to the Frank-Starling mechanism
Chapter 3 Murine left ventricular pressure-volume loops
29
The opposite is seen as a result of gradual venous return decrease in the case of transient caval
vein occlusion (figure 7 amp 9) Moreover the distinction between systolic and diastolic failure
can be made through continuous PV-measurements (19) Systolic heart failure encompasses
mainly an ejection dysfunction with impaired contractility Both aspects are obtained by and
directly visualized through PV-loops Additionally the definite diagnosis of diastolic failure
is dependent on the observation of an inappropriate upward shift of the (end-)diastolic PV
relationship requiring cardiac catheterization for continuous volume determinations using
impedance measurements and high-fidelity measurements of ventricular pressure with a
micromanometer (19) PV-loops are useful determining cardiac performance within the
complete continuum of healthy and diseased hearts
Chapter 3 Murine left ventricular pressure-volume loops
30
Conclusion
In vivo PV measurements provide an essential tool in the assessment of cardiac
function in genetically modified mice Open- and closed-chest surgical protocols for murine
cardiac function determination are sensitive reproducible and comparable PV-loops enable
the researcher to accurately investigate diverse murine models of cardiac pathology by
adequately visualizing the cause-and-effect relationship between genetic modification and
their functional outcome Changes in ventricular contractility are best detected by PV derived
parameters in comparison to other methods of cardiac function determination
Chapter 3 Murine left ventricular pressure-volume loops
31
References
1 Doevendans PA Daemen MJ de Muinck ED Smits JF Cardiovascular phenotypingin mice Cardiovasc Res 19983934-49
2 Hoit BD New approaches to phenotypic analysis in adult mice J Mol Cell Cardiol20013327-35
3 Chacko VP Aresta F Chacko SM Weiss RG MRIMRS assessment of in vivomurine cardiac metabolism morphology and function at physiological heart rates AmJ Physiol Heart Circ Physiol 2000279H2218-24
4 Tanaka N Dalton N Mao L et al Transthoracic echocardiography in models ofcardiac disease in the mouse Circulation 1996941109-17
5 De Windt LJ Willems J Reneman RS Van der Vusse GJ Arts T Van Bilsen M Animproved isolated left ventricular ejecting murine heart model Functional andmetabolic evaluation Pflugers Arch 1999437182-90
6 Palmen M Daemen MJ Buehler A et al Impaired cardiac remodeling and functionafter myocardial infarction in FGF-1 transgenic mice Circulation 1999100250
7 Rockman HA Hamilton RA Jones LR Milano CA Mao L Lefkowitz RJ Enhancedmyocardial relaxation in vivo in transgenic mice overexpressing the beta2-adrenergicreceptor is associated with reduced phospholamban protein J Clin Invest1996971618-23
8 Georgakopoulos D Mitzner WA Chen CH et al In vivo murine left ventricularpressure-volume relations by miniaturized conductance micromanometry Am JPhysiol 1998274H1416-22
9 Dekker AL Geskes GG Cramers AA et al Right ventricular support for off-pumpcoronary artery bypass grafting studied with bi-ventricular pressure-volume loops insheep Eur J Cardiothorac Surg 200119179-84
10 Schreuder JJ Steendijk P van der Veen FH et al Acute and short-term effects ofpartial left ventriculectomy in dilated cardiomyopathy assessment by pressure-volumeloops J Am Coll Cardiol 2000362104-14
11 Zimmer HG Measurement of left ventricular hemodynamic parameters in closed-chest rats under control and various pathophysiologic conditions Basic Res Cardiol19837877-84
12 Georgakopoulos D Kass DA Estimation of parallel conductance by dual-frequencyconductance catheter in mice Am J Physiol Heart Circ Physiol 2000279H443-50
13 Feldman MD Mao Y Valvano JW Pearce JA Freeman GL Development of amultifrequency conductance catheter-based system to determine LV function in miceAm J Physiol Heart Circ Physiol 2000279H1411-20
14 Kornet L Schreuder JJ Van de Velden ET Jansen JR The volume-dependency ofparallel conductance throughout the cardiac cycle and its consequence for volumeestimation of the left ventricle in patients Cardiovasc Res 200151729-35
15 Nemoto S DeFreitas G Mann DL Carabello BA Effects of changes in leftventricular contractility on indexes of contractility in mice Am J Physiol Heart CircPhysiol 2002283H2504-10
16 Baan J Van de Velden ET Steendijk P Ventricular pressure-volume relations in vivoEur Heart J 199213 SupplE2-6
17 Little WC Cheng CP Left ventricular-arterial coupling in conscious dogs Am JPhysiol 1991261H70-6
18 Sunagawa K Maughan WL Sagawa K Optimal arterial resistance for the maximalstroke work studied in isolated canine left ventricle Circ Res 198556586-95
Chapter 3 Murine left ventricular pressure-volume loops
32
19 Van Kraaij D Van Pol P Ruiters AW et al Diagnosing diastolic heart failure Eur JHeart Fail 20024419-30
20 Faunt KK Cohn LA Jones BD Dodam JR Cardiopulmonary effects of bilateralhemithorax ventilation and diagnostic thoracoscopy in dogs Am J Vet Res1998591494-8
21 Lips DJ Van Kraaij DL De Windt LJ Doevendans PA Molecular determinants ofmyocardial hypertrophy and failure alternative pathways for beneficial andmaladaptive hypertrophy Eur Heart J 200324883-96
22 Collins KA Korcarz CE Lang RM Use of echocardiography for the phenotypicassessment of genetically altered mice Physiol Genomics 200313227-39
23 Scherrer-Crosbie M Steudel W Hunziker PR et al Determination of right ventricularstructure and function in normoxic and hypoxic mice a transesophagealechocardiographic study Circulation 1998981015-21
24 Takuma S Suehiro K Cardinale C et al Anesthetic inhibition in ischemic andnonischemic murine heart comparison with conscious echocardiographic approachAm J Physiol Heart Circ Physiol 2001280H2364-70
25 Chaves AA Weinstein DM Bauer JA Non-invasive echocardiographic studies inmice influence of anesthetic regimen Life Sci 200169213-22
26 Yamaura G Turoczi T Yamamoto F Siddqui MA Maulik N Das DK STATsignaling in ischemic heart a role of STAT5A in ischemic preconditioning Am JPhysiol Heart Circ Physiol 2003285H476-82
27 Bell RM Yellon DM Atorvastatin administered at the onset of reperfusion andindependent of lipid lowering protects the myocardium by up-regulating a pro-survival pathway J Am Coll Cardiol 200341508-15
28 Aartsen WM Schuijt MP Danser AH Daemen MJ Smits JF The role of locallyexpressed angiotensin converting enzyme in cardiac remodeling after myocardialinfarction in mice Cardiovasc Res 200256205-13
29 Janssen B Debets J Leenders P Smits J Chronic measurement of cardiac output inconscious mice Am J Physiol Regul Integr Comp Physiol 2002282R928-35
30 Georgakopoulos D Christe ME Giewat M Seidman CM Seidman JG Kass DA Thepathogenesis of familial hypertrophic cardiomyopathy early and evolving effects froman alpha-cardiac myosin heavy chain missense mutation Nat Med 19995327-30
31 Liao P Georgakopoulos D Kovacs A et al The in vivo role of p38 MAP kinases incardiac remodeling and restrictive cardiomyopathy Proc Natl Acad Sci U S A20019812283-8
32 McConnell BK Jones KA Fatkin D et al Dilated cardiomyopathy in homozygousmyosin-binding protein-C mutant mice J Clin Invest 19991041235-44
33 Georgakopoulos D Kass DA Minimal force-frequency modulation of inotropy andrelaxation of in situ murine heart J Physiol 2001534535-45
34 Yang B Larson DF Watson R Age-related left ventricular function in the mouseanalysis based on in vivo pressure-volume relationships Am J Physiol1999277H1906-13
35 Reyes M Freeman GL Escobedo D Lee S Steinhelper ME Feldman MDEnhancement of contractility with sustained afterload in the intact murine heartblunting of length-dependent activation Circulation 20031072962-8
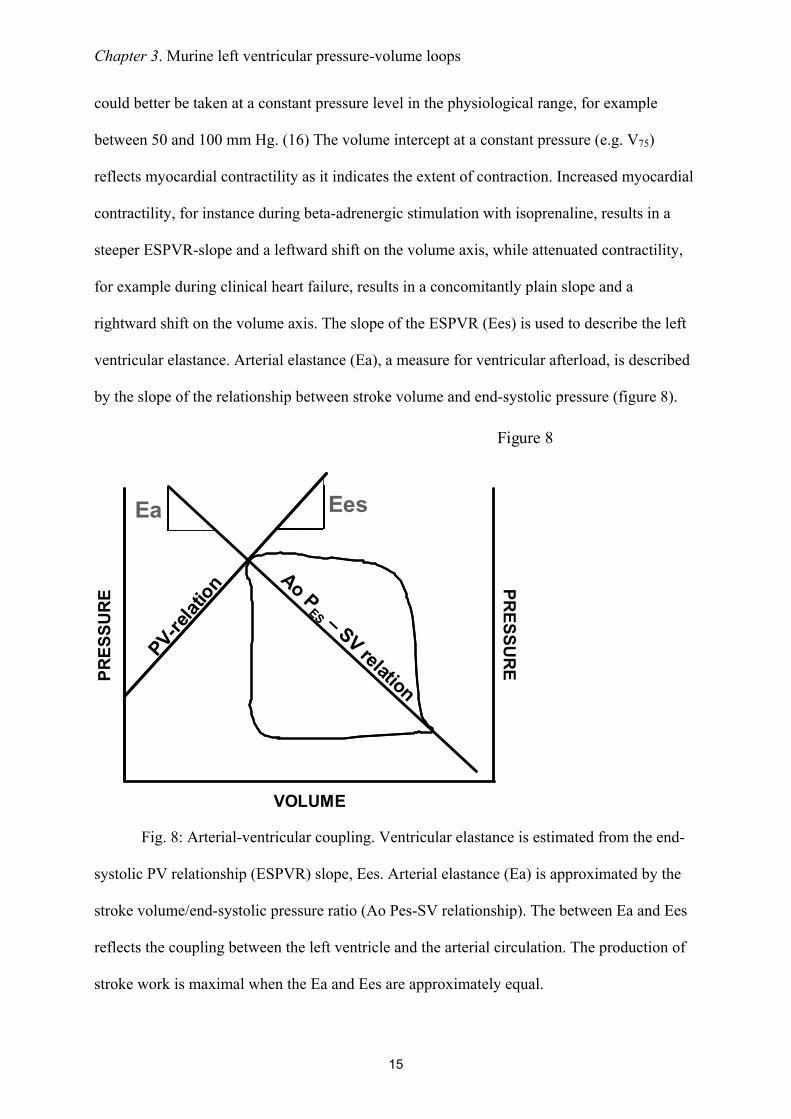
Chapter 3 Murine left ventricular pressure-volume loops
15
could better be taken at a constant pressure level in the physiological range for example
between 50 and 100 mm Hg (16) The volume intercept at a constant pressure (eg V75)
reflects myocardial contractility as it indicates the extent of contraction Increased myocardial
contractility for instance during beta-adrenergic stimulation with isoprenaline results in a
steeper ESPVR-slope and a leftward shift on the volume axis while attenuated contractility
for example during clinical heart failure results in a concomitantly plain slope and a
rightward shift on the volume axis The slope of the ESPVR (Ees) is used to describe the left
ventricular elastance Arterial elastance (Ea) a measure for ventricular afterload is described
by the slope of the relationship between stroke volume and end-systolic pressure (figure 8)
Fig 8 Arterial-ventricular coupling Ventricular elastance is estimated from the end-
systolic PV relationship (ESPVR) slope Ees Arterial elastance (Ea) is approximated by the
stroke volumeend-systolic pressure ratio (Ao Pes-SV relationship) The between Ea and Ees
reflects the coupling between the left ventricle and the arterial circulation The production of
stroke work is maximal when the Ea and Ees are approximately equal
Figure 8
Ea Ees
VOLUME
PRES
SURE
PRESSURE
PV-relat
ion Ao PES ndash SV relation
Chapter 3 Murine left ventricular pressure-volume loops
16
The production of stroke work is maximal when the Ees and Ea are approximately
equal Stroke work attenuates substantially in relation to its maximal value whenever Ea and
Ees differ markedly (1718) The preload-recruitable stroke work (PRSW) is the relationship
between end-diastolic volume and performed stroke work by the ventricle It is a load-
independent measure of contractility related to preload The contractile state of the heart is
resembled by the steepness of the PRSW-slope In a high contractile state the heart is able to
perform more stroke work at a constant end-diastolic volume for instance by augmenting the
ejection fraction
Diastolic function is derived from the end-diastolic PV relationship (EDPVR) which
correlates with the compliance of the ventricular myocardium Diastolic dysfunctioning or
failure is observed by an inappropriate upward shift of the ESPVR The slope of the EDPVR
(β) increases during augmented stiffness of the ventricular wall when pressure rises
progressively more during ventricular filling The opposite occurs in case of increased
compliance Certain cardiac diseases and remodeling processes are correlated with increased
stiffness of the ventricular wall by collagen deposition resulting in an increase of the
EDPVR-slope (19)
Numerous other relationships can be assessed The limits are determined by the
interests and the creativity of the investigator
Chapter 3 Murine left ventricular pressure-volume loops
17
Results of PV-measurements with the open- (OC) and closed-chest (CC) approach
A comparative study was performed to determine scientifically based arguments for
the choice between open- (OC) or closed-chest (CC) PV measurements to examine murine
cardiac function Comparing cardiac performance between OC and CC protocols revealed
overall relatively similar values for the investigated parameters (table 3) The values for LV
volumes were corrected for ρ determined at 124 Ωcm in the used setup (N = 10 12352 plusmn
088 Ωcm) α (N = 13 030) and Vc Vc was determined during all PV experiments by the
hypertonic saline injection method No significant differences could be detected between CC
and OC instrumentation (9469 plusmn 483 microl versus 9272 plusmn 205 microl respectively NS) The 4 microl
30 saline demonstrated to be sufficient to change blood conductivity Moreover as this
volume encompasses only 15 of the normal murine end-diastolic volume it proved to be too
small to influence LV end-diastolic and end-systolic pressures (figure 4) in either OC or CC
mice
Several differences were found between the OC and CC approaches (table 3) Cardiac
function in the OC approach was characterized by higher ejection fractions (EF 69 versus
48 respectively) larger stroke volume (1998 versus 1470 microl respectively) and a leftward
shift in ventricular volume On the contrary measuring cardiac function with an intact thorax
resulted in higher end-systolic pressures (ESP OC 52 versus CC 65 mmHg with urethane
anesthesia) and a higher rate of relaxation as indicated by the dPdtmin No differences were
found in the PV relationships ie the ESPVR EDPVR or PRSW Interestingly the OC
approach did result in a mismatch between arterial afterload and ventricular work The
arterial-ventricular elastance ratio (EaEes) was significantly depressed following opening of
the chest In contrast EaEes ratios were normal (ie ~ 10) in the CC approach under both
regimens This finding is consistently found in open-chest instrumented mice (8) The arterial-
ventricular coupling mismatch was depending on arterial resistance the slope of the ESPVR
Chapter 3 Murine left ventricular pressure-volume loops
18
Table 1 Comparison of volume derived by ultrasonography and conductance
Descriptive statistics of alphaN Min Max Mean SEM
EDV 13 018 045 030 002ESV 13 016 094 051 007SV 13 009 058 026 004
Regression analysis
N
RR2
Adjusted R2
SEE
EDV13
082068065179
ESV13
083069066172
SV13
041017009117
Chapter 3 Murine left ventricular pressure-volume loops
19
Left ventricular volume was measured by both ultrasonography
and conductance in adult C57Bl6 mice End-diastolic end-
systolic and stroke volume were used to obtain alpha (α)
Descriptive analysis shows that α determination at the end-
diastolic moment results in the most consistent mean α Also
the correlation of LV volume values between ultrasonography
and conductance is high as shown by the regression analysis
SEM indicates standard error of the mean SEE standard error
of the estimate
EDVECHO (microl)120100806040200
EDV C
ON
DUC
TAN
CE (micro
l)
18
16
14
12
10
8
6
SCATTERPLOT OF END-DIASTOLIC VOLUMECONDUCTANCE VS ULTRASONOGRAPHY
EDVECHO (microl)120100806040200
EDV C
ON
DUC
TAN
CE (micro
l)
18
16
14
12
10
8
6
EDVECHO (microl)120100806040200
EDV C
ON
DUC
TAN
CE (micro
l)
18
16
14
12
10
8
6
SCATTERPLOT OF END-DIASTOLIC VOLUMECONDUCTANCE VS ULTRASONOGRAPHY
Chapter 3 Murine left ventricular pressure-volume loops
20
Table 2 Parameters derived by pressure-volume loops
Abbreviations DefinitionsGeneral parameters
CI (CI = CObody wt) CO HR
Card iac indexCard iac outputHeart rate
PressuredPdtmax
dPdtmin
PedPesτ
Maximum derivative of change in systolic pressure in timeMaximum derivative of change in diastolic pressure in timeEnd-diastolic pressureEnd-systolic pressureTime constant of isovolumic relaxation
VolumeEFSI (SI = SVbody wt)SVVedVes
Ejection fractionStroke index Stroke volumeEnd-diastolic pressureEnd-systolic pressure
Pressure-volume relationshipsβEa (Ea = PesSV)EDPVREes
Slope of the end-diastolic pressure-volume relat ionshipArterial elastanceEnd-diastolic pressure-volume relat ionshipEnd-systolic ventricular elastance
EmaxESPVR
(slope of the end-systolic pressure-volume relationship)Maximum chamber elasticity (∆P∆V)End-systolic pressure-volume relat ionship
Pressure-volume areaEfficiencyEWPEPRSWPVASWSWI (SWI = SWbody wt)
EWPVAExternal work = SWPotential energyPreload-recruitable stroke workPressure-volume area = EW + PEStroke workStroke work index
Abbreviations DefinitionsGeneral parameters
CI (CI = CObody wt) CO HR
Card iac indexCard iac outputHeart rate
PressuredPdtmax
dPdtmin
PedPesτ
Maximum derivative of change in systolic pressure in timeMaximum derivative of change in diastolic pressure in timeEnd-diastolic pressureEnd-systolic pressureTime constant of isovolumic relaxation
VolumeEFSI (SI = SVbody wt)SVVedVes
Ejection fractionStroke index Stroke volumeEnd-diastolic pressureEnd-systolic pressure
Pressure-volume relationshipsβEa (Ea = PesSV)EDPVREes
Slope of the end-diastolic pressure-volume relat ionshipArterial elastanceEnd-diastolic pressure-volume relat ionshipEnd-systolic ventricular elastance
EmaxESPVR
(slope of the end-systolic pressure-volume relationship)Maximum chamber elasticity (∆P∆V)End-systolic pressure-volume relat ionship
Pressure-volume areaEfficiencyEWPEPRSWPVASWSWI (SWI = SWbody wt)
EWPVAExternal work = SWPotential energyPreload-recruitable stroke workPressure-volume area = EW + PEStroke workStroke work index
EmaxESPVR
(slope of the end-systolic pressure-volume (slope of the end-systolic pressure-volume relationship)Maximum chamber elasticity (∆P∆V)End-systolic pressure-volume relat ionship
Pressure-volume areaEfficiencyEWPEPRSWPVASWSWI (SWI = SWbody wt)
EWPVAExternal work = SWPotential energyPreload-recruitable stroke workPressure-volume area = EW + PEStroke workStroke work index
Chapter 3 Murine left ventricular pressure-volume loops
21
(Ees) proved to be equal in OC and CC instrumented mice The combination of enlarged
stroke volume with attenuated systolic pressures leads to a decrease in arterial elastance The
altered arterial elastance could be explained by the opening of the thorax A drop in overall
peripheral vascular resistance from baseline values has been described during thoracoscopy
(20)
Urethane
Volume (microl)
Pres
sure
(mm
Hg)
Pentobarbital
Volume (microl)
Pres
sure
(mm
Hg)
A
B
CCOCCCCCOCOC
CCOCCCCCOCOC
-100
102030405060708090
-10
0
10
20
30
40
50
60
0 5 10 15 20 25 30 35 400 5 10 15 20 25 30 35 40
0 5 10 15 20 25 30 35 400 5 10 15 20 25 30 35 40
Figure 9
Chapter 3 Murine left ventricular pressure-volume loops
22
Fig 9 Left ventricular pressure-volume loops Pressure presented in mmHg and volume microl
A Representative figure of PV loops acquired during urethane anesthesia in closed chest
(CC) and open chest (OC) instrumented mice B Representative figure of PV loops acquired
during pentobarbital anesthesia in CC and OC instrumented mice Loops are acquired during
an occlusion of the inferior caval vein Venous returns decreases which is represented in the
loops by attenuation of both pressure and volume The differences in ESP SW and ESPVR
between urethane and pentobarbital anesthesia can be observed by analyzing the loops in A
and B The loops show also the larger stroke volume and depressed systolic pressure in OC
instrumented mice
Figure 9 shows representative PV-loops while venous return was attenuated following
inferior caval vein occlusion Typical pressure and volume effects are depicted showing the
absence of apparent differences in PV relationships The mentioned differences in ESP SV
and EF are evident in the presented loops though
ECG recordings were made during both surgical protocols to detect possible heart rate
alterations and arrhythmias Murine left ventricular PV measurements could be distorted by
physiological responses to the catheterization Heart rate alterations could be anticipated
especially in relation to carotid sinus stimulation while cannulating of the carotid artery
However neither bradycardia nor other arrhythmias were observed during either CC or OC
procedures (figure 10) This finding indicates that cannulation of the right common carotid
artery does not alter heart rate by carotid sinus stimulation
Chapter 3 Murine left ventricular pressure-volume loops
23
Table 3 Functional parameters to determine baseline LV functioning in open- and closed-
chest protocols during steady-state measurement
URETHANE PENTOBARBITALOC CC OC CC
N = 5 N = 5 N = 10 N = 10
Mean plusmn SEM Mean plusmn SEM Mean plusmn SEM Mean plusmn SEM
HR 583 plusmn 20 658 plusmn 21 493 plusmn 25 481 plusmn 36SVdagger 1958 plusmn 351 1557 plusmn 254 2018 plusmn 183 1426 plusmn 103CO 12 plusmn 2 10 plusmn 2 10 plusmn 1 7 plusmn 0Vmaxdagger 1761 plusmn 053 2361 plusmn 223 3089 plusmn 289 3883 plusmn 230Vmindagger 215 plusmn 133 679 plusmn 180 1029 plusmn 189 2373 plusmn 199EFdagger 79 plusmn 6 66 plusmn 8 66 plusmn 4 39 plusmn 2
ESPdagger 52 plusmn 4 65 plusmn 5 42 plusmn 3 47 plusmn 4EDP 1 plusmn 1 -1 plusmn 1 -6 plusmn 2 1 plusmn 1
dPdtmax 7200 plusmn 1349 8252 plusmn 1685 4004 plusmn 629 3718 plusmn 684dPdtmindagger -4233 plusmn 531 -7577 plusmn 750 -3631 plusmn 424 -3348 plusmn 653Tau 10 plusmn 0 7 plusmn 0 12 plusmn 1 14 plusmn 2
SW 1066 plusmn 245 1147 plusmn 213 1076 plusmn 176 666 plusmn 116
EaEesdagger 065 plusmn 020 084 plusmn 016 060 plusmn 005 103 plusmn 015ESPVR 570 plusmn 094 589 plusmn 074 347 plusmn 027 318 plusmn 052EDPVR 009 plusmn 009 -008 plusmn 015 -015 plusmn 014 -005 plusmn 015PRSW 79 plusmn 14 64 plusmn 6 68 plusmn 10 53 plusmn 3
Results from LV pressure-volume measurements in C57Bl6 mice anesthetized by urethane or
pentobarbital Urethane versus pentobarbital P lt 005 dagger OC versus CC P lt 005 ρ Valued
124 Ωcm α 030 Open- (OC) and closed-chest (CC) protocols HR indicates heart rate in
bpm SV left ventricular stroke volume in microl CO cardiac output mlmin Vmin minimal left
ventricular volume in microl Vmax maximal left ventricular volume in microl EF ejection fraction in
ESP left ventricular end-systolic pressure in mmHg EDP left ventricular end-diastolic
pressure in mmHg dPdtmax maximal first derivative of left ventricular pressure in mmHgs
dPdtmin minimal first derivative of left ventricular pressure in mmHgs Tau time constant of
left ventricular relaxation in ms SW stroke work in mmHgmicrol Ea arterial elastance Ees
ventricular end-systolic elastance ESPVR left ventricular end-systolic PV relationship in
Chapter 3 Murine left ventricular pressure-volume loops
24
mmHgmicrol EDPVR left ventricular end-diastolic PV relationship in mmHgmicrol PRSW left
ventricular preload-recruitable stroke work in mmHg
The steady-state functional parameters from OC and CC instrumented mice during
either urethane or pentobarbital are also depicted in Table 2 The use of pentobarbital
anesthesia had a cardiodepressive effect that was represented by significant function decline
in most parameters EF dPdtMAX and ESPVR decreased respectively with 24 57 and 41
upon pentobarbital use compared to urethane anesthesia Pentobarbital therefore had strong
negative chronotropic and inotropic effects
Hear
trat
e(b
pm)
Heart rate trace in closed-chest animal
0
100
200
300
400
500
600
700
Time (minutes)
arterial canulation
A
0 1 2 3 4 5 6 7 8 9 10 11 12 13 14 15 16
Heart rate trace in open-chest animal
0
100
200
300
400
500
600
700
Time (minutes)
Hear
trat
e(b
pm)
Ventricular catheterisation
B
0 1 2 3 4 5 6 7 8 9 10 11 12 13 14
Figure 10
Chapter 3 Murine left ventricular pressure-volume loops
25
Fig 10 Heart rate tracings in closed chest and open chest instrumented mice
A Representative figure of a heart rate tracing in a closed-chest instrumented mouse The
moment of arterial cannulation is indicated Some arrhythmias are seen in response to
introduction of the catheter into the left ventricle Arrhythmias are only present in a short
time-period that is part of the stabilization period following catheter introduction Heart rate
remains unchanged during the measurements B Representative figure of a heart rate tracing
in an open-chest instrumented mouse Somewhat more pronounced chronotropic arrhythmias
are seen in response to ventricular introduction of the catheter by apical stab However no
significant brady- or tachycardias are present during the measurements
Chapter 3 Murine left ventricular pressure-volume loops
26
Discussion
In this chapter OC and CC protocols for in vivo left ventricular PV relationship
measurement are described and discussed Murine cardiac function determination via these
methods is sensitive reproducible and comparable The choice for open- or closed-chest PV
measurements in mice depends on the aim of the study with regards to the specific cardiac
pathology The OC approach is technically less complicated and less time consuming Main
characteristics of the OC model itself are low systolic pressures and arterial resistance The
OC approach could best be used in studies where myocardial integrity is not at stake
Particularly ischemiareperfusion studies regarding myocardial integrity are probably better
done using the CC approach
Assessment of cardiac performance in genetically engineered mice is indispensable to
understand human cardiovascular pathologies In general the synergistic features of cardiac
diseases such as hypertrophy and cell death affect cardiac function negatively The
contractile performance of the heart deteriorates which is reflected in the attenuation of
systolic parameters as ejection fraction stroke work and PV-relationships Furthermore
ventricular relaxation prolongs and diastolic filling becomes impaired The progression of
cardiac disease ultimately results in clinical heart failure which is defined by the inability of
the heart to meet hemodynamic demands of the body and is characterized by specific signs
and symptoms (21) The most important parameter of cardiac performance which defines
heart failure is cardiac output
The influence on cardiac performance of specific genes and proteins in the
development of cardiac diseases ought to be investigated extensively to assess their clinical
relevance Various techniques have been used to assess cardiac performance in mice The
main techniques will be discussed in brief
Chapter 3 Murine left ventricular pressure-volume loops
27
Echocardiography is the most widely used noninvasive technique to determine cardiac
performance in mice High-frequency transthoracic and transesophageal transducers are used
as effective tools for two-dimensional and Doppler imaging of ventricular wall structures
dimensions and volumes of cavum and cardiac function (2223) Full-conscious or gas-
anesthesia experiments are preferred for echocardiographic assessment of cardiac function in
mice (2425) There is no limit to the diversity of murine models investigated by this general
accepted method of cardiac performance assessment However the most questionable aspect
of these measurements is the significant inter- and intraobservator variance in the
measurements
Isolated working mouse heart measurements in a Langendorf perfusion setup are a
technique for ex vivo cardiac function measurements approximating the in vivo function level
(5) Cardiac output developed left ventricular pressure and first derivates of maximal and
minimal pressures are some of the parameters that can be derived Isolated working heart
measurements are especially useful to study the acute effects of ischemic preconditioning and
ischemia-induced apoptosis(2627) Metabolites of interest can be measured accurately in the
perfusion fluid Disadvantages are the impossibility of chronic studies and the
unphysiological situation of ex vivo cardiac function measurements
Aortic flow measurements by means of a flow-probe have been used in several
studies (2829) Aortic flow acquisition is a validated technique and reveals functional
parameters as cardiac output stroke volume and blood flow velocity However several
disadvantages oppose against this technique Firstly aortic flow measurements are invasive
(ie thoracotomy or laparotomy) and result solely in aortic derived volume parameters
Integrated ventricular function cannot be assessed More importantly the exact localization of
the flow probe around the aorta is the critical determinant of the systematic error made by
these measurements Flow probes have been placed around the ascending and descending
Chapter 3 Murine left ventricular pressure-volume loops
28
thoracic aorta and the abdominal aorta The percentage of total cardiac output passing the
flow probe on the specific location has to be estimated Flow probes located at the ascending
aorta correct for coronary circulation and for instance bloodvolume passing the descending
thoracic aorta has been estimated to be around 75 of total cardiac output (30) The estimated
correction factor provides lsquoabsolutersquo stroke volume instead of absolute LV cavum volumes
and does not correct for cardiophysiological changes Altered cardiophysiological situations
could theoretically influence the relative amount of bloodvolume passing the flow probe On
the other hand major advances are the possibility of chronic cardiac function measurements
and the relative facile manner of data acquirement(29) Moreover aortic flow probe
measurements are not hampered by deleterious cardiac remodeling in myocardial ischemia or
hypertrophy studies(2829)
The newly developed method of cardiac performance assessment by in vivo left
ventricular PV measurements in the CC model is introduced here Left ventricular PV
measurements in vivo provide an accurate assessment of murine cardiac function The method
is highly sensitive during open- and closed-chest approaches in determining alterations in left
ventricular function as result of cardiac disease or altered hemodynamic stress The
characteristics of simultaneous left ventricular pressure and volume measurements enable the
researcher to directly investigate pressure-related cardiac diseases as cardiac hypertrophy and
restrictive cardiomyopathy (31) or volume-related diseases as dilated cardiomyopathy (32)
Moreover the effective influence of both aspects of cardiac disease on each other can be
observed in detail For instance ventricular dilation and subsequent decrease in ventricular
systolic pressure is mapped accurately in PV-loops Continuous measurements provide
possibilities to investigate the complete cardiac cycle Basic aspects of cardiac physiology can
be visualized using PV-loops in mice (81533-35) For instance increase in ventricular filling
is followed by an increase in ejection fraction according to the Frank-Starling mechanism
Chapter 3 Murine left ventricular pressure-volume loops
29
The opposite is seen as a result of gradual venous return decrease in the case of transient caval
vein occlusion (figure 7 amp 9) Moreover the distinction between systolic and diastolic failure
can be made through continuous PV-measurements (19) Systolic heart failure encompasses
mainly an ejection dysfunction with impaired contractility Both aspects are obtained by and
directly visualized through PV-loops Additionally the definite diagnosis of diastolic failure
is dependent on the observation of an inappropriate upward shift of the (end-)diastolic PV
relationship requiring cardiac catheterization for continuous volume determinations using
impedance measurements and high-fidelity measurements of ventricular pressure with a
micromanometer (19) PV-loops are useful determining cardiac performance within the
complete continuum of healthy and diseased hearts
Chapter 3 Murine left ventricular pressure-volume loops
30
Conclusion
In vivo PV measurements provide an essential tool in the assessment of cardiac
function in genetically modified mice Open- and closed-chest surgical protocols for murine
cardiac function determination are sensitive reproducible and comparable PV-loops enable
the researcher to accurately investigate diverse murine models of cardiac pathology by
adequately visualizing the cause-and-effect relationship between genetic modification and
their functional outcome Changes in ventricular contractility are best detected by PV derived
parameters in comparison to other methods of cardiac function determination
Chapter 3 Murine left ventricular pressure-volume loops
31
References
1 Doevendans PA Daemen MJ de Muinck ED Smits JF Cardiovascular phenotypingin mice Cardiovasc Res 19983934-49
2 Hoit BD New approaches to phenotypic analysis in adult mice J Mol Cell Cardiol20013327-35
3 Chacko VP Aresta F Chacko SM Weiss RG MRIMRS assessment of in vivomurine cardiac metabolism morphology and function at physiological heart rates AmJ Physiol Heart Circ Physiol 2000279H2218-24
4 Tanaka N Dalton N Mao L et al Transthoracic echocardiography in models ofcardiac disease in the mouse Circulation 1996941109-17
5 De Windt LJ Willems J Reneman RS Van der Vusse GJ Arts T Van Bilsen M Animproved isolated left ventricular ejecting murine heart model Functional andmetabolic evaluation Pflugers Arch 1999437182-90
6 Palmen M Daemen MJ Buehler A et al Impaired cardiac remodeling and functionafter myocardial infarction in FGF-1 transgenic mice Circulation 1999100250
7 Rockman HA Hamilton RA Jones LR Milano CA Mao L Lefkowitz RJ Enhancedmyocardial relaxation in vivo in transgenic mice overexpressing the beta2-adrenergicreceptor is associated with reduced phospholamban protein J Clin Invest1996971618-23
8 Georgakopoulos D Mitzner WA Chen CH et al In vivo murine left ventricularpressure-volume relations by miniaturized conductance micromanometry Am JPhysiol 1998274H1416-22
9 Dekker AL Geskes GG Cramers AA et al Right ventricular support for off-pumpcoronary artery bypass grafting studied with bi-ventricular pressure-volume loops insheep Eur J Cardiothorac Surg 200119179-84
10 Schreuder JJ Steendijk P van der Veen FH et al Acute and short-term effects ofpartial left ventriculectomy in dilated cardiomyopathy assessment by pressure-volumeloops J Am Coll Cardiol 2000362104-14
11 Zimmer HG Measurement of left ventricular hemodynamic parameters in closed-chest rats under control and various pathophysiologic conditions Basic Res Cardiol19837877-84
12 Georgakopoulos D Kass DA Estimation of parallel conductance by dual-frequencyconductance catheter in mice Am J Physiol Heart Circ Physiol 2000279H443-50
13 Feldman MD Mao Y Valvano JW Pearce JA Freeman GL Development of amultifrequency conductance catheter-based system to determine LV function in miceAm J Physiol Heart Circ Physiol 2000279H1411-20
14 Kornet L Schreuder JJ Van de Velden ET Jansen JR The volume-dependency ofparallel conductance throughout the cardiac cycle and its consequence for volumeestimation of the left ventricle in patients Cardiovasc Res 200151729-35
15 Nemoto S DeFreitas G Mann DL Carabello BA Effects of changes in leftventricular contractility on indexes of contractility in mice Am J Physiol Heart CircPhysiol 2002283H2504-10
16 Baan J Van de Velden ET Steendijk P Ventricular pressure-volume relations in vivoEur Heart J 199213 SupplE2-6
17 Little WC Cheng CP Left ventricular-arterial coupling in conscious dogs Am JPhysiol 1991261H70-6
18 Sunagawa K Maughan WL Sagawa K Optimal arterial resistance for the maximalstroke work studied in isolated canine left ventricle Circ Res 198556586-95
Chapter 3 Murine left ventricular pressure-volume loops
32
19 Van Kraaij D Van Pol P Ruiters AW et al Diagnosing diastolic heart failure Eur JHeart Fail 20024419-30
20 Faunt KK Cohn LA Jones BD Dodam JR Cardiopulmonary effects of bilateralhemithorax ventilation and diagnostic thoracoscopy in dogs Am J Vet Res1998591494-8
21 Lips DJ Van Kraaij DL De Windt LJ Doevendans PA Molecular determinants ofmyocardial hypertrophy and failure alternative pathways for beneficial andmaladaptive hypertrophy Eur Heart J 200324883-96
22 Collins KA Korcarz CE Lang RM Use of echocardiography for the phenotypicassessment of genetically altered mice Physiol Genomics 200313227-39
23 Scherrer-Crosbie M Steudel W Hunziker PR et al Determination of right ventricularstructure and function in normoxic and hypoxic mice a transesophagealechocardiographic study Circulation 1998981015-21
24 Takuma S Suehiro K Cardinale C et al Anesthetic inhibition in ischemic andnonischemic murine heart comparison with conscious echocardiographic approachAm J Physiol Heart Circ Physiol 2001280H2364-70
25 Chaves AA Weinstein DM Bauer JA Non-invasive echocardiographic studies inmice influence of anesthetic regimen Life Sci 200169213-22
26 Yamaura G Turoczi T Yamamoto F Siddqui MA Maulik N Das DK STATsignaling in ischemic heart a role of STAT5A in ischemic preconditioning Am JPhysiol Heart Circ Physiol 2003285H476-82
27 Bell RM Yellon DM Atorvastatin administered at the onset of reperfusion andindependent of lipid lowering protects the myocardium by up-regulating a pro-survival pathway J Am Coll Cardiol 200341508-15
28 Aartsen WM Schuijt MP Danser AH Daemen MJ Smits JF The role of locallyexpressed angiotensin converting enzyme in cardiac remodeling after myocardialinfarction in mice Cardiovasc Res 200256205-13
29 Janssen B Debets J Leenders P Smits J Chronic measurement of cardiac output inconscious mice Am J Physiol Regul Integr Comp Physiol 2002282R928-35
30 Georgakopoulos D Christe ME Giewat M Seidman CM Seidman JG Kass DA Thepathogenesis of familial hypertrophic cardiomyopathy early and evolving effects froman alpha-cardiac myosin heavy chain missense mutation Nat Med 19995327-30
31 Liao P Georgakopoulos D Kovacs A et al The in vivo role of p38 MAP kinases incardiac remodeling and restrictive cardiomyopathy Proc Natl Acad Sci U S A20019812283-8
32 McConnell BK Jones KA Fatkin D et al Dilated cardiomyopathy in homozygousmyosin-binding protein-C mutant mice J Clin Invest 19991041235-44
33 Georgakopoulos D Kass DA Minimal force-frequency modulation of inotropy andrelaxation of in situ murine heart J Physiol 2001534535-45
34 Yang B Larson DF Watson R Age-related left ventricular function in the mouseanalysis based on in vivo pressure-volume relationships Am J Physiol1999277H1906-13
35 Reyes M Freeman GL Escobedo D Lee S Steinhelper ME Feldman MDEnhancement of contractility with sustained afterload in the intact murine heartblunting of length-dependent activation Circulation 20031072962-8
Chapter 3 Murine left ventricular pressure-volume loops
16
The production of stroke work is maximal when the Ees and Ea are approximately
equal Stroke work attenuates substantially in relation to its maximal value whenever Ea and
Ees differ markedly (1718) The preload-recruitable stroke work (PRSW) is the relationship
between end-diastolic volume and performed stroke work by the ventricle It is a load-
independent measure of contractility related to preload The contractile state of the heart is
resembled by the steepness of the PRSW-slope In a high contractile state the heart is able to
perform more stroke work at a constant end-diastolic volume for instance by augmenting the
ejection fraction
Diastolic function is derived from the end-diastolic PV relationship (EDPVR) which
correlates with the compliance of the ventricular myocardium Diastolic dysfunctioning or
failure is observed by an inappropriate upward shift of the ESPVR The slope of the EDPVR
(β) increases during augmented stiffness of the ventricular wall when pressure rises
progressively more during ventricular filling The opposite occurs in case of increased
compliance Certain cardiac diseases and remodeling processes are correlated with increased
stiffness of the ventricular wall by collagen deposition resulting in an increase of the
EDPVR-slope (19)
Numerous other relationships can be assessed The limits are determined by the
interests and the creativity of the investigator
Chapter 3 Murine left ventricular pressure-volume loops
17
Results of PV-measurements with the open- (OC) and closed-chest (CC) approach
A comparative study was performed to determine scientifically based arguments for
the choice between open- (OC) or closed-chest (CC) PV measurements to examine murine
cardiac function Comparing cardiac performance between OC and CC protocols revealed
overall relatively similar values for the investigated parameters (table 3) The values for LV
volumes were corrected for ρ determined at 124 Ωcm in the used setup (N = 10 12352 plusmn
088 Ωcm) α (N = 13 030) and Vc Vc was determined during all PV experiments by the
hypertonic saline injection method No significant differences could be detected between CC
and OC instrumentation (9469 plusmn 483 microl versus 9272 plusmn 205 microl respectively NS) The 4 microl
30 saline demonstrated to be sufficient to change blood conductivity Moreover as this
volume encompasses only 15 of the normal murine end-diastolic volume it proved to be too
small to influence LV end-diastolic and end-systolic pressures (figure 4) in either OC or CC
mice
Several differences were found between the OC and CC approaches (table 3) Cardiac
function in the OC approach was characterized by higher ejection fractions (EF 69 versus
48 respectively) larger stroke volume (1998 versus 1470 microl respectively) and a leftward
shift in ventricular volume On the contrary measuring cardiac function with an intact thorax
resulted in higher end-systolic pressures (ESP OC 52 versus CC 65 mmHg with urethane
anesthesia) and a higher rate of relaxation as indicated by the dPdtmin No differences were
found in the PV relationships ie the ESPVR EDPVR or PRSW Interestingly the OC
approach did result in a mismatch between arterial afterload and ventricular work The
arterial-ventricular elastance ratio (EaEes) was significantly depressed following opening of
the chest In contrast EaEes ratios were normal (ie ~ 10) in the CC approach under both
regimens This finding is consistently found in open-chest instrumented mice (8) The arterial-
ventricular coupling mismatch was depending on arterial resistance the slope of the ESPVR
Chapter 3 Murine left ventricular pressure-volume loops
18
Table 1 Comparison of volume derived by ultrasonography and conductance
Descriptive statistics of alphaN Min Max Mean SEM
EDV 13 018 045 030 002ESV 13 016 094 051 007SV 13 009 058 026 004
Regression analysis
N
RR2
Adjusted R2
SEE
EDV13
082068065179
ESV13
083069066172
SV13
041017009117
Chapter 3 Murine left ventricular pressure-volume loops
19
Left ventricular volume was measured by both ultrasonography
and conductance in adult C57Bl6 mice End-diastolic end-
systolic and stroke volume were used to obtain alpha (α)
Descriptive analysis shows that α determination at the end-
diastolic moment results in the most consistent mean α Also
the correlation of LV volume values between ultrasonography
and conductance is high as shown by the regression analysis
SEM indicates standard error of the mean SEE standard error
of the estimate
EDVECHO (microl)120100806040200
EDV C
ON
DUC
TAN
CE (micro
l)
18
16
14
12
10
8
6
SCATTERPLOT OF END-DIASTOLIC VOLUMECONDUCTANCE VS ULTRASONOGRAPHY
EDVECHO (microl)120100806040200
EDV C
ON
DUC
TAN
CE (micro
l)
18
16
14
12
10
8
6
EDVECHO (microl)120100806040200
EDV C
ON
DUC
TAN
CE (micro
l)
18
16
14
12
10
8
6
SCATTERPLOT OF END-DIASTOLIC VOLUMECONDUCTANCE VS ULTRASONOGRAPHY
Chapter 3 Murine left ventricular pressure-volume loops
20
Table 2 Parameters derived by pressure-volume loops
Abbreviations DefinitionsGeneral parameters
CI (CI = CObody wt) CO HR
Card iac indexCard iac outputHeart rate
PressuredPdtmax
dPdtmin
PedPesτ
Maximum derivative of change in systolic pressure in timeMaximum derivative of change in diastolic pressure in timeEnd-diastolic pressureEnd-systolic pressureTime constant of isovolumic relaxation
VolumeEFSI (SI = SVbody wt)SVVedVes
Ejection fractionStroke index Stroke volumeEnd-diastolic pressureEnd-systolic pressure
Pressure-volume relationshipsβEa (Ea = PesSV)EDPVREes
Slope of the end-diastolic pressure-volume relat ionshipArterial elastanceEnd-diastolic pressure-volume relat ionshipEnd-systolic ventricular elastance
EmaxESPVR
(slope of the end-systolic pressure-volume relationship)Maximum chamber elasticity (∆P∆V)End-systolic pressure-volume relat ionship
Pressure-volume areaEfficiencyEWPEPRSWPVASWSWI (SWI = SWbody wt)
EWPVAExternal work = SWPotential energyPreload-recruitable stroke workPressure-volume area = EW + PEStroke workStroke work index
Abbreviations DefinitionsGeneral parameters
CI (CI = CObody wt) CO HR
Card iac indexCard iac outputHeart rate
PressuredPdtmax
dPdtmin
PedPesτ
Maximum derivative of change in systolic pressure in timeMaximum derivative of change in diastolic pressure in timeEnd-diastolic pressureEnd-systolic pressureTime constant of isovolumic relaxation
VolumeEFSI (SI = SVbody wt)SVVedVes
Ejection fractionStroke index Stroke volumeEnd-diastolic pressureEnd-systolic pressure
Pressure-volume relationshipsβEa (Ea = PesSV)EDPVREes
Slope of the end-diastolic pressure-volume relat ionshipArterial elastanceEnd-diastolic pressure-volume relat ionshipEnd-systolic ventricular elastance
EmaxESPVR
(slope of the end-systolic pressure-volume relationship)Maximum chamber elasticity (∆P∆V)End-systolic pressure-volume relat ionship
Pressure-volume areaEfficiencyEWPEPRSWPVASWSWI (SWI = SWbody wt)
EWPVAExternal work = SWPotential energyPreload-recruitable stroke workPressure-volume area = EW + PEStroke workStroke work index
EmaxESPVR
(slope of the end-systolic pressure-volume (slope of the end-systolic pressure-volume relationship)Maximum chamber elasticity (∆P∆V)End-systolic pressure-volume relat ionship
Pressure-volume areaEfficiencyEWPEPRSWPVASWSWI (SWI = SWbody wt)
EWPVAExternal work = SWPotential energyPreload-recruitable stroke workPressure-volume area = EW + PEStroke workStroke work index
Chapter 3 Murine left ventricular pressure-volume loops
21
(Ees) proved to be equal in OC and CC instrumented mice The combination of enlarged
stroke volume with attenuated systolic pressures leads to a decrease in arterial elastance The
altered arterial elastance could be explained by the opening of the thorax A drop in overall
peripheral vascular resistance from baseline values has been described during thoracoscopy
(20)
Urethane
Volume (microl)
Pres
sure
(mm
Hg)
Pentobarbital
Volume (microl)
Pres
sure
(mm
Hg)
A
B
CCOCCCCCOCOC
CCOCCCCCOCOC
-100
102030405060708090
-10
0
10
20
30
40
50
60
0 5 10 15 20 25 30 35 400 5 10 15 20 25 30 35 40
0 5 10 15 20 25 30 35 400 5 10 15 20 25 30 35 40
Figure 9
Chapter 3 Murine left ventricular pressure-volume loops
22
Fig 9 Left ventricular pressure-volume loops Pressure presented in mmHg and volume microl
A Representative figure of PV loops acquired during urethane anesthesia in closed chest
(CC) and open chest (OC) instrumented mice B Representative figure of PV loops acquired
during pentobarbital anesthesia in CC and OC instrumented mice Loops are acquired during
an occlusion of the inferior caval vein Venous returns decreases which is represented in the
loops by attenuation of both pressure and volume The differences in ESP SW and ESPVR
between urethane and pentobarbital anesthesia can be observed by analyzing the loops in A
and B The loops show also the larger stroke volume and depressed systolic pressure in OC
instrumented mice
Figure 9 shows representative PV-loops while venous return was attenuated following
inferior caval vein occlusion Typical pressure and volume effects are depicted showing the
absence of apparent differences in PV relationships The mentioned differences in ESP SV
and EF are evident in the presented loops though
ECG recordings were made during both surgical protocols to detect possible heart rate
alterations and arrhythmias Murine left ventricular PV measurements could be distorted by
physiological responses to the catheterization Heart rate alterations could be anticipated
especially in relation to carotid sinus stimulation while cannulating of the carotid artery
However neither bradycardia nor other arrhythmias were observed during either CC or OC
procedures (figure 10) This finding indicates that cannulation of the right common carotid
artery does not alter heart rate by carotid sinus stimulation
Chapter 3 Murine left ventricular pressure-volume loops
23
Table 3 Functional parameters to determine baseline LV functioning in open- and closed-
chest protocols during steady-state measurement
URETHANE PENTOBARBITALOC CC OC CC
N = 5 N = 5 N = 10 N = 10
Mean plusmn SEM Mean plusmn SEM Mean plusmn SEM Mean plusmn SEM
HR 583 plusmn 20 658 plusmn 21 493 plusmn 25 481 plusmn 36SVdagger 1958 plusmn 351 1557 plusmn 254 2018 plusmn 183 1426 plusmn 103CO 12 plusmn 2 10 plusmn 2 10 plusmn 1 7 plusmn 0Vmaxdagger 1761 plusmn 053 2361 plusmn 223 3089 plusmn 289 3883 plusmn 230Vmindagger 215 plusmn 133 679 plusmn 180 1029 plusmn 189 2373 plusmn 199EFdagger 79 plusmn 6 66 plusmn 8 66 plusmn 4 39 plusmn 2
ESPdagger 52 plusmn 4 65 plusmn 5 42 plusmn 3 47 plusmn 4EDP 1 plusmn 1 -1 plusmn 1 -6 plusmn 2 1 plusmn 1
dPdtmax 7200 plusmn 1349 8252 plusmn 1685 4004 plusmn 629 3718 plusmn 684dPdtmindagger -4233 plusmn 531 -7577 plusmn 750 -3631 plusmn 424 -3348 plusmn 653Tau 10 plusmn 0 7 plusmn 0 12 plusmn 1 14 plusmn 2
SW 1066 plusmn 245 1147 plusmn 213 1076 plusmn 176 666 plusmn 116
EaEesdagger 065 plusmn 020 084 plusmn 016 060 plusmn 005 103 plusmn 015ESPVR 570 plusmn 094 589 plusmn 074 347 plusmn 027 318 plusmn 052EDPVR 009 plusmn 009 -008 plusmn 015 -015 plusmn 014 -005 plusmn 015PRSW 79 plusmn 14 64 plusmn 6 68 plusmn 10 53 plusmn 3
Results from LV pressure-volume measurements in C57Bl6 mice anesthetized by urethane or
pentobarbital Urethane versus pentobarbital P lt 005 dagger OC versus CC P lt 005 ρ Valued
124 Ωcm α 030 Open- (OC) and closed-chest (CC) protocols HR indicates heart rate in
bpm SV left ventricular stroke volume in microl CO cardiac output mlmin Vmin minimal left
ventricular volume in microl Vmax maximal left ventricular volume in microl EF ejection fraction in
ESP left ventricular end-systolic pressure in mmHg EDP left ventricular end-diastolic
pressure in mmHg dPdtmax maximal first derivative of left ventricular pressure in mmHgs
dPdtmin minimal first derivative of left ventricular pressure in mmHgs Tau time constant of
left ventricular relaxation in ms SW stroke work in mmHgmicrol Ea arterial elastance Ees
ventricular end-systolic elastance ESPVR left ventricular end-systolic PV relationship in
Chapter 3 Murine left ventricular pressure-volume loops
24
mmHgmicrol EDPVR left ventricular end-diastolic PV relationship in mmHgmicrol PRSW left
ventricular preload-recruitable stroke work in mmHg
The steady-state functional parameters from OC and CC instrumented mice during
either urethane or pentobarbital are also depicted in Table 2 The use of pentobarbital
anesthesia had a cardiodepressive effect that was represented by significant function decline
in most parameters EF dPdtMAX and ESPVR decreased respectively with 24 57 and 41
upon pentobarbital use compared to urethane anesthesia Pentobarbital therefore had strong
negative chronotropic and inotropic effects
Hear
trat
e(b
pm)
Heart rate trace in closed-chest animal
0
100
200
300
400
500
600
700
Time (minutes)
arterial canulation
A
0 1 2 3 4 5 6 7 8 9 10 11 12 13 14 15 16
Heart rate trace in open-chest animal
0
100
200
300
400
500
600
700
Time (minutes)
Hear
trat
e(b
pm)
Ventricular catheterisation
B
0 1 2 3 4 5 6 7 8 9 10 11 12 13 14
Figure 10
Chapter 3 Murine left ventricular pressure-volume loops
25
Fig 10 Heart rate tracings in closed chest and open chest instrumented mice
A Representative figure of a heart rate tracing in a closed-chest instrumented mouse The
moment of arterial cannulation is indicated Some arrhythmias are seen in response to
introduction of the catheter into the left ventricle Arrhythmias are only present in a short
time-period that is part of the stabilization period following catheter introduction Heart rate
remains unchanged during the measurements B Representative figure of a heart rate tracing
in an open-chest instrumented mouse Somewhat more pronounced chronotropic arrhythmias
are seen in response to ventricular introduction of the catheter by apical stab However no
significant brady- or tachycardias are present during the measurements
Chapter 3 Murine left ventricular pressure-volume loops
26
Discussion
In this chapter OC and CC protocols for in vivo left ventricular PV relationship
measurement are described and discussed Murine cardiac function determination via these
methods is sensitive reproducible and comparable The choice for open- or closed-chest PV
measurements in mice depends on the aim of the study with regards to the specific cardiac
pathology The OC approach is technically less complicated and less time consuming Main
characteristics of the OC model itself are low systolic pressures and arterial resistance The
OC approach could best be used in studies where myocardial integrity is not at stake
Particularly ischemiareperfusion studies regarding myocardial integrity are probably better
done using the CC approach
Assessment of cardiac performance in genetically engineered mice is indispensable to
understand human cardiovascular pathologies In general the synergistic features of cardiac
diseases such as hypertrophy and cell death affect cardiac function negatively The
contractile performance of the heart deteriorates which is reflected in the attenuation of
systolic parameters as ejection fraction stroke work and PV-relationships Furthermore
ventricular relaxation prolongs and diastolic filling becomes impaired The progression of
cardiac disease ultimately results in clinical heart failure which is defined by the inability of
the heart to meet hemodynamic demands of the body and is characterized by specific signs
and symptoms (21) The most important parameter of cardiac performance which defines
heart failure is cardiac output
The influence on cardiac performance of specific genes and proteins in the
development of cardiac diseases ought to be investigated extensively to assess their clinical
relevance Various techniques have been used to assess cardiac performance in mice The
main techniques will be discussed in brief
Chapter 3 Murine left ventricular pressure-volume loops
27
Echocardiography is the most widely used noninvasive technique to determine cardiac
performance in mice High-frequency transthoracic and transesophageal transducers are used
as effective tools for two-dimensional and Doppler imaging of ventricular wall structures
dimensions and volumes of cavum and cardiac function (2223) Full-conscious or gas-
anesthesia experiments are preferred for echocardiographic assessment of cardiac function in
mice (2425) There is no limit to the diversity of murine models investigated by this general
accepted method of cardiac performance assessment However the most questionable aspect
of these measurements is the significant inter- and intraobservator variance in the
measurements
Isolated working mouse heart measurements in a Langendorf perfusion setup are a
technique for ex vivo cardiac function measurements approximating the in vivo function level
(5) Cardiac output developed left ventricular pressure and first derivates of maximal and
minimal pressures are some of the parameters that can be derived Isolated working heart
measurements are especially useful to study the acute effects of ischemic preconditioning and
ischemia-induced apoptosis(2627) Metabolites of interest can be measured accurately in the
perfusion fluid Disadvantages are the impossibility of chronic studies and the
unphysiological situation of ex vivo cardiac function measurements
Aortic flow measurements by means of a flow-probe have been used in several
studies (2829) Aortic flow acquisition is a validated technique and reveals functional
parameters as cardiac output stroke volume and blood flow velocity However several
disadvantages oppose against this technique Firstly aortic flow measurements are invasive
(ie thoracotomy or laparotomy) and result solely in aortic derived volume parameters
Integrated ventricular function cannot be assessed More importantly the exact localization of
the flow probe around the aorta is the critical determinant of the systematic error made by
these measurements Flow probes have been placed around the ascending and descending
Chapter 3 Murine left ventricular pressure-volume loops
28
thoracic aorta and the abdominal aorta The percentage of total cardiac output passing the
flow probe on the specific location has to be estimated Flow probes located at the ascending
aorta correct for coronary circulation and for instance bloodvolume passing the descending
thoracic aorta has been estimated to be around 75 of total cardiac output (30) The estimated
correction factor provides lsquoabsolutersquo stroke volume instead of absolute LV cavum volumes
and does not correct for cardiophysiological changes Altered cardiophysiological situations
could theoretically influence the relative amount of bloodvolume passing the flow probe On
the other hand major advances are the possibility of chronic cardiac function measurements
and the relative facile manner of data acquirement(29) Moreover aortic flow probe
measurements are not hampered by deleterious cardiac remodeling in myocardial ischemia or
hypertrophy studies(2829)
The newly developed method of cardiac performance assessment by in vivo left
ventricular PV measurements in the CC model is introduced here Left ventricular PV
measurements in vivo provide an accurate assessment of murine cardiac function The method
is highly sensitive during open- and closed-chest approaches in determining alterations in left
ventricular function as result of cardiac disease or altered hemodynamic stress The
characteristics of simultaneous left ventricular pressure and volume measurements enable the
researcher to directly investigate pressure-related cardiac diseases as cardiac hypertrophy and
restrictive cardiomyopathy (31) or volume-related diseases as dilated cardiomyopathy (32)
Moreover the effective influence of both aspects of cardiac disease on each other can be
observed in detail For instance ventricular dilation and subsequent decrease in ventricular
systolic pressure is mapped accurately in PV-loops Continuous measurements provide
possibilities to investigate the complete cardiac cycle Basic aspects of cardiac physiology can
be visualized using PV-loops in mice (81533-35) For instance increase in ventricular filling
is followed by an increase in ejection fraction according to the Frank-Starling mechanism
Chapter 3 Murine left ventricular pressure-volume loops
29
The opposite is seen as a result of gradual venous return decrease in the case of transient caval
vein occlusion (figure 7 amp 9) Moreover the distinction between systolic and diastolic failure
can be made through continuous PV-measurements (19) Systolic heart failure encompasses
mainly an ejection dysfunction with impaired contractility Both aspects are obtained by and
directly visualized through PV-loops Additionally the definite diagnosis of diastolic failure
is dependent on the observation of an inappropriate upward shift of the (end-)diastolic PV
relationship requiring cardiac catheterization for continuous volume determinations using
impedance measurements and high-fidelity measurements of ventricular pressure with a
micromanometer (19) PV-loops are useful determining cardiac performance within the
complete continuum of healthy and diseased hearts
Chapter 3 Murine left ventricular pressure-volume loops
30
Conclusion
In vivo PV measurements provide an essential tool in the assessment of cardiac
function in genetically modified mice Open- and closed-chest surgical protocols for murine
cardiac function determination are sensitive reproducible and comparable PV-loops enable
the researcher to accurately investigate diverse murine models of cardiac pathology by
adequately visualizing the cause-and-effect relationship between genetic modification and
their functional outcome Changes in ventricular contractility are best detected by PV derived
parameters in comparison to other methods of cardiac function determination
Chapter 3 Murine left ventricular pressure-volume loops
31
References
1 Doevendans PA Daemen MJ de Muinck ED Smits JF Cardiovascular phenotypingin mice Cardiovasc Res 19983934-49
2 Hoit BD New approaches to phenotypic analysis in adult mice J Mol Cell Cardiol20013327-35
3 Chacko VP Aresta F Chacko SM Weiss RG MRIMRS assessment of in vivomurine cardiac metabolism morphology and function at physiological heart rates AmJ Physiol Heart Circ Physiol 2000279H2218-24
4 Tanaka N Dalton N Mao L et al Transthoracic echocardiography in models ofcardiac disease in the mouse Circulation 1996941109-17
5 De Windt LJ Willems J Reneman RS Van der Vusse GJ Arts T Van Bilsen M Animproved isolated left ventricular ejecting murine heart model Functional andmetabolic evaluation Pflugers Arch 1999437182-90
6 Palmen M Daemen MJ Buehler A et al Impaired cardiac remodeling and functionafter myocardial infarction in FGF-1 transgenic mice Circulation 1999100250
7 Rockman HA Hamilton RA Jones LR Milano CA Mao L Lefkowitz RJ Enhancedmyocardial relaxation in vivo in transgenic mice overexpressing the beta2-adrenergicreceptor is associated with reduced phospholamban protein J Clin Invest1996971618-23
8 Georgakopoulos D Mitzner WA Chen CH et al In vivo murine left ventricularpressure-volume relations by miniaturized conductance micromanometry Am JPhysiol 1998274H1416-22
9 Dekker AL Geskes GG Cramers AA et al Right ventricular support for off-pumpcoronary artery bypass grafting studied with bi-ventricular pressure-volume loops insheep Eur J Cardiothorac Surg 200119179-84
10 Schreuder JJ Steendijk P van der Veen FH et al Acute and short-term effects ofpartial left ventriculectomy in dilated cardiomyopathy assessment by pressure-volumeloops J Am Coll Cardiol 2000362104-14
11 Zimmer HG Measurement of left ventricular hemodynamic parameters in closed-chest rats under control and various pathophysiologic conditions Basic Res Cardiol19837877-84
12 Georgakopoulos D Kass DA Estimation of parallel conductance by dual-frequencyconductance catheter in mice Am J Physiol Heart Circ Physiol 2000279H443-50
13 Feldman MD Mao Y Valvano JW Pearce JA Freeman GL Development of amultifrequency conductance catheter-based system to determine LV function in miceAm J Physiol Heart Circ Physiol 2000279H1411-20
14 Kornet L Schreuder JJ Van de Velden ET Jansen JR The volume-dependency ofparallel conductance throughout the cardiac cycle and its consequence for volumeestimation of the left ventricle in patients Cardiovasc Res 200151729-35
15 Nemoto S DeFreitas G Mann DL Carabello BA Effects of changes in leftventricular contractility on indexes of contractility in mice Am J Physiol Heart CircPhysiol 2002283H2504-10
16 Baan J Van de Velden ET Steendijk P Ventricular pressure-volume relations in vivoEur Heart J 199213 SupplE2-6
17 Little WC Cheng CP Left ventricular-arterial coupling in conscious dogs Am JPhysiol 1991261H70-6
18 Sunagawa K Maughan WL Sagawa K Optimal arterial resistance for the maximalstroke work studied in isolated canine left ventricle Circ Res 198556586-95
Chapter 3 Murine left ventricular pressure-volume loops
32
19 Van Kraaij D Van Pol P Ruiters AW et al Diagnosing diastolic heart failure Eur JHeart Fail 20024419-30
20 Faunt KK Cohn LA Jones BD Dodam JR Cardiopulmonary effects of bilateralhemithorax ventilation and diagnostic thoracoscopy in dogs Am J Vet Res1998591494-8
21 Lips DJ Van Kraaij DL De Windt LJ Doevendans PA Molecular determinants ofmyocardial hypertrophy and failure alternative pathways for beneficial andmaladaptive hypertrophy Eur Heart J 200324883-96
22 Collins KA Korcarz CE Lang RM Use of echocardiography for the phenotypicassessment of genetically altered mice Physiol Genomics 200313227-39
23 Scherrer-Crosbie M Steudel W Hunziker PR et al Determination of right ventricularstructure and function in normoxic and hypoxic mice a transesophagealechocardiographic study Circulation 1998981015-21
24 Takuma S Suehiro K Cardinale C et al Anesthetic inhibition in ischemic andnonischemic murine heart comparison with conscious echocardiographic approachAm J Physiol Heart Circ Physiol 2001280H2364-70
25 Chaves AA Weinstein DM Bauer JA Non-invasive echocardiographic studies inmice influence of anesthetic regimen Life Sci 200169213-22
26 Yamaura G Turoczi T Yamamoto F Siddqui MA Maulik N Das DK STATsignaling in ischemic heart a role of STAT5A in ischemic preconditioning Am JPhysiol Heart Circ Physiol 2003285H476-82
27 Bell RM Yellon DM Atorvastatin administered at the onset of reperfusion andindependent of lipid lowering protects the myocardium by up-regulating a pro-survival pathway J Am Coll Cardiol 200341508-15
28 Aartsen WM Schuijt MP Danser AH Daemen MJ Smits JF The role of locallyexpressed angiotensin converting enzyme in cardiac remodeling after myocardialinfarction in mice Cardiovasc Res 200256205-13
29 Janssen B Debets J Leenders P Smits J Chronic measurement of cardiac output inconscious mice Am J Physiol Regul Integr Comp Physiol 2002282R928-35
30 Georgakopoulos D Christe ME Giewat M Seidman CM Seidman JG Kass DA Thepathogenesis of familial hypertrophic cardiomyopathy early and evolving effects froman alpha-cardiac myosin heavy chain missense mutation Nat Med 19995327-30
31 Liao P Georgakopoulos D Kovacs A et al The in vivo role of p38 MAP kinases incardiac remodeling and restrictive cardiomyopathy Proc Natl Acad Sci U S A20019812283-8
32 McConnell BK Jones KA Fatkin D et al Dilated cardiomyopathy in homozygousmyosin-binding protein-C mutant mice J Clin Invest 19991041235-44
33 Georgakopoulos D Kass DA Minimal force-frequency modulation of inotropy andrelaxation of in situ murine heart J Physiol 2001534535-45
34 Yang B Larson DF Watson R Age-related left ventricular function in the mouseanalysis based on in vivo pressure-volume relationships Am J Physiol1999277H1906-13
35 Reyes M Freeman GL Escobedo D Lee S Steinhelper ME Feldman MDEnhancement of contractility with sustained afterload in the intact murine heartblunting of length-dependent activation Circulation 20031072962-8
Chapter 3 Murine left ventricular pressure-volume loops
17
Results of PV-measurements with the open- (OC) and closed-chest (CC) approach
A comparative study was performed to determine scientifically based arguments for
the choice between open- (OC) or closed-chest (CC) PV measurements to examine murine
cardiac function Comparing cardiac performance between OC and CC protocols revealed
overall relatively similar values for the investigated parameters (table 3) The values for LV
volumes were corrected for ρ determined at 124 Ωcm in the used setup (N = 10 12352 plusmn
088 Ωcm) α (N = 13 030) and Vc Vc was determined during all PV experiments by the
hypertonic saline injection method No significant differences could be detected between CC
and OC instrumentation (9469 plusmn 483 microl versus 9272 plusmn 205 microl respectively NS) The 4 microl
30 saline demonstrated to be sufficient to change blood conductivity Moreover as this
volume encompasses only 15 of the normal murine end-diastolic volume it proved to be too
small to influence LV end-diastolic and end-systolic pressures (figure 4) in either OC or CC
mice
Several differences were found between the OC and CC approaches (table 3) Cardiac
function in the OC approach was characterized by higher ejection fractions (EF 69 versus
48 respectively) larger stroke volume (1998 versus 1470 microl respectively) and a leftward
shift in ventricular volume On the contrary measuring cardiac function with an intact thorax
resulted in higher end-systolic pressures (ESP OC 52 versus CC 65 mmHg with urethane
anesthesia) and a higher rate of relaxation as indicated by the dPdtmin No differences were
found in the PV relationships ie the ESPVR EDPVR or PRSW Interestingly the OC
approach did result in a mismatch between arterial afterload and ventricular work The
arterial-ventricular elastance ratio (EaEes) was significantly depressed following opening of
the chest In contrast EaEes ratios were normal (ie ~ 10) in the CC approach under both
regimens This finding is consistently found in open-chest instrumented mice (8) The arterial-
ventricular coupling mismatch was depending on arterial resistance the slope of the ESPVR
Chapter 3 Murine left ventricular pressure-volume loops
18
Table 1 Comparison of volume derived by ultrasonography and conductance
Descriptive statistics of alphaN Min Max Mean SEM
EDV 13 018 045 030 002ESV 13 016 094 051 007SV 13 009 058 026 004
Regression analysis
N
RR2
Adjusted R2
SEE
EDV13
082068065179
ESV13
083069066172
SV13
041017009117
Chapter 3 Murine left ventricular pressure-volume loops
19
Left ventricular volume was measured by both ultrasonography
and conductance in adult C57Bl6 mice End-diastolic end-
systolic and stroke volume were used to obtain alpha (α)
Descriptive analysis shows that α determination at the end-
diastolic moment results in the most consistent mean α Also
the correlation of LV volume values between ultrasonography
and conductance is high as shown by the regression analysis
SEM indicates standard error of the mean SEE standard error
of the estimate
EDVECHO (microl)120100806040200
EDV C
ON
DUC
TAN
CE (micro
l)
18
16
14
12
10
8
6
SCATTERPLOT OF END-DIASTOLIC VOLUMECONDUCTANCE VS ULTRASONOGRAPHY
EDVECHO (microl)120100806040200
EDV C
ON
DUC
TAN
CE (micro
l)
18
16
14
12
10
8
6
EDVECHO (microl)120100806040200
EDV C
ON
DUC
TAN
CE (micro
l)
18
16
14
12
10
8
6
SCATTERPLOT OF END-DIASTOLIC VOLUMECONDUCTANCE VS ULTRASONOGRAPHY
Chapter 3 Murine left ventricular pressure-volume loops
20
Table 2 Parameters derived by pressure-volume loops
Abbreviations DefinitionsGeneral parameters
CI (CI = CObody wt) CO HR
Card iac indexCard iac outputHeart rate
PressuredPdtmax
dPdtmin
PedPesτ
Maximum derivative of change in systolic pressure in timeMaximum derivative of change in diastolic pressure in timeEnd-diastolic pressureEnd-systolic pressureTime constant of isovolumic relaxation
VolumeEFSI (SI = SVbody wt)SVVedVes
Ejection fractionStroke index Stroke volumeEnd-diastolic pressureEnd-systolic pressure
Pressure-volume relationshipsβEa (Ea = PesSV)EDPVREes
Slope of the end-diastolic pressure-volume relat ionshipArterial elastanceEnd-diastolic pressure-volume relat ionshipEnd-systolic ventricular elastance
EmaxESPVR
(slope of the end-systolic pressure-volume relationship)Maximum chamber elasticity (∆P∆V)End-systolic pressure-volume relat ionship
Pressure-volume areaEfficiencyEWPEPRSWPVASWSWI (SWI = SWbody wt)
EWPVAExternal work = SWPotential energyPreload-recruitable stroke workPressure-volume area = EW + PEStroke workStroke work index
Abbreviations DefinitionsGeneral parameters
CI (CI = CObody wt) CO HR
Card iac indexCard iac outputHeart rate
PressuredPdtmax
dPdtmin
PedPesτ
Maximum derivative of change in systolic pressure in timeMaximum derivative of change in diastolic pressure in timeEnd-diastolic pressureEnd-systolic pressureTime constant of isovolumic relaxation
VolumeEFSI (SI = SVbody wt)SVVedVes
Ejection fractionStroke index Stroke volumeEnd-diastolic pressureEnd-systolic pressure
Pressure-volume relationshipsβEa (Ea = PesSV)EDPVREes
Slope of the end-diastolic pressure-volume relat ionshipArterial elastanceEnd-diastolic pressure-volume relat ionshipEnd-systolic ventricular elastance
EmaxESPVR
(slope of the end-systolic pressure-volume relationship)Maximum chamber elasticity (∆P∆V)End-systolic pressure-volume relat ionship
Pressure-volume areaEfficiencyEWPEPRSWPVASWSWI (SWI = SWbody wt)
EWPVAExternal work = SWPotential energyPreload-recruitable stroke workPressure-volume area = EW + PEStroke workStroke work index
EmaxESPVR
(slope of the end-systolic pressure-volume (slope of the end-systolic pressure-volume relationship)Maximum chamber elasticity (∆P∆V)End-systolic pressure-volume relat ionship
Pressure-volume areaEfficiencyEWPEPRSWPVASWSWI (SWI = SWbody wt)
EWPVAExternal work = SWPotential energyPreload-recruitable stroke workPressure-volume area = EW + PEStroke workStroke work index
Chapter 3 Murine left ventricular pressure-volume loops
21
(Ees) proved to be equal in OC and CC instrumented mice The combination of enlarged
stroke volume with attenuated systolic pressures leads to a decrease in arterial elastance The
altered arterial elastance could be explained by the opening of the thorax A drop in overall
peripheral vascular resistance from baseline values has been described during thoracoscopy
(20)
Urethane
Volume (microl)
Pres
sure
(mm
Hg)
Pentobarbital
Volume (microl)
Pres
sure
(mm
Hg)
A
B
CCOCCCCCOCOC
CCOCCCCCOCOC
-100
102030405060708090
-10
0
10
20
30
40
50
60
0 5 10 15 20 25 30 35 400 5 10 15 20 25 30 35 40
0 5 10 15 20 25 30 35 400 5 10 15 20 25 30 35 40
Figure 9
Chapter 3 Murine left ventricular pressure-volume loops
22
Fig 9 Left ventricular pressure-volume loops Pressure presented in mmHg and volume microl
A Representative figure of PV loops acquired during urethane anesthesia in closed chest
(CC) and open chest (OC) instrumented mice B Representative figure of PV loops acquired
during pentobarbital anesthesia in CC and OC instrumented mice Loops are acquired during
an occlusion of the inferior caval vein Venous returns decreases which is represented in the
loops by attenuation of both pressure and volume The differences in ESP SW and ESPVR
between urethane and pentobarbital anesthesia can be observed by analyzing the loops in A
and B The loops show also the larger stroke volume and depressed systolic pressure in OC
instrumented mice
Figure 9 shows representative PV-loops while venous return was attenuated following
inferior caval vein occlusion Typical pressure and volume effects are depicted showing the
absence of apparent differences in PV relationships The mentioned differences in ESP SV
and EF are evident in the presented loops though
ECG recordings were made during both surgical protocols to detect possible heart rate
alterations and arrhythmias Murine left ventricular PV measurements could be distorted by
physiological responses to the catheterization Heart rate alterations could be anticipated
especially in relation to carotid sinus stimulation while cannulating of the carotid artery
However neither bradycardia nor other arrhythmias were observed during either CC or OC
procedures (figure 10) This finding indicates that cannulation of the right common carotid
artery does not alter heart rate by carotid sinus stimulation
Chapter 3 Murine left ventricular pressure-volume loops
23
Table 3 Functional parameters to determine baseline LV functioning in open- and closed-
chest protocols during steady-state measurement
URETHANE PENTOBARBITALOC CC OC CC
N = 5 N = 5 N = 10 N = 10
Mean plusmn SEM Mean plusmn SEM Mean plusmn SEM Mean plusmn SEM
HR 583 plusmn 20 658 plusmn 21 493 plusmn 25 481 plusmn 36SVdagger 1958 plusmn 351 1557 plusmn 254 2018 plusmn 183 1426 plusmn 103CO 12 plusmn 2 10 plusmn 2 10 plusmn 1 7 plusmn 0Vmaxdagger 1761 plusmn 053 2361 plusmn 223 3089 plusmn 289 3883 plusmn 230Vmindagger 215 plusmn 133 679 plusmn 180 1029 plusmn 189 2373 plusmn 199EFdagger 79 plusmn 6 66 plusmn 8 66 plusmn 4 39 plusmn 2
ESPdagger 52 plusmn 4 65 plusmn 5 42 plusmn 3 47 plusmn 4EDP 1 plusmn 1 -1 plusmn 1 -6 plusmn 2 1 plusmn 1
dPdtmax 7200 plusmn 1349 8252 plusmn 1685 4004 plusmn 629 3718 plusmn 684dPdtmindagger -4233 plusmn 531 -7577 plusmn 750 -3631 plusmn 424 -3348 plusmn 653Tau 10 plusmn 0 7 plusmn 0 12 plusmn 1 14 plusmn 2
SW 1066 plusmn 245 1147 plusmn 213 1076 plusmn 176 666 plusmn 116
EaEesdagger 065 plusmn 020 084 plusmn 016 060 plusmn 005 103 plusmn 015ESPVR 570 plusmn 094 589 plusmn 074 347 plusmn 027 318 plusmn 052EDPVR 009 plusmn 009 -008 plusmn 015 -015 plusmn 014 -005 plusmn 015PRSW 79 plusmn 14 64 plusmn 6 68 plusmn 10 53 plusmn 3
Results from LV pressure-volume measurements in C57Bl6 mice anesthetized by urethane or
pentobarbital Urethane versus pentobarbital P lt 005 dagger OC versus CC P lt 005 ρ Valued
124 Ωcm α 030 Open- (OC) and closed-chest (CC) protocols HR indicates heart rate in
bpm SV left ventricular stroke volume in microl CO cardiac output mlmin Vmin minimal left
ventricular volume in microl Vmax maximal left ventricular volume in microl EF ejection fraction in
ESP left ventricular end-systolic pressure in mmHg EDP left ventricular end-diastolic
pressure in mmHg dPdtmax maximal first derivative of left ventricular pressure in mmHgs
dPdtmin minimal first derivative of left ventricular pressure in mmHgs Tau time constant of
left ventricular relaxation in ms SW stroke work in mmHgmicrol Ea arterial elastance Ees
ventricular end-systolic elastance ESPVR left ventricular end-systolic PV relationship in
Chapter 3 Murine left ventricular pressure-volume loops
24
mmHgmicrol EDPVR left ventricular end-diastolic PV relationship in mmHgmicrol PRSW left
ventricular preload-recruitable stroke work in mmHg
The steady-state functional parameters from OC and CC instrumented mice during
either urethane or pentobarbital are also depicted in Table 2 The use of pentobarbital
anesthesia had a cardiodepressive effect that was represented by significant function decline
in most parameters EF dPdtMAX and ESPVR decreased respectively with 24 57 and 41
upon pentobarbital use compared to urethane anesthesia Pentobarbital therefore had strong
negative chronotropic and inotropic effects
Hear
trat
e(b
pm)
Heart rate trace in closed-chest animal
0
100
200
300
400
500
600
700
Time (minutes)
arterial canulation
A
0 1 2 3 4 5 6 7 8 9 10 11 12 13 14 15 16
Heart rate trace in open-chest animal
0
100
200
300
400
500
600
700
Time (minutes)
Hear
trat
e(b
pm)
Ventricular catheterisation
B
0 1 2 3 4 5 6 7 8 9 10 11 12 13 14
Figure 10
Chapter 3 Murine left ventricular pressure-volume loops
25
Fig 10 Heart rate tracings in closed chest and open chest instrumented mice
A Representative figure of a heart rate tracing in a closed-chest instrumented mouse The
moment of arterial cannulation is indicated Some arrhythmias are seen in response to
introduction of the catheter into the left ventricle Arrhythmias are only present in a short
time-period that is part of the stabilization period following catheter introduction Heart rate
remains unchanged during the measurements B Representative figure of a heart rate tracing
in an open-chest instrumented mouse Somewhat more pronounced chronotropic arrhythmias
are seen in response to ventricular introduction of the catheter by apical stab However no
significant brady- or tachycardias are present during the measurements
Chapter 3 Murine left ventricular pressure-volume loops
26
Discussion
In this chapter OC and CC protocols for in vivo left ventricular PV relationship
measurement are described and discussed Murine cardiac function determination via these
methods is sensitive reproducible and comparable The choice for open- or closed-chest PV
measurements in mice depends on the aim of the study with regards to the specific cardiac
pathology The OC approach is technically less complicated and less time consuming Main
characteristics of the OC model itself are low systolic pressures and arterial resistance The
OC approach could best be used in studies where myocardial integrity is not at stake
Particularly ischemiareperfusion studies regarding myocardial integrity are probably better
done using the CC approach
Assessment of cardiac performance in genetically engineered mice is indispensable to
understand human cardiovascular pathologies In general the synergistic features of cardiac
diseases such as hypertrophy and cell death affect cardiac function negatively The
contractile performance of the heart deteriorates which is reflected in the attenuation of
systolic parameters as ejection fraction stroke work and PV-relationships Furthermore
ventricular relaxation prolongs and diastolic filling becomes impaired The progression of
cardiac disease ultimately results in clinical heart failure which is defined by the inability of
the heart to meet hemodynamic demands of the body and is characterized by specific signs
and symptoms (21) The most important parameter of cardiac performance which defines
heart failure is cardiac output
The influence on cardiac performance of specific genes and proteins in the
development of cardiac diseases ought to be investigated extensively to assess their clinical
relevance Various techniques have been used to assess cardiac performance in mice The
main techniques will be discussed in brief
Chapter 3 Murine left ventricular pressure-volume loops
27
Echocardiography is the most widely used noninvasive technique to determine cardiac
performance in mice High-frequency transthoracic and transesophageal transducers are used
as effective tools for two-dimensional and Doppler imaging of ventricular wall structures
dimensions and volumes of cavum and cardiac function (2223) Full-conscious or gas-
anesthesia experiments are preferred for echocardiographic assessment of cardiac function in
mice (2425) There is no limit to the diversity of murine models investigated by this general
accepted method of cardiac performance assessment However the most questionable aspect
of these measurements is the significant inter- and intraobservator variance in the
measurements
Isolated working mouse heart measurements in a Langendorf perfusion setup are a
technique for ex vivo cardiac function measurements approximating the in vivo function level
(5) Cardiac output developed left ventricular pressure and first derivates of maximal and
minimal pressures are some of the parameters that can be derived Isolated working heart
measurements are especially useful to study the acute effects of ischemic preconditioning and
ischemia-induced apoptosis(2627) Metabolites of interest can be measured accurately in the
perfusion fluid Disadvantages are the impossibility of chronic studies and the
unphysiological situation of ex vivo cardiac function measurements
Aortic flow measurements by means of a flow-probe have been used in several
studies (2829) Aortic flow acquisition is a validated technique and reveals functional
parameters as cardiac output stroke volume and blood flow velocity However several
disadvantages oppose against this technique Firstly aortic flow measurements are invasive
(ie thoracotomy or laparotomy) and result solely in aortic derived volume parameters
Integrated ventricular function cannot be assessed More importantly the exact localization of
the flow probe around the aorta is the critical determinant of the systematic error made by
these measurements Flow probes have been placed around the ascending and descending
Chapter 3 Murine left ventricular pressure-volume loops
28
thoracic aorta and the abdominal aorta The percentage of total cardiac output passing the
flow probe on the specific location has to be estimated Flow probes located at the ascending
aorta correct for coronary circulation and for instance bloodvolume passing the descending
thoracic aorta has been estimated to be around 75 of total cardiac output (30) The estimated
correction factor provides lsquoabsolutersquo stroke volume instead of absolute LV cavum volumes
and does not correct for cardiophysiological changes Altered cardiophysiological situations
could theoretically influence the relative amount of bloodvolume passing the flow probe On
the other hand major advances are the possibility of chronic cardiac function measurements
and the relative facile manner of data acquirement(29) Moreover aortic flow probe
measurements are not hampered by deleterious cardiac remodeling in myocardial ischemia or
hypertrophy studies(2829)
The newly developed method of cardiac performance assessment by in vivo left
ventricular PV measurements in the CC model is introduced here Left ventricular PV
measurements in vivo provide an accurate assessment of murine cardiac function The method
is highly sensitive during open- and closed-chest approaches in determining alterations in left
ventricular function as result of cardiac disease or altered hemodynamic stress The
characteristics of simultaneous left ventricular pressure and volume measurements enable the
researcher to directly investigate pressure-related cardiac diseases as cardiac hypertrophy and
restrictive cardiomyopathy (31) or volume-related diseases as dilated cardiomyopathy (32)
Moreover the effective influence of both aspects of cardiac disease on each other can be
observed in detail For instance ventricular dilation and subsequent decrease in ventricular
systolic pressure is mapped accurately in PV-loops Continuous measurements provide
possibilities to investigate the complete cardiac cycle Basic aspects of cardiac physiology can
be visualized using PV-loops in mice (81533-35) For instance increase in ventricular filling
is followed by an increase in ejection fraction according to the Frank-Starling mechanism
Chapter 3 Murine left ventricular pressure-volume loops
29
The opposite is seen as a result of gradual venous return decrease in the case of transient caval
vein occlusion (figure 7 amp 9) Moreover the distinction between systolic and diastolic failure
can be made through continuous PV-measurements (19) Systolic heart failure encompasses
mainly an ejection dysfunction with impaired contractility Both aspects are obtained by and
directly visualized through PV-loops Additionally the definite diagnosis of diastolic failure
is dependent on the observation of an inappropriate upward shift of the (end-)diastolic PV
relationship requiring cardiac catheterization for continuous volume determinations using
impedance measurements and high-fidelity measurements of ventricular pressure with a
micromanometer (19) PV-loops are useful determining cardiac performance within the
complete continuum of healthy and diseased hearts
Chapter 3 Murine left ventricular pressure-volume loops
30
Conclusion
In vivo PV measurements provide an essential tool in the assessment of cardiac
function in genetically modified mice Open- and closed-chest surgical protocols for murine
cardiac function determination are sensitive reproducible and comparable PV-loops enable
the researcher to accurately investigate diverse murine models of cardiac pathology by
adequately visualizing the cause-and-effect relationship between genetic modification and
their functional outcome Changes in ventricular contractility are best detected by PV derived
parameters in comparison to other methods of cardiac function determination
Chapter 3 Murine left ventricular pressure-volume loops
31
References
1 Doevendans PA Daemen MJ de Muinck ED Smits JF Cardiovascular phenotypingin mice Cardiovasc Res 19983934-49
2 Hoit BD New approaches to phenotypic analysis in adult mice J Mol Cell Cardiol20013327-35
3 Chacko VP Aresta F Chacko SM Weiss RG MRIMRS assessment of in vivomurine cardiac metabolism morphology and function at physiological heart rates AmJ Physiol Heart Circ Physiol 2000279H2218-24
4 Tanaka N Dalton N Mao L et al Transthoracic echocardiography in models ofcardiac disease in the mouse Circulation 1996941109-17
5 De Windt LJ Willems J Reneman RS Van der Vusse GJ Arts T Van Bilsen M Animproved isolated left ventricular ejecting murine heart model Functional andmetabolic evaluation Pflugers Arch 1999437182-90
6 Palmen M Daemen MJ Buehler A et al Impaired cardiac remodeling and functionafter myocardial infarction in FGF-1 transgenic mice Circulation 1999100250
7 Rockman HA Hamilton RA Jones LR Milano CA Mao L Lefkowitz RJ Enhancedmyocardial relaxation in vivo in transgenic mice overexpressing the beta2-adrenergicreceptor is associated with reduced phospholamban protein J Clin Invest1996971618-23
8 Georgakopoulos D Mitzner WA Chen CH et al In vivo murine left ventricularpressure-volume relations by miniaturized conductance micromanometry Am JPhysiol 1998274H1416-22
9 Dekker AL Geskes GG Cramers AA et al Right ventricular support for off-pumpcoronary artery bypass grafting studied with bi-ventricular pressure-volume loops insheep Eur J Cardiothorac Surg 200119179-84
10 Schreuder JJ Steendijk P van der Veen FH et al Acute and short-term effects ofpartial left ventriculectomy in dilated cardiomyopathy assessment by pressure-volumeloops J Am Coll Cardiol 2000362104-14
11 Zimmer HG Measurement of left ventricular hemodynamic parameters in closed-chest rats under control and various pathophysiologic conditions Basic Res Cardiol19837877-84
12 Georgakopoulos D Kass DA Estimation of parallel conductance by dual-frequencyconductance catheter in mice Am J Physiol Heart Circ Physiol 2000279H443-50
13 Feldman MD Mao Y Valvano JW Pearce JA Freeman GL Development of amultifrequency conductance catheter-based system to determine LV function in miceAm J Physiol Heart Circ Physiol 2000279H1411-20
14 Kornet L Schreuder JJ Van de Velden ET Jansen JR The volume-dependency ofparallel conductance throughout the cardiac cycle and its consequence for volumeestimation of the left ventricle in patients Cardiovasc Res 200151729-35
15 Nemoto S DeFreitas G Mann DL Carabello BA Effects of changes in leftventricular contractility on indexes of contractility in mice Am J Physiol Heart CircPhysiol 2002283H2504-10
16 Baan J Van de Velden ET Steendijk P Ventricular pressure-volume relations in vivoEur Heart J 199213 SupplE2-6
17 Little WC Cheng CP Left ventricular-arterial coupling in conscious dogs Am JPhysiol 1991261H70-6
18 Sunagawa K Maughan WL Sagawa K Optimal arterial resistance for the maximalstroke work studied in isolated canine left ventricle Circ Res 198556586-95
Chapter 3 Murine left ventricular pressure-volume loops
32
19 Van Kraaij D Van Pol P Ruiters AW et al Diagnosing diastolic heart failure Eur JHeart Fail 20024419-30
20 Faunt KK Cohn LA Jones BD Dodam JR Cardiopulmonary effects of bilateralhemithorax ventilation and diagnostic thoracoscopy in dogs Am J Vet Res1998591494-8
21 Lips DJ Van Kraaij DL De Windt LJ Doevendans PA Molecular determinants ofmyocardial hypertrophy and failure alternative pathways for beneficial andmaladaptive hypertrophy Eur Heart J 200324883-96
22 Collins KA Korcarz CE Lang RM Use of echocardiography for the phenotypicassessment of genetically altered mice Physiol Genomics 200313227-39
23 Scherrer-Crosbie M Steudel W Hunziker PR et al Determination of right ventricularstructure and function in normoxic and hypoxic mice a transesophagealechocardiographic study Circulation 1998981015-21
24 Takuma S Suehiro K Cardinale C et al Anesthetic inhibition in ischemic andnonischemic murine heart comparison with conscious echocardiographic approachAm J Physiol Heart Circ Physiol 2001280H2364-70
25 Chaves AA Weinstein DM Bauer JA Non-invasive echocardiographic studies inmice influence of anesthetic regimen Life Sci 200169213-22
26 Yamaura G Turoczi T Yamamoto F Siddqui MA Maulik N Das DK STATsignaling in ischemic heart a role of STAT5A in ischemic preconditioning Am JPhysiol Heart Circ Physiol 2003285H476-82
27 Bell RM Yellon DM Atorvastatin administered at the onset of reperfusion andindependent of lipid lowering protects the myocardium by up-regulating a pro-survival pathway J Am Coll Cardiol 200341508-15
28 Aartsen WM Schuijt MP Danser AH Daemen MJ Smits JF The role of locallyexpressed angiotensin converting enzyme in cardiac remodeling after myocardialinfarction in mice Cardiovasc Res 200256205-13
29 Janssen B Debets J Leenders P Smits J Chronic measurement of cardiac output inconscious mice Am J Physiol Regul Integr Comp Physiol 2002282R928-35
30 Georgakopoulos D Christe ME Giewat M Seidman CM Seidman JG Kass DA Thepathogenesis of familial hypertrophic cardiomyopathy early and evolving effects froman alpha-cardiac myosin heavy chain missense mutation Nat Med 19995327-30
31 Liao P Georgakopoulos D Kovacs A et al The in vivo role of p38 MAP kinases incardiac remodeling and restrictive cardiomyopathy Proc Natl Acad Sci U S A20019812283-8
32 McConnell BK Jones KA Fatkin D et al Dilated cardiomyopathy in homozygousmyosin-binding protein-C mutant mice J Clin Invest 19991041235-44
33 Georgakopoulos D Kass DA Minimal force-frequency modulation of inotropy andrelaxation of in situ murine heart J Physiol 2001534535-45
34 Yang B Larson DF Watson R Age-related left ventricular function in the mouseanalysis based on in vivo pressure-volume relationships Am J Physiol1999277H1906-13
35 Reyes M Freeman GL Escobedo D Lee S Steinhelper ME Feldman MDEnhancement of contractility with sustained afterload in the intact murine heartblunting of length-dependent activation Circulation 20031072962-8
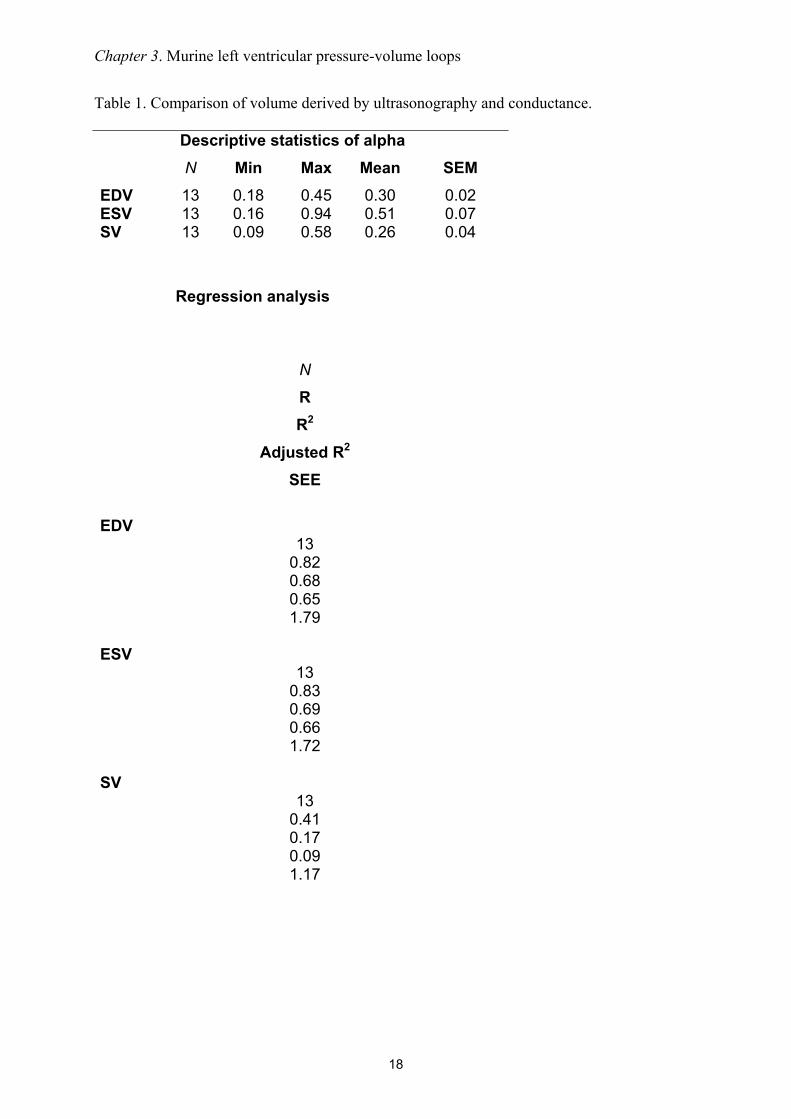
Chapter 3 Murine left ventricular pressure-volume loops
18
Table 1 Comparison of volume derived by ultrasonography and conductance
Descriptive statistics of alphaN Min Max Mean SEM
EDV 13 018 045 030 002ESV 13 016 094 051 007SV 13 009 058 026 004
Regression analysis
N
RR2
Adjusted R2
SEE
EDV13
082068065179
ESV13
083069066172
SV13
041017009117
Chapter 3 Murine left ventricular pressure-volume loops
19
Left ventricular volume was measured by both ultrasonography
and conductance in adult C57Bl6 mice End-diastolic end-
systolic and stroke volume were used to obtain alpha (α)
Descriptive analysis shows that α determination at the end-
diastolic moment results in the most consistent mean α Also
the correlation of LV volume values between ultrasonography
and conductance is high as shown by the regression analysis
SEM indicates standard error of the mean SEE standard error
of the estimate
EDVECHO (microl)120100806040200
EDV C
ON
DUC
TAN
CE (micro
l)
18
16
14
12
10
8
6
SCATTERPLOT OF END-DIASTOLIC VOLUMECONDUCTANCE VS ULTRASONOGRAPHY
EDVECHO (microl)120100806040200
EDV C
ON
DUC
TAN
CE (micro
l)
18
16
14
12
10
8
6
EDVECHO (microl)120100806040200
EDV C
ON
DUC
TAN
CE (micro
l)
18
16
14
12
10
8
6
SCATTERPLOT OF END-DIASTOLIC VOLUMECONDUCTANCE VS ULTRASONOGRAPHY
Chapter 3 Murine left ventricular pressure-volume loops
20
Table 2 Parameters derived by pressure-volume loops
Abbreviations DefinitionsGeneral parameters
CI (CI = CObody wt) CO HR
Card iac indexCard iac outputHeart rate
PressuredPdtmax
dPdtmin
PedPesτ
Maximum derivative of change in systolic pressure in timeMaximum derivative of change in diastolic pressure in timeEnd-diastolic pressureEnd-systolic pressureTime constant of isovolumic relaxation
VolumeEFSI (SI = SVbody wt)SVVedVes
Ejection fractionStroke index Stroke volumeEnd-diastolic pressureEnd-systolic pressure
Pressure-volume relationshipsβEa (Ea = PesSV)EDPVREes
Slope of the end-diastolic pressure-volume relat ionshipArterial elastanceEnd-diastolic pressure-volume relat ionshipEnd-systolic ventricular elastance
EmaxESPVR
(slope of the end-systolic pressure-volume relationship)Maximum chamber elasticity (∆P∆V)End-systolic pressure-volume relat ionship
Pressure-volume areaEfficiencyEWPEPRSWPVASWSWI (SWI = SWbody wt)
EWPVAExternal work = SWPotential energyPreload-recruitable stroke workPressure-volume area = EW + PEStroke workStroke work index
Abbreviations DefinitionsGeneral parameters
CI (CI = CObody wt) CO HR
Card iac indexCard iac outputHeart rate
PressuredPdtmax
dPdtmin
PedPesτ
Maximum derivative of change in systolic pressure in timeMaximum derivative of change in diastolic pressure in timeEnd-diastolic pressureEnd-systolic pressureTime constant of isovolumic relaxation
VolumeEFSI (SI = SVbody wt)SVVedVes
Ejection fractionStroke index Stroke volumeEnd-diastolic pressureEnd-systolic pressure
Pressure-volume relationshipsβEa (Ea = PesSV)EDPVREes
Slope of the end-diastolic pressure-volume relat ionshipArterial elastanceEnd-diastolic pressure-volume relat ionshipEnd-systolic ventricular elastance
EmaxESPVR
(slope of the end-systolic pressure-volume relationship)Maximum chamber elasticity (∆P∆V)End-systolic pressure-volume relat ionship
Pressure-volume areaEfficiencyEWPEPRSWPVASWSWI (SWI = SWbody wt)
EWPVAExternal work = SWPotential energyPreload-recruitable stroke workPressure-volume area = EW + PEStroke workStroke work index
EmaxESPVR
(slope of the end-systolic pressure-volume (slope of the end-systolic pressure-volume relationship)Maximum chamber elasticity (∆P∆V)End-systolic pressure-volume relat ionship
Pressure-volume areaEfficiencyEWPEPRSWPVASWSWI (SWI = SWbody wt)
EWPVAExternal work = SWPotential energyPreload-recruitable stroke workPressure-volume area = EW + PEStroke workStroke work index
Chapter 3 Murine left ventricular pressure-volume loops
21
(Ees) proved to be equal in OC and CC instrumented mice The combination of enlarged
stroke volume with attenuated systolic pressures leads to a decrease in arterial elastance The
altered arterial elastance could be explained by the opening of the thorax A drop in overall
peripheral vascular resistance from baseline values has been described during thoracoscopy
(20)
Urethane
Volume (microl)
Pres
sure
(mm
Hg)
Pentobarbital
Volume (microl)
Pres
sure
(mm
Hg)
A
B
CCOCCCCCOCOC
CCOCCCCCOCOC
-100
102030405060708090
-10
0
10
20
30
40
50
60
0 5 10 15 20 25 30 35 400 5 10 15 20 25 30 35 40
0 5 10 15 20 25 30 35 400 5 10 15 20 25 30 35 40
Figure 9
Chapter 3 Murine left ventricular pressure-volume loops
22
Fig 9 Left ventricular pressure-volume loops Pressure presented in mmHg and volume microl
A Representative figure of PV loops acquired during urethane anesthesia in closed chest
(CC) and open chest (OC) instrumented mice B Representative figure of PV loops acquired
during pentobarbital anesthesia in CC and OC instrumented mice Loops are acquired during
an occlusion of the inferior caval vein Venous returns decreases which is represented in the
loops by attenuation of both pressure and volume The differences in ESP SW and ESPVR
between urethane and pentobarbital anesthesia can be observed by analyzing the loops in A
and B The loops show also the larger stroke volume and depressed systolic pressure in OC
instrumented mice
Figure 9 shows representative PV-loops while venous return was attenuated following
inferior caval vein occlusion Typical pressure and volume effects are depicted showing the
absence of apparent differences in PV relationships The mentioned differences in ESP SV
and EF are evident in the presented loops though
ECG recordings were made during both surgical protocols to detect possible heart rate
alterations and arrhythmias Murine left ventricular PV measurements could be distorted by
physiological responses to the catheterization Heart rate alterations could be anticipated
especially in relation to carotid sinus stimulation while cannulating of the carotid artery
However neither bradycardia nor other arrhythmias were observed during either CC or OC
procedures (figure 10) This finding indicates that cannulation of the right common carotid
artery does not alter heart rate by carotid sinus stimulation
Chapter 3 Murine left ventricular pressure-volume loops
23
Table 3 Functional parameters to determine baseline LV functioning in open- and closed-
chest protocols during steady-state measurement
URETHANE PENTOBARBITALOC CC OC CC
N = 5 N = 5 N = 10 N = 10
Mean plusmn SEM Mean plusmn SEM Mean plusmn SEM Mean plusmn SEM
HR 583 plusmn 20 658 plusmn 21 493 plusmn 25 481 plusmn 36SVdagger 1958 plusmn 351 1557 plusmn 254 2018 plusmn 183 1426 plusmn 103CO 12 plusmn 2 10 plusmn 2 10 plusmn 1 7 plusmn 0Vmaxdagger 1761 plusmn 053 2361 plusmn 223 3089 plusmn 289 3883 plusmn 230Vmindagger 215 plusmn 133 679 plusmn 180 1029 plusmn 189 2373 plusmn 199EFdagger 79 plusmn 6 66 plusmn 8 66 plusmn 4 39 plusmn 2
ESPdagger 52 plusmn 4 65 plusmn 5 42 plusmn 3 47 plusmn 4EDP 1 plusmn 1 -1 plusmn 1 -6 plusmn 2 1 plusmn 1
dPdtmax 7200 plusmn 1349 8252 plusmn 1685 4004 plusmn 629 3718 plusmn 684dPdtmindagger -4233 plusmn 531 -7577 plusmn 750 -3631 plusmn 424 -3348 plusmn 653Tau 10 plusmn 0 7 plusmn 0 12 plusmn 1 14 plusmn 2
SW 1066 plusmn 245 1147 plusmn 213 1076 plusmn 176 666 plusmn 116
EaEesdagger 065 plusmn 020 084 plusmn 016 060 plusmn 005 103 plusmn 015ESPVR 570 plusmn 094 589 plusmn 074 347 plusmn 027 318 plusmn 052EDPVR 009 plusmn 009 -008 plusmn 015 -015 plusmn 014 -005 plusmn 015PRSW 79 plusmn 14 64 plusmn 6 68 plusmn 10 53 plusmn 3
Results from LV pressure-volume measurements in C57Bl6 mice anesthetized by urethane or
pentobarbital Urethane versus pentobarbital P lt 005 dagger OC versus CC P lt 005 ρ Valued
124 Ωcm α 030 Open- (OC) and closed-chest (CC) protocols HR indicates heart rate in
bpm SV left ventricular stroke volume in microl CO cardiac output mlmin Vmin minimal left
ventricular volume in microl Vmax maximal left ventricular volume in microl EF ejection fraction in
ESP left ventricular end-systolic pressure in mmHg EDP left ventricular end-diastolic
pressure in mmHg dPdtmax maximal first derivative of left ventricular pressure in mmHgs
dPdtmin minimal first derivative of left ventricular pressure in mmHgs Tau time constant of
left ventricular relaxation in ms SW stroke work in mmHgmicrol Ea arterial elastance Ees
ventricular end-systolic elastance ESPVR left ventricular end-systolic PV relationship in
Chapter 3 Murine left ventricular pressure-volume loops
24
mmHgmicrol EDPVR left ventricular end-diastolic PV relationship in mmHgmicrol PRSW left
ventricular preload-recruitable stroke work in mmHg
The steady-state functional parameters from OC and CC instrumented mice during
either urethane or pentobarbital are also depicted in Table 2 The use of pentobarbital
anesthesia had a cardiodepressive effect that was represented by significant function decline
in most parameters EF dPdtMAX and ESPVR decreased respectively with 24 57 and 41
upon pentobarbital use compared to urethane anesthesia Pentobarbital therefore had strong
negative chronotropic and inotropic effects
Hear
trat
e(b
pm)
Heart rate trace in closed-chest animal
0
100
200
300
400
500
600
700
Time (minutes)
arterial canulation
A
0 1 2 3 4 5 6 7 8 9 10 11 12 13 14 15 16
Heart rate trace in open-chest animal
0
100
200
300
400
500
600
700
Time (minutes)
Hear
trat
e(b
pm)
Ventricular catheterisation
B
0 1 2 3 4 5 6 7 8 9 10 11 12 13 14
Figure 10
Chapter 3 Murine left ventricular pressure-volume loops
25
Fig 10 Heart rate tracings in closed chest and open chest instrumented mice
A Representative figure of a heart rate tracing in a closed-chest instrumented mouse The
moment of arterial cannulation is indicated Some arrhythmias are seen in response to
introduction of the catheter into the left ventricle Arrhythmias are only present in a short
time-period that is part of the stabilization period following catheter introduction Heart rate
remains unchanged during the measurements B Representative figure of a heart rate tracing
in an open-chest instrumented mouse Somewhat more pronounced chronotropic arrhythmias
are seen in response to ventricular introduction of the catheter by apical stab However no
significant brady- or tachycardias are present during the measurements
Chapter 3 Murine left ventricular pressure-volume loops
26
Discussion
In this chapter OC and CC protocols for in vivo left ventricular PV relationship
measurement are described and discussed Murine cardiac function determination via these
methods is sensitive reproducible and comparable The choice for open- or closed-chest PV
measurements in mice depends on the aim of the study with regards to the specific cardiac
pathology The OC approach is technically less complicated and less time consuming Main
characteristics of the OC model itself are low systolic pressures and arterial resistance The
OC approach could best be used in studies where myocardial integrity is not at stake
Particularly ischemiareperfusion studies regarding myocardial integrity are probably better
done using the CC approach
Assessment of cardiac performance in genetically engineered mice is indispensable to
understand human cardiovascular pathologies In general the synergistic features of cardiac
diseases such as hypertrophy and cell death affect cardiac function negatively The
contractile performance of the heart deteriorates which is reflected in the attenuation of
systolic parameters as ejection fraction stroke work and PV-relationships Furthermore
ventricular relaxation prolongs and diastolic filling becomes impaired The progression of
cardiac disease ultimately results in clinical heart failure which is defined by the inability of
the heart to meet hemodynamic demands of the body and is characterized by specific signs
and symptoms (21) The most important parameter of cardiac performance which defines
heart failure is cardiac output
The influence on cardiac performance of specific genes and proteins in the
development of cardiac diseases ought to be investigated extensively to assess their clinical
relevance Various techniques have been used to assess cardiac performance in mice The
main techniques will be discussed in brief
Chapter 3 Murine left ventricular pressure-volume loops
27
Echocardiography is the most widely used noninvasive technique to determine cardiac
performance in mice High-frequency transthoracic and transesophageal transducers are used
as effective tools for two-dimensional and Doppler imaging of ventricular wall structures
dimensions and volumes of cavum and cardiac function (2223) Full-conscious or gas-
anesthesia experiments are preferred for echocardiographic assessment of cardiac function in
mice (2425) There is no limit to the diversity of murine models investigated by this general
accepted method of cardiac performance assessment However the most questionable aspect
of these measurements is the significant inter- and intraobservator variance in the
measurements
Isolated working mouse heart measurements in a Langendorf perfusion setup are a
technique for ex vivo cardiac function measurements approximating the in vivo function level
(5) Cardiac output developed left ventricular pressure and first derivates of maximal and
minimal pressures are some of the parameters that can be derived Isolated working heart
measurements are especially useful to study the acute effects of ischemic preconditioning and
ischemia-induced apoptosis(2627) Metabolites of interest can be measured accurately in the
perfusion fluid Disadvantages are the impossibility of chronic studies and the
unphysiological situation of ex vivo cardiac function measurements
Aortic flow measurements by means of a flow-probe have been used in several
studies (2829) Aortic flow acquisition is a validated technique and reveals functional
parameters as cardiac output stroke volume and blood flow velocity However several
disadvantages oppose against this technique Firstly aortic flow measurements are invasive
(ie thoracotomy or laparotomy) and result solely in aortic derived volume parameters
Integrated ventricular function cannot be assessed More importantly the exact localization of
the flow probe around the aorta is the critical determinant of the systematic error made by
these measurements Flow probes have been placed around the ascending and descending
Chapter 3 Murine left ventricular pressure-volume loops
28
thoracic aorta and the abdominal aorta The percentage of total cardiac output passing the
flow probe on the specific location has to be estimated Flow probes located at the ascending
aorta correct for coronary circulation and for instance bloodvolume passing the descending
thoracic aorta has been estimated to be around 75 of total cardiac output (30) The estimated
correction factor provides lsquoabsolutersquo stroke volume instead of absolute LV cavum volumes
and does not correct for cardiophysiological changes Altered cardiophysiological situations
could theoretically influence the relative amount of bloodvolume passing the flow probe On
the other hand major advances are the possibility of chronic cardiac function measurements
and the relative facile manner of data acquirement(29) Moreover aortic flow probe
measurements are not hampered by deleterious cardiac remodeling in myocardial ischemia or
hypertrophy studies(2829)
The newly developed method of cardiac performance assessment by in vivo left
ventricular PV measurements in the CC model is introduced here Left ventricular PV
measurements in vivo provide an accurate assessment of murine cardiac function The method
is highly sensitive during open- and closed-chest approaches in determining alterations in left
ventricular function as result of cardiac disease or altered hemodynamic stress The
characteristics of simultaneous left ventricular pressure and volume measurements enable the
researcher to directly investigate pressure-related cardiac diseases as cardiac hypertrophy and
restrictive cardiomyopathy (31) or volume-related diseases as dilated cardiomyopathy (32)
Moreover the effective influence of both aspects of cardiac disease on each other can be
observed in detail For instance ventricular dilation and subsequent decrease in ventricular
systolic pressure is mapped accurately in PV-loops Continuous measurements provide
possibilities to investigate the complete cardiac cycle Basic aspects of cardiac physiology can
be visualized using PV-loops in mice (81533-35) For instance increase in ventricular filling
is followed by an increase in ejection fraction according to the Frank-Starling mechanism
Chapter 3 Murine left ventricular pressure-volume loops
29
The opposite is seen as a result of gradual venous return decrease in the case of transient caval
vein occlusion (figure 7 amp 9) Moreover the distinction between systolic and diastolic failure
can be made through continuous PV-measurements (19) Systolic heart failure encompasses
mainly an ejection dysfunction with impaired contractility Both aspects are obtained by and
directly visualized through PV-loops Additionally the definite diagnosis of diastolic failure
is dependent on the observation of an inappropriate upward shift of the (end-)diastolic PV
relationship requiring cardiac catheterization for continuous volume determinations using
impedance measurements and high-fidelity measurements of ventricular pressure with a
micromanometer (19) PV-loops are useful determining cardiac performance within the
complete continuum of healthy and diseased hearts
Chapter 3 Murine left ventricular pressure-volume loops
30
Conclusion
In vivo PV measurements provide an essential tool in the assessment of cardiac
function in genetically modified mice Open- and closed-chest surgical protocols for murine
cardiac function determination are sensitive reproducible and comparable PV-loops enable
the researcher to accurately investigate diverse murine models of cardiac pathology by
adequately visualizing the cause-and-effect relationship between genetic modification and
their functional outcome Changes in ventricular contractility are best detected by PV derived
parameters in comparison to other methods of cardiac function determination
Chapter 3 Murine left ventricular pressure-volume loops
31
References
1 Doevendans PA Daemen MJ de Muinck ED Smits JF Cardiovascular phenotypingin mice Cardiovasc Res 19983934-49
2 Hoit BD New approaches to phenotypic analysis in adult mice J Mol Cell Cardiol20013327-35
3 Chacko VP Aresta F Chacko SM Weiss RG MRIMRS assessment of in vivomurine cardiac metabolism morphology and function at physiological heart rates AmJ Physiol Heart Circ Physiol 2000279H2218-24
4 Tanaka N Dalton N Mao L et al Transthoracic echocardiography in models ofcardiac disease in the mouse Circulation 1996941109-17
5 De Windt LJ Willems J Reneman RS Van der Vusse GJ Arts T Van Bilsen M Animproved isolated left ventricular ejecting murine heart model Functional andmetabolic evaluation Pflugers Arch 1999437182-90
6 Palmen M Daemen MJ Buehler A et al Impaired cardiac remodeling and functionafter myocardial infarction in FGF-1 transgenic mice Circulation 1999100250
7 Rockman HA Hamilton RA Jones LR Milano CA Mao L Lefkowitz RJ Enhancedmyocardial relaxation in vivo in transgenic mice overexpressing the beta2-adrenergicreceptor is associated with reduced phospholamban protein J Clin Invest1996971618-23
8 Georgakopoulos D Mitzner WA Chen CH et al In vivo murine left ventricularpressure-volume relations by miniaturized conductance micromanometry Am JPhysiol 1998274H1416-22
9 Dekker AL Geskes GG Cramers AA et al Right ventricular support for off-pumpcoronary artery bypass grafting studied with bi-ventricular pressure-volume loops insheep Eur J Cardiothorac Surg 200119179-84
10 Schreuder JJ Steendijk P van der Veen FH et al Acute and short-term effects ofpartial left ventriculectomy in dilated cardiomyopathy assessment by pressure-volumeloops J Am Coll Cardiol 2000362104-14
11 Zimmer HG Measurement of left ventricular hemodynamic parameters in closed-chest rats under control and various pathophysiologic conditions Basic Res Cardiol19837877-84
12 Georgakopoulos D Kass DA Estimation of parallel conductance by dual-frequencyconductance catheter in mice Am J Physiol Heart Circ Physiol 2000279H443-50
13 Feldman MD Mao Y Valvano JW Pearce JA Freeman GL Development of amultifrequency conductance catheter-based system to determine LV function in miceAm J Physiol Heart Circ Physiol 2000279H1411-20
14 Kornet L Schreuder JJ Van de Velden ET Jansen JR The volume-dependency ofparallel conductance throughout the cardiac cycle and its consequence for volumeestimation of the left ventricle in patients Cardiovasc Res 200151729-35
15 Nemoto S DeFreitas G Mann DL Carabello BA Effects of changes in leftventricular contractility on indexes of contractility in mice Am J Physiol Heart CircPhysiol 2002283H2504-10
16 Baan J Van de Velden ET Steendijk P Ventricular pressure-volume relations in vivoEur Heart J 199213 SupplE2-6
17 Little WC Cheng CP Left ventricular-arterial coupling in conscious dogs Am JPhysiol 1991261H70-6
18 Sunagawa K Maughan WL Sagawa K Optimal arterial resistance for the maximalstroke work studied in isolated canine left ventricle Circ Res 198556586-95
Chapter 3 Murine left ventricular pressure-volume loops
32
19 Van Kraaij D Van Pol P Ruiters AW et al Diagnosing diastolic heart failure Eur JHeart Fail 20024419-30
20 Faunt KK Cohn LA Jones BD Dodam JR Cardiopulmonary effects of bilateralhemithorax ventilation and diagnostic thoracoscopy in dogs Am J Vet Res1998591494-8
21 Lips DJ Van Kraaij DL De Windt LJ Doevendans PA Molecular determinants ofmyocardial hypertrophy and failure alternative pathways for beneficial andmaladaptive hypertrophy Eur Heart J 200324883-96
22 Collins KA Korcarz CE Lang RM Use of echocardiography for the phenotypicassessment of genetically altered mice Physiol Genomics 200313227-39
23 Scherrer-Crosbie M Steudel W Hunziker PR et al Determination of right ventricularstructure and function in normoxic and hypoxic mice a transesophagealechocardiographic study Circulation 1998981015-21
24 Takuma S Suehiro K Cardinale C et al Anesthetic inhibition in ischemic andnonischemic murine heart comparison with conscious echocardiographic approachAm J Physiol Heart Circ Physiol 2001280H2364-70
25 Chaves AA Weinstein DM Bauer JA Non-invasive echocardiographic studies inmice influence of anesthetic regimen Life Sci 200169213-22
26 Yamaura G Turoczi T Yamamoto F Siddqui MA Maulik N Das DK STATsignaling in ischemic heart a role of STAT5A in ischemic preconditioning Am JPhysiol Heart Circ Physiol 2003285H476-82
27 Bell RM Yellon DM Atorvastatin administered at the onset of reperfusion andindependent of lipid lowering protects the myocardium by up-regulating a pro-survival pathway J Am Coll Cardiol 200341508-15
28 Aartsen WM Schuijt MP Danser AH Daemen MJ Smits JF The role of locallyexpressed angiotensin converting enzyme in cardiac remodeling after myocardialinfarction in mice Cardiovasc Res 200256205-13
29 Janssen B Debets J Leenders P Smits J Chronic measurement of cardiac output inconscious mice Am J Physiol Regul Integr Comp Physiol 2002282R928-35
30 Georgakopoulos D Christe ME Giewat M Seidman CM Seidman JG Kass DA Thepathogenesis of familial hypertrophic cardiomyopathy early and evolving effects froman alpha-cardiac myosin heavy chain missense mutation Nat Med 19995327-30
31 Liao P Georgakopoulos D Kovacs A et al The in vivo role of p38 MAP kinases incardiac remodeling and restrictive cardiomyopathy Proc Natl Acad Sci U S A20019812283-8
32 McConnell BK Jones KA Fatkin D et al Dilated cardiomyopathy in homozygousmyosin-binding protein-C mutant mice J Clin Invest 19991041235-44
33 Georgakopoulos D Kass DA Minimal force-frequency modulation of inotropy andrelaxation of in situ murine heart J Physiol 2001534535-45
34 Yang B Larson DF Watson R Age-related left ventricular function in the mouseanalysis based on in vivo pressure-volume relationships Am J Physiol1999277H1906-13
35 Reyes M Freeman GL Escobedo D Lee S Steinhelper ME Feldman MDEnhancement of contractility with sustained afterload in the intact murine heartblunting of length-dependent activation Circulation 20031072962-8
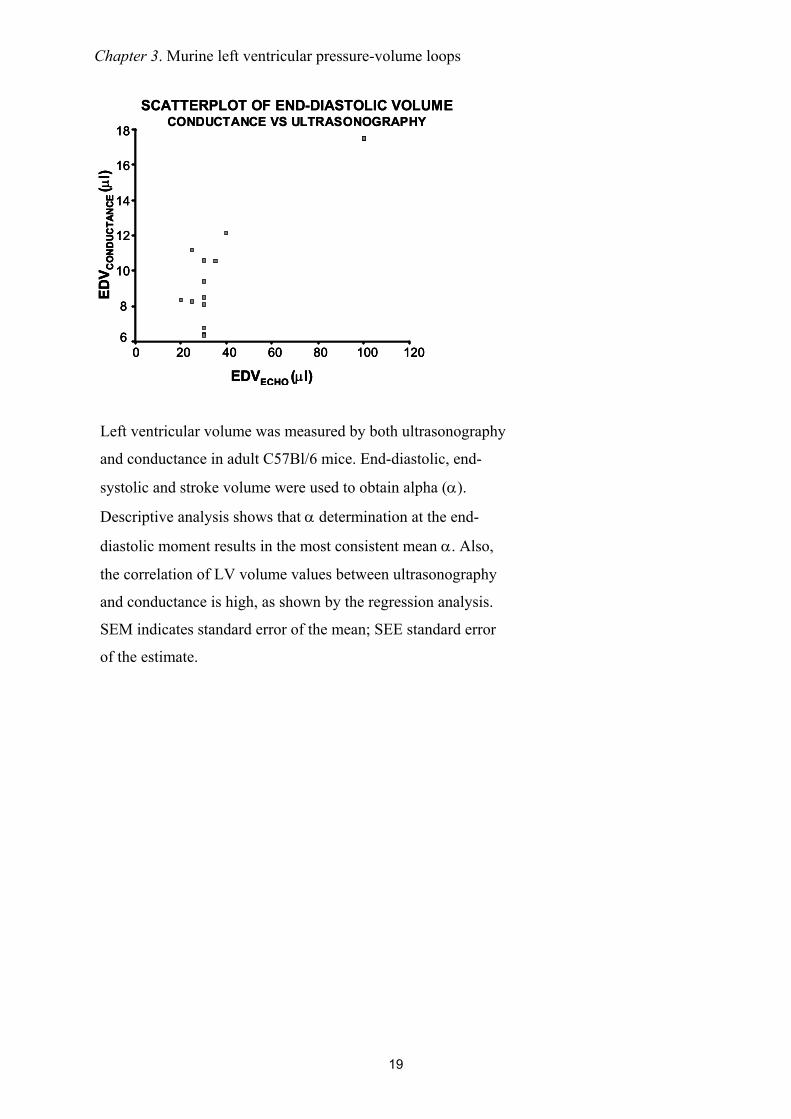
Chapter 3 Murine left ventricular pressure-volume loops
20
Table 2 Parameters derived by pressure-volume loops
Abbreviations DefinitionsGeneral parameters
CI (CI = CObody wt) CO HR
Card iac indexCard iac outputHeart rate
PressuredPdtmax
dPdtmin
PedPesτ
Maximum derivative of change in systolic pressure in timeMaximum derivative of change in diastolic pressure in timeEnd-diastolic pressureEnd-systolic pressureTime constant of isovolumic relaxation
VolumeEFSI (SI = SVbody wt)SVVedVes
Ejection fractionStroke index Stroke volumeEnd-diastolic pressureEnd-systolic pressure
Pressure-volume relationshipsβEa (Ea = PesSV)EDPVREes
Slope of the end-diastolic pressure-volume relat ionshipArterial elastanceEnd-diastolic pressure-volume relat ionshipEnd-systolic ventricular elastance
EmaxESPVR
(slope of the end-systolic pressure-volume relationship)Maximum chamber elasticity (∆P∆V)End-systolic pressure-volume relat ionship
Pressure-volume areaEfficiencyEWPEPRSWPVASWSWI (SWI = SWbody wt)
EWPVAExternal work = SWPotential energyPreload-recruitable stroke workPressure-volume area = EW + PEStroke workStroke work index
Abbreviations DefinitionsGeneral parameters
CI (CI = CObody wt) CO HR
Card iac indexCard iac outputHeart rate
PressuredPdtmax
dPdtmin
PedPesτ
Maximum derivative of change in systolic pressure in timeMaximum derivative of change in diastolic pressure in timeEnd-diastolic pressureEnd-systolic pressureTime constant of isovolumic relaxation
VolumeEFSI (SI = SVbody wt)SVVedVes
Ejection fractionStroke index Stroke volumeEnd-diastolic pressureEnd-systolic pressure
Pressure-volume relationshipsβEa (Ea = PesSV)EDPVREes
Slope of the end-diastolic pressure-volume relat ionshipArterial elastanceEnd-diastolic pressure-volume relat ionshipEnd-systolic ventricular elastance
EmaxESPVR
(slope of the end-systolic pressure-volume relationship)Maximum chamber elasticity (∆P∆V)End-systolic pressure-volume relat ionship
Pressure-volume areaEfficiencyEWPEPRSWPVASWSWI (SWI = SWbody wt)
EWPVAExternal work = SWPotential energyPreload-recruitable stroke workPressure-volume area = EW + PEStroke workStroke work index
EmaxESPVR
(slope of the end-systolic pressure-volume (slope of the end-systolic pressure-volume relationship)Maximum chamber elasticity (∆P∆V)End-systolic pressure-volume relat ionship
Pressure-volume areaEfficiencyEWPEPRSWPVASWSWI (SWI = SWbody wt)
EWPVAExternal work = SWPotential energyPreload-recruitable stroke workPressure-volume area = EW + PEStroke workStroke work index
Chapter 3 Murine left ventricular pressure-volume loops
21
(Ees) proved to be equal in OC and CC instrumented mice The combination of enlarged
stroke volume with attenuated systolic pressures leads to a decrease in arterial elastance The
altered arterial elastance could be explained by the opening of the thorax A drop in overall
peripheral vascular resistance from baseline values has been described during thoracoscopy
(20)
Urethane
Volume (microl)
Pres
sure
(mm
Hg)
Pentobarbital
Volume (microl)
Pres
sure
(mm
Hg)
A
B
CCOCCCCCOCOC
CCOCCCCCOCOC
-100
102030405060708090
-10
0
10
20
30
40
50
60
0 5 10 15 20 25 30 35 400 5 10 15 20 25 30 35 40
0 5 10 15 20 25 30 35 400 5 10 15 20 25 30 35 40
Figure 9
Chapter 3 Murine left ventricular pressure-volume loops
22
Fig 9 Left ventricular pressure-volume loops Pressure presented in mmHg and volume microl
A Representative figure of PV loops acquired during urethane anesthesia in closed chest
(CC) and open chest (OC) instrumented mice B Representative figure of PV loops acquired
during pentobarbital anesthesia in CC and OC instrumented mice Loops are acquired during
an occlusion of the inferior caval vein Venous returns decreases which is represented in the
loops by attenuation of both pressure and volume The differences in ESP SW and ESPVR
between urethane and pentobarbital anesthesia can be observed by analyzing the loops in A
and B The loops show also the larger stroke volume and depressed systolic pressure in OC
instrumented mice
Figure 9 shows representative PV-loops while venous return was attenuated following
inferior caval vein occlusion Typical pressure and volume effects are depicted showing the
absence of apparent differences in PV relationships The mentioned differences in ESP SV
and EF are evident in the presented loops though
ECG recordings were made during both surgical protocols to detect possible heart rate
alterations and arrhythmias Murine left ventricular PV measurements could be distorted by
physiological responses to the catheterization Heart rate alterations could be anticipated
especially in relation to carotid sinus stimulation while cannulating of the carotid artery
However neither bradycardia nor other arrhythmias were observed during either CC or OC
procedures (figure 10) This finding indicates that cannulation of the right common carotid
artery does not alter heart rate by carotid sinus stimulation
Chapter 3 Murine left ventricular pressure-volume loops
23
Table 3 Functional parameters to determine baseline LV functioning in open- and closed-
chest protocols during steady-state measurement
URETHANE PENTOBARBITALOC CC OC CC
N = 5 N = 5 N = 10 N = 10
Mean plusmn SEM Mean plusmn SEM Mean plusmn SEM Mean plusmn SEM
HR 583 plusmn 20 658 plusmn 21 493 plusmn 25 481 plusmn 36SVdagger 1958 plusmn 351 1557 plusmn 254 2018 plusmn 183 1426 plusmn 103CO 12 plusmn 2 10 plusmn 2 10 plusmn 1 7 plusmn 0Vmaxdagger 1761 plusmn 053 2361 plusmn 223 3089 plusmn 289 3883 plusmn 230Vmindagger 215 plusmn 133 679 plusmn 180 1029 plusmn 189 2373 plusmn 199EFdagger 79 plusmn 6 66 plusmn 8 66 plusmn 4 39 plusmn 2
ESPdagger 52 plusmn 4 65 plusmn 5 42 plusmn 3 47 plusmn 4EDP 1 plusmn 1 -1 plusmn 1 -6 plusmn 2 1 plusmn 1
dPdtmax 7200 plusmn 1349 8252 plusmn 1685 4004 plusmn 629 3718 plusmn 684dPdtmindagger -4233 plusmn 531 -7577 plusmn 750 -3631 plusmn 424 -3348 plusmn 653Tau 10 plusmn 0 7 plusmn 0 12 plusmn 1 14 plusmn 2
SW 1066 plusmn 245 1147 plusmn 213 1076 plusmn 176 666 plusmn 116
EaEesdagger 065 plusmn 020 084 plusmn 016 060 plusmn 005 103 plusmn 015ESPVR 570 plusmn 094 589 plusmn 074 347 plusmn 027 318 plusmn 052EDPVR 009 plusmn 009 -008 plusmn 015 -015 plusmn 014 -005 plusmn 015PRSW 79 plusmn 14 64 plusmn 6 68 plusmn 10 53 plusmn 3
Results from LV pressure-volume measurements in C57Bl6 mice anesthetized by urethane or
pentobarbital Urethane versus pentobarbital P lt 005 dagger OC versus CC P lt 005 ρ Valued
124 Ωcm α 030 Open- (OC) and closed-chest (CC) protocols HR indicates heart rate in
bpm SV left ventricular stroke volume in microl CO cardiac output mlmin Vmin minimal left
ventricular volume in microl Vmax maximal left ventricular volume in microl EF ejection fraction in
ESP left ventricular end-systolic pressure in mmHg EDP left ventricular end-diastolic
pressure in mmHg dPdtmax maximal first derivative of left ventricular pressure in mmHgs
dPdtmin minimal first derivative of left ventricular pressure in mmHgs Tau time constant of
left ventricular relaxation in ms SW stroke work in mmHgmicrol Ea arterial elastance Ees
ventricular end-systolic elastance ESPVR left ventricular end-systolic PV relationship in
Chapter 3 Murine left ventricular pressure-volume loops
24
mmHgmicrol EDPVR left ventricular end-diastolic PV relationship in mmHgmicrol PRSW left
ventricular preload-recruitable stroke work in mmHg
The steady-state functional parameters from OC and CC instrumented mice during
either urethane or pentobarbital are also depicted in Table 2 The use of pentobarbital
anesthesia had a cardiodepressive effect that was represented by significant function decline
in most parameters EF dPdtMAX and ESPVR decreased respectively with 24 57 and 41
upon pentobarbital use compared to urethane anesthesia Pentobarbital therefore had strong
negative chronotropic and inotropic effects
Hear
trat
e(b
pm)
Heart rate trace in closed-chest animal
0
100
200
300
400
500
600
700
Time (minutes)
arterial canulation
A
0 1 2 3 4 5 6 7 8 9 10 11 12 13 14 15 16
Heart rate trace in open-chest animal
0
100
200
300
400
500
600
700
Time (minutes)
Hear
trat
e(b
pm)
Ventricular catheterisation
B
0 1 2 3 4 5 6 7 8 9 10 11 12 13 14
Figure 10
Chapter 3 Murine left ventricular pressure-volume loops
25
Fig 10 Heart rate tracings in closed chest and open chest instrumented mice
A Representative figure of a heart rate tracing in a closed-chest instrumented mouse The
moment of arterial cannulation is indicated Some arrhythmias are seen in response to
introduction of the catheter into the left ventricle Arrhythmias are only present in a short
time-period that is part of the stabilization period following catheter introduction Heart rate
remains unchanged during the measurements B Representative figure of a heart rate tracing
in an open-chest instrumented mouse Somewhat more pronounced chronotropic arrhythmias
are seen in response to ventricular introduction of the catheter by apical stab However no
significant brady- or tachycardias are present during the measurements
Chapter 3 Murine left ventricular pressure-volume loops
26
Discussion
In this chapter OC and CC protocols for in vivo left ventricular PV relationship
measurement are described and discussed Murine cardiac function determination via these
methods is sensitive reproducible and comparable The choice for open- or closed-chest PV
measurements in mice depends on the aim of the study with regards to the specific cardiac
pathology The OC approach is technically less complicated and less time consuming Main
characteristics of the OC model itself are low systolic pressures and arterial resistance The
OC approach could best be used in studies where myocardial integrity is not at stake
Particularly ischemiareperfusion studies regarding myocardial integrity are probably better
done using the CC approach
Assessment of cardiac performance in genetically engineered mice is indispensable to
understand human cardiovascular pathologies In general the synergistic features of cardiac
diseases such as hypertrophy and cell death affect cardiac function negatively The
contractile performance of the heart deteriorates which is reflected in the attenuation of
systolic parameters as ejection fraction stroke work and PV-relationships Furthermore
ventricular relaxation prolongs and diastolic filling becomes impaired The progression of
cardiac disease ultimately results in clinical heart failure which is defined by the inability of
the heart to meet hemodynamic demands of the body and is characterized by specific signs
and symptoms (21) The most important parameter of cardiac performance which defines
heart failure is cardiac output
The influence on cardiac performance of specific genes and proteins in the
development of cardiac diseases ought to be investigated extensively to assess their clinical
relevance Various techniques have been used to assess cardiac performance in mice The
main techniques will be discussed in brief
Chapter 3 Murine left ventricular pressure-volume loops
27
Echocardiography is the most widely used noninvasive technique to determine cardiac
performance in mice High-frequency transthoracic and transesophageal transducers are used
as effective tools for two-dimensional and Doppler imaging of ventricular wall structures
dimensions and volumes of cavum and cardiac function (2223) Full-conscious or gas-
anesthesia experiments are preferred for echocardiographic assessment of cardiac function in
mice (2425) There is no limit to the diversity of murine models investigated by this general
accepted method of cardiac performance assessment However the most questionable aspect
of these measurements is the significant inter- and intraobservator variance in the
measurements
Isolated working mouse heart measurements in a Langendorf perfusion setup are a
technique for ex vivo cardiac function measurements approximating the in vivo function level
(5) Cardiac output developed left ventricular pressure and first derivates of maximal and
minimal pressures are some of the parameters that can be derived Isolated working heart
measurements are especially useful to study the acute effects of ischemic preconditioning and
ischemia-induced apoptosis(2627) Metabolites of interest can be measured accurately in the
perfusion fluid Disadvantages are the impossibility of chronic studies and the
unphysiological situation of ex vivo cardiac function measurements
Aortic flow measurements by means of a flow-probe have been used in several
studies (2829) Aortic flow acquisition is a validated technique and reveals functional
parameters as cardiac output stroke volume and blood flow velocity However several
disadvantages oppose against this technique Firstly aortic flow measurements are invasive
(ie thoracotomy or laparotomy) and result solely in aortic derived volume parameters
Integrated ventricular function cannot be assessed More importantly the exact localization of
the flow probe around the aorta is the critical determinant of the systematic error made by
these measurements Flow probes have been placed around the ascending and descending
Chapter 3 Murine left ventricular pressure-volume loops
28
thoracic aorta and the abdominal aorta The percentage of total cardiac output passing the
flow probe on the specific location has to be estimated Flow probes located at the ascending
aorta correct for coronary circulation and for instance bloodvolume passing the descending
thoracic aorta has been estimated to be around 75 of total cardiac output (30) The estimated
correction factor provides lsquoabsolutersquo stroke volume instead of absolute LV cavum volumes
and does not correct for cardiophysiological changes Altered cardiophysiological situations
could theoretically influence the relative amount of bloodvolume passing the flow probe On
the other hand major advances are the possibility of chronic cardiac function measurements
and the relative facile manner of data acquirement(29) Moreover aortic flow probe
measurements are not hampered by deleterious cardiac remodeling in myocardial ischemia or
hypertrophy studies(2829)
The newly developed method of cardiac performance assessment by in vivo left
ventricular PV measurements in the CC model is introduced here Left ventricular PV
measurements in vivo provide an accurate assessment of murine cardiac function The method
is highly sensitive during open- and closed-chest approaches in determining alterations in left
ventricular function as result of cardiac disease or altered hemodynamic stress The
characteristics of simultaneous left ventricular pressure and volume measurements enable the
researcher to directly investigate pressure-related cardiac diseases as cardiac hypertrophy and
restrictive cardiomyopathy (31) or volume-related diseases as dilated cardiomyopathy (32)
Moreover the effective influence of both aspects of cardiac disease on each other can be
observed in detail For instance ventricular dilation and subsequent decrease in ventricular
systolic pressure is mapped accurately in PV-loops Continuous measurements provide
possibilities to investigate the complete cardiac cycle Basic aspects of cardiac physiology can
be visualized using PV-loops in mice (81533-35) For instance increase in ventricular filling
is followed by an increase in ejection fraction according to the Frank-Starling mechanism
Chapter 3 Murine left ventricular pressure-volume loops
29
The opposite is seen as a result of gradual venous return decrease in the case of transient caval
vein occlusion (figure 7 amp 9) Moreover the distinction between systolic and diastolic failure
can be made through continuous PV-measurements (19) Systolic heart failure encompasses
mainly an ejection dysfunction with impaired contractility Both aspects are obtained by and
directly visualized through PV-loops Additionally the definite diagnosis of diastolic failure
is dependent on the observation of an inappropriate upward shift of the (end-)diastolic PV
relationship requiring cardiac catheterization for continuous volume determinations using
impedance measurements and high-fidelity measurements of ventricular pressure with a
micromanometer (19) PV-loops are useful determining cardiac performance within the
complete continuum of healthy and diseased hearts
Chapter 3 Murine left ventricular pressure-volume loops
30
Conclusion
In vivo PV measurements provide an essential tool in the assessment of cardiac
function in genetically modified mice Open- and closed-chest surgical protocols for murine
cardiac function determination are sensitive reproducible and comparable PV-loops enable
the researcher to accurately investigate diverse murine models of cardiac pathology by
adequately visualizing the cause-and-effect relationship between genetic modification and
their functional outcome Changes in ventricular contractility are best detected by PV derived
parameters in comparison to other methods of cardiac function determination
Chapter 3 Murine left ventricular pressure-volume loops
31
References
1 Doevendans PA Daemen MJ de Muinck ED Smits JF Cardiovascular phenotypingin mice Cardiovasc Res 19983934-49
2 Hoit BD New approaches to phenotypic analysis in adult mice J Mol Cell Cardiol20013327-35
3 Chacko VP Aresta F Chacko SM Weiss RG MRIMRS assessment of in vivomurine cardiac metabolism morphology and function at physiological heart rates AmJ Physiol Heart Circ Physiol 2000279H2218-24
4 Tanaka N Dalton N Mao L et al Transthoracic echocardiography in models ofcardiac disease in the mouse Circulation 1996941109-17
5 De Windt LJ Willems J Reneman RS Van der Vusse GJ Arts T Van Bilsen M Animproved isolated left ventricular ejecting murine heart model Functional andmetabolic evaluation Pflugers Arch 1999437182-90
6 Palmen M Daemen MJ Buehler A et al Impaired cardiac remodeling and functionafter myocardial infarction in FGF-1 transgenic mice Circulation 1999100250
7 Rockman HA Hamilton RA Jones LR Milano CA Mao L Lefkowitz RJ Enhancedmyocardial relaxation in vivo in transgenic mice overexpressing the beta2-adrenergicreceptor is associated with reduced phospholamban protein J Clin Invest1996971618-23
8 Georgakopoulos D Mitzner WA Chen CH et al In vivo murine left ventricularpressure-volume relations by miniaturized conductance micromanometry Am JPhysiol 1998274H1416-22
9 Dekker AL Geskes GG Cramers AA et al Right ventricular support for off-pumpcoronary artery bypass grafting studied with bi-ventricular pressure-volume loops insheep Eur J Cardiothorac Surg 200119179-84
10 Schreuder JJ Steendijk P van der Veen FH et al Acute and short-term effects ofpartial left ventriculectomy in dilated cardiomyopathy assessment by pressure-volumeloops J Am Coll Cardiol 2000362104-14
11 Zimmer HG Measurement of left ventricular hemodynamic parameters in closed-chest rats under control and various pathophysiologic conditions Basic Res Cardiol19837877-84
12 Georgakopoulos D Kass DA Estimation of parallel conductance by dual-frequencyconductance catheter in mice Am J Physiol Heart Circ Physiol 2000279H443-50
13 Feldman MD Mao Y Valvano JW Pearce JA Freeman GL Development of amultifrequency conductance catheter-based system to determine LV function in miceAm J Physiol Heart Circ Physiol 2000279H1411-20
14 Kornet L Schreuder JJ Van de Velden ET Jansen JR The volume-dependency ofparallel conductance throughout the cardiac cycle and its consequence for volumeestimation of the left ventricle in patients Cardiovasc Res 200151729-35
15 Nemoto S DeFreitas G Mann DL Carabello BA Effects of changes in leftventricular contractility on indexes of contractility in mice Am J Physiol Heart CircPhysiol 2002283H2504-10
16 Baan J Van de Velden ET Steendijk P Ventricular pressure-volume relations in vivoEur Heart J 199213 SupplE2-6
17 Little WC Cheng CP Left ventricular-arterial coupling in conscious dogs Am JPhysiol 1991261H70-6
18 Sunagawa K Maughan WL Sagawa K Optimal arterial resistance for the maximalstroke work studied in isolated canine left ventricle Circ Res 198556586-95
Chapter 3 Murine left ventricular pressure-volume loops
32
19 Van Kraaij D Van Pol P Ruiters AW et al Diagnosing diastolic heart failure Eur JHeart Fail 20024419-30
20 Faunt KK Cohn LA Jones BD Dodam JR Cardiopulmonary effects of bilateralhemithorax ventilation and diagnostic thoracoscopy in dogs Am J Vet Res1998591494-8
21 Lips DJ Van Kraaij DL De Windt LJ Doevendans PA Molecular determinants ofmyocardial hypertrophy and failure alternative pathways for beneficial andmaladaptive hypertrophy Eur Heart J 200324883-96
22 Collins KA Korcarz CE Lang RM Use of echocardiography for the phenotypicassessment of genetically altered mice Physiol Genomics 200313227-39
23 Scherrer-Crosbie M Steudel W Hunziker PR et al Determination of right ventricularstructure and function in normoxic and hypoxic mice a transesophagealechocardiographic study Circulation 1998981015-21
24 Takuma S Suehiro K Cardinale C et al Anesthetic inhibition in ischemic andnonischemic murine heart comparison with conscious echocardiographic approachAm J Physiol Heart Circ Physiol 2001280H2364-70
25 Chaves AA Weinstein DM Bauer JA Non-invasive echocardiographic studies inmice influence of anesthetic regimen Life Sci 200169213-22
26 Yamaura G Turoczi T Yamamoto F Siddqui MA Maulik N Das DK STATsignaling in ischemic heart a role of STAT5A in ischemic preconditioning Am JPhysiol Heart Circ Physiol 2003285H476-82
27 Bell RM Yellon DM Atorvastatin administered at the onset of reperfusion andindependent of lipid lowering protects the myocardium by up-regulating a pro-survival pathway J Am Coll Cardiol 200341508-15
28 Aartsen WM Schuijt MP Danser AH Daemen MJ Smits JF The role of locallyexpressed angiotensin converting enzyme in cardiac remodeling after myocardialinfarction in mice Cardiovasc Res 200256205-13
29 Janssen B Debets J Leenders P Smits J Chronic measurement of cardiac output inconscious mice Am J Physiol Regul Integr Comp Physiol 2002282R928-35
30 Georgakopoulos D Christe ME Giewat M Seidman CM Seidman JG Kass DA Thepathogenesis of familial hypertrophic cardiomyopathy early and evolving effects froman alpha-cardiac myosin heavy chain missense mutation Nat Med 19995327-30
31 Liao P Georgakopoulos D Kovacs A et al The in vivo role of p38 MAP kinases incardiac remodeling and restrictive cardiomyopathy Proc Natl Acad Sci U S A20019812283-8
32 McConnell BK Jones KA Fatkin D et al Dilated cardiomyopathy in homozygousmyosin-binding protein-C mutant mice J Clin Invest 19991041235-44
33 Georgakopoulos D Kass DA Minimal force-frequency modulation of inotropy andrelaxation of in situ murine heart J Physiol 2001534535-45
34 Yang B Larson DF Watson R Age-related left ventricular function in the mouseanalysis based on in vivo pressure-volume relationships Am J Physiol1999277H1906-13
35 Reyes M Freeman GL Escobedo D Lee S Steinhelper ME Feldman MDEnhancement of contractility with sustained afterload in the intact murine heartblunting of length-dependent activation Circulation 20031072962-8
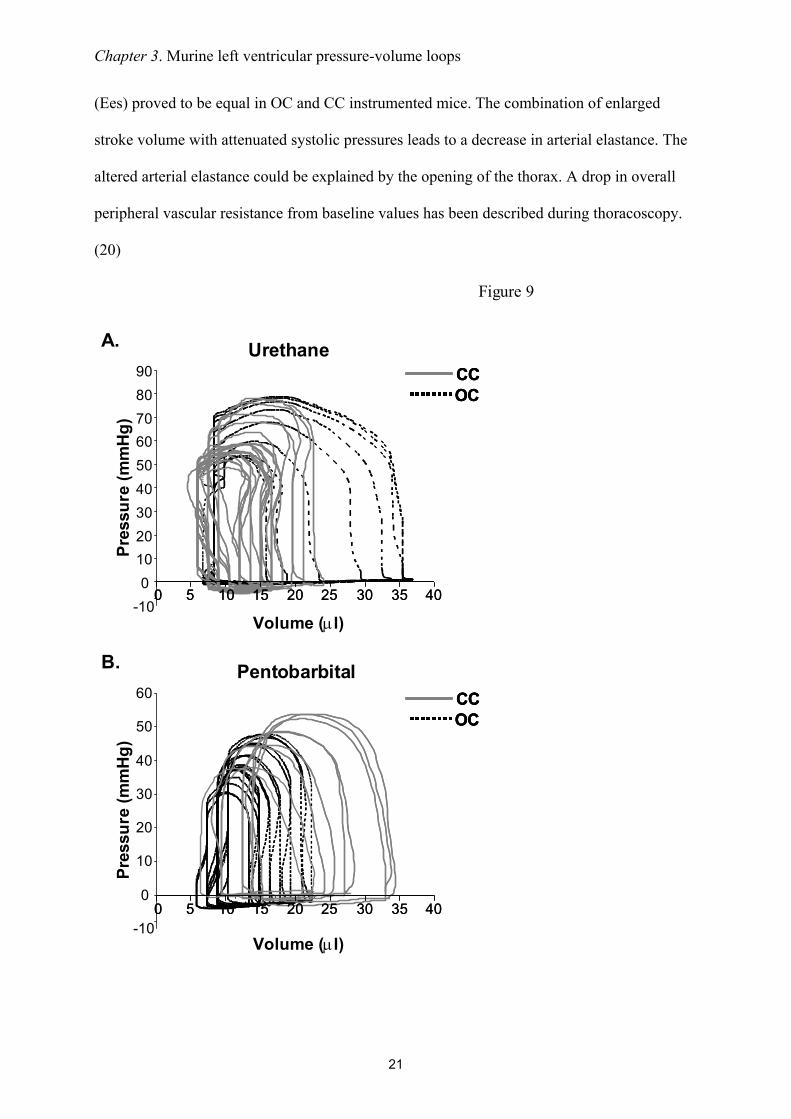
Chapter 3 Murine left ventricular pressure-volume loops
21
(Ees) proved to be equal in OC and CC instrumented mice The combination of enlarged
stroke volume with attenuated systolic pressures leads to a decrease in arterial elastance The
altered arterial elastance could be explained by the opening of the thorax A drop in overall
peripheral vascular resistance from baseline values has been described during thoracoscopy
(20)
Urethane
Volume (microl)
Pres
sure
(mm
Hg)
Pentobarbital
Volume (microl)
Pres
sure
(mm
Hg)
A
B
CCOCCCCCOCOC
CCOCCCCCOCOC
-100
102030405060708090
-10
0
10
20
30
40
50
60
0 5 10 15 20 25 30 35 400 5 10 15 20 25 30 35 40
0 5 10 15 20 25 30 35 400 5 10 15 20 25 30 35 40
Figure 9
Chapter 3 Murine left ventricular pressure-volume loops
22
Fig 9 Left ventricular pressure-volume loops Pressure presented in mmHg and volume microl
A Representative figure of PV loops acquired during urethane anesthesia in closed chest
(CC) and open chest (OC) instrumented mice B Representative figure of PV loops acquired
during pentobarbital anesthesia in CC and OC instrumented mice Loops are acquired during
an occlusion of the inferior caval vein Venous returns decreases which is represented in the
loops by attenuation of both pressure and volume The differences in ESP SW and ESPVR
between urethane and pentobarbital anesthesia can be observed by analyzing the loops in A
and B The loops show also the larger stroke volume and depressed systolic pressure in OC
instrumented mice
Figure 9 shows representative PV-loops while venous return was attenuated following
inferior caval vein occlusion Typical pressure and volume effects are depicted showing the
absence of apparent differences in PV relationships The mentioned differences in ESP SV
and EF are evident in the presented loops though
ECG recordings were made during both surgical protocols to detect possible heart rate
alterations and arrhythmias Murine left ventricular PV measurements could be distorted by
physiological responses to the catheterization Heart rate alterations could be anticipated
especially in relation to carotid sinus stimulation while cannulating of the carotid artery
However neither bradycardia nor other arrhythmias were observed during either CC or OC
procedures (figure 10) This finding indicates that cannulation of the right common carotid
artery does not alter heart rate by carotid sinus stimulation
Chapter 3 Murine left ventricular pressure-volume loops
23
Table 3 Functional parameters to determine baseline LV functioning in open- and closed-
chest protocols during steady-state measurement
URETHANE PENTOBARBITALOC CC OC CC
N = 5 N = 5 N = 10 N = 10
Mean plusmn SEM Mean plusmn SEM Mean plusmn SEM Mean plusmn SEM
HR 583 plusmn 20 658 plusmn 21 493 plusmn 25 481 plusmn 36SVdagger 1958 plusmn 351 1557 plusmn 254 2018 plusmn 183 1426 plusmn 103CO 12 plusmn 2 10 plusmn 2 10 plusmn 1 7 plusmn 0Vmaxdagger 1761 plusmn 053 2361 plusmn 223 3089 plusmn 289 3883 plusmn 230Vmindagger 215 plusmn 133 679 plusmn 180 1029 plusmn 189 2373 plusmn 199EFdagger 79 plusmn 6 66 plusmn 8 66 plusmn 4 39 plusmn 2
ESPdagger 52 plusmn 4 65 plusmn 5 42 plusmn 3 47 plusmn 4EDP 1 plusmn 1 -1 plusmn 1 -6 plusmn 2 1 plusmn 1
dPdtmax 7200 plusmn 1349 8252 plusmn 1685 4004 plusmn 629 3718 plusmn 684dPdtmindagger -4233 plusmn 531 -7577 plusmn 750 -3631 plusmn 424 -3348 plusmn 653Tau 10 plusmn 0 7 plusmn 0 12 plusmn 1 14 plusmn 2
SW 1066 plusmn 245 1147 plusmn 213 1076 plusmn 176 666 plusmn 116
EaEesdagger 065 plusmn 020 084 plusmn 016 060 plusmn 005 103 plusmn 015ESPVR 570 plusmn 094 589 plusmn 074 347 plusmn 027 318 plusmn 052EDPVR 009 plusmn 009 -008 plusmn 015 -015 plusmn 014 -005 plusmn 015PRSW 79 plusmn 14 64 plusmn 6 68 plusmn 10 53 plusmn 3
Results from LV pressure-volume measurements in C57Bl6 mice anesthetized by urethane or
pentobarbital Urethane versus pentobarbital P lt 005 dagger OC versus CC P lt 005 ρ Valued
124 Ωcm α 030 Open- (OC) and closed-chest (CC) protocols HR indicates heart rate in
bpm SV left ventricular stroke volume in microl CO cardiac output mlmin Vmin minimal left
ventricular volume in microl Vmax maximal left ventricular volume in microl EF ejection fraction in
ESP left ventricular end-systolic pressure in mmHg EDP left ventricular end-diastolic
pressure in mmHg dPdtmax maximal first derivative of left ventricular pressure in mmHgs
dPdtmin minimal first derivative of left ventricular pressure in mmHgs Tau time constant of
left ventricular relaxation in ms SW stroke work in mmHgmicrol Ea arterial elastance Ees
ventricular end-systolic elastance ESPVR left ventricular end-systolic PV relationship in
Chapter 3 Murine left ventricular pressure-volume loops
24
mmHgmicrol EDPVR left ventricular end-diastolic PV relationship in mmHgmicrol PRSW left
ventricular preload-recruitable stroke work in mmHg
The steady-state functional parameters from OC and CC instrumented mice during
either urethane or pentobarbital are also depicted in Table 2 The use of pentobarbital
anesthesia had a cardiodepressive effect that was represented by significant function decline
in most parameters EF dPdtMAX and ESPVR decreased respectively with 24 57 and 41
upon pentobarbital use compared to urethane anesthesia Pentobarbital therefore had strong
negative chronotropic and inotropic effects
Hear
trat
e(b
pm)
Heart rate trace in closed-chest animal
0
100
200
300
400
500
600
700
Time (minutes)
arterial canulation
A
0 1 2 3 4 5 6 7 8 9 10 11 12 13 14 15 16
Heart rate trace in open-chest animal
0
100
200
300
400
500
600
700
Time (minutes)
Hear
trat
e(b
pm)
Ventricular catheterisation
B
0 1 2 3 4 5 6 7 8 9 10 11 12 13 14
Figure 10
Chapter 3 Murine left ventricular pressure-volume loops
25
Fig 10 Heart rate tracings in closed chest and open chest instrumented mice
A Representative figure of a heart rate tracing in a closed-chest instrumented mouse The
moment of arterial cannulation is indicated Some arrhythmias are seen in response to
introduction of the catheter into the left ventricle Arrhythmias are only present in a short
time-period that is part of the stabilization period following catheter introduction Heart rate
remains unchanged during the measurements B Representative figure of a heart rate tracing
in an open-chest instrumented mouse Somewhat more pronounced chronotropic arrhythmias
are seen in response to ventricular introduction of the catheter by apical stab However no
significant brady- or tachycardias are present during the measurements
Chapter 3 Murine left ventricular pressure-volume loops
26
Discussion
In this chapter OC and CC protocols for in vivo left ventricular PV relationship
measurement are described and discussed Murine cardiac function determination via these
methods is sensitive reproducible and comparable The choice for open- or closed-chest PV
measurements in mice depends on the aim of the study with regards to the specific cardiac
pathology The OC approach is technically less complicated and less time consuming Main
characteristics of the OC model itself are low systolic pressures and arterial resistance The
OC approach could best be used in studies where myocardial integrity is not at stake
Particularly ischemiareperfusion studies regarding myocardial integrity are probably better
done using the CC approach
Assessment of cardiac performance in genetically engineered mice is indispensable to
understand human cardiovascular pathologies In general the synergistic features of cardiac
diseases such as hypertrophy and cell death affect cardiac function negatively The
contractile performance of the heart deteriorates which is reflected in the attenuation of
systolic parameters as ejection fraction stroke work and PV-relationships Furthermore
ventricular relaxation prolongs and diastolic filling becomes impaired The progression of
cardiac disease ultimately results in clinical heart failure which is defined by the inability of
the heart to meet hemodynamic demands of the body and is characterized by specific signs
and symptoms (21) The most important parameter of cardiac performance which defines
heart failure is cardiac output
The influence on cardiac performance of specific genes and proteins in the
development of cardiac diseases ought to be investigated extensively to assess their clinical
relevance Various techniques have been used to assess cardiac performance in mice The
main techniques will be discussed in brief
Chapter 3 Murine left ventricular pressure-volume loops
27
Echocardiography is the most widely used noninvasive technique to determine cardiac
performance in mice High-frequency transthoracic and transesophageal transducers are used
as effective tools for two-dimensional and Doppler imaging of ventricular wall structures
dimensions and volumes of cavum and cardiac function (2223) Full-conscious or gas-
anesthesia experiments are preferred for echocardiographic assessment of cardiac function in
mice (2425) There is no limit to the diversity of murine models investigated by this general
accepted method of cardiac performance assessment However the most questionable aspect
of these measurements is the significant inter- and intraobservator variance in the
measurements
Isolated working mouse heart measurements in a Langendorf perfusion setup are a
technique for ex vivo cardiac function measurements approximating the in vivo function level
(5) Cardiac output developed left ventricular pressure and first derivates of maximal and
minimal pressures are some of the parameters that can be derived Isolated working heart
measurements are especially useful to study the acute effects of ischemic preconditioning and
ischemia-induced apoptosis(2627) Metabolites of interest can be measured accurately in the
perfusion fluid Disadvantages are the impossibility of chronic studies and the
unphysiological situation of ex vivo cardiac function measurements
Aortic flow measurements by means of a flow-probe have been used in several
studies (2829) Aortic flow acquisition is a validated technique and reveals functional
parameters as cardiac output stroke volume and blood flow velocity However several
disadvantages oppose against this technique Firstly aortic flow measurements are invasive
(ie thoracotomy or laparotomy) and result solely in aortic derived volume parameters
Integrated ventricular function cannot be assessed More importantly the exact localization of
the flow probe around the aorta is the critical determinant of the systematic error made by
these measurements Flow probes have been placed around the ascending and descending
Chapter 3 Murine left ventricular pressure-volume loops
28
thoracic aorta and the abdominal aorta The percentage of total cardiac output passing the
flow probe on the specific location has to be estimated Flow probes located at the ascending
aorta correct for coronary circulation and for instance bloodvolume passing the descending
thoracic aorta has been estimated to be around 75 of total cardiac output (30) The estimated
correction factor provides lsquoabsolutersquo stroke volume instead of absolute LV cavum volumes
and does not correct for cardiophysiological changes Altered cardiophysiological situations
could theoretically influence the relative amount of bloodvolume passing the flow probe On
the other hand major advances are the possibility of chronic cardiac function measurements
and the relative facile manner of data acquirement(29) Moreover aortic flow probe
measurements are not hampered by deleterious cardiac remodeling in myocardial ischemia or
hypertrophy studies(2829)
The newly developed method of cardiac performance assessment by in vivo left
ventricular PV measurements in the CC model is introduced here Left ventricular PV
measurements in vivo provide an accurate assessment of murine cardiac function The method
is highly sensitive during open- and closed-chest approaches in determining alterations in left
ventricular function as result of cardiac disease or altered hemodynamic stress The
characteristics of simultaneous left ventricular pressure and volume measurements enable the
researcher to directly investigate pressure-related cardiac diseases as cardiac hypertrophy and
restrictive cardiomyopathy (31) or volume-related diseases as dilated cardiomyopathy (32)
Moreover the effective influence of both aspects of cardiac disease on each other can be
observed in detail For instance ventricular dilation and subsequent decrease in ventricular
systolic pressure is mapped accurately in PV-loops Continuous measurements provide
possibilities to investigate the complete cardiac cycle Basic aspects of cardiac physiology can
be visualized using PV-loops in mice (81533-35) For instance increase in ventricular filling
is followed by an increase in ejection fraction according to the Frank-Starling mechanism
Chapter 3 Murine left ventricular pressure-volume loops
29
The opposite is seen as a result of gradual venous return decrease in the case of transient caval
vein occlusion (figure 7 amp 9) Moreover the distinction between systolic and diastolic failure
can be made through continuous PV-measurements (19) Systolic heart failure encompasses
mainly an ejection dysfunction with impaired contractility Both aspects are obtained by and
directly visualized through PV-loops Additionally the definite diagnosis of diastolic failure
is dependent on the observation of an inappropriate upward shift of the (end-)diastolic PV
relationship requiring cardiac catheterization for continuous volume determinations using
impedance measurements and high-fidelity measurements of ventricular pressure with a
micromanometer (19) PV-loops are useful determining cardiac performance within the
complete continuum of healthy and diseased hearts
Chapter 3 Murine left ventricular pressure-volume loops
30
Conclusion
In vivo PV measurements provide an essential tool in the assessment of cardiac
function in genetically modified mice Open- and closed-chest surgical protocols for murine
cardiac function determination are sensitive reproducible and comparable PV-loops enable
the researcher to accurately investigate diverse murine models of cardiac pathology by
adequately visualizing the cause-and-effect relationship between genetic modification and
their functional outcome Changes in ventricular contractility are best detected by PV derived
parameters in comparison to other methods of cardiac function determination
Chapter 3 Murine left ventricular pressure-volume loops
31
References
1 Doevendans PA Daemen MJ de Muinck ED Smits JF Cardiovascular phenotypingin mice Cardiovasc Res 19983934-49
2 Hoit BD New approaches to phenotypic analysis in adult mice J Mol Cell Cardiol20013327-35
3 Chacko VP Aresta F Chacko SM Weiss RG MRIMRS assessment of in vivomurine cardiac metabolism morphology and function at physiological heart rates AmJ Physiol Heart Circ Physiol 2000279H2218-24
4 Tanaka N Dalton N Mao L et al Transthoracic echocardiography in models ofcardiac disease in the mouse Circulation 1996941109-17
5 De Windt LJ Willems J Reneman RS Van der Vusse GJ Arts T Van Bilsen M Animproved isolated left ventricular ejecting murine heart model Functional andmetabolic evaluation Pflugers Arch 1999437182-90
6 Palmen M Daemen MJ Buehler A et al Impaired cardiac remodeling and functionafter myocardial infarction in FGF-1 transgenic mice Circulation 1999100250
7 Rockman HA Hamilton RA Jones LR Milano CA Mao L Lefkowitz RJ Enhancedmyocardial relaxation in vivo in transgenic mice overexpressing the beta2-adrenergicreceptor is associated with reduced phospholamban protein J Clin Invest1996971618-23
8 Georgakopoulos D Mitzner WA Chen CH et al In vivo murine left ventricularpressure-volume relations by miniaturized conductance micromanometry Am JPhysiol 1998274H1416-22
9 Dekker AL Geskes GG Cramers AA et al Right ventricular support for off-pumpcoronary artery bypass grafting studied with bi-ventricular pressure-volume loops insheep Eur J Cardiothorac Surg 200119179-84
10 Schreuder JJ Steendijk P van der Veen FH et al Acute and short-term effects ofpartial left ventriculectomy in dilated cardiomyopathy assessment by pressure-volumeloops J Am Coll Cardiol 2000362104-14
11 Zimmer HG Measurement of left ventricular hemodynamic parameters in closed-chest rats under control and various pathophysiologic conditions Basic Res Cardiol19837877-84
12 Georgakopoulos D Kass DA Estimation of parallel conductance by dual-frequencyconductance catheter in mice Am J Physiol Heart Circ Physiol 2000279H443-50
13 Feldman MD Mao Y Valvano JW Pearce JA Freeman GL Development of amultifrequency conductance catheter-based system to determine LV function in miceAm J Physiol Heart Circ Physiol 2000279H1411-20
14 Kornet L Schreuder JJ Van de Velden ET Jansen JR The volume-dependency ofparallel conductance throughout the cardiac cycle and its consequence for volumeestimation of the left ventricle in patients Cardiovasc Res 200151729-35
15 Nemoto S DeFreitas G Mann DL Carabello BA Effects of changes in leftventricular contractility on indexes of contractility in mice Am J Physiol Heart CircPhysiol 2002283H2504-10
16 Baan J Van de Velden ET Steendijk P Ventricular pressure-volume relations in vivoEur Heart J 199213 SupplE2-6
17 Little WC Cheng CP Left ventricular-arterial coupling in conscious dogs Am JPhysiol 1991261H70-6
18 Sunagawa K Maughan WL Sagawa K Optimal arterial resistance for the maximalstroke work studied in isolated canine left ventricle Circ Res 198556586-95
Chapter 3 Murine left ventricular pressure-volume loops
32
19 Van Kraaij D Van Pol P Ruiters AW et al Diagnosing diastolic heart failure Eur JHeart Fail 20024419-30
20 Faunt KK Cohn LA Jones BD Dodam JR Cardiopulmonary effects of bilateralhemithorax ventilation and diagnostic thoracoscopy in dogs Am J Vet Res1998591494-8
21 Lips DJ Van Kraaij DL De Windt LJ Doevendans PA Molecular determinants ofmyocardial hypertrophy and failure alternative pathways for beneficial andmaladaptive hypertrophy Eur Heart J 200324883-96
22 Collins KA Korcarz CE Lang RM Use of echocardiography for the phenotypicassessment of genetically altered mice Physiol Genomics 200313227-39
23 Scherrer-Crosbie M Steudel W Hunziker PR et al Determination of right ventricularstructure and function in normoxic and hypoxic mice a transesophagealechocardiographic study Circulation 1998981015-21
24 Takuma S Suehiro K Cardinale C et al Anesthetic inhibition in ischemic andnonischemic murine heart comparison with conscious echocardiographic approachAm J Physiol Heart Circ Physiol 2001280H2364-70
25 Chaves AA Weinstein DM Bauer JA Non-invasive echocardiographic studies inmice influence of anesthetic regimen Life Sci 200169213-22
26 Yamaura G Turoczi T Yamamoto F Siddqui MA Maulik N Das DK STATsignaling in ischemic heart a role of STAT5A in ischemic preconditioning Am JPhysiol Heart Circ Physiol 2003285H476-82
27 Bell RM Yellon DM Atorvastatin administered at the onset of reperfusion andindependent of lipid lowering protects the myocardium by up-regulating a pro-survival pathway J Am Coll Cardiol 200341508-15
28 Aartsen WM Schuijt MP Danser AH Daemen MJ Smits JF The role of locallyexpressed angiotensin converting enzyme in cardiac remodeling after myocardialinfarction in mice Cardiovasc Res 200256205-13
29 Janssen B Debets J Leenders P Smits J Chronic measurement of cardiac output inconscious mice Am J Physiol Regul Integr Comp Physiol 2002282R928-35
30 Georgakopoulos D Christe ME Giewat M Seidman CM Seidman JG Kass DA Thepathogenesis of familial hypertrophic cardiomyopathy early and evolving effects froman alpha-cardiac myosin heavy chain missense mutation Nat Med 19995327-30
31 Liao P Georgakopoulos D Kovacs A et al The in vivo role of p38 MAP kinases incardiac remodeling and restrictive cardiomyopathy Proc Natl Acad Sci U S A20019812283-8
32 McConnell BK Jones KA Fatkin D et al Dilated cardiomyopathy in homozygousmyosin-binding protein-C mutant mice J Clin Invest 19991041235-44
33 Georgakopoulos D Kass DA Minimal force-frequency modulation of inotropy andrelaxation of in situ murine heart J Physiol 2001534535-45
34 Yang B Larson DF Watson R Age-related left ventricular function in the mouseanalysis based on in vivo pressure-volume relationships Am J Physiol1999277H1906-13
35 Reyes M Freeman GL Escobedo D Lee S Steinhelper ME Feldman MDEnhancement of contractility with sustained afterload in the intact murine heartblunting of length-dependent activation Circulation 20031072962-8
Chapter 3 Murine left ventricular pressure-volume loops
22
Fig 9 Left ventricular pressure-volume loops Pressure presented in mmHg and volume microl
A Representative figure of PV loops acquired during urethane anesthesia in closed chest
(CC) and open chest (OC) instrumented mice B Representative figure of PV loops acquired
during pentobarbital anesthesia in CC and OC instrumented mice Loops are acquired during
an occlusion of the inferior caval vein Venous returns decreases which is represented in the
loops by attenuation of both pressure and volume The differences in ESP SW and ESPVR
between urethane and pentobarbital anesthesia can be observed by analyzing the loops in A
and B The loops show also the larger stroke volume and depressed systolic pressure in OC
instrumented mice
Figure 9 shows representative PV-loops while venous return was attenuated following
inferior caval vein occlusion Typical pressure and volume effects are depicted showing the
absence of apparent differences in PV relationships The mentioned differences in ESP SV
and EF are evident in the presented loops though
ECG recordings were made during both surgical protocols to detect possible heart rate
alterations and arrhythmias Murine left ventricular PV measurements could be distorted by
physiological responses to the catheterization Heart rate alterations could be anticipated
especially in relation to carotid sinus stimulation while cannulating of the carotid artery
However neither bradycardia nor other arrhythmias were observed during either CC or OC
procedures (figure 10) This finding indicates that cannulation of the right common carotid
artery does not alter heart rate by carotid sinus stimulation
Chapter 3 Murine left ventricular pressure-volume loops
23
Table 3 Functional parameters to determine baseline LV functioning in open- and closed-
chest protocols during steady-state measurement
URETHANE PENTOBARBITALOC CC OC CC
N = 5 N = 5 N = 10 N = 10
Mean plusmn SEM Mean plusmn SEM Mean plusmn SEM Mean plusmn SEM
HR 583 plusmn 20 658 plusmn 21 493 plusmn 25 481 plusmn 36SVdagger 1958 plusmn 351 1557 plusmn 254 2018 plusmn 183 1426 plusmn 103CO 12 plusmn 2 10 plusmn 2 10 plusmn 1 7 plusmn 0Vmaxdagger 1761 plusmn 053 2361 plusmn 223 3089 plusmn 289 3883 plusmn 230Vmindagger 215 plusmn 133 679 plusmn 180 1029 plusmn 189 2373 plusmn 199EFdagger 79 plusmn 6 66 plusmn 8 66 plusmn 4 39 plusmn 2
ESPdagger 52 plusmn 4 65 plusmn 5 42 plusmn 3 47 plusmn 4EDP 1 plusmn 1 -1 plusmn 1 -6 plusmn 2 1 plusmn 1
dPdtmax 7200 plusmn 1349 8252 plusmn 1685 4004 plusmn 629 3718 plusmn 684dPdtmindagger -4233 plusmn 531 -7577 plusmn 750 -3631 plusmn 424 -3348 plusmn 653Tau 10 plusmn 0 7 plusmn 0 12 plusmn 1 14 plusmn 2
SW 1066 plusmn 245 1147 plusmn 213 1076 plusmn 176 666 plusmn 116
EaEesdagger 065 plusmn 020 084 plusmn 016 060 plusmn 005 103 plusmn 015ESPVR 570 plusmn 094 589 plusmn 074 347 plusmn 027 318 plusmn 052EDPVR 009 plusmn 009 -008 plusmn 015 -015 plusmn 014 -005 plusmn 015PRSW 79 plusmn 14 64 plusmn 6 68 plusmn 10 53 plusmn 3
Results from LV pressure-volume measurements in C57Bl6 mice anesthetized by urethane or
pentobarbital Urethane versus pentobarbital P lt 005 dagger OC versus CC P lt 005 ρ Valued
124 Ωcm α 030 Open- (OC) and closed-chest (CC) protocols HR indicates heart rate in
bpm SV left ventricular stroke volume in microl CO cardiac output mlmin Vmin minimal left
ventricular volume in microl Vmax maximal left ventricular volume in microl EF ejection fraction in
ESP left ventricular end-systolic pressure in mmHg EDP left ventricular end-diastolic
pressure in mmHg dPdtmax maximal first derivative of left ventricular pressure in mmHgs
dPdtmin minimal first derivative of left ventricular pressure in mmHgs Tau time constant of
left ventricular relaxation in ms SW stroke work in mmHgmicrol Ea arterial elastance Ees
ventricular end-systolic elastance ESPVR left ventricular end-systolic PV relationship in
Chapter 3 Murine left ventricular pressure-volume loops
24
mmHgmicrol EDPVR left ventricular end-diastolic PV relationship in mmHgmicrol PRSW left
ventricular preload-recruitable stroke work in mmHg
The steady-state functional parameters from OC and CC instrumented mice during
either urethane or pentobarbital are also depicted in Table 2 The use of pentobarbital
anesthesia had a cardiodepressive effect that was represented by significant function decline
in most parameters EF dPdtMAX and ESPVR decreased respectively with 24 57 and 41
upon pentobarbital use compared to urethane anesthesia Pentobarbital therefore had strong
negative chronotropic and inotropic effects
Hear
trat
e(b
pm)
Heart rate trace in closed-chest animal
0
100
200
300
400
500
600
700
Time (minutes)
arterial canulation
A
0 1 2 3 4 5 6 7 8 9 10 11 12 13 14 15 16
Heart rate trace in open-chest animal
0
100
200
300
400
500
600
700
Time (minutes)
Hear
trat
e(b
pm)
Ventricular catheterisation
B
0 1 2 3 4 5 6 7 8 9 10 11 12 13 14
Figure 10
Chapter 3 Murine left ventricular pressure-volume loops
25
Fig 10 Heart rate tracings in closed chest and open chest instrumented mice
A Representative figure of a heart rate tracing in a closed-chest instrumented mouse The
moment of arterial cannulation is indicated Some arrhythmias are seen in response to
introduction of the catheter into the left ventricle Arrhythmias are only present in a short
time-period that is part of the stabilization period following catheter introduction Heart rate
remains unchanged during the measurements B Representative figure of a heart rate tracing
in an open-chest instrumented mouse Somewhat more pronounced chronotropic arrhythmias
are seen in response to ventricular introduction of the catheter by apical stab However no
significant brady- or tachycardias are present during the measurements
Chapter 3 Murine left ventricular pressure-volume loops
26
Discussion
In this chapter OC and CC protocols for in vivo left ventricular PV relationship
measurement are described and discussed Murine cardiac function determination via these
methods is sensitive reproducible and comparable The choice for open- or closed-chest PV
measurements in mice depends on the aim of the study with regards to the specific cardiac
pathology The OC approach is technically less complicated and less time consuming Main
characteristics of the OC model itself are low systolic pressures and arterial resistance The
OC approach could best be used in studies where myocardial integrity is not at stake
Particularly ischemiareperfusion studies regarding myocardial integrity are probably better
done using the CC approach
Assessment of cardiac performance in genetically engineered mice is indispensable to
understand human cardiovascular pathologies In general the synergistic features of cardiac
diseases such as hypertrophy and cell death affect cardiac function negatively The
contractile performance of the heart deteriorates which is reflected in the attenuation of
systolic parameters as ejection fraction stroke work and PV-relationships Furthermore
ventricular relaxation prolongs and diastolic filling becomes impaired The progression of
cardiac disease ultimately results in clinical heart failure which is defined by the inability of
the heart to meet hemodynamic demands of the body and is characterized by specific signs
and symptoms (21) The most important parameter of cardiac performance which defines
heart failure is cardiac output
The influence on cardiac performance of specific genes and proteins in the
development of cardiac diseases ought to be investigated extensively to assess their clinical
relevance Various techniques have been used to assess cardiac performance in mice The
main techniques will be discussed in brief
Chapter 3 Murine left ventricular pressure-volume loops
27
Echocardiography is the most widely used noninvasive technique to determine cardiac
performance in mice High-frequency transthoracic and transesophageal transducers are used
as effective tools for two-dimensional and Doppler imaging of ventricular wall structures
dimensions and volumes of cavum and cardiac function (2223) Full-conscious or gas-
anesthesia experiments are preferred for echocardiographic assessment of cardiac function in
mice (2425) There is no limit to the diversity of murine models investigated by this general
accepted method of cardiac performance assessment However the most questionable aspect
of these measurements is the significant inter- and intraobservator variance in the
measurements
Isolated working mouse heart measurements in a Langendorf perfusion setup are a
technique for ex vivo cardiac function measurements approximating the in vivo function level
(5) Cardiac output developed left ventricular pressure and first derivates of maximal and
minimal pressures are some of the parameters that can be derived Isolated working heart
measurements are especially useful to study the acute effects of ischemic preconditioning and
ischemia-induced apoptosis(2627) Metabolites of interest can be measured accurately in the
perfusion fluid Disadvantages are the impossibility of chronic studies and the
unphysiological situation of ex vivo cardiac function measurements
Aortic flow measurements by means of a flow-probe have been used in several
studies (2829) Aortic flow acquisition is a validated technique and reveals functional
parameters as cardiac output stroke volume and blood flow velocity However several
disadvantages oppose against this technique Firstly aortic flow measurements are invasive
(ie thoracotomy or laparotomy) and result solely in aortic derived volume parameters
Integrated ventricular function cannot be assessed More importantly the exact localization of
the flow probe around the aorta is the critical determinant of the systematic error made by
these measurements Flow probes have been placed around the ascending and descending
Chapter 3 Murine left ventricular pressure-volume loops
28
thoracic aorta and the abdominal aorta The percentage of total cardiac output passing the
flow probe on the specific location has to be estimated Flow probes located at the ascending
aorta correct for coronary circulation and for instance bloodvolume passing the descending
thoracic aorta has been estimated to be around 75 of total cardiac output (30) The estimated
correction factor provides lsquoabsolutersquo stroke volume instead of absolute LV cavum volumes
and does not correct for cardiophysiological changes Altered cardiophysiological situations
could theoretically influence the relative amount of bloodvolume passing the flow probe On
the other hand major advances are the possibility of chronic cardiac function measurements
and the relative facile manner of data acquirement(29) Moreover aortic flow probe
measurements are not hampered by deleterious cardiac remodeling in myocardial ischemia or
hypertrophy studies(2829)
The newly developed method of cardiac performance assessment by in vivo left
ventricular PV measurements in the CC model is introduced here Left ventricular PV
measurements in vivo provide an accurate assessment of murine cardiac function The method
is highly sensitive during open- and closed-chest approaches in determining alterations in left
ventricular function as result of cardiac disease or altered hemodynamic stress The
characteristics of simultaneous left ventricular pressure and volume measurements enable the
researcher to directly investigate pressure-related cardiac diseases as cardiac hypertrophy and
restrictive cardiomyopathy (31) or volume-related diseases as dilated cardiomyopathy (32)
Moreover the effective influence of both aspects of cardiac disease on each other can be
observed in detail For instance ventricular dilation and subsequent decrease in ventricular
systolic pressure is mapped accurately in PV-loops Continuous measurements provide
possibilities to investigate the complete cardiac cycle Basic aspects of cardiac physiology can
be visualized using PV-loops in mice (81533-35) For instance increase in ventricular filling
is followed by an increase in ejection fraction according to the Frank-Starling mechanism
Chapter 3 Murine left ventricular pressure-volume loops
29
The opposite is seen as a result of gradual venous return decrease in the case of transient caval
vein occlusion (figure 7 amp 9) Moreover the distinction between systolic and diastolic failure
can be made through continuous PV-measurements (19) Systolic heart failure encompasses
mainly an ejection dysfunction with impaired contractility Both aspects are obtained by and
directly visualized through PV-loops Additionally the definite diagnosis of diastolic failure
is dependent on the observation of an inappropriate upward shift of the (end-)diastolic PV
relationship requiring cardiac catheterization for continuous volume determinations using
impedance measurements and high-fidelity measurements of ventricular pressure with a
micromanometer (19) PV-loops are useful determining cardiac performance within the
complete continuum of healthy and diseased hearts
Chapter 3 Murine left ventricular pressure-volume loops
30
Conclusion
In vivo PV measurements provide an essential tool in the assessment of cardiac
function in genetically modified mice Open- and closed-chest surgical protocols for murine
cardiac function determination are sensitive reproducible and comparable PV-loops enable
the researcher to accurately investigate diverse murine models of cardiac pathology by
adequately visualizing the cause-and-effect relationship between genetic modification and
their functional outcome Changes in ventricular contractility are best detected by PV derived
parameters in comparison to other methods of cardiac function determination
Chapter 3 Murine left ventricular pressure-volume loops
31
References
1 Doevendans PA Daemen MJ de Muinck ED Smits JF Cardiovascular phenotypingin mice Cardiovasc Res 19983934-49
2 Hoit BD New approaches to phenotypic analysis in adult mice J Mol Cell Cardiol20013327-35
3 Chacko VP Aresta F Chacko SM Weiss RG MRIMRS assessment of in vivomurine cardiac metabolism morphology and function at physiological heart rates AmJ Physiol Heart Circ Physiol 2000279H2218-24
4 Tanaka N Dalton N Mao L et al Transthoracic echocardiography in models ofcardiac disease in the mouse Circulation 1996941109-17
5 De Windt LJ Willems J Reneman RS Van der Vusse GJ Arts T Van Bilsen M Animproved isolated left ventricular ejecting murine heart model Functional andmetabolic evaluation Pflugers Arch 1999437182-90
6 Palmen M Daemen MJ Buehler A et al Impaired cardiac remodeling and functionafter myocardial infarction in FGF-1 transgenic mice Circulation 1999100250
7 Rockman HA Hamilton RA Jones LR Milano CA Mao L Lefkowitz RJ Enhancedmyocardial relaxation in vivo in transgenic mice overexpressing the beta2-adrenergicreceptor is associated with reduced phospholamban protein J Clin Invest1996971618-23
8 Georgakopoulos D Mitzner WA Chen CH et al In vivo murine left ventricularpressure-volume relations by miniaturized conductance micromanometry Am JPhysiol 1998274H1416-22
9 Dekker AL Geskes GG Cramers AA et al Right ventricular support for off-pumpcoronary artery bypass grafting studied with bi-ventricular pressure-volume loops insheep Eur J Cardiothorac Surg 200119179-84
10 Schreuder JJ Steendijk P van der Veen FH et al Acute and short-term effects ofpartial left ventriculectomy in dilated cardiomyopathy assessment by pressure-volumeloops J Am Coll Cardiol 2000362104-14
11 Zimmer HG Measurement of left ventricular hemodynamic parameters in closed-chest rats under control and various pathophysiologic conditions Basic Res Cardiol19837877-84
12 Georgakopoulos D Kass DA Estimation of parallel conductance by dual-frequencyconductance catheter in mice Am J Physiol Heart Circ Physiol 2000279H443-50
13 Feldman MD Mao Y Valvano JW Pearce JA Freeman GL Development of amultifrequency conductance catheter-based system to determine LV function in miceAm J Physiol Heart Circ Physiol 2000279H1411-20
14 Kornet L Schreuder JJ Van de Velden ET Jansen JR The volume-dependency ofparallel conductance throughout the cardiac cycle and its consequence for volumeestimation of the left ventricle in patients Cardiovasc Res 200151729-35
15 Nemoto S DeFreitas G Mann DL Carabello BA Effects of changes in leftventricular contractility on indexes of contractility in mice Am J Physiol Heart CircPhysiol 2002283H2504-10
16 Baan J Van de Velden ET Steendijk P Ventricular pressure-volume relations in vivoEur Heart J 199213 SupplE2-6
17 Little WC Cheng CP Left ventricular-arterial coupling in conscious dogs Am JPhysiol 1991261H70-6
18 Sunagawa K Maughan WL Sagawa K Optimal arterial resistance for the maximalstroke work studied in isolated canine left ventricle Circ Res 198556586-95
Chapter 3 Murine left ventricular pressure-volume loops
32
19 Van Kraaij D Van Pol P Ruiters AW et al Diagnosing diastolic heart failure Eur JHeart Fail 20024419-30
20 Faunt KK Cohn LA Jones BD Dodam JR Cardiopulmonary effects of bilateralhemithorax ventilation and diagnostic thoracoscopy in dogs Am J Vet Res1998591494-8
21 Lips DJ Van Kraaij DL De Windt LJ Doevendans PA Molecular determinants ofmyocardial hypertrophy and failure alternative pathways for beneficial andmaladaptive hypertrophy Eur Heart J 200324883-96
22 Collins KA Korcarz CE Lang RM Use of echocardiography for the phenotypicassessment of genetically altered mice Physiol Genomics 200313227-39
23 Scherrer-Crosbie M Steudel W Hunziker PR et al Determination of right ventricularstructure and function in normoxic and hypoxic mice a transesophagealechocardiographic study Circulation 1998981015-21
24 Takuma S Suehiro K Cardinale C et al Anesthetic inhibition in ischemic andnonischemic murine heart comparison with conscious echocardiographic approachAm J Physiol Heart Circ Physiol 2001280H2364-70
25 Chaves AA Weinstein DM Bauer JA Non-invasive echocardiographic studies inmice influence of anesthetic regimen Life Sci 200169213-22
26 Yamaura G Turoczi T Yamamoto F Siddqui MA Maulik N Das DK STATsignaling in ischemic heart a role of STAT5A in ischemic preconditioning Am JPhysiol Heart Circ Physiol 2003285H476-82
27 Bell RM Yellon DM Atorvastatin administered at the onset of reperfusion andindependent of lipid lowering protects the myocardium by up-regulating a pro-survival pathway J Am Coll Cardiol 200341508-15
28 Aartsen WM Schuijt MP Danser AH Daemen MJ Smits JF The role of locallyexpressed angiotensin converting enzyme in cardiac remodeling after myocardialinfarction in mice Cardiovasc Res 200256205-13
29 Janssen B Debets J Leenders P Smits J Chronic measurement of cardiac output inconscious mice Am J Physiol Regul Integr Comp Physiol 2002282R928-35
30 Georgakopoulos D Christe ME Giewat M Seidman CM Seidman JG Kass DA Thepathogenesis of familial hypertrophic cardiomyopathy early and evolving effects froman alpha-cardiac myosin heavy chain missense mutation Nat Med 19995327-30
31 Liao P Georgakopoulos D Kovacs A et al The in vivo role of p38 MAP kinases incardiac remodeling and restrictive cardiomyopathy Proc Natl Acad Sci U S A20019812283-8
32 McConnell BK Jones KA Fatkin D et al Dilated cardiomyopathy in homozygousmyosin-binding protein-C mutant mice J Clin Invest 19991041235-44
33 Georgakopoulos D Kass DA Minimal force-frequency modulation of inotropy andrelaxation of in situ murine heart J Physiol 2001534535-45
34 Yang B Larson DF Watson R Age-related left ventricular function in the mouseanalysis based on in vivo pressure-volume relationships Am J Physiol1999277H1906-13
35 Reyes M Freeman GL Escobedo D Lee S Steinhelper ME Feldman MDEnhancement of contractility with sustained afterload in the intact murine heartblunting of length-dependent activation Circulation 20031072962-8
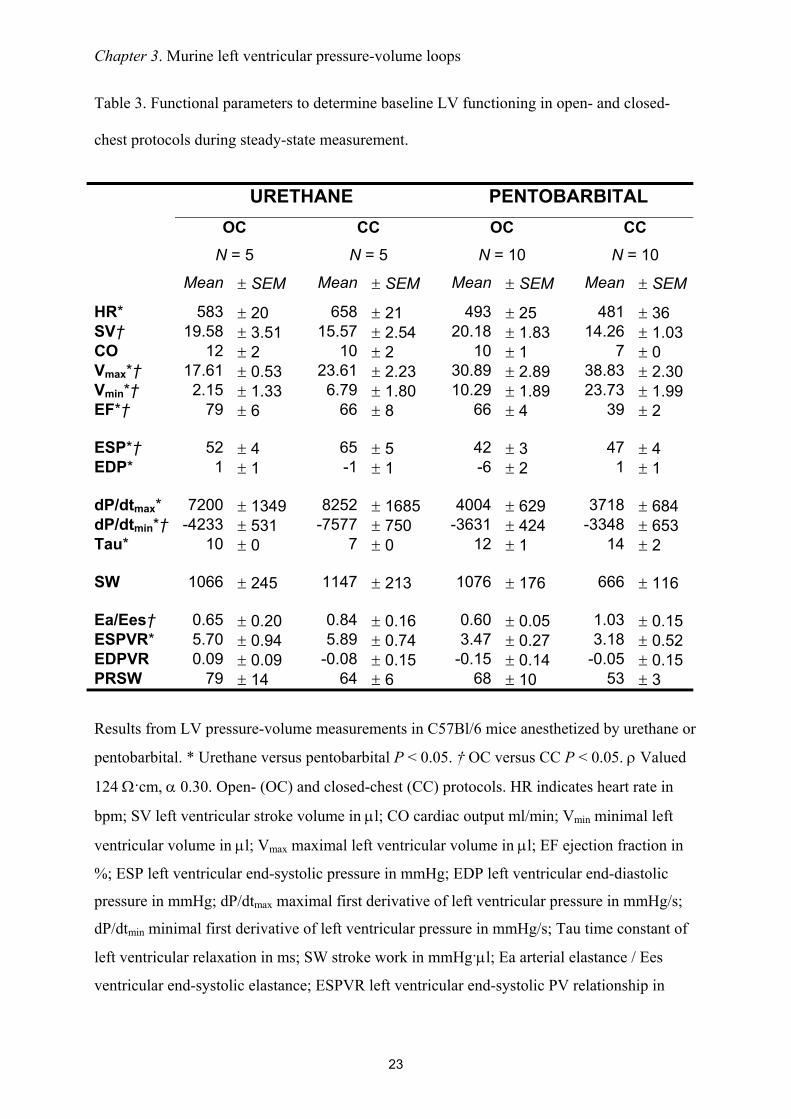
Chapter 3 Murine left ventricular pressure-volume loops
23
Table 3 Functional parameters to determine baseline LV functioning in open- and closed-
chest protocols during steady-state measurement
URETHANE PENTOBARBITALOC CC OC CC
N = 5 N = 5 N = 10 N = 10
Mean plusmn SEM Mean plusmn SEM Mean plusmn SEM Mean plusmn SEM
HR 583 plusmn 20 658 plusmn 21 493 plusmn 25 481 plusmn 36SVdagger 1958 plusmn 351 1557 plusmn 254 2018 plusmn 183 1426 plusmn 103CO 12 plusmn 2 10 plusmn 2 10 plusmn 1 7 plusmn 0Vmaxdagger 1761 plusmn 053 2361 plusmn 223 3089 plusmn 289 3883 plusmn 230Vmindagger 215 plusmn 133 679 plusmn 180 1029 plusmn 189 2373 plusmn 199EFdagger 79 plusmn 6 66 plusmn 8 66 plusmn 4 39 plusmn 2
ESPdagger 52 plusmn 4 65 plusmn 5 42 plusmn 3 47 plusmn 4EDP 1 plusmn 1 -1 plusmn 1 -6 plusmn 2 1 plusmn 1
dPdtmax 7200 plusmn 1349 8252 plusmn 1685 4004 plusmn 629 3718 plusmn 684dPdtmindagger -4233 plusmn 531 -7577 plusmn 750 -3631 plusmn 424 -3348 plusmn 653Tau 10 plusmn 0 7 plusmn 0 12 plusmn 1 14 plusmn 2
SW 1066 plusmn 245 1147 plusmn 213 1076 plusmn 176 666 plusmn 116
EaEesdagger 065 plusmn 020 084 plusmn 016 060 plusmn 005 103 plusmn 015ESPVR 570 plusmn 094 589 plusmn 074 347 plusmn 027 318 plusmn 052EDPVR 009 plusmn 009 -008 plusmn 015 -015 plusmn 014 -005 plusmn 015PRSW 79 plusmn 14 64 plusmn 6 68 plusmn 10 53 plusmn 3
Results from LV pressure-volume measurements in C57Bl6 mice anesthetized by urethane or
pentobarbital Urethane versus pentobarbital P lt 005 dagger OC versus CC P lt 005 ρ Valued
124 Ωcm α 030 Open- (OC) and closed-chest (CC) protocols HR indicates heart rate in
bpm SV left ventricular stroke volume in microl CO cardiac output mlmin Vmin minimal left
ventricular volume in microl Vmax maximal left ventricular volume in microl EF ejection fraction in
ESP left ventricular end-systolic pressure in mmHg EDP left ventricular end-diastolic
pressure in mmHg dPdtmax maximal first derivative of left ventricular pressure in mmHgs
dPdtmin minimal first derivative of left ventricular pressure in mmHgs Tau time constant of
left ventricular relaxation in ms SW stroke work in mmHgmicrol Ea arterial elastance Ees
ventricular end-systolic elastance ESPVR left ventricular end-systolic PV relationship in
Chapter 3 Murine left ventricular pressure-volume loops
24
mmHgmicrol EDPVR left ventricular end-diastolic PV relationship in mmHgmicrol PRSW left
ventricular preload-recruitable stroke work in mmHg
The steady-state functional parameters from OC and CC instrumented mice during
either urethane or pentobarbital are also depicted in Table 2 The use of pentobarbital
anesthesia had a cardiodepressive effect that was represented by significant function decline
in most parameters EF dPdtMAX and ESPVR decreased respectively with 24 57 and 41
upon pentobarbital use compared to urethane anesthesia Pentobarbital therefore had strong
negative chronotropic and inotropic effects
Hear
trat
e(b
pm)
Heart rate trace in closed-chest animal
0
100
200
300
400
500
600
700
Time (minutes)
arterial canulation
A
0 1 2 3 4 5 6 7 8 9 10 11 12 13 14 15 16
Heart rate trace in open-chest animal
0
100
200
300
400
500
600
700
Time (minutes)
Hear
trat
e(b
pm)
Ventricular catheterisation
B
0 1 2 3 4 5 6 7 8 9 10 11 12 13 14
Figure 10
Chapter 3 Murine left ventricular pressure-volume loops
25
Fig 10 Heart rate tracings in closed chest and open chest instrumented mice
A Representative figure of a heart rate tracing in a closed-chest instrumented mouse The
moment of arterial cannulation is indicated Some arrhythmias are seen in response to
introduction of the catheter into the left ventricle Arrhythmias are only present in a short
time-period that is part of the stabilization period following catheter introduction Heart rate
remains unchanged during the measurements B Representative figure of a heart rate tracing
in an open-chest instrumented mouse Somewhat more pronounced chronotropic arrhythmias
are seen in response to ventricular introduction of the catheter by apical stab However no
significant brady- or tachycardias are present during the measurements
Chapter 3 Murine left ventricular pressure-volume loops
26
Discussion
In this chapter OC and CC protocols for in vivo left ventricular PV relationship
measurement are described and discussed Murine cardiac function determination via these
methods is sensitive reproducible and comparable The choice for open- or closed-chest PV
measurements in mice depends on the aim of the study with regards to the specific cardiac
pathology The OC approach is technically less complicated and less time consuming Main
characteristics of the OC model itself are low systolic pressures and arterial resistance The
OC approach could best be used in studies where myocardial integrity is not at stake
Particularly ischemiareperfusion studies regarding myocardial integrity are probably better
done using the CC approach
Assessment of cardiac performance in genetically engineered mice is indispensable to
understand human cardiovascular pathologies In general the synergistic features of cardiac
diseases such as hypertrophy and cell death affect cardiac function negatively The
contractile performance of the heart deteriorates which is reflected in the attenuation of
systolic parameters as ejection fraction stroke work and PV-relationships Furthermore
ventricular relaxation prolongs and diastolic filling becomes impaired The progression of
cardiac disease ultimately results in clinical heart failure which is defined by the inability of
the heart to meet hemodynamic demands of the body and is characterized by specific signs
and symptoms (21) The most important parameter of cardiac performance which defines
heart failure is cardiac output
The influence on cardiac performance of specific genes and proteins in the
development of cardiac diseases ought to be investigated extensively to assess their clinical
relevance Various techniques have been used to assess cardiac performance in mice The
main techniques will be discussed in brief
Chapter 3 Murine left ventricular pressure-volume loops
27
Echocardiography is the most widely used noninvasive technique to determine cardiac
performance in mice High-frequency transthoracic and transesophageal transducers are used
as effective tools for two-dimensional and Doppler imaging of ventricular wall structures
dimensions and volumes of cavum and cardiac function (2223) Full-conscious or gas-
anesthesia experiments are preferred for echocardiographic assessment of cardiac function in
mice (2425) There is no limit to the diversity of murine models investigated by this general
accepted method of cardiac performance assessment However the most questionable aspect
of these measurements is the significant inter- and intraobservator variance in the
measurements
Isolated working mouse heart measurements in a Langendorf perfusion setup are a
technique for ex vivo cardiac function measurements approximating the in vivo function level
(5) Cardiac output developed left ventricular pressure and first derivates of maximal and
minimal pressures are some of the parameters that can be derived Isolated working heart
measurements are especially useful to study the acute effects of ischemic preconditioning and
ischemia-induced apoptosis(2627) Metabolites of interest can be measured accurately in the
perfusion fluid Disadvantages are the impossibility of chronic studies and the
unphysiological situation of ex vivo cardiac function measurements
Aortic flow measurements by means of a flow-probe have been used in several
studies (2829) Aortic flow acquisition is a validated technique and reveals functional
parameters as cardiac output stroke volume and blood flow velocity However several
disadvantages oppose against this technique Firstly aortic flow measurements are invasive
(ie thoracotomy or laparotomy) and result solely in aortic derived volume parameters
Integrated ventricular function cannot be assessed More importantly the exact localization of
the flow probe around the aorta is the critical determinant of the systematic error made by
these measurements Flow probes have been placed around the ascending and descending
Chapter 3 Murine left ventricular pressure-volume loops
28
thoracic aorta and the abdominal aorta The percentage of total cardiac output passing the
flow probe on the specific location has to be estimated Flow probes located at the ascending
aorta correct for coronary circulation and for instance bloodvolume passing the descending
thoracic aorta has been estimated to be around 75 of total cardiac output (30) The estimated
correction factor provides lsquoabsolutersquo stroke volume instead of absolute LV cavum volumes
and does not correct for cardiophysiological changes Altered cardiophysiological situations
could theoretically influence the relative amount of bloodvolume passing the flow probe On
the other hand major advances are the possibility of chronic cardiac function measurements
and the relative facile manner of data acquirement(29) Moreover aortic flow probe
measurements are not hampered by deleterious cardiac remodeling in myocardial ischemia or
hypertrophy studies(2829)
The newly developed method of cardiac performance assessment by in vivo left
ventricular PV measurements in the CC model is introduced here Left ventricular PV
measurements in vivo provide an accurate assessment of murine cardiac function The method
is highly sensitive during open- and closed-chest approaches in determining alterations in left
ventricular function as result of cardiac disease or altered hemodynamic stress The
characteristics of simultaneous left ventricular pressure and volume measurements enable the
researcher to directly investigate pressure-related cardiac diseases as cardiac hypertrophy and
restrictive cardiomyopathy (31) or volume-related diseases as dilated cardiomyopathy (32)
Moreover the effective influence of both aspects of cardiac disease on each other can be
observed in detail For instance ventricular dilation and subsequent decrease in ventricular
systolic pressure is mapped accurately in PV-loops Continuous measurements provide
possibilities to investigate the complete cardiac cycle Basic aspects of cardiac physiology can
be visualized using PV-loops in mice (81533-35) For instance increase in ventricular filling
is followed by an increase in ejection fraction according to the Frank-Starling mechanism
Chapter 3 Murine left ventricular pressure-volume loops
29
The opposite is seen as a result of gradual venous return decrease in the case of transient caval
vein occlusion (figure 7 amp 9) Moreover the distinction between systolic and diastolic failure
can be made through continuous PV-measurements (19) Systolic heart failure encompasses
mainly an ejection dysfunction with impaired contractility Both aspects are obtained by and
directly visualized through PV-loops Additionally the definite diagnosis of diastolic failure
is dependent on the observation of an inappropriate upward shift of the (end-)diastolic PV
relationship requiring cardiac catheterization for continuous volume determinations using
impedance measurements and high-fidelity measurements of ventricular pressure with a
micromanometer (19) PV-loops are useful determining cardiac performance within the
complete continuum of healthy and diseased hearts
Chapter 3 Murine left ventricular pressure-volume loops
30
Conclusion
In vivo PV measurements provide an essential tool in the assessment of cardiac
function in genetically modified mice Open- and closed-chest surgical protocols for murine
cardiac function determination are sensitive reproducible and comparable PV-loops enable
the researcher to accurately investigate diverse murine models of cardiac pathology by
adequately visualizing the cause-and-effect relationship between genetic modification and
their functional outcome Changes in ventricular contractility are best detected by PV derived
parameters in comparison to other methods of cardiac function determination
Chapter 3 Murine left ventricular pressure-volume loops
31
References
1 Doevendans PA Daemen MJ de Muinck ED Smits JF Cardiovascular phenotypingin mice Cardiovasc Res 19983934-49
2 Hoit BD New approaches to phenotypic analysis in adult mice J Mol Cell Cardiol20013327-35
3 Chacko VP Aresta F Chacko SM Weiss RG MRIMRS assessment of in vivomurine cardiac metabolism morphology and function at physiological heart rates AmJ Physiol Heart Circ Physiol 2000279H2218-24
4 Tanaka N Dalton N Mao L et al Transthoracic echocardiography in models ofcardiac disease in the mouse Circulation 1996941109-17
5 De Windt LJ Willems J Reneman RS Van der Vusse GJ Arts T Van Bilsen M Animproved isolated left ventricular ejecting murine heart model Functional andmetabolic evaluation Pflugers Arch 1999437182-90
6 Palmen M Daemen MJ Buehler A et al Impaired cardiac remodeling and functionafter myocardial infarction in FGF-1 transgenic mice Circulation 1999100250
7 Rockman HA Hamilton RA Jones LR Milano CA Mao L Lefkowitz RJ Enhancedmyocardial relaxation in vivo in transgenic mice overexpressing the beta2-adrenergicreceptor is associated with reduced phospholamban protein J Clin Invest1996971618-23
8 Georgakopoulos D Mitzner WA Chen CH et al In vivo murine left ventricularpressure-volume relations by miniaturized conductance micromanometry Am JPhysiol 1998274H1416-22
9 Dekker AL Geskes GG Cramers AA et al Right ventricular support for off-pumpcoronary artery bypass grafting studied with bi-ventricular pressure-volume loops insheep Eur J Cardiothorac Surg 200119179-84
10 Schreuder JJ Steendijk P van der Veen FH et al Acute and short-term effects ofpartial left ventriculectomy in dilated cardiomyopathy assessment by pressure-volumeloops J Am Coll Cardiol 2000362104-14
11 Zimmer HG Measurement of left ventricular hemodynamic parameters in closed-chest rats under control and various pathophysiologic conditions Basic Res Cardiol19837877-84
12 Georgakopoulos D Kass DA Estimation of parallel conductance by dual-frequencyconductance catheter in mice Am J Physiol Heart Circ Physiol 2000279H443-50
13 Feldman MD Mao Y Valvano JW Pearce JA Freeman GL Development of amultifrequency conductance catheter-based system to determine LV function in miceAm J Physiol Heart Circ Physiol 2000279H1411-20
14 Kornet L Schreuder JJ Van de Velden ET Jansen JR The volume-dependency ofparallel conductance throughout the cardiac cycle and its consequence for volumeestimation of the left ventricle in patients Cardiovasc Res 200151729-35
15 Nemoto S DeFreitas G Mann DL Carabello BA Effects of changes in leftventricular contractility on indexes of contractility in mice Am J Physiol Heart CircPhysiol 2002283H2504-10
16 Baan J Van de Velden ET Steendijk P Ventricular pressure-volume relations in vivoEur Heart J 199213 SupplE2-6
17 Little WC Cheng CP Left ventricular-arterial coupling in conscious dogs Am JPhysiol 1991261H70-6
18 Sunagawa K Maughan WL Sagawa K Optimal arterial resistance for the maximalstroke work studied in isolated canine left ventricle Circ Res 198556586-95
Chapter 3 Murine left ventricular pressure-volume loops
32
19 Van Kraaij D Van Pol P Ruiters AW et al Diagnosing diastolic heart failure Eur JHeart Fail 20024419-30
20 Faunt KK Cohn LA Jones BD Dodam JR Cardiopulmonary effects of bilateralhemithorax ventilation and diagnostic thoracoscopy in dogs Am J Vet Res1998591494-8
21 Lips DJ Van Kraaij DL De Windt LJ Doevendans PA Molecular determinants ofmyocardial hypertrophy and failure alternative pathways for beneficial andmaladaptive hypertrophy Eur Heart J 200324883-96
22 Collins KA Korcarz CE Lang RM Use of echocardiography for the phenotypicassessment of genetically altered mice Physiol Genomics 200313227-39
23 Scherrer-Crosbie M Steudel W Hunziker PR et al Determination of right ventricularstructure and function in normoxic and hypoxic mice a transesophagealechocardiographic study Circulation 1998981015-21
24 Takuma S Suehiro K Cardinale C et al Anesthetic inhibition in ischemic andnonischemic murine heart comparison with conscious echocardiographic approachAm J Physiol Heart Circ Physiol 2001280H2364-70
25 Chaves AA Weinstein DM Bauer JA Non-invasive echocardiographic studies inmice influence of anesthetic regimen Life Sci 200169213-22
26 Yamaura G Turoczi T Yamamoto F Siddqui MA Maulik N Das DK STATsignaling in ischemic heart a role of STAT5A in ischemic preconditioning Am JPhysiol Heart Circ Physiol 2003285H476-82
27 Bell RM Yellon DM Atorvastatin administered at the onset of reperfusion andindependent of lipid lowering protects the myocardium by up-regulating a pro-survival pathway J Am Coll Cardiol 200341508-15
28 Aartsen WM Schuijt MP Danser AH Daemen MJ Smits JF The role of locallyexpressed angiotensin converting enzyme in cardiac remodeling after myocardialinfarction in mice Cardiovasc Res 200256205-13
29 Janssen B Debets J Leenders P Smits J Chronic measurement of cardiac output inconscious mice Am J Physiol Regul Integr Comp Physiol 2002282R928-35
30 Georgakopoulos D Christe ME Giewat M Seidman CM Seidman JG Kass DA Thepathogenesis of familial hypertrophic cardiomyopathy early and evolving effects froman alpha-cardiac myosin heavy chain missense mutation Nat Med 19995327-30
31 Liao P Georgakopoulos D Kovacs A et al The in vivo role of p38 MAP kinases incardiac remodeling and restrictive cardiomyopathy Proc Natl Acad Sci U S A20019812283-8
32 McConnell BK Jones KA Fatkin D et al Dilated cardiomyopathy in homozygousmyosin-binding protein-C mutant mice J Clin Invest 19991041235-44
33 Georgakopoulos D Kass DA Minimal force-frequency modulation of inotropy andrelaxation of in situ murine heart J Physiol 2001534535-45
34 Yang B Larson DF Watson R Age-related left ventricular function in the mouseanalysis based on in vivo pressure-volume relationships Am J Physiol1999277H1906-13
35 Reyes M Freeman GL Escobedo D Lee S Steinhelper ME Feldman MDEnhancement of contractility with sustained afterload in the intact murine heartblunting of length-dependent activation Circulation 20031072962-8
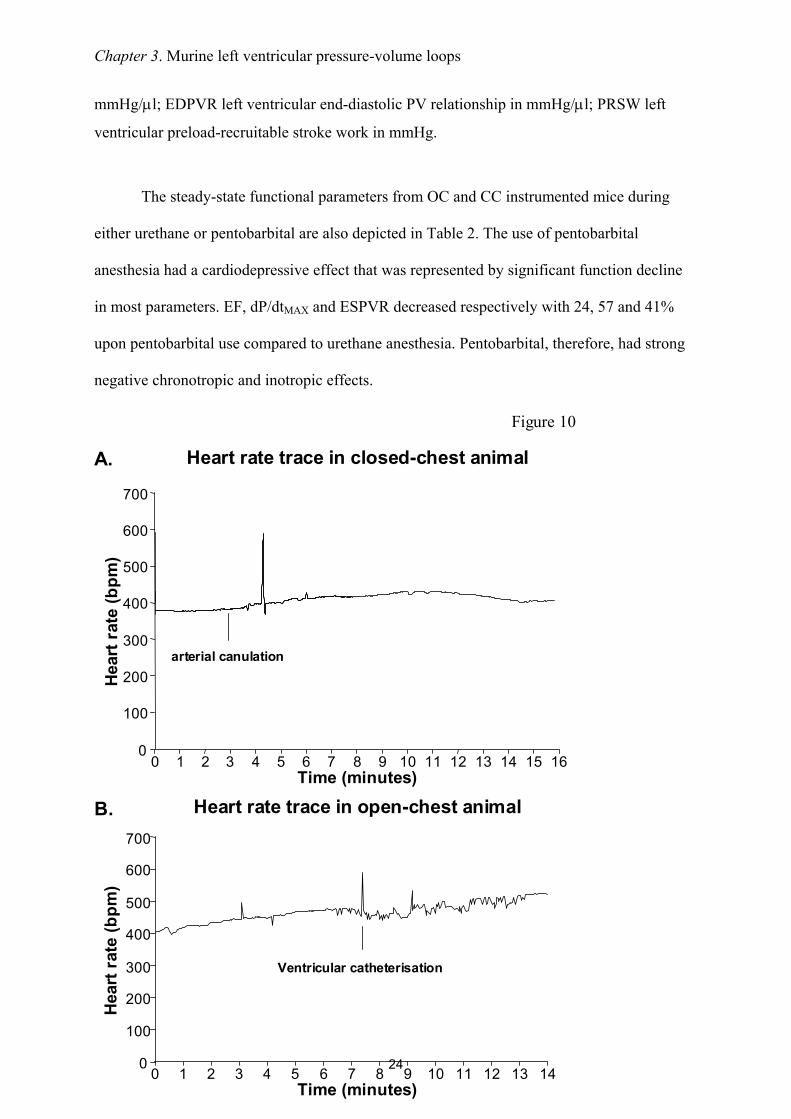
Chapter 3 Murine left ventricular pressure-volume loops
24
mmHgmicrol EDPVR left ventricular end-diastolic PV relationship in mmHgmicrol PRSW left
ventricular preload-recruitable stroke work in mmHg
The steady-state functional parameters from OC and CC instrumented mice during
either urethane or pentobarbital are also depicted in Table 2 The use of pentobarbital
anesthesia had a cardiodepressive effect that was represented by significant function decline
in most parameters EF dPdtMAX and ESPVR decreased respectively with 24 57 and 41
upon pentobarbital use compared to urethane anesthesia Pentobarbital therefore had strong
negative chronotropic and inotropic effects
Hear
trat
e(b
pm)
Heart rate trace in closed-chest animal
0
100
200
300
400
500
600
700
Time (minutes)
arterial canulation
A
0 1 2 3 4 5 6 7 8 9 10 11 12 13 14 15 16
Heart rate trace in open-chest animal
0
100
200
300
400
500
600
700
Time (minutes)
Hear
trat
e(b
pm)
Ventricular catheterisation
B
0 1 2 3 4 5 6 7 8 9 10 11 12 13 14
Figure 10
Chapter 3 Murine left ventricular pressure-volume loops
25
Fig 10 Heart rate tracings in closed chest and open chest instrumented mice
A Representative figure of a heart rate tracing in a closed-chest instrumented mouse The
moment of arterial cannulation is indicated Some arrhythmias are seen in response to
introduction of the catheter into the left ventricle Arrhythmias are only present in a short
time-period that is part of the stabilization period following catheter introduction Heart rate
remains unchanged during the measurements B Representative figure of a heart rate tracing
in an open-chest instrumented mouse Somewhat more pronounced chronotropic arrhythmias
are seen in response to ventricular introduction of the catheter by apical stab However no
significant brady- or tachycardias are present during the measurements
Chapter 3 Murine left ventricular pressure-volume loops
26
Discussion
In this chapter OC and CC protocols for in vivo left ventricular PV relationship
measurement are described and discussed Murine cardiac function determination via these
methods is sensitive reproducible and comparable The choice for open- or closed-chest PV
measurements in mice depends on the aim of the study with regards to the specific cardiac
pathology The OC approach is technically less complicated and less time consuming Main
characteristics of the OC model itself are low systolic pressures and arterial resistance The
OC approach could best be used in studies where myocardial integrity is not at stake
Particularly ischemiareperfusion studies regarding myocardial integrity are probably better
done using the CC approach
Assessment of cardiac performance in genetically engineered mice is indispensable to
understand human cardiovascular pathologies In general the synergistic features of cardiac
diseases such as hypertrophy and cell death affect cardiac function negatively The
contractile performance of the heart deteriorates which is reflected in the attenuation of
systolic parameters as ejection fraction stroke work and PV-relationships Furthermore
ventricular relaxation prolongs and diastolic filling becomes impaired The progression of
cardiac disease ultimately results in clinical heart failure which is defined by the inability of
the heart to meet hemodynamic demands of the body and is characterized by specific signs
and symptoms (21) The most important parameter of cardiac performance which defines
heart failure is cardiac output
The influence on cardiac performance of specific genes and proteins in the
development of cardiac diseases ought to be investigated extensively to assess their clinical
relevance Various techniques have been used to assess cardiac performance in mice The
main techniques will be discussed in brief
Chapter 3 Murine left ventricular pressure-volume loops
27
Echocardiography is the most widely used noninvasive technique to determine cardiac
performance in mice High-frequency transthoracic and transesophageal transducers are used
as effective tools for two-dimensional and Doppler imaging of ventricular wall structures
dimensions and volumes of cavum and cardiac function (2223) Full-conscious or gas-
anesthesia experiments are preferred for echocardiographic assessment of cardiac function in
mice (2425) There is no limit to the diversity of murine models investigated by this general
accepted method of cardiac performance assessment However the most questionable aspect
of these measurements is the significant inter- and intraobservator variance in the
measurements
Isolated working mouse heart measurements in a Langendorf perfusion setup are a
technique for ex vivo cardiac function measurements approximating the in vivo function level
(5) Cardiac output developed left ventricular pressure and first derivates of maximal and
minimal pressures are some of the parameters that can be derived Isolated working heart
measurements are especially useful to study the acute effects of ischemic preconditioning and
ischemia-induced apoptosis(2627) Metabolites of interest can be measured accurately in the
perfusion fluid Disadvantages are the impossibility of chronic studies and the
unphysiological situation of ex vivo cardiac function measurements
Aortic flow measurements by means of a flow-probe have been used in several
studies (2829) Aortic flow acquisition is a validated technique and reveals functional
parameters as cardiac output stroke volume and blood flow velocity However several
disadvantages oppose against this technique Firstly aortic flow measurements are invasive
(ie thoracotomy or laparotomy) and result solely in aortic derived volume parameters
Integrated ventricular function cannot be assessed More importantly the exact localization of
the flow probe around the aorta is the critical determinant of the systematic error made by
these measurements Flow probes have been placed around the ascending and descending
Chapter 3 Murine left ventricular pressure-volume loops
28
thoracic aorta and the abdominal aorta The percentage of total cardiac output passing the
flow probe on the specific location has to be estimated Flow probes located at the ascending
aorta correct for coronary circulation and for instance bloodvolume passing the descending
thoracic aorta has been estimated to be around 75 of total cardiac output (30) The estimated
correction factor provides lsquoabsolutersquo stroke volume instead of absolute LV cavum volumes
and does not correct for cardiophysiological changes Altered cardiophysiological situations
could theoretically influence the relative amount of bloodvolume passing the flow probe On
the other hand major advances are the possibility of chronic cardiac function measurements
and the relative facile manner of data acquirement(29) Moreover aortic flow probe
measurements are not hampered by deleterious cardiac remodeling in myocardial ischemia or
hypertrophy studies(2829)
The newly developed method of cardiac performance assessment by in vivo left
ventricular PV measurements in the CC model is introduced here Left ventricular PV
measurements in vivo provide an accurate assessment of murine cardiac function The method
is highly sensitive during open- and closed-chest approaches in determining alterations in left
ventricular function as result of cardiac disease or altered hemodynamic stress The
characteristics of simultaneous left ventricular pressure and volume measurements enable the
researcher to directly investigate pressure-related cardiac diseases as cardiac hypertrophy and
restrictive cardiomyopathy (31) or volume-related diseases as dilated cardiomyopathy (32)
Moreover the effective influence of both aspects of cardiac disease on each other can be
observed in detail For instance ventricular dilation and subsequent decrease in ventricular
systolic pressure is mapped accurately in PV-loops Continuous measurements provide
possibilities to investigate the complete cardiac cycle Basic aspects of cardiac physiology can
be visualized using PV-loops in mice (81533-35) For instance increase in ventricular filling
is followed by an increase in ejection fraction according to the Frank-Starling mechanism
Chapter 3 Murine left ventricular pressure-volume loops
29
The opposite is seen as a result of gradual venous return decrease in the case of transient caval
vein occlusion (figure 7 amp 9) Moreover the distinction between systolic and diastolic failure
can be made through continuous PV-measurements (19) Systolic heart failure encompasses
mainly an ejection dysfunction with impaired contractility Both aspects are obtained by and
directly visualized through PV-loops Additionally the definite diagnosis of diastolic failure
is dependent on the observation of an inappropriate upward shift of the (end-)diastolic PV
relationship requiring cardiac catheterization for continuous volume determinations using
impedance measurements and high-fidelity measurements of ventricular pressure with a
micromanometer (19) PV-loops are useful determining cardiac performance within the
complete continuum of healthy and diseased hearts
Chapter 3 Murine left ventricular pressure-volume loops
30
Conclusion
In vivo PV measurements provide an essential tool in the assessment of cardiac
function in genetically modified mice Open- and closed-chest surgical protocols for murine
cardiac function determination are sensitive reproducible and comparable PV-loops enable
the researcher to accurately investigate diverse murine models of cardiac pathology by
adequately visualizing the cause-and-effect relationship between genetic modification and
their functional outcome Changes in ventricular contractility are best detected by PV derived
parameters in comparison to other methods of cardiac function determination
Chapter 3 Murine left ventricular pressure-volume loops
31
References
1 Doevendans PA Daemen MJ de Muinck ED Smits JF Cardiovascular phenotypingin mice Cardiovasc Res 19983934-49
2 Hoit BD New approaches to phenotypic analysis in adult mice J Mol Cell Cardiol20013327-35
3 Chacko VP Aresta F Chacko SM Weiss RG MRIMRS assessment of in vivomurine cardiac metabolism morphology and function at physiological heart rates AmJ Physiol Heart Circ Physiol 2000279H2218-24
4 Tanaka N Dalton N Mao L et al Transthoracic echocardiography in models ofcardiac disease in the mouse Circulation 1996941109-17
5 De Windt LJ Willems J Reneman RS Van der Vusse GJ Arts T Van Bilsen M Animproved isolated left ventricular ejecting murine heart model Functional andmetabolic evaluation Pflugers Arch 1999437182-90
6 Palmen M Daemen MJ Buehler A et al Impaired cardiac remodeling and functionafter myocardial infarction in FGF-1 transgenic mice Circulation 1999100250
7 Rockman HA Hamilton RA Jones LR Milano CA Mao L Lefkowitz RJ Enhancedmyocardial relaxation in vivo in transgenic mice overexpressing the beta2-adrenergicreceptor is associated with reduced phospholamban protein J Clin Invest1996971618-23
8 Georgakopoulos D Mitzner WA Chen CH et al In vivo murine left ventricularpressure-volume relations by miniaturized conductance micromanometry Am JPhysiol 1998274H1416-22
9 Dekker AL Geskes GG Cramers AA et al Right ventricular support for off-pumpcoronary artery bypass grafting studied with bi-ventricular pressure-volume loops insheep Eur J Cardiothorac Surg 200119179-84
10 Schreuder JJ Steendijk P van der Veen FH et al Acute and short-term effects ofpartial left ventriculectomy in dilated cardiomyopathy assessment by pressure-volumeloops J Am Coll Cardiol 2000362104-14
11 Zimmer HG Measurement of left ventricular hemodynamic parameters in closed-chest rats under control and various pathophysiologic conditions Basic Res Cardiol19837877-84
12 Georgakopoulos D Kass DA Estimation of parallel conductance by dual-frequencyconductance catheter in mice Am J Physiol Heart Circ Physiol 2000279H443-50
13 Feldman MD Mao Y Valvano JW Pearce JA Freeman GL Development of amultifrequency conductance catheter-based system to determine LV function in miceAm J Physiol Heart Circ Physiol 2000279H1411-20
14 Kornet L Schreuder JJ Van de Velden ET Jansen JR The volume-dependency ofparallel conductance throughout the cardiac cycle and its consequence for volumeestimation of the left ventricle in patients Cardiovasc Res 200151729-35
15 Nemoto S DeFreitas G Mann DL Carabello BA Effects of changes in leftventricular contractility on indexes of contractility in mice Am J Physiol Heart CircPhysiol 2002283H2504-10
16 Baan J Van de Velden ET Steendijk P Ventricular pressure-volume relations in vivoEur Heart J 199213 SupplE2-6
17 Little WC Cheng CP Left ventricular-arterial coupling in conscious dogs Am JPhysiol 1991261H70-6
18 Sunagawa K Maughan WL Sagawa K Optimal arterial resistance for the maximalstroke work studied in isolated canine left ventricle Circ Res 198556586-95
Chapter 3 Murine left ventricular pressure-volume loops
32
19 Van Kraaij D Van Pol P Ruiters AW et al Diagnosing diastolic heart failure Eur JHeart Fail 20024419-30
20 Faunt KK Cohn LA Jones BD Dodam JR Cardiopulmonary effects of bilateralhemithorax ventilation and diagnostic thoracoscopy in dogs Am J Vet Res1998591494-8
21 Lips DJ Van Kraaij DL De Windt LJ Doevendans PA Molecular determinants ofmyocardial hypertrophy and failure alternative pathways for beneficial andmaladaptive hypertrophy Eur Heart J 200324883-96
22 Collins KA Korcarz CE Lang RM Use of echocardiography for the phenotypicassessment of genetically altered mice Physiol Genomics 200313227-39
23 Scherrer-Crosbie M Steudel W Hunziker PR et al Determination of right ventricularstructure and function in normoxic and hypoxic mice a transesophagealechocardiographic study Circulation 1998981015-21
24 Takuma S Suehiro K Cardinale C et al Anesthetic inhibition in ischemic andnonischemic murine heart comparison with conscious echocardiographic approachAm J Physiol Heart Circ Physiol 2001280H2364-70
25 Chaves AA Weinstein DM Bauer JA Non-invasive echocardiographic studies inmice influence of anesthetic regimen Life Sci 200169213-22
26 Yamaura G Turoczi T Yamamoto F Siddqui MA Maulik N Das DK STATsignaling in ischemic heart a role of STAT5A in ischemic preconditioning Am JPhysiol Heart Circ Physiol 2003285H476-82
27 Bell RM Yellon DM Atorvastatin administered at the onset of reperfusion andindependent of lipid lowering protects the myocardium by up-regulating a pro-survival pathway J Am Coll Cardiol 200341508-15
28 Aartsen WM Schuijt MP Danser AH Daemen MJ Smits JF The role of locallyexpressed angiotensin converting enzyme in cardiac remodeling after myocardialinfarction in mice Cardiovasc Res 200256205-13
29 Janssen B Debets J Leenders P Smits J Chronic measurement of cardiac output inconscious mice Am J Physiol Regul Integr Comp Physiol 2002282R928-35
30 Georgakopoulos D Christe ME Giewat M Seidman CM Seidman JG Kass DA Thepathogenesis of familial hypertrophic cardiomyopathy early and evolving effects froman alpha-cardiac myosin heavy chain missense mutation Nat Med 19995327-30
31 Liao P Georgakopoulos D Kovacs A et al The in vivo role of p38 MAP kinases incardiac remodeling and restrictive cardiomyopathy Proc Natl Acad Sci U S A20019812283-8
32 McConnell BK Jones KA Fatkin D et al Dilated cardiomyopathy in homozygousmyosin-binding protein-C mutant mice J Clin Invest 19991041235-44
33 Georgakopoulos D Kass DA Minimal force-frequency modulation of inotropy andrelaxation of in situ murine heart J Physiol 2001534535-45
34 Yang B Larson DF Watson R Age-related left ventricular function in the mouseanalysis based on in vivo pressure-volume relationships Am J Physiol1999277H1906-13
35 Reyes M Freeman GL Escobedo D Lee S Steinhelper ME Feldman MDEnhancement of contractility with sustained afterload in the intact murine heartblunting of length-dependent activation Circulation 20031072962-8
Chapter 3 Murine left ventricular pressure-volume loops
32
19 Van Kraaij D Van Pol P Ruiters AW et al Diagnosing diastolic heart failure Eur JHeart Fail 20024419-30
20 Faunt KK Cohn LA Jones BD Dodam JR Cardiopulmonary effects of bilateralhemithorax ventilation and diagnostic thoracoscopy in dogs Am J Vet Res1998591494-8
21 Lips DJ Van Kraaij DL De Windt LJ Doevendans PA Molecular determinants ofmyocardial hypertrophy and failure alternative pathways for beneficial andmaladaptive hypertrophy Eur Heart J 200324883-96
22 Collins KA Korcarz CE Lang RM Use of echocardiography for the phenotypicassessment of genetically altered mice Physiol Genomics 200313227-39
23 Scherrer-Crosbie M Steudel W Hunziker PR et al Determination of right ventricularstructure and function in normoxic and hypoxic mice a transesophagealechocardiographic study Circulation 1998981015-21
24 Takuma S Suehiro K Cardinale C et al Anesthetic inhibition in ischemic andnonischemic murine heart comparison with conscious echocardiographic approachAm J Physiol Heart Circ Physiol 2001280H2364-70
25 Chaves AA Weinstein DM Bauer JA Non-invasive echocardiographic studies inmice influence of anesthetic regimen Life Sci 200169213-22
26 Yamaura G Turoczi T Yamamoto F Siddqui MA Maulik N Das DK STATsignaling in ischemic heart a role of STAT5A in ischemic preconditioning Am JPhysiol Heart Circ Physiol 2003285H476-82
27 Bell RM Yellon DM Atorvastatin administered at the onset of reperfusion andindependent of lipid lowering protects the myocardium by up-regulating a pro-survival pathway J Am Coll Cardiol 200341508-15
28 Aartsen WM Schuijt MP Danser AH Daemen MJ Smits JF The role of locallyexpressed angiotensin converting enzyme in cardiac remodeling after myocardialinfarction in mice Cardiovasc Res 200256205-13
29 Janssen B Debets J Leenders P Smits J Chronic measurement of cardiac output inconscious mice Am J Physiol Regul Integr Comp Physiol 2002282R928-35
30 Georgakopoulos D Christe ME Giewat M Seidman CM Seidman JG Kass DA Thepathogenesis of familial hypertrophic cardiomyopathy early and evolving effects froman alpha-cardiac myosin heavy chain missense mutation Nat Med 19995327-30
31 Liao P Georgakopoulos D Kovacs A et al The in vivo role of p38 MAP kinases incardiac remodeling and restrictive cardiomyopathy Proc Natl Acad Sci U S A20019812283-8
32 McConnell BK Jones KA Fatkin D et al Dilated cardiomyopathy in homozygousmyosin-binding protein-C mutant mice J Clin Invest 19991041235-44
33 Georgakopoulos D Kass DA Minimal force-frequency modulation of inotropy andrelaxation of in situ murine heart J Physiol 2001534535-45
34 Yang B Larson DF Watson R Age-related left ventricular function in the mouseanalysis based on in vivo pressure-volume relationships Am J Physiol1999277H1906-13
35 Reyes M Freeman GL Escobedo D Lee S Steinhelper ME Feldman MDEnhancement of contractility with sustained afterload in the intact murine heartblunting of length-dependent activation Circulation 20031072962-8