CHAPTER 21 Independent Power Projects in Sub...
30
A t the beginning of the 1990s, virtually all major power generation providers in Sub-Saharan Africa were financed by public coffers, including concessionary loans from development finance institutions (DFIs). These publicly financed power generation assets were considered one of the core elements of state-owned, vertically integrated power systems. A confluence of fac- tors, however, brought about a significant change in the ensuing years. With insufficient public funds for new power generation and decades of poor performance by state-run utilities, African countries began to adopt a new model for their power systems, influenced by pioneering reformers in Chile, Norway, the United Kingdom, and the United States. 1 Urged on by multilateral and bilateral develop- ment institutions, which were withdrawing funding from state-owned projects, a number of countries adopted plans to unbundle their power systems and introduce pri- vate participation and competition. Independent power projects (IPPs)—privately financed, greenfield generation supported by nonrecourse or limited-recourse loans and with long-term power purchase agreements (PPAs) with the state utility or another off-taker—thus became a pri- ority in overall power sector reform (World Bank 1993; World Bank and USAID 1994). IPPs were considered a solution to persistent supply constraints, and they also 371 Independent Power Projects in Sub-Saharan Africa: Determinants of Success Anton Eberhard and Katharine Nawal Gratwick CHAPTER 21 had the potential to benchmark state-owned supply to gradually introduce competition (APEC Energy Working Group 1997). In 1994 Côte d’Ivoire became one of the first African countries to attract a foreign-led IPP to sell power to the national grid under long-term contracts with the state util- ity. Ghana, Kenya, Nigeria, Senegal, Tanzania, and Uganda, among others, opened their doors to foreign and local investors in their power sectors shortly thereafter. Although IPPs were considered part of larger power sec- tor reform programs in Sub-Saharan Africa, the reforms were not far-reaching. In most cases, state utilities remained vertically integrated and maintained a dominant share of the power generation market, while private investors were allowed to operate only on the margin of the sector. 2 Policy frameworks and regulatory regimes, necessary to maintain a competitive environment, were limited. International com- petitive bids (ICBs) for IPPs were often not conducted because of tight time frames, resulting in limited competi- tion for the market and, because of the long-term PPAs, no competition in the market. These long-term PPAs, along with government guarantees and security arrangements such as escrows and liquidity facilities, exposed countries to significant exchange rate risks. Finally, while Africa has seen continued private participation in greenfield electricity proj- ects, that progress has been erratic, with 2007 representing Anton Eberhard is a professor and Katharine Nawal Gratwick is a PhD graduate at the University of Cape Town Graduate School of Business.
Transcript of CHAPTER 21 Independent Power Projects in Sub...

At the beginning of the 1990s, virtually all majorpower generation providers in Sub-SaharanAfrica were financed by public coffers, including
concessionary loans from development finance institutions(DFIs). These publicly financed power generation assetswere considered one of the core elements of state-owned,vertically integrated power systems. A confluence of fac-tors, however, brought about a significant change in theensuing years.
With insufficient public funds for new power generationand decades of poor performance by state-run utilities,African countries began to adopt a new model for theirpower systems, influenced by pioneering reformers inChile, Norway, the United Kingdom, and the UnitedStates.1 Urged on by multilateral and bilateral develop-ment institutions, which were withdrawing funding fromstate-owned projects, a number of countries adoptedplans to unbundle their power systems and introduce pri-vate participation and competition. Independent powerprojects (IPPs)—privately financed, greenfield generationsupported by nonrecourse or limited-recourse loans andwith long-term power purchase agreements (PPAs) withthe state utility or another off-taker—thus became a pri-ority in overall power sector reform (World Bank 1993;World Bank and USAID 1994). IPPs were considered asolution to persistent supply constraints, and they also
371
Independent Power Projects in Sub-Saharan Africa: Determinants of SuccessAnton Eberhard and Katharine Nawal Gratwick
C H A P T E R 2 1
had the potential to benchmark state-owned supply togradually introduce competition (APEC Energy WorkingGroup 1997).
In 1994 Côte d’Ivoire became one of the first Africancountries to attract a foreign-led IPP to sell power to thenational grid under long-term contracts with the state util-ity. Ghana, Kenya, Nigeria, Senegal, Tanzania, and Uganda,among others, opened their doors to foreign and localinvestors in their power sectors shortly thereafter.
Although IPPs were considered part of larger power sec-tor reform programs in Sub-Saharan Africa, the reformswere not far-reaching. In most cases, state utilities remainedvertically integrated and maintained a dominant share ofthe power generation market, while private investors wereallowed to operate only on the margin of the sector.2 Policyframeworks and regulatory regimes, necessary to maintain acompetitive environment, were limited. International com-petitive bids (ICBs) for IPPs were often not conductedbecause of tight time frames, resulting in limited competi-tion for the market and, because of the long-term PPAs, nocompetition in the market. These long-term PPAs, alongwith government guarantees and security arrangementssuch as escrows and liquidity facilities, exposed countries tosignificant exchange rate risks. Finally, while Africa has seencontinued private participation in greenfield electricity proj-ects, that progress has been erratic, with 2007 representing
Anton Eberhard is a professor and Katharine Nawal Gratwick is a PhD graduate at the University of Cape Town Graduate School of Business.

the zenith, largely because of the financial close of one largeproject, Bujagali.
Several factors explain the recent trends in investmentin Africa’s power sector. First, private sector firms weredeeply affected by the Asian and subsequent Latin Ameri-can financial crises in the late 1990s and early 2000s. TheEnron collapse and its aftershocks also influenced U.S.-and European-based firms to reduce risk exposure indeveloping-country markets and to refocus on core activi-ties at home. The financial crisis of 2008 and 2009 has alsohad a toll. Furthermore, DFIs began to reconsider theirposition of restricted infrastructure investment, a modelthat was predominant throughout the 1990s.3 As conces-sionary funding became available again, many countriesopted for a hybrid solution—part public, part private.Kenya represents one of the clearest examples of such ahybrid, with KenGen, the state-owned generator, buildingalongside IPPs, with support from DFIs.
Despite this revival of concessionary lending, powersector investments have been insufficient in addressingSub-Saharan Africa’s power needs. Only 25 percent of thepopulation currently has access to electricity, and poorsupply is the rule, not the exception. The cost of meetingAfrica’s power sector needs is estimated at $40.8 billion peryear, equivalent to 6.35 percent of Africa’s 2005 grossdomestic product (GDP). Approximately two-thirds of thespending needed is for capital investment ($26.7 billionper year), and the remainder for operations and mainte-nance (O&M). Current spending on power infrastructuretotals approximately $11.6 billion per year. Approximately80 percent of existing spending is domestically sourcedfrom taxes or user charges. The remainder is split amongofficial development assistance (ODA) financing (6 percentof the total); other sources, mainly China (9 percent); andprivate sector investment (4 percent). Tackling existing util-ity inefficiencies, including system losses, underpricing,undercollection of revenue, and overstaffing, would makean additional $8.24 billion available, but a funding gap ofabout $21 billion would still remain (Eberhard andShkaratan 2010).
Closing Africa’s power infrastructure funding gapinevitably requires undertaking reforms to reduce or elimi-nate system inefficiencies. This will help existing resourcesgo farther and create a more attractive investment climatefor external and private finance, which still has growthpotential. With the original drivers for market reform stillpresent, future private sector involvement appears inevitable.
Approximately 20 grid-connected IPPs, each in excess of40 megawatts (MW) and with long-term PPAs with the
largely state-run utilities, have been developed in Sub-Saharan Africa as of early 2010 (table 21.1). In total, aboutfour gigawatts (GW) of IPP capacity has been added. Withfew exceptions,4 these IPPs represent a small fraction oftotal power generation capacity and have mostly comple-mented incumbent state-owned utilities.
Nevertheless, IPPs are an important source of newinvestment in the power sector in a number of Africancountries. In Togo, for example, Centrale Thermique deLomé, the country’s first IPP, will triple the country’sinstalled capacity.
The majority of IPP contracts in Sub-Saharan Africahave been upheld (namely, CIPREL and Azito in Côted’Ivoire, Takoradi II in Ghana, Iberafrica, Tsavo, OrPower 4,and Rabai in Kenya, Afam VI and Aba Integrated in Nigeria,and Namanve in Uganda). Although the contracts of thetwo Senegalese projects, GTi Dakar and Kounoune I, remainlargely intact, there are reports of changes in fuel supplyarrangements. A number of other IPPs, such as Bui Hydroin Ghana, Bujagali in Uganda, and Centrale Thermique deLomé in Togo, have reached financial closure and are underconstruction.5 Kenya is in the process of negotiating threemore IPPs after an international competitive tender.
For all of this progress, however, there have been sev-eral high-profile IPP mishaps in Sub-Saharan Africa. Twoprojects—AES Barge in Nigeria and Independent PowerTanzania Limited (IPTL) in Tanzania—are in arbitration.The costs of Songas, in Tanzania, meanwhile, haveescalated as a result of the unplanned, and later disputed,contracting of IPTL; Songas’s capacity charges were laterreduced after the government agreed to buy down theaccumulated allowance for funds used during constructioncosts. A dispute about escalating investment costs alsomarked the Okpai project in Nigeria. In Kenya changesmay be made in the contracts of OrPower 4, whichreduced its tariff for the second phase of the plant.Another Kenyan project, Westmont, had an initial seven-year contract that was not renewed. The other early IPP inKenya, IberAfrica, had its contract renewed but withmuch lower capacity charges.
Following contract changes, IPPs have generally gone onto make a significant contribution to the countries’ powergeneration—the main exceptions being Westmont, whichceased operation, and IPTL, which has operated intermit-tently during its arbitration proceedings. Another high-profile failure was the nontransparent procurement processsurrrounding the Richmond/Dowans plant in Tanzania,which has not been allowed to operate since corruptioncharges were filed. Furthermore, there is evidence of stalling
372 CHAPTER 21: INDEPENDENT POWER PROJECTS IN SUB-SAHARAN AFRICA: DETERMINANTS OF SUCCESS

373
Tabl
e 21
.1G
ener
al P
roje
ct S
peci
ficat
ions
of S
ub-S
ahar
an A
fric
an IP
P Pr
ojec
ts
Co
untr
y/pr
oje
ctS
ize
(MW
)F
uel/c
ycle
Co
ntra
ct t
ype
Len
gth
of
cont
ract
(ye
ars)
Pro
ject
ten
der
Co
mm
erci
alo
pera
ting
dat
a
Eas
t A
fric
aK
enya
Wes
tmon
t46
Ker
osen
e/ga
s co
nden
sate
/gas
Tur
bine
(ba
rge-
mou
nted
)BO
O7
1996
1997
Iber
afri
ca10
9aH
FO/m
ediu
m-s
peed
die
sel e
ngin
eBO
O7/
15/2
519
96,1
999,
2008
1997
,200
0,20
09O
rPow
er 4
48G
eoth
erm
alBO
O20
1996
2000
,200
9T
savo
75H
FO/m
ediu
m-s
peed
die
sel e
ngin
eBO
O20
1995
2001
Rab
ai90
HFO
BOO
T20
2006
2009
Tanz
ania
IPT
L10
0H
FO/m
ediu
m-s
peed
die
sel e
ngin
eBO
O20
1997
1998
Song
as18
0N
atga
s/op
en c
ycle
BOO
2019
9420
04U
gand
aN
aman
ve
50H
FOBO
OT
6—
2008
Buja
gali
250
Hyd
roBO
T30
2005
b—
Wes
t A
fric
aC
ôte
d’Iv
oire
CIP
REL
210
Nat
gas/
open
cyc
leBO
OT
1919
9319
95A
zito
288c
Nat
gas/
open
cyc
leBO
OT
2419
9620
00G
hana
Tako
radi
II22
0dLi
ght
crud
e/si
ngle
cyc
leBO
OT
2519
9820
00Su
non
Aso
gli
200
Com
bust
ion
engi
neBO
O20
2007
—
Bui H
ydro
e40
0H
ydro
BOO
—20
05—
Nig
eria
AES
Bar
ge27
0N
atga
s/op
en c
ycle
(ba
rge-
mou
nted
)BO
O20
(2
part
s)19
9920
01O
kpai
450
Nat
gas/
com
bine
d cy
cle
BOO
2020
0120
05A
fam
VI
630
Nat
gas/
com
bine
d cy
cle
BOO
2020
0020
07
Aba
Inte
grat
edf
140
Nat
gas/
open
-cyc
le
BOO
20/1
520
05—
Sene
gal
GT
i Dak
ar
52D
iese
l/Naf
taBO
OT
1519
9619
99K
ouno
une
I 68
HFO
BOO
1520
0320
08To
go Cen
tral
e T
herm
ique
de
Lom
é10
0Tr
iple
fuel
(na
tgas
/HFO
/die
sel)
BOO
T25
—20
10
Sour
ce:A
uth
ors.
Not
e:P
roje
cts
incl
ud
ed h
ere
are
grea
ter
than
40
MW
;hav
e re
ach
ed fi
nan
cial
clo
se;a
nd
are
un
der
con
stru
ctio
n,o
per
atio
nal
,or
con
clu
ded
.BO
O =
bu
ild
-ow
n-o
per
ate
con
trac
t;B
OO
T =
bu
ild
-ow
n-
oper
ate-
tran
sfer
con
trac
t;H
FO =
Hea
vy f
uel
oil
.— =
Not
ava
ilab
le.
a.Ib
eraf
rica
has
bee
n d
evel
oped
in t
hre
e st
ages
,wit
h 4
4,12
an
d 52
.3 M
W,t
otal
ing
109
MW
at
tim
e of
wri
tin
g.b.
Th
e fi
rst
phas
e of
Bu
jaga
li’s
con
cept
ual
izat
ion
,spa
nn
ing
the
mid
-199
0s u
nti
l 200
3 an
d in
volv
ing
AE
S,is
not
cov
ered
in
th
is a
rtic
le.I
t sh
ould
be
not
ed t
hat
th
e pr
ojec
t di
d n
ot r
each
fin
anci
al c
lose
duri
ng
this
tim
e.A
uth
ors
repo
rt o
nly
on
th
e pr
ojec
t fr
om it
s se
con
d ph
ase,
star
tin
g in
200
5.c.
Th
e in
itia
l pro
ject
con
cept
incl
ude
d sp
ecif
icat
ion
s to
rai
se c
apac
ity
to 4
20 M
W.
d.A
lth
ough
th
e in
itia
l pro
ject
con
cept
incl
ude
d sp
ecif
icat
ion
s to
add
a s
econ
d ph
ase
of11
0 M
W a
nd
conv
ert
to c
ombi
ned
cyc
le,l
ack
offu
ndi
ng
has
lim
ited
th
e co
mpl
etio
n o
fth
is p
has
e.e.
Th
e B
ui
proj
ect
was
in
itia
ted
in t
he
1960
s bu
t ab
orte
d af
ter
the
cou
p in
Gh
ana
in 1
966.
Th
e pr
ojec
t w
as r
econ
side
red
seve
ral t
imes
in
th
e de
cade
s th
at f
ollo
wed
.In
200
5 th
e go
vern
men
t of
Gh
ana
sign
ed a
mem
oran
dum
of
un
ders
tan
din
g w
ith
th
e C
hin
ese
firm
Sin
o H
ydro
,an
d th
e pl
ant
is e
xpec
ted
to b
e on
line
in 2
012.
f.A
ba I
nte
grat
ed is
pri
vate
ly f
inan
ced
but
is n
ot a
cla
ssic
IP
P in
th
at o
wn
ersh
ip w
ill e
xten
d to
th
e of
f-ta
ker.

in Takoradi II’s second phase and in Sunon Asogli, which asof early 2010 had no gas supply—although efforts to rectifythis situation are under way.
COUNTRY-LEVEL FACTORS AFFECTING THE IPP MARKET
Several elements have contributed to the success of IPPprojects in Sub-Saharan Africa: a favorable investment cli-mate; new policy frameworks and regulation; the linking ofplanning, procurement, and contracting; and low-cost fueland secure fuel contracts.
Favorable investment climate
Even though a investment climate is not the only factor ininfluencing IPP outcomes, it sets the stage for negotia-tions and contract terms and helps explain the initialimbalance in some of the Sub-Saharan African cases. Hostcountries with a strong investment profile attracted moreinvestors and ultimately were able to negotiate deals withmore favorable terms than countries with weak invest-ment conditions. Because all countries and entities com-pete for capital, a risk-reward balance needs to be offeredthat will attract investors and lenders. That “balance”starts with a stable and predictable investment environ-ment (Rudo 2010a).
Of the Sub-Saharan countries whose IPPs are examinedin this chapter, none has an investment-grade sovereigncredit rating. Of the five countries that have received a spec-ulative rating (Ghana, Kenya, Nigeria, Senegal, and Uganda),all except Ghana received their rating after the first IPPdeals were signed. Kenya’s investment climate was defined, atthe time, by its aid embargo in the mid-1990s. Tanzania is alsoworth mentioning in this context. Throughout the 1990s, allexport credit agencies were off-cover in Tanzania. Foreigncommercial banks were not willing to lend, because therewas no track record of successful repayment of commercialloans. Consequently, traditional, project-financed IPP dealsin this climate were limited. In contrast in North Africa, theArab Republic of Egypt, Morocco, and Tunisia have allattained either a credit rating of investment grade or onenotch below and have experienced successful IPPs(Gratwick and Eberhard 2008a). While credit enhance-ments and security arrangements have differed broadlybetween North and Sub-Saharan Africa, interestingly,incentives offered to investors in IPPs were relatively similarin both regions, though there was some variety with regardto tax breaks. For instance, nearly all projects appear to have
benefited from both customs and value added tax (VAT)exemptions during construction, as well as the right to fullrepatriation of profits. Currency conversion was also pro-vided for virtually all projects. In East Africa, Tanzania pro-vided a tax holiday of five years, but Kenya extended thisbenefit only until plants were commissioned. Althoughone would expect investment incentives to increase withperceived risk, such a pattern is not apparent.
New policy frameworks and regulation
While all eight Sub-Saharan African countries examined inthis chapter have introduced legislation allowing for pri-vate sector power generation, few have actually formulatedand implemented a clear and coherent policy frameworkfor procuring IPPs. Thus, there is abundant evidence oftentative experimentation with private power that doesnot always lead to a sustained opening of the market forprivate investment. Furthermore, long-term power pur-chase agreements have the potential to constrain futurewholesale competition, although means to transition towholesale competition with IPPs have been identified(Woolf and Halpern 2001). In addition, state-owned utili-ties are rarely exposed to market costs of capital, and directcomparisons of state-owned utilities’ costs and IPPs’ costsare often difficult to discern.
The standard reform model for power sector reform—namely, unbundling of generation, transmission, and dis-tribution; as well as the introduction of competition andprivate-sector participation at both the generation anddistribution level—is not being fully adopted anywhere inSub-Saharan Africa (UNEP and UNECA 2006; Malgras,Gratwick, and Eberhard 2007a; Gratwick and Eberhard2008b). Most incumbent national utilities are state-owned6
and in a dominant position. However, elements of thereform model have been adopted: for example, Kenya hasunbundled power generation from its national transmissionand distribution utility; Uganda and Ghana have unbun-dled generation, transmission, and distribution; andUganda and Côte d’Ivoire have introduced private conces-sions. The private sector has also invested in IPPs in manycountries. In general, there has been competition for themarket, but not ongoing competition in the market interms of customer choice. In effect, hybrid power marketshave emerged across Africa, and in other developingregions. As such, the incumbent state-owned utility typi-cally continues to play a key role in the sector, but becauseof inefficiencies and inadequate investment resources, IPPsare gradually being introduced. These hybrid power
374 CHAPTER 21: INDEPENDENT POWER PROJECTS IN SUB-SAHARAN AFRICA: DETERMINANTS OF SUCCESS

markets are giving rise to new challenges that need explicitattention if private investment is to be accelerated.
In addition to introducing legislation allowing for pri-vate power generation, the eight countries examined in thischapter also have established independent regulators. InKenya the presence of the regulator, together with the adop-tion of International Competition in Bidding (ICB) prac-tices, helped reduce PPA charges radically between the firstset of IPPs and the second. A similar trend may be observedin Senegal, where the first IPP (GTi Dakar) was not overseenby the independent regulatory body and the second (Kou-noune I) was (Regulatory Commission of Senegal 2010; IFC2010b). Kenya’s Energy Regulatory Commission (ERC) hasalso been instrumental in helping set tariffs and manage theoverall interface between private and public sectors. InUganda sponsors note the benefits of having the regulatorinvolved from project inception, particularly in helping toincrease overall transparency, especially in the case ofBujagali. An ERC staff member affirms that the commis-sion’s “presence has helped to focus minds on the require-ments for setting up power supply projects so that investorscoming in are clear of what is expected of them from thebeginning and hence align their bids to these require-ments. As a result, we have increasing numbers of investorsapplying to set up IPP projects” (ERC 2010a).
In Côte d’Ivoire, Ghana, Nigeria, and Tanzania, however,regulatory agencies have come into force only after IPPshave been negotiated, and as yet the agencies have had littleimpact on new investment. In general, the mere presence ofa regulator does not appear to be a defining factor in attract-ing IPPs. An independent regulator may have positive, neg-ative, or no impact on IPP outcomes. If, however, regulatorygovernance is transparent, fair, and accountable, and if reg-ulatory decisions are credible and predictable, there isgreater potential for positive outcomes for both the hostcountry and investor alike. Evidence also suggests that effec-tive regulatory oversight may lead to a reduction in thestated capital costs of projects and improved efficiency forselectively bid projects (Phadke 2007; Eberhard andShkaratan 2010).7
In Nigeria and Tanzania efforts have been made toexploit stranded gas as part of the IPP program.8 In Nigeriaa reduction in gas flaring is central to the push for gas-firedpower, while in Tanzania the IPP program commercializedpreviously stranded (although not flared) gas throughSongas and Mtwara (a small private concession in the southof the country). Although these two countries have a dis-tinct set of challenges,9 in general the larger policy of involv-ing stranded gas has insulated projects from intense public
scrutiny, with project sponsors and policy makers alike ableto point to the benefits of the commercialized gas and thereduction in fuel imports.
Finally, DFIs are behind many countries’ power sectorpolicy frameworks; notably the World Bank has had a handin nearly all power sector reform programs in Africa. DFIshave been particularly instrumental in advancing privatesector participation in generation. And as many of thosesame institutions began reconsidering publicly fundedinfrastructure investments at the end of the 1990s, coun-tries’ policies have followed—from state to market and backagain, albeit with some changes to accommodate the morehybrid market that has emerged.
Linking planning, procurement, and contracting
Intricately connected to sound policy frameworks arecoherent power sector plans. Ideally, planning, procure-ment, and contracting follow from sound policy frame-works and include a number of core components: setting areliability standard for energy security, completion ofdetailed supply and demand forecasts, development of aleast-cost plan with alternative scenarios, clarification ofhow new generation production will be split between theprivate and public sectors, and identification of requisitebidding and procurement processes for new projects. Oneimportant aspect of coherent power sector planning is vest-ing planning and procurement in one empowered agency toensure that implementation takes place with minimalmishaps (Eberhard and Malgas forthcoming).
While that planning and procurement arrangement maybe ideal, the reality is often quite different. As one stakeholderat Ghana’s Public Utilities Regulatory Commission (PURC)notes about the recent past, “A crisis arises, and everybodypanics; anybody who comes in [to propose generation] islistened to” (PURC 2010). Indeed, in the eight countriesexamined here, there have been several noteworthy plan-ning mishaps that subsequently affected procurement andcontracting. In some cases, demand and supply were notbeing accurately forecast partly because of weather condi-tions such as extended droughts, which in turn necessitatedfast-tracking IPPs—that is, plans for IPPs were spedthrough to meet immediate power shortages. The firsttwo plants in Kenya (Westmont and Iberafrica), the firstplant in Nigeria (AES Barge), and Ghana’s Takoradi II IPPwere all negotiated during drought conditions. Althoughboth the Westmont and Iberafrica plants came onlinewithin 11 months, they were later investigated for suspiciousbidding practices and what were perceived as unnecessarily
CHAPTER 21: INDEPENDENT POWER PROJECTS IN SUB-SAHARAN AFRICA: DETERMINANTS OF SUCCESS 375

expensive charges. Furthermore, public stakeholders’unwillingness to make concessions over a tariff resulted inWestmont not securing a second PPA. The AES Barge proj-ect in Nigeria took nearly two years to come online becauseof a renegotiation of the PPA, despite the project beingfast-tracked. In Ghana, no agreement was reached over thesecond phase of the Takoradi II project.
Inability to estimate demand and supply accurately or toset a clear reliability standard has also led to several cases inwhich emergency power units needed to be leased for one totwo years with the purpose of plugging a short-term crisis.In 2009 approximately 750 MW of emergency power was inoperation in Sub-Saharan Africa (Foster and Briceno-Garmendia 2010). The governments of Ghana, Kenya,Tanzania, and Uganda all have been forced to addressdrought and black-outs in recent years, often turning toemergency power suppliers (see box 21.1 for an example).Kenya harnessed 100 MW of emergency power twice: in1999, 2000, and 2001, and again in 2006 (supplied by Aggreko,Cummins, and Deutz in the first instance and Aggreko alonein the second). In 2007 Aggreko’s contract was extended foran additional two years, and in 2009 Aggreko was selected toprovide a further 140 MW for a total of 250 MW of emer-gency power.10 In Ghana emergency power was instrumentalin reducing the impact of the 1998 drought, but as droughtconditions reversed, the state failed to honor its contractswith SIIF Accra; as of 2007 those contracts were still in dis-pute. The cost of emergency power, at approximately 30 to40 cents a kilowatt hour (kWh), is high (IFC 2005). Tanzania,for example, has estimated that it saves around $1 for everykWh of outage averted (or about 5 to 10 times the ordinarycost of generating electricity).11
Competitive International Bidding Practices.Although it is easy, in hindsight, to accuse IPP stakehold-ers of acting imprudently in the face of emergencies, theactual conditions of load-shedding and shortages in thepower sector appear to have provided few alternatives. Twostudies highlight the importance of the international com-petition in bidding practices in reducing up to 60 percentof the capital cost of plants (Deloitte Touche TohmatsuEmerging Markets Ltd. and Advanced Engineering Associ-ates International 2003; Phadke 2007). There is also evi-dence for selective bidding proving effective in certaininstances, provided there is regulatory scrutiny. Of the 21IPPs examined here, ICBs are known to have been con-ducted for nine. Six of the projects in East Africa (OrPower4, Tsavo, Rabai, Songas, Namanve, and Bujagali) con-formed to these bidding practices, as did three projects in
West Africa (Azito, GTi Dakar, and Kounoune I). Of theprojects examined here that have faced renegotiation, fourwere not bid through an ICB (IPTL, Iberafrica, AES Barge,and Okpai); the two exceptions were Songas and OrPower4. Absence of regulatory scrutiny is also noteworthy ineach of these four projects. Furthermore, Westmont,which was selectively bid, quit the country after its firstseven-year PPA expired. Other non-ICB projects have alsoencountered difficulties. For example, Ghana’s Takoradi IIhas not been able to raise financing for the second phase ofthe plant. Although reasons for these stumbling blocksmay be traced well beyond the presence or absence of anICB, the correlation is nonetheless revealing.
Furthermore, the success of the ICB process is intricatelylinked to the number of bids received, with more bidding
376 CHAPTER 21: INDEPENDENT POWER PROJECTS IN SUB-SAHARAN AFRICA: DETERMINANTS OF SUCCESS
The quick and obscure process through which IPTL(Tanzania) was negotiated resulted in the highest-profile IPP mishap on the continent to date. Theproject’s total investment costs were estimated at$150 million ($163 million including fuel conver-sion), an amount the government and the WorldBank later argued was inflated by 40 percent. Thisdispute led to a three-year arbitration process duringwhich another project in Tanzania, the Songo Songogas-to-electricity project, was also put on hold,mainly through pressure from the World Bank, itslargest donor, because of alleged corruption.Although the IPTL arbitration reduced its estimatedcosts it was still well above the price the governmentsought to pay. In addition, since both IPPs wereunavailable until 2002 and 2004 respectively, the statehad to negotiate with another company, Rich-mond/Dowans, for emergency power, a contract thatcame with its own inflated costs and controversies.Furthermore, because of the delays, Songo Songoaccumulated $100 million in interest charges onowner’s equity.
In this project, critical planning elements are miss-ing, namely, a clear reliability standard, an accuratedemand and supply forecast, a detailed plan for pri-vately powered and publicly powered generation, and,most important, timely initiation of procurement andeffective conclusion of contracts.
Source: Authors.
Box 21.1 Poor Planning Led to Significant Delaysfor Tanzania’s Projects

driving down prices,12 as evidenced by IPPs in North Africa,where the number of bids submitted to ICBs has been gen-erally double to triple those submitted to ICBs in East andWest Africa. That said, the time and cost required to com-plete an international competitive bid should not be under-estimated. In Sub-Saharan Africa, drought-related energycrises are often cited as the reason why ICBs have not beenpursued. In Togo, for example, the drought conditions of2006 prompted a move to discontinue a rehabilitate-own-transfer contract with Electro Togo to manage the Centralethermique de Lomé. Rather than launching an ICB, the gov-ernment chose to negotiate directly with an existing player,Contour Global, which was already in discussions with theutility. In this case, time and project familiarity proved moreimportant than complying with international bidding prac-tices, which risked extending the project development time-line (Ministry of Energy of Togo 2010).13
The reason for these planning and contracting mishapsseems to lie in the changing nature of power marketsacross Africa and other developing regions. In addition, aspower markets continue to include private sector partici-pation, it is not always clear who has responsibility formaintaining security of supply. Often, the planning func-tion is shifted from the state-owned utility company tothe energy ministry, which does not have the capacity,resources, or experience to undertake detailed power sectorplanning. Alternatively, planning is contracted to consult-ants who produce master plans that quickly becomeoutdated as global equipment, fuel costs, and other keyparameters change (Eberhard and Malgas forthcoming).Absence of regulatory control and institutional capacity isevident in more areas than just planning. In manyinstances, there are no clear criteria for allocating powerplant building opportunities to either the incumbentstate-owned utility or the private sector.
Often, it is not clear whether plans are merely indicative,whether unsolicited proposals may be considered, orwhether plans have legal force in determining which plantsthe regulator may license. Too often, plans do not translateinto timely initiation of competitive bid processes for newplants. Similarly, there is often insufficient capacity to nego-tiate with winning bidders or to conclude sustainable con-tracts. Transaction advisers may be appointed, but oftenthere is little continuity and the overall policy framework islacking information about security packages or creditenhancement measures being offered by government.Despite past planning deficiencies and forced reliance onemergency power generation, Kenya provides an interestingrecent example in which progress is being made in dealing
with these planning, procurement, and contracting chal-lenges (box 21.2).
Abundant, low-cost fuel and secure fuel contracts
The availability of competitively priced fuel supplies hasalso emerged as a key factor in how IPPs are perceived andultimately whether there is public appetite for such projects,in large part because fuel is generally a pass-through cost tothe utility and, in many cases, also to the final consumer.Thus, if the IPP uses a different fuel than other plants, andif that fuel is more expensive, there is greater potential fordisputes surrounding the new project.
In several Sub-Saharan African countries—Ghana, Kenya,Senegal, Tanzania, and Togo—low-priced hydropower wasthe dominant fuel source for power production, but IPPswere thermal powered, using a combination of imported fuel
CHAPTER 21: INDEPENDENT POWER PROJECTS IN SUB-SAHARAN AFRICA: DETERMINANTS OF SUCCESS 377
Box 21.2 Planning, Procurement, and ContractingChallenges in Kenya
Recognizing that it does not have the internal capacity,resources, or planning tools to develop detailed andup-to-date electricity plans, Kenya’s Energy RegulatoryCommission (ERC) has delegated this function to theKenya Power and Light Company (KPLC), guided by agovernment committee chaired by the ERC. KPLCceased being an electricity-generating company in1997, and thus has a neutral stance between the stateutility, Kenya Electricity Generating Company(KenGen), on one hand and private IPPs on theother. KPLC has also been assigned responsibilityfor managing the procurement and contractingprocess for IPPs. As described by one project sponsorin Kenya, commenting in May 2010,“Kenya has an IPPstructure that is working. It has a track record. It canstructure new projects based on experience gainedfrom previous projects. And it has a very capable set ofteams working in KPLC, the Ministry of Energy/Finance and KenGen. It understands project financeand is not surprised when a developer requests a com-fort letter, as one example.” The fruits of this approachare evident. Kenya is about to add three new IPPs to itsexisting five, maintaining its lead position in Sub-Saharan Africa in terms of IPP investments.a
a. Kenya also has been cited by public stakeholders in Ghanaand Tanzania as having processes that should be emulated(PURC 2010; EWURA 2010).
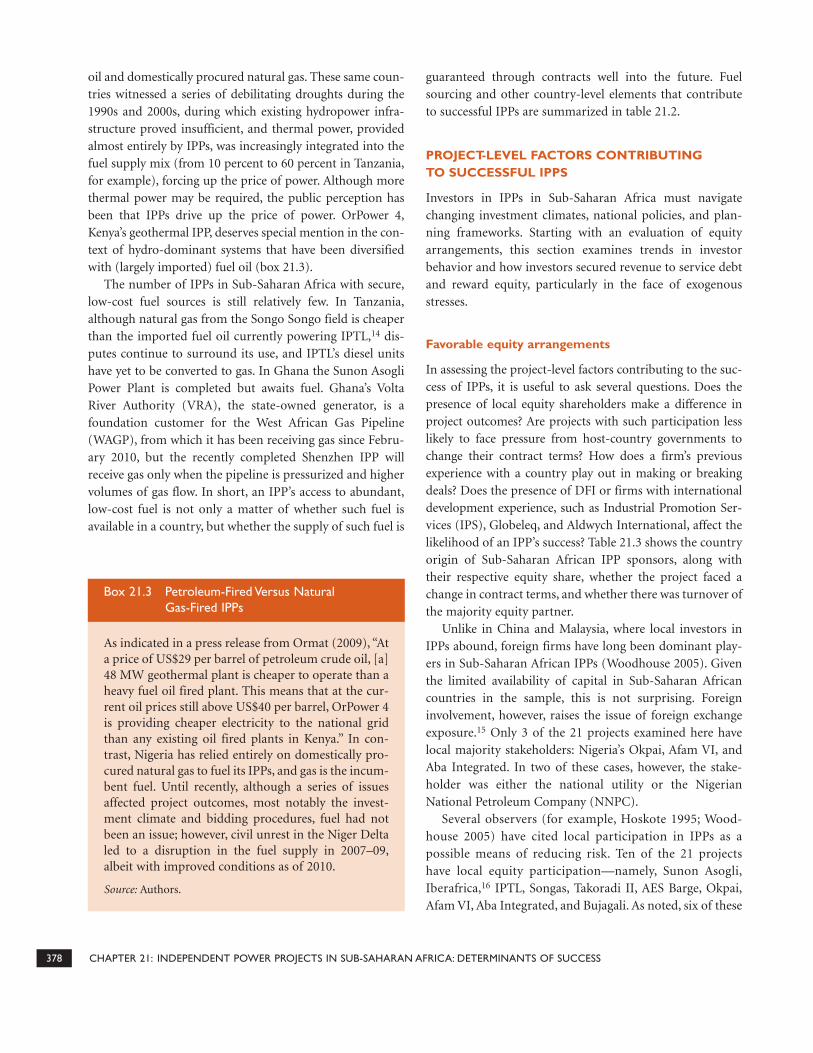
oil and domestically procured natural gas. These same coun-tries witnessed a series of debilitating droughts during the1990s and 2000s, during which existing hydropower infra-structure proved insufficient, and thermal power, providedalmost entirely by IPPs, was increasingly integrated into thefuel supply mix (from 10 percent to 60 percent in Tanzania,for example), forcing up the price of power. Although morethermal power may be required, the public perception hasbeen that IPPs drive up the price of power. OrPower 4,Kenya’s geothermal IPP, deserves special mention in the con-text of hydro-dominant systems that have been diversifiedwith (largely imported) fuel oil (box 21.3).
The number of IPPs in Sub-Saharan Africa with secure,low-cost fuel sources is still relatively few. In Tanzania,although natural gas from the Songo Songo field is cheaperthan the imported fuel oil currently powering IPTL,14 dis-putes continue to surround its use, and IPTL’s diesel unitshave yet to be converted to gas. In Ghana the Sunon AsogliPower Plant is completed but awaits fuel. Ghana’s VoltaRiver Authority (VRA), the state-owned generator, is afoundation customer for the West African Gas Pipeline(WAGP), from which it has been receiving gas since Febru-ary 2010, but the recently completed Shenzhen IPP willreceive gas only when the pipeline is pressurized and highervolumes of gas flow. In short, an IPP’s access to abundant,low-cost fuel is not only a matter of whether such fuel isavailable in a country, but whether the supply of such fuel is
guaranteed through contracts well into the future. Fuelsourcing and other country-level elements that contributeto successful IPPs are summarized in table 21.2.
PROJECT-LEVEL FACTORS CONTRIBUTING TO SUCCESSFUL IPPS
Investors in IPPs in Sub-Saharan Africa must navigatechanging investment climates, national policies, and plan-ning frameworks. Starting with an evaluation of equityarrangements, this section examines trends in investorbehavior and how investors secured revenue to service debtand reward equity, particularly in the face of exogenousstresses.
Favorable equity arrangements
In assessing the project-level factors contributing to the suc-cess of IPPs, it is useful to ask several questions. Does thepresence of local equity shareholders make a difference inproject outcomes? Are projects with such participation lesslikely to face pressure from host-country governments tochange their contract terms? How does a firm’s previousexperience with a country play out in making or breakingdeals? Does the presence of DFI or firms with internationaldevelopment experience, such as Industrial Promotion Ser-vices (IPS), Globeleq, and Aldwych International, affect thelikelihood of an IPP’s success? Table 21.3 shows the countryorigin of Sub-Saharan African IPP sponsors, along withtheir respective equity share, whether the project faced achange in contract terms, and whether there was turnover ofthe majority equity partner.
Unlike in China and Malaysia, where local investors inIPPs abound, foreign firms have long been dominant play-ers in Sub-Saharan African IPPs (Woodhouse 2005). Giventhe limited availability of capital in Sub-Saharan Africancountries in the sample, this is not surprising. Foreigninvolvement, however, raises the issue of foreign exchangeexposure.15 Only 3 of the 21 projects examined here havelocal majority stakeholders: Nigeria’s Okpai, Afam VI, andAba Integrated. In two of these cases, however, the stake-holder was either the national utility or the NigerianNational Petroleum Company (NNPC).
Several observers (for example, Hoskote 1995; Wood-house 2005) have cited local participation in IPPs as apossible means of reducing risk. Ten of the 21 projectshave local equity participation—namely, Sunon Asogli,Iberafrica,16 IPTL, Songas, Takoradi II, AES Barge, Okpai,Afam VI, Aba Integrated, and Bujagali. As noted, six of these
378 CHAPTER 21: INDEPENDENT POWER PROJECTS IN SUB-SAHARAN AFRICA: DETERMINANTS OF SUCCESS
As indicated in a press release from Ormat (2009), “Ata price of US$29 per barrel of petroleum crude oil, [a]48 MW geothermal plant is cheaper to operate than aheavy fuel oil fired plant. This means that at the cur-rent oil prices still above US$40 per barrel, OrPower 4is providing cheaper electricity to the national gridthan any existing oil fired plants in Kenya.” In con-trast, Nigeria has relied entirely on domestically pro-cured natural gas to fuel its IPPs, and gas is the incum-bent fuel. Until recently, although a series of issuesaffected project outcomes, most notably the invest-ment climate and bidding procedures, fuel had notbeen an issue; however, civil unrest in the Niger Deltaled to a disruption in the fuel supply in 2007–09,albeit with improved conditions as of 2010.
Source: Authors.
Box 21.3 Petroleum-Fired Versus Natural Gas-Fired IPPs

projects have encountered some form of change to theircontract, and in four of the six, either the state utility oranother government entity held an equity share, indicatingthat the existence of a local partner might not be critical inpreserving the original financing balance.
As for renegotiating contract terms, it is unclearwhether having a local partner makes a difference. Kenya’sWestmont and Iberafrica, for example, were negotiated atthe same time under similar policy frameworks, althoughIberafrica had local participation and Westmont did not.Iberafrica first voluntarily reduced its tariff and then went
on to negotiate a second 15-year PPA, in contrast to West-mont, which stopped production after failing to come toan agreement on a second PPA. Although the presence of alocal partner may have helped Iberafrica create a long-term solution, with just one example, the evidence is notconclusive. Togo’s Centrale thermique de Lomé, due to beonline in July 2010, may provide a more sustainablemethod for balancing investment and development out-comes. In this project, 25 percent of the project equitymust be sold to local investors within the first five years(Ministry of Energy of Togo 2010).
CHAPTER 21: INDEPENDENT POWER PROJECTS IN SUB-SAHARAN AFRICA: DETERMINANTS OF SUCCESS 379
Table 21.2 Elements within Purview of Host Governments Contributing to Successful IPPs
Element Details
Favorable investment climate ■ Stable macroeconomic policies■ Legal system that allows contracts to be enforced, laws to be upheld,
and arbitration ■ Good repayment record and investment-grade credit rating■ Requires less (costly) risk mitigation techniques to be employed,
translating into lower cost of capital, lower project costs, and morecompetitive prices
■ Potentially more than one investment opportunityClear policy framework ■ Policy framework enshrined in legislation
■ Framework clearly specifies market structure and roles and terms forprivate and public sector investments (generally for single-buyer model,as wholesale competition does not yet exist in African context)
■ Framework is led and implemented by reform-minded “champions,”concerned with long-term power sector conditions
Clear, consistent, and fair regulatory oversight ■ Oversight improves general performance of private and public sector assets
■ Transparent and predictable licensing and tariff framework improvesinvestor confidence
■ Cost-reflective tariffs ensure revenue sufficiency■ Consumers protected
Coherent power sector planning linked to procurement and contracting
■ Energy security standard in place; planning roles and functions are clear
■ Power planning vested with lead, appropriate (skilled, resourced, andempowered) agency
■ Power sector planning takes into consideration the hybrid market(public and private stakeholders and their respective real costs ofcapital) and fairly allocates new building opportunities amongstakeholders
■ Planning has built-in contingencies to avoid emergency power plants or blackouts
■ Responsibility for procurement is clearly allocated; plans are linked to procurement and bids are initiated in time
■ Procurement process is transparent and competition ultimately drives down prices
■ Capacity is built to contract effectivelyAbundant, low- cost fuel and secure contracts ■ Cost-competitive with other fuels
■ Contract safeguards affordable and reliable; fuel supply sufficient forduration of contract
Source: Authors.

380
Tabl
e 21
.3Eq
uity
Par
ticip
atio
n in
IPPs
in S
ub-S
ahar
an A
fric
a
Pro
ject
E
quit
y pa
rtne
rs (
coun
try
and
perc
ent
of
equi
ty h
eld)
C
hang
e in
co
ntra
ct t
erm
s
Maj
ori
ty e
quit
y pa
rtne
r tu
rnov
er
(num
ber
of
tim
es)
Wes
tmon
t (K
enya
)W
estm
ont
(Mal
aysi
a,10
0%);
has
soug
ht t
o se
ll pl
ant
sinc
e 20
04—
—Ib
eraf
rica
(K
enya
)U
nion
Fen
osa
(Spa
in,8
0%),
KPL
C P
ensi
on F
und
(Ken
ya,2
0%)
sinc
e 19
97ye
s0
OrP
ower
4 (
Ken
ya)
Orm
at (
Uni
ted
Stat
es/Is
rael
,100
%)
sinc
e 19
98ye
s0
Tsa
vo (
Ken
ya)
Cin
ergy
(U
nite
d St
ates
) an
d IP
S (in
tern
atio
nal)
join
tly o
wne
d 49
.9%
,Cin
ergy
sol
d to
Duk
e En
ergy
(U
nite
d St
ates
) in
200
5;C
DC
/Glo
bele
q (U
nite
d K
ingd
om,3
0%),
War
tsila
(Fi
nlan
d,15
%),
IFC
(in
tern
atio
nal,
5%)
have
ret
aine
d re
mai
ning
sha
res
sinc
e 20
00
no1
Rab
ai (
Ken
ya)
Ald
ywch
-Inte
rnat
iona
l (N
ethe
rlan
ds,3
4%),
BWSC
(D
enm
ark,
but
owne
d by
Mits
ui o
f Jap
an,2
5.5%
),FM
O (
Net
herl
ands
,20%
),IF
U (
Den
mar
k,20
%)
no0
IPT
L (T
anza
nia)
Mec
hmar
(M
alay
sia,
70%
),V
IP (
Tanz
ania
,30%
in k
ind)
;bot
h ha
ve s
ough
t to
sel
l sha
res,
and
actu
al e
quity
co
ntri
butio
n is
cur
rent
ly d
ispu
ted
yes
—
Song
as (
Tanz
ania
)Tr
ansC
anad
a so
ld m
ajor
ity s
hare
s to
AES
(U
nite
d St
ates
) in
199
9,an
d A
ES s
old
maj
ority
sha
res
to
Glo
bele
q (U
nite
d K
ingd
om)
in 2
003.
aA
ll pr
efer
red
equi
ty s
hare
s w
ere
conv
erte
d in
to “
loan
not
es”
in Ju
ne 2
009,
only
com
mon
sha
res
rem
ain
yes
2
Buja
gali
(Uga
nda)
Sith
e G
loba
l (U
nite
d St
ates
,58%
),IP
S-A
KFE
D (
32%
),go
vern
men
t of
Uga
nda
(10%
)no
0N
aman
ve (
Uga
nda)
Jaco
bsen
(N
orw
ay,1
00%
)no
0C
IPR
EL (
Côt
e d’
Ivoi
re)
SAU
R In
tern
atio
nal (
88%
).T
his
is a
join
t ve
ntur
e be
twee
n Fr
ench
SA
UR
Gro
up o
wne
d by
Bou
ygue
s (6
5%),
and
Elec
tric
ité d
e Fr
ance
(35
%).
The
rem
aini
ng 1
2% w
as o
wne
d by
a c
ombi
natio
n of
BO
AD
(W
est A
fric
an B
ank
for
Dev
elop
men
t);t
he In
vest
men
t an
d Pr
omot
ions
Com
pany
for
Econ
omic
C
oope
ratio
n,a
subs
idia
ry o
f AFD
;and
IFC
.In
2005
98%
of t
he s
hare
s w
ere
sold
to
Bouy
gues
(F
ranc
e);B
OA
D r
etai
ned
2%.
no1
Azi
to (
Côt
e d’
Ivoi
re)
Cin
ergy
(65
.7%
;joi
nt v
entu
re b
etw
een
Swis
s A
BB a
nd G
lobe
leq)
,CD
C/G
lobe
leq
(11%
),an
d IP
S-A
KFE
D (
23%
)no
1Ta
kora
di II
(G
hana
)C
MS
(Uni
ted
Stat
es,9
0%),
VR
A (
Gha
na,1
0%);
CM
S so
ld s
hare
s to
TA
QA
(U
AE,
90%
) in
200
7ye
s1
Suno
n A
sogl
i (G
hana
)Sh
enzh
en (
Chi
na),
Togb
e A
fede
XIV
(G
hana
/loca
l str
ateg
ic in
vest
or)
no0
Bui h
ydro
(G
hana
)Si
nohy
dro
(Chi
na)
no0
AES
Bar
ge (
Nig
eria
)En
ron
(Uni
ted
Stat
es,1
00%
);so
ld t
o A
ES (
Uni
ted
Stat
es,9
5%)
and
YFP
(N
iger
ia,5
%)
in 2
000
yes
1O
kpai
(N
iger
ia)
Nig
eria
n N
atio
nal P
etro
leum
Cor
pora
tion
(Nig
eria
,60%
),N
iger
ian
Agi
p O
il C
ompa
ny (
Ital
y,20
%),
and
Phill
ips
Oil
Com
pany
(U
nite
d St
ates
,20%
) ha
ve m
aint
aine
d eq
uity
sin
ce 2
001
yes
0
Afa
m V
I (N
iger
ia)
Nig
eria
n N
atio
nal P
etro
leum
Cor
pora
tion
(Nig
eria
,55%
),Sh
ell (
Uni
ted
Kin
gdom
/Net
herl
ands
,30%
),El
f (To
tal)
(Fra
nce,
10%
),A
gip
(Ital
y,5%
)no
0
Aba
Inte
grat
ed (
Nig
eria
) G
eom
etri
c Po
wer
Lim
ited
(Nig
eria
)no
0G
Ti D
akar
(Se
nega
l)G
E C
apita
l Str
uctu
red
Fina
nce
Gro
up (
SFG
) (U
SA),
Edis
on (
Ital
y),I
FCno
0K
ouno
une
(Sen
egal
)M
itsub
ishi
(Ja
pan)
,Mat
elec
S.A
.L (
Leba
non)
no0
Cen
tral
e th
erm
ique
de
Lom
é (T
ogo)
Con
tour
Glo
bal (
Uni
ted
Stat
es,8
0%)
IFC
(20
%)
no0
Sour
ce: A
uth
ors.
Not
e:—
= P
endi
ng
deve
lopm
ents
.a.
Turn
over
wit
hin
th
e So
nga
s pr
ojec
t h
as b
een
com
plex
:Oce
lot
(Can
ada)
,Tra
nsC
anad
a (C
anad
a),T
anza
nia
Pet
role
um
Dev
elop
men
t C
orpo
rati
on,T
PD
C (
Tan
zan
ia),
TAN
ESC
O (
Tan
zan
ia),
Tan
zan
ia D
evel
opm
ent
Fin
ance
Com
pany
,TD
FL (
Tan
zan
ia,s
pon
sore
d by
Eu
rope
an I
nves
tmen
t B
ank)
,IFC
(m
ult
ilate
ral)
,DE
G (
Ger
man
y),a
nd
CD
C (
Un
ited
Kin
gdom
) w
ere
shar
ehol
ders
by 1
996,
wit
h T
ran
sCan
ada
the
maj
orit
y sh
areh
olde
r.IF
C a
nd
DE
G s
old
thei
r sh
ares
to
CD
C in
199
7/98
;Tra
nsC
anad
a so
ld it
s sh
ares
to
AE
S (U
nit
ed S
tate
s) in
199
9;O
celo
t/Pa
nO
cean
sol
dsh
ares
to
AE
S in
200
1;an
d A
ES
sold
maj
orit
y sh
ares
to
Glo
bele
q (U
nit
ed K
ingd
om)
and
FMO
(th
e N
eth
erla
nds
) in
200
3.A
fter
th
e A
ES
sale
,equ
ity
shar
es a
nd
asso
ciat
ed f
inan
cial
com
mit
-m
ents
in S
onga
s w
ere
as f
ollo
ws:
Glo
bele
q,$3
3.8
mill
ion
(56
per
cen
t);F
MO
,$14
.6 m
illio
n (
24 p
erce
nt)
;TD
FL,$
4 m
illio
n (
7 pe
rcen
t);C
DC
,$3.
6 m
illio
n (
6 pe
rcen
t);T
PD
C,$
3 m
illio
n
(5 p
erce
nt)
;an
d TA
NE
SCO
,$1
mill
ion
(2
per
cen
t).T
he
amou
nt
give
n f
or G
lobe
leq
does
not
ref
lect
th
e ad
diti
onal
$50
mill
ion
th
at t
he
com
pany
com
mit
ted
for
the
expa
nsi
on o
fth
e pr
ojec
t.

Origins, Experience, and Mandates of Partners. Froma global perspective, IPP investments during the 1990s wereled by a host of American and European investors who sawreturns in their home markets diminishing. A wave ofinvestors originating from developing countries, however,particularly from Malaysia, was also present. Although itwould be inaccurate to say that investors based in develop-ing countries overlooked the risk involved in African coun-tries (or did not ultimately charge higher returns), they mayhave had a greater willingness to consider IPP investmentsin Sub-Saharan Africa in the first place.
While the number of developing-country-based investorsin IPPs appears to be growing, three such firms are trying tosell their shares (Mechmar, VIP, and Westmont). Thus, thehome country of the firm does not mean that project equityis permanent, or that firms based in developing countries arebest positioned to service debt and reward equity.
An aspect more important than the nationality of theinvesting firm appears to be a firm’s experience and mandate.Across the pool of IPPs examined in table 21.3, several firmswere actively involved in the country before making an IPPinvestment. Union Fenosa, for example, the parent companyof Iberafrica, had previous experience in Kenya through aninformation-technology contract. IPS, a major shareholder inTsavo (Kenya), Azito (Côte d’Ivoire), and Bujagali (Uganda),has operated in Kenya since 1963 and in Côte d’Ivoire since1965. For certain projects, it may be argued that long-termrelationships, particularly those with strong local manage-ment, appear to have contributed to the staying power offirms and often the rebalancing of contract terms.
In addition to the terms of the deal, the mandate of theinvesting firm appears to play a central role in firms’ deci-sions about whether to invest in IPP projects. AlthoughGlobeleq, IPS, and Aldwych, for example, are commercialentities, they emerged from agencies with a strong commit-ment to social and economic development. Until recently,the two firms that were increasing their stakes were Glo-beleq and IPS. Globeleq holds a 43 percent share in Côted’Ivoire’s Azito, 30 percent equity in Kenya’s Tsavo, and 56 percent in Tanzania’s Songas. IPS holds a 23 percentshare in Azito, and together with Duke Energy, a 49.9 percentshare in Tsavo. IPS is also leading development ofUganda’s Bujagali project and is a 35 percent shareholderin equity. Although a smaller player than either Globeleqor IPS, Aldwych International has also made significantinroads via Rabai in Kenya and is evaluating furtherexpansion.
With the exception of Tanzania’s Songas, none of theSub-Saharan African IPP projects with involvement of firms
with development origins examined here has had anychanges in contract terms, which may signal that they werebetter balanced from inception in terms of investors andhad a better ability to withstand public pressure. Further-more, in terms of the Songas change, although the $103 million buy-down of the allowance for funds usedduring construction resulted in a reduction in the capac-ity charge, the firm received full payment upon the buy-down—a different case from many of the contract changescited earlier. Alongside companies with development ori-gins, foreign investors remain directly involved in IPPinvestments. Indeed, DFI equity shares have increased inrecent years for at least five IPPs. With the exception ofSongas, no project with DFI involvement has seen any con-tract changes. Box 21.4 provides further insights on IPPprojects concerned with their developmental impacts.
Equity Turnover. Of the 46 original equity partners inthe 21 projects considered here, 7 have exited (from5 projects). This ratio, however, tells only part of the story.First, as previously indicated, shareholders in Westmont(Kenya) and IPTL (Tanzania) have been trying for several
CHAPTER 21: INDEPENDENT POWER PROJECTS IN SUB-SAHARAN AFRICA: DETERMINANTS OF SUCCESS 381
Development is perhaps more important for Indus-trial Promotion Services (IPS) than for any other firminvesting in IPPs in Sub-Saharan Africa. As a rule, IPSinvests only in projects with a substantial develop-mental impact and a reasonable internal rate ofreturn. For the Tsavo project, that rate is 17–18 per-cent, and for Bujagali, 19 percent—considerably lowerthan typical internal rates of return for IPP projects inSub-Saharan Africa (IPS 2010).
Aldwych International, on the other hand, requiresthat its project investments both make commercialsense and serve a clear developmental function for thecountry and local community. The company’s experi-ence in the Rabai in Kenya helps to illustrate thispoint. The firm has faced three major hurdles as partof its involvement in the project—legal trouble duringthe tendering process, national postelection civilunrest in late 2007, and the global financial crisis.Despite the challenges, the project reached financialclose successfully in 2008; it even won the ProjectFinance International’s deal of the year award.
Source: Authors.
Box 21.4 Two IPPs with Development andInvestment Mandates

years to sell their assets. In the case of IPTL, Mechmar, thelead shareholder, has indicated that the sale has beendriven by an arbitration settlement that hurt its equitypartners. VIP, the minority shareholder, cites oppressionby the majority shareholder, fraud by Mechmar in inflat-ing the IPTL capital cost, and failure by Mechmar to payits equity contribution (that is, the project was 100 per-cent debt financed) as reasons behind its desire to sell itsstake. For this and other projects, investors repeatedly saythat their motivation to sell stakes in IPPs is driven pri-marily by changing circumstances in home markets orcorporate strategy—that is, the desire to sell has little todo with host-country actions and reactions or with poorinvestment outcomes, namely, the ability to service debtadequately and reward equity.
While investment outcomes may be partially motivatingsales, turnover does not in and of itself appear to be chal-lenging the long-term sustainability of contracts, since innearly all cases sellers have found willing buyers to take overthe original or recently renegotiated PPAs. The two excep-tions, again, are Westmont, in which the first PPA expiredand was shrouded in controversy, and IPTL, which has beenembroiled in lawsuits. Under such circumstances, it maytherefore be understandable that the plants have notattracted buyers. One stakeholder went so far as to assertthat “[equity turnover is a] healthy factor in a maturingmarket. It is a good sign when investors come and go—nota bad or threatening thing.” The return of the governmentas a shareholder, as planned in the case of Tanzania’s IPTL,would, however, signal that some markets are less maturethan initially expected.
Debt arrangements: Global and local
With debt financing often representing more than 70 percentof total project costs, competitively priced financing hasemerged as a key factor in successful projects. How and whereto get this low-cost financing is a challenge, but possibleapproaches in the case of Sub-Saharan Africa are DFIs,credit enhancements, and flexibility in repayment terms andconditions, including possible refinancing.17 The goal forsustainable financing should be that the risk premiumdemanded by financiers or capped by the off-taker matchesthe actual country risk and that project risks and risk pre-miums are not inflated.
While there is no uniform pattern in the debt financ-ing for the projects considered here, observation of sev-eral trends in terms of how investors handled costs maycontribute to the success of other projects. Although
nonrecourse project financing is the norm for privatelyfinanced electric power plants in developing regions, the21 projects examined here represent several notable excep-tions: Nigeria’s Okpai and Afam VI, which were 100 percentfinanced by the balance sheet of equity partners, and thesecond phase of Songas, which was largely refinanced by aWorld Bank loan in 2009 (Globeleq 2010a). Until recently,Westmont, Iberafrica, and OrPower 4 were all financedentirely with the balance sheets of their sponsors. For West-mont and Iberafrica, the reason cited for this arrangementwas insufficient time to arrange project finance, becauseplants had to be brought online within 11 months. ForOrPower4, the reason was linked to lack of a security pack-age, which was not finalized until 2006.
The Impact of DFIs on Projects. With limited appetitefor IPPs among commercial banks, DFIs provide a sub-stantial amoung of credit to projects. Indeed, DFIs such asthe World Bank, International Finance Corporation (IFC),European Investment Bank, DEG, FMO, African Develop-ment Bank, PROPARCO, the Emerging Africa Infrastruc-ture Fund, and European Financing Partners, KfW, andAgence Française de Développement have participated innearly every IPP. Beyond these institutions’ long history ofactivity in Sub-Saharan Africa, their involvement is attrib-utable to real and perceived risks by private investors,which keep them from filling the financing gap, and to theDFIs’ interest in participating in the broader mandate ofpower sector reform.
Although projects with DFI funding tended to takelonger to reach financial closure than those financedthrough private sources, project sponsors in Kenya say thatmultilateral and bilateral development institutions helpedthem maintain contracts and resist renegotiation in the faceof external challenges such as droughts, when developerswere pressured to reduce tariffs. A particularly revealingcontrast is between the two Kenyan plants, OrPower 4 andTsavo. Although the two projects were negotiated under thesame policy framework, the former initially had no multi-lateral involvement in either its equity or debt,18 whereas theIFC arranged all the debt for Tsavo and took a 5 percentequity stake. Tsavo has since resisted KPLC pressure toreduce its tariffs. OrPower 4, on the other hand, ultimatelyreduced its tariff for the second phase of the plant. Tanza-nia’s Songas project, for which the World Bank and Euro-pean Investment Bank financed all project debt, alsodeserves special mention here. The project took almost adecade to reach financial closure; the World Bank played aninstrumental role in, among other things, pressuring the
382 CHAPTER 21: INDEPENDENT POWER PROJECTS IN SUB-SAHARAN AFRICA: DETERMINANTS OF SUCCESS

IPTL arbitration, which ultimately led to more balancedcontract terms.
Locally Sourced Finance. While observers argue thatlocal financing is key to increasing sustainable foreigninvestment, capital markets in many Sub-Saharan Africancountries are underdeveloped and illiquid, hence unableto provide financing for all projects. Three exceptions inthe project sample are Kounoune I of Senegal, Geometricof Nigeria, and Namanve of Uganda. The Kounoune Iproject received financing from both the West AfricanBank for Development (BOAD), based in Togo, and theBanking Company of West Africa (CBAO), a private bankbased in Senegal. Funding for Geometric has been pro-vided by Diamond Bank and Stanbic IBTC Bank Plc, bothof Nigeria. Similarly, for Uganda’s Namanve project, financ-ing was provided by Standard Chartered Bank of the UnitedKingdom through Stanbic Bank of Uganda. By contrast, inNorth Africa, all of the €213 million debt of Tahaddart, a384 megawatt combined-cycle gas turbine plant inMorocco, was financed by local banks. Local financing wasaided by a number of factors, including the state utility’sprominent role in the plant (it holds nearly 50 percent oftotal equity) and the fact that Morocco’s commercial bankshave a significant degree of state involvement. With or with-out state involvement, however, no other country in Sub-Saharan Africa has yet been able to manage to arrange thislevel and depth of local financing for IPPs.
One main drawback for IPPs without local finance is theimpact of macroeconomic shocks and local currency deval-uation. Since the late 1990s, Ghana, Kenya, and Tanzaniahave experienced substantial depreciation, with their cur-rencies losing more than 100 percent, 200 percent, and 400 percent of their value against the U.S. dollar, respec-tively. Inevitably, these currency shifts have led to pressureto reduce capacity charges and to countries reconsideringIPP development.
Securing revenue:The PPA
All 21 of the projects examined here had a long-term powerpurchase agreement with the incumbent state-owned utilityto ensure a market for the power produced and to securerevenue flows for debt and equity providers. In addition tostating who would buy the power, the PPAs detailed howmuch power capacity would be available and how muchbuyers would be charged. Provisions concerning fuel meter-ing, interconnection, insurance, force majeure, transfer, ter-mination, change of legal provisions, and refinancing were
generally also addressed. Nearly all the contracts specifiedsome form of international dispute resolution and mini-mum power availability.
For each project, sponsors negotiated or were grantedPPAs in U.S. dollars, thereby reducing their exposure tocurrency devaluation. Over time, the bulk of projectcontracts have been upheld, but not without changes.Box 21.5 reviews PPA renegotiations in Kenya, Nigeria,and Tanzania.
Credit enhancements and security arrangements
The underlying credit risk of IPP projects in Sub-SaharanAfrica has been dealt with largely through a suite of creditenhancements, namely, guarantees, insurance, and cash (thelatter of which took the form of escrow accounts, liquidityfacilities, and letters of credit of varying amounts andtenures). The Tsavo project in Kenya, for example, has anescrow account equivalent to one month’s capacity chargeand a standby letter of credit from KPLC covering threemonths’ billing (approximately $12 million). At least 12 ofthe 21 projects examined in this chapter had some form ofcash security arrangement, with typical terms of betweenone and four months’ capacity charge in reserve.
Not surprisingly, the number of credit enhancementsappears to diminish as a country’s risk profile improves.There are, however, noticeable exceptions such as the firstwave of IPPs in Kenya (Westmont and Iberafrica), for whichrisk appears to be entirely reflected in the higher capacitypayments negotiated. That said, corruption was also allegedin both these plants.19 Thus, the “security arrangement”may lie not in a letter of credit but in an informal agreementamong sponsors.
Of the many different credit enhancements used inconnection with IPPs, sovereign guarantees are mostcommon. Such guarantees are known to have beenextended for at least nine of the pool of 21 projects:Tanzania’s IPTL, Nigeria’s AES Barge, Côte d’Ivoire’sAzito, Ghana’s Takoradi II (phase I), both GTi Dakar andKounoune I in Senegal, Togo’s Centrale thermique de Lomé,and Bujagali and Namanve in Uganda. Several of the proj-ects without guarantees—Tsavo and Rabai, for example—were, however, given assurances by the government in theform of comfort or support letters, through which politicalrisk is assumed. In the case of the Okpai plant in Nigeria,security was extended in the form of the state-owned oilcompany’s revenues. Thus, if the off-taker defaults, NNPC,among the most liquid firms in the country, is liable. Partialrisk guarantees (PRGs) issued by the World Bank were used
CHAPTER 21: INDEPENDENT POWER PROJECTS IN SUB-SAHARAN AFRICA: DETERMINANTS OF SUCCESS 383

for two of the projects, Azito and Bujagali.20 In theseinstances, the PRG covered all debt of the commercialbanks. In the case of default by the project company, thePRG (backed by World Bank) would pay the commerciallenders, and the World Bank would then claim repaymentfrom the government (World Bank 1997, 1999). For otherIPPs, political risk insurance was provided by the OverseasPrivate Investment Corporation (OPIC), whereas guaran-tees relating to currency inconvertibility, expropriation,and political violence were issued by the World Bank’sMultilateral Investment Guarantee Agency (MIGA).
In several cases, these credit enhancements haveimproved the sustainability of projects and attracted orassuaged lenders. The Bujagali project’s PRG, for example,was instrumental in motivating and solidifying the involve-ment of four commercial banks, which contributed a com-bined $115 million at very competitive pricing. Some havelikened the PRG to a hammer effect, with the World Bankguaranteeing what the government has already guaranteedand thus making the government’s commitment twofold.That said, PRGs are not appropriate for all Sub-SaharanAfrican IPPs because they are typically used for large proj-ects in countries that are in an early stage of reform andwhen commercial lenders are also present. Furthermore,
the government of the country must request a PRG; thus,the project must be significant in the eyes of both the gov-ernment and the World Bank. For projects without PRGssecurity arrangements and credit enhancements aresimilar, with the DFIs generally accepting the political risks,such as in the Azito and Songas projects.
In Kenya, the only country among those in Sub-SaharanAfrica examined here to extend sovereign guarantees toIPPs, stakeholders in Tsavo indicated that, without such aguarantee, the presence of the IFC became critical, both tohelp arrange debt and share in equity. In Ghana, lack of sov-ereign guarantees has been cited as the main obstacle todeveloping the second phase of the Takoradi II project.
Other credit enhancements have been used in abundancein Kenya, including a suite of escrow facilities, which havecontributed to KPLC’s cash-strapped position. Althoughgovernment guarantees were recently debated by officials,it looks as if the government will retain its no-guaranteepolicy going forward, providing only letters of support toIPPs. KPLC cites the absence of sovereign guarantees ashampering its ability to raise private finance, while ERCcounters that IPPs have been introduced to help commer-cialize the sector. Government guarantees work againstthis goal, however.
384 CHAPTER 21: INDEPENDENT POWER PROJECTS IN SUB-SAHARAN AFRICA: DETERMINANTS OF SUCCESS
In Kenya’s first wave of IPPs, costs were inflated in part due to the short duration of contracts—only seven years. WithIberafrica facing ongoing pressure to reduce its tariff, coupled with an interest in negotiating another contract, thesponsor voluntarily reduced the capacity charge enshrined in the PPA. (Iberafrica’s second and third PPAs are for aconsiderably longer time frame than its first, and tariffs have been reduced significantly.) Westmont, on the otherhand, did not negotiate a second contract after it failed to obtain the same terms—in particular, those related to capac-ity charges—spelled out in its first PPA. Likewise, changes in Kenya’s OrPower 4 and Tanzania’s Songas PPA agree-ments are related in part to the final amount of the capacity charge (as originally spelled out in the PPA).a
In the case of Nigeria’s AES Barge, initially sponsored by Enron, renegotiations in 1999–2000 brought about sev-eral changes in the PPA, including a change in the fuel specifications (from liquid fuel to natural gas), which led to amajor reduction in the fuel charge for the off-taker. The current arbitration with AES Barge involves, among otherthings, reconsideration of the availability-deficiency payment as well as the tax exemption. In each of the casesreviewed here, the original terms of the PPA have been viewed as unsustainable for the host country and thereforechallenged.
The case of Tanzania’s IPTL is slightly different, however. Although the contract was considered initially unsus-tainable due to the added capacity of Songas, the IPTL arbitration was prompted by what was deemed a breach in thePPA, namely, the project sponsors’ substitution of medium-speed for slow-speed engines without passing on the cap-ital cost savings to the utility, as per the PPA.b
a. It is, however, worth reiterating in this context that failure to agree on the security package and the capacity charge contributedto delays in the development of OrPower 4’s additional 36 megawatts of production capacity.b. Although this dispute was resolved, a subsequent and prevailing dispute relates to the level of actual equity in the project, whichin turn affects WACC and the allowed rate of return.
Box 21.5 The Experience of PPAs with Renegotiations in Kenya, Nigeria, and Tanzania

Notably, sovereign guarantees, political risk insurancepolicies, and PRGs have not been invoked in any of the 21projects examined here, including in those projects thatultimately faced a change in the contract (AES Barge, IPTL,OrPower 4, and Takoradi II). Recourse to international arbi-tration has occurred only in the case of IPTL. Additionally,it is helpful to reflect on the overall application of securityarrangements and credit enhancements. Although there issome variation in the project sample, by and large the vari-ation is limited, with the size of the project, the track recordof the regulatory regime (including its stability and credi-bility), and the creditworthiness of the off-taker being themain determinants. While there is resistance to governmentguarantees on the part of some country stakeholders, proj-ect developers and multilaterals typically support them. Asone World Bank (2010) official noted, “the first level of sup-port has to come from the government.”
Furthermore, there has been very little evolution in thecredit arrangements used for IPPs in Sub-Saharan Africa.All projects are supported by a PPA and their credit risklargely carried by a government guarantee. In countries inwhich the market for power is not developed, a PPA, alongwith a government guarantee, is generally required, partic-ularly where the off-taker is not creditworthy (IFC 2010a;Rudo 2010a). This situation is quite different than that inother developing regions. In Latin America, for example,PRGs and other credit enhancements and securityarrangements are virtually nonexistent because powermarkets are operational and local lenders are “in thedriver’s seat and generally very comfortable with localdevelopers and regulation.”21
Positive technical performance
Virtually all IPPs among the 21 considered here haveshown positive technical performance. Exceptions includeNigeria’s plants (which have had problems with fuel sup-ply) and, more recently, Kounoune I in Senegal (NigeriaElectricity Regulatory Commission 2010; IFC 2010b). Ingeneral, IPPs’ technical performance is superior to that ofstate-owned plants. An argument for extending gas fromthe West African Gas Pipeline to the Sunon Asogli PowerPlant in Ghana, for example, is being made in part becauseSunon’s technical performance is superior to that of theVolta River Authority (PURC 2010). The Ministry ofEnergy of Togo (2010), meanwhile, has indicated that Cen-trale thermique de Lomé is expected to be more efficientthan its state-owned counterpart. In terms of availability,IPPs in Kenya had an average availability of approximately
95 percent between 2004 and 2006, versus 60 percent forKenGen’s thermal plants. When asked generally about hismost favorable IPP experience to date, one public stake-holder simply indicated, “their technical performance”(ERC 2010).
Strategic management and relationship building
Once 20-year contracts are in place, it would seem that thedeal is set and the revenue secured, with clear provisions toensure debt repayment and reward equity. Several otherinterrelated actions deserve mention, however. One involvesrelationship building, including with local partners andcommunities. Another relates to how sponsors handle theonset of stresses, including those presented by capacitycharges and refinancing.
Numerous IPP sponsors have adopted outreach pro-grams to improve relations with local communities. InKenya, for example, Tsavo set up a $1 million communitydevelopment fund for the duration of the 20-year PPA,from which grants of $50,000 each are disbursed each yearto benefit environmental and social activities in Kenya’sCoast Region. Iberafrica maintains a social responsibilityprogram, and IPTL also is an active donor to its immedi-ate community. In Ghana CMS’s social responsibilityinvolvement (before it sold its shares to TAQA in 2007)included providing scholarships for secondary and tertiaryeducation and supporting medical clinics and the con-struction of drainage systems. Bujagali also has a suite ofsocial outreach programs. Although the sums are not sig-nificant, these programs, particularly when well adver-tised, have the potential to win allies and counter thestereotype of IPPs.
Another, perhaps more significant, action is how spon-sors cope with stresses such as macroeconomic shocks, cur-rency depreciation, and pressure from host governments toreduce costs. Anecdotal evidence suggests that strategicmanagement helped put Kenya’s Iberafrica back on track, incontrast to Westmont, where there is no evidence of suchaction. Iberafrica, in fact, has had to cope with two majorstresses, drought and alleged corruption. According tostakeholders at Iberafrica, the IPP voluntarily reduced itscapacity charge when KPLC was operating at a loss (duein part to a drought-related recession), to show its sup-port for the country and signal its interest in a secondcontract. Iberafrica later secured a second contract, albeitafter even further reductions were negotiated and passedby the electricity regulator.22 For Rabai, another project inKenya, sponsors chose to continue work on the project
CHAPTER 21: INDEPENDENT POWER PROJECTS IN SUB-SAHARAN AFRICA: DETERMINANTS OF SUCCESS 385

in the midst of countrywide protests following the elec-tion in December 2007 (Aldwych International 2010a).
Project refinancing
A final area in which IPPs may yield greater balancing interms of development and investment outcomes is in therefinancing of projects, evidence for which can be seen inthe Songas project in Tanzania. Possible refinancing in thecase of IPTL, with the government of Tanzania proposingto buy the project’s outstanding debt equity, could alsolead to what may be perceived as a more balanced out-come. A government buyback of IPTL would make a one-time payment on behalf of the utility and then transferownership of the asset to TANESCO, which may subse-quently decide to convert the plant to run on natural gas.Through this transaction, the capacity charge will fall to atoken amount, and following conversion to gas, the energycharge will drop from $9 million–$12 million to $1 mil-lion–$1.5 million a month. The PPA would also be termi-nated and a new agreement drafted, one that would offercustomers discounted tariffs.
Project refinancing has limited application and mustbe dealt with carefully during the project negotiation. Asone banker candidly indicated, “If project finance bankers
are expected to finance projects with the understandingthat periodically it will be necessary to have a restructur-ing, the outcome of which is uncertain, the result will beto eliminate the availability of nonrecourse financing.”Given the already low level of availability of financing inAfrica, this should be avoided.
A host-country government’s willingness to share risksover the life of an IPP may thus be pivotal to the long-termsustainability of projects. That said, strategic managementdoes not occur in a vacuum. Often, the government is notonly an active counterparty but may even, as evidenced inthe refinancing of IPTL, initiate strategic management.Other government-led initiatives include the government ofTanzania’s buying down of Songas’ allowance for funds usedduring construction. The myriad project-level factors aresummarized in table 21.4.
LESSONS LEARNED FROM IPPs IN SUB-SAHARAN AFRICA
Despite numerous challenges, a number of Sub-SaharanAfrican countries have managed to attract and sustain pri-vate investments in IPPs. More than 20 large IPPs havetaken root in eight countries, and a number of smaller, pri-vate projects have also been developed. While some IPPs
386 CHAPTER 21: INDEPENDENT POWER PROJECTS IN SUB-SAHARAN AFRICA: DETERMINANTS OF SUCCESS
Table 21.4 Elements Contributing to Successful IPP Investments
Element Details
Favorable equity partners ■ Local capital/partner contribution, where possible■ Risk appetite for project■ Experience with developing-country project risk■ Involvement of a DFI partner and/or host-country government■ Reasonable, fair return on equity■ Firms with development origins
Favorable debt arrangements ■ Competitively priced financing or involvement of DFIs■ Local capital/markets to mitigate foreign exchange risk ■ Flexibility in terms and conditions (possible option to refinance)
Secure and adequate revenue stream ■ Commercially sound metering, billing, and collections by the utility■ Robust PPA (stipulates capacity and energy charges as well as dispatch, fuel
metering, interconnection, insurance, force majeure, transfer, termination, change oflaw provisions, refinancing arrangements, dispute resolution)
Credit enhancements and security arrangements ■ Guarantees: sovereign guarantees, partial risk guarantees ■ Insurance: political risk insurance■ Cash: escrow accounts, letters of credit, liquidity facilities
Positive technical performance ■ High level of technical performance (including availability)■ Sponsors anticipate and mitigate potential conflicts (especially related to O&M and
budgeting)
Strategic management and relationship building ■ Sponsors work to create good image in country through political relationships,development funds, and effective communications and strategically manage theircontracts, particularly in the face of exogenous shocks and other stresses
Source: Authors.

have encountered some contract changes, nearly all havesurvived and are countributing to social and economicdevelopment.
At the country level, factors such as a favorable invest-ment climate, clear policy and regulatory frameworks, andlocal availability of cost-competitive fuels clearly help createsuccessful IPPs. Of growing importance are effective plan-ning, procurement, and contracting policies and practices.Kenya provides an example of how responsibilty for thesefunctions can be effectively allocated and institutionalized.
Although evidence is not conclusive, strategic manage-ment on behalf of IPP sponsors and governments, as well asstrong technical performance, have been used to strengthenprojects. The role of firms with development origins, suchas Aldwych, Globeleq, and IPS, and development financeinstitutions such as the IFC is increasingly important in thesuccessful development and operation of new IPPs in Sub-Saharan Africa. Projects with participation of these firms
and DFIs were less likely to unravel, leading to one of twoconclusions: these projects may have been more balancedfrom the outset and when an exogenous stress struck, orthey may have been better equipped to resist host-countrygovernment pressure.
In Sub-Saharan African countries in which an imbalancebetween development and investment outcomes is per-ceived, there is evidence that IPP contracts are moreunlikely to unravel. The incidence of such unraveling, how-ever, does not necessarily signal the end of a project’s oper-ation. In all cases, efforts to close the initial gap betweeninvestors and host-country governments’ perceptions andtreatment of risks must continue. Finally, the means of clos-ing this gap may not be only, or mainly, through increasingnew protections such as PRGs or political risk insurance.Rather, the solution may lie in systematic treatment of thenumerous elements contributing to success at the countryand project level defined in this chapter.
CHAPTER 21: INDEPENDENT POWER PROJECTS IN SUB-SAHARAN AFRICA: DETERMINANTS OF SUCCESS 387

ANNEX 21A PROJECT SPECIFICATIONS
Detailed specifications are presented for each IPP discussedin this chapter. Information is first grouped into regionswith East Africa followed by West Africa. Countries within
each of the regions are presented in alphabetical order.Under each country, IPPs are then presented in chrono-logical order, based on the date when the IPP first cameonline.
388 CHAPTER 21: INDEPENDENT POWER PROJECTS IN SUB-SAHARAN AFRICA: DETERMINANTS OF SUCCESS
Kenya (2 of 5 projects)Project IberafricaSize 108.3 MW (44, 12, 52.3 brought on, respectively)Cost US$35 million (only for first 56 MW)$ per kW NAFuel/technology HFO/medium speed diesel engineICB NoneContract BOO, 7 years, 15 years, 25 yearsDebt/Equity 72/28DFI in equity and debt NoneLocal participation in equity and debt Yes (equity and debt) Equity partners (country of origin; % of each shareholder) Union Fenosa (Spain, 80%), KPLC Pension Fund (Kenya, 20%) since 1997Lenders Union Fenosa (US$12.7 million in direct loans and guaranteed
US$20 million); KPLC Staff Pension Fund (US$9.4 in direct loans andguaranteed US$5 million through a local Kenyan bank).
Credit enhancements, security arrangements NoneProject tender, COD 1996, 1997/1999, 2000/2008, 2009Contract change Yes, Iberafrica reduced the capacity charge of its first PPA by 37% in
April 2002 and then to 59% of the original PPA in September 2003.a
Fuel arrangement Iberafrica buys fuel and passes cost through to KPLC based on theunits generated and specific consumption parameters agreed on inthe PPA
East Africa
Kenya (1 of 5 projects)
Project WestmontSize 46 MW Cost US$65 million$ per kW US$1,413Fuel/technology Kerosene/gas condensate/gas turbine (barge mounted)ICB None, but selective international tender conductedContract BOO, 7 yearsDebt/equity —DFI in equity and debt NoneLocal participation in equity and debt NoneEquity partners (country of origin; % of each shareholder) Westmont (Malaysia, 100%) has sought to sell plant since 2004Lenders —Credit enhancements, security arrangements NoneProject tender, COD 1996, 1997Contract change Not a contract change per se, but firm failed to negotiate a second
contract after its 7 year contract ended in 2004 due to failure toagree on tariffs
Fuel arrangement Originally Westmont to procure fuel and then pass through to utility,however, following dispute with fuel supplier about taxes after thefirst year of operation, utility took over procurement
Kenya (3 of 5 projects)Project OrPower 4Size 13 MW + 35 MWCost US$105b million$ per kW NAFuel/technology GeothermalICB Yes
(continued next page)

CHAPTER 21: INDEPENDENT POWER PROJECTS IN SUB-SAHARAN AFRICA: DETERMINANTS OF SUCCESS 389
Kenya (4 of 5 projects)Project TsavoSize 75 MWCost US$86 million$ per kW US$1,133Fuel/technology HFO/medium speed diesel engineICB YesContract BOO, 20 yearsDebt/equity 78/22DFI in equity and debt Yes (equity and debt)Local participation in equity and debt NoneEquity partners (country of origin; % of each shareholder) Cinergy and IPS jointly owned 49. 9%, Cinergy sold to Duke Energy in
2005, CDC/Globeleq (U.K., 30%),Wartsila (Finland, 15%), IFC (5%)retain remaining shares since 2000
Lenders IFC own account (US$16.5 million), IFC syndicated (US$23.5 million);CDC own account (US$13 million), DEG own account (€11 million), DEG syndicated (€2 million)
Credit enhancements, security arrangements Letter of comfort provided by government, and escrow account,equivalent to 1 month capacity charge, and a stand-by letter ofcredit, equivalent to 3 months billing
Project tender, COD 1995, 2001Contract change None, but was pressured to lower tariffFuel arrangement Tsavo buys fuel and passes cost through to KPLC based on the units
generated and specific consumption parameters agreed on in the PPAKenya (5 of 5 projects)Project RabaiSize 90 MWCost US$155 million$ per kW US$1,722Fuel/technology HFOICB YesContract BOOT, 20 yearsDebt/equity 75% debt, (5% subordinated debt, 25% equity)DFI in equity and debt YesLocal participation in equity and debt NoEquity partners (country of origin; % of shareholder) Aldywch: 34%, BWSC (Danish, but owned by Mitsui of Japan): 25.5%,
FMO: 20%, IFU (Danish bilateral lender): 20%Lenders DEG: 15%, FMO: 25%, EAIF: 25%, Proparco: 25%, EFP (European
Financing Partners): 10%Credit enhancements, security arrangements Support letter from government of Kenya (covers political risk but falls
short of being an outright guarantee), and KPLC-issued letter ofcredit equivalent to 5 months of capacity (debt service, fixed costsand equity returns) payments and 2 months of fuel payments
Project tender, COD 2006, 2009Contract change NoneFuel arrangement Fuel supply agreement with Kenol of Kenya
Contract BOO, 20 yearsDebt/equity NADFI in equity and debt DEGLocal participation in equity and debt NoneEquity partners (country of origin; % of each shareholder) Ormat (100%) from 1998 to 2008.Lenders —Credit enhancements, security arrangements MIGA guarantee, a stand-by letter of credit, covering several months
billing (although only finalized at end-2006)Project tender, COD 1996, 2000–2009Contract change Yes, tariff for the second phased (35 MW) reducedFuel arrangement The only fuel arrangement per se is that OrPower 4 was granted a
Geothermal Resource License from the government, to which it paysa royalty of sorts (of US$0.004/kWh or USc 0.4/kWh)
(continued next page)
East Africa (continued)

390 CHAPTER 21: INDEPENDENT POWER PROJECTS IN SUB-SAHARAN AFRICA: DETERMINANTS OF SUCCESS
Tanzania (2 of 2 projects)Project SongasSize 180 MWc
Cost US$316 milliond
$ per kW US$2,313 (for first 115 MW) and US$769 (for 65 MW expansion)Fuel/technology Natural gas/open cycleICB YesContract BOO, 20 yearsDebt/equity 70/30 for 115 MW
100% equity financed for 65 MW expansion, which has since beenrefinanced
DFI in equity and debt YesLocal participation in equity and debt Yes (TANESCO,TDFL)Equity partners (country of origin; % of each shareholder) TransCanada sold majority shares to AES (USA) in 1999 and AES sold
majority shares to Globeleq (UK) in 2003.e All preferred equity shares were converted into “Loan Notes” in June 2009. Onlycommon shares remain.
Lenders World Bank (US$136 million), EIB (US$55 million), Sida (US$15 million)Credit enhancements, security arrangements Escrow account: for first 115 MW, with the government matching every
US$1 spent by the project company; liquidity facility equivalent to 4 months capacity charge for the first 3 years, declining to 2 monthsstarting in year 4 through the remaining years of the contract
Project tender, COD 1994, 2004Contract change The changes to Songas’ PPA include: US$103 million AFUDC buy-
down; the use of escrow funds to buy down the AFUDC; freezingthe liquidity facility, which was meant to be replenished and accessedonly in the case of partial or nonpayment by TANESCO; andpreferred equity conversion to “loan notes”
Fuel arrangement Songo Songo gas provided to project company at a rate of US$0.55/MMBtu for turbines I–V and at US$2.17 MMBtu for turbine VI
Uganda (1 of 2)Project Namanve Power Plant/Jacobsen Uganda Power Plant LimitedSize 50 MWCost US$74 million at inception$ per kW US$1,488Fuel/technology HFOICB Yes
Tanzania (1 of 2 projects)
Project IPTLSize 100 MWCost US$120 million$ per kW US$1,200Fuel/technology HFO/medium speed diesel engineICB NoneContract BOO, 20 yearsDebt/equity 70/30 (albeit ratio disputed)DFI in equity and debt NoneLocal participation in equity and debt Yes (in-kind equity participation)Equity partners (country of origin; % of each shareholder) Mechmar (Malaysia, 70%),VIP (Tanzania, 30% in kind), both have sought
to sell sharesLenders Two Malaysian-based banks (Bank Bumiputra Malaysia Berhad—now
Bank Bumiputra Commercial Bank—and SIME Bank) auctioned debtto Standard Chartered Bank
Credit enhancements, security arrangements Sovereign guarantee, liquidity facility equivalent to 4 months capacitycharge (but not yet established)
Project tender, COD 1997, 2002Contract change Yes, postarbitration, monthly capacity charges lowered from US$3.6
million to US$2.6 millionFuel arrangement IPTL imports fuel, which is a pass-through to the utility
East Africa (continued)
(continued next page)
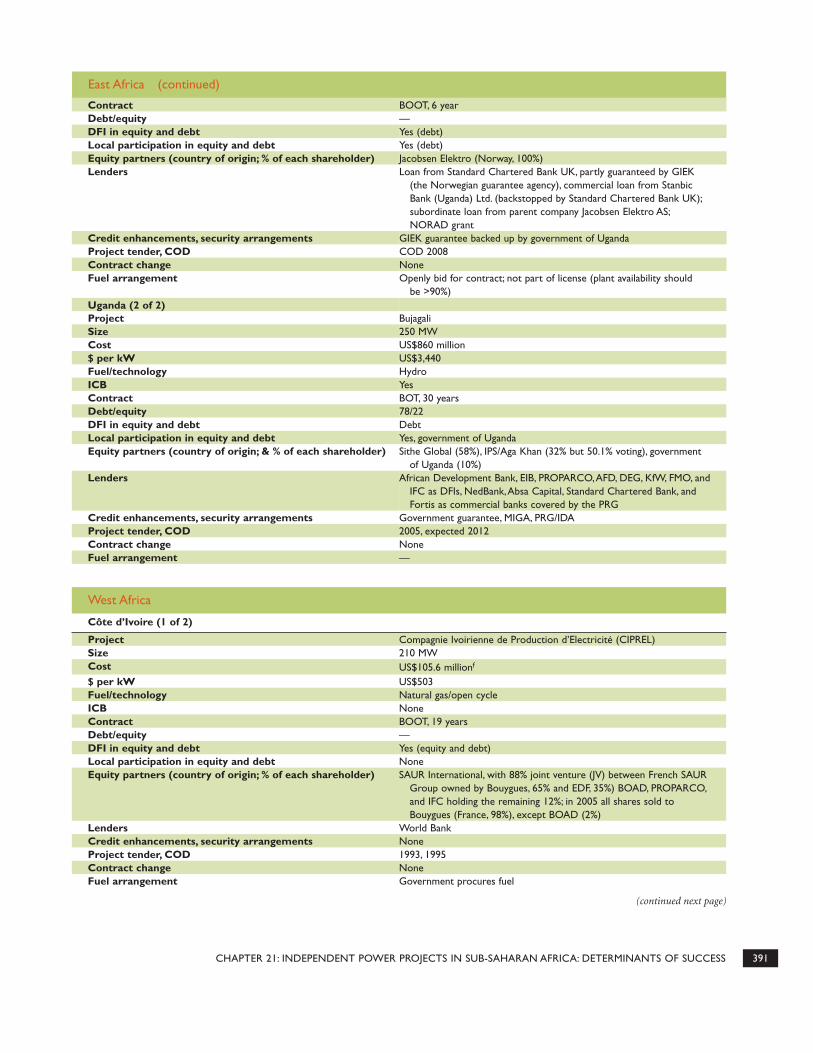
CHAPTER 21: INDEPENDENT POWER PROJECTS IN SUB-SAHARAN AFRICA: DETERMINANTS OF SUCCESS 391
Uganda (2 of 2)Project BujagaliSize 250 MWCost US$860 million$ per kW US$3,440Fuel/technology HydroICB YesContract BOT, 30 yearsDebt/equity 78/22DFI in equity and debt DebtLocal participation in equity and debt Yes, government of UgandaEquity partners (country of origin; & % of each shareholder) Sithe Global (58%), IPS/Aga Khan (32% but 50.1% voting), government
of Uganda (10%)Lenders African Development Bank, EIB, PROPARCO,AFD, DEG, KfW, FMO, and
IFC as DFIs, NedBank,Absa Capital, Standard Chartered Bank, andFortis as commercial banks covered by the PRG
Credit enhancements, security arrangements Government guarantee, MIGA, PRG/IDA Project tender, COD 2005, expected 2012Contract change NoneFuel arrangement —
Contract BOOT, 6 yearDebt/equity —DFI in equity and debt Yes (debt)Local participation in equity and debt Yes (debt)Equity partners (country of origin; % of each shareholder) Jacobsen Elektro (Norway, 100%)Lenders Loan from Standard Chartered Bank UK, partly guaranteed by GIEK
(the Norwegian guarantee agency), commercial loan from StanbicBank (Uganda) Ltd. (backstopped by Standard Chartered Bank UK);subordinate loan from parent company Jacobsen Elektro AS;NORAD grant
Credit enhancements, security arrangements GIEK guarantee backed up by government of UgandaProject tender, COD COD 2008Contract change NoneFuel arrangement Openly bid for contract; not part of license (plant availability should
be >90%)
(continued next page)
East Africa (continued)
West Africa
Côte d’Ivoire (1 of 2)
Project Compagnie Ivoirienne de Production d’Electricité (CIPREL)Size 210 MWCost US$105.6 millionf
$ per kW US$503Fuel/technology Natural gas/open cycleICB NoneContract BOOT, 19 yearsDebt/equity —DFI in equity and debt Yes (equity and debt)Local participation in equity and debt NoneEquity partners (country of origin; % of each shareholder) SAUR International, with 88% joint venture (JV) between French SAUR
Group owned by Bouygues, 65% and EDF, 35%) BOAD, PROPARCO,and IFC holding the remaining 12%; in 2005 all shares sold toBouygues (France, 98%), except BOAD (2%)
Lenders World BankCredit enhancements, security arrangements NoneProject tender, COD 1993, 1995Contract change NoneFuel arrangement Government procures fuel

392 CHAPTER 21: INDEPENDENT POWER PROJECTS IN SUB-SAHARAN AFRICA: DETERMINANTS OF SUCCESS
Côte d’Ivoire (2 of 2)
Project AzitoSize 288 MWg
Cost US$225 million$ per kW US$781Fuel/technology Natural gas/open cycleICB YesContract BOOT, 24 yearsDebt/equity 70/30DFI in equity and debt Yes (debt)Local participation in equity and debt NoneEquity partners (country of origin; % of each shareholder) Cinergy (JV between Swiss ABB, 50% and French EDF, 50%)
Holds 65.7% of shares, CDC/Globeleq (11%), and IPS (23%)Lenders IFC, CDC, FMO, DEG,AfDB, Societe Generale, and other European
commercial banksCredit enhancements World Bank partial risk guarantee
Sovereign guaranteeSecurity arrangements Escrow account equivalent to 1 month capacity chargeProject tender, COD 1996, 2000Contract change NoneFuel arrangement Government procures fuelGhana (1 of 3)Project Takoradi IISize 220 MWh
Cost US$110 million$ per kW US$500Fuel/technology Light crude oil/single cycleICB NoneContract BOOT, 25 yearsDebt/Equity Financed exclusively with balance sheet of sponsorsDFI in equity and debt NoLocal participation in equity and debt Yes (equity)Equity partners (country of origin & % of each shareholder) CMS (U.S., 90%),VRA (Ghana, 10%), CMS sold shares to TAQA
(UAE, 90%) in 2007Lenders Financed exclusively with balance sheet of sponsorsCredit enhancements Sovereign guaranteeSecurity arrangements US$3 million letter of credit provided by governmentProject tender, COD 1998, 2000Contract change Failure to develop second phase (110 MW), investors cite the lack of
government guarantees (granted in the first phase of Takoradi II),meanwhile government has indicated that the EPC costs are too highand further development remains at standstill
Fuel arrangement Government procures fuel
(continued next page)
Ghana (2 of 3)Project Sunon Asogli Power PlantSize 200 MWCost —$ per kW —Fuel/technology Combustion engineICB NoContract BOO, 20 yearsDebt/equity —DFI in equity and debt NoneLocal participation in equity and debt Local strategic investor,Togbe Afede XIVEquity partners (country of origin; % of each shareholder) Shenzhen (China, 100%)Lenders —Credit enhancements, security arrangements —Project tender, COD —
West Africa (continued)

CHAPTER 21: INDEPENDENT POWER PROJECTS IN SUB-SAHARAN AFRICA: DETERMINANTS OF SUCCESS 393
Ghana (3 of 3)Project Bui hydroSize 400 MWCost US$622 million$ per kW US$1,555/kWFuel/Technology HydroICB NoContract —Debt/Equity —DFI in equity and debt NoneLocal participation in equity and debt —Equity partners (country of origin & % of each shareholder) Sinohydro (China, 100%)Lenders —Credit enhancements and security arrangements —Project tender, COD 2005, expected online in 2012Contract change NoneFuel arrangement Hydro
West Africa (continued)
Contract change Related to fuelFuel arrangement Inability to reach conclusion about fuel agreement, which has prevented
plant from coming online
Nigeria (1 of 4)Project AES Barge LimitedSize 270 MWCost US$240 million$ per kW US$888Fuel/technology Natural gas/open cycle (barge mounted)ICB NoneContract BOO, 13 yearsDebt/equity —DFI in equity and debt NoneLocal participation in equity and debt Yes (equity)Equity partners (country of origin; % of each shareholder) Enron (U.S., 100%) sold to AES (95%) and YFP (Nigeria, 5%) in 2000Lenders —Credit enhancements, security arrangements OPIC political risk insurance
Sovereign guarantee, US$60 million letter of credit from Ministry of Finance
Project tender, COD 1999, 2001Contract change Yes, initial plant size increased from 90 MW to 270 MW (9 units of 30
MW each) and change in the fuel from liquid fuel to natural gas, bothof which had the effect of reducing the capacity charge, currentcontract changes under discussion involve among other things theavailability of deficiency payment, meanwhile tax exemption certificatehas been withheld by government for the duration of the project
Fuel arrangement Utility arranges fuel
Nigeria (2 of 4)Project OkpaiSize 450 MWCost US$462i
$ per kW —Fuel/technology Natural gas/combined cycleICB NoneContract BOO, 20 yearsDebt/equity 100% equity financedDFI in equity and debt NoneLocal participation in equity and debt Yes (equity and debt)Equity partners (country of origin; % of each shareholder) Nigerian National Petroleum Corporation (Nigeria, 60%), Nigerian
Agip Oil Company (Italy, 20%), and Phillips Oil Company (U.S., 20%)maintained equity since 2001
(continued next page)

394 CHAPTER 21: INDEPENDENT POWER PROJECTS IN SUB-SAHARAN AFRICA: DETERMINANTS OF SUCCESS
Nigeria (3 of 4)Project Afam IVSize 630 MWCost —$ per kW —Fuel/technology CCGTICB NoContract BOO, 20 yearsDebt/equity 100% equityDFI in equity and debt NoneLocal participation in equity and debt Yes, NNPCEquity partners (country of origin; % of each shareholder) NNPC (Nigeria, 55%), Shell (U.K./Netherlands, 30%), Elf (Total)
(France, 10%), Agip (Italy, 5%)LendersCredit enhancements, security arrangements PPA backed by Nigerian Petroleum Development Company’s
oil revenuesProject tender, COD 2000, 2007Contract change NoFuel arrangement Project company provides fuel
Senegal (1 of 2)Project GTi DakarSize 52 MWCost US$65 million$ per kW US$1,250/kWFuel/technology Complete cycle/diesel/natfaICB YesContract BOOT, 15 yearsDebt/equity 75/25DFI in equity and debt Yes (both)Local participation in equity and debt NoneEquity partners (country of origin, % of each shareholder) GE Capital Structured Finance Group (U.S.), IFC, Edison (Italy)Lenders IFC and Credit Commercial de France
Nigeria (4 of 4)Project Aba Integrated Power ProjectSize 140 MWCost US$385$ per kW US$2,750/kW (includes distribution investment)Fuel/t\Technology Gas fired open-cycle powerICB NoContract BOODebt/equityDFI in equity and debt NoLocal participation in equity and debt Yes (equity)Equity partners (country of origin; % of each shareholder) Geometric Power Limited (Nigeria)Lenders Diamond Bank, Stanbic IBTCCredit enhancements, security arrangementsProject tender, COD 2005, anticipated COD end-2010Contract change NoFuel arrangement
Lenders Provided by equity partnersCredit enhancements, security arrangements PPA backed by Nigerian Petroleum Development Company’s oil
revenuesProject tender, COD 2001, 2005Contract change Ongoing negotiations related to investment costs which rose by
US$150 million, to US$462 million; although plant is producingpower, due to the dispute, full payment is not being made by utility
Fuel arrangement Project company provides fuel
(continued next page)
West Africa (continued)

CHAPTER 21: INDEPENDENT POWER PROJECTS IN SUB-SAHARAN AFRICA: DETERMINANTS OF SUCCESS 395
Senegal (2 of 2)Project Kounoune ISize 68 MWCost US$110 million$ per kW US$1617/kWFuel/technology HFO dieselICB YesContract BOO, 15 yearsDebt/equityDFI in equity and debt Yes (debt)Local participation in equity and debt Yes (debt)Equity partners (country of origin; % of each shareholder) Mitsubishi (Japan), Matelec S.A.L (Lebanon)Lenders IFC, Proparco,AfDB, BOAD, and CBAOCredit enhancements, security arrangements Government guarantee, a PRG although never signed by the
government, a letter of credit from SenelecProject tender, COD 2003, 2008Contract change NoneFuel arrangement During the project negotiations, the structures of the FSA and PPA
were changed to turn the PPA into a tolling agreement.
(continued next page)
Credit enhancements, security arrangements Government guarantee, credit insurance through a guarantee programof SACE, the Italian export credit agency, and a partial interestsubsidy through the Mediocredito Central Subsidy Department,escrow account
Project tender, COD 1996, 1999/2000Contract change NoneFuel arrangement
West Africa (continued)
Togo (1 of 1)Project Extension of Central Thermique de Lome (CTL)Size 100 MWCost US$196 million (including 18 km transmission lines rehabilitation and
soil decontamination investment)$ per kW US$1,960Fuel/technology Triple fuelICB NoContract BOOT, 25 yearsDebt/equity 75/25DFI in equity and debt Yes (debt)Local participation in equity and debt None (but contract stipulates up to 25% of equity must be sold to
local/Togolese)Equity partners (country of origin; % of each shareholder) Contour Global (U.S., 80%), IFC (20%)Lenders OPICCredit enhancements, security arrangements Government guarantee, OPIC guarantee, escrow account for 1 month
of full operation, letter of credit of 2 months of full operation, (whichbecome one month after 2 years of no incident of payment, andceases to exist after 4 years of no incident)
Project tender, COD Due online in July 2010Contract change NoFuel arrangement The buyer (utility provides fuel)
Source: Authors.Notes: — = Not available. BOT = build, own, transfer.a. Furthermore, although not a contract change per se, the value of the capacity charge for Iberafrica’s second PPA was 50 percent that of the first PPA.b. US$105 includes only the loan portion for the 35 MW part of the plant (Ormat, personal communication, 2010).c. There was considerable evolution in terms of the planned capacity for the plant, from 60 MW to the current 180 MW.d. Songas project costs include refurbishment of gas wells, a new gas processing facility, pipeline construction and fuel conversion of the existingpower station (Ubungo), in total amounting to US$266 million, and an additional US$50 million for expansion in terms of two additional turbines(total 65 MW) and related infrastructure. The expansion was financed entirely by equity. A rough estimate for the electricity generation componentwould be 40 percent of project costs or US$130 million, based on US$35 million for refurbishment and fuel conversion of existing turbines, US$45million assumed loans on existing turbines, and US$50 million for expansion.
NOTES
1. The standard model for power sector reform has beenroughly defined as a series of steps that move verticallyintegrated utilities toward competition, generally includ-ing the following activities: corporatization, commercial-ization, passage of the requisite legislation, establishmentof an independent regulator, introduction of IPPs,restructuring/unbundling, divestiture of generation anddistribution assets, and introduction of competition(Bacon 1999; Adamantiades and others 1995; Besant-Jones2006; Williams and Ghanadan 2006). Although this model,based largely on the early power sector reforms carried outin Chile, Norway, and the United Kingdom, came to repre-sent a standard, it is arguable that not all steps were relevantto conditions on the ground in most developing countries(Gratwick and Eberhard 2008b).
2. Exceptions are Côte d’Ivoire and Tanzania, where IPPsare contributing more than 50 percent to overall electricityproduction. Togo’s first IPP, Centrale thermique de Lomé,will also supply the majority of electricity for that country.
3. Two different categories of DFIs should be distinguished,namely, those that lend on commercial terms and largely toprivate companies (for example, FMO, PROPARCO, DEG,and IFC), and the multilateral development banks (such asthe World Bank and the African Development Bank) thatlend on concessionary terms and primarily to public sectorprojects. It is the latter that refocused on infrastructure(Rudo 2010a).
4. Although Mauritius has four IPPs (which, at approxi-mately 200 MW combined, account for about 37 percent ofinstalled capacity and a little less than 25 percent of pro-duction, as of end-2005), the country has not beenincluded in this sample. The IPPs, which are all cogenera-tion plants, provide power and steam to the country’s sugarmills throughout the crop season, reducing their contribu-tion to the state-owned utility by about 30 percent. Duringthis time, the shortfall in production is made up by seven
continuous power producers, privately owned by the sugarmills. With installed capacity of 40 MW, roughly equal tothe IPP shortfall, these continuous producers also havelong-term take or pay contracts with the state (Bergesen2007; World Bank 2007a).
5. Centrale thermique de Lomé is a preexisting 90 MWfacility for which a rehabilitate-own-transfer contract wasprovided to Electro Togo in 2001. In 2006, however, whena power crisis intensified and the rehabilitation had notyet been completed, the government of Togo opted to ter-minate Electro Togo’s contract and initiate a BOOTdirectly with Contour Global, which had previously beeninvolved in discussions with Electro Togo (Ministry ofEnergy of Togo 2010).
6. A portion of the shares of the two Kenyan utilities, KPLCand Kengen, however, are listed on the Nairobi StockExchange. Côte d’Ivoire’s state utility has been under a pri-vate concession contract since 1990—an arrangement that isexpected to continue until 2020. TANESCO in Tanzania andKPLC in Kenya also have had private management contracts.In Senegal, there was an attempt (albeit aborted) to privatizeSenelec in 1999 through a concession with Hydro-Québecand Elyo (the concession was annulled by the president in2001). Uganda unbundled its national utility into separategeneration, transmission, and distribution companies andentered into long-term private concession in generation(Eskom) and distribution (Umeme-Globeleq). Finally,Nigeria has expressed an intention to unbundle and priva-tize but has not yet fully realized this ambition.
7. Alternatives to strictly independent regulation that mayprovide a better match to a country’s regulatory commit-ment and institutional and human resource capacity (forexample, regulatory contracts, outsourcing of regulatoryfunctions, expert panels, and regional regulators) areincreasingly being considered (Eberhard 2007).
8. Domestic gas reserves were used for IPPs in Côted’Ivoire. Unlike for the other countries, however, this use
396 CHAPTER 21: INDEPENDENT POWER PROJECTS IN SUB-SAHARAN AFRICA: DETERMINANTS OF SUCCESS
e. Due to complexity, turnover is detailed in this footnote: Ocelot (Canada), TransCanada (Canada), Tanzania Petroleum Development Corpora-tion, TPDC (Tanzania), TANESCO (Tanzania), Tanzania Development Finance Company, TDFL (Tanzania, sponsored by EIB), IFC (multilateral),DEG (German), CDC (UK) were shareholders by 1996, with TransCanada the majority shareholder; IFC and DEG sold shares to CDC in 1997/8;TransCanada sold shares to AES (USA) in 1999; Ocelot/PanOcean sold shares to AES in 2001; AES sold majority shares to Globeleq (UK) and FMO(Holland) in 2003. After the AES sale, equity shares and associated financial commitments (expressed in US$ million) in Songas were as follows:Globeleq: US$33.8 (56%); FMO: US$14.6 (24%); TDFL: US$4 (7%); CDC: US$3.6 (6%); TPDC: US$3 (5%) and TANESCO: US$1 (2%). This doesnot reflect the additional US$50 million that Globeleq committed for the expansion.f. Investment cost €87.8m or 57.6 billion CFA, with the average 1994 conversion of US$ to CFA, 545,100.g. The initial project concept included specifications to raise capacity to 420 MW.h. The initial project concept included specifications to add a second phase of 110 MW and convert to combined cycle, however, lack of fundinghas limited the completion of this phase.i. Project costs include the gas infrastructure.
West Africa (continued)

did not represent the establishment of a new gas infra-structure. An attempt, led by the government, was alsomade to exploit stranded gas reserves in Ghana’s OsagyefoBarge project.
9. Stakeholders in Nigeria have seen costs escalate, causingthe utility to withhold payments. In Tanzania costs have alsoescalated, but for reasons unrelated to the project itself.
10. At the time of writing, Kenya had only 60 MW still inservice, and that was expected to be retired by November2010.
11. In terms of international norms, however, it should benoted that Tanzania’s cost of unserved energy (CUE) is low.South Africa’s CUE is approximately US$10/kWh, which isin line with the CUE in many industrialized countries(Global Energy Decisions 2007).
12. On the other hand, given the high cost of mounting abid, having an excessive amount of bidders would also notbe desirable as some will not bid if they perceive theirchances to be low (Rudo 2010a).
13. Togo’s next IPP, a 24 MW wind farm, is being procuredthrough an ICB (Ministry of Energy of Togo 2010).
14. Tanzania used the net-back calculation method to estab-lish the gas price for the first 142 MW owned by Songas.Although it is viewed to be low (“US$0.55/Mcf”), most ofthe costs associated with the gas infrastructure are paid sep-arately as part of the capacity charge. In typical projects,these would have been part of the gas price (i.e.,US$4.20/Mcf). The same gas price is not offered to IPTL.Under the IPTL PPA, fuel is a pass-through. TANESCO hasnegotiated with PanAfrican Energy and TPDC to book 100MMcfd at negotiated wellhead prices (in favor of the addi-tional 40 MW owned by Songas, 145 MW owned byTANESCO, and the next 100 MW plant, which may be IPTLor any other plant) starting at US$1.98/Mcf, escalated at 2.2percent annually for the first five years from July 2007, thento US$3.5/Mcf thereafter, escalated at USCPI. In summary,the gas prices are discounted market prices of an alternativefuel (EWURA 2010a).
15. Projects such as Osagyefo Barge in Ghana and Ibomand Omoku in Nigeria are sometimes loosely termedIPPs. In Ghana, private participation was expected (butnot achieved), and in Nigeria, projects, although inde-pendent of the national utility, have been led entirely bythe Rivers and Akwa Ibom state governments, respec-tively. All of these projects are excluded from the analysispresented here.
16. At the time of writing, the level of equity (includinglocal equity) is under dispute in Tanzanian court.
17. The emergence of two Chinese firms, Shenzhen andSinohydro, in Sunon Asogli and Bui hydro, respectively, inGhana could represent a new element and be a significantsource of investment for other African IPPs. Foster and
Briceno-Garmendia (2010) report on the general phenom-enon of non-OECD funders, including the emergence ofincreasingly significant funding flows from China to Sub-Saharan Africa.
18. In 2009, 10 years after financial close, DEG arranged a$105 million loan (Ormat 2009).
19. In 2005, it was found that the then managing director ofKPLC, Samuel Gichuru, received $2 million from Westmont.
20. In addition, a PRG for Kounoune I was approved by theWorld Bank but was ultimately not signed by the govern-ment of Senegal, because the lender that the PRG wouldhave covered was willing to fund the project without thePRG (IFC 2010a).
21. World Bank 2010. For IPPs in Central Asia, however,and for cross-border projects such as those in Laos andThailand (Nam Theum II), a PRG or other “strong” creditenhancements would be employed. In the middle-incomeLatin American countries cited above, privatization trajec-tories meant there were few IPPs, and in those few cases (forexample, Colombia), bilateral and multilateral institutionshelped back investments (Rudo 2010a).
22. The fact that Iberafrica was not project-financed meantthat the company had greater flexibility to change the pay-ment streams.
REFERENCES
Adamantiades, A. G., et al. 1995. “Power Sector Reform inDeveloping Countries and the Role of the World Bank.”Paper prepared for 16th Congress of the World EnergyCouncil, Tokyo. World Bank, Industry and EnergyDepartment, Washington, DC.
Africa Electra. 2005. “The Role of Local Banks in FinancingPower Projects.” Africa Electra 30.
Aldwych International. 2010a. Personal communication,May 5–6.
———. 2010b. Personal communication, June 9.
APEC (Asia-Pacific Economic Cooperation) Energy WorkingGroup. 1997.“Manual of Best Practice Principles for Inde-pendent Power Producers.” APEC Secretariat, Canberra.
Bacon, R. 1999. “A Scorecard for Energy Reform in Devel-oping Countries.” World Bank, Finance Private Sectorand Infrastructure Network, Washington, DC.
Bergesen, C. 2007. Mauritius. Columbus, OH: McGraw Hill.
Besant-Jones, J. E. 2006. “Reforming Power Markets inDeveloping Countries: What Have We Learned?” Energyand Mining Sector Board Discussion Paper 19, WorldBank, Washington, DC.
Deloitte Touche Tohmatsu Emerging Markets Ltd. andAdvanced Engineering Associates International. 2003.“Energy Program South Asia Generation Pricing Study.”
CHAPTER 21: INDEPENDENT POWER PROJECTS IN SUB-SAHARAN AFRICA: DETERMINANTS OF SUCCESS 397
South East Asia Regional Initiative for Energy, USAID,Washington, DC.
Eberhard, A. 2007. “The Independence and Accountabilityof Africa’s Infrastructure Regulators: Reassessing Regu-latory Design and Performance.” Paper presented atAFUR Annual Conference, Livingstone, Zambia, April25–26.
Eberhard, A., and I. Malgas. Forthcoming. “Hybrid PowerMarkets in Africa: Generation Planning, Procurementand Contracting Challenges.” Energy Policy.
Eberhard, A., and M. Shkaratan. 2010. “Africa’s Power Infra-structure: Improving Investment, Connectivity, Reliabil-ity and Efficiencies.” Africa Infrastructure Country Diag-nostic, World Bank, Washington, DC.
EDF (Électricité de France). 2005. Personal communication,January 11.
ERC (Energy Regulatory Commission of Kenya). 2010a.Personal communication, May 18. Nairobi, Kenya.
———. 2010b. Personal communication, May 26. Nairobi,Kenya.
EWURA (Energy and Water Utilities Regulatory Author-ity). 2010. Personal communication, May 18. Dar esSalaam Tanzania.
Foster, V., and C. Briceño-Garmendia, eds. 2010. Africa’sInfrastructure: A Time for Transformation. Washing-ton, DC: Agence Française de Développement andWorld Bank.
Global Energy Decisions. 2007. “Electrical Resource NeedsAnalysis: Adequate Reserve Margin for Development ofThird National Integrated Resource Plan for SouthAfrica.” Pretoria.
Globeleq. 2006. “Enabling Electricity Growth in Africa:Some Experiences.” In Financing Electricity for Growth inAfrica. Tunis: Infrastructure Consortium for Africa.
———. 2010a. Personal communication, May 5.
———. 2010b. Personal communication, June 1.
Gratwick, K. N., and A. Eberhard. 2008a. “An Analysis ofIndependent Power Projects in Africa: UnderstandingDevelopment and Investment Outcomes.” DevelopmentPolicy Review 26 (3): 309–38.
———. 2008b. “Demise of the Standard Model for PowerSector Reform and the Emergence of Hybrid PowerMarkets.” Energy Policy 36: 3948–60.
IFC (International Finance Corporation). 2005. Personalcommunication, January 24.
———. 2010a. Personal communication, May 21.Washington,DC.
———. 2010b. Personal communication, June 12.Washington,DC.
IPS (Industrial Promotion Services). 2010. Personal com-munication, May 24. Nairobi, Kenya.
Hoskote, M. 1995. “Independent Power Projects (IPPs): AnOverview.”Energy Note 2. In Energy Themes, ed. R. English.Washington, DC: World Bank.
International Energy Agency. 2006. World Energy Outlook2006. Paris: OECD/IEA.
Malgas, I., K. N. Gratwick, and A. Eberhard. 2007a. “Moroc-can Independent Power Producers: African Pioneers.”Journal of North African Studies 13 (1): 15–36.
———. 2007b. “Two of a Kind: Lessons from TunisianIndependent Power Projects.” Journal of North AfricanStudies 12 (4): 395–415.
Matsukawa, T., R. Sheppard, and J. Wright. 2003. “ForeignExchange Risk Mitigation for Power and Water Projectsin Developing Countries.” Energy and Mining SectorBoard Discussion Paper 9, World Bank, Washington, DC.
Ministry of Energy of Togo. 2010. Personal communication,June 10–11. Lome, Togo.
Nigeria Electricity Regulatory Commission. 2010. Per-sonal communication, May 21. Abuja, Nigeria.
Ormat. 2009. “Ormat Technologies Announces Closing of$105 Million Long-Term Senior Debt Financing for theOlkaria III Geothermal Power Project in Kenya.” Pressrelease, March 6, Reno, Nevada.
———. 2010. Personal communication, May 17.
Phadke, A. 2007. “Mark-ups in the State Capital Cost ofPrivate Power Projects in Developing Countries.”Energy and Resources Group, University of California,Berkeley.
PURC (Public Utilities Regulatory Commission of Ghana).2010. Personal communication, May 19–21. Accra, Ghana.
Regulatory Commision of Senegal. 2010. Personal commu-nication, June 11. Dakar, Senegal.
Rudo, D. 2010a. Personal communication, May 14.Washington,DC.
———. 2010b. Personal communication, June 10.Washington,DC.
Sinclair, S. 2007. “The World Bank Group Risk MitigationInstruments.” Paper presented at Private Sector Partici-pation in Power Conference, Dead Sea, Jordan.
UNEP (United Nations Environment Programme) and UNEconomic Commission for Africa. 2006. Making Africa’sPower Sector Sustainable: An Analysis of Power SectorReforms in Africa. New York: United Nations.
Williams, J. H., and R. Ghanadan. 2006. “Electricity Reformin Developing and Transition Countries: A Reappraisal.”Energy 31: 815–44.
Woodhouse, E. J. 2005. “The Experience with IndependentPower Projects in Developing Countries: Interim
398 CHAPTER 21: INDEPENDENT POWER PROJECTS IN SUB-SAHARAN AFRICA: DETERMINANTS OF SUCCESS

Report.” Program on Energy and Sustainable Develop-ment, Stanford University, Stanford, CA.
Woolf, F., and J. Halpern. 2001. “Integrating IndependentPower Producers into Emerging Wholesale Power Mar-kets.” Policy Research Working Paper 2703, World Bank,Washington, DC.
World Bank. 1993. The World Bank’s Role in the ElectricPower Sector: Policies for Effective Institutional, Regulatory,and Financial Reform. Washington, DC: World Bank.
———. 1997.“Morocco’s Jorf Lasfar Power Station.” In ProjectFinance and Guarantees. World Bank, Washington, DC.
———. 1999. “Sub-Saharan Africa Benefits from the firstIDA Guarantee for Azito.” In Project Finance and Guar-antees. Washington, DC: World Bank.
———. 2007. Private Participation in Infrastructure Data-base. http://ppi.worldbank.org.
———. 2010. Personal communication, May 17.
World Bank and USAID. 1994. “Submission and Evaluationof Proposals for Private Power Generation Projects inDeveloping Countries.” IEN Occasional Paper 2. WorldBank, Washington, DC.
CHAPTER 21: INDEPENDENT POWER PROJECTS IN SUB-SAHARAN AFRICA: DETERMINANTS OF SUCCESS 399