Evidence of Crisis and Analysis of Contributing...
52
The State of the Health Workforce in Sub-Saharan Africa: Evidence of Crisis and Analysis of Contributing Factors Bernhard Liese The World Bank/Georgetown University Gilles Dussault The World Bank Africa Region The World Bank Washington, D.C. Africa Region Human Development Working Paper Series
Transcript of Evidence of Crisis and Analysis of Contributing...

The State of theHealth Workforce inSub-Saharan Africa:Evidence of Crisis and Analysisof Contributing Factors
Bernhard Liese
The World Bank/Georgetown University
Gilles Dussault
The World Bank
Africa Region
The World Bank
Washington, D.C.
Africa Region Human DevelopmentWorking Paper Series

ii
Copyright © September 2004Human Development SectorAfrica RegionThe World Bank
The findings, interpretations, and conclusionsexpressed herein are entirely those of the authors They do not necessarily represent the views of the World Bank Group, its ExecutiveDirectors, or the countries that they representand should not be attributed to them.
Cover design by Word ExpressTypography by Word Design, Inc.Cover photo:

Table of Contents
Foreword . . . . . . . . . . . . . . . . . . . . . . . . . . . . . . . . . . . . . . . . . . . . . . . . . . . . . . . . . . . . . .v
Acknowledgements . . . . . . . . . . . . . . . . . . . . . . . . . . . . . . . . . . . . . . . . . . . . . . . . . . . . .vii
I. Introduction . . . . . . . . . . . . . . . . . . . . . . . . . . . . . . . . . . . . . . . . . . . . . . . . . . . . . . . . . . .1
II. Country Estimates of the Health Sector Workforce . . . . . . . . . . . . . . . . . . . . . . . . . . . . . .2
III. Trends in the Health Workforce . . . . . . . . . . . . . . . . . . . . . . . . . . . . . . . . . . . . . . . . . . . .6
IV. Geographical Imbalances . . . . . . . . . . . . . . . . . . . . . . . . . . . . . . . . . . . . . . . . . . . . . . . . . .8
V. Impact of Economic Reform Processes . . . . . . . . . . . . . . . . . . . . . . . . . . . . . . . . . . . . . .10
VI. International Migration of Health Professionals . . . . . . . . . . . . . . . . . . . . . . . . . . . . . . .12Factors Contributing to Emigration . . . . . . . . . . . . . . . . . . . . . . . . . . . . . . . . . . . . . .14
VII. Impact of HIV/AIDS on the Health Sector . . . . . . . . . . . . . . . . . . . . . . . . . . . . . . . . . . .17
VIII. Achieving the Millennium Development Goals . . . . . . . . . . . . . . . . . . . . . . . . . . . . . . . .20
IX. Conclusion . . . . . . . . . . . . . . . . . . . . . . . . . . . . . . . . . . . . . . . . . . . . . . . . . . . . . . . . . . .22
Annex . . . . . . . . . . . . . . . . . . . . . . . . . . . . . . . . . . . . . . . . . . . . . . . . . . . . . . . . . . . . . . . . . . . .24
Notes . . . . . . . . . . . . . . . . . . . . . . . . . . . . . . . . . . . . . . . . . . . . . . . . . . . . . . . . . . . . . . . . . . . .38
References . . . . . . . . . . . . . . . . . . . . . . . . . . . . . . . . . . . . . . . . . . . . . . . . . . . . . . . . . . . . . . . . . .39
FiguresFigure 1: Average Health Workforce Availability . . . . . . . . . . . . . . . . . . . . . . . . . . . . . . . . . . . . .4Figure 2: Trend of Africa’s Physician to Population Ratio . . . . . . . . . . . . . . . . . . . . . . . . . . . . . . .6Figure 3: Trend of Africa’s Nurses to Population Ratio . . . . . . . . . . . . . . . . . . . . . . . . . . . . . . . .7Figure 4: Niger Health Personnel Distribution by Region . . . . . . . . . . . . . . . . . . . . . . . . . . . . . . .9Figure 5: Health Personnel from Zambia and Zimbabwe Registered in the UK . . . . . . . . . . . . .13Figure 6: Health Personnel in South Africa 1996 vs. 2001 . . . . . . . . . . . . . . . . . . . . . . . . . . . . .15Figure 7: Proportion of Health Workers Who Intend to Migrate . . . . . . . . . . . . . . . . . . . . . . . .15
iii

iv
Figure 8: Distribution of Increased Labor Costs due to HIV/AIDS in Zimbabwe . . . . . . . . . . . .18Figure 9: Projected Health Workers with AIDS in Botswana . . . . . . . . . . . . . . . . . . . . . . . . . . .18Figure 10: Estimates of Shortages of Health Workers in SSA . . . . . . . . . . . . . . . . . . . . . . . . . . .21
BoxesBox 1: Malawi Faces Grave Health Personnel Shortage . . . . . . . . . . . . . . . . . . . . . . . . . . . . . . . .3Box 2: The Impact of Structural Adjustment Programs in Cameroon and Ghana . . . . . . . . . . . .11Box 3: Ghana’s Loss of Health Sector Workers . . . . . . . . . . . . . . . . . . . . . . . . . . . . . . . . . . . . . .14Box 4: Impact of HIV/AIDS on Kenya’s Health Workforce . . . . . . . . . . . . . . . . . . . . . . . . . . . .19
TablesTable 1: Classification of Sub-Saharan Countries by HRH Ratios and Languages . . . . . . . . . . . .5Table 2: Projection of the Cost of the Health Personnel Brain Drain for Ghana . . . . . . . . . . . . .16Table 3: WHO Estimates of Health Personnel per 100,000 Population for SSA . . . . . . . . . . . . .24Table 4: WHO Estimates of Health Personnel per 100,000 Population, Averages . . . . . . . . . . .26Table 5: Trends in Physicians 1960-1998 . . . . . . . . . . . . . . . . . . . . . . . . . . . . . . . . . . . . . . . . . .26Table 6: Trends in Nurses 1960-1998 . . . . . . . . . . . . . . . . . . . . . . . . . . . . . . . . . . . . . . . . . . . . .27Table 7: Health Personnel Statistical Database . . . . . . . . . . . . . . . . . . . . . . . . . . . . . . . . . . . . . .28Table 8: Brain loss in 9 SSA countries, by profession . . . . . . . . . . . . . . . . . . . . . . . . . . . . . . . . .35

Foreword
he declaration and acceptance of theMillennium Development Goals her-alded renewed commitment by coun-tries and the international community
to work towards the achievement of a betterquality of life for all the people of the develop-ing world. At least 4 of the 8 goals are healthrelated and provide the impetus for govern-ments, bilateral and multilateral developmentagencies working in the health sector to devel-op effective strategies to attain these goals.
Yet, for many African countries, it will behard, if not impossible to achieve the goalsby 2015. The key obstacle is now recognizedas the lack of a stable human resource base inthe health sector. Absolute shortages, internaland external migration, inadequate remuner-ation and incentive mechanisms, maldistribu-tion and training and education issues ofhealth workers, as well as macroeconomicpolicy constraints (often highlighted by theBank, the Fund and other internationalfinancial institutions) are identified as rootcauses for the present situation. The realiza-tion that there are health work-force issues ofsuch serious dimensions has led the usage ofthe phrase “The African health workforcecrisis”.
This report is an attempt to systematicallydocument and evaluate the state of the healthworkforce in Africa. It draws on academicpublished literature (which is limited), theWHO statistical database (which is incompleteand only sporadically updated), studies ofbilateral donors , national documents, andnewspaper articles. The report shows clearlythat for more than a decade HR issues havereceived very little attention. Ministries ofFinance often consider HR as a recurrentexpenditure and a drain on the budget ratherthan a critical investment and input to theattainment of positive health outcomes. Demo-tivation of the health workforce has reachedalarming levels and resulted in their migrationto the developed world. Increasing nursingshortages in many high income countries suchas the UK, USA, France, and Canada have ledto a dramatic increase in emigration of highlyskilled health personnel particularly fromAnglophone and now from Francophonecountries in Africa.
The situation has been compounded by theHIV/Aids epidemic which has put additionalstrains on the health care sector. The diseaseburden has escalated, productivity of healthworkers has diminished and a great number of
v
T

vi
health workers have succumbed to the epidem-ic, thus aggravating the crisis.
The report shows that Africa faces a crisisand offers recommendations for action. It sug-gests the need to recognize the importance toalign health sector, civil service and macroeco-nomic policies; it stresses that countries mustoffer internally competitive wages and nonfi-nancial incentives; and proposes to invest intotraining that is specifically oriented to the
needs of national markets. Our hope is that thereport will stimulate further work on thisimportant issue.
Ok PannenborgSenior Health Advisor and Sector Leaderfor Health, Nutrition and PopulationHuman DevelopmentAfrica Region

vii
Acknowledgement
We would like to thank our colleagues, Christoph Kurowski and Demissie Habte, for shar-ing their data and experience and their guidance. We would also like to thank Ying Zhou,who provided superb research support, and Elsie Lauretta Maka, who has overseen the pub-lication of this report.


CHAPTER 1
Introduction
n 2000, all 189 United Nations mem-ber states endorsed the MillenniumDevelopment Goals (MDGs). This rep-resented an unprecedented agreement
within the development community about keydevelopment outcomes (OECD, 2002). TheMDGs are a set of 8 goals, 18 targets and 48performance indicators relating to povertyreduction by 2015. Of these goals, four aredirectly related to better health outcomes: two-third reduction of infant and under five mor-tality, three-fourth reduction of maternal mor-tality, halt and reverse HIV/AIDS, tuberculosis,and malaria epidemics, and halve the propor-tion of people suffering from hunger. By someestimates, US$46 billion per year is required toscale up health services in low-income coun-tries (WHO CMH, 2001). The majority ofthese funds would be used to expand thecapacity of human resources in health,1 as thisis a prerequisite for increasing the access to
essential health services and for bringing downthe disease burden to the level of the MDGs(WHO CMH, 2001).
This paper examines some of the issues ofhuman resources in the health sector, focusingon the situation in Africa in view of its partic-ularly critical state. First, we examine the cur-rent state of the health sector workforce,including the latest statistics and trends. Sec-ond, we analyze the economic factors thatinfluence the availability of human resources.Next, we take a close look at the brain lossphenomenon, or exodus of trained health careprofessionals from the country or from the sec-tor. Then, a discussion of the impact of theHIV/AIDS epidemic on the workforce itselfand working conditions follows. Last, we con-clude with some issues that governments anddevelopment partners need to tackle to addressthe growing human resources crisis in theAfrican health sector.
1
I
CHAPTER 2
Country Estimates of the Health Sector Workforce
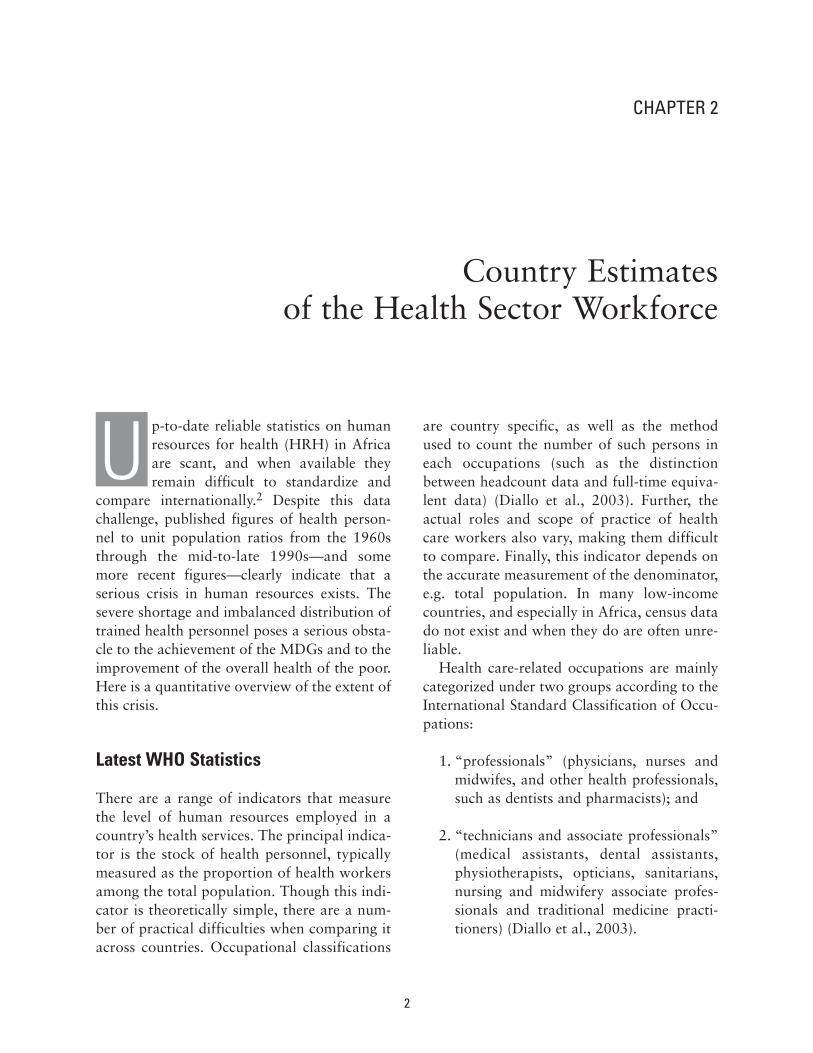
p-to-date reliable statistics on humanresources for health (HRH) in Africaare scant, and when available theyremain difficult to standardize and
compare internationally.2 Despite this datachallenge, published figures of health person-nel to unit population ratios from the 1960sthrough the mid-to-late 1990s—and somemore recent figures—clearly indicate that aserious crisis in human resources exists. Thesevere shortage and imbalanced distribution oftrained health personnel poses a serious obsta-cle to the achievement of the MDGs and to theimprovement of the overall health of the poor.Here is a quantitative overview of the extent ofthis crisis.
Latest WHO Statistics
There are a range of indicators that measurethe level of human resources employed in acountry’s health services. The principal indica-tor is the stock of health personnel, typicallymeasured as the proportion of health workersamong the total population. Though this indi-cator is theoretically simple, there are a num-ber of practical difficulties when comparing itacross countries. Occupational classifications
are country specific, as well as the methodused to count the number of such persons ineach occupations (such as the distinctionbetween headcount data and full-time equiva-lent data) (Diallo et al., 2003). Further, theactual roles and scope of practice of healthcare workers also vary, making them difficultto compare. Finally, this indicator depends onthe accurate measurement of the denominator,e.g. total population. In many low-incomecountries, and especially in Africa, census datado not exist and when they do are often unre-liable.
Health care-related occupations are mainlycategorized under two groups according to theInternational Standard Classification of Occu-pations:
1. “professionals” (physicians, nurses andmidwifes, and other health professionals,such as dentists and pharmacists); and
2. “technicians and associate professionals”(medical assistants, dental assistants,physiotherapists, opticians, sanitarians,nursing and midwifery associate profes-sionals and traditional medicine practi-tioners) (Diallo et al., 2003).
2
U

Country Estimates of the Health Sector Workforce 3
Box 1: Malawi Faces Grave Health Personnel Shortage
The World Bank sponsored a Health, Nutrition, and Population Project in Malawi from1991–2000. The Implementation Completion Report (ICR) found that under-staffed andunder-supplied facilities have become increasingly common, with adverse effects on quality ofcare. A survey conducted by KPMG in 1999 showed that many district hospitals do not havephysicians, that lower-level staff were performing higher-skill functions, and that even in terti-ary facilities patients rarely see a physician.
Among SSA countries, Malawi has consistently had one of the worst health worker to pop-ulation ratios, with 2.22 physicians per 100,000 people, compared to 4.55 in Kenya and 9.09in Zambia (Picazo, 2002). Currently 50% of the available nursing posts are unfilled. Malawihas struggled with low numbers of health professionals in the past, but the situation hasbecome more acute due to: 1) low pay and poor staff benefits of government workers; 2) anexodus of government workers to the private sector, which offers better salaries and benefits;and 3) the increasing demand for skilled nurses in neighboring countries and in Europe.
The Malawi Nursing and Midwifery Council has also insisted they should produce higherskilled registered nurses (mainly hospital-based, with a longer and more expensive trainingperiod) rather than the lower skilled, but more cost-effective community health nurses. In addi-tion, a lack of nursing tutors, severe scarcity of secondary school graduates, limited scienceeducation, and increasing death and morbidity from the AIDS epidemic all continue to con-tribute to the Malawi nursing shortage. Without improvements in training and remunerationof health professionals, Malawi will continue to lose valuable human resources.
0100
200300400
500600700
800
Heal
th P
erso
nel p
er 1
00,0
00
Popu
latio
n
Sub-SaharanAfrica
North Africa EmergingCountries
IndustrializedCountries
Physicians Nurses
Figure 1: Average Health Workforce Availability (1995–2002)
Source: WHO Statistical Information Service. Figures are from one year between 1994-1998, with the except of Nigeria for which figures arefrom 1992. May be accessed at http://www3.who.int/whosis.

4 The State of the Health Workforce in Sub-Saharan Africa
Although health personnel to populationratios are somewhat problematic for the vari-ous reasons listed above, they do provide theclearest starting point in recognizing the extentof the crisis.
The World Health Organization (WHO)Statistical Information Service lists such ratiosfor most countries. Tables 3 and 4 in theAnnex list the data for physicians, nurses, mid-wives, and pharmacists for all availableAfrican countries and selected others for com-parison. The figures for Africa are appallinglylow, especially when compared to other emerg-ing and developed countries (Figure 1 and seeBox 1 for the case of Malawi). The averageratio of physicians per 100,000 people in sub-Saharan Africa (SSA) was a meager 15.5, com-pared to an average of 311.0 in nine selectedindustrialized countries. For nurses, the samecomparison was 73.4 in SSA and 737.5 inindustrialized countries. On average, Africancountries had about 20 times fewer physiciansand 10 times fewer nurses than developedcountries. Even compared to other emergingcountries, SSA numbers are strikingly low. ForIndia, Korea, Singapore, and Vietnam, theaverage number of physicians per 100,000people was 106.3; for nurses it was 220.4..
Out of 48 African countries, thirteen3 hadfewer than five physicians per 100,000 people,and, except for Burkina Faso, Mozambique,and Tanzania, those same countries had fewerthan 20 nurses per 100,000 people (Table 3 inthe Annex). Further, there is significant indi-vidual variation among countries throughoutthe continent. For example, Burkina Faso has 4physicians and 26 nurses per 100,000 people
compared to Egypt with 218 physicians and284 nurses per 100,000 people. However,some other SSA countries are faring a little bet-ter: Botswana has 28.7 physicians and 241.0nurses per 100,000 people, while Congo has25.1 physicians and 185.1 nurses per 100,000people. While pharmacists play a key role inpeople’s access to medicines, very little datahas been collected on their numbers. As can beseen from the Table 3 in the Annex, only ahandful of countries report data. This dataproblem is not specific to SSA but applies toother middle or high income countries as well.
Based on the ratio of physicians and nursesto population, we divided the SSA countriesinto four groups. We use a physician to100,000 population ratio of 10 and a nurse topopulation ratio of 20, respectively, as thethreshold to categorize each country into eithera top or bottom group (Table 1). Thirty threeout of 43 analyzed countries (about 78%) havemore than 20 nurses per 100,000 population,and only 18 out of the 43 countries (about42%) have more than 10 physicians per100,000 population. A total of ten countrieshave less than 10 physicians and less than 20nurses per 100,000 population. There are nocountries with 10 or more physicians per100,000 population and less than 20 nurses.
A majority of Lusophone and Arabic speak-ing countries have more than 10 physicians per100,000 population, and all of their nurses topopulation ratios are above 20. In contrast,more than half of the Anglophone countriesand almost two third of the Francophonecountries have less than 10 physicians per100,000 population.

Country Estimates of the Health Sector Workforce 5
Table 1: Classification of Sub-Saharan Countries by HRH Ratios and Languages
More than 20 Nurses Less than 20 Nurses
More than Anglophone: Botswana, Kenya, Namibia, 10 Physicians Nigeria, South Africa, Sudan, Swaziland
Francophone: Benin, Congo, Guinea, Mauritius, Senegal, Seychelles
Lusophone: Cape Verde, Guinea Bissau, Anglophone: Gambia, Liberia, UgandaSao Tome and Principe
Francophone: Burundi, CAR, Chad, Arabic: Djibouti, Mauritania Madagascar, Mali, Togo
Less than Anglophone: Ghana, Lesotho, Sierra Leone, Other: Ethiopia10 Physicians Tanzania, Zambia, Zimbabwe
Francophone: Burkina Faso, Cameroon, Cote d’Ivoire, DR Congo, Niger,
Lusophone: Angola, Mozambique
Arabic: Somalia,
Other: Eritrea
Source: Annual statistics from the World Bank and WHO. See: World Bank. 1978 and 1980. World Development Report: World DevelopmentIndicators; World Bank. 1993. World Development Report: Investing in Health. p. 208; and WHO. 1998. WHOSIS database. Available athttp://www3.who.int/whosis.

CHAPTER 3
Trends in the Health Workforce
he production or supply of health sec-tor workers does not even come closeto keeping pace with the rate of popu-lation growth.4 Although these statis-
tics paint a discouraging picture, they provideonly part of a larger picture. Issues of healthworker distribution within a country and
workplace conditions further compound thecurrent crisis.
Figures 2 and 3 compare the trends in physi-cian and nurse to population ratios since 1960of eight sub-Saharan countries for which thedata was available with Morocco and India.The following are a few key observations
6
T
0
10
20
30
40
50
60
1960 1975-77 1988-92 1992-98 2002
Phys
icia
ns p
er 1
00,0
00 P
opul
atio
n
India Morocco Sub-Sahara Africa
Figure 2: Trend of Afruca’s Physician to Population Ratio (1960–2002)
Source: Annual statistics from the World Bank and WHO. See: World Bank. 1978 and 1980. World Development Report: World DevelopmentIndicators; World Bank. 1993. World Development Report: Investing in Health. p. 208; and WHO. 1998. WHOSIS database. Available athttp://www3.who.int/whosis.

Trends in the Health Workforce 7
based on country data reported in Tables 5 and6 in the Annex:
When compared to figures from either the1970s or 1980s, 7 out of the 8 SSA countries5
experienced a decline in physicians per100,000 population in the 1990s. Five of theAfrican countries6 experienced the same trendfor nurses. By 2002 the situation had slightlyimproved in three countries but deteriorated inMadagascar.
The physician to population ratio has stag-nated or declined in nearly every SSA country,since 1960. Meanwhile, India has made con-siderable progress—increasing its physician topopulation ratio from 17.2 per 100,000 popu-lation in 1960 to 51.2 by 2002, and improvingits nurse to population ratio from 10.4 per100,000 population to 62.9 over the sameperiod. Morocco also experienced improve-ment in the health personnel ratio during thistime period.
These figures indicate that ameliorating thehuman resources for health situation in SSA isan enormous challenge that must be surmount-ed to adequately serve poor populations. Theexperience of India shows that it can be done.
In addition to these figures, confirmationthat the crisis continues and may be worseningwas presented at a recent Consultation of 17African countries organized by the World Bankand WHO. Background papers documentedthe following:
• In 1998, medical physician vacancy ratesin the public sector were reported at 43%in Ghana and 36% in Malawi.
• In 1998, the public sector nurse vacancyrate was reported at 48% in Lesotho.
• Fifty percent of physicians in public serv-ices in Namibia are reported to be expa-triates.
• Cameroon has had no recruitment ofhealth personnel in the public sector for15 years.
• Data from Ghana, Zambia, and Zimbab-we suggest that annual losses from publicsector health employment continue atrates of 15% to 40% (WHO/WB, 2002).
0
20
40
60
80
100
120
1960 1975-77 1988-92 1992-98 2002
Nurs
es p
er 10
0,000
Pop
ulat
ion
India Morocco Sub-Sahara Africa
Figure 3: Trend of Africa’s Nurses to Population Ratio (1960–2002)
Source: Annual statistics from the World Bank and WHO. See: World Bank. 1978 and 1980. World Development Report: World DevelopmentIndicators; World Bank. 1993. World Development Report: Investing in Health. p. 208; and WHO. 1998. WHOSIS database. Available athttp://www3.who.int/whosis.

CHAPTER 4
Geographical Imbalances
eyond national-level shortages ofhealth personnel, imbalances in geo-graphic distribution—especially be-tween rural and urban areas—exacer-
bate the health workforce crisis (Dussault andFranceschini, 2003). In Ghana, Guinea, andSenegal, more than 50% of physicians are con-centrated in the capital city where less than20% of the population lives (Ghana MoH,2002). In many countries, a similar situationexists for nurses, pharmacists, and medicaltechnicians. For example, 55% of pharmacistsin Ghana work in the Greater Accra region,which has 16% of the total population; only2% of Ghanaian pharmacists work in theNorthern Region, with 10% of the population(Ghana MoH, 2002).
Other recent reports describe this urban-rural split dramatically. In Chad, for example,the capital region of N’Djaména was reportedto have 71 physicians per 100,000 population,whereas the rural Chari-Baguirmi region hadonly 2 physicians per 100,000 (Wyss et al.,2002; Wyss et al., in press, cited in Kurowski,2003). A report from Mali shows a similarimbalance. Nationwide, Mali was reported tohave about 5.15 physicians per 100,000 peo-
ple, but that ratio ranged from 18.7 in the cap-ital region (Bamako) to a mere 1.9 in theKoulikoro region (Ministère de Santé, Mali,2002).
In Niger, recent data on the regional distri-bution of health personnel show that mosthealth professionals concentrate in urban areas(Figure 4). In the capital, Niamey, the physi-cians to population ratio is about 24 timeshigher than in the Tillaberi region; the nursesand the midwives to population ratios are 7and 17 times, respectively, higher than in theMaradi region (World Bank, 2002b).
Studies on the health workforce in Tunisia(which has much more adequate nation-wideratios), Angola, and South Africa equallyshow geographical imbalances, implying thatthe urban-rural split is likely to be found con-tinent-wide (Bchir and de Brouwere, 2000;Fresta, Fresta, & Ferrinho, 2000). This indi-cates that rural populations have much lessaccess to health care services than do urbandwellers, and are often forced to travel signif-icant distances to find any health care, evenfor their most basic needs. This adds to thecosts of services and can even be a deterrent touse services.
8
B

Geographical Imbalances 9
0.0
5.0
10.0
15.0
20.0
25.0
30.0
35.0
40.0
45.0
Tillaberi Dosso Maradi Zinder Tahoua Diffa Agadez Niamey Nger
Heal
th p
erso
nnel
per
100
,000
pop
ulat
ion
Physicians Nurses Midwives
Figure 4: Niger Health Personnel Distribution by Region (2000)
Source: World Bank, 2002b.

CHAPTER 5
Impact of Economic Reform Processes
he crisis in the African health work-force has been emerging over severaldecades. Starting from very low levelsin the 1960s, many countries’ work-
forces progressed somewhat in the 1970s andearly 1980s, but stagnated or even declined inthe late 1980s and the 1990s following thewell-known wave of economic crises that hitthe continent. Macroeconomic constraints dis-couraged the expansion of personnel and serv-ices; thus, the international community andlow-income country governments have givenlittle attention to health-workforce issues inthe past two decades. The health workforcewas seen as a drain on the budget rather thanan asset for poverty reduction, and unemploy-ment of health professionals even appeared incountries where needs were enormous.7 Somecountries even enacted complete freezes onrecruitment of certain health personnel (Ngu-for, 1999; WHO/WB, 2002).8
The consequences of a series of reformprocesses, starting in the mid-1980s, has large-ly determined the present situation. Whenmany African countries were confronted witha dramatic fall in public revenue from exportsof commodities, a series of important econom-ic reforms were introduced. In many of thecountries, the reforms were executed through
structural adjustment programs (SAP) of theWorld Bank and International Monetary Fund(IMF). A central tenet of these reforms includ-ed better control of public wages, reduction ofpublic expenditures, privatization of publicenterprises, elimination of subsidies, liberaliza-tion of the economy, and devaluation of thecurrency in order to achieve sustained growth.
Results of these measures on public servants,particularly on health personnel, were not dra-matically different from one country to anoth-er. The impact is a lasting one, largely deter-mining the attitudes of health providers andthe actual availability of health personnel. Inmost countries, the SAP reforms went alongwith public service reform and decentralizationof the health sector. Case studies for Cameroonand Ghana, where detailed research is avail-able including interview surveys with healthpersonnel, are illustrative of the impacts (SeeBox 2).
Between 1981 and 1991, the Bank conduct-ed 55 civil service reform operations in Africa.More than half of these operations were struc-tural adjustment loans. But the functionalreviews failed to mention the impact on thehealth and education sector. A review of theWorld Bank’s operations on macroeconomicsin Africa between 1995 and 2002 found that
10
T

Impact of Economic Reform Processes 11
while half of the operations discussed theimpact of changes in public expenditure onhealth, the impact on the health workforce wasnot mentioned in any of the documents.Although one third of the operations apparent-
ly were associated with changes in the wagebill for public sector health employees, only10% of the operations mentioned the implica-tions to the health workforce (Elmendorf,2003).
Box 2: The Impact of Structural Adjustment Programs in Cameroon and Ghana
In Cameroon, government reform was initiated in the early 1980s as part of their StructuralAdjustment Program (SAP) administered by the World Bank and International Monetary Fund(IMF). Measures affecting the health sector resulted in suspending recruitment, strict imple-mentation of retirement at 50 or 55, limiting employment to 30 years, suspension of any finan-cial promotion, reduction of additional benefits (housing, travel expenses, etc.), and two salaryreductions—totaling 50%—and a currency devaluation resulting in an effective income loss of70% over 15 years. In addition, paramedical training for nurses and laboratory technicianswas suspended for several years and schools closed.
The overall effect was dramatic. In 1999, the health sector budget had shrunk to 2.4% ofthe national budget, from 4.8% in 1993. These adjustments occurred while in the private sec-tor (40% of service provision—mostly denominational) wages substantially increased, adjust-ing again for the effects of the devaluation. Thus, the spread between public and private healthworker income is large. Not surprisingly, in 1999, jobs in the public sector were about 80%unfilled, and Cameroon had a truly de-motivated national health workforce.
Notwithstanding the efforts of many health workers to provide services, in general, a lais-sez faire attitude prevails—with under the table payments, absenteeism and a lack of attentionto quality. The perception of punishment inflicted by the IMF and the World Bank is still com-mon. On the positive side, however, budgets have been decentralized and are now availablelocally, and the private sector has been strengthened. The serious shortage of health workers,though, has lead to the direct recruitment of qualified personnel by communities and hospi-tals, which have the financial resources.
In Ghana, the reform process focused on national democratization, decentralization, and thecreation of the Ghana health services. While the civil service lost 32,000 jobs between 1987-1989, the health sector remained somewhat a priority and faired better than other sectors.There was also meaningful sector reform with emphasis on the quality of services. Healthworkers have received some benefits—such as first priority housing in rural areas andincreased salaries in urban areas. Despite the well-documented severe shortage of health work-ers and significant brain drain, the motivation of the health workforce remains good in Ghana(Wiskow, 1999).

CHAPTER 6
International Migration of Health Professionals
migration of highly skilled personsfrom developing to developed countrieshas increased in the last decade (Lowelland Findlay, 2001). Growing concerns
among many rich countries about actual orfuture shortages9 has initiated large-scalerecruitment of foreign-trained health workers.Foreign-trained health professionals are esti-mated to represent more than a quarter of themedical and nursing workforces of Australia,Canada, the UK, and the US (OECD, 2002),and the needs are rapidly growing. This trendis expected to increase, with health profession-als being increasingly recruited from SSA. Thenumber of overseas trained nurses and mid-wives registering with the United Kingdom Co-operative Council from SSA10 increased from905 in 1998/99 to 2133 in 2000/01 (Mar-tineau et al., 2002). Figure 5 illustrates thisaccelerating trend with a depiction of Zambia’sand Zimbabwe’s loss of nurses and midwivesto the U.K. It has been estimated that 15,000foreign nurses were recruited in the U.K. in2001 and that 35,000 more are needed by2008 (USAID SARA, 2003).
The permanent departure of skilled labor, or“the emigration or flight of skilled human cap-ital from one country to the other in search ofbetter returns to one’s knowledge, skills, quali-
fications, and competencies” (Lowell and Find-lay, 2001) is depleting human capital in manydeveloping countries and further reducing thepossibility for strong economic growth.11 Sim-ply put, the emigration of an individual is aloss because s/he is an investment loss to hercountry, since s/he will not apply the educationgained in-country. The UN Commission forTrade and Development estimated that eachmigrating African professional represents aloss of US$184,000 to Africa. Paradoxically,Africa spends US$4 billion a year on thesalaries of 100,000 foreign experts (Seepe,2001).
In Ghana, for example, a continuous flow ofphysicians, nurses, midwives, and pharmacistshave left the country directly after receivingtheir degrees (See Box 3). According to itsHealth Minister, Kenya has only retained 600of 6,000 physicians trained in public hospitals.This number rose to 1200 after increasingcompensation for physicians, which is stillbelow the requirement. Similarly, 4,000Kenyan nurses have left for the UK and the US(BBC, 2003). In Zimbabwe, only 360 of 1,200physicians trained during the 1990s were prac-ticing in their country in 2000; half of thosetrained in Ethiopia and Zambia have also emi-grated (Frommel, 2002). Table 8 in the Annex
12
E

International Migration of Health Professionals 13
summarizes earlier studies of the sub-Saharanbrain drain.
A pattern has emerged where physicians andnurses are continually moving to countrieswith a perceived higher standard of living, cre-ating what has been referred to as a “carousel”of movement (Martineau, Decker, and Bun-dred, 2002). Canada for instance recruits pri-mary care physicians from South Africa towork in remote areas, leaving South Africa tofill vacancies by recruiting from Zimbabwe,Botswana, Malawi, and other African coun-tries. More than 600 South African physiciansare registered in New Zealand, at a cost toSouth African taxpayers of roughly US$37 mil-lion, reports the University of Western Cape,South Africa. As of 1999, 78% of rural physi-cians in South Africa were from abroad, most-ly from Cuba (OECD, 2002). South Africapresents a rare case because it is one of the fewdeveloping countries that pays comparativelyhigher salaries and is, thus, able to compensatefor emigration. Yet WHO data, summarized inFigure 6, show that the country still experi-enced a strong net loss of health personnel. Theratios of physicians and nurses per 100,000population dropped by 55% and 70%, respec-tively, between 1996 and 2001. For the many
sub-Saharan countries not able to pay compet-itive salaries and, therefore, not able to attracthealth personnel from abroad the situation iseven more critical.
This brain loss is a particular problem inAfrica where the challenge of developing andretaining human resources is extremely diffi-cult and fundamental for development(Wadda, 2000). Worsening economic condi-tions and severely declining or stagnantsalaries and benefits contribute to the loss ofhealth personnel. Although data on this phe-nomenon is sketchy, the International Officefor Migration estimates that 300,000 Africanprofessionals live and work in the West (Shinn,2002).
The brain drain will remain a relevant forcefor the foreseeable future and entails signifi-cant costs to sub-Saharan Africa. As summa-rized in Figure 7, a study of migration issues insix African countries found that 68% of healthworkers in Zimbabwe intend to migrate, 49%in Cameroon, and about 60% in Ghana andSouth Africa (Awases, Gbary, and Chatora,2003). A study by the Ministry of Health inGhana (2002) projects that the costs willamount to US $55 million between 2001 and2006 (Table 2). The largest fractions of these
1583
52
221
40
1086
0
200
400
600
800
1000
1200
1999 2000 2001
Num
ber o
f Nur
ses a
nd M
idw
ives
Zambia Zimbabwe
Figure 5: Health Personnel from Zambia and Zimbabwe Registered in the UK
Source: Loewenson and Thomson, 2002.

14 The State of the Health Workforce in Sub-Saharan Africa
costs are the lost investment in physicians’ andpharmacists’ training.
Factors Contributing to Emigration
To exactly define the factors contributing toemigration is a difficult task because mosthealth professionals do not report their inten-
tion to emigrate, nor the reasons why they doso; they simply vacate their posts, resign, orask for leave without pay for an indefinite peri-od of time (Awases, Gbary, and Chatora,2003). The causes and extent of emigrationvary from one country to another, but lack ofjob opportunities, low wages, and a poorworking environment are the most commonlycited causes. Negative side effects of SAPs,
Box 3: Ghana’s Loss of Health Sector Workers
The State of Ghanaian Economy Report 2002 shows that 31% of trained health personnel,including physicians, nurses, midwives, and pharmacists, left the country between 1993 and2002 (Safo, 2003). Table 1 below shows trends in employment of human resources in healthby the government of Ghana between 1996 to 2002 based on a government report. While bothreports signify the extensive degree of brain loss in Ghana, it is questionable whether any ofthe currently existing records demonstrate accuracy, consistency, and reliability, since varia-tions occur from report to report. As seen in Table 2 below, the University of Ghana MedicalSchool, the School of Medical Sciences of KNUST, and the UDS Medical School train onlyapproximately 150 medical officers annually. However, 50% of every graduating class leavesthe country within the second year, while 80% have left by the fifth year (Safo, 2003).
This exodus of medical officers is mirrored in other health sector professions. Out of 944pharmacists trained between 1995 and 2002, a total of 410 were presumed to have left thecountry by the end of 2002. The number of nurses and midwives immigrating to foreign coun-tries is greatest compared to all other categories; of the 10,145 trained between that same peri-od, 1,996 were deemed to have left Ghana by the end of 2002 (Safo, 2003).
Table 1: Public Sector Health Staff, Ghana
CATEGORY 1996 1998 2000 2002
Physicians 1,154 1,132 1,015 964Nurses (including auxiliaries) 14,932 15,046 13,742 11,325Pharmacists 230 200
Source: Ghana MoH. (2002). Human Resources Projections from Internal Report.
Table 2: Annual Output of Trained Public Sector Health Staff, Ghana
CATEGORY Annual Production
Physicians 150*Professional Nurses 500Midwives 200Community Health Nurses 200
Source: Ghana MoH. (2002). Human Resources Projections, Internal Report.*Safo, A. (2003). 604 physicians abandon Ghana. Public Agenda

International Migration of Health Professionals 15
with their associated measures to eliminate orreduce budget deficits and public expenditure,downsizing or retreat of government from eco-nomic activity, and the liquidation or privati-zation of enterprises, have also led to the emi-gration of professionals (Mato, 2002). Awases,Gbary, and Chatora (2003) report that otherde-motivating factors include a lack of oppor-
tunities for continuing education and training,mediocre quality of training, and inadequateday care facilities for their children.
Political instability, lack of security and anenvironment of abject poverty have also beencited as factors contributing to out-migration.Today, health professionals in SSA work inextraordinary circumstances. The pressure of
5625
472
140
0
100
200
300
400
500
Heal
th P
erso
nnel
pe
r 100
,000
Pop
ulat
ion
Physicians Nurses
1996 2001
Figure 6: Health Personnel in South Africa 1996 vs. 2001
Source: WHO, 2003.
49
62
38
58
26
68
0
10
20
30
40
50
60
70
Cameroon Ghana Senegal South Africa Uganda Zimbabwe
Perc
enta
ge
Figure 7: Proportion of Health Workers Who Intend to Migrate
Source: Awases, Gbary, and Chatora, 2003.

16 The State of the Health Workforce in Sub-Saharan Africa
having too many patients increases daily stresslevels and leads to poor quality of care. Poorworking conditions are reported to seriouslyundermine health systems performance bythwarting staff morale and motivation, anddirectly contributing to problems in recruit-ment and retention (WHO, 1996). These“push” factors are compounded by “pull” fac-
tors, including active recruitment strategies byagencies from rich countries. While the manyaforementioned factors may de-motivate anddiscourage health care workers, other studieshave found that most individuals who do stayin the health sector, work hard and receiverecognition and status from colleagues andfamily (Stillwell, 2001).
Table 2: Projection of the Cost of the Health Personnel Brain Drain for Ghana (in millions of US$)
2001 2002 2003 2004 2005 2006 Total
Physicians 3.60 3.84 4.02 4.14 4.38 4.50 24.48Pharmacists 3.82 4.14 3.58 3.15 2.77 2.51 19.97LabTechnician 0.11 0.15 0.10 0.08 0.07 0.06 0.57GenNurses 1.31 1.31 1.32 1.33 1.33 1.33 7.93Midwives 0.36 0.36 0.36 0.37 0.37 0.37 2.19C.H. Nurses 0.06 0.06 0.07 0.07 0.08 0.08 0.42Total 9.26 9.87 9.45 9.14 8.99 8.86 55.57
Source: Ghana Ministry of Health Report, 2002.

CHAPTER 7
Impact of HIV/AIDS on the Health Sector
hile we have touched upon someof the issues affecting the number,distribution, and performance ofworkers in the health sector, the
enormous impact of the HIV/AIDS epidemicmerits its own discussion. The epidemic hasimpacted health sector workforce in two ways:1) direct costs—labor loss, disability and deathbenefits, and increasing medical aid costs; and2) indirect costs—increased absenteeism,reduced productivity, and stressed workforcefrom additional staff recruitment and trainingof personnel (Kinoti, 2001). See Box 4 for thecase of Kenya.
With a generalized epidemic of HIV/AIDS inmany African countries, health care workersthemselves are being infected, as they are partof the adult, sexually active population. Theimpact of HIV/AIDS is serious and is estimat-ed to be the cause of between 19-53% of alldeaths of government health employees inAfrican countries today (Tawfik and Kinoti,2001). This results in personnel attrition due todeath and absenteeism due to sickness. Forexample, by some estimates a person livingwith AIDS may be away from work for up tohalf the time of their final year of life (Tawfikand Kinoti, 2001). Caring for ill family mem-bers or dependents and attending funerals also
contributes to worker absenteeism. Studies inZimbabwe indicate that almost 60% ofincreased labor costs are attributed toHIV/AIDS absenteeism (Whiteside and Sunter,2001). For a distribution of these costs see Fig-ure 8.
Caring for AIDS patients has made the workenvironment more complex, difficult andstressful as well as a chilling place to work—with the fear of infection and also with a con-stant observance of patients dying. One studyof Zairian nurses indicated that they had to“work significantly more, sometimes at doubleeffort, to care for AIDS patients” (Lombela,1996; cited in Kinoti, 2002).
The HIV/AIDS epidemic has placed addi-tional strain on the health care sector and con-tributed to the human resource crisis. But theextent of the impact of HIV/AIDS on thehealth care sector is not fully known. Morecomprehensive country-level assessments ofthe impact are needed.
In 2000, ABT Associates undertook a healthsector assessment in Botswana (using a 25%prevalence rate as baseline) which projectedHIV-related morbidity and mortality amonghealth workers (Figure 9). The model takesinto consideration the demographic profiles ofhealth workers, leading to two estimations,
17
W

18 The State of the Health Workforce in Sub-Saharan Africa
non-age adjusted and age adjusted. The non-age adjusted estimation assumes that healthworkers have the same HIV/AIDS prevalenceas the general 20-64 age group population.
As illustrated by Figure 9, 2% to 3% ofhealth workers had AIDS in 2001. Assumingno interventions are taken to reverse the epi-demic, 6% to 9% of health workers will be liv-
ing with HIV/AIDS by 2010. The Abt healthsector assessment also showed that the project-ed cumulative AIDS deaths in Botswanaamong health workers will increase from 5%of current health workforce in 2000 to about17% by 2005 and 40% of current healthworkforce by 2010.
40%
16%
17%
9%
6%
5%7% HIV Absenteeism
AIDS Absenteeism
Burial
Recruitment
Funeral
Health Care
Training
Figure 8: Distribution of Increased Labor Costs due to HIV/AIDS in Zimbabwe
Source: Whiteside and Sunter, XXXX.
0123456789
10
2000
2001
2002
2003
2004
2005
2006
2007
2008
2009
2010
Perc
ent
Not age adjusted Age adjusted
Figure 9: Projected Health Workers with AIDS in Botswana (2000 to 2010)
Source: ABT Associates, 2000.

Impact of HIV/AIDS on the Health Sector 19
Box 4: Impact of HIV/AIDS on Kenya’s Health Workforce
Since the first HIV/AIDS case was reported in Kenya in 1984, a total of 1.75 million adultshave been infected. The current prevalence rate of HIV/AIDS is at 9.4%. Assuming a similarinfection rate, 3,500 health workers in Kenya are infected by HIV. The disease caused about55,000 deaths, mainly among young people, including health workers.
A recent study of the impact of HIV/AIDS on the health workforce in Kenya collected datafrom 6 sampled hospitals between 1996 to 2002. The study shows that HIV/AIDS caused anincreased demand for health services. Between 1996 and 2002 there has been a 40% increasein total admissions due to HIV/AIDS. Bed occupancy by HIV related illness is high and is asso-ciated with long stays and frequent re-admissions. Overall, fifty percent of the Medical wards’patients are admitted with HIV/AIDS related illness.
Kenya recently introduced VCT and PMTCT and rapidly scaled up these interventions usingthe existing health workforce. There are strong indicators of overload among the serviceproviders. Ideally a counselor is expected to have an average of 160 clients per month. Thestudy showed that, among the sampled hospitals, each VCT provider had 349 clients, whileeach PMTCT provider had 560 clients per month. Current staffing levels are not adequate tocope with the workload for HIV/AIDS and other services.
Among the sampled facilities, there is a trend toward death becoming the primary reasonfor health personnel attrition (Figure 1). Of the 170 deaths with record of cause, 45% are dueto AIDS related illnesses (pneumonia, tuberculosis, chronic diarrhea and immunosuppression).Further, these deaths occur predominantly among relatively young people (age 15 to 49).
Figure 1: Cause of Health Personnel Attrition
Source: Cheluget, Ngare, Wahiu, et al, 2003.
31.427.7
20.2
13.7
6.30
5
10
15
20
25
30
35
Death Voluntary/Retrechment
Resignation Dismissal Others
Perc
enta
ge

CHAPTER 8
Achieving the Millennium Development Goals
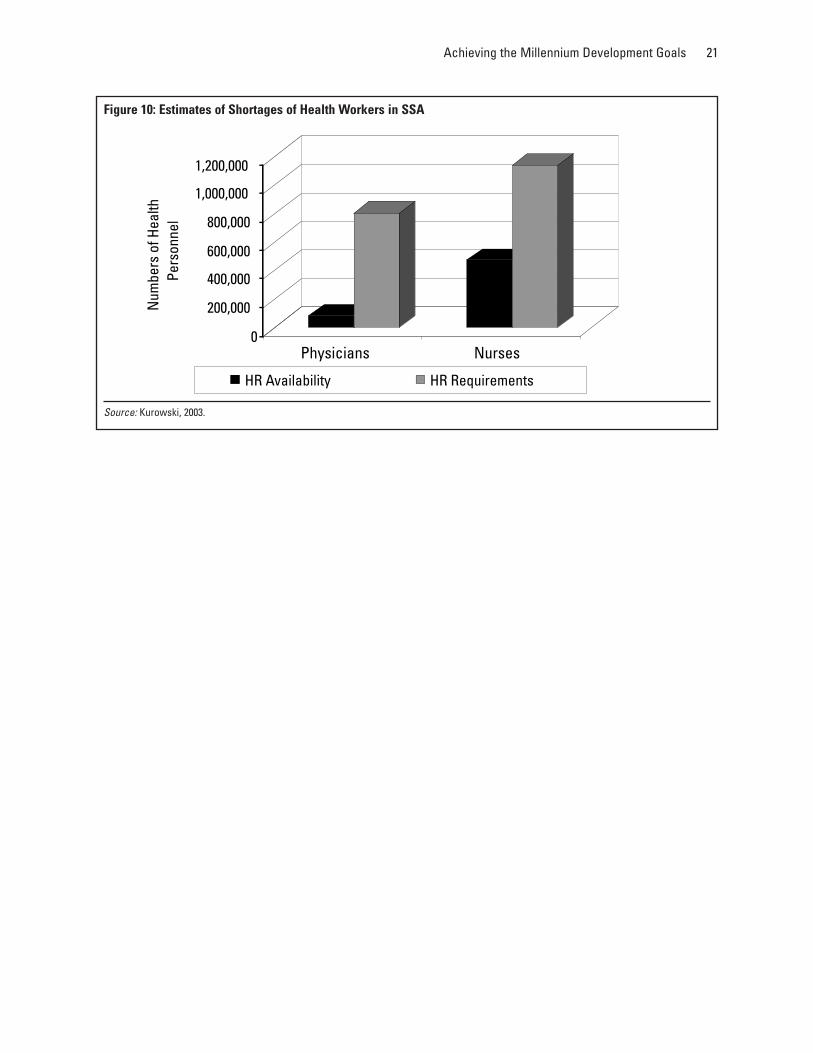
n 2003, Kurowski et al. undertook casestudies of Tanzania and Chad to lookat the ‘role and importance’ of humanresources for scaling up health services
in low-income countries. This study examinedthe size, structure, and compositions of thehealth workforces; and estimated futurehuman resource availability and requirementsfor scaling up priority interventions, as recom-mended by the Commission on Macroeconom-ics and Health.
The study indicates that future staff avail-ability is grossly insufficient for the scaling upof priority interventions, accounting for only40% and 20% of requirements in Tanzaniaand Chad, respectively, by 2015. Shortages arelikely to be greater than indicated, since thetotal health workforce would not be availablefor the provision of priority interventions.Even if training capacities would be immedi-
ately increased by 50%, the 2015 workforcewould constitute only 45% and 25% of totalhuman resource requirements. In Figure 14,Kurowski et al. estimate the shortage of healthworkers for all low and lower-middle incomecountries in SSA.
The study also identified four priority issuesfor scaling up, which merit further research: 1)geographical imbalances must be better under-stood and overcome; 2) more needs to beknown about health staff attrition rates—espe-cially due to emigration—which has implica-tions for training; 3) how can staff productivi-ty (estimated at approximately 50% to 65%)be improved through better staff management;and 4) alternative service delivery mechanismsneed to be developed. Finally, the authorsurged decades-long international commitmentto scaling up, to ensure that the efforts madeare not wasted.
20
I
Achieving the Millennium Development Goals 21
0
200,000
400,000
600,000
800,000
1,000,000
1,200,000N
umbe
rs o
f Hea
lth
Pers
onne
l
Physicians Nurses
HR Availability HR Requirements
Figure 10: Estimates of Shortages of Health Workers in SSA
Source: Kurowski, 2003.

CHAPTER 9
Conclusion
iven the crisis of human resources inthe health sector of sub-SaharanAfrica outlined in this paper, thehealth-related MDGs are arguably
difficult targets for most African countries toattain. However, MDGs are useful in high-lighting underlying problems or constraintshindering their attainment.
Some of the key issues that African govern-ments and development partners should focuson, to address this human resource crisis,include:
• Instituting a consultative process in whichall stakeholders collectively developstrategies to address the crisis facing thehealth workforce.
• Recognizing the importance to alignhealth sector, civil service and macroeco-nomic policies and their objectives toimprove the health workforce (and healthsector) performance.
• Acknowledging that African countriesmust offer internally competitive wagesand benefit packages to retain highlytrained staff; this includes increasing com-pensation so that workers receive a living
wage, and do not have to seek outsideemployment or under-the-table paymentsfor services to survive.
• Investing into training capacities, in par-ticular training that is specifically orient-ed to the needs of national markets tostem brain drain.
• Improving training and knowledgeregarding HIV/AIDS to decrease risk forworkers, address fears and misconcep-tions, and improve patient care.12
• Investing into HIV/AIDS prevention andcare to mitigate the impact of the epidem-ic on the demand for health services andto prevent any further depletion of theworkforce.
• Exploiting alternative service deliverymechanisms (community based, syn-dromic approaches) to reduce the work-load of health personnel.
• Improving the non-monetary incentiveframework faced by health personnel (e.g.continuous training, supervision, appro-priate equipment) to improve motivation
22
G

Conclusion 23
and thus the productivity and quality ofthe health workforce.
The limited availability of human resourcesin Africa is likely to singularly determine the
pace of scaling-up services and to limit thecapacity to absorb additional financialresources. More importantly, it is likely to bethe most significant impediment towards theattainment of the health related MDGs.

Annex
Table 3: WHO Estimates of Health Personnel per 100,000 Population for SSA
Country Physicians1 Nurses1 Midwives2 Pharmacists2
Algeria 85.0 300.0 NA NAAngola 5.0 114.0 4.3 NABenin 10.0 20.0 7.9 NABotswana 28.7 241.0 0.0 NABurkina Faso 4.0 26.0 3.4 NA
Burundi 0.5 1.0 NA NACameroon 7.4 36.7 0.5 NACape Verde 17.1 55.8 NA NACAR 3.5 8.8 4.9 NAChad 2.5 15.0 2.3 NA
Congo 25.1 185.1 24.9 NACôte d’Ivoire 6.8 44.1 15.0 NADR Congo 9.0 31.2 NA NADjibouti 13.0 64.0 NA 2.0Egypt 218.0 284.0 NA 56.0
Eritrea 5.1 21.0 2.2 NAEthiopia 3.0 6.0 NA NAGambia 3.5 12.5 8.2 NAGhana 9.0 64.0 53.2 NAGuinea 13.0 55.7 5.2 NA
Guinea-Bissau 16.6 109.3 12.7 NAKenya 14.1 108.0 NA NALesotho 7.0 33.0 47.0 NALiberia 2.3 5.8 4.3 NALibya 120.0 360.0 NA 23.0
Madagascar 8.7 18.8 10.7 NAMali 4.4 12.6 3.0 NAMauritania 13.8 62.4 10.1 NAMauritius 85.0 232.9 NA NA
24

Annex 25
Country Physicians1 Nurses1 Midwives2 Pharmacists2
Morocco 49.0 101.0 NA 11.0
Mozambique 2.4 20.5 NA NANamibia 29.1 165.8 116.5 NANiger 3.3 23.1 5.5 NANigeria 26.9 66.2 52.4 NASao Tome and Principe 46.7 127.4 29.6 NA
Senegal 10.0 50.0 6.6 NASeychelles 132.4 467.6 394.6 NASierra Leone 8.8 90.7 4.7 NASomalia 4.0 20.0 NA 0.1South Africa 25.1 140.0 NA NA
Sudan 16.0 86.0 NA 1.1Swaziland 15.1 40.0 NA NATanzania 4.1 85.2 44.8 NATogo 5.6 16.7 10.4 NATunisia 70.0 286.0 NA 17.0
Uganda 4.7 5.6 13.6 NAZambia 6.9 113.1 NA NAZimbabwe 5.7 54.1 28.1 NAAfrica Region Average 25.1 93.5 30.9 NA1 Source: WHO 20032 Source: WHO Statistical Information Service. Figures are from one year between 1994-1998, with the exception of Nigeria for which figures arefrom 1992. May be accessed at http://www3.who.int/whosis.

26 The State of the Health Workforce in Sub-Saharan Africa
Table 4: WHO Estimates of Health Personnel per 100,000 Population, Averages
Country Physicians1 Nurses1 Midwives2 Pharmacists2
Sub-Saharan Africa Average 15.5 73.4 30.9 1.1SSA without South Africa Average 15.2 71.8 30.9 1.1North African Average3 108.4 266.2 NA 26.8Four Emerging Countries:India 51.2 62.9 NA NAKorea 180.0 341.0 NA NASingapore 140.0 421.1 NA NAViet Nam 53.8 56.6 17.6 NAFour Emerging Countries’ Average 106.3 220.4 NA NAIndustrialized Countries:Australia 247.4 769.5 40.0 NACanada 187.0 748.0 NA NAFrance 329.7 668.6 21.7 100.0Germany 363.2 954.8 11.3 57.7Italy 606.5 446.5 29.2 102.0Japan 201.5 821.3 18.9 NARussia 420.4 793.0 62.5 6.2UK 164.0 497.0 43.3 58.2USA 279.0 939.0 NA NAIndustrialized Countries’ Average 311.0 737.5 32.4 64.8
1 Source: WHO 20032 Source: WHO Statistical Information Service. Figures are from one year between 1994 and 1998, with the exception of India for which figuresare from 1992. May be accessed at http://www3.who.int/whosis.3 Algeria, Egypt, Libya, Morocco, and Tunisia
Table 5: Trends in Physicians 1960-19981,2
Country 1960 1975/77 1988/92 1992/98 2002
Burkina Faso 1.7 1.8 3.0 3.4 4.0Cameroon 2.5 6.1 8.0 7.4 7.4CAR 2.8 5.7 4.0 3.5 3.5Ghana 8.2 10.0 4.0 6.2 9.0India 17.2 27.6 41.0 48.0 51.2Kenya 9.5 8.4 14.0 13.2 14.1Madagascar 10.4 9.8 12.0 10.7 8.7Morocco 10.6 9.9 21.0 46.0 49.0Tanzania 4.8 6.5 3.0 4.1 4.1Tunisia 10.0 20.8 53.0 70.0 70.0Zambia 8.3 9.8 9.0 6.9 6.91 Measured as physicians per 100,000 population. Figures are from an individual year within the given period.2 Annual statistics from the World Bank and WHO. See: World Bank. 1978 and 1980. World Development Report: World Development Indicators;World Bank. 1993. World Development Report: Investing in Health. p. 208; and WHO. 1998. WHOSIS database. Available athttp://www3.who.int/whosis.

Annex 27
Table 6: Trends in Nurses 1960-19981,2
Country 1960 1975/77 1988/92 1992/98 2002
Burkina Faso 1.7 1.8 3.0 3.4 4.0Cameroon 2.5 6.1 8.0 7.4 7.4CAR 2.8 5.7 4.0 3.5 3.5Ghana 8.2 10.0 4.0 6.2 9.0India 17.2 27.6 41.0 48.0 51.2Kenya 9.5 8.4 14.0 13.2 14.1Madagascar 10.4 9.8 12.0 10.7 8.7Morocco 10.6 9.9 21.0 46.0 49.0Tanzania 4.8 6.5 3.0 4.1 4.1Tunisia 10.0 20.8 53.0 70.0 70.0Zambia 8.3 9.8 9.0 6.9 6.91 Measured as nurses per 100,000 population. Figures are from an individual year within the given period.2 Annual statistics from the World Bank and WHO. See: World Bank. 1978 and 1980. World Development Report: World Development Indicators;World Bank. 1993. World Development Report: Investing in Health. p. 208; and WHO. 1998. WHOSIS database. Available athttp://www3.who.int/whosis.

28 The State of the Health Workforce in Sub-Saharan Africa
Tabl
e 7:
Hea
lth P
erso
nnel
Sta
tistic
al D
atab
ase
IMR
Phys
icia
ns
Nur
ses
Mid
wiv
esDe
ntis
tsPh
arm
acis
ts
GDP
Inco
me
Popu
latio
n IM
R 20
00-
per 1
00,0
00
per 1
00,0
00pe
r 100
,000
pe
r 100
,000
pe
r 100
,000
(2
002)
leve
l1Re
gion
2(2
002)
1990
2002
(199
5-19
99)
Year
(199
5-19
99)
Year
(199
5-19
99)
Year
(199
5-19
99)
Year
(199
5-19
99)
Year
Afgh
anis
tan
13
27,9
63,0
0016
716
511
1997
1819
971
1997
219
97Al
bani
a$1
,071
24
3,19
5,10
037
2312
919
9838
019
9859
.119
9431
.519
9640
.619
94Al
geria
$1,6
572
531
,320
,000
4239
84.6
1995
297.
819
95…
…28
.219
95…
…Am
eric
an S
amoa
70,0
000
Ando
rra
54
70,0
000
625
319
9828
319
989.
419
9853
.119
9889
.119
98An
gola
$598
11
13,8
96,0
0016
615
47.
719
9711
4.5
1997
4.3
1997
019
97…
…An
tigua
& B
arbu
da$9
,204
56
68,8
900
1211
3.6
1996
330.
319
96…
…18
.219
96…
…Ar
gent
ina
$6,5
793
637
,928
,000
2516
268.
419
9276
.819
94…
…66
.219
97…
…Ar
men
ia$1
,495
24
3,07
2,00
050
3131
619
9848
119
9848
.119
9827
.619
983.
819
98Ar
uba
56
90,0
000
Aust
ralia
$24,
801
42
19,5
81,0
008
624
019
9883
019
9840
1998
4019
98…
…Au
stria
$33,
480
44
8,14
0,90
08
530
219
9853
219
9818
.619
9747
.219
9852
.819
97Az
erba
ijan
$505
14
8,18
4,30
084
7736
019
9876
719
9813
719
9827
.119
9833
.119
98
Baha
mas
$13,
836
56
313,
990
2413
151.
819
9622
9.7
1996
……
25.4
1996
……
Bahr
ain
$11,
070
55
671,
970
1513
100
1997
283
1997
919
9720
1997
Bang
lade
sh$3
961
313
5,68
0,00
096
5120
1997
1119
97…
……
……
…Ba
rbad
os$8
,610
56
269,
380
1412
125.
419
9333
0.3
1993
……
16.1
1993
……
Bela
rus
$1,5
792
49,
930,
800
1817
443
1998
1182
1998
67.6
1998
40.6
1998
30.7
1998
Belg
ium
$31,
333
44
10,3
20,0
008
539
519
9810
7519
9665
1996
68.2
1998
145
1998
Beliz
e$3
,227
36
253,
330
3934
54.8
1996
8219
96…
…10
.619
96…
…Be
nin
$435
11
6,60
3,40
011
194
5.7
1995
20.4
1995
7.9
1995
0.3
1995
……
Berm
uda
56
60,0
000
Bhut
an$5
801
385
0,82
00
7416
1995
3919
9556
1995
……
……
Boliv
ia$9
472
68,
697,
100
8760
129.
919
9769
.419
97…
…21
.119
97…
…Bo
snia
&He
rzeg
ovin
a$1
,671
24
4,12
0,60
018
1514
319
9845
219
9835
.819
9119
1998
1119
98Bo
tsw
ana
$4,2
333
11,
711,
800
4580
23.8
1994
219.
119
940
1994
2.2
1994
……
Braz
il$4
,644
26
174,
490,
000
5031
127.
219
9641
.319
96…
…85
.119
96…
…Br
unei
$17,
650
52
350,
630
106
84.8
1996
401.
519
96…
…12
.819
96…
…Bu
lgar
ia$1
,733
24
7,86
8,00
015
1434
519
9871
319
9870
.619
9858
.619
9818
.519
98Bu
rkin
a Fa
so$2
581
111
,831
,000
118
104
3.4
1995
19.6
1995
3.4
1995
0.3
1995
……
Buru
ndi
$143
11
7,07
1,00
011
411
4…
……
……
……
……
…

Annex 29
IMR
Phys
icia
ns
Nur
ses
Mid
wiv
esDe
ntis
tsPh
arm
acis
ts
GDP
Inco
me
Popu
latio
n IM
R 20
00-
per 1
00,0
00
per 1
00,0
00pe
r 100
,000
pe
r 100
,000
pe
r 100
,000
(2
002)
leve
l1Re
gion
2(2
002)
1990
2002
(199
5-19
99)
Year
(199
5-19
99)
Year
(199
5-19
99)
Year
(199
5-19
99)
Year
(199
5-19
99)
Year
Cam
bodi
a$3
251
212
,487
,000
8097
29.7
1998
73.8
1998
28.8
1998
1.8
1998
……
Cam
eroo
n$7
111
115
,523
,000
8596
7.4
1996
36.7
1996
0.5
1996
0.4
1996
……
Cana
da$2
3,59
04
631
,414
,000
75
229.
119
9589
7.1
1996
……
58.6
1997
……
Cape
Ver
de$1
,571
21
458,
030
4529
17.1
1996
55.6
1996
……
1.5
1996
……
Caym
an Is
land
s5
635
,000
0Ce
ntra
l Afri
can
Repu
blic
$348
11
3,82
8,00
011
511
53.
519
958.
819
954.
919
950.
219
95…
…Ch
ad$2
481
18,
144,
400
118
117
3.3
1994
14.7
1994
2.3
1994
0.2
1994
……
Chan
nel I
slan
ds5
414
9,00
07
6Ch
ile$5
,436
36
15,5
79,0
0016
1011
0.3
1994
47.2
1996
……
41.5
1996
……
Chin
a$9
422
21,
281,
000,
000
3831
161.
719
9898
.619
983.
919
98…
……
…Co
lom
bia
$2,2
742
643
,745
,000
2919
116
1997
48.3
1994
……
40.3
1994
……
Com
oros
$436
11
585,
940
8859
7.4
1997
34.1
1997
1419
9714
1997
……
Cong
o, D
em. R
ep.
$87
11
53,7
97,0
0012
812
96.
919
9644
.219
96…
…1.
119
96…
…Co
ngo,
Rep
$87
11
53,7
97,0
0012
812
925
.119
9518
5.1
1995
24.9
1995
……
……
Cook
Isla
nds
$00
8381
9019
9720
019
9730
1997
9019
97…
…Co
sta
Rica
$3,9
273
63,
941,
800
150
141.
119
9710
9.1
1997
……
39.4
1997
……
Côte
d'Iv
oire
$712
11
16,7
75,0
0010
010
29
1996
31.2
1996
1519
96…
……
…Cr
oatia
$5,5
493
44,
376,
900
117
229
1998
474
1998
3319
9865
.719
9845
.519
98Cu
ba2
611
,263
,000
117
530.
419
9767
7.6
1997
……
84.5
1997
……
Cypr
us$1
4,80
05
476
4,97
011
525
519
9644
719
9665
1995
104
1995
Czec
h Re
publ
ic$5
,691
34
10,2
10,0
0011
430
319
9888
619
9844
.719
9862
1998
44.3
1998
Denm
ark
$39,
211
44
5,37
3,30
08
429
019
9472
219
9421
.119
9788
.619
9518
.219
94Dj
ibou
ti$7
752
565
6,51
011
910
014
1996
7419
961.
719
962
1996
Dom
inic
a$3
,157
36
71,8
0019
1449
.319
9641
5.5
1996
……
5.6
1996
……
Dom
inic
an R
epub
lic$2
,129
26
8,63
4,70
053
4121
5.6
1997
29.9
1997
……
23.4
1997
……
Ecua
dor
$17,
046
26
13,1
12,0
0043
2416
9.6
1997
70.1
1997
……
63.9
1997
……
Egyp
t, Ar
ab R
ep.
$1,2
502
566
,372
,000
7635
202
1996
233
1996
2519
9656
1996
El S
alva
dor
$1,7
632
66,
523,
900
4633
107.
119
9734
.919
97…
…35
.619
97…
…Eq
uato
rial G
uine
a$1
,541
11
481,
420
122
101
24.6
1996
39.5
1996
2.2
1996
119
96…
…Er
itrea
$166
11
4,30
8,80
092
723
1996
1619
962.
219
960.
119
96…
…Es
toni
a$5
,000
34
1,35
8,00
012
1129
719
9862
519
9837
.419
9867
.919
9853
.519
98(c
ontin
ued
non
next
pag
e))

30 The State of the Health Workforce in Sub-Saharan Africa
Tabl
e 7
(con
tinue
d)
IMR
Phys
icia
ns
Nur
ses
Mid
wiv
esDe
ntis
tsPh
arm
acis
ts
GDP
Inco
me
Popu
latio
n IM
R 20
00-
per 1
00,0
00
per 1
00,0
00pe
r 100
,000
pe
r 100
,000
pe
r 100
,000
(2
002)
leve
l1Re
gion
2(2
002)
1990
2002
(199
5-19
99)
Year
(199
5-19
99)
Year
(199
5-19
99)
Year
(199
5-19
99)
Year
(199
5-19
99)
Year
Ethi
opia
$124
11
67,3
35,0
0012
811
6…
……
……
……
……
…
Faer
oe Is
land
s5
450
,000
0Fi
ji$2
,910
22
823,
300
2518
47.6
1997
195.
119
97…
…4.
319
97…
…Fi
nlan
d$3
2,57
54
45,
199,
000
64
299
1998
2162
1998
7819
9893
.719
9814
519
98Fr
ance
$30,
667
44
59,4
42,0
007
430
319
9749
719
9621
.719
9667
.819
9610
019
97Fr
ench
Pol
ynes
ia$1
9,89
55
223
9,80
018
10
Gabo
n$4
,405
31
1,29
0,60
060
60…
……
……
……
……
…Ga
mbi
a, T
he$3
701
11,
375,
700
103
913.
519
9712
.519
978.
219
970.
519
97…
…Ge
orgi
a$5
371
45,
177,
000
2424
436
1998
474
1998
31.1
1998
35.3
1998
9.2
1998
Germ
any
$32,
807
44
82,4
95,0
007
435
019
9895
719
9811
.319
9775
.919
9857
.719
98Gh
ana
$432
11
20,0
71,0
0074
576.
219
9672
1996
53.2
1996
0.2
1996
……
Gree
ce$1
4,15
74
410
,631
,000
105
392
1995
257
1992
18.5
1993
102
1995
69.2
1988
Gren
ada
$3,5
163
610
1,71
030
2049
.519
9736
7.7
1997
……
8.6
1997
……
Guam
52
159,
350
96
Guat
emal
a$1
,545
26
11,9
92,0
0060
4393
.319
9727
1997
……
1319
97…
…Gu
inea
$628
11
7,74
4,40
014
510
913
1995
55.7
1995
5.2
1995
……
……
Guin
ea-B
issa
u$1
931
11,
252,
700
153
130
16.6
1996
109.
419
9612
.719
960.
919
96…
…Gu
yana
$938
26
771,
970
6554
18.1
1997
84.2
1997
……
3.8
1997
……
Haiti
$344
16
8,28
6,50
010
279
8.4
1992
10.7
1997
……
1.2
1992
……
Hond
uras
$711
26
6,75
5,10
047
3183
.219
9725
.519
97…
…16
.819
97…
…Hu
ngar
y$5
,735
34
10,1
66,0
0015
835
719
9838
519
9818
.619
9842
.419
9847
.319
98
Icel
and
$31,
835
44
283,
990
63
326
1997
865
1998
85.9
1998
105
1997
83.1
1997
Indi
a$4
941
31,
048,
300,
000
8067
4819
9245
1992
……
……
……
Indo
nesi
a$1
,060
12
211,
720,
000
6033
1619
9450
1994
2619
94…
……
…Ira
n, Is
lam
ic R
ep.
$1,7
872
565
,540
,000
5435
8519
9625
919
9616
1996
1119
96Ira
q2
524
,256
,000
4010
755
1998
236
1995
5.7
1998
11.8
1998
Irela
nd$3
0,15
74
43,
877,
600
86
219
1998
1593
1998
411
1998
46.2
1998
77.8
1998
Isra
el$1
7,06
75
56,
494,
200
106
385
1998
613
1998
18.6
1998
116
1998
60.5
1998
Italy
$21,
233
44
57,9
19,0
008
455
419
9729
619
8929
.219
8264
.419
9710
219
96

Annex 31
IMR
Phys
icia
ns
Nur
ses
Mid
wiv
esDe
ntis
tsPh
arm
acis
ts
GDP
Inco
me
Popu
latio
n IM
R 20
00-
per 1
00,0
00
per 1
00,0
00pe
r 100
,000
pe
r 100
,000
pe
r 100
,000
(2
002)
leve
l1Re
gion
2(2
002)
1990
2002
(199
5-19
99)
Year
(199
5-19
99)
Year
(199
5-19
99)
Year
(199
5-19
99)
Year
(199
5-19
99)
Year
Jam
aica
$2,1
742
62,
612,
900
1717
140.
119
9664
.519
96…
…9
1994
……
Japa
n$4
4,10
84
412
7,14
0,00
05
319
3.2
1996
744.
919
9618
.919
9668
.619
96…
…Jo
rdan
$1,6
612
55,
171,
300
3527
166
1997
296
1997
4919
9777
1997
Kaza
khst
an$1
,893
24
14,7
95,0
0042
8135
319
9864
919
9856
.119
9825
.119
9865
.719
94Ke
nya
$325
11
31,3
45,0
0063
7813
.219
9590
.119
95…
…2.
219
95…
…Ki
ribat
i$5
752
294
,700
6551
29.6
1998
235.
819
98…
…4.
919
98…
…Ko
rea,
Dem
. Rep
.1
222
,519
,000
2642
297
1995
180
1995
6019
95…
……
…Ko
rea,
Rep
.$1
4,28
04
247
,640
,000
85
136.
119
9729
1.2
1997
……
33.4
1997
……
Kuw
ait
$13,
345
55
2,10
3,90
014
918
919
9747
519
9726
1997
3519
96Ky
rgyz
Rep
.$1
3,34
51
42,
103,
900
149
301
1998
750
1998
72.8
1998
27.4
1998
6.7
1998
Lao,
PDR
$477
12
5,53
0,10
012
087
24.3
1996
107.
719
96…
…4.
319
96…
…La
tvia
$3,1
003
42,
335,
000
1417
282
1998
549
1998
33.2
1998
43.5
1998
……
Leba
non
$2,8
683
54,
441,
200
3228
210
1997
100
1997
8019
9750
1997
Leso
tho
$577
11
2,08
6,70
010
291
5.4
1995
60.1
1995
4719
950.
519
95…
…Li
beria
$199
11
3,29
5,10
015
715
72.
319
975.
919
974.
319
970.
119
97…
…Li
bya
35
5,53
3,90
034
1612
819
9736
019
9613
1996
2319
96Li
thua
nia
$2,6
593
43,
476,
000
108
395
1998
884
1998
43.5
1998
6119
9857
.819
98Lu
xem
bour
g$5
6,51
34
444
3,50
07
527
219
9878
219
9821
.919
9865
.819
9869
.419
98
Mac
edon
ia, F
YR$2
,418
24
2,03
8,00
032
2220
419
9848
819
9866
.619
9851
.919
9814
.919
98M
adag
asca
r$2
171
116
,437
,000
103
8410
.719
9621
.619
9610
.719
961
1996
……
Mal
awi
$162
11
10,7
43,0
0014
611
4…
……
……
……
……
…M
alay
sia
$4,8
113
224
,305
,000
168
65.8
1997
113.
319
9727
.119
978.
619
97…
…M
aldi
ves
$1,9
902
328
6,68
080
5840
1995
113
1995
185
1995
……
……
Mal
i$3
131
111
,346
,000
152
141
4.7
1994
13.1
1994
319
940.
119
94…
…M
alta
$10,
098
55
397,
000
95
261
1998
1100
1993
77.1
1993
35.8
1998
49.3
1998
Mar
shal
l Isl
ands
$1,5
542
253
,200
6354
42.2
1996
148.
819
9610
.119
965.
119
96…
…M
aurit
ania
$513
11
2,82
8,00
012
012
013
.819
9562
.419
9510
.119
952
1995
……
Mau
ritiu
s$4
,537
31
1,21
2,40
021
1785
1995
232.
919
95…
…13
.519
95…
…M
exic
o$3
,713
36
100,
920,
000
3724
186.
419
9086
.519
95…
…65
.919
90…
…M
icro
nesi
a Fe
d. S
ts.
$3,7
132
210
0,92
0,00
037
2457
.319
9927
919
990.
819
9912
.219
99…
…(c
ontin
ued
on n
ext p
age)

32 The State of the Health Workforce in Sub-Saharan Africa
Tabl
e 7
(con
tinue
d)
IMR
Phys
icia
ns
Nur
ses
Mid
wiv
esDe
ntis
tsPh
arm
acis
ts
GDP
Inco
me
Popu
latio
n IM
R 20
00-
per 1
00,0
00
per 1
00,0
00pe
r 100
,000
pe
r 100
,000
pe
r 100
,000
(2
002)
leve
l1Re
gion
2(2
002)
1990
2002
(199
5-19
99)
Year
(199
5-19
99)
Year
(199
5-19
99)
Year
(199
5-19
99)
Year
(199
5-19
99)
Year
Mol
dova
, Rep
.$7
291
44,
255,
000
3027
350
1998
874
1998
87.1
1998
41.2
1998
67.5
1994
Mon
aco
54
30,0
000
066
419
9516
2119
9535
.719
9512
119
9521
819
95M
ongo
lia$4
401
22,
448,
500
7761
243.
319
9830
7.3
1998
……
13.5
1998
……
Mor
occo
$1,4
761
529
,641
,000
6639
4619
9710
519
974
1997
1119
96M
ozam
biqu
e$2
291
118
,438
,000
143
125
……
……
……
……
……
Mya
nmar
12
48,8
95,0
0091
7729
.719
9926
.119
9922
.119
992.
119
99…
…
Nam
ibia
$2,4
122
11,
823,
200
6555
29.5
1997
168
1997
116.
519
974
1997
……
Nau
ru3
$00
6555
157
1995
588
1995
……
……
……
Nep
al$2
411
324
,122
,000
100
04
1995
519
957.
419
95…
……
…N
ethe
rland
s$3
1,16
04
416
,144
,000
75
251
1990
902
1991
9.1
1997
47.1
1996
17.4
1997
New
Zea
land
$19,
024
44
3,86
9,60
08
621
7.5
1997
771
1997
56.2
1997
3919
97…
…N
icar
agua
$437
16
5,33
4,90
052
3685
.619
9791
.919
97…
…18
.619
97…
…N
iger
$207
11
11,5
42,0
0019
115
63.
519
9722
.919
975.
519
970.
219
97…
…N
iger
ia$2
481
113
2,78
0,00
011
411
018
.519
9266
.119
9252
.419
922.
619
92…
…N
iue3
$00
114
110
130.
419
9647
8.3
1996
8719
9687
1996
……
Nor
way
$38,
843
44
4,53
8,70
07
441
319
9818
4019
9859
.119
9811
819
9857
.119
98
Oman
$6,2
773
52,
539,
400
2512
133
1998
325
1998
919
9819
1998
Paki
stan
$527
13
144,
900,
000
9684
5719
9734
1996
2.3
1997
3419
96Pa
lau
$5,4
353
219
,900
024
110.
419
9814
419
985.
619
9811
1998
……
Pana
ma
$3,8
392
62,
940,
400
2719
166.
819
9514
4.1
1997
……
83.8
1997
……
Papu
a N
ew G
uine
a$8
561
25,
373,
300
7970
7.3
1998
6719
98…
…2.
719
98…
…Pa
ragu
ay$1
,703
26
5,51
0,00
030
2610
9.8
1997
23.9
1997
……
22.8
1997
……
Peru
$2,4
042
626
,749
,000
5830
93.2
1997
115.
219
97…
…39
.619
97…
…Ph
ilipp
ines
$1,1
952
279
,944
,000
4529
123
1996
418
1996
163
1996
5219
96…
…Po
land
$3,7
623
438
,626
,000
198
236
1997
527
1990
64.3
1997
45.6
1997
53.5
1997
Portu
gal
$13,
151
44
10,0
32,0
0011
531
219
9837
919
988.
319
8433
.319
9875
.319
98
Qata
r5
561
0,49
019
1112
619
9628
919
9621
1996
5119
96
Rom
ania
$1,6
112
422
,355
,000
2719
184
1998
409
1998
39.6
1998
23.9
1998
7.3
1998
Russ
ian
Fede
ratio
n$2
,734
24
144,
070,
000
1718
421
1998
821
1998
62.5
1998
32.2
1998
6.2
1998

Annex 33
IMR
Phys
icia
ns
Nur
ses
Mid
wiv
esDe
ntis
tsPh
arm
acis
ts
GDP
Inco
me
Popu
latio
n IM
R 20
00-
per 1
00,0
00
per 1
00,0
00pe
r 100
,000
pe
r 100
,000
pe
r 100
,000
(2
002)
leve
l1Re
gion
2(2
002)
1990
2002
(199
5-19
99)
Year
(199
5-19
99)
Year
(199
5-19
99)
Year
(199
5-19
99)
Year
(199
5-19
99)
Year
Rwan
da$2
951
18,
163,
000
107
96…
……
……
……
……
…
Sam
oa$1
,491
22
176,
200
3320
34.4
1996
155
1996
3619
964
1996
……
San
Mar
ino
54
30,0
000
425
219
9050
819
9026
1990
36.4
1984
52.1
1990
Sao
Tom
e &
Prin
cipe
$347
11
154,
210
6957
46.7
1996
127.
419
9629
.619
965.
219
96…
…Sa
udi A
rabi
a$6
,614
35
22,1
16,0
0034
2316
619
9733
019
9716
1997
2119
97Se
nega
l$6
281
110
,007
,000
9079
7.5
1995
22.1
1995
6.6
1995
1.2
1995
……
Seyc
helle
s$5
,715
31
83,5
9017
1313
2.4
1996
467.
619
9639
4.6
1996
12.2
1996
……
Sier
ra L
eone
$165
11
5,23
5,50
018
518
27.
319
9633
1996
4.7
1996
0.4
1996
……
Sing
apor
e$2
7,25
45
24,
164,
000
73
162.
719
9849
2.1
1998
……
28.9
1998
……
Slov
ak R
ep.
$27,
254
34
4,16
4,00
07
335
319
9870
819
9539
.319
9548
.219
9833
.819
98Sl
oven
ia$1
2,32
65
41,
992,
000
84
228
1998
681
1998
32.7
1990
60.8
1998
36.3
1998
Solo
mon
Isla
nds
$527
12
443,
300
2920
1419
9511
919
95…
…7
1995
……
Som
alia
11
9,39
0,80
013
313
34
1997
2019
970.
219
970.
119
97So
uth
Afric
a$4
,183
21
43,5
80,0
0045
5656
.319
9647
1.8
1996
……
17.8
1996
……
Spai
n$1
7,88
54
441
,180
,000
84
424
1997
458
1997
16.2
1988
38.5
1997
113
1997
Sri L
anka
$891
23
18,9
68,0
0019
1736
.519
9910
2.7
1999
41.9
1999
2.5
1999
4.5
1999
St. K
itts
& N
evis
$6,1
253
645
,980
3020
117.
119
9749
7.6
1997
……
19.5
1997
……
St. L
ucia
$3,7
093
615
8,52
019
1747
.319
9726
319
97…
…6.
219
97…
…St
. Vin
cent
&
the
Gren
adin
es$2
,471
26
116,
720
2122
87.7
1997
238.
619
97…
…5.
319
97…
…Su
dan
$356
11
32,3
65,0
0075
659
1996
5819
960.
719
961.
119
96Su
rinam
e$1
,057
26
422,
570
3526
25.2
1996
156.
319
96…
…0.
919
96…
…Sw
azila
nd$1
,528
21
1,08
8,20
077
106
15.1
1996
……
……
……
……
Swed
en$3
2,11
74
48,
924,
000
63
311
1997
821
1997
71.8
1991
152
1997
67.3
1998
Switz
erla
nd$4
6,99
34
47,
227,
500
75
323
1998
779
1990
26.5
1990
48.8
1997
61.5
1998
Syria
n Ar
ab R
ep.
$801
25
17,0
05,0
0037
2314
419
9818
919
9874
1998
5319
98
Tajik
ista
n$4
531
46,
315,
700
980
201
1998
484
1998
65.4
1998
18.4
1998
1219
98Ta
nzan
ia$2
041
135
,181
,000
102
104
4.1
1995
85.2
1995
44.8
1995
0.7
1995
……
Thai
land
$2,9
862
261
,613
,000
3424
2419
9587
1995
……
……
……
Tim
or-L
este
753,
000
085
Togo
$324
11
4,76
6,60
088
797.
619
9529
.719
9510
.419
950.
719
95…
…(c
ontin
ued
on n
ext p
age)

34 The State of the Health Workforce in Sub-Saharan Africa
Tabl
e 7
(con
tinue
d)
IMR
Phys
icia
ns
Nur
ses
Mid
wiv
esDe
ntis
tsPh
arm
acis
ts
GDP
Inco
me
Popu
latio
n IM
R 20
00-
per 1
00,0
00
per 1
00,0
00pe
r 100
,000
pe
r 100
,000
pe
r 100
,000
(2
002)
leve
l1Re
gion
2(2
002)
1990
2002
(199
5-19
99)
Year
(199
5-19
99)
Year
(199
5-19
99)
Year
(199
5-19
99)
Year
(199
5-19
99)
Year
Tong
a$1
,750
22
101,
160
2517
4419
9731
5.1
1997
3119
979.
219
97…
…Tr
inid
ad &
Tob
ago
$5,4
663
61,
318,
300
2117
78.8
1994
286.
819
94…
…8.
419
97…
…Tu
nisi
a$2
,580
25
9,78
8,30
037
2170
1997
286
1997
1319
9717
1997
Turk
ey$2
,942
24
69,6
26,0
0061
3612
119
9810
919
9864
.419
9821
1998
33.6
1998
Turk
men
ista
n$1
,787
24
5,54
5,40
080
6930
019
9758
719
9778
.419
9721
.619
9733
.519
97Tu
valu
3$0
080
6930
1999
300
1999
9019
9910
1999
……
Ugan
da$3
671
123
,395
,000
100
79…
…18
.719
9613
.619
960.
219
96…
…Uk
rain
e$1
,038
24
48,7
17,0
0018
1729
919
9873
619
9858
.719
9839
1998
46.7
1997
Unite
d Ar
ab
Emira
tes
$15,
590
55
3,04
9,20
012
818
119
9734
119
9626
1996
8119
96Un
ited
King
dom
$23,
015
44
58,8
58,0
008
616
419
9349
719
8943
.319
8939
.819
9258
.219
92Un
ited
Stat
es$3
1,97
74
428
8,37
0,00
09
727
919
9597
219
96…
…59
.819
96…
…Ur
ugua
y$5
,463
36
3,38
1,00
020
1437
0.3
1996
7019
96…
…12
6.3
1996
……
Uzbe
kist
an$5
251
425
,391
,000
5352
309
1998
1011
1998
67.5
1998
24.4
1998
3.1
1998
Vanu
atu
$1,1
762
220
5,57
052
3412
1997
260
1997
……
……
……
Vene
zuel
a, R
B$2
,978
36
25,0
93,0
0023
1923
6.3
1997
64.4
1997
……
57.1
1997
……
Viet
Nam
$2,9
781
225
,093
,000
2319
4819
9856
1998
17.6
1998
……
……
Yem
en, R
ep.
$314
15
18,6
01,0
0098
7923
1996
5119
951.
619
964
1996
Zam
bia
$410
11
10,4
61,0
0010
811
26.
919
9511
3.1
1995
……
……
……
Zim
babw
e$5
221
112
,967
,000
5376
13.9
1995
128.
719
9528
.119
951.
319
95…
…
1 Th
e m
easu
re fo
r inc
ome
leve
l, 1,
2, 3
, 4, a
nd 5
cor
resp
onds
to lo
w in
com
e, lo
wer
mid
dle
inco
me,
upp
er m
iddl
e in
com
e, h
igh
inco
me
OECD
, and
hig
h in
com
e no
n-OE
CD c
ount
ries,
resp
ectiv
ely.
2 Th
e m
easu
re fo
r reg
ion,
1, 2
, 3, 4
, and
5 c
orre
spon
ds to
SSA
, EAP
, SA,
ECA
, and
MEN
A co
untri
es, r
espe
ctiv
ely.
3 N
o W
DI d
ata.
Sour
ce: C
ourte
sy o
f Chr
isto
pher
Kur
owsk
i

Annex 35
Table 8: Brain loss in 9 SSA countries, by profession
Country Physicians Nurses and Others
Cameroon 49% of health workers have intention to emigrate (p.47) (Awases, Gbary, and Chatora, 2003).
Ghana 600 Ghanaian medical practitioners are Ghana has lost about 2,500 nurses to Europe practicing in New York. 62% of health workers from 1999 to 2002 according to the president of have intention to emigrate (p.47) (Frimpong, 2002). the nurse association of Ghana (Awases, Gbary,
and Chatora, 2003).604 (70%) out of 604 out of the 871 (70%) medical officers trained between 1993-2002 left the Ghana lost 328 nurses in 1999 which was country (Safo, 2003). equivalent of its annual output (Loewenson and
Thomson, 2002).UNDP notes that in Africa, the loss of physicians has been the most striking. At least 60% of physicians trained in Ghana during the 1980s have left the country (Mutume, 2003).In 1999, 40 of Ghana’s 43 final year medical students planned to leave immediately after graduation, while 70% of its 1995 graduates had already emigrated by 1999 (Loewenson and Thomson, 2002).
Kenya Kenya estimated that only 600 physicians work in public hospitals out of more than 5000 registered. The rest have moved abroad or are working in private sector (Pang, Lansang, and Haines, 2002)
Malawi In 2001, the School of Medicine stated that: Outof a group of 35 RN graduates, some went towork with NGOs and 4 went directly overseas.Four of their teachers also went to work over-seas (p.30) (Martineau et al, 2001).
The Nursing Association reports that in 2001, 100nurses applied for references application towork abroad and 80 have made similar requestup to September 2002 (Hornby, Kathyola, andMartineau, 2002).
Nurses and midwives registering with the UK CC(Loewenson and Thomson, 2002):
1998/1999: 11999/2000: 152000/2001: 45
Senegal 38% of health workers have intention to emigrate (p.47) (Awases, Gbary, and Chatora, 2003).
(continued on next page)

36 The State of the Health Workforce in Sub-Saharan Africa
Table 8 (continued)
Country Physicians Nurses and Others
South Africa 58% of health workers have intention to More than 300 South African specialist nurses emigrate (p.47) (Awases, Gbary, and Chatora, are thought to leave the country every month 2003). (Tettey, 2003).In the past four years(1998-2002), South Africa has 600 of its medical graduates (trained at a Nurses and midwives from South Africa cost of US$ 37 million) registered in New registering with the UK CC (Loewenson and Zealand (Lancet, 2002). Thomson, 2002):
1998/1999: 59910% of Canada’s hospital-based physicians are 1999/2000: 1460South African graduates (Loewenson and 2000/2001: 1086Thomson, 2002).
South Africa medical school suggest that a third to a half of its graduates emigrate to the developed world (Pang, Lansang, and Haines, 2002).
Uganda Uganda produces 150 physicians per annum, Uganda produces 200 registered nurses/estimated migration is 30% for physicians midwives per year, more than 10% of these (Omaswa, 2003). professionals are estimated to migrate
(Omaswa, 2003).Many Ugandan physicians left for more affluent countries. One of South Africa’s medical schools has several senior faculty from Uganda (Bundred and Levitt, 2000).
26% of health workers have intention to emigrate (p.47) (Awases, Gbary, and Chatora, 2003).
Zambia Zambia’s medical school in Lusaka has trained Nurses and midwives from Zambia registering over 600 Zambian medical graduates in its 23 with the UK CC (Loewenson and Thomson, 2002):years, but only 50 work in the Zambia public 1998/1999: 15sector health service now (Bundred and Levitt, 1999/2000: 402000). 2000/2001: 83
The Zambian public health system has retained The principal reason for staff losses is salary, only about 50 of more than 600 physicians with a large number of nurses and midwives trained in the country since independence leaving Zambia for jobs in the UK and the US. (Loewenson and Thomson, 2002). The Zambian government recently increased the
salaries of nurses and midwives, but complaintsthat the salaries remain insufficient even afterthe increase are widespread. Therefore, it is notclear that this recent salary increase willinfluence staff loss rates (Huddart, Lyons, andFurth, 2003).
(conbtinued on next page)

Annex 37
Country Physicians Nurses and Others
Zimbabwe 68% of health workers have intention to 18,000 Zimbabwean nurses work abroad emigrate (p.47) (Awases, Gbary, and Chatora, (Mangwende, 2002).2003).
Nurses and midwives from Zimbabwe registering About 200 physicians left Zimbabwe for with the UK CC (Loewenson and Thomson, 2002):Botswana and South Africa in 1992. Of 1200 1998/1999: 52Physicians trained in Zimbabwe during the 1999/2000: 2211990s, only 360 were still practicing in the 2000/2001: 1086country in 2001. (= 840 went abroad) (Loewenson and Thomson, 2002).
Non-specific UN Commission for Trade and Development estimated that each migrating African professional rep-resents a loss of US$184,000 to Africa. Paradoxically, Africa spends US$4bn a year on the salariesof 100,000 foreign experts (Seepe, 2001).

Notes
1. In many countries, up to three quarters ofrecurrent health expenditures are used onstaffing costs and wages.
2. At the time of writing, the most currentand comprehensive data available is compiledby the WHO, using a variety of national healthsurveys. More information on this topic can befound in Diallo et al. (2003).
3. Burkina Faso, Burundi, Central AfricanRepublic, Chad, Ethiopia, Gambia, Liberia,Mali, Mozambique, Niger, Somalia, Tanzania,and Uganda.
4. As of 2002, SSA had an estimated popu-lation of 693 million, which is expected toincrease to 1081 million by 2025, (PopulationReference Bureau, World Population DataSheet, 2002).
5. Cameroon, CAR, Ghana, Kenya, Mada-gascar, Tanzania, and Zambia.
6. Burkina Faso, Cameroon, CAR, Ghana,and Madagascar.
7. CREDESS, Paris, 1999 data for IvoryCoast, unpublished.
8. See, for example, the case of Cameroon,Congo, and Cote d’Ivoire.
9. These are attributable to demographicfactors (an aging population which requires
more services, a smaller pool of recruits for thehealth professions), social and cultural factors(more career options available to young peo-ple, particularly to women), work related fac-tors (lower attractiveness of health occupationsperceived as demanding and not well reward-ed).
10. Statistics available for South Africa,Zimbabwe, Nigeria, Ghana, Zambia, Kenya,and Malawi.
11. This is often described as “brain drain”,an expression traditionally used to describe thepermanent emigration of qualified persons.The notion of “brain loss” is more compre-hensive, as it also encompasses losses due topeople leaving the health sector to take otherjobs which reward them better.
12. An example of an interesting and poten-tially effective measure is the InternationalCouncil of Nurses supported Zambian NursesAssociation partnership with the ZambianMinistry of Health in the administration of aprogram to provide free testing and treatmentfor pregnant nurses and other health workers(see ICN, http://www.icn.ch/PR26_03.htm).
38

References
Abt Associates South Africa Inc. (2000). TheImpact of HIV/AIDS on the Health Sectorin Botswana. Commissioned by the Min-istry of Finance and Development Plan-ning with support from the UnitedNations Development Program. April.
Adams, R.H. (2003). International migration,remittances and the brain drain: A studyof 24 labor-exporting countries. Washing-ton, DC: World Bank.
Arresting the health brain drain. (2002, Nov.24). Public Agenda (Accra), OPINION.Retrieved January 13, 2003, fromhttp://fr.allafrica.com/stories/print-able/200211250738.html.
Awases, M., A. Gbary, and R. Chatora (2003).Migration of health professionals in sixcountries: A synthesis report. Brazzaville:World Health Organization RegionalOffice for Africa.
BBC (2003). Halting Africa’s health braindrain. BBC News. Retrieved June 30,2003, from http://news.bbc.co.uk/go/pr/fr/-/2/hi/africa/3040825.stm.
Bchir, A. and V. Brouwere (2000). The per-formance of medical doctors in Tunisia.In Ferrinho, P. and W. Van Lerberghe, eds.Providing Health Care Under AdverseConditions: Health Personnel Perfor-
mance and Individual Coping Strategies.Studies in Health Services Organizationand Policy 16. Antwerp: ITGPress.
Buchan, J. (2000). Making up the difference: Areview of the UK nursing labour marketin 2000. London: RCN.
Buchan, J. (2002a). Global nursing shortagesare often a symptom of wider health sys-tem or societal aliments. British MedicalJournal 324: 751-752.
Buchan, J. (2002b). International recruitmentof nurses: United Kingdom case study.London: RCN.
Buchan, J. (2003). Here to stay? Internationalnurses in the UK. London: RCN.
Buchan, J. and I. Seccombe (2002). Behind theheadlines: a review of the UK nursinglabour market in 2001. London: RCN.
Bundred, P. and C. Levitt (2000). Medicalmigration: who are the real losers? TheLancet 356 (9225): 245-246.
Campbell, E.K. (2002). Skills and brain drainand the movement of skilled migrants inSouthern Africa. Paper presented atSAMP/LHR/HSRC workshop on regionalintegration, poverty and South African’sproposed migration policy, Pretoria,South Africa (April 23).
39
40 The State of the Health Workforce in Sub-Saharan Africa
Chatora R. (2003). Migration of Health Pro-fessionals. Presentation at 38th RegionalHealth Ministers’ Conference, Living-stone, ZAMBIA (17-21 November).
Cheluget B., C. Ngare, J. Wahiu, et al. (2003).Impact of HIV/AIDS on Health Work-force in Kenya. Ministry of Health,Kenya.
Commonwealth Secretariat (2002). Common-wealth code of practice for internationalrecruitment of health workers. London:Commonwealth Secretariat.
Diallo, K., P. Zurn, N. Gupta, and M. Dal Poz(2003). Monitoring and evaluation ofhuman resources for health: an interna-tional perspective. Human Resources forHealth 1(3). http://www.human-resources-health.com/content/1/1/3.
Dickson, P. (2002). Unskilled workers pour in.Pretoria News (Oct. 16). Retrieved Jan.17, 2003 from http://www.neasa-sa.com/article20.htm.
Dussault, G. and C. Franceschini (2003). Notenough here, too many there: understand-ing geographic imbalances in the distri-bution of health personnel. Washington,DC: The World Bank Institute.
Elmendorf A.E. and K. Larusso (2003). Healthworkforce issues under World Bank-financed Health, Nutrition and Popula-tion projects in Africa, 1974–2002(Draft). Washington, DC: The WorldBank.
Elmendorf A.E., I. Pimenta (2003). Healthworkforce issues in World Bank macro-economic operations in Africa (Draft).Washington, DC: The World Bank.
Elmendorf A.E. and R. Nesbitt (2003). Healthworkforce issues in HIPC and PRSP doc-umentation of African countries (Draft).Washington, DC: The World Bank.
Fresta, E., M.J. Fresta, and P. Ferrinho (2000).The internal brain drain in the Angolanhealth sector. In Ferrinho, P. and W. VanLerberghe, eds. Providing Health Care
Under Adverse Conditions: Organizationand Policy 16. Antwerp: ITGPress.
Frimpong, D. (2002). GTV News Jan. 21,2002. Cited in Awases, Gbary, and Cha-tora (2003).
Frommel, D. (2002). Quand le Nord débaucheles médecins du Sud. Le Monde diploma-tique 28-29 (April).
Fülop, T. and M. Roemer (1987). Reviewinghealth manpower development: A methodfor improving national health systems.Public Health Paper 83. Geneva: WorldHealth Organization.
Gaidzanwa, R. (1999). Voting with their feet:Migrant Zimbabwean nurses and doctorsin the era of structural adjustment.Nordiska Afrikainstitutet. ResearchReport 11: 79-81.
Ghana Ministry of Health (2002). InternalReport on Human Resources.
Government wakes up to flight for healthworkers. (2002). UN Integrated Regionalinformation Networks, NEWS, May 15.Retrieved Feb. 12, 2003, from http://a l l a f r i c a . c o m / s t o r i e s / p r i n t a b l e /200205150003.html.
Health services threatened by “brain drain”.(2002). UN Integrated Regional informa-tion Networks, NEWS, August. RetrievedFeb. 12, 2003, from http://allafrica.com/stories/printable/200108220382.html.
Hornby, P., J. Kathyola, and T. Martineau(2002). SWAp Design Mission HumanResource Report, 19 September 2002,Malawi.
Huddart, J., J.V. Lyons, and R. Furth (2003).HIV/AIDS Workforce Study, InitiativesInc., October 7, 2003.
Kinoti, S. (2002). The impact of HIV/AIDS onthe health sector in sub-Saharan Africa:The issue of human resources. Paper pre-sented at the consultative meeting onimproving collaboration between healthprofessionals, government and stakehold-ers in human resource development forhealth, Addis Ababa (Jan/Feb).

References 41
Kurowski, C., K. Wyss, S. Abdulla, Yèmadji,N’Diekhor, and A. Mills (2003). Improv-ing the health of the poor: the humanresource challenge. Submitted for publica-tion to The Lancet.
Lancet (2002). Medical migration and inequityof health care. The Lancet 356 (9225),July 15: 177.
Loewenson R. and C. Thomson (2002). Healthpersonnel in Southern Africa: Con-fronting mal-distribution and brain drain.EQUINET discussion paper 3. RegionalNetwork for Equity in Health in SouthernAfrica (EQUINET) Health System Trust(South Africa) and MEDACT (UK).
Lowell, B.L. and A.M. Findlay (2001). Migra-tion of highly skilled persons from devel-oping countries: impact and policyresponses. International Migration Papers44. Geneva: International Labour Office.
Lowell, B.L. (2001). Some developmentaleffects of the international migration ofhighly skilled persons. InternationalMigration Papers 46. Geneva: Interna-tional Labour Office.
Mangwende, B. (2002). Health sector recordsmassive brain drain. Daily News (Zim-babwe), April 10, 2001. Cited in Pang,Langsang, and Haines (2002).
Martineau, T. and J. Buchan (2000). HR andthe success of health sector reform: Elim-inating health disparities. Paper presentedat the 128th annual meeting of the Amer-ican Public Health Association, Boston,MA.
Martineau, T., K. Decker, and P. Bundred(2002). Briefing Note on InternationalMigration of Health Professionals: Level-ing the Playing Field for DevelopingCountry Health Systems. LiverpoolSchool of Tropical Medicine.
Martineau, T., K. Sargent, A. Mvula, and S.Lungu (2001). Institutional and HumanResources Appraisal of Sexual andReproductive Health Program, Mission
Report, April 2001, Ministry of Healthand Population, Government of Malawi.
Mato, N. (2002). Brain drain in Africa. Inter-national Association of University Presi-dents. Retrieved February 20, 2003, fromhttp://www.auc.dk/iaup/5chap5.htm.
Mbanefoh, N. (1992). Dimensions of braindrain in Nigeria: a case study of some crit-ical high level manpower in the universitycollege hospital (UCH), Ibadan. NISERMonograph 8. Ibadan: Nigerian Instituteof Social and Economic Research(NISER).
Mensah, K. (2002). Attracting and retaininghealth staff: A critical analysis of the fac-tors influencing the retention of healthworkers in deprived/hardship areas. Yak-Aky Services.
Ministère de la Santé, Mali (2002). Gestion duService de santé. Technical notes (mimeo-graphed), Mission d’Appui au développe-ment des ressources humaines (MDRH).
Mutume, Gumisai (July 2003). ReversingAfrica’s ‘brain drain’ New initiatives tapskills of African expatriates. AfricaRecovery 17/2.
Ngufor, G. F. (1999). Public service reformsand their impact on health sector person-nel in Cameroon. In ILO/WHO/WorldBank. Public service reforms and theirimpact on health sector personnel: Casestudies on Cameroon, Colombia, Jordan,Philippines, Poland, and Uganda.
OECD (Organization for Economic Co-opera-tion and Development) (2002). Interna-tional migration of physicians and nurses:causes, consequences, and health policyimplications. Paper presented at expertmeeting for human resources for health-care of the OECD Health Project, Paris,France (December).
Omaswa, F.G. (2003) Human resources for theMillennium Development Goals: TheChallenge in Uganda, Meeting of Interest-ed Parties, WHO, Geneva, November4,2003.

42 The State of the Health Workforce in Sub-Saharan Africa
Pablos-Mendez, A., H. Brown, T. Evans, andL. Chen (2002). Strategies on HumanResources for Health and Development:A Joint Exploration. The RockefellerFoundation.
Pang, T., M.A. Lansang, and A. Haines (2002).Brain drain and health professionals: aglobal problem needs global solutions.British Medical Journal 324 (7336): 499-500.
Picazo, O.F. (2002). Better Health Outcomesfrom Limited Resources: Focusing on Pri-ority Services in Malawi. Africa RegionHuman Development Working PapersSeries. Washington, D.C.: World Bank,Africa Region, Human DevelopmentDivision.
Picazo, O.F. (2002). Human Capacity Devel-opment and HIV/AIDS. Slides presentedat Human Capacity Development andHIV/AIDS meeting, London (2-3 Octo-ber).
Population Reference Bureau (2002). WorldPopulation Data Sheet.
Rosenblatt, R., M. Whitcomb, T. Cullen, T., D.Lishner, and G. Hart (1992). Which med-ical schools produce rural physicians.JAMA 268(12): 1559-65.
Safo, A. (2003). 604 Doctors Abandon Ghana.Public Agenda (July 7).
Secretary of State for Health (2000). The NHSplan: A plan for investment, a plan forreform. London: Department of Health.
Secretary of State for Health (2002). Deliver-ing the NHS plan: Next steps on invest-ment, next steps on reform. London:Department of Health.
Seepe S. (2001). “Brain drain costly” Int. Her-ald Trib. (18 October). The brain drainwill continue unabated. Cited in Pang T,M.A. Lansang, and A. Haines (2002).Brain drain and health professionals: Aglobal problems need global solutions.British Medical Journal 324: 499-500.
Shinn, D. (2002). Reversing the Brain Drain inEthiopia. AllAfrica.com (December 6).
Stillwell, B. (2001). Health worker motivationin Zimbabwe. World Health Organiza-tion unpublished.
Tawfik, L. and S. Kinoti (2001). The impact ofHIV/AIDS on the health sector in sub-Saharan Africa: the issue of humanresources. The SARA Project.
Tettey, Wisdom J. (2003). “Africa’s options:Return, retention or diaspora?” SciDevNet, policy briefs, May 2003.
UNAIDS and WHO (2003). AIDS EpidemicUpdate 2003.
USAID SARA (2003). Health sector humanresources crisis in Africa: An issues paper.Support for Analysis and Research inAfrica. Bureau for Africa, Office of Sus-tainable Development, Washington.
Vaughan, P. (1992). Health personnel develop-ment in Sub-Saharan Africa. Policyresearch working paper. Washington, DC:World Bank, Population and HumanResources Department.
Van de Looij, F. and J. Benders (1995). Notjust money: quality of working life asemployment strategy. Health ManpowerManagement 21: 27-33.
Wadda, R. (2000). Brain drain and capacitybuilding in Africa: the Gambian experi-ence. Paper presented at the JointECA/IOM/IDRC Regional Conference onBrain Drain and Capacity Building inAfrica, Addis Ababa, Ethiopia.
Wibulpolprasert, S. (2002). Integrated strate-gies to tackle inequitable distribution ofdoctors in Thailand: four decades ofexperience. Thailand: Ministry of PublicHealth.
Wiskow, C. (1999). Summary of findings fromthe country studies on Ghana andCameroon. Human resource managementand development in district health seriesin African countries. GTZ.
Whiteside, A and C. Sunter (2001).AIDS: Thechallenge for South Africa. Human &Rosseau

References 43
World Bank (1999). Operations EvaluationDepartment. Development Effectivenessin Health, Nutrition, and Population:Lessons from World Bank Experience.Sector Study (May).
World Bank (2002). Santé et Pauvreté auNiger. Vers les objectifs Internationaux.Le Groupe Thématique Santé et Pauvretédu Niger en préparation du Document deStratégie de Réduction de la Pauvreté(Draft). Washington D.C. (July).
World Health Organization (1996). Strength-ening nursing and midwifery: Progressand future directions, 1996-2000. Gene-va: WHO.
World Health Organization (2000). WorldHealth Report 2000. Geneva: WHO.
World Health Organization (2001). Humanresources in health toolkit for planning,training, and management, country HRHproblems and policies. Retrieved on Feb-ruary 2, 2003 from http://hrhtootlkit.forumone.com/mstr_workforce…/work-force-05.htm.
World Health Organization (2002). Strategicdirections for strengthening nursing andmidwifery services. Geneva: WHO.
World Health Organization (2001). Macroeco-nomics and Health: investing in health foreconomic development. Commission onMacroeconomics and Health chaired byJ.D. Sachs. Presented to G.H. Brundtland,Director-General of the WHO, Geneva(December 20).
World Health Organization (2002). Buildingstrategic partnerships in education andhealth in Africa. Regional Office forAfrica. Document presented at the con-
sultative meeting on improving collabora-tion between health professionals, gov-ernments, and other stakeholders inhuman resources for health development,Addis Ababa, Ethiopia.
World Health Organization (2002). The HRDAdvocacy Pack. Regional Office forAfrica. Compiled and mimeographed bySchool of Public Health, University ofWestern Cape, South Africa.
World Health Organization and World Bank(2002). Building Strategic Partnerships inEducation and Health in Africa. Reportpresented at the consultative meeting onimproving collaboration between healthprofessionals, governments and otherstakeholders in human resources forhealth development, Addis Ababa,Ethiopia.
Wyss K., M.D. Doumagoum, and B. Calle-waert (in press). Constraints to Scaling-uphealth related interventions: The case ofChad, Central Africa. Journal for Interna-tional Development, in press.
Wyss, K., D.D. Moto, N. Yémadji, and C.Kurowski (2002). Human resources avail-ability and requirements in Chad. SwissCenter for International Health, SwissTropical Institute, Basel.
Zimbabwe: Only one doctor left for Bulawayo.(2003, June 23). The Daily News Harare.
Zinyama, L.M. (1990). “International migra-tions to and from Zimbabwe and theinfluence of political changes on popula-tion movements, 1965-1987,” Interna-tional Migration Review (electronic ver-sion) 24(4): 748-767.