CHAPTE R 17 Malawi’s Agricultural Input Subsidy Program...
30
289 T CHAPTER 17 Malawi’ s Agricultural Input Subsidy Pr ogram Experience over 2005–09 Andrew Dorward, Ephraim Chirwa, and T. S. Jayne he implementation in Malawi of a large-scale agri- cultural input subsidy program in the 2005/06 agricultural season and in subsequent years has attracted significant international interest. 1 While much of this attention has applauded reported growth in maize pro- duction and food security in the country, there have also been significant criticisms and questions. These have focused on the effectiveness and efficiency of the program in raising maize productivity, its impacts on the develop- ment of sustainable commercial input markets (Ricker- Gilbert, Jayne, and Chirwa 2011), its high and (from 2005/06 to 2008/09) dramatically rising fiscal and macro- economic costs, its opportunity costs (in terms of crowding out of other investments), its overall return on investment, and its sustainability (SOAS et al. 2008; Dorward and Chirwa 2009a, 2009b, 2010; Dorward, Chirwa, and Slater 2010a, 2010b; Kelly, Boughton, and Lenski 2010). The importance of agriculture—specifically, maize—to the Malawian economy and to the livelihoods of most Malawian people is the critical backdrop to the agricultural input subsidy program (AISP), together with low agricul- tural and maize productivity and associated high national, individual, and household food insecurity. 2 Large numbers of very poor people in Malawi work on very small areas of land that are predominantly planted to maize (see table 17.1 for some key indicators). Continual cultivation of maize on the same land without addition of organic or inorganic fer- tilizers leads to low yields. Low yields then lead to inability to afford the purchase of inputs. Purchase of inputs on credit is also not possible for most farmers because rural credit markets are underdeveloped and the costs of credit administration are too high, as are risks for both borrowers and lenders. Low volumes of input demand, poor infra- structure, and high transport costs lead to high input costs and inhibit the development of input supply systems in less accessible areas, while highly variable maize prices (dis- cussed below) add to the risks of input use (whether pur- chased with cash or credit). Increasing maize productivity is difficult for several rea- sons. Only 10 percent of Malawian maize producers are net sellers of maize, while 60 percent are net buyers of maize (SOAS et al. 2008), and hence most (particularly poorer) people’ s livelihoods and food security are damaged by high maize prices. Increased maize productivity from the use of purchased inputs requires, however, that the use of the inputs is profitable for farmers, and that requires sufficiently high maize prices and yield responses to cover the costs of inputs. Unless substantial improvements can be made in Andrew Dorward is Professor of Development Economics at the School of Oriental and African Studies, University of London; Ephraim Chirwa is Professor of Economics at Chancellor College, University of Malawi; and T. S. Jayne is Professor of International Development at Michigan State University.
Transcript of CHAPTE R 17 Malawi’s Agricultural Input Subsidy Program...

289
T
C H A P T E R 1 7
Malawi’s Agricultural Input Subsidy Program Experience over 2005–09
Andrew Dorward, Ephraim Chirwa, and T. S. Jayne
he implementation in Malawi of a large-scale agri- cultural input subsidy program in the 2005/06 agricultural season and in subsequent years has
attracted significant international interest. 1 While much of this attention has applauded reported growth in maize pro- duction and food security in the country, there have also been significant criticisms and questions. These have focused on the effectiveness and efficiency of the program in raising maize productivity, its impacts on the develop- ment of sustainable commercial input markets (Ricker- Gilbert, Jayne, and Chirwa 2011), its high and (from 2005/06 to 2008/09) dramatically rising fiscal and macro- economic costs, its opportunity costs (in terms of crowding out of other investments), its overall return on investment, and its sustainability (SOAS et al. 2008; Dorward and Chirwa 2009a, 2009b, 2010; Dorward, Chirwa, and Slater 2010a, 2010b; Kelly, Boughton, and Lenski 2010).
The importance of agriculture—specifically, maize—to the Malawian economy and to the livelihoods of most Malawian people is the critical backdrop to the agricultural input subsidy program (AISP), together with low agricul- tural and maize productivity and associated high national, individual, and household food insecurity.2 Large numbers of very poor people in Malawi work on very small areas of
land that are predominantly planted to maize (see table 17.1 for some key indicators). Continual cultivation of maize on the same land without addition of organic or inorganic fer- tilizers leads to low yields. Low yields then lead to inability to afford the purchase of inputs. Purchase of inputs on credit is also not possible for most farmers because rural credit markets are underdeveloped and the costs of credit administration are too high, as are risks for both borrowers and lenders. Low volumes of input demand, poor infra- structure, and high transport costs lead to high input costs and inhibit the development of input supply systems in less accessible areas, while highly variable maize prices (dis- cussed below) add to the risks of input use (whether pur- chased with cash or credit).
Increasing maize productivity is difficult for several rea- sons. Only 10 percent of Malawian maize producers are net sellers of maize, while 60 percent are net buyers of maize (SOAS et al. 2008), and hence most (particularly poorer) people’s livelihoods and food security are damaged by high maize prices. Increased maize productivity from the use of purchased inputs requires, however, that the use of the inputs is profitable for farmers, and that requires sufficiently high maize prices and yield responses to cover the costs of inputs. Unless substantial improvements can be made in
Andrew Dorward is Professor of Development Economics at the School of Oriental and African Studies, University of London; Ephraim Chirwa is Professor of Economics at Chancellor College, University of Malawi; and T. S. Jayne is Professor of International Development at Michigan State University.

2 CHAPTER 17: MALAWI’S AGRICULTURAL INPUT SUBSIDY PROGRAM EXPERIENCE OVER 2005–09
Table 17.1 Key Data on Smallholder Agriculture in Malawi, 2004/05
Indicator North Center South National Rural population (percent of total population) 10 38 40 88 Income and poverty
Median expenditure/capita (MK thousands)
17
20.9
16.9
17.5 Poor households (percent of rural population) 56 47 64 52
Nutrition and food security Mean rural daily per capita consumption (kilocalories) for people living
below the poverty line 1,738 1,811 1,703 1,746 Incidence of stunting in children 6 months–5 years (percent) 39.6 47.9 40.8 43.7 Incidence of underweight children 6 months–5 years (percent) 16.1 20 17.2 18.3 Share of calories from own production 0.53 0.58 0.47 0.52 Median month after 2004/05 harvest own food crop exhausted (actual)* — — — 4 Suffered large rise in food prices in past 5 years (percent) — — — 79.2
Smallholder agriculture Landholding:
Less than 0.5 hectare/household (percent ) 12.1 15.4 25.4 19.9 Less than 1.0 hectare/household (percent ) 31.4 40.6 54.1 46.2
Suffered crop yield loss in past 5 years (percent) — — — 68.8 Maize growers (percent) 93 97 99 97 Access to credit for food crop inputs (percent ) 2.5 4.2 3.0 3.4 Percentage of smallholder farmers purchasing fertilizer (percent) 37 44 39 43 Fertilizer applied on all fields (kilograms)a 32 45 24 34 Fertilizer applied on fertilized maize fields (kilograms/hectare) 139 111 77 101
Source: SOAS et al. (2008) using data from NSO (2005) except * (authors’ calculations from NSO 2006). Note: — = not available. $1 = MK 140 for most of the years covered in this paper. a. Fertilizer rates on tobacco plots are roughly double rates across all plots.
yield responses, there is a significant dilemma between the need for low maize prices for a large numbers of poor maize buyers (who are also significant maize producers) and the need for higher maize prices to allow increased returns from input use to reliably cover the purchase costs. Further diffi- culties arise from high maize price variability, which dam- ages both producers and consumers—low prices present risks to investments in inputs by producers who aim to have a marketable surplus, while high prices present risks to con- sumers (including the majority of smallholder farmers). Poor access to international and domestic markets (caused in large part by historically low public investment in trans- port infrastructure), seasonal scarcities, and poor local market development (resulting from low and uncertain vol- umes, high costs of transport, and uncertain government intervention) have led in the past to high intra- and inter- seasonal maize price variation (as well as higher farm gate input prices and lower farm gate produce prices), further depressing market development. Risks of high maize prices encourage poor consumers to grow as much of their own staple food as possible, even at very low levels of productiv- ity. At the same time, there are limited higher-earning opportunities within or outside agriculture. The result is a lock-in to low-productivity maize cultivation.
Productivity and investment in productive activities are further constrained by poverty and by vulnerability to a wide variety of (often related) shocks, particularly low crop yields, sickness affecting household members, high food prices, and losses of employment or remittance income. Women, who play a key role in agricultural production and rural livelihoods, tend to be particularly vulnerable to these shocks. Macroeconomic conditions before 2005—namely, high real interest rates, high inflation, and significant deval- uation of the kwacha (MK)—also inhibited growth. How- ever, macroeconomic management has improved dramati- cally since 2004.
Agricultural, rural, and national economic development in Malawi are therefore constrained by a number of inter- acting household, local, and national vulnerability, poverty and productivity traps, as illustrated in figure 17.1. These traps constrain input and maize market development, investments in maize intensification, diversification out of maize into other agricultural and nonagricultural activities, the ability of rural people (particularly the poor) to protect themselves from shocks, and wider local and national eco- nomic development. The result is a vicious circle of unsta- ble maize prices inhibiting net producers’ investment in maize production, net consumers’ reliance on the market

CHAPTER 17: MALAWI’S AGRICULTURAL INPUT SUBSIDY PROGRAM EXPERIENCE OVER 2005–09 291
Figure 17.1 Vicious Circle of the Low Maize Productivity Trap
Unstable policies
Unstable weather
Slow private sector
development
Poor roads
Unstable maize prices
Low producer
investment
Low maize
and agriculture
productivity
Consumer
to low-productivity maize
Lock-in
Low demand for nonagriculture
goods and services
Low and vulnerable real incomes
Source: Authors. Note: Light green arrows represent feedback effect.
for maize purchases, and poor consumers’ escape from low- productivity maize cultivation. These in turn inhibit the growth of the nonfarm economy. Sustained improvements in maize productivity with low and stable prices are required to drive diversification out of low productivity maize into a more diversified and productive economy that benefits all Malawians, particularly those who are currently poor and food insecure.3
Input subsidy and maize market intervention policies have been a long-standing, major, though often contentious, feature of strategies of both the government of Malawi and varied donors’ to promote agriculture and food security. From the mid-1970s to the early 1990s, the government financed a universal fertilizer subsidy, subsidized small- holder credit, and controlled maize prices. The system began to break down in the late 1980s and early 1990s, how- ever, with cash flow difficulties, rising treasury deficits, par- tial market liberalization and increasing importance of parallel grain markets. The state system of subsidized input loans, with loan recovery through farmers’ delivery of grain to the Agricultural Development and Marketing Corpora- tion (ADMARC), collapsed in the mid-1990s as a result of the coincidence of widespread harvest failure, multiparty elections, credit default, the rise of parallel grain markets, partial implementation of liberalization and structural
adjustment policies, and substantial devaluation (raising local fertilizer prices). With other policy changes drawing more productive smallholders away from surplus maize production and into tobacco production, there was a wide- spread perception in Malawi in the mid-1990s that falling fertilizer support was leading to diminished maize produc- tion and a food and political crisis. From 1998/99 the gov- ernment, with mixed donor support, reinstated a variety of interventions subsidizing maize fertilizer and seed access, with intermittent interventions in maize markets. Seed and fertilizer subsidies shifted from universal price subsidies to free provision of small “starter packs” initially provided to all households in 1998/99 and 1999/2000, and then to a more limited (but varying) number of targeted households in 2001/02 to 2004/05 (see, for example, Harrigan 2003).
Analysis of smallholder agricultural performance since the late 1990s is complicated by difficulties with data and in separating out the effects of poor rainfall and of policy changes responding to perceptions of an impending food crisis. In contrast to the widespread perception that maize production fell during the 1990s and 2000s, official maize production and overall food production estimates show a strong rising trend through the 1990s to 2006, together with a modest rising trend during the same period in per capita food production (including sometimes disputed estimates

4 CHAPTER 17: MALAWI’S AGRICULTURAL INPUT SUBSIDY PROGRAM EXPERIENCE OVER 2005–09
of increasing cassava production). There were two years of very poor rainfall in 1991/92 and 1992/93, two years of good rainfall with universal distribution of small free fertilizer packs in 1998/99 and 1999/2000, poor rainfall and lower fertilizer subsidies and production with widespread hunger in 2000/01, 2001/02, and 2004/05, and good rainfall and a large fertilizer subsidy in 2005/06.
Fertilizer use also rose impressively through the 1990s, with an annual average of 6 percent growth in fertilizer use on all crops and commercial and smallholder farms between 1984/85 and 2004/05 (SOAS et al. 2008). Starting in the mid-1990s, private input suppliers took over an increasing share of the fertilizer market from ADMARC and the Small- holder Farmers Fertiliser Revolving Fund (SFFRFM), both parastatals responsible for importing and distributing fertil- izers to smallholder farmers. By the end of the 1990s private input suppliers were responsible for more than 70 percent of national fertilizer imports and for a large proportion of sales to smallholders (SOAS et al. 2008). During the 2002/03 and 2003/04 crop seasons, 43 percent of smallholders sur- veyed in a nationally representative survey purchased some fertilizer (see table 17.1). Smallholders using fertilizer on maize applied an average of 101 kilograms per hectare (see table 17.1). Major parastatal involvement in fertilizer imports for subsidized fertilizer sales has, however, affected private sector sales and confidence in investment in imports and retail systems by varying, and debated, amounts.
Widespread fertilizer use on maize produced by small- holder farmers is constrained by two problems: prof- itability and affordability. Unsubsidized fertilizer was not generally profitable on maize produced for sale in Malawi from the mid-1990s to the mid-2000s.4 It was, however, more profitable on maize grown for households’ own con- sumption, with a higher subjective valuation stemming from farmers’ fears of the effects of a bad year on maize purchase prices. For poorer farmers with this higher sub- jective valuation, however, affordability of fertilizer becomes a major problem. Liquidity presents substantial difficulties for poor farm households, who on the one hand face a “hungry gap” during the cropping period (when farmers need to invest labor, seed, and other inputs in crop production while food stocks from the previous season are running low, and children are particularly susceptible to sickness) and on the other very high borrowing costs and an absence of low-cost financing services for inputs. Hun- gry-gap problems at the livelihood level are exacerbated by rural economy market effects (which depress wage rates and asset prices and raise food prices). These problems are widely recognized as very severe for poor rural households
in Malawi, causing major production and welfare prob- lems in rural areas.5
Improving the profitability of fertilizer use in maize pro- duction requires lower fertilizer prices (as a result of greater efficiency in fertilizer supply and reduction in transport costs for importation or distribution of a subsidy, or both), higher maize prices, or greater efficiency in the use of fertil- izer (raising the grain output to nitrogen ratio).6 Changes to maize prices and improved efficiency of fertilizer use will not, however, improve the affordability of fertilizer for large numbers of poor rural households in Malawi. Making fer- tilizer more affordable requires very substantial reductions in fertilizer prices, the development of low-cost and accessi- ble financial services, or both. Development of such finan- cial services, however, requires that maize be profitable, that smallholders have other sources of cash income that can be used to repay fertilizer loans when the majority of the maize they produce is for home consumption, and that very low- cost systems be used for loan disbursement and recovery. All these requirements are difficult to achieve in Malawi. REVIEW OF INPUT SUBSIDIES To understand the implementation, impacts, strengths, and weaknesses of the Malawi Agricultural Input Subsidy Program, it is helpful to examine broader historical and the- oretical lessons on input subsidies’ implementation, perfor- mance, and impacts.7
Wider experience with agricultural input subsidies Large-scale (so-called universal) agricultural input subsidies were a common and prominent feature of agricultural development policies in poor rural economies from the 1960s to the 1980s. They were subsequently criticized, however, as a major element in fiscally and economically unsustainable policies that were inefficient, ineffective, and expensive in Africa (see, for example, World Bank 1981). These policies distorted market incentives, blunted competitiveness and farmer incentives, and undermined the growth of private sector agricultural services. While subsi- dized input systems may have seemed attractive to farmers (in regard to the services that were supposed to be pro- vided), theoretical difficulties with subsidy benefits (see below) were compounded by diversion and inefficiency, which often limited actual benefits to farmers.
Evaluations of the rate of return to alternative public investments in Asia tend to rank input subsidies as fourth or fifth, after investments in road infrastructure, agricultural

CHAPTER 17: MALAWI’S AGRICULTURAL INPUT SUBSIDY PROGRAM EXPERIENCE OVER 2005–09 293
research and development, education, and often other types of public investments (see, for example, Fan, Thorat, and Rao 2004; Economist Intelligence Unit 2008). There are also arguments, however, that while returns to agricultural input subsidies were often low, they did yield substantial benefits in some countries at certain times. Such arguments stress the importance of differences between subsidies benefiting fertilizer suppliers and those benefiting (poorer) farmers, falling returns over time where subsidies are effective, and the need for judicious (and changing) decisions on the scale of different investments, recognizing trade-offs, comple- mentarities, differences in the timing of returns, and poten- tial diminishing (and sometimes increasing) marginal returns across different investments (see Dorward et al. 2004; Djurfeldt et al. 2005; Timmer 1989, for Indonesia; Fan, Gulati, and Thorat 2007, for India; and Dorward 2009).
Information on the performance of most of the recent input subsidy programs in Africa is limited despite the very substantial investments of public funds in these programs. However, recent empirical evidence from Malawi and Zambia shows that subsidies tend to be targeted dispropor- tionately to better-off farmers compared with poor and female-headed households, where affordability constraints are most severe (Govereh et al. 2006; SOAS et al. 2008); input subsidies have partially displaced commercial fertilizer demand, which has hindered policy objectives to promote sustainable development of commercial input dis- tribution systems (Xu et al. 2009; Ricker-Gilbert, Jayne, and Chirwa 2011); and the high costs of large-scale input subsi- dies means that there are very substantial opportunity costs in terms of forgone public investments, investments that, as shown by the Asian experience discussed earlier, may have greater long-term impacts on poverty reduction and agri- cultural growth. Moreover, Kenya has achieved impressive growth in fertilizer use on food crops based on strong com- mercial demand for inputs after the liberalization of input marketing and foreign exchange controls, without the use of subsidies (chapter 17; Ariga et al. 2008; Ariga and Jayne 2009). The potential applicability of the Kenyan model, or parts of it, to other Sub-Saharan African countries needs to be considered, taking account of particular features of the Kenyan situation and experience.
Dorward (2009), in a review of a number of input sub- sidy programs across Africa, also notes apparent tendencies for these programs to focus on production objectives and producer welfare (largely ignoring potential benefits for consumers and for wider pro-poor economic growth); for poor integration of many programs with complementary investments; and in some programs, for an unfortunate lack
of interest in improving effectiveness and efficiency. Two further commonalities are a limited focus on replenishing soil fertility and a strong prevalence of heavy subsidies (50 percent to 100 percent subsidy rates) on rationed inputs (Dorward 2009). Theoretical benefits and costs of agricultural input subsidies
Conventional arguments for subsidies in agricultural devel- opment have focused on the promotion of increased agricultural productivity through the adoption of new tech- nologies (Ellis 1992). Reduced costs of subsidized inputs increase the profitability of these technologies and reduce the risks perceived by farmers in adopting them. Together with credit and extension services, input subsidies were sup- posed to help farmers implement, benefit from, and then, with the withdrawal of the subsidy, fully fund efficient input purchases and use themselves.
Supply and demand analysis of input subsidies shows that because of deadweight losses, a subsidy can generate a positive net economic return to a country only if it addresses some market failure (Siamwalla and Valdes 1986). This may occur when: farmers’ private costs of working capital for input pur-
chase are greater than the social cost of capital, farmers’ lack of knowledge about the benefits of inputs
means that their expectation of the production bene- fits from input use are less than the benefits they will gain,
there are learning costs with input use, meaning that ini- tial farmer returns are low but will increase with experi- ence (Ellis 1992; Crawford, Jayne, and Kelly 2006; Morris et al. 2007), and
farmers’ risk assessment and aversion to investing work- ing capital in input purchase and use are higher than society’s risk assessment and aversion.
The size of the deadweight loss and the distribution of
benefits between consumers and producers also depend on the elasticity of supply and demand. Demand or supply inelasticity tends to be associated with smaller deadweight losses. Inelastic demand is associated with larger shares of consumer surplus benefits, while inelastic supply is associ- ated with larger shares of producer benefits (Dorward 2009). Staple food markets in landlocked countries tend to be associated with more inelastic demand by poor con- sumers (where prices lie between export and import parity

294 CHAPTER 17: MALAWI’S AGRICULTURAL INPUT SUBSIDY PROGRAM EXPERIENCE OVER 2005–09
prices). Demand tends to be more elastic for cash crops, particularly for cash crops that are exported.8
Subsidy inefficiencies also arise when part of the cost of the subsidy goes to reducing the cost of production for pro- duce that would be produced anyway; when subsidies bid up demand and prices for land, labor, or inputs, and are passed back to suppliers of these inputs,9 and when rationing leads to opportunities for those controlling subsi- dized inputs to demand payments for provision of subsi- dized inputs. Another major concern with input subsides is the extent of leakage and diversion away from their intended use as a result of diversion between products, diversion from intended beneficiaries to others within the country, and cross-border leakage.
A final, crucial point is that the technical efficiency of input use in generating additional agricultural production is critical in determining deadweight losses, distribution of benefits between producers and consumers, and wider eco- nomic gains. This efficiency depends upon the quality and appropriateness of the inputs to the product on which they are used, the timing of the delivery of inputs to farm- ers, the availability of complementary resources (for example, seed and fertilizer together), agro-ecological conditions, and farmers’ technical skill or competence in using the inputs.
This analysis suggests that large-scale input subsidies should be focused on:
producers who are not using inputs because of market
failure, crops and geographical areas for which increased input
use can induce a large supply shift (this may also require complementary infrastructure and services for input delivery, extension, and output markets), and
stimulating products with inelastic demand and supply, particularly inelastic demand, among poor producers and consumers (staple grain production tends to have these characteristics in poor large or landlocked countries).
The analysis also suggests the importance of consumer
benefits in addition to (or rather than) producer benefits for achieving economic and welfare gains from subsidies; sub- sidy implementation that reduces deadweight losses and rents from straight transfers, leakages, and high administra- tive costs; and comparing distributional impacts and multi- pliers from expenditure on input subsidies with alternative (tax, subsidy, or other transfer) instruments for changing income distribution and for stimulating growth.
The conclusions from this neoclassical supply and demand analysis influenced conventional wisdom on a
number of difficulties with input subsidy programs: in con- trolling costs, in achieving “exit strategies” after subsidy pro- grams have become entrenched, in effective targeting of input subsidies to particular farmer types, in ensuring inputs are not overused, in controlling regressive benefits that favor larger farmers who can access subsidized inputs, and in pre- venting market distortions where parastatal involvement crowds out private sector investment in input supply systems and provides opportunities for corruption.
In recent years, however, some scholars and many gov- ernment policy makers have departed from orthodox neo- classical thinking on input (particularly fertilizer) subsidies. Factors giving rise to this rethinking in Sub-Saharan Africa include perceptions by some that liberalization policies have failed to support sustainable intensification of staple food crop production; political demands for fertilizer subsidies; tensions among donors facing such demands; concerns about declining soil fertility; and interest in using input sub- sidies as an instrument for social protection policies and as a means of promoting input market development.
On the basis of this analysis, Dorward (2009) suggests that the following design and implementation features are important if subsidy programs are to be effective and effi- cient in stimulating increased productivity and broad-based growth: Large unit (or percent) subsidies on rationed supplies
targeted to credit constrained farmers to reduce input affordability problems.
Targeting access to subsidized inputs for specific house- hold types where input use is constrained by the market failures that the program effectively addresses; where these inputs can be used effectively and efficiently;10 and where substantial political, economic, welfare, equity, and administrative challenges in effective and low-cost targeting can be overcome.
Rationing to control the costs of input subsidies with large per unit or percent subsidies and limited secondary mar- kets in which recipients sell subsidized inputs to others.
Encouragement of private sector input supply systems’ effi- ciency and investments by economies of scale and by competition in the sale of large volumes of inputs (espe- cially in remote and previously poorer and less productive areas and producers), with measures to limit uncertainty and the diversion of suppliers’ focus to capturing subsi- dized sales without developing retail systems.
Promotion of dynamic effects on pro-poor growth through higher land and labor productivity in staple food pro- duction, lower food prices, and higher producer incomes

CHAPTER 17: MALAWI’S AGRICULTURAL INPUT SUBSIDY PROGRAM EXPERIENCE OVER 2005–09 295
that facilitate wider nonagricultural development, mar- ket thickening, and reduced coordination and transac- tion costs and risks in poor rural economies.
Effective and efficient entitlement and distribution sys- tems supporting targeting, rationing, supply system development, control of secondary markets and leakages, and cost control. A combination of paper vouchers (or coupons),11 scratch cards, and electronic systems (involving bank cards, electronic “smart” cards, mobile phones, or some combination of the three) may be used as evidence of entitlement. Different systems offer differ- ent potential benefits and political, technical, adminis- trative, and social challenges within communities and households. Entitlements may be input specific or flexi- ble with regard to inputs allowed and may have a fixed value (with a variable top-up at redemption) or a vari- able value (with a fixed top-up). There are also impor- tant interactions between entitlement systems, secondary markets, recipient choice (of inputs and suppliers), con- trol of fraud and program costs, and gendered access to and control of subsidized inputs within households.
Complementary investments, policies, and instruments critical for subsidy effectiveness and efficiency, with bal- anced investments in the subsidy program itself, research and extension support, transport and communications infrastructure, and efficient and stable output markets.12
Matching of political interests with more technical and bureaucratic needs for cost control, limited leakages, tar- geting, rationing, and private sector development.
Given the experience with subsidies in Africa discussed
earlier, implementing some of these features is a major challenge.
Issues to consider in evaluating agricultural input subsidies
The success of an input subsidy program has to be judged against its objectives, and input subsidy programs can have a wide range of possible objectives: wider (pro-poor) eco- nomic growth, benefits for poor consumers from lower out- put prices, national (or household) food self-sufficiency or security, increased input adoption, increased efficiency of input use, benefits for poor producers, input supply system development, soil fertility replenishment, and political ben- efits. Most, but not all, of these objectives can be mutually complementary, depending on how a program is imple- mented. The balance of program objectives, and their context, should then determine the key design and implementation
elements of input subsidy programs as discussed earlier. Figure 17.2 provides a conceptual framework that identifies key variables and relationships affecting input subsidy pro- gram impacts and guides this discussion of the Malawi Agricultural Input Subsidy Program. MALAWI’S 2005/06 TO 2008/09 EXPERIENCE WITH AGRICULTURAL INPUT SUBSIDIES
Following severe food security difficulties in the early 2000s and in line with election commitments, the government of Malawi decided to implement a large national input subsidy program for the 2005/06 growing season.13 The popular program has been repeated and expanded in subsequent seasons, building on core experience but also incorporating modifications in components and implementation systems from year to year. Core elements of the program common to the different years have been its use of vouchers targeting roughly 50 percent of farmers across the country for the receipt of fertilizers for maize production, with further vouchers for improved maize seeds and for fertilizers for tobacco. The core objective of the program, which has been refined over time, has been twofold: to increase resource- poor smallholder farmers’ access to improved agricultural inputs in order to achieve food self-sufficiency, and to raise these farmers’ incomes through increased food and cash crop production. The main features of the program across the four years are summarized in table 17.2, and details of its design, implementation and various achievements are detailed in the following sections. Program design and implementation The 2005/06 program provided the foundation on which subsequent input subsidy programs in Malawi have been built. We therefore describe this program in more detail before considering changes made in subsequent programs. The objective of the program was to promote access to and use of fertilizers in maize and tobacco production in order to increase agricultural productivity and food security. Fer- tilizer coupons were distributed to districts and within dis- tricts to extension planning areas in two rounds. In the first round, allocation was broadly in proportion to cropped maize and tobacco areas. Coupons were distributed to dis- tricts and Traditional Authorities (TAs) by the Ministry of Agriculture and Food Security (MoAFS). TAs were supposed to allocate coupons to Village Development Com- mittees (VDCs), which were then supposed to identify recipients to receive two coupons that they could redeem, at

296 CHAPTER 17: MALAWI’S AGRICULTURAL INPUT SUBSIDY PROGRAM EXPERIENCE OVER 2005–09
Figure 17.2 Conceptual Framework for Investigating Agricultural Input Subsidy Impacts
3. Effects on input supply system
private sector importers and large/ small distributors;
parastatals profits, cash flow,
confidence, volumes, prices, investment, innovations,
other services
2a Effects on recipients
(different hholds and hhold members)
input access and use, farm and non-farm
activities and productivity labour hire in/out
crop purchases/sales, income, food security, welfare, vulnerability
1. Input subsidy implementation
Scale, cost, modalities, timing, targeting, rationing
2. Effects on rural households
local and national, market and non- market relations:
(staple food, labour, cash, land, etc
prices and flows)
4. Effects on macro economy
fiscal balance foreign exchange balance health, education, infrastructure,
other agricultural spending
2b Effects on non- recipients (different
hholds and hhold members)
input access and use, farm and non-farm activities and
productivity, labour hire in/out, crop purchases /
sales, income, food security, welfare, vulnerability
Other macro- economic
management
Political economy and
policy processes
Global and
regional prices
Staple food
market policies
Previous season(s)
events and outcomes
Weather
Disease
(HIV/AIDS, malaria, etc)
Other social protection and agricutural/rural development measures
Other rural economic activities
Source: Adapted from SOAS et al. (2008). Note: hholds = households.
Table 17.2 Summary of Malawian Agricultural Input Subsidy Programs, 2005/06 to 2008/09
Indicator 2005/06 2006/07 2007/08 2008/09 Fertilizer voucher distribution (mt equivalent) 166,156 200,128 216,000 195,369 Households receiving one or more fertilizer coupons (percent) — 54 59 65 Subsidized fertilizer (mt For maize) 108,986 152,989 192,976 182,309 For tobacco 22,402 21,699 23,578 19,969 Total subsidized Planned 137,006 150,000 170,000 170,000
fertilizer sales Actual 131,388 174,688 216,553 202,278 Redemption price (MK/50-kilogram bag) 950a 950 900 800 Approximate voucher value, (MK/bag) 1,750 2,480 3,299 7,951 Approximate subsidy (%) 64 72 79 91 Subsidized maize seed (mt) — 4,524 5,541 5,365 Hybrid seed (%) 0 61 53 84 Cotton seed (mt) 0 0 390 435 Legume seed (mt) 0 0 24 — Cotton chemical vouchers 0 0 131,848 — Total program Planned 5,100 7,500 11,500 19,480 cost (MK millions) Actual 7,200 12,729 16,346 39,847
Sources: Logistics Unit reports; Nakhumwa 2006; SOAS et al. 2008; MoAFS 2008; Dorward and Chirwa 2009a; MoAFS implemen- tation guidelines; government of Malawi budget statistics; Dorward, Chirwa, and Slater 2010b; key informants. Note: — = not available; mt = metric tons. a. seed or fertilizer coupon (NSO 2008).

CHAPTER 17: MALAWI’S AGRICULTURAL INPUT SUBSIDY PROGRAM EXPERIENCE OVER 2005–09 297
a reduced cash price, for any of four types of fertilizer. There was considerable variation within areas in the criteria deter- mining prioritization and selection of beneficiaries, in numbers of people receiving coupons, and in numbers of coupons received per recipient household. A second, sup- plementary round of coupon allocation and distribution was made later in the season. Under the program, 6,000 metric tons of open pollinated variety (OPV) maize seed was also offered for sale without coupons, at a subsidized price of MK 150 for a 3-kilogram bag, compared with the market price of MK 500. Although the parastatals ADMARC and SFFRFM were responsible for distributing subsidized inputs, 48 percent of subsided fertilizer was sup- plied by private sector importers.
Holders of coupons were entitled to redeem coupons for fertilizer at the rate of one coupon and MK 950 for one 50-kilogram bag of 23:21:0 +4S or urea (“maize fertilizers”), and at one coupon plus MK 1,450 per bag of Compound D or CAN (“tobacco fertilizers”). These prices represented, on average, a two-thirds subsidy to farmers on the market cost of inputs. Coupons intended for different types of fertilizer were not marked as such, and many coupons allocated for “tobacco fertilizer” may have been used to buy “maize fertil- izer” instead. Sales continued into January 2005, and in var- ious areas were limited either by a shortage of fertilizer stock or a shortage of coupons. In the latter case, supplementary coupons were used in some areas, but unavailability of fer- tilizer in time for it to be agronomically useful meant that
significant numbers of coupons were not used. ADMARC/SFFRFM reported total sales of 131,803 metric tons of subsidized fertilizer (representing 2.62 million coupons).14
Malawi’s 2005/06 agricultural input subsidy program is reported to have cost MK 7.2 billion, against a budget of MK 5.1 billion (SOAS et al. 2008). The reported program cost excludes overhead costs for ADMARC and SFFRFM and likely allows for only partial deduction of farmer payments to ADMARC and SFFRFM for coupon redemption: these payments amounted to a total of MK 2.7 billion.
Following the popularity of the 2005/06 program and the perception of its success, the government decided to implement the program in 2006/07 with a number of mod- ifications (table 17.3). These included an increase in the overall amount of maize fertilizers to be subsidized, a stan- dard redemption price of MK 950 per bag for all fertilizer types, improved coupon security (with differentiation by fertilizer type), involvement of the Logistics Unit (a unit largely funded by the U.K. Department for International Development, which had played a major role in the logistics of the nationwide starter pack and targeted input programs from 1998/99 to 2004/05), involvement of several large input supply companies in retail sales of subsidized fertilizer, and use of maize seed vouchers that could be exchanged at a wider range of outlets (including agro-dealers) for different quantities of OPV or hybrid seeds.15 The seed component, a portion of the Logistic Unit’s costs, and an independent
Table 17.3 Principal Changes in Subsidy Program Design and Implementation, 2005/06 to 2008/09
Year Subsidized inputs Voucher distribution system Voucher redemption systems Other system innovations 2005/06 Maize and tobacco fertilizers,
maize seed (OPV) 2006/07 Maize and tobacco
fertilizers, maize seed (hybrid and OPV)
2007/08 Maize, tobacco, coffee, and
tea fertilizers; maize seed (hybrid and OPV); legume seed (limited); cotton seed and chemicals
2008/09 Maize and tobacco fertilizers; maize seed (hybrid and OPV); legume seed, cotton seed, and chemicals; maize storage chemicals
District allocation by maize areas, distribution through TAs
District allocation by maize areas, distribution varied, through local government, TAs,VDCs, MoAFS
District allocation by farm
households and areas, distribution through MoAFS and VDCs
District allocation by farm
households and areas; use of farm household register; open meetings for allocation and disbursement led by MoAFS
Only through SFFRFM and ADMARC
Fertilizers also through major retailers; flexible maize seed vouchers through wide range of seed retailers
Fertilizers also through major retailers; flexible maize and legume seed vouchers through wide range of seed retailers; cotton inputs through ADDs
Fertilizers only through ADMARC and SFFRFM; flexible maize and seed vouchers through wide range of seed retailers; cotton inputs through ADDs
None Coupons specific to fertilizer
type; fertilizer buy-back system; involvement of Logistics Unit
Reduced copies of coupons; remote EPA premium; fertilizer buy-back system
Extra coupon security
features and market monitoring; no remote EPA premium; ADMARC computers for voucher processing
Sources: Logistics Unit; Nakhumwa (2006); SOAS et al. (2008); MoAFS (2008); key informants; Dorward and Chirwa (2009a); MoAFS Implementation guidelines; NSO (2008). Note: EPA = Extension Planning Area.

298 CHAPTER 17: MALAWI’S AGRICULTURAL INPUT SUBSIDY PROGRAM EXPERIENCE OVER 2005–09
program evaluation were funded by donors, who had not directly financed any part of the 2005/06 program (other than through budget support). Donors also funded a buy- back scheme, which reduced the risks to government of holding unsold stocks at the end of the year if private sales led to lower-than-expected sales by ADMARC and SFFRFM.
Planned and achieved subsidy sales and costs in 2006/07 (and other years) are shown in table 17.2. Supplementary fertilizer voucher issues and the availability of fertilizer for sales by private companies (which sold just under 30 percent of subsidized sales) together led to higher sales volumes than budgeted. These, together with higher prices than budgeted, led to significant budget overruns. These problems were not faced in seed sales, where no extra coupons were issued.
Growing experience with the program led to consolida- tion in 2007/08 of many of the changes made in 2006/07, together with further changes to extend the scope of the program. Program objectives and beneficiary targeting cri- teria were amended to give greater emphasis to concerns for vulnerable households. Targeted quantities of subsidized maize fertilizer and seed were again increased, to roughly equal disbursements to the previous year. Changes were made to coupon allocation systems between districts to pro- vide greater weight to the number of farming households (and less weight to crop areas), leading to an increasing pro- portion of coupons allocated to the more densely populated southern region, where levels of poverty and poverty inci- dence are greatest.
Following problems in some areas in 2006/07, systems for allocating and distributing coupons within districts were also modified in 2007/08 to give less power to TAs and more responsibility to MoAFS staff. In addition to the maize seed vouchers provided with maize fertilizer coupons, extra “flexible vouchers” allowed farmers to choose maize or legume seeds (although legume seed supplies were very lim- ited). A “remote area premium” was also introduced to pro- vide incentives to private retailers to extend their networks into areas with low coverage by private retailers; a premium was provided on the subsidy paid to private sector retailers for sales of subsidized fertilizers against identifiable vouch- ers issued to beneficiaries in designated “remote areas” with higher transport and distribution costs (with the vouchers identifiable by their location code). Coupons for cotton seed and chemicals were distributed through the MoAFS Divi- sional Offices (ADDs).
Subsidized fertilizer volumes were again significantly over budget in 2007/08; with higher-than-budgeted input
prices, program costs were 29 percent above the budget, compared with 18 percent the previous year. However, pri- vate sector subsidy sales were roughly the same as the previ- ous year (increasing by only 6 percent, from 49,000 metric tons to 52,000 metric tons), whereas parastatal sales increased by approximately 30 percent, from 125,000 to 165,000 metric tons.
A number of further changes were made to the 2008/09 subsidy program. A farm household register compiled the previous year was updated and used to list coupon alloca- tions to individual beneficiaries in open village meetings led by teams involving MoAFS and local government staff. An attempt to print coupons in the government printer was fol- lowed by a significant security breach, and vouchers for the central and northern regions were then printed outside the country with extra security features. The flexible maize and legume seed voucher and cotton input systems were contin- ued. Grain pesticides were also subsidized, and some subsi- dized fertilizers were issued to tea and coffee farmers. Although private retailers were initially involved in the sale of subsidized fertilizers, this practice was discontinued at a very late stage in the season. The program went massively over budget, however, largely as a result of soaring interna- tional fertilizer costs, but there was also an approximate 15 percent overrun in quantities of inputs subsidized. Implementation achievements Three aspects of Malawi’s achievements in implementing its agricultural input subsidies are considered: program scale, innovation and adaptation, and implementation performance. Program scale. Malawi’s agricultural input subsidy pro- gram has grown each year since its creation and involves complex and very significant logistical and organizational challenges to tight deadlines. The major tasks of the pro- gram are shown in figure 17.3. This summary is highly simplified, however, and in practice a complex set of inter- actions between various stakeholders is needed to complete each task. In 2008/09 this process involved the selection of more than 1.5 million fertilizer coupon beneficiaries from more than 2.5 million farm households, printing and distri- bution of 5.9 million coupons, and purchase and distribu- tion of more than 3.4 million bags of fertilizer—all within tight deadlines. Further challenges arise because farmers served by the program are widely dispersed across the coun- try (with a significant number being illiterate or semiliterate and living in remote and poorly accessible areas), and

CHAPTER 17: MALAWI’S AGRICULTURAL INPUT SUBSIDY PROGRAM EXPERIENCE OVER 2005–09 299
Figure 17.3 Major Tasks in Implementing Malawi’s Agricultural Input Subsidy Program
Planning and budgeting
Farmer registration
Input purchase
Input distribution
Secure coupon printing
Coupon distribution
Coupon allocations
Beneficiary identification
Coordination and control
Farmers
Stakeholders
(transport and storage)
Coupon redemption
Coupon
issue
Payments and control
MoAFS: HQ, LU, ADDs, DADOs, Ass, FAs DCs, TAs, VDCs, Police, CSOs Fertiliser importers, retailers Seed producers/importers, retailers ADMARC: HQ, districts, markets SFFRFM: HQ, depots, markets Transporters Donors
Source: Authors.
because there is a constant threat of fraud or theft of program commodities worth a total of approximately $220 million, with each fertilizer coupon worth more than 10 percent of annual household income for the more than 40 percent of the population below the poverty line.
The implementation challenges should not be underesti- mated, and it is significant that Malawi has been imple- menting such activities at varying scales annually since the inception of the starter pack program in 1998 (see below) and has therefore built up both systems and considerable expertise in these tasks.
Innovation and adaptation. The 2005/06 subsidy pro- gram built on Malawi’s innovative experience in imple- menting the starter pack and targeted input programs (TIP). These programs involved large-scale registration and targeting across the country; development of systems using vouchers; coordination across different government, paras- tatal, private sector, donor, and community stakeholders; and substantial logistical challenges. The 2005/06 subsidy program, however, involved a change in objectives (from an emphasis on social protection and food security for vulner- able households in the TIP to national food production and self-sufficiency), an increase in the scale of subsidized inputs (from approximately 50,000 metric tons of fertilizer in 2004/05 to 130,000 in 2005/06), and the addition of tobacco inputs and cash redemption of vouchers.
Following the experience of 2005/06, the government has, with other stakeholders, implemented further innova- tions to improve performance of the program and broaden its impact. These changes emerged from formal and infor- mal management and evaluation reviews and lesson learn- ing within the government (formal internal evaluations were conducted in 2006/07 and 2007/08); from discussions with other stakeholders (donors, private sector fertilizer importers, seed and fertilizer suppliers, a parliamentary committee on agriculture, and civil society); from external evaluations (commissioned by CISANet for 2005/06 and by the government, DFID, and USAID for 2006/07 and by the government and DFID for 2008/09); and shifts in policy within a changing economic and political environment.
The major program modifications in 2006/07, 2007/08, and 2008/09, summarized in table 17.3, concerned: the extent and modalities of private sector involvement in
fertilizer imports, fertilizer sales, and seed sales, with a buy-back scheme to reduce government stockholding risks, a premium to stimulate private retail network development in more remote areas in 2007/08, and exclu- sion of the private sector from fertilizer sales in 2008/09;
recognition of the importance of including vulnerable households among targeted beneficiaries, with an increasing volume of inputs for maize production and modified district/EPA allocation systems;

300 CHAPTER 17: MALAWI’S AGRICULTURAL INPUT SUBSIDY PROGRAM EXPERIENCE OVER 2005–09
trialing of flexible vouchers for seed inputs and addition of cotton inputs and grain storage pesticides;
introduction of beneficiary registration and more open and more tightly managed beneficiary selection, voucher distribution, and market monitoring systems;
coupon design, printing, security, and farmer redemp- tion prices; and
sharing of the costs of some program components with donors.
Implementation performance. Effectiveness and effi- ciency of implementation can be assessed in terms of volume of subsidized inputs disbursed, timing of subsidy sales and supplier payments, targeted beneficiary access to inputs, and cost. As shown in table 17.2, both planned and disbursed vol- umes of subsidized inputs increased steadily between 2005/06 and 2008/09. Although fertilizer disbursement and sales targets were not met in 2005/06, they were exceeded in 2006/07, 2007/08, and 2008/09 by 16 percent, 27 percent, and 19 percent, respectively. Exceeding these targets demonstrates considerable success in meeting demand, but also suggests difficulties in controlling disbursement and cost overruns.
Timing of subsidy sales is determined by the timing of availability of inputs in markets and the issue of vouchers to beneficiaries. Timing is critical for the effective use of seed and fertilizer at the start of the agricultural season. For fertil- izer, the timing of input availability depends upon timing of tendering of input purchases and supplier deliveries to depots, the staffing and stocking of input markets (for paras- tatal sales), and subsidy redemption contracts with retailers and their stocking and staffing of input sales points for private sector sales. The timing of voucher issue depends on the tim- ing of beneficiary registration, voucher allocations, voucher printing, voucher distribution to districts, and district distri- bution payments. Information on some of these variables is given in table 17.4. In general, performance regarding earlier award of seed and fertilizer contracts and earlier fertilizer deliveries to depots and uplifts has improved over time. Infor- mation on the timing of fertilizer sales is incomplete, but it appears that despite some evidence of improvement between 2005/06 and 2006/07 (not shown in table 17.4), there has been little improvement since then. It is particularly impor- tant to increase sales by the end of November. These sales were highest in 2008/09 but still only 30 percent of the total. Receipt of seed vouchers by the Logistics Unit is determined by the timing of sales and the speed of voucher processing by seed suppliers; both were problematic in 2007/08.
Targeted beneficiary access to inputs is determined by coupon allocation and issue and by the use of coupons,
which may be affected by the availability of subsidy inputs in accessible markets and by any “tip” needed to redeem coupons. Household surveys provide the only systematic information available on these areas. Results from focus group discussions and household surveys examining the 2006/07 and 2008/09 programs (SOAS et al. 2008; Dorward, Chirwa, and Slater 2010a) suggest the following: In 2008/09, 65 percent of farm households received one
or more fertilizer coupons, with an average of 1.5 coupons per household receiving coupons and of 1.1 coupons per household across all households (figures for 2006/07 were 54 percent, 1.7, and 1.0, respectively);
Targeting criteria were highly variable across different administrative areas;16
Overall targeting recommendations were followed to some extent in that there was a tendency for targeting to reach households that are productive full-time farmers. However, household survey data for the of 2006/07 and 2008/09 seasons indicate that coupons were disproportionately targeted to households with relatively large amounts of land or other assets, and (in 2006/07 but not in 2008/09) to male-headed house- holds. Smaller proportions of fertilizer coupons were given to households in the bottom half of the wealth and income distribution;
In some areas, particularly the south and center, coupon allocations were modified so that in 2008/09 just under 40 percent of households in these regions and 36 percent nationally received one fertilizer coupon (rather than fewer households receiving two coupons);
Open meetings for coupon allocation were introduced in 2008/09 and appear to have succeeded to some extent in increasing the proportion of coupons and subsidized fer- tilizer going to poorer households (Chirwa, Matita, and Dorward 2010);
Key informants tended to underestimate the propor- tion of households receiving subsidized inputs com- pared with estimates provided in interviews with households;
In 2006/07, 75 percent of ADMARC and private supplier outlets and 100 percent of SFFRFM outlets were reported to have suffered from frequent major queues; a similar figure of 75 percent was reported across ADMARC and SFFRFM outlets in 2008/09;
In both 2006/07 and 2008/09, household surveys indi- cated that 5 percent of coupons were reported to be accessed with some payment, with a median price of MK 1,000 in 2006/07 and of MK 2,000 in 2008/09.

CHAPTER 17: MALAWI’S AGRICULTURAL INPUT SUBSIDY PROGRAM EXPERIENCE OVER 2005–09 301
Table 17.4 Implementation Performance Indicators 2006/07–2008/09
Indicator 2006/07 2007/08 2008/09 Fertilizers Tender awards for parastatal supplies Late August Mid-August End-July
Depot receipts end October (% of parastatal total sales) 32 58 53
Depot receipts, end November (% of parastatal total sales) 77 76 71
Outstanding payments, end Nov (% and MK millions) 28 1,216 22 1,595 16 3,500
Outstanding payments, end Dec (% and MK millions) 46 4,303 13 1,192 13 3,690
Outstanding payments, end Jan (% and MK millions) 14 1,406 21 2,620 — 7,707
Uplifts dispatched as of end November (% of parastatal total sales) 64 70 75
Total relocation transport costs (MK millions) — 68.4 42.0
Finalization of retail fertilizer contracts Early Nov Mid/late Nov — District voucher allocations Early Sept Oct 9 Sept 12 Voucher printing End Sept End Oct SR early Oct CR/NR early Nov Voucher and list distribution to
districts completed Nov 7 Nov 3 Nov18 Sales end Nov (% of total season sales) 8 — 30 Sales end Dec (% of total season sales 74 — 68 SFFRFM/ADMARC voucher returns
end Dec (thousands) 0 101 175 SFFRFM/ADMARC voucher returns
end Jan (thousands) 111 720 1,057 Finalization of seed supply contracts Mid/late Nov Mid/late Nov Early Nov Seed coupons in LU end Dec
(% of season sales) 27 4 6 Seed coupons in LU end Jan
(% of season sales) 74 18 22
Sources: Logistics Unit reports; Nakhumwa (2006); SOAS et al. (2008); MoAFS (2008); key informants. Note: Data are not available for 2005/06. LU = Logistics Unit. — = not available.
In 2006/07 a “tip” was paid to retail market staff for
redemption of about 20 percent of fertilizer coupons, with a mean price per bag of just over MK 1,000 (com- pared with the official price of MK 950) and with no significant overall differences between parastatal and private sector suppliers. In 2008/09, 14 percent of fertil- izer coupons were reported to require a “tip” for redemp- tion, with a median “tip” of 200 MK, again giving a price of MK 1,000 per bag.
There are considerable difficulties in determining the
extent to which fraud affects Malawi’s agricultural input subsidy program. Fraud can arise in a number of ways— through allocation of vouchers to nonexistent beneficiaries (and their diversion to government staff, traditional leaders, or politicians), direct allocation of vouchers to people who do not satisfy beneficiary criteria, printing of extra or coun- terfeit vouchers, and payment of “tips.”
Determining the extent of the fraud is rendered difficult by the lack of formal and transparent audit systems cover- ing the whole program and by discrepancies between MoAFS and NSO estimates of the total number of farm households in Malawi (MoAFS estimates of farm house- holds were 33 percent above NSO estimates in 2006/07 and 47 percent above NSO estimates in 2008/09). SOAS et al. (2008) concluded that there is insufficient evidence to sug- gest widespread fraud, and that household survey estimates of subsidized fertilizer access were broadly compatible with the MoAFS farm household estimates, but there are numer- ous anecdotal reports of fraud within the system. Although Dorward, Chirwa, and Slater (2010b) suggest that NSO may well underestimate the number of farm households in Malawi, it seems unlikely that underestimate could be off by a third, and there are risks (and anecdotal reports) of increasing numbers of villages and of some “ghost villages,” suggesting significant diversion of subsidized inputs away

302 CHAPTER 17: MALAWI’S AGRICULTURAL INPUT SUBSIDY PROGRAM EXPERIENCE OVER 2005–09
from the intended beneficiaries. The discrepancy between NSO and MoAFS estimates of the number of farm families is being jointly examined by the NSO and MoAFS to resolve this issue.
Regarding the extent to which counterfeit or nonstan- dard vouchers (those with serial numbers outside the ranges recorded by the Logistics Unit) have been accepted by dif- ferent outlets, records for 2007/08 show that these (and sales without vouchers) accounted for 27 percent of ADMARC/ SFFRFM sales and 3 percent of private retailer sales (LU 2009). Rapid return of vouchers to the Logistics Unit is important for early identification of markets accepting counterfeit or nonstandard vouchers. Private retailers gen- erally return coupons quickly in order to receive payment, but ADMARC and SFFRFM have been much slower at this task although their voucher returns have improved over the three years for which records are available (see table 17.4). A major security breach in the printing of vouchers in 2008/09 led to reprinting of more secure vouchers for issue in two regions.
Overall, the costs of Malawi’s subsidy program were over budget and increasing from 2005/6 to 2008/9 (table 17.5), due to a combination of increasing subsidy volumes and large increases in fertilizer prices. Program costs were just over 40 percent above the budget for 2005/06 and 2006/07, nearly 50 percent over budget in 2007/08, and 90 percent
over budget in 2008/09. Program costs rose from just over 60 percent of the MoAFS budget in 2006/07 and 2007/08, rising to 74 percent in 2008/09, when the program accounted for over 15 percent of the total national budget. It is, however, important to note that for the 2009/10 pro- gram, actual costs were 21 percent below budget and costs fell back sharply, by 41 percent, because of both a halving of fertilizer prices and a 20 percent reduction in the amount of fertilizer disbursed, which was almost exactly on budget. As a result program costs fell back to 7 percent of the total national budget.
Data on estimated per unit fertilizer costs and on total program costs, excluding ADMARC overhead costs, are also given in table 17.5. As shown in the table, fertilizer prices and transport costs rose from 2005/06 to 2008/09. The esti- mated per unit fertilizer cost increases from 2005/06 to 2006/07 in Malawi (25 percent) are higher than would be expected given that international prices were static over the same period, but from 2006/07 to 2007/08 the price increase (22 percent) was markedly lower than the increase in international prices, which rose by around 50 percent or more, so the overall cost increase in Malawi over 2005/06 to 2007/08 was in line with international price increases. Fertilizer cost increases from 2007/08 to 2008/09 also appear to have been roughly in line with increases in international price increases over the same period (about 125 percent).
Table 17.5 Fertilizer and Program Costs in Malawi 2005/06–2009/10
2005/06 2006/07 2007/08 2008/09 2009/10 Planned Actual Planned Actual Planned Actual Planned Actual Actual
Fertilizer cost ($/mt): Parastatal: delivered
at depots — — — 454 — 555a — 1,204b 575 Parastatal: transport, etc. — — — 36 — 45 — 46 39 Parastatal: total — 393 — 490 — 600 — 1,250 614 Private retailers: total — ... — 490 — 612 — ... ... Average all suppliers — 393 — 490 — 590 — 1,250 614 Program costs: Malawi government 36.4 51.4 51.4 81.4 73.6 109.6 127 227.7 137.6 Donors ($ millions) 0 0 12.5 9.5 5.7 7.1 12.1 37.8 17.5 Total ($ millions) 36.4 51.4 63.9 90.9 79.3 116.8 139.1 265.4 155.1 Net of farmer payments — 32 — 73.9 — 95.4 — 242.3 143.7 Total as % MoAFS budget — — 43 61 51 61 61 74 — Total as % national budget 4.3 5.6 5.4 8.4 6.7 8.9 8.5 16.2 6.7 Total as % of GDP — 2.1 3.1 — 3.4 — 6.6 —
Sources: Logistics Unit; Nakhumwa (2006); SOAS et al. (2008); MoAFS (2008); Dorward and Chirwa (2009a); Government of Malawi budget statistics; key informants. Note: The 2005/06 fertilizer costs may also include some seed and coupon production/distribution costs. Parastatal transport etc., costs exclude ADMARC overheads. Program costs exclude buy-back carried forward. — = not available. ... = not applicable. a. Excluding costs of buy-back brought forward. b. Including costs of buy-back brought forward.

CHAPTER 17: MALAWI’S AGRICULTURAL INPUT SUBSIDY PROGRAM EXPERIENCE OVER 2005–09 303
Marked monthly variation in international fuel prices from mid- to late 2006 and 2007 makes it difficult to calculate equivalent figures for transport costs.
Aside from the problems of high fertilizer prices in 2008/09, the 2006/07 to 2008/09 programs faced major challenges in controlling the volume of subsidized fertil- izer disbursed. Three alternative (and complementary) approaches to limiting the volume may be used: control- ling the number of coupons issued, controlling the physi- cal stock of fertilizer available, and controlling sales of fertilizer by closing further sales once the total budget quantity has been sold. In principle, the first option is the best approach, although it is undermined by counterfeit coupons and by any high-level political pressure that may demand extra coupon issues. Control of physical stock of fertilizer (the method used in 2009/10) is difficult if the private sector is involved in retail subsidy, and may result in genuine beneficiaries being denied the opportunity to redeem genuine coupons. Closure of the program once target sales have been achieved suffers from the latter dis- advantage, and in addition requires timely reporting and monitoring of sales.
The rising costs of the subsidy program over the period were met by increasing budgetary allocations to the MoAFS, and did not crowd out other MoAFS activities in terms of actually cutting budgetary allocations to them. However, the opportunity cost of the program is an issue in terms of for- gone investments that could have been achieved with those funds. The program also consumes very large amounts of staff time and other resources, for people must be diverted from other activities to manage and implement the subsidy program in the critical time before and at the start of the cropping season. Similarly, while financial resources allo- cated to the subsidy program have grown dramatically since the start of the program, financial resources allocated to other activities have remained largely static or shown only small increases, posing severe challenges to other essential research and extension activities of the Ministry.
Input supply impacts
Malawi’s subsidy program has had major, and mixed, impacts on private sector input suppliers. These effects have to be considered separately for fertilizer importers, fertilizer retailers, seed suppliers, and seed retailers. For retailers of seed and fertilizer, it is important to distinguish between small independent agro-dealers on one hand and retail out- lets of larger companies involved in importation and both wholesale and retail sales on the other.
Fertilizer importers have been responsible for generally increasing proportions and volumes of government subsidy sales, with particularly large volumes in 2008/09 (table 17.6). Importers have clearly benefited from their growing share in imports, although they have faced some difficulties from exposure to foreign exchange losses caused by delays in pay- ments in local currency. Insofar as currency risks are fac- tored into tender margins, these raise fertilizer costs for government. Some importers have expressed concerns about increasing competition in import tenders from new players without proper qualification criteria, leading to the award of some tenders to suppliers who are unable to deliver. If the award of such tenders leads to late cancellation and reordering at short notice, they may also raise fertilizer costs for the government.
Maize seed suppliers have also benefited from significant growth in sales over the life of the program (see table 17.2). Government and the seed suppliers association negotiate prices, which involves a difficult balance between competi- tion and coordination in supply. The subsidy program affects retail sales through three processes, each of which has a different effect on whether retail outlets sell subsidized inputs. These are set out in table 17.7.
Displacement of commercial sales occurs when a farmer chooses not to buy an input received on subsidy when he or she would have bought it commercially if the subsidy had not been available. This affects private retail outlets irrespective of their participation as subsidy retailers. Dis- placement is difficult to estimate because even without sub- sidies, farmers’ commercial purchases change from year to year with changes in input prices, output prices, and their access to seasonal finance. Input suppliers appear to be very concerned about losses of fertilizer sales through displace- ment if these are not counteracted by gains in subsidized sales and customers from participation in the subsidy scheme. Displacement rates have been estimated from examination of changes in aggregate sales (SOAS et al. 2008)
Table 17.6 Private Sector Involvement in Subsidized Fertilizer Sales
Private sector involvement 2005/06 2006/07 2007/08 2008/09 Subsidized tender
deliveries (mt) 70,000 99,386 97,845 162,840 Subsidized tender
deliveries (%) 48 72 71 88 Retail sales (%) 0 28 24 0
Source: Logistics Unit; SOAS et al. 2008; Dorward and Chirwa 2009a.

304 CHAPTER 17: MALAWI’S AGRICULTURAL INPUT SUBSIDY PROGRAM EXPERIENCE OVER 2005–09
Table 17.7 Impacts of Subsidy Program on Seed and Fertilizer Private Retail Outlets
Processes by which the subsidy program affects retail sales Participating retail outlets Excluded retail outlets Displacement of commercial sales
by subsidy sales Loss of sales Loss of sales
Sales of subsidized inputs Gain in sales No effect Gain/loss of customers going to outlets
to redeem their subsidy vouchers General increases in demand as a result
of program-induced growth and income/ cash gains in previous season
Gain in sales Loss of sales Gain in sales Gain in sales
Private fertilizer retailers Retail chains in 2006/07 and 2007/08 Agro-dealers in all years, retail chains in 2005/06 and 2008/09
Private seeds retailers Agro-dealers and retail chains from 2006/07 to 2008/09
Agro-dealers and retail chains in 2005/06 only
Source: Authors.
and from panel data analysis of farmer purchases (Ricker- Gilbert, Jayne, and Chirwa 2011).
Displacement estimates from examination of changes in aggregate sales were 20–30 percent in 2005/06 and 30–40 percent in 2006/07, with displacement for tobacco fertilizers higher than that for maize fertilizers (SOAS et al. 2008). Dis- placement estimated from panel data analysis of farmer purchases was 23 percent for 2006/07 (Ricker-Gilbert, Jayne, and Chirwa 2011) and 3 percent for 2008/09 (Ricker-Gilbert and Jayne 2010), but in all years some further displacement may be expected if some subsidized fertilizers are not received by smallholders. Estimating displacement from aggregate fertilizer sales for 2007/08 and 2008/09 has not been possible due to lack of data on aggregate commercial sales. Table 17.8 shows incremental fertilizer use estimates for 2005/06 and 2006/07 and predictions for 2007/08 and 2008/09, assuming similar implementation in these years.17
Displacement of maize seed sales appears to be much lower, with strong growth in commercial seed sales in 2006/07.
As table 17.7 shows, however, overall impacts of the sub- sidy program on input sales depend not only on displace- ment effects but also on the impact of participation or exclusion in the program on subsidy sales and on customers visiting the outlet. The last two lines of the table identify the status of agro-dealers and retail outlets for larger companies with regard to subsidized fertilizer and seed sales. Notably, both reported a significant increase in sales in 2006/07 when they were able to participate in subsidized seed sales and in subsidized fertilizer sales (only retail outlets for larger com- panies) (Kelly, Boughton, and Lenski 2010). Conversely, the exclusion of the private sector from all retail subsidy sales in 2005/06 led to a substantial drop in reported fertilizer sales from all retail outlets. Sales recovered in 2006/07 and
2007/08 for the larger importers with retail outlets with their inclusion in retail subsidy sales, but they again reported declines in retail outlet fertilizer sales when they were excluded from the program in 2008/09 (Kelly, Boughton, and Lenski 2010). Small agro-dealers had been excluded from retail sales of fertilizer subsidies during all four seasons of the program. Maize market impacts The input subsidy program may affect maize markets in a number of ways. We identify four potential impacts: Direct impact through increased supply of maize for sale
and reduced demand for purchases by net surplus and deficit farmers;
Indirect impacts as a result of policy changes influenced by the subsidy;
In the longer term, if the subsidy program leads to rising incomes, demand for maize should increase as a result of consumption by both humans and livestock;
Finally, if the net effect of these impacts is to lower (or raise) maize prices, then a supply response to increase (or reduce) resources allocated to maize production should be expected.
These impacts arise in the context of wider changes in
production (as a result of seasonal weather), in policies, in regional and national maize markets, and in urban and rural incomes (as a result of other processes of livelihood change and growth). Although data and analytical limita- tions make it difficult to tease out these different influences, Malawi does have good information on maize prices. As
CHAPTER 17: MALAWI’S AGRICULTURAL INPUT SUBSIDY PROGRAM EXPERIENCE OVER 2005–09 305
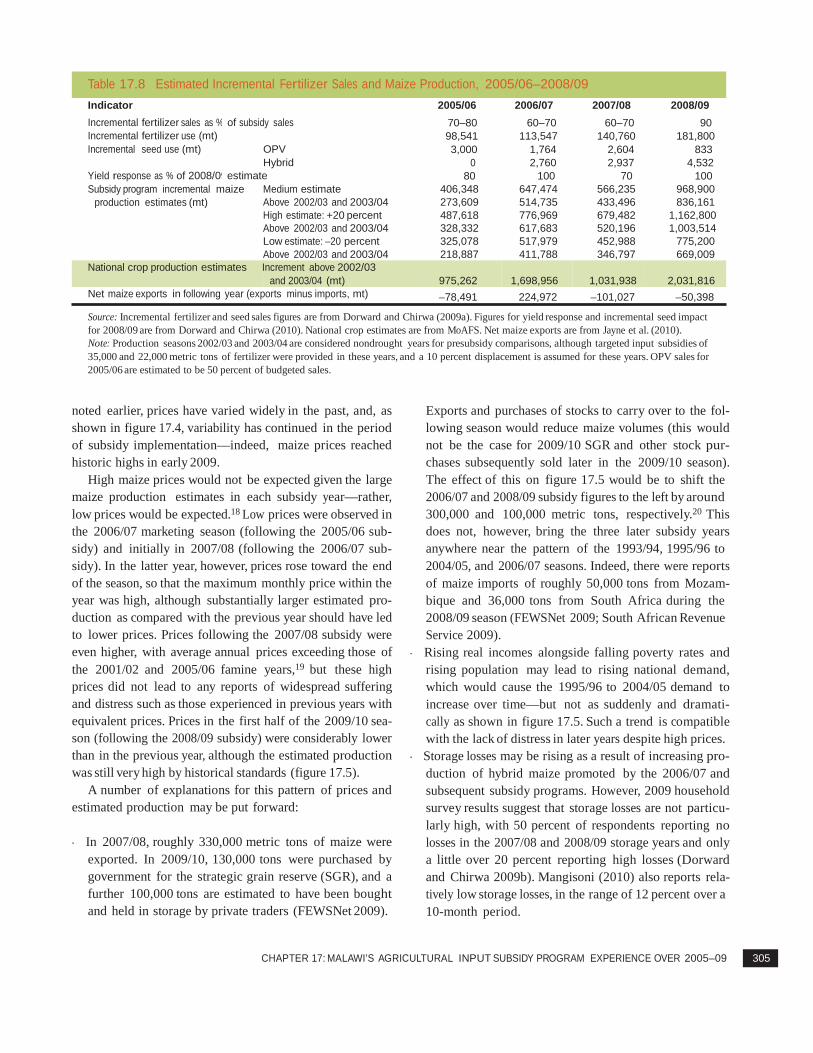
Table 17.8 Estimated Incremental Fertilizer Sales and Maize Production, 2005/06–2008/09
Indicator 2005/06 2006/07 2007/08 2008/09 Incremental fertilizer sales as % of subsidy sales 70–80 60–70 60–70 90 Incremental fertilizer use (mt) 98,541 113,547 140,760 181,800 Incremental seed use (mt) OPV 3,000 1,764 2,604 833
Hybrid 0 2,760 2,937 4,532 Yield response as % of 2008/09 estimate 80 100 70 100 Subsidy program incremental maize Medium estimate 406,348 647,474 566,235 968,900
production estimates (mt) Above 2002/03 and 2003/04 273,609 514,735 433,496 836,161 High estimate: +20 percent 487,618 776,969 679,482 1,162,800 Above 2002/03 and 2003/04 328,332 617,683 520,196 1,003,514 Low estimate: –20 percent 325,078 517,979 452,988 775,200 Above 2002/03 and 2003/04 218,887 411,788 346,797 669,009
National crop production estimates Increment above 2002/03 and 2003/04 (mt) 975,262 1,698,956 1,031,938 2,031,816
Net maize exports in following year (exports minus imports, mt) –78,491 224,972 –101,027 –50,398
Source: Incremental fertilizer and seed sales figures are from Dorward and Chirwa (2009a). Figures for yield response and incremental seed impact for 2008/09 are from Dorward and Chirwa (2010). National crop estimates are from MoAFS. Net maize exports are from Jayne et al. (2010). Note: Production seasons 2002/03 and 2003/04 are considered nondrought years for presubsidy comparisons, although targeted input subsidies of 35,000 and 22,000 metric tons of fertilizer were provided in these years, and a 10 percent displacement is assumed for these years. OPV sales for 2005/06 are estimated to be 50 percent of budgeted sales.
noted earlier, prices have varied widely in the past, and, as shown in figure 17.4, variability has continued in the period of subsidy implementation—indeed, maize prices reached historic highs in early 2009.
High maize prices would not be expected given the large maize production estimates in each subsidy year—rather, low prices would be expected.18 Low prices were observed in the 2006/07 marketing season (following the 2005/06 sub- sidy) and initially in 2007/08 (following the 2006/07 sub- sidy). In the latter year, however, prices rose toward the end of the season, so that the maximum monthly price within the year was high, although substantially larger estimated pro- duction as compared with the previous year should have led to lower prices. Prices following the 2007/08 subsidy were even higher, with average annual prices exceeding those of the 2001/02 and 2005/06 famine years,19 but these high prices did not lead to any reports of widespread suffering and distress such as those experienced in previous years with equivalent prices. Prices in the first half of the 2009/10 sea- son (following the 2008/09 subsidy) were considerably lower than in the previous year, although the estimated production was still very high by historical standards (figure 17.5).
A number of explanations for this pattern of prices and estimated production may be put forward:
In 2007/08, roughly 330,000 metric tons of maize were
exported. In 2009/10, 130,000 tons were purchased by government for the strategic grain reserve (SGR), and a further 100,000 tons are estimated to have been bought and held in storage by private traders (FEWSNet 2009).
Exports and purchases of stocks to carry over to the fol- lowing season would reduce maize volumes (this would not be the case for 2009/10 SGR and other stock pur- chases subsequently sold later in the 2009/10 season). The effect of this on figure 17.5 would be to shift the 2006/07 and 2008/09 subsidy figures to the left by around 300,000 and 100,000 metric tons, respectively.20 This does not, however, bring the three later subsidy years anywhere near the pattern of the 1993/94, 1995/96 to 2004/05, and 2006/07 seasons. Indeed, there were reports of maize imports of roughly 50,000 tons from Mozam- bique and 36,000 tons from South Africa during the 2008/09 season (FEWSNet 2009; South African Revenue Service 2009).
Rising real incomes alongside falling poverty rates and rising population may lead to rising national demand, which would cause the 1995/96 to 2004/05 demand to increase over time—but not as suddenly and dramati- cally as shown in figure 17.5. Such a trend is compatible with the lack of distress in later years despite high prices.
Storage losses may be rising as a result of increasing pro- duction of hybrid maize promoted by the 2006/07 and subsequent subsidy programs. However, 2009 household survey results suggest that storage losses are not particu- larly high, with 50 percent of respondents reporting no losses in the 2007/08 and 2008/09 storage years and only a little over 20 percent reporting high losses (Dorward and Chirwa 2009b). Mangisoni (2010) also reports rela- tively low storage losses, in the range of 12 percent over a 10-month period.

306 CHAPTER 17: MALAWI’S AGRICULTURAL INPUT SUBSIDY PROGRAM EXPERIENCE OVER 2005–09
Max
imum
mai
ze p
rice
per k
ilogr
am
(in 2
005
U.S.
$)
Mai
ze p
rice
at 1
990
US$/
kg
Figure 17.4 Mean Annual Maize Price in Malawi, by Marketing Season
0.40
0.35
0.30
0.25
0.20
0.15
0.10
0.05
0
Subsidy years
Source: MoAFS. Note: Maize prices are simple averages across all markets obtained from weekly surveys, all deflated to 1990 prices.
Figure 17.5 Peak Monthly Maize Prices in Malawi by Estimated Maize Supply per Capita, by Season
0.50
0.45
0.40
2004/05
2000/01 1996/97
1994/95
2007/08
0.35
0.30
0.25
1993/94 1997/98
2001/02 1995/96
1998/99
2006/07
2008/09
0.20
0.15
2003/04 2002/03
2005/06
1999/2000
0.10 0.10 0.15 0.20
0.25 0.30
Per capita maize crop estimates plus net imports (metric tons)
1993/94–2004/05 2005/06–2008/09
Source: Calculated from MoAFS annual crop production estimates and weekly maize price data with export-import data from Jayne et al. 2010, Minot 2009, and FAO 2009. Note: Estimated maize supply = crop estimate plus exports – imports. Labels show production season.
Higher welfare and real incomes following the 2005/06 harvest and low maize prices led to greater retention and consumption of the 2006/07 harvest and hence a thinner and tighter market.
Changes in informal cross-border flows could also have occurred (Jayne et al. 2010).
Finally, national maize production following the imple- mentation of the subsidy program could have been over- estimated. Although there are no clear changes in methodology in the last few years, the method appears to rely substantially on field workers’ subjective estimates of crop area and yield, which may be affected by the very

CHAPTER 17: MALAWI’S AGRICULTURAL INPUT SUBSIDY PROGRAM EXPERIENCE OVER 2005–09 307
substantial involvement of field workers in the subsidy program. Production impacts of the subsidy program are discussed in more detail below.
None of these explanations (except possibly the last) can
fully explain the high prices despite the high estimated pro- duction following the 2006/07, 2007/08, and 2008/09 sub- sidy programs. To illustrate this, figure 17.5 plots maximum monthly price against estimated per capita net maize sup- ply. From the 1993/94 to 2004/05 production seasons, there was a roughly downward sloping relationship, with high prices following years of low supply and low prices in years following high supply (although the 2002/03 and 2003/04 seasons do not fit this relationship). Prices following the first (2005/06) subsidy fit this pattern. The three subsequent seasons, however, when prices were high despite high esti- mates of production, do not fit this pattern.
Two clear and important conclusions emerge from this analysis. First, in three out of four years, the subsidy pro- gram did not lead to lower market prices for maize. Second, the subsidy program has not led to increases in maize sup- ply as large as those suggested by increases in maize crop estimates from 2006/07 onward, particularly in 2007/08 and 2008/09, when prices appeared to be very high compared with estimated supplies. We therefore consider estimates of the subsidy programs impacts on production.
Production impacts
The major stated objectives of Malawi’s subsidy program have been to achieve food self-sufficiency and to increase the incomes of resource-poor households through increased food and cash crop production. Increased pro- duction is therefore critical to achievement of program objectives. This results from incremental use of inputs (mainly fertilizers and seeds) leading to increased yields, with yield responses to these inputs dependent upon the weather and the efficiency of input use and of crop produc- tion. Estimated incremental fertilizer sales were discussed earlier in terms of the effects of displacement on input sup- ply markets. Incremental fertilizer sales are also important for estimating the incremental production effects of the program, with responses to fertilizer depending upon rain- fall, crop variety, and management (including timing of planting, weeding, and timing and methods of fertilizer application), and soil fertility.
SOAS et al. (2008) and Dorward and Chirwa (2009a) cal- culate estimated incremental production for 2005/06 to 2007/08 using a range of 12 to 18 kilograms of grain per
kilogram of nitrogen. Results from crop-cutting survey esti- mates in the 2008/09 crop year demonstrate that substantial problems in obtaining precise estimates of crop responses21
make it difficult to obtain precise estimates of incremental production from the subsidy program. They do, however, support the broad response of 12 to 18 kilograms of grain per kilogram of fertilizer, with 15 kilograms per hectare a reasonable “medium expectation.” Using different estimates of incremental fertilizer use and of yield responses gives dif- ferent estimates of incremental production as a result of the input subsidy program. Table 17.8 sets out such estimates by year of implementation.
For each year estimated, incremental fertilizer use is mul- tiplied by a grain-to-nitrogen response ratio adjusted to reflect differing conditions in subsidy implementation between years (good weather but very little hybrid seed in 2005/06 compared with 2008/09; similar conditions in 2006/07 but a bit less hybrid seed; late fertilizer delivery in the southern region and only slightly more hybrid seed in 2007/08). This is added to a yield gain from subsidized hybrid seed separate from fertilizer to arrive at an estimate of total incremental maize production from the subsidy.22
High and low estimates are, respectively, 20 percent above and below the 2008/09 medium estimate (which averaged 15 kilograms of grain per kilogram of fertilizer across hybrid and local seed plots).
While the estimates in table 17.8 are necessarily approxi- mate, indeed indicative, as noted above, they nevertheless demonstrate several important points: Incremental production is very sensitive to yield
responses to inputs (hybrid seed and fertilizers) and the potential is therefore considerable for raising yields and yield responses with good subsidy program and crop management—with early subsidy sales, planting and fer- tilizer application, high plant populations, and greater use of organic matter, for example.
Not explicitly shown in table 17.8 is the importance of hybrid seed in raising yield responses to fertilizer. Increasing hybrid seed sales (subsidized or unsubsidized) is therefore another potential way of increasing subsidy impacts on incremental production.23
Incremental production estimates are considerable, and they grow over the life of the program as a result of the increasing volume of incremental fertilizer use and increasing supply of hybrid seed.
Incremental production estimates are, however, consid- erably less than the production increases estimated in the national crop estimates for maize production since the

308 CHAPTER 17: MALAWI’S AGRICULTURAL INPUT SUBSIDY PROGRAM EXPERIENCE OVER 2005–09
start of the subsidy program, and these differences are too large to be explained by upward revision of the yield response to fertilizer.24
Differences in production between presubsidy and sub- sidy years as estimated above are more compatible with price differences between these years as shown in figure 17.5 (for example the export of 330,000 metric tons fol- lowing the 2006/07 harvest would more than cancel out the increased subsidy impact that year, compared with 2005/06). The very high prices in 2007/08 remain a puzzle but may be explained by the subsidy program’s incre- mental production being insufficient to counteract pro- duction losses from adverse conditions affecting all maize in some parts of the country (late subsidized input delivery and local events such as flooding and drought spells).
Macroeconomic impacts
The large size of Malawi’s subsidy program could be expected to have macroeconomic impacts. As a proportion of total government expenditure, the subsidy increased from 5.6 percent in 2005/06 to 8.4 percent in 2006/07 to 8.9 percent in 2007/08. With very large increases in fertilizer prices and costs for 2008/09, actual expenditure on the sub- sidy rose to 16.2 percent of total government expenditure (see table 17.5). As a proportion of gross domestic product (GDP), subsidy program costs rose from 2.1 percent in 2005/06 to 3.4 percent in 2007/08 and to 6.6 percent in 2008/09 (excluding remittance by ADMARC and SFFRFM of the farmer’s redemption price to government). (As noted earlier and shown in table 17.5, program costs have subse- quently fallen back markedly.)
On the positive side, estimates of GDP growth have been significantly affected by large increases in estimated maize production since the implementation of the subsidy pro- gram. Estimates of incremental production attributable to the subsidy program are not as high but are nevertheless very large, and incremental maize production and increases in land and labor productivity in maize production attrib- utable to the program should have had a significant positive impact on GDP growth.
No evidence of negative macroeconomic impacts was found in the subsidy’s first two years (SOAS et al. 2008). Important contributors to GDP were sound macroeconomic management; improving macroeconomic indicators includ- ing growth, inflation, and government deficit (table 17.9); and increased growth across the economy at that time; and the subsidy program itself was a contributor to that growth (good tobacco prices, good weather for agricultural
Table 17.9 Trends in Macroeconomic Performance
Indicators, 2005–09 (percent)
Indicator 2005 2006 2007 2008 2009 Real GDP growth 3.3 6.7 8.6 9.7 6.9 Inflation 15.4 13.9 8.0 8.7 10.1 Deficit/GDP
ratio (budget) 2.6 1.5 1.8 1.9 3.7 Deficit/GDP
ratio (actual) 0.4 1.4 4.0 6.3 8.0
Source: Reserve Bank of Malawi 2010. production, and improved macroeconomic management and conditions were other important contributors). Improved macroeconomic management, together with budgetary support from donors, was also undoubtedly important in enabling the government to finance such a large program.
The situation was, changing, however, as increasing vol- umes and increasing prices in subsequent years led to very high cost overruns. At the same time, Malawi’s economy was facing a number of internal and external pressures that led to adverse changes in macroeconomic indicators. The subsidy program both contributed to and was affected by these macroeconomic changes, this time adversely (other macro- economic pressures were very high government expenditure and import costs for the subsidy program with high fuel costs, high maize prices, other government expenditures, and lower tobacco prices), although the incremental maize pro- duction from the subsidy program should have exerted a downward influence on maize prices. In a fixed exchange rate environment, these pressures contributed to a foreign exchange crisis in Malawi in November and December 2009.
Very high budgetary and foreign exchange allocations to the subsidy program also reduced funding available to activ- ities such as health, education, and infrastructure develop- ment. It is clear that the 2008/9 level of spending on the pro- gram was not sustainable, and as noted earlier the government is addressing this: although the very high fertil- izer prices in the 2008/09 season were a temporary phe- nomenon, the government has committed itself to control- ling costs by limiting the volume of subsidized fertilizers in future years. It has also restricted the subsidy to inputs for the production of only maize. Economic returns Economic returns to Malawi’s subsidy program depend upon the economic price of maize, the price of inputs, and

CHAPTER 17: MALAWI’S AGRICULTURAL INPUT SUBSIDY PROGRAM EXPERIENCE OVER 2005–09 309
production responses to increased input use. Producer ben- efit-cost ratios estimated for the 2006/07 program showed that the net economic return to the project is very sensitive to maize prices and the production response, and, with rea- sonable variation in assumptions, these ratios range from 0.81 to 1.30, with a mid estimate of 1.06 (table 17.10). Adjustments to this analysis using estimated maize and fer- tilizer prices for other program years suggest that both the 2005/06 and 2007/08 programs should have yielded equiva- lent or higher returns. However, the very high fertilizer prices that prevailed when fertilizers were being purchased for the 2008/09 program adversely affected returns in 2008/09, despite good weather and yields and high maize prices (although these did offset the effects of high fertilizer prices to some extent).
Fiscal efficiency estimates (net economic benefit per unit of fiscal investment) show a similar pattern to eco- nomic returns, but in addition these are (negatively) affected by high rates of displacement of unsubsidized sales by subsidized sales (displacement lowers the net benefit of subsidized sales). Key conclusions from the benefit-to-cost and fiscal efficiency analyses are that economic returns are highly sensitive to the yield response to fertilizer (as dis- cussed earlier under production impacts); fiscal returns are highly sensitive to displacement rates; and with good pro- gram implementation and good (but achievable) yield responses to fertilizer, the program can be a very good investment. It is therefore critical that the program design and implementation deliver low displacement and high responses to inputs.
Growth and poverty reduction impacts
While the producer benefit-cost and fiscal efficiency analy- ses can yield valuable information about the efficiency of the subsidy program, they can be misleading when examin- ing the contributions of the program to poverty reduction, economic growth, and food security. Understanding the full economic benefits of the program requires consideration of the direct effects of the program on subsidy recipients and of the different ways that these effects subsequently work through their own and others’ livelihoods and the rural economy. Because the program is large, it is very important for the wider market effects of the intervention to be prop- erly recognized.
Figure 17.6 shows three possible uses of the subsidy by subsidy recipients: reselling of coupons or of subsidized inputs, incremental use of the inputs in production, or use of the inputs with displacement of purchase of unsubsi-
dized inputs. These should lead to two main types of direct benefit for recipients: immediate income transfers (from reselling of coupons or subsidized inputs or from reduced expenditure on inputs as a result of displacement of unsub- sidized purchases by cheaper, subsidized purchases), or incremental production at harvest if the inputs are used on farm. If poorer households sell their coupon(s), then imme- diate income and welfare gains should also be accompanied by an easing of short-term seasonal cash constraints. This easing may reduce the extent to which they have to hire out their own labor (as casual ganyu labor) to obtain food, thus allowing them to work more on their own farms, both increasing end-of-season yields and reducing the supply of labor into the local labor market. At the same time, if less poor households obtain cheaper inputs directly from the program or buy those inputs from subsidy recipients, then this increase in income should increase their demand for hired-on farm labor or for local goods and services. The result should be a tightening of both demand and supply in the local labor market, and a consequent rise in wages, to the benefit of poorer households.
Further direct and indirect benefits may also accrue in subsequent seasons. At the end of the season, higher maize production should result from incremental fertilizer use and increased crop labor inputs, increasing households’ incomes. Higher production should also depress maize prices. Higher household maize stocks and lower maize prices carried forward into the following season should again benefit poorer households, reducing their seasonal cash flow constraints and their need to hire out their labor, so that they can again work more on their own farms. This will again tighten the labor market. Higher incomes from higher wages should stimulate demand for nonfarm goods and services, with spin-off benefits and multipliers in the local economy.
There is considerable empirical support from Asia and from Africa for the importance of some of these processes and of indirect effects of agricultural growth on wider eco- nomic growth. Hazell and Rosegrant (2000) show that the indirect effects of increased agricultural production in the green revolution in Asia were the major process driving pro- poor growth in the second half of the 20th century. There is also a large body of literature on agricultural growth “mul- tipliers” in Africa, with estimates that vary from around 1.5 to over 2.0 (a multiplier of 1.5 indicates that $1.00 of extra income from agricultural production results in further income growth of $0.50) (Hazell and Hojjati 1995; Reardon 1998; Delgado, Hopkins, and Kelly 1998). Studies of countries across Africa and Asia also generally show that consumption

310
Table 17.10 Estimated Economic Impacts of Subsidy Programs in Malawi
Economic impact 2005/06 2006/07 2007/08 2008/09 Domestic maize prices ($/mt) May–Oct Nov 2006– May–Oct Nov 2007– May–Oct Nov 2008– May–Oct Nov 2009–
2006 Apr 2007 2007 Apr 2008 2008 Apr 2009 2009 Apr 2010
139.5 142.7 119.3 243.8 336.6 434.6 271.4 307.1 Maize price in benefit-cost and
fiscal efficiency analysis ($/mt)
143
154
250
280
Fertilizer price in analysis ($/mt) 393 490 590 1,250 Benefit-cost ratio, high response 1.38 1.30 1.90 1.08 Benefit-cost ratio, moderate
response
1.12
1.06
1.54
0.90 Benefit-cost ratio, low response 0.86 0.81 1.18 0.72 Fiscal efficiency, high response 0.76 0.44 1.13 0.09 Fiscal efficiency, moderate response 0.24 0.09 0.68 negative Fiscal efficiency, low response negative negative 0.23 negative
2005 2006 2007 2008 Poverty incidence 50% 45% 40% 40% Meals per day 2.0 2.2 2.3 2.3
Sources: SOAS et al. 2008; Dorward, Chirwa, and Slater 2010b; Food and Nutrition Security Program 2008; NSO 2006, 2009. Note: The benefit-cost ratio and fiscal efficiencies were calculated with high, medium, and low fertilizer responses of 18, 15, and 12 kilograms of grain per kilogram of fertilizer, respectively. The benefit-cost ratio is calculated as the gross incremental benefits divided by the gross incremental cost, valued at social prices. Fiscal efficiency is calculated as the net economic benefit divided by fiscal cost.

CHAPTER 17: MALAWI’S AGRICULTURAL INPUT SUBSIDY PROGRAM EXPERIENCE OVER 2005–09 311
Figure 17.6 Tracing Direct and Indirect Subsidy Impacts
Rural households
Poorer households
Resale
Y1 Increased real incomes
Farm/non-farm investment
Y2 Increased real incomes
Input subsidy
Incremental use
Displacement use
less poor households
Y1 Increased production
Y2 Increased production
Y1 Increased wages
Y2 Reduced maize prices
Y2 Increased wages
Rural economy
Input service demand
and investment
Farm/nonfarm
demand and investment
Source: SOAS et al 2008. Note: Solid lines indicate positive impacts for poorer, food-deficit producers and sellers of labor; dashed lines indicate negative impacts for the less poor, maize surplus producers, and buyers of labor.
linkages are more important than production linkages, accounting for between 50 percent (in Senegal) and 98 per- cent (in Zambia) of overall multipliers calculated (Delgado, Hopkins, and Kelly 1998). These studies do not, however, explicitly consider the further effects of transfers and growth on seasonal capital constraints, or the knock-on effects of relaxing these constraints.
The extent of these effects and of direct and indirect increases in wages and benefits to poorer households as a result of implementation of the subsidy program is, however, an empirical question, as is the extent to which productivity and welfare benefits are carried forward from one year to the next. Focus group discussions in 2007, reporting on the effects of the 2005/06 subsidy, clearly (and independently) articulated processes of easing of seasonal cash constraints in the hungry gap and tightening of labor markets, with higher wages and low maize prices throughout the season (SOAS et al. 2008). Similar focus group discussions con- ducted in 2009 reported income benefits from higher wages and increased maize availability, though they were also con- cerned about the adverse effects of high maize prices—and the high maize prices experienced after 2006/07 would be expected to undermine these processes.
Livelihood and rural economy models have also been used to investigate and describe this process in 2006/07 (see
SOAS et al. 2008) and for 2008/09 (Dorward 2010). These studies provide results consistent with those of the focus group discussion reports, finding that the subsidy con- tributes to higher wages but had lower wage effects in 2008/09 and that subsidy benefits have become more con- centrated among beneficiaries (because the value of direct production benefits to subsidy recipients is increased with higher maize prices, but the benefits of lower maize prices and higher wages to poor nonbeneficiaries are absent or reduced). Fragmented information on wage rates over the period 2005/06 to 2008/09 suggests that wage rate increases over the period were higher than maize price increases over the same period, representing real increase in wage rates.
Further empirical work is required to investigate the scale of the indirect benefits through wage effects, because they depend heavily upon the scale of growth multipliers (consumption multipliers of slightly more than 1.5 embed- ded in the livelihood and rural economy models are derived from historical expenditure patterns in Malawi, which are augmented by savings multipliers in the model). Without these multipliers, wage impacts would be very low—analysis of 2006/07 and 2008/09 household survey data suggests that agricultural wage labor constitutes less than 20 percent of household income even among the poorest 20 percent of rural households in Malawi, although

312 CHAPTER 17: MALAWI’S AGRICULTURAL INPUT SUBSIDY PROGRAM EXPERIENCE OVER 2005–09
observed rises in agricultural wages suggest that unskilled, nonagricultural wages have also risen, unless these two labor markets are completely separated, an unlikely scenario.
The overall increase in real wages over the period is sup- ported by anecdotal reports of rising rural wages and is con- sistent with the limited political and social impact of and response to high nominal maize prices in early 2009. It is also consistent with reports of falling poverty rates and decreased wasting among children under the age of five. The subsidy program is not the only contributor to these improvements. Over the same period, there were good rains, a marked improvement in macroeconomic management, and relatively high tobacco prices. These factors will have made direct contributions to economic growth, and also facilitated the implementation and impact of the subsidy program (the tobacco prices and macroeconomic manage- ment contribute to the availability of foreign exchange for fertilizer imports, reduce the crowding-out effects of the program, and stimulate other complementary parts of the economy; good rains promote good yield responses to fertilizers).
While attribution of these changes to the program is dif- ficult, there are reasons to believe that the stimulus to maize production from the subsidy and the good rains has been a critical element in rural economic growth and poverty reduction, as compared with the effects of good tobacco prices alone. Limited evidence from elsewhere in Africa and the world suggests that even labor-demanding smallholder cash crops can drive pro-poor growth in such a broad way. Further empirical work is also needed to establish the extent to which productivity and welfare gains in one year are car- ried forward to subsequent years, the conditions under which these gains can be maximized, and the implications for subsidy program design and implementation and ques- tions about graduation.
CONCLUSIONS AND LESSONS
This chapter suggests that the Malawi agricultural input sub- sidy program has achieved substantial benefits and successes, although these are more nuanced than some press reports on the program suggest. The measured producer benefits of the program relative to its costs have been relatively modest; however, our benefit-cost analysis does not capture all the benefits of the program, nor all of its costs. Moreover, there is scope for considerable improvement in the program’s effectiveness and efficiency, although there are also practical and political difficulties regarding the implementation of some of these and questions about their effects.
Other African countries considering the introduction of agricultural input subsidies can learn important lessons from Malawi’s experience. The program is a bold, large- scale initiative that has achieved substantial increases in maize production. The implementation of such a program represents a very considerable logistical achievement, and the government is to be commended for this and for its con- tinuing and often imaginative attempts to improve the program. Nevertheless, higher maize prices and calculation of the agronomic yield effects of incremental fertilizer and seed suggest the production increases resulting from the program are not as large as might appear from the post- 2005/06 national maize production increases reported by MoAFS. The benefits of the program also have to be weighed against its very considerable costs (with an average of over 9 percent of the national budget going to the subsidy program since 2005/06) and the loss of benefits from alter- native investment of these funds. While the food security and growth benefits of the program have been partially undermined by high maize prices, there have still been sig- nificant improvements in productivity and welfare from 2005/06 associated with greater maize availability and with increases in real wages.
Ongoing implementation challenges that the govern- ment is working on include controlling costs, timing of input deliveries, effective targeting of subsidized inputs, reducing diversion and fraud, improving agronomic and market returns with complementary investments (for example, in extension, research, organic soil fertility improvement, and roads), and using the subsidy program to extend private sector input delivery systems. Success in addressing these challenges will lead to new challenges because increasing success will lead to changes in the need for such a large-scale program with these objectives—and continuing political, strategic, economic, technical, and logistical system innovations will be needed to respond to these changes.
Malawi’s experience with its large-scale agricultural input subsidy program offers a number of important les- sons to other countries in Africa considering the introduc- tion of agricultural input subsidies.
First, any growth and development strategy that involves agricultural input subsidies must be rooted in the opportu- nities for and constraints to growth and development facing a country and particular groups within it. This chapter has set out in some detail specific difficulties that constrain broad-based growth in Malawi, highlighting the reliance on low-productivity maize and the difficulties and limited options faced by very large numbers of poor, food-deficit

CHAPTER 17: MALAWI’S AGRICULTURAL INPUT SUBSIDY PROGRAM EXPERIENCE OVER 2005–09 313
farmers, and indeed by the Malawian economy as a whole, in breaking out of the low-maize-productivity and poverty traps.
This low-productivity trap arises as a result of severe sea- sonal credit constraints affecting very large numbers of poor, food-deficit farming families, together with thin and high-risk, high-margin input and maize markets. Malawi’s key achievements with its subsidy program have been the ability to raise land and labor productivity and improve food security for large numbers of poor households by relieving both profitability and affordability constraints on the use of inputs needed to increase staple crop productiv- ity, leading to some combination of increased real wages and reduced food prices. The Malawian model thus applies to other countries only if there are large numbers of people facing similar staple-food-productivity constraints along- side increased input use constrained by thin input markets, poorly developed input supply systems, and widespread profitability and affordability problems.
Malawi’s experience also shows that, in the right context, large-scale agricultural input subsidy programs have the potential to yield substantial benefits to people and their governments with good design and implementation. The chapter has also shown the very substantial costs and resources required for such programs, and the difficulties and challenges that must be overcome for effective, efficient, and sustainable delivery of program benefits. Several issues from Malawi’s experience are relevant to other countries considering similar subsidy programs:
Focus: subsidies should be provided for inputs whose use
for important staple crops is constrained by affordability difficulties despite high potential responses to input use.
Consumer gains: strong emphasis should be put on wider contributions to economic growth and poverty reduc- tion through consumer as well as producer gains.
Scale: the subsidy should affect staple crop prices, labor markets, or both, requiring sufficient local or national scale to affect markets, but strict limits on scale and the control of costs are needed to limit displacement of exist- ing purchases, crowding out of critical complementary investments, and adverse macroeconomic impacts.
Logistical systems face major challenges in delivering timely, targeted subsidies to large numbers of widely dis- persed farmers, and the establishment of such logistical systems requires time and major investments.
Performance monitoring, information, and auditing systems are needed to develop trust, control fraud, and promote efficiency and effectiveness. Debates on crop production
estimates and the number of farm families in Malawi also demonstrate the importance of reliable information for issues beyond specific matters related to the imple- mentation of the subsidy program and assessments of its impacts.
Effective targeting and rationing systems are needed to limit scale and increase subsidy impacts on productivity, but different (geographical or household) approaches face different costs and difficulties (Dorward 2009), and in some situations strict rationing of universal provision may be a practicable alternative.
Entitlement systems are needed for targeting and rationing, and these need to be robust against inevitable counterfeiting and diversion.
Input supply system development requires close attention to the complementary and changing roles and interests of different public sector and commercial stakeholders, but improved farmer access to input services should be a major objective and outcome of agricultural input sub- sidy programs.
Complementary policies and investments: if a subsidy pro- gram is seen as part of a broad, long-term strategy for poverty reduction and economic development, then investments in complementary activities must be made in areas such as extension, research, organic soil fertility improvement, health, education, markets, transport and communication infrastructure, and services. Considera- tion of the different roles of these complementary invest- ments should also guide decisions on the nature, scale, and implementation of the input subsidy, as well as of other investments, in order to achieve positive interac- tions among investments.
Macroeconomic management to promote favorable growth conditions and provide budgetary resources needed for such a program is also important.
Political commitment is required for sustained mobiliza- tion of program resources, but there may also be poten- tial conflicts between the need for political support on the one hand and targeting, rationing, cost control, and performance monitoring needed for efficient and sus- tainable implementation on the other.
Sustainability of program implementation should be addressed by attention to cost control, scale, and logistical and performance monitoring and audit systems. There is also need for investigation of sustainability of impacts, with examination of the extent to which productivity and welfare gains carry forward from one year to the next and the implications of this analysis for program design and implementation and for questions about graduation.

314 CHAPTER 17: MALAWI’S AGRICULTURAL INPUT SUBSIDY PROGRAM EXPERIENCE OVER 2005–09
An innate dilemma in the design and implementation of large-scale subsidy programs is that such programs require both stability and flexibility, with innovation. Stability is needed to provide stakeholders with confidence and security that will justify long-term financial and other investments associated with the program’s implementation. Stability can be undermined, however, by the need for flexibility to adjust to changing conditions (for example in the weather, in international and national markets and economies, or in politics), and some of these changes may be anticipated or unanticipated results of the program. Alongside flexibility is the need for innovation (in technology, systems, and prices) to take advantage of learning and change during program implementation. Although flexibility and innovation can undermine stability, lack of flexibility and innovation may also undermine stability if conditions, such as increasing incidence of fraud, make the system unsustainable and inef- fective in its initial form. To achieve mutually supportive stability, flexibility, and innovation, trust and stable princi- ples must govern both the long-term objectives of and rela- tions between different stakeholders on one hand and the processes for successful learning, flexibility, and innovation on the other.
NOTES
1. This section draws heavily on material from SOAS (2008). 2. Reasons for the high dependency on maize as opposed
to other food crops include dietary preferences, different crops’ relative calorific yields per hectare in different agro- ecologies, farmers’ familiarity with the crop, and long- standing strong government policies aimed at promoting maize production and input and crop marketing subsidies focused on maize. 3. Understanding of the nature, causes, and relative impor-
tance of these problems varies (indeed, elements of the analysis presented here are not universally accepted, nor is this paper a comprehensive account of the complex issues involved). 4. The postharvest value-to-cost ratio has generally been
less than 2, widely considered to be the minimum required to make fertilizer use profitable in moderately but not highly risky situations (Morris et al. 2007). Even for higher preharvest maize prices, the ratio typically has been around or below 2 (SOAS 2008), depending on the yield response achieved. With high yield responses, the value-to-cost ratio has been above 2 in some years (Maize Productivity Task Force 1997). 5. Table 17.1 shows, for example, that the median for
maize stocks running out each year is between four and six
months after harvest, and that in 2003/04 one bag of fertil- izer represented approximately 10 percent of rural house- holds’ median per capita annual expenditure (and more than 20 percent of median per capita expenditure of the lowest expenditure quintile). 6. A ratio of 15 was used in the calculations cited above
based on what are believed to represent mean grain-to- nitrogen response rates to fertilizer application on farmers’ fields. Improved management and uptake of hybrid seed provide the potential for higher ratios (in the range of 22 to 28 kilograms of maize per kilogram of fertilizer applied). Hence, improved farm management practices have the potential to make fertilizer use on maize profitable even without subsidy, although the affordability constraint remains. 7. This section draws heavily on Dorward (2009). 8. This analysis applies only to subsidies implemented on a
scale large enough to affect output prices. Small-scale subsi- dies that do not significantly affect product prices are equiv- alent to highly elastic product demand: subsidy benefits are largely captured by suppliers and producers, and dead- weight costs depend upon the elasticity of supply. 9. This is not a problem in situations in which the
providers of land and labor are poor. Indeed, subsidies can promote pro-poor growth in such situations. 10. For this, complementary constraints to effective use of inputs by targeted beneficiaries must be addressed. 11. The terms “coupon” and “voucher” are used inter- changeably in wider discussions of the Malawi Agricultural Input Subsidy program and in this paper. 12. Efficient and stable output markets may require less government intervention in direct market operations but more focused investment in market insurance and in facili- tating infrastructure and institutions. 13. This section draws heavily on SOAS (2008) and on Dorward and Chirwa 2009a. 14. No information is available on seed sales. 15. A standard maize subsidy pack in 2005/06 consisted of one voucher for a 50 kilogram bag of 23:21:0+4S, one voucher for a 50 kilogram bag of 23:21:0+4S, and one voucher for improved maize seed. A standard tobacco sub- sidy pack consisted of one voucher each for a 50 kilogram bag of calcium ammonium nitrate (CAN) and a 50 kilo- gram bag of D Compound. The fertilizer vouchers were redeemable for MK 950. The seed voucher required no top- up and could be used to purchase 2 kilograms of hybrid seed or 3 to 4 kilograms of OPV seed, depending on the price set by the seed supply company. 16. These variations in targeting stem from vagueness in the definition of target beneficiaries in the guidelines and dif- ferences in the way communities dealt with problems of
CHAPTER 17: MALAWI’S AGRICULTURAL INPUT SUBSIDY PROGRAM EXPERIENCE OVER 2005–09 315
shortages. Variations meant that those that were targeting beneficiaries placed different emphasis on different criteria and processes. 17. Displacement for 2007/08 is assumed to be similar to that for 2006/07 (higher subsidy sales may increase displacement, but greater farmer familiarity and higher fertilizer prices would be expected to reduce displacement). A lower displace- ment is assumed for 2008/09 as a result of much higher fer- tilizer prices and earlier (separate) beneficiary registration. 18. Low average prices in some years in the early 1990s were brought about by large-scale imports, and at the turn of the century by the starter pack subsidy program (with good weather). 19. Although the annual average price in 2008/09 was very high, peak prices were equivalent to those in 2001/02 and 2005/06 because prices rose much earlier in the season in 2008/09 but then flattened out. 20. The latter may be higher if there are significant exports or commercial carryover stocks at the end of the season. 21. These include inherent and difficult-to-quantify biases in different methods of collecting yield data, multicollinear- ity between input use and other management variables, high variability in smallholder agriculture, and variation of response rates with average rates of subsidized fertilizer use. 22. This calculation considers only maize production. Provision of the fertilizer subsidy for tobacco leads to a much higher displacement than for maize; thus, assuming that all incremental fertilizer is used on maize is not unreasonable. Fertilizer impacts on crops mixed with maize are ignored here. 23. It is important to note that increased hybrid seed subsi- dies may not be required if farmers are able and willing to purchase unsubsidized seed—improved access to seed, increased distributors, and effective extension may be more effective in increasing hybrid seed use. 24. For 2007/08, however, low crop output resulting from local droughts and floods affected total production, not just incremental production from the subsidy.
REFERENCES
Ariga, J., and T. Jayne. 2009. “Private Sector Responses to Public Investments and Policy Reforms. The Case of Fer- tilizer and Maize Market Development in Kenya.” Dis- cussion Paper 00921. International Food Policy Research Institute (IFPRI), Washington, DC.
Ariga, J., T. Jayne, B. Kibaara, and J. K. Nyoro. 2008. “Trends and Patterns in Fertilizer Use by Smallholder Farmers in Kenya, 1997–2007.” KeWP 28, Tegemeo Institute, Nairobi.
Chapoto, A., and T. S. Jayne. 2010. “Maize Price Instability in Eastern and Southern Africa: The Impact of Trade Barriers
and Market Interventions.” Prepared for the COMESA policy seminar “Variation in Staple Food Prices: Causes, Consequence, and Policy Options.” Maputo, Mozam- bique, 25-26 January 2010 under the Comesa-MSU- IFPRI African Agricultural Markets Project.
Chirwa, E., M. Matita, and A. Dorward. 2010. “Factors Influencing Access to Agricultural Input Subsidy Coupons in Malawi.” Future Agricultures Consortium, Brighton, U.K.
Crawford, E. W., T. S. Jayne, and V. A. Kelly. 2006. “Alterna- tive Approaches for Promoting Fertilizer Use in Africa.” Agriculture and Rural Development Discussion Paper 22, World Bank, Washington, DC.
Delgado, L. C., J. Hopkins, and V. A. Kelly. 1998. “Agricul- tural Growth Linkages in Sub-Saharan Africa.” IFPRI Research Report. IFPRI, Washington, DC.
Djurfeldt, G., H. Holmen, M. Jirstrom, and R. Larsson, eds. 2005. The African Food Crisis: Lessons from the Asian Green Revolution. Wallingford, U.K.: CABI Publishing.
Dorward, A. R. 2006. “Markets and Pro-poor Agricultural Growth: Insights from Livelihood and Informal Rural Economy Models in Malawi.” Agricultural Economics 35 (2): 157–69.
———. 2009. “Rethinking Agricultural Input Subsidy Pro- grams in Developing Countries.” Non-Distorting Farm Support to Enhance Global Good Production, ed. A. Elbehri and A. Sarris, pp. 311-74. Rome: Food and Agri- culture Organization. Also available at http://www.fao .org/es/esc/common/ecg/586/en/Dorward_FAO_Subsidy_ Paper_FINAL.pdf.
———. 2010. “Informal Rural Economy Modelling of Sub- sidy Impacts.” Unpublished paper, SOAS (School of Ori- ental and African Studies), London.
Dorward, A. R., and E. Chirwa. 2009a. “The Agricultural Input Subsidy Program 2005 to 2008: Achievements and Challenges.” School of Oriental and African Studies, London.
———. 2009b. “The Malawi Agricultural Input Subsidy Programme: 2009 Fieldwork Preliminary Report.” School of Oriental and African Studies, London.
———. 2010. “Evaluation of the 2008/09 Agricultural Input Subsidy Malawi: Maize Production Impacts.” School of Oriental and African Studies, London.
Dorward, A., E. Chirwa, and R. Slater. 2010a. “Evaluation of the 2008/09 Agricultural Input Subsidy Malawi: Prelimi- nary Report on Program Impact.” School of Oriental and African Studies, London.
———. 2010b. “Evaluation of the 2008/09 Agricultural Input Subsidy Malawi: Report on Program Implemen- tation.” School of Oriental and African Studies, London.

316 CHAPTER 17: MALAWI’S AGRICULTURAL INPUT SUBSIDY PROGRAM EXPERIENCE OVER 2005–09
Dorward, A. R., J. G. Kydd, J. A. Morrison, and I. Urey. 2004. “A Policy Agenda for Pro-Poor Agricultural Growth.” World Development 32 (1): 73–89.
Economist Intelligence Unit. 2008. “Lifting African and Asian Farmers Out of Poverty: Assessing the Investment Needs.” Custom research project for the Bill and Melinda Gates Foundation, New York.
Ellis, F. 1992. Agricultural Policies in Developing Countries. Cambridge, U.K.: Cambridge University Press.
Fan, S., A. Gulati, and S. Thorat. 2007. “Investment, Subsi- dies, and Pro-Poor Growth in Rural India.” Discussion Paper 716, IFPRI, Washington, DC.
Fan, S., S. Thorat, and N. Rao. 2004. “Investment, Subsidies, and Pro-Poor Growth in Rural India: Institutions and Economic Policies for Pro-poor Agricultural Growth.” IFPRI discussion paper, IFPRI, Washington, DC.
FAO (Food and Agriculture Organization). 2009. FAO Agri- cultural production data. Rome.
FEWS NET. 2009. “Malawi Food Security Outlook, October 2009–March 2010.” Lilongwe.
Food and Nutrition Security Program. 2008. “Monitoring and Evaluation, 6th Report,” (draft). Lilongwe.
Govereh, J., J. Shawa, E. Malawo, and T. S. Jayne. 2006. “Rais- ing the Productivity of Public Investments in Zambia’s Agricultural Sector.” Working Paper 20, Food Security Research Project, Lusaka.
Harrigan, J. 2003. “U-Turns and Full Circles: Two Decades of Agricultural Reform in Malawi 1981–2000.” World Development 31 (5): 847–63.
Hazell, P., and B. Hojjati. 1995. “Farm/Non-Farm Growth Linkages in Zambia.” Journal of African Economies 4 (3): 406–35.
Hazell, P., and M. Rosegrant. 2000. Rural Asia: Beyond the Green Revolution. Manila: Asian Development Bank.
Jayne, T. S., J. Mangisoni, N. Sitko, and J. Ricker-Gilbert. 2010. “Malawi’s Maize Marketing System.” Report com- missioned by the World Bank and Ministry of Agriculture of the Government of Malawi, Lilongwe.
Kelly, V. A., D. Boughton, and N. Lenski. 2010. “Malawi Agri- cultural Inputs Subsidy Program: Evaluation of the 2007/08 and 2008/09 Input Supply Sector Analysis.” Michigan State University, East Lansing, MI.
Levy, S., ed. 2005. Starter Packs: A Strategy to Fight Hunger in Developing and Transition Countries? Lessons from the Malawi Experience, 1998–2003. Wallingford, U.K.: CABI.
Logistics Unit. 2009. “Final Report: Implementation of Agri- cultural Inputs Subsidy Program 2008/09.” Lilongwe.
Maize Productivity Task Force, Ministry of Agriculture of Malawi. 1997. “Area-specific Recommendations for Hybrid Maize Grown by Malawian Smallholders: A Man- ual for Extension Field Assistants.” Lilongwe.
Mangisoni, J. 2010. “Defects and Storage Loss Analysis of Maize Grain in Malawi.” Unpublished paper, Bunda Col- lege, University of Malawi.
MoAFS (Ministry of Agriculture and Food Security of Malawi). 2008. “The 2007/2008 Inputs Subsidy Program Review Report: An Internal Review.” Department of Agricultural Planning Services, Lilongwe.
Minot, N. 2009. “Staple Food Prices in Malawi.” Prepared for the COMESA policy seminar “Variation in Staple Food Prices: Causes, Consequences, and Policy Options.” Maputo, 25–26 January 2010 under the African Agricul- tural Marketing Project, IFPRI.
Morris, M., V. A. Kelly, R. Kopicki, and D. Byerlee. 2007. “Fertilizer Use in African Agriculture.” World Bank, Washington, DC.
Munthali, M. W. 2007. “Integrated Soil Fertility Manage- ment Technologies: A Counteract to Existing Milestone in Obtaining Achievable Economical Crop Yields in Cul- tivated Lands of Poor Smallholder Farmers in Malawi.” In Advances in Integrated Soil Fertility Management in Sub-Saharan Africa, ed. A. Bationo, B. Waswa, J. Kihara, and J. Kimetu, pp. 533–536. Dordrecht, The Netherlands: Springer.
Nakhumwa, T. O. 2006. “Rapid Evaluation of the 2005 Fer- tilizer Subsidy Program in Malawi.” Policy Paper No 10, CISANET, Lilongwe.
NSO (National Statistical Office of Malawi). 2005. “Inte- grated Household Survey 2004 –2005.” Zomba.
———. 2006. “Welfare Monitoring Survey 2005.” Zomba. ———. 2008. “Welfare Monitoring Survey 2008.” Zomba. ———. 2009a. “2008 Population and Housing Census: Pre-
liminary Report.” Zomba. ———. 2009b. “Welfare Monitoring Survey 2008.”
Zomba. Reardon, T. 1998. Rural Non-farm Income in Developing
Countries: The State of Food and Agriculture 1998. Rome: Food and Agriculture Organization.
Reserve Bank of Malawi. 2010. “Financial and Economic Review 2009.” Lilongwe.
Ricker-Gilbert, J., and T. Jayne. 2010. “The Impact of Fertil- izer Subsidies on Displacement and Total Fertilizer Use.” Unpublished presentation, Lilongwe.
Ricker-Gilbert, J., T. S. Jayne, and E. Chirwa. 2011. “Subsidies and Crowding Out: A Double-Hurdle Model of Fertilizer Demand in Malawi.” American Journal of Agricultural Economics 93 (February): 26–42.

CHAPTER 17: MALAWI’S AGRICULTURAL INPUT SUBSIDY PROGRAM EXPERIENCE OVER 2005–09 317
SOAS (School of Oriental and African Studies), Wadonda Consult, Overseas Development Institute, and Michigan State University. 2008. “Evaluation of the 2006/07 Agri- cultural Input Supply Program Malawi: Final Report.” SOAS, London.
South African Revenue Service. 2009. Monthly maize quan- tities exported to Malawi. SARS database. Pretoria.
Siamwalla, A., and A. Valdes. 1986. “Should Crop Insur- ance Be Subsidized?” In Crop Insurance for Agricultural Development: Issues and Experience, ed. P. Hazell, C. Pomareda, and A. Valdes, pp. 117–25. Baltimore: IFPRI and John Hopkins University Press.
Timmer, C. P. 1989. “Indonesia: Transition from Food Importer to Food Exporter.” In Food Price Policy in Asia, ed. T. Sicular, pp. 22–64. Ithaca, NY: Cornell University Press.
World Bank. 1981. “Accelerated Development in Sub-Saharan Africa: An Agenda for Action.” World Bank, Washington, DC.
Xu, Z., W. A. Burke, T. S. Jayne, and J. Govereh. 2009. “Do Input Subsidy Programs ‘Crowd In’ or ‘Crowd Out’ Com- mercial Market Development? Modeling Fertilizer Demand in a Two-Channel Marketing System.” Agricul- tural Economics 40 (1).