EVALUATION OF MALAWI’S SUPPORT FOR SERVICE …...EVALUATION OF MALAWI’S SUPPORT FOR SERVICE...
8
EVALUATION OF MALAWI’S SUPPORT FOR SERVICE DELIVERY INTEGRATION PBI INTERVENTION THE CHALLENGE Performance-based incentives (PBI) are commonly used as a financial measure to improve health service provision, either by targeting service outputs (e.g. number of patients seen) or service content or quality (e.g. number of patients treated according to protocol, availability of essential service inputs). Effects of PBI programs on service provision differ depending on initial service performance, health worker and facility capacities, PBI design and reward size, and other contextual factors. This brief provides a summary of the effects of a set of performance incentives used in Malawi on the quality of a range of essential health services (maternal and newborn care, child health, HIV/AIDS). The design of the Support for Service Delivery Integration- Performance Based Incentives (SSDI-PBI) program began in 2012, and implementation started in September 2014. The evaluation of the program drew on a mixed-methods approach using quantitative and qualitative methods, and primary as well as secondary data. This brief summarizes the results of quantitative analyses on data from 17 PBI facilities and 17 control facilities, including five hospitals and 12 health centers each. To assess eight dimensions of service provision (namely antenatal care, labor and delivery, child health, PMTCT, HIV, family planning, and postnatal care services, and general service management and quality assurance) we used routine data as well as primary data sources. Where monthly data were available, we used interrupted time series analysis; where one baseline and one endline measurement were available, we used difference-in-difference analysis to estimate the effect of the intervention. Time series analysis allowed us to compare how BRIEF 1: EFFECT OF INCENTIVES ON SERVICE QUANTITY AND QUALITY THE SSDI-PBI INITIATIVE & IMPACT EVALUATION The SSDI-PBI program aims to increase access, utilization, and quality of essential health services by linking rewards to service utilization and quality indicators across a range of conditions and services. Implemented by the Ministry of Health with funding from USAID and technical support from Jhpiego and Abt Associates, the program operates in 17 facilities across Chitipa, Nkhotakota, and Mangochi districts. SSDI-PBI entailed rewards paid to facilities and destined exclusively for facility improvements, and the procurement of goods and equipment via implementers rather than facilities directly. This series of briefs is meant to serve as a resource for decision makers as they craft performance-based financing programs and policies in Malawi and similar settings. The briefs stem from a 1-year evaluation led by Heidelberg University in Germany and the College of Medicine in Malawi. While the design SSDI-PBI began in 2012 and will be implemented through September 2016, data for the evaluation represents the period up to and including December 2015. individual facilities performed in the intervention period relative to their own baseline performance, and revealed when PBI facilities experienced a change in level (a leap in performance at program outset) and/or a change in trend (gradual improvement over time) compared to control facilities. Difference-in-difference April 2017 This brief is made possible by the support of the American People through the United States Agency for International Development (USAID). This research project is made possible through Translating Research into Action, TRAction, which is funded by United States Agency for International Development (USAID) under cooperative agreement number No. GHS-A-00-09-00015-00. The findings of this study are the sole responsibility of the University of Heidelberg and College of Medicine research team and do not necessarily reflect the views of USAID or the United States Government.
Transcript of EVALUATION OF MALAWI’S SUPPORT FOR SERVICE …...EVALUATION OF MALAWI’S SUPPORT FOR SERVICE...

EVALUATION OF MALAWI’S SUPPORT FOR SERVICE DELIVERY INTEGRATION PBI INTERVENTION
THE CHALLENGEPerformance-based incentives (PBI) are commonly used as a financial
measure to improve health service provision, either by targeting service
outputs (e.g. number of patients seen) or service content or quality (e.g.
number of patients treated according to protocol, availability of essential
service inputs). Effects of PBI programs on service provision differ
depending on initial service performance, health worker and facility
capacities, PBI design and reward size, and other contextual factors.
This brief provides a summary of the effects of a set of performance
incentives used in Malawi on the quality of a range of essential health
services (maternal and newborn care, child health, HIV/AIDS).
The design of the Support for Service Delivery Integration-
Performance Based Incentives (SSDI-PBI) program began in 2012,
and implementation started in September 2014. The evaluation of
the program drew on a mixed-methods approach using quantitative
and qualitative methods, and primary as well as secondary data.
This brief summarizes the results of quantitative analyses on
data from 17 PBI facilities and 17 control facilities, including five
hospitals and 12 health centers each. To assess eight dimensions
of service provision (namely antenatal care, labor and delivery, child
health, PMTCT, HIV, family planning, and postnatal care services,
and general service management and quality assurance) we used
routine data as well as primary data sources. Where monthly data
were available, we used interrupted time series analysis; where
one baseline and one endline measurement were available, we
used difference-in-difference analysis to estimate the effect of
the intervention. Time series analysis allowed us to compare how
BRIEF 1: EFFECT OF INCENTIVES ON SERVICE QUANTITY AND QUALITY
THE SSDI-PBI INITIATIVE & IMPACT EVALUATION
The SSDI-PBI program aims to increase access, utilization, and
quality of essential health services by linking rewards to service
utilization and quality indicators across a range of conditions
and services. Implemented by the Ministry of Health with
funding from USAID and technical support from Jhpiego and
Abt Associates, the program operates in 17 facilities across
Chitipa, Nkhotakota, and Mangochi districts. SSDI-PBI entailed
rewards paid to facilities and destined exclusively for facility
improvements, and the procurement of goods and equipment
via implementers rather than facilities directly.
This series of briefs is meant to serve as a resource for
decision makers as they craft performance-based financing
programs and policies in Malawi and similar settings. The
briefs stem from a 1-year evaluation led by Heidelberg
University in Germany and the College of Medicine in
Malawi. While the design SSDI-PBI began in 2012 and will be
implemented through September 2016, data for the evaluation
represents the period up to and including December 2015.
individual facilities performed in the intervention period relative
to their own baseline performance, and revealed when PBI
facilities experienced a change in level (a leap in performance at
program outset) and/or a change in trend (gradual improvement
over time) compared to control facilities. Difference-in-difference
April 2017
This brief is made possible by the support of the American People through the United States Agency for International Development (USAID). This research project is made possible through Translating Research into Action, TRAction, which is funded by United States Agency for International Development (USAID) under cooperative agreement number No. GHS-A-00-09-00015-00. The findings of this study are the sole responsibility of the University of Heidelberg and College of Medicine research team and do not necessarily reflect the views of USAID or the United States Government.
2
analysis allowed us to compare what proportion of facilities were
performing to a certain standard at baseline and post-intervention,
and to compare whether changes in PBI and control facilities were
measurably different. Ultimately, time series analysis was used to
understand patterns related to service utilization (Tables 1 and 2)
whereas difference-in-difference analysis was used to understand
patterns across quality domains (Table 3). This was due to the type
of data available for each type of indicator.
Given the heavy reliance on secondary data, the research team sought
to draw from multiple sources of data in order to confirm or refute
patterns across sources. This was possible, to a large extent, in relation
to the service utilization data in the sense that Health Management
Information Systems (HMIS) data could be crosschecked with data
stemming from the Presidents Emergency Plan for AIDS Relief
(PEPFAR) data. For the quality-related data, the research team intended
to draw from three main sources: Service Provision Assessment (SPA)
data collected in 2014, primary data that could complement questions
within the SPA and Jhpiego’s own Standards Based Management and
Recognition (SBMR) data. Ultimately, due to data quality concerns, the
SBMR data could not be used for analysis.
SUMMARY OF EFFECTSIn general, we observe more statistically significant improvements
in health centers than hospitals when comparing SSDI-PBI facilities
to controls. Furthermore, we see overall positive effects on MNH
services, generally positive effect on HIV services, and neutral/no/
negative effects on family planning and child immunization.
INCENTIVIZED INDICATORS TYPE OF EFFECT IN PBI HEALTH CENTERS
TYPE OF EFFECT IN PBI HOSPITALS
1. Number of pregnant women starting antenatal care during the 1st trimester Trend increase No effect detected
2. Number of women completing the 4 ANC visits Level & trend increase Level increase
3. Number of pregnant women receiving 2 IPT doses Level & trend increase Trend increase
4. Number of births attended by skilled birth attendants Level & trend increase No effect detected
5. Number of 1 year old children fully immunized No effect detected Level decrease
6. Number of HIV-positive pregnant women initiated on ART Level increase Trend decrease
7. Number of HIV/AIDS cases screened for TB Data not available*
8. Number of children receiving Vitamin A supplementation Level increase Trend increase
9. Number of clients counseled for FP No effect detected No effect detected
10. Number of couples tested for HIV during HTC services Trend increase Level & trend increase
11. Number of infants born by HIV positive mothers tested for HIV Data not available*
12. Number of women who receive PNC by skilled HCWs within 2 weeks No effect detected Trend increase
13. Number of pregnant women attending ANC receiving iron supplementation Trend increase** No effect detected
Table 1. Quantity Indicators Directly Incentivized by SSDI-PBI, results of a time-series analysis
* For two indicators (#7 and #11) secondary data were not available either because data were not collected (#7) or had too many variables missing (#11).
** A significant trend increase attributed to the intervention was detected in the first half of the implementation period, after which a significant trend decrease was observed in both RBF and control facilities, likely due to a nation-wide supply stock-out
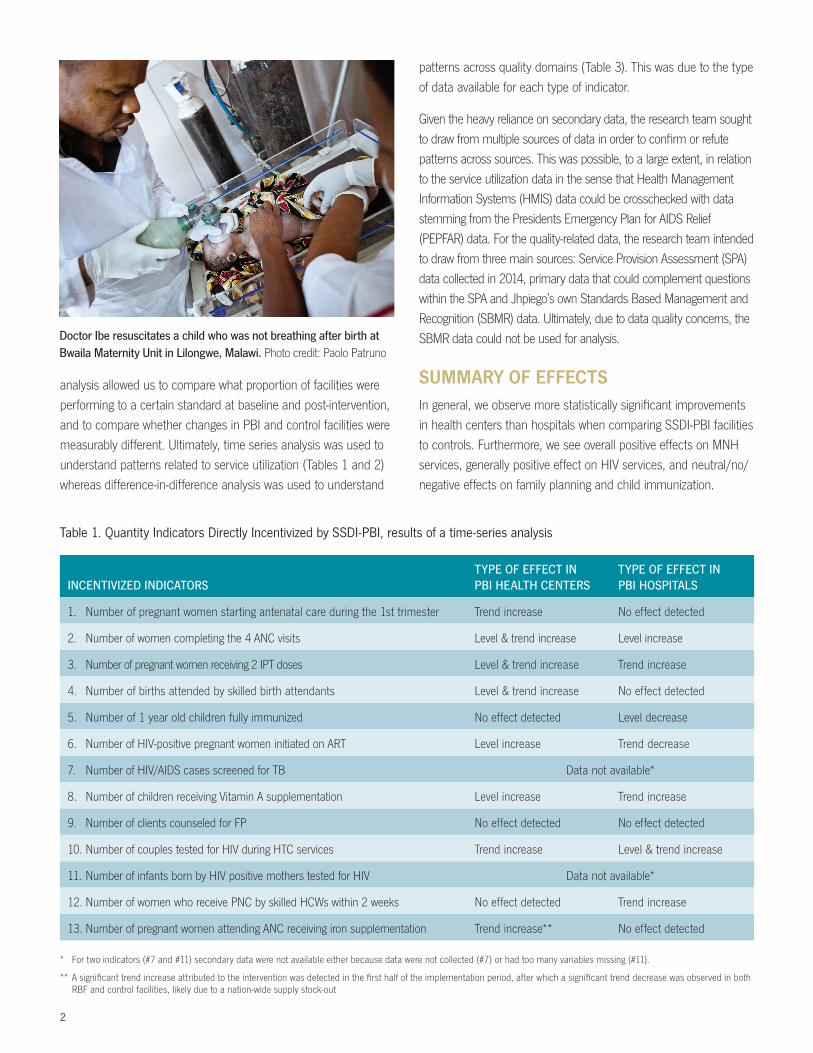
Doctor Ibe resuscitates a child who was not breathing after birth at Bwaila Maternity Unit in Lilongwe, Malawi. Photo credit: Paolo Patruno

3
Figure 1. Interpreting time series analysis of changes in trend and level; a visual depiction
and “trend”. A level increase refers to an indicator improving
measurably around the time of program outset (September
2014). A trend increase refers to an indicator increasing in
slope after program outset. In order to facilitate the reader’s
understanding of these concepts, following Table 1, we present
three representative figures that depict a) a change in trend, b) a
change in level, and c) a change in both trend and level. In these
figures, the solid black lines represent increases among SSDI-PBI
facilities over the performance in control facilities (dashed lines).
This analysis also included an assessment of service utilization
for non-incentivized indicators comparing SSDI-PBI facilities to
controls (see Table 2). Across the six indicators for which data
were available, we observe mixed results. In some cases, such
as BCG and polio vaccine coverage, there was no change in
health centers but a decrease in hospitals (comparing SSDI-PBI
facilities to controls). At other times, trends increased in hospitals
but no change was observed in health centers (HIV testing
among pregnant and non-pregnant females). In only one case,
HIV testing among males, was a similar trend increase observed
across both health centers and hospitals.
Finally we analyzed changes in indicators related to quality
that were not directly incentivized by the SSDI-Program, but
for which impartial secondary baseline data were available and
could be complemented with endline primary data collection.
In an overarching sense, we see that performance according
to these measurements was typically high regardless of facility
status (hospital versus health center, and intervention versus
control) that there was minimal space to detect statistically
significant differences.
CHANGE IN TREND
4
3
2
1
0
2013m7 2014m1 2014m7 2015m1 2015m7 2016m1
AUG
UST
201
4
CHANGE IN LEVEL
4
3
2
1
0
2013m7 2014m1 2014m7 2015m1 2015m7 2016m1
AUG
UST
201
4
CHANGE IN TREND & LEVEL
4
3
2
1
0
2013m7 2014m1 2014m7 2015m1 2015m7 2016m1
AUG
UST
201
4PBI (solid dots & line) vs non-PBI (hollow dots & dashed line) facilities
We begin with a presentation of changes observed across the 13
indicators that were incentivized by the SSDI-PBI program (see
Table 1). In our analysis, we took note of both changes in “level”
A mother carries her baby to Khuwi maternity clinic, Malawi. Photo credit: Donna Murray

4
INDICATOR INDICATOR PERFORMANCE PBI VS. CONTROL FACILITIES
15. Proportion of facilities that reported receiving external supervision within past 6 months No effect detected
16. Proportion of facilities that reported having management meetings at least every 6 months No effect detected
17. Proportion of facilities with client feedback system in place No effect detected
18. Proportion of facilities with SP available at facility No effect detected
19. Proportion of facilities with iron supplements available at ANC service site PBI facilities protected from general declines
20. Proportion of facilities with injectable FP methods available Control facilities improved
21. Proportion of facilities with oxytocin available in maternity unit No effect detected
22. Proportion of facilities with delivery packs available at maternity unit No effect detected
23. Proportion of facilities with partograph forms available at maternity unit No effect detected
24. Proportion of facilities with rapid HIV tests available No effect detected
Table 3. Quality Indicators Not Directly Incentivized SSDI-PBI*, results of a difference-in-difference analysis
* These indicators were chosen from among available data collected as part of Malawi’s Service Provision Assessment (SPA). While not directly incentivized by SSDI-PBI, these
indicators may be linked, or may constitute subcomponents of, more pointed indicators that were incentivized by SSDI-PBI or by an umbrella program that was ongoing in most
facilities called “Performance Quality Improvement” (PQI).
NON-INCENTIVIZED INDICATORS TYPE OF EFFECT IN PBI HEALTH CENTERS
TYPE OF EFFECT IN PBI HOSPITALS
1. BCG vaccine coverage No effect detected Level decrease
2. Measles vaccine coverage Most data missing
3. Pentavalent III vaccine coverage Level increase Level decrease
4. Polio-III vaccine coverage No effect detected Level decrease
5. Number of HIV-tested pregnant females No effect detected Trend increase
6. Number of HIV-tested males Trend increase Trend increase
7. Number of HIV-tested non-pregnant females No effect detected Trend increase
8. Under-1 year old fully immunized children Most data missing
9. Over-1 year old fully immunized children Most data missing
10. Number of postnatal mothers supplemented Most data missing
11. Proportion of all deliveries that are facility-based Most data missing
Table 2. Quantity Indicators Not Directly Incentivized by SSDI-PBI, results of a time series analysis
In order to facilitate the reader’s understanding of these
concepts, following Table 3, we present three representative
figures that depict instances when a) PBI facilities were protected
from general declines, b) improvement in control facilities relative
to PBI facilities were detected, and, c) when no statistically
detectable difference was observed. The final category (category
c) was the most common category in this analysis. In each
representative figure, the solid black line represents performance
across SSDI-PBI facilities while the dashed line represents
performance in control facilities.

5
SERVICE PROVISION
Antenatal Care (ANC) Services
In respect to ANC service performance, PBI incentivized facilities to
improve both service outputs and clinical content. In terms of ANC
service outputs, the following performance indicators were used:
a) the number of pregnant women starting ANC during their first
trimester of pregnancy (Indicator 1 in Table 1), and b) the number
of women completing at least 4 ANC visits during their pregnancy
(Indicator 2 in Table 1). In terms of ANC service quality the following
performance indicators were used: a) the number of pregnant
women attending ANC services receiving at least 2 doses of IPT
during the course of their pregnancy (Indicator 3 in Table 1), b)
the number of pregnant women attending ANC services receiving
iron supplementation (Indicator 13 in Table 1), c) proportion of
facilities with Sulfadoxine-Pyrimethamine (SP) available at the facility
(Indicator 18 in Table 3), and d) proportion of facilities with iron
supplements available at ANC service site (Indicator 19 in Table 3).
For health centers, we found significant positive effects of PBI
on both the number of first trimester ANC visits and the number
of total ANC visits during a pregnancy. For hospitals, significant
effects were only observed for the number of total ANC visits
during a pregnancy. While PBI had an initial positive effect
on the number of women who received iron supplementation
during their ANC visits across health centers, this effect became
significantly negative at later time points due to a national iron/
folate (FeFo) tablet shortage; Indicator 19 in Table 3 indicates
that PBI facilities were significantly better protected from the
effects of the shortage than control facilities. However, there was
no significant PBI effect observed across hospitals for a number
of pregnant women receiving iron supplementation. For both
health centers and hospitals PBI had significant positive effects
on the number of women who received at least two doses of
IPT during pregnancy. For both PBI and control facilities, SP was
available at all facilities at both baseline and endline surveys.
Labor and Delivery Services
In respect to labor and delivery service performance, PBI
incentivized facilities only in terms of labor and delivery service
quality by improving the number of births attended by a SBA
(Indicator 4 in Table 1). We additionally evaluated a) proportion
of facilities with oxytocin available in maternity unit (Indicator 21
in Table 3), b) proportion of facilities with delivery packs available
at maternity unit (Indicator 22 in Table 3), and c) proportion
of facilities with partograph forms available at a maternity unit
(Indicator 23 in Table 3).
Figure 2. Interpreting difference-in-difference analysis of quality indicator performance; a visual depiction
A. PBI FACILITIES PROTECTED FROM GENERAL DECLINES
10
8
6
4
2
0
Baseline Jun 2013-Feb 2014 Endline Mar 2016
B. IMPROVEMENT IN CONTROLS RELATIVE TO PBI FACILITIES
10
8
6
4
2
0
Baseline Jun 2013-Feb 2014 Endline Mar 2016
C. NO STATISTICALLY DETECTABLE DIFFERENCE
10
8
6
4
2
0
Baseline Jun 2013-Feb 2014 Endline Mar 2016
PBI (solid dots & line) vs non-PBI (hollow dots & dashed line) facilities

6
There was no statistically significant effect of PBI on the
number of delivery cases attended by SBAs at health centers.
At hospitals, we found a significant negative effect of PBI on
this indicator. There was no significant difference in proportion
of facilities with oxytocin, delivery packs, or partograph forms
available in the maternity unit.
Child Health Services
In respect to child health service performance, PBI incentivized
child health service outputs only, using the following performance
indicators: a) the number of one-year old children fully
immunized (Indicator 5 in Table 1), and b) the number of under-
five-year-old children having received vitamin A supplementation
(Indicator 8 in Table 1).
While there was no significant effect on the number of one-
year old children fully immunized at health centers, we found
significant negative effects of PBI on the performance of
hospitals in respect to this indicator. We observed significant
positive effects of PBI on the number of under-five-year-old
children having received vitamin A supplementation at both
health centers and hospitals.
Prevention of Mother-to-Child-Transmission of HIV (PMTCT) Services
In respect to service performance of prevention of mother-to-
child-transmission of HIV (PMTCT), PBI incentivized facilities only
in terms of PMTCT service outputs by improving a) the number
of HIV-positive pregnant women initiated on anti-retroviral therapy
(ART) (Indicator 6 in Table 1) and b) the number of infants born
to HIV positive mothers tested for HIV (Indicator 11 in Table 1).
We observed a significant positive effect on ART coverage of
pregnant HIV positive mothers across health centers, but a
significant negative effect across hospitals during the late intervention
period. We were unable to assess PBI’s effect on HIV testing of
infants born to HIV positive mothers due to low quality of available
data on this indicator (many missing values in the database).
HIV Services
In respect to HIV service performance, the PBI incentivized
facilities on improving HIV service outputs by improving a) the
number of couples tested for HIV during testing and counseling
sessions (HTC) (Indicator 10 in Table 1) and b) the number of HIV/
AIDS cases screened for tuberculosis (TB) (Indicator 7 in Table
1). We additionally analyzed the number of HIV-tested pregnant
females, males, and non-pregnant females, (non-incentivized
indicators 5, 6, and 7 in Table 2, respectively) and the proportion
of facilities with rapid HIV tests available (Indicator 24 in Table 3).
We observed significant positive effects on the number of
couples tested during HTC. We were unable to assess the PBI
effect on TB screening of patients with HIV/AIDS due to an
absence of data for this indicator in available databases. We also
observed a significant trend increase in hospitals in the number
of HIV-tested pregnant females, males, and non-pregnant
females, and a significant trend increase in health centers in
the number of HIV-tested males. While there was an increase in
the proportion of PBI facilities with rapid HIV tests available, the
effect was not statistically significant.
Family Planning Services
In respect to FP service performance, PBI incentivized facilities
on improving FP service output related to the number of clients
counseled for modern family planning methods (Indicator 9
in Table 1). We also assessed the proportion of facilities with
injectable FP methods available (Indicator 20 in Table 3).
We observed mainly negative effects of PBI on the number of
clients counseled across both facility types. Additionally, control
facilities showed significant improvement over PBI facilities’
decline in terms of proportion of facilities with injectable FP
methods available.
Postnatal Care (PNC) Services
In respect to PNC service performance, PBI incentivized facilities
on improving PNC service outputs by improving the number of
women who receive PNC by skilled health care workers within
two weeks of delivery (Indicator 12 in Table 1).
A health worker prepares an IV bag in the pediatrics ward of a large referral hospital in Lilongwe, Malawi. Photo credit: Fletcher Gong’a

7
We observed a positive PBI effect across health centers and
a negative effect across hospitals in the number of women
receiving PNC by skilled providers.
Service Management and Quality Assurance
Although not specifically incentivized, we assessed a set of
indicators related to aspects of service management and general
quality assurance, including: a) the proportion of facilities that
reported receiving external supervision within past 6 months
(Indicator 15 in Table 3), b) the proportion of facilities that
reported having management meetings at least every 6 months
(Indicator 16 in Table 3), and c) the proportion of facilities with
client feedback system in place (Indicator 17 in Table 3).
For both external supervision and client feedback we observed
non-significant negative intervention effects. For periodic
management meetings we did not observe any effects due to PBI.
LOOKING AHEAD Effects by health facility type: Generally, service provision
quality at health centers seemed to have improved more than
at hospitals. This might indicate that the intervention design
targeted service performance issues that were more pertinent
to health centers. The PBI approach based on setting clear
performance targets and the influx of additional financial income
likely allowed health centers to better identify and prioritize those
aspects of work performances and overall facility management
that ensured higher service quality yields. It might therefore be
useful to follow more differentiated understanding of service
provision in respect to hospitals in order to align performance
incentives and targets more closely to the realities and challenges
encountered at different levels of healthcare provision.
Effects by health service type: We noted overall positive effects
on services related to maternal and newborn health (ANC, skilled
birth attendance, PMTCT, and to some degree PNC). The PBI
also positively affected service quality related to HIV counseling
and testing, however had no effect on counseling services related
to family planning, and affected child immunization services even
negatively. Although the underlying causes for these observed
patterns could not be identified by our data, findings underscore
the point that performance incentives might not always result
in desired outcomes. Further understanding of how and why
different health services respond differently to a PBI program
might allow for some adjustments that ultimately improve quality
more consistently across services and facility levels.
PBI as a vehicle for service reform: Depending on the design,
PBI programs can restore or even reform certain functions
essential to service organization, facility management, and
quality assurance by aligning individuals’ sense of responsiveness
or accountability with general service efficiency. As PBI effects
on these service elements are difficult to measure, especially
using routine data, we nevertheless identified indicators on
service and system organization (i.e. external supervision, facility
management meetings, patient feedback procedures) as best
possible proxies. Deeper understanding of the extent to which the
current SSDI PBI design contributes to an overall system-reform
process within and beyond the enrolled facilities might provide
useful information for future program expansion or scale-up.
ACKNOWLEDGEMENTSThe SSDI-PBI evaluation team consists of researchers from the
College of Medicine at the University of Malawi (Christopher
Makwero, Adamson Muula (Co-PI)), Heidelberg University in
Germany (Stephan Brenner, Rachel P. Chase, Manuela De Allegri
(PI), Julia Lohmann and Shannon A. McMahon), and the Centre
for Research on Health and Social Care Management at Bocconi
University in Italy (Aleksandra Torbica).
TRACTION PROJECT OVERVIEWThe Translating Research Into Action (TRAction) Project, funded by the U.S. Agency for International Development, focuses on implementation and delivery science—which seeks to develop, test, and compare approaches to more effectively deliver health interventions, increase utilization, achieve coverage, and scale-up evidence-based interventions. TRAction supports implementation research to provide critically-needed evidence to program implementers and policy-makers addressing maternal and child health issues.
For more information on the TRAction Project: www.tractionproject.org � [email protected]

University Research Co., LLC � 5404 Wisconsin Avenue, Suite 800 � Chevy Chase, MD 20815 � www.urc-chs.com