
CFD Analysis of Mixed Flow Pump - · PDF fileCFD Analysis of Mixed Flow Pump Kiran Patel And...
12
CFD Analysis of Mixed Flow Pump Kiran Patel And N. Ramakrishnan Jyoti ltd. Abstract The study pertains to the CFD application for mixed flow hydraulic pumps. Authors have done CFD analysis of mixed flow pump (Nsq. = 46.00 Metric) at duty point and also at part load. The results of the study brought out following findings. 1. Head predicted by CFD analysis is 5 to 10 % higher at rated point as well as at part load, than the test result. The nature of Head versus Capacity curve is similar to that of standard mixed- flow pump curve. 2. Power predicted by CFD analysis is 5 to 10% higher at rated point. Disc- friction power loss calculated using standard method and added to CFX generated power for estimating total power requirement. The nature of Power versus Capacity curve is similar to that of standard mixed flow pump curve. 3. Efficiency predicted by CFD analysis is higher than the test results. Leakage loss was predicted and volumetric efficiency was determined. Pump efficiency, considering disc-friction loss and leakage-loss was predicted and that is within + 5% range, at duty point. At off-design point, variation in efficiency was found. CFD analysis has clearly brought out the secondary flow/recirculation in stator at duty point which caused reduction in efficiency. This is improved by matching stator blade angle with respect to flow angle and changing hub-curve profile. The paper also includes the results of steady state analysis of original geometry and comparison of test result and CFD analysis result. The comparison of results of original and modified geometry was presented. Introduction Computational Fluid Dynamics (CFD) is the present day state-of-art technique in fluid engineering flow- analysis. It has wide range of applications-like pumps, fans, compressors, turbines, automobiles, process industries, aerospace, in fact in any areas of study, where there is fluid in motion, air, water, steam etc. CFD analysis is very useful for predicting pump performance at various mass-flow rate. For designers, prediction of operating characteristics curve is most important. All theoretical methods for prediction of efficiency merely give a value; but one is unable to determine the root cause for the poor performance. Due to the development of CFD code, one can get the efficiency value as well as observe actual behavior. One can find the root cause for poor performance by using CFD Analysis of equipment. Vertical mixed flow pumps are widely used for water transportation or as cooling water pumps in power stations. Their operating range spans from full-load down to close to the shut-off head. In order to develop
Transcript of CFD Analysis of Mixed Flow Pump - · PDF fileCFD Analysis of Mixed Flow Pump Kiran Patel And...

CFD Analysis of Mixed Flow Pump Kiran Patel
And N. Ramakrishnan
Jyoti ltd.
Abstract
The study pertains to the CFD application for mixed flow hydraulic pumps. Authors have done CFD analysis of mixed flow pump (Nsq. = 46.00 Metric) at duty point and also at part load. The results of the study brought out following findings.
1. Head predicted by CFD analysis is 5 to 10 % higher at rated point as well as at part load, than the test result. The nature of Head versus Capacity curve is similar to that of standard mixed-flow pump curve.
2. Power predicted by CFD analysis is 5 to 10% higher at rated point. Disc- friction power loss calculated using standard method and added to CFX generated power for estimating total power requirement. The nature of Power versus Capacity curve is similar to that of standard mixed flow pump curve.
3. Efficiency predicted by CFD analysis is higher than the test results.
Leakage loss was predicted and volumetric efficiency was determined. Pump efficiency, considering disc-friction loss and leakage-loss was predicted and that is within + 5% range, at duty point. At off-design point, variation in efficiency was found.
CFD analysis has clearly brought out the secondary flow/recirculation in stator at duty point which caused reduction in efficiency. This is improved by matching stator blade angle with respect to flow angle and changing hub-curve profile.
The paper also includes the results of steady state analysis of original geometry and comparison of test result and CFD analysis result. The comparison of results of original and modified geometry was presented.
Introduction
Computational Fluid Dynamics (CFD) is the present day state-of-art technique in fluid engineering flow-analysis. It has wide range of applications-like pumps, fans, compressors, turbines, automobiles, process industries, aerospace, in fact in any areas of study, where there is fluid in motion, air, water, steam etc.
CFD analysis is very useful for predicting pump performance at various mass-flow rate. For designers, prediction of operating characteristics curve is most important. All theoretical methods for prediction of efficiency merely give a value; but one is unable to determine the root cause for the poor performance. Due to the development of CFD code, one can get the efficiency value as well as observe actual behavior. One can find the root cause for poor performance by using CFD Analysis of equipment.
Vertical mixed flow pumps are widely used for water transportation or as cooling water pumps in power stations. Their operating range spans from full-load down to close to the shut-off head. In order to develop
a reliable machine for this highly demanding operation, the behavior of the flow in the entire pump has to be predicted by a reliable computational method.
For pumps, important questions are-to what extent can the current 3D Navier-Stokes design tools be used to identify the onset of instabilities in the flow, and how accurately can the pumps characteristic be predicted.
Steady state simulation using ANSYS CFX-5.7.1 is used for the prediction of the flow in the single stage and entire machines in the design process. However, due to unsteady effects, it is difficult to predict the pump characteristic correctly. Unsteady effects in turbo machinery, include the interaction of the rotor and stator, the surge and stall limits in compressors, and the instabilities in pumps. The comparison of the experimental data and the results of the steady and unsteady flow simulations show the capability of modern CFD codes.
Steady state numerical flow simulations
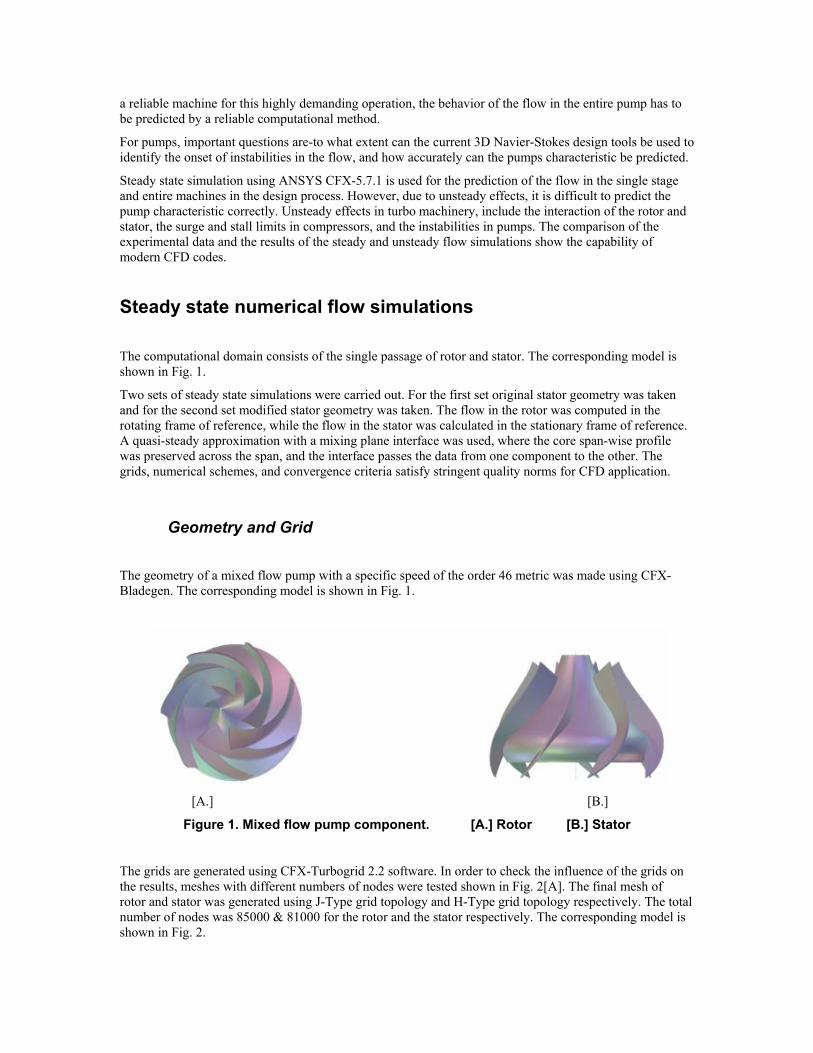
The computational domain consists of the single passage of rotor and stator. The corresponding model is shown in Fig. 1.
Two sets of steady state simulations were carried out. For the first set original stator geometry was taken and for the second set modified stator geometry was taken. The flow in the rotor was computed in the rotating frame of reference, while the flow in the stator was calculated in the stationary frame of reference. A quasi-steady approximation with a mixing plane interface was used, where the core span-wise profile was preserved across the span, and the interface passes the data from one component to the other. The grids, numerical schemes, and convergence criteria satisfy stringent quality norms for CFD application.
Geometry and Grid
The geometry of a mixed flow pump with a specific speed of the order 46 metric was made using CFX-Bladegen. The corresponding model is shown in Fig. 1.
[A.] [B.]
Figure 1. Mixed flow pump component. [A.] Rotor [B.] Stator
The grids are generated using CFX-Turbogrid 2.2 software. In order to check the influence of the grids on the results, meshes with different numbers of nodes were tested shown in Fig. 2[A]. The final mesh of rotor and stator was generated using J-Type grid topology and H-Type grid topology respectively. The total number of nodes was 85000 & 81000 for the rotor and the stator respectively. The corresponding model is shown in Fig. 2.

HEAD Vs GRID SIZE
50
55
6065
70
75
80
0 100000 200000 300000
GRID (NO OF NODES)
HEAD
- M
ETER
[A]
[B.] [C.]
Figure 2: Meshed pump component. [A]. Grid dependent test
[B.] Rotor [C.] Stator
Boundary Condition and Operating Point
The simulations were carried out over a wide range of operating points, from the best efficiency point (100 %) down to 70% of the nominal mass-flow rate and up to 120% on higher side. Due to severe convergence problems, it was not possible to compute part-load operating points lower than 70%. It was assumed, that the flow phenomena are the same in all the blade passages of the impeller and diffuser. Therefore, it was only necessary to discretize one passage of the rotor and stator and to simulate the adjacent passage with the help of periodic boundary conditions. Total pressure in stationary frame was specified at the inlet while mass flow per passage was defined at the outlet boundary.
High resolution scheme was selected as advection scheme.

Analysis Results & Discussion
In turbomachinery application results was plotted and observed in blade-to-blade view and meridional view. Velocity vectors are plotted in blade-to-blade view at duty point in Fig.3 (A). Here vectors are streamlined in rotor; but in stator due to secondary flow vectors are recirculating. Total pressure in stationary frame is plotted in blade-to-blade view at duty point in Fig.3 (B). Total pressure is gradually increasing in rotor and loss took place in stator.
[A.] [B.]
Figure 3:. [A.] Velocity vector plot [B.] Total pressure plot
Velocity vectors are plotted in meridional view at duty point in Fig. 4(A). Here vectors are streamlined in rotor but as soon as enter into the stator vectors are recirculating. Total pressure in stationary frame is plotted in meridional view at duty point in Fig. 4(B). Total pressure is gradually increasing in rotor and loss took place in stator.

[A.] [B.]
Figure 4. [A] Velocity vector plot [B.] Total pressure plot
Blade loading of rotor at different span location i.e. 5, 50, 95 percent were plotted in Fig. 5 (A, B and C).Static pressure is gradually increasing at every span location and there is no abrupt changes observed. Pressures on both side of blade are crossing each other at 98 to 99 % stream-wise location i.e. trailing edge.
[A.] 5% [B.] 50 % [C.] 95 %
Figure 5. Rotor blade loading
Blade loading of stator at different span location i.e. 5, 50, 95 percent was plotted in Fig. 6 (A, B and C). Pressure on both side of blade are crossing each other at 80 % at 5 and 95% span-wise location and at 50% span-wise location pressure on both side of blade are crossing each other at 88% location. This crossing of pressure is detrimental to the blades.

[A.] 5% [B.] 50 % [C.] 95 %
Figure 6. Stator blade loading
Fig. 7 (A) shows the total pressure variation from rotor inlet to stator exit. Total pressure is gradually increasing in rotor and loss of pressure took place in stator.
Fig. 7 (B) shows the absolute velocity variation from rotor inlet to stator exit. Absolute velocity is gradually increasing in rotor but as soon as it enters in stator heavy loss was observed.
[A.] [B.]
Figure 7. [A.] Total pressure versus Stream-wise location
[B.] Absolute velocity versus Stream-wise location
Overall efficiency of the Pump is the product of hydraulic, mechanical and volumetric efficiency. In CFD analysis one is getting only hydraulic efficiency of the component. The other two efficiencies i.e. mechanical & volumetric are unpredictable. So if one wants to do comparison of tested result and CFD analysis result, one has to determine the mechanical loss i.e. disc friction loss and volumetric loss. Then the product of all these three efficiencies is the overall efficiency of the pump. The mechanical loss i.e. disc friction loss and volumetric loss is determined using NEL methods [1]. The Overall efficiency, which is the product of volumetric, hydraulic and mechanical efficiency, is determined at all the analysis points.
Fig.8 (A, B and C) shows the comparison of tested and the result of CFD study. Fig.8 (A) shows the Head versus Capacity curve of pump and Head predicted by CFD is 5 -10 % higher.
Fig.8 (B) shows the Efficiency versus Capacity curve of pump and at duty point +5% variation is observed. Fig.8(C) shows the Power versus Capacity curve of pump and Power predicted by CFD is 5-10% higher as Head predicted by CFD is 5-10% higher.

HEAD VS CAPACITY
0
10
20
30
40
50
60
70
80
90
0 10000 20000 30000 40000 50000CAP ACITY - L P M
HEA
D -
MET
ER
ACTUAL
CFD
DUTY PO INT
Figure 8. [A.] Head versus Capacity Curve
EFFICIENCY VS CAPACITY
0
10
20
30
40
50
60
70
80
90
100
0 10000 20000 30000 40000 50000CAP ACITY - L P M
EFFI
CIE
NC
Y - %
ACTUALCFDDUTY POINT
Figure 8. [B.] Efficiency versus Capacity Curve

POWER VS CAPACITY
0
50
100
150
200
250
300
350
400
450
0 10000 20000 30000 40000 50000
CAP ACITY - LP M
POW
ER -
KW
ACTUALCFDDUTY POINT
Figure 8. [C.] Power versus Capacity Curve
The secondary flow in stator is in-evitable but the reduction in its intensity will increase the performance of the equipment. Pressure distribution along the stator blade surface is nonuniform and two side pressures are crossing which is detrimental to the blade. In order to improve these two defects, one can do two corrections in stator geometry.
(A.) Stator hub curve profile was made more uniform Fig. 9(A and B).
[A.] [B.]
Figure 9. [A.] Original stator [B.] Modified stator
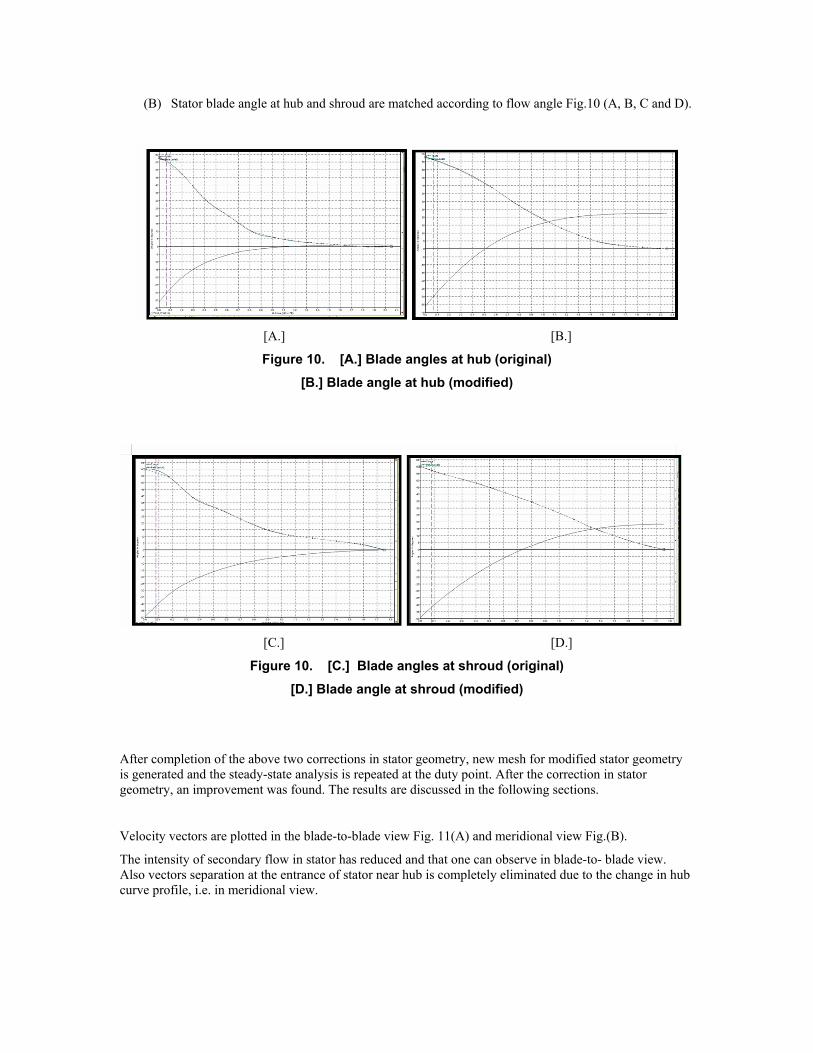
(B) Stator blade angle at hub and shroud are matched according to flow angle Fig.10 (A, B, C and D).
[A.] [B.]
Figure 10. [A.] Blade angles at hub (original)
[B.] Blade angle at hub (modified)
[C.] [D.]
Figure 10. [C.] Blade angles at shroud (original)
[D.] Blade angle at shroud (modified)
After completion of the above two corrections in stator geometry, new mesh for modified stator geometry is generated and the steady-state analysis is repeated at the duty point. After the correction in stator geometry, an improvement was found. The results are discussed in the following sections.
Velocity vectors are plotted in the blade-to-blade view Fig. 11(A) and meridional view Fig.(B).
The intensity of secondary flow in stator has reduced and that one can observe in blade-to- blade view. Also vectors separation at the entrance of stator near hub is completely eliminated due to the change in hub curve profile, i.e. in meridional view.

[A.] [B.]
Figure 11. [A.] Velocity vector plot in Blade-to-blade view
[B.] Velocity vector plot in Meridional view
Blade loading of original and modified stator at the different span location i.e. 5, 95 percent were plotted in Fig. 12 (A, B, C and D). Pressure on both side of blades are crossing each other at 80 % at 5 and 95% span-wise location in original stator but after modification crossing point is shifted to 92-95% stream-wise location at both the 5,95% span wise location. This is an improvement for the stator geometry.
[A.] [B.]
Figure 12. [A.] Original stator blade loading at 5% span-wise location
[B.] Modified stator blade loading at 5% span-wise location

[C.] [D.]
Figure 12. [C.] Original stator blade loading at 95% span-wise location
[D.] Modified stator blade loading at 95% span-wise location
Fig. 13 (A) shows the total pressure variation from rotor inlet to original stator exit. Total pressure is gradually increasing in rotor and higher loss of pressure takes place in stator. Fig. 13 (B) shows the total pressure variation from rotor inlet to modified stator exit. Total pressure is gradually increasing in rotor while the loss of pressure in the stator has reduced.
[A.] [B.]
Figure 13. [A.] Total Pressure versus stream-wise location (Original stator)
[B.] Total Pressure versus stream-wise location (Modified stator)
Conclusion
A systematic study using CFD Analysis software lead to the following conclusions.

• Head predicted by CFD analysis is 5 to 10 % higher than the test result at rated point.
• Power predicted by CFD analysis is 5 to 10% higher at rated point. To compare with the test result, disc-friction power loss calculated using NEL method [1] is added to CFX generated power for estimating total power requirement.
• Efficiency predicted by CFD analysis is higher than the test result. Leakage-loss is predicted using NEL method [1] and the volumetric efficiency is determined. Pump efficiency considering disc-friction loss and leakage-loss is predicted and it was found within +5%range, at duty point.
• The nature of Pump operating characteristic curve of CFD analysis is the same as the standard curve.
• CFD analysis has indicated recirculation zone in the stator at duty point, which has caused reduction in efficiency.
• Efficiency is improved by 1% after matching stator angle and changing hub curve profile.
• Stator blade loading at hub and shroud has improved.
References
1. T.E.Stirling : “Analysis of the design of two pumps using NEL methods”
Centrifugal Pumps-Hydraulic Design-I Mech E Conference Publications 1982-11, C/183/82.