CEO Compensation in High-Tech Firms and … · CEO compensation in high -tech firms and changes in...
24
n. 518 December 2013 ISSN: 0870-8541 CEO Compensation in High-Tech Firms and Changes in the SFAS No 123 (R) Paula Faria 1 Francisco Vitorino Martins 1 Elísio Brandão 1 1 FEP-UP, School of Economics and Management, University of Porto
Transcript of CEO Compensation in High-Tech Firms and … · CEO compensation in high -tech firms and changes in...

n. 518 December 2013
ISSN: 0870-8541
CEO Compensation in High-Tech Firmsand Changes in the SFAS No 123 (R)
Paula Faria1
Francisco Vitorino Martins1
Elísio Brandão1
1 FEP-UP, School of Economics and Management, University of Porto
Paula Faria [email protected]
School of Economics and Management, University of Porto
Francisco Vitorino Martins [email protected]
School of Economics and Management, University of Porto
Elísio Brandão [email protected]
School of Economics and Management, University of Porto
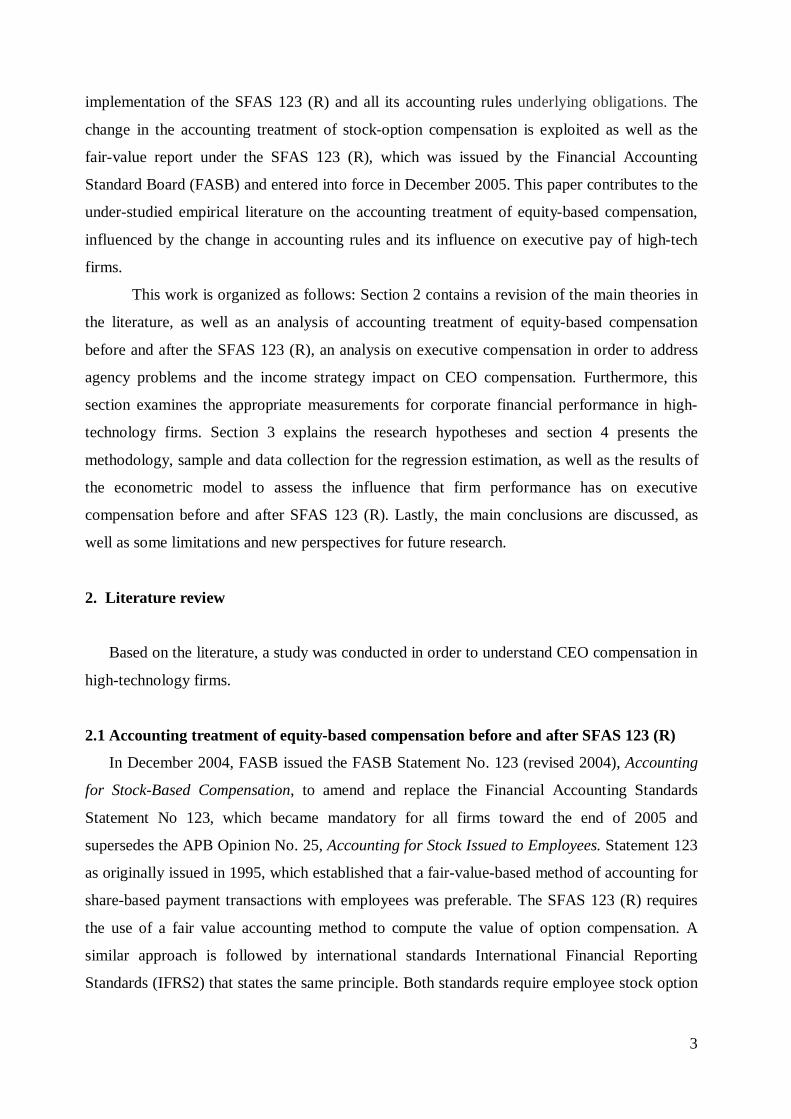
CEO compensation in high-tech firms and changes in the SFAS No 123 (R) Abstract This study examines the effects of the introduction of the FASB statement 123 (R) on corporate performance and Chief Executive Officer (CEO) compensation in high-technology firms. The total CEO compensation and short- and long-term compensations were tested regarding corporate performance. Panel data SUR models were estimated that describe total compensation and cash compensation as a proportion of total pay for the period between 2000 and 2010. The findings indicate that there is a positive relation between CEO compensation and firm performance in high-tech firms after the FASB statement 123 (R) is implemented, but with less intensity than before. This econometric study provides a better understanding of the relationship between CEO compensation and performance in high-technologies firms before and after the FASB statement 123 (R). Key words: Executive compensation, Corporate finance, FASB statement 123 (R)
JEL classification: M52, G30, M48

2
1. Introduction
Chief Executive Officer (CEO) compensation became common in the late 1970s and early
1980s and is often discussed in the literature ever since. Numerous stories have appeared
recently in the financial press pointing out how many executives define contract remunerations.
These news and striking reports have raised concerns on compensation. Nevertheless, no
consensus view has emerged, and there is still much to learn about the determinants of CEO
compensation. Appropriate incentives can be the tools in many cases, however, by basing
compensation on changes in shareholder wealth. According to Graham (2012), managers often
have better information than shareholders and boards in terms of identifying investment
opportunities and assessing the profitability of potential projects. Furthermore, the fact that
managers are expected to make higher investment decisions explains why shareholders
relinquish decision rights over their assets by purchasing common stock (Graham et al. 2012) .
This study explores how the Financial Accounting Standards (FAS) Statement 123 (R)
affects the performance determinants of CEO pays for long-term and short-term periods and
points out the influence of high-tech firms. Furthermore, this paper examines how high-tech
firms behave facing the cash based compensations and total CEO pays related to various
performance measurements. The performance measurements pointed in this work are the usual
accounting ratios of corporate finance.
In 1990, Jensen and Murphy wrote that it is possible that CEO bonuses are strongly tied
to an unexamined and/or unobservable performance measurement. When referring to the
swings in CEO pay from year to year, the authors explain that the variations are consistent with
the existence of an overlooked and yet important performance measurement, and that increase
suggests that CEO pay is essentially unrelated to all relevant performance measurements
(Jensen and Murphy 1990, 1990b; Murphy 1999). In many Standard & Poor´s (S&P) firms,
employee stock option plans are an important component of employee remuneration. In 1999,
94% of companies in the S&P 500 offered stock options to their top employees (Murphy 1999;
Hall and Murphy 2002). In order to better understand this argument, this study investigates the
relation between the CEO pay and the performance against high-technology firms with the
balance cash compensation and total compensation. The combination of salary, incentives and
bonuses is often referred to as cash compensation for executives. The CEO behavior is different
when we think in short-term and long-term periods. The main goal of this paper is to provide a
broader perspective on the relationship between CEO pay and firm performance and how high-
technology can improve that performance while analyzing the behavior with the
3
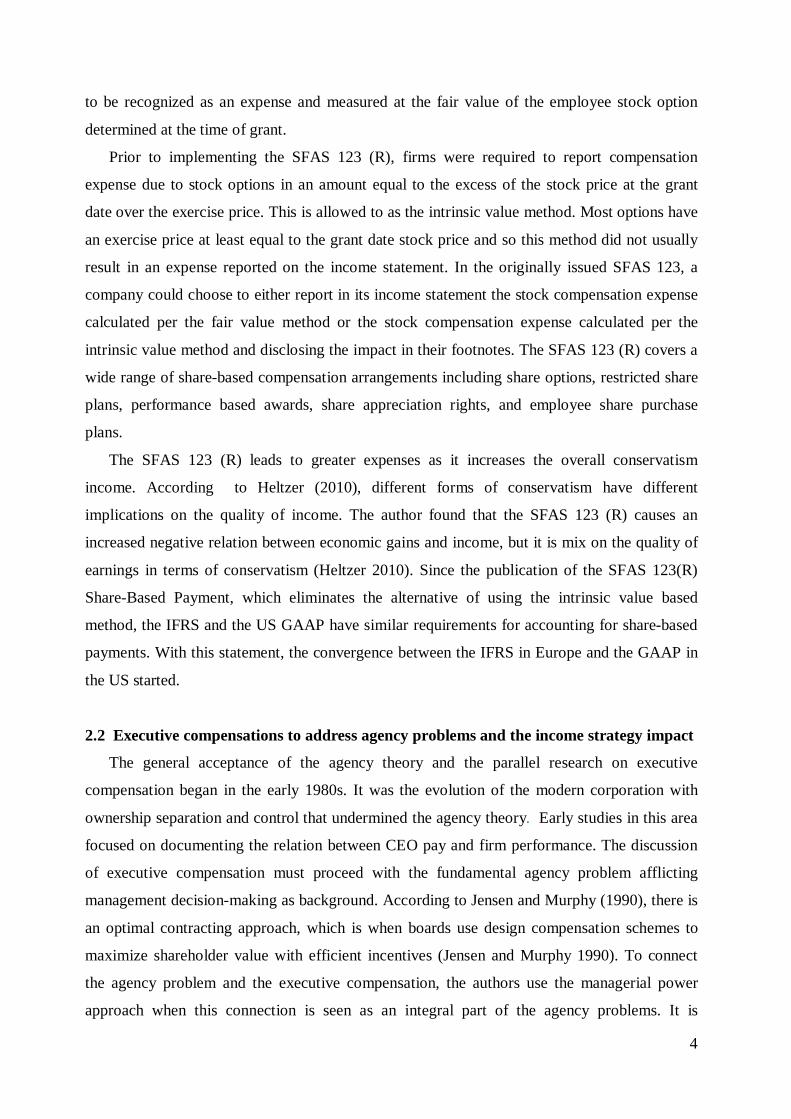
implementation of the SFAS 123 (R) and all its accounting rules underlying obligations. The
change in the accounting treatment of stock-option compensation is exploited as well as the
fair-value report under the SFAS 123 (R), which was issued by the Financial Accounting
Standard Board (FASB) and entered into force in December 2005. This paper contributes to the
under-studied empirical literature on the accounting treatment of equity-based compensation,
influenced by the change in accounting rules and its influence on executive pay of high-tech
firms.
This work is organized as follows: Section 2 contains a revision of the main theories in
the literature, as well as an analysis of accounting treatment of equity-based compensation
before and after the SFAS 123 (R), an analysis on executive compensation in order to address
agency problems and the income strategy impact on CEO compensation. Furthermore, this
section examines the appropriate measurements for corporate financial performance in high-
technology firms. Section 3 explains the research hypotheses and section 4 presents the
methodology, sample and data collection for the regression estimation, as well as the results of
the econometric model to assess the influence that firm performance has on executive
compensation before and after SFAS 123 (R). Lastly, the main conclusions are discussed, as
well as some limitations and new perspectives for future research.
2. Literature review
Based on the literature, a study was conducted in order to understand CEO compensation in
high-technology firms.
2.1 Accounting treatment of equity-based compensation before and after SFAS 123 (R)
In December 2004, FASB issued the FASB Statement No. 123 (revised 2004), Accounting
for Stock-Based Compensation, to amend and replace the Financial Accounting Standards
Statement No 123, which became mandatory for all firms toward the end of 2005 and
supersedes the APB Opinion No. 25, Accounting for Stock Issued to Employees. Statement 123
as originally issued in 1995, which established that a fair-value-based method of accounting for
share-based payment transactions with employees was preferable. The SFAS 123 (R) requires
the use of a fair value accounting method to compute the value of option compensation. A
similar approach is followed by international standards International Financial Reporting
Standards (IFRS2) that states the same principle. Both standards require employee stock option
4
to be recognized as an expense and measured at the fair value of the employee stock option
determined at the time of grant.
Prior to implementing the SFAS 123 (R), firms were required to report compensation
expense due to stock options in an amount equal to the excess of the stock price at the grant
date over the exercise price. This is allowed to as the intrinsic value method. Most options have
an exercise price at least equal to the grant date stock price and so this method did not usually
result in an expense reported on the income statement. In the originally issued SFAS 123, a
company could choose to either report in its income statement the stock compensation expense
calculated per the fair value method or the stock compensation expense calculated per the
intrinsic value method and disclosing the impact in their footnotes. The SFAS 123 (R) covers a
wide range of share-based compensation arrangements including share options, restricted share
plans, performance based awards, share appreciation rights, and employee share purchase
plans.
The SFAS 123 (R) leads to greater expenses as it increases the overall conservatism
income. According to Heltzer (2010), different forms of conservatism have different
implications on the quality of income. The author found that the SFAS 123 (R) causes an
increased negative relation between economic gains and income, but it is mix on the quality of
earnings in terms of conservatism (Heltzer 2010). Since the publication of the SFAS 123(R)
Share-Based Payment, which eliminates the alternative of using the intrinsic value based
method, the IFRS and the US GAAP have similar requirements for accounting for share-based
payments. With this statement, the convergence between the IFRS in Europe and the GAAP in
the US started.
2.2 Executive compensations to address agency problems and the income strategy impact
The general acceptance of the agency theory and the parallel research on executive
compensation began in the early 1980s. It was the evolution of the modern corporation with
ownership separation and control that undermined the agency theory. Early studies in this area
focused on documenting the relation between CEO pay and firm performance. The discussion
of executive compensation must proceed with the fundamental agency problem afflicting
management decision-making as background. According to Jensen and Murphy (1990), there is
an optimal contracting approach, which is when boards use design compensation schemes to
maximize shareholder value with efficient incentives (Jensen and Murphy 1990). To connect
the agency problem and the executive compensation, the authors use the managerial power
approach when this connection is seen as an integral part of the agency problems. It is
5
important to remember that the principal-agent problems treat the difficulties that arise under
conditions where information is incomplete and asymmetric whenever a principal hires an
agent (Murphy, 1999, Eisenhardt (1989); Bebchuk and Fried (2003)). Furthermore, the agency
theory aims at solving two problems that can occur in agency relationships. The first is the
desires or goals of the principal and agent conflict and it is difficult or expensive for the
principal to verify what the agent is actually doing. The problem is that the principal is unable
to check if the agent has behaved correctly. Secondly, it is the problem of risk sharing facing
the different attitudes toward risk, because the principal and the agent have different actions
according to different risk preferences (Eisenhardt 1989).
Hall and Liebman (1998) argue that the solution to the agency problem is aligning the
incentives of executives with the interests of shareholders by granting (or selling) stock and
stock options to the CEOs. The CEOs have the correct incentives on every margin, including
effort, perquisites and project choice, and support that the optimal contract is a one-to-one
correspondence between firm value and CEO pay (Hall and Liebman 1998). In their work, Hall
and Liebman (1998) conclude that the relationship between pay and performance is much
larger than has previously been recognized, and that this includes both gains and losses in CEO
wealth. The salary and bonus vary so little because corporate board members are often reluctant
to reduce CEO pay, even in response to poor performance and that may attract unwanted media
attention. Using salary and bonuses to reward and penalize CEOs may only be possible to
create high-powered incentives that align CEO pay with shareholder objectives (Hall and
Liebman, 1998). A large part of the executive pay literature argues that compensation and
managerial interests should be aligned with shareholder interests in order to solve agency
problems (see, for example, the surveys by Murphy and by Core et al. (2003a).
Equity-based compensation is widely documented in the research examining pay versus
performance. Jensen and Meckling (1976), Murphy (2003) and Jensen (2004) state that the
increase in stock options pay is the result of the boards’ inability to evaluate the true cost of this
form of compensation. The use of equity-based compensation is encouraged by all
stakeholders, such as investors, regulators and academics. The controversy over CEO
compensation reflects a perception that CEOs effectively set their own pay levels. In most
companies, the last decisions over executive pay are made by members outside the board of
directors who are keenly aware of the conflicts of interest between managers and shareholders
over the level of pay. However, the CEOs and other top managers exert at least some influence
on the level and on the structure of their pay (Murphy 1999).
6
In recent years, the use of restricted stocks in compensation executives has increased and
has been widely criticized when these executives received dividend equivalents on restricted
stocks before the vesting period. Agency cost benefits of dividend equivalent rights argue that
this practice helps executives focus on the business, and rewards them for managing the
business to produce cash. Therefore, this is encouraged because it is a way of distributing
dividends by shareholders (Akpotaire 2011).
The SFAS 123 (R) is a change in accounting policy and represents an exogenous shock to
the accounting benefits, and restricts the choice of accounting principles by managers
(Zmijewski and Hagerman 1981). There are economic incentives to determine and motivate the
managers’ concern with a set of accounting principal utilized to generate the firms’ financial
statements. Under economic factors which influence the decision, managers will attempt to
archive the optimal reported net income over time and will choose a set of income policies
according to theirs goals. There are many variables that induce managers to use deflating
policies while other variables encourage managers to choose income inflating solutions. That
infers a conservative or liberal firm income strategy. This trade-off means that any combination
of Generally Accepted Accounting Practice (GAAP) variables may be optimal for each firm.
However, the SAF 123(R) prevents this income strategy by the imposing and restricting some
variables as accounting treatment of stock-options compensation and the fair-value report. In
their study, Zmijewski and Hagerman (1981) suggest that individual accounting choice
decisions are part of an overall firm strategy and applicable in larger firms and in more
concentrated industries. In this sense, Matsunaga (1995) suggests that some change in the
financial reporting of treatment of stock options, as proposed by the FASB, is likely to reduce
the use of the employees’ stock option for some firms (Matsunaga 1995).
2.3 Financial performance in high-technology firms
This chapter provides an analysis on the different forms of measuring performance in high-
tech firms and how these engage to the level of CEO pay. The behavior of high-tech firms and
its contribution to CEO compensation for the short- and long-term are also analyzed. This is
consistent with Shim (2009), who argues that it is possible to confirm that high-tech firms that
depend more on managing assets are more successful. Some of these assets are technology
innovation, continuous improvement, software development and knowledge-based
management. High-tech firms must continuously innovate to survive and to sustain their
growth (Shim et al., 2009). In high-technology firms it is possible to find innovation, R&D
investments and some assets with an essential competitive advantage and there are, at the same
7
time, some risks. Different R&D spending in the firms is indicative of a large variance in the
firms’ performance. High-tech investment is particularly important because the returns on high-
tech investment are skewed and highly uncertain, in part because R&D projects have a low
probability of succeeding financially. Another reason is the existing asymmetry in information
shared between firms and potential investors. This happens because it is difficult to increase
high-tech investments and often insiders will have much better information than outsiders about
the prospects of the firm's investments. Moreover, as pointed out by Makri, Lane and Gomez-
Mejia, to engage in innovative projects leading to innovations the incentive schemes play a
pivotal role in inducing senior organizational managers. Furthermore, to secure the stream of
innovations a firm needs to enhance its economic performance with a proper pay scheme to
encourage executives (Makri et al. 2006). The study by Gomez-Mejia et al. (2000) was taken
into consideration in this paper, especially their conclusion that high-technology industry
executives may be more rewarded for innovation activity than for the firm’s financial
performance. The executive incentives induce higher risk and cannot bear the associated
financial risk as a consequence of those actions (Gomez-Mejia et al. 2000).
In summary, it was found that firms are subjected to the agency problem in which the CEO
may not work in favor of the shareholders to maximize their wealth by improving firm
performance. Furthermore, the decisions related to CEO compensation are based on the firms’
accounting and finance performance. Therefore, the change in the rules of the SFAS 123 (R)
forces managers to make decisions and to overtake the limitations of their income goals. 2.4 Developing a hypothesis
The role that accounting plays on CEO compensation in high-tech firms is still little known.
Some possibilities have been identified to find some relations with pay compensation and to
understand how it is possible to improve firm performance and in turn the shareholder wealth.
As previously discussed, existing theories provide predictions on the outlined considerations
related to firm performance, allowing for two different selection hypotheses.
The first research question, that the CEO compensation for the long-term is determinant and
positively related to firm performance. High-technology companies support and enhance this
evidence. Rejecting the null hypothesis would mean that the relative weight in terms of total
compensation of each compensation component (such as salary, bonus, stock options and other
compensations)are different goals for executives, as opposed to performance for the short-term.
It is possible that high value firms have CEOs are interested in long-term performance and in
obtaining personal benefits in terms of total compensation. It might be argued that powerful
8
incentive models are especially valuable for high value firms with high opportunities for
growth that need to be decisively and vigorously pursued. It might also be that high value firms
are especially likely to attract star CEOs and pay gold parachutes. Furthermore, the CEO
compensation for the short-term is determinant and positively correlated with firm
performance. With less intensity and yet more persistent than long-term compensation, bonuses
and salary are determinant and in the same effect related to accounting performance.
Hypotheses 1a and 1b are formulated accordingly.
Hypothesis 1a: CEO compensation in high-technology firms is positively related to firm
performance for the long-term.
Hypothesis 1b: CEO compensation in high-technology firms is positively related to firm
performance for the short-term.
The second question is the SFAS 123 (R) has an influence on CEO compensation in high-
technology firms. Human capital intensive industries rely heavily on stock options as
compensation relatively to other firms. The impact of fair value reporting is examined for stock
option compensation on their income statements and on CEO compensation. In line with this,
hypothesis 2 is formulated.
Hypothesis 2: CEO compensation in high-technology firms is positively related to firm
performance after the implementation of the SFAS 123 (R).
The purpose of this paper is to examine this impact on CEO compensation. The effect on
CEO compensation is analyzed for the long- and short-term using high-tech firm performance
before and after SFAS 123 (R) implementations. 3 Empirical approach
The models introduced by the system equation presented below were used to test whether firm
performance is relevant to explain executive compensation for the long- and short-term. Firstly,
the model for the long-term,
Ln (T_COMP)ij= β11 + β12*ln(ASSETS)ij + β13*ΔASSETSij + β 15*ln(OIBD/ASSETS*100)ij+ β
16*ln(SALES) ij + β17*ln(NIBEX)ij + β18*ERPSEX ij + β19*SPCODE ij + β10*DHTECH ij+
β31*ln(COMMEQ)ij+β∑ 휕푗 ∗ 푌푒푎푟푗 + uij
and for the short-term
9
Ln (CASH)ij = β21+ b22*log(ASSETS) ij + β23*ΔASSETSij + β25*ln(OIBD/ASSETS*100)ij +
β26*ln(SALES)ij + β27*ln(NIBEX)ij + β29*SPCODEij + β20*DHTECHij +
β32*ln(COMMEQ)ij+β∑ 휕푗 ∗ 푌푒푎푟푗 + vij
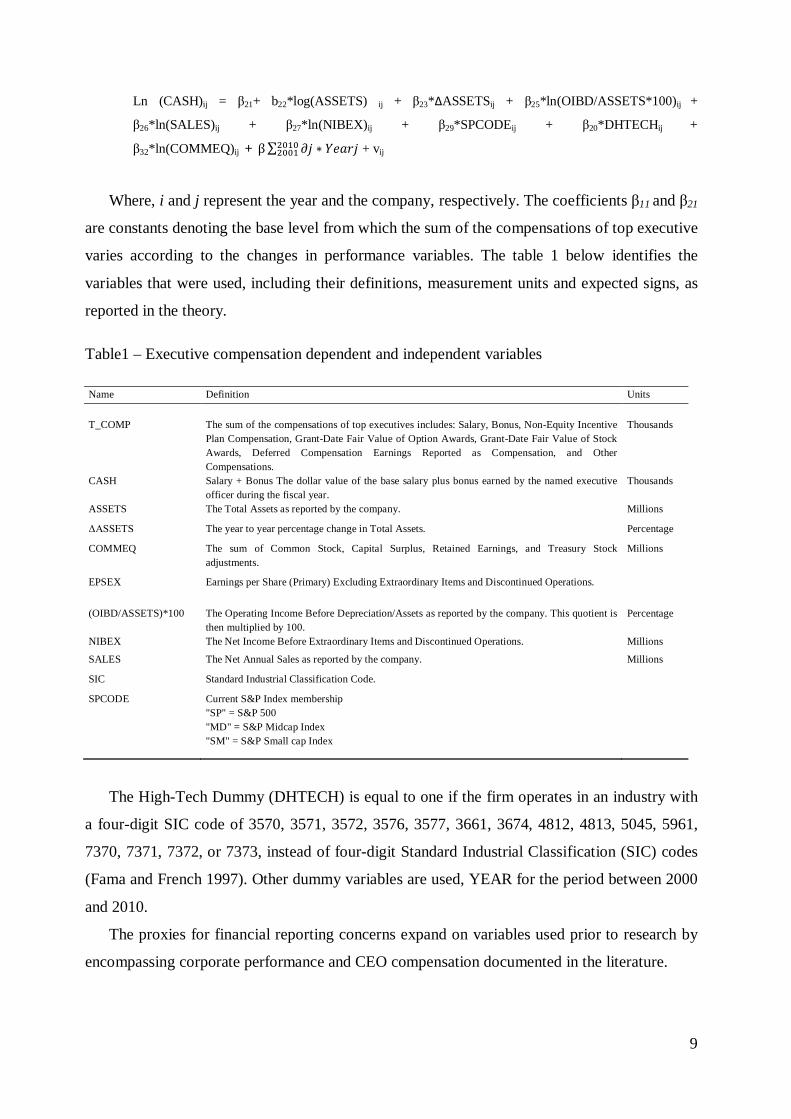
Where, i and j represent the year and the company, respectively. The coefficients β11 and β21
are constants denoting the base level from which the sum of the compensations of top executive
varies according to the changes in performance variables. The table 1 below identifies the
variables that were used, including their definitions, measurement units and expected signs, as
reported in the theory. Table1 – Executive compensation dependent and independent variables Name Definition Units T_COMP
The sum of the compensations of top executives includes: Salary, Bonus, Non-Equity Incentive Plan Compensation, Grant-Date Fair Value of Option Awards, Grant-Date Fair Value of Stock Awards, Deferred Compensation Earnings Reported as Compensation, and Other Compensations.
Thousands
CASH Salary + Bonus The dollar value of the base salary plus bonus earned by the named executive officer during the fiscal year.
Thousands
ASSETS The Total Assets as reported by the company. Millions
ΔASSETS The year to year percentage change in Total Assets. Percentage
COMMEQ The sum of Common Stock, Capital Surplus, Retained Earnings, and Treasury Stock adjustments.
Millions
EPSEX Earnings per Share (Primary) Excluding Extraordinary Items and Discontinued Operations.
(OIBD/ASSETS)*100 The Operating Income Before Depreciation/Assets as reported by the company. This quotient is then multiplied by 100.
Percentage
NIBEX The Net Income Before Extraordinary Items and Discontinued Operations. Millions
SALES The Net Annual Sales as reported by the company. Millions
SIC Standard Industrial Classification Code.
SPCODE Current S&P Index membership "SP" = S&P 500 "MD" = S&P Midcap Index "SM" = S&P Small cap Index
The High-Tech Dummy (DHTECH) is equal to one if the firm operates in an industry with
a four-digit SIC code of 3570, 3571, 3572, 3576, 3577, 3661, 3674, 4812, 4813, 5045, 5961,
7370, 7371, 7372, or 7373, instead of four-digit Standard Industrial Classification (SIC) codes
(Fama and French 1997). Other dummy variables are used, YEAR for the period between 2000
and 2010.
The proxies for financial reporting concerns expand on variables used prior to research by
encompassing corporate performance and CEO compensation documented in the literature.
10
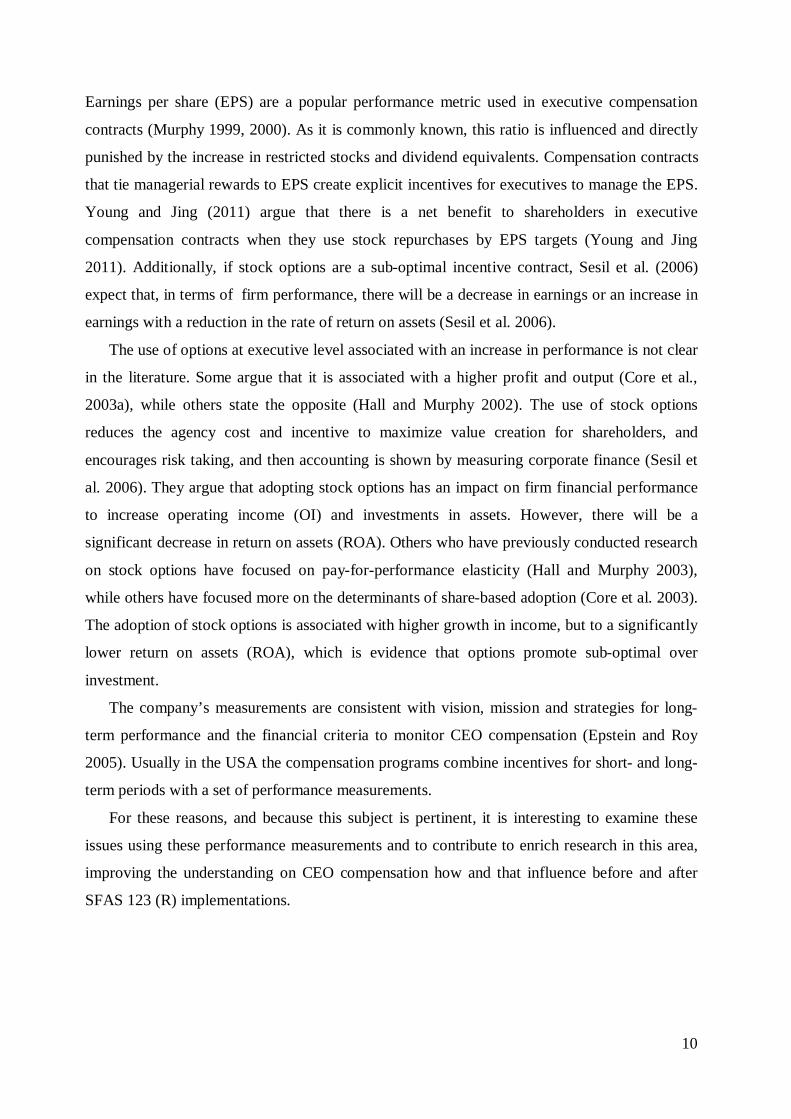
Earnings per share (EPS) are a popular performance metric used in executive compensation
contracts (Murphy 1999, 2000). As it is commonly known, this ratio is influenced and directly
punished by the increase in restricted stocks and dividend equivalents. Compensation contracts
that tie managerial rewards to EPS create explicit incentives for executives to manage the EPS.
Young and Jing (2011) argue that there is a net benefit to shareholders in executive
compensation contracts when they use stock repurchases by EPS targets (Young and Jing
2011). Additionally, if stock options are a sub-optimal incentive contract, Sesil et al. (2006)
expect that, in terms of firm performance, there will be a decrease in earnings or an increase in
earnings with a reduction in the rate of return on assets (Sesil et al. 2006).
The use of options at executive level associated with an increase in performance is not clear
in the literature. Some argue that it is associated with a higher profit and output (Core et al.,
2003a), while others state the opposite (Hall and Murphy 2002). The use of stock options
reduces the agency cost and incentive to maximize value creation for shareholders, and
encourages risk taking, and then accounting is shown by measuring corporate finance (Sesil et
al. 2006). They argue that adopting stock options has an impact on firm financial performance
to increase operating income (OI) and investments in assets. However, there will be a
significant decrease in return on assets (ROA). Others who have previously conducted research
on stock options have focused on pay-for-performance elasticity (Hall and Murphy 2003),
while others have focused more on the determinants of share-based adoption (Core et al. 2003).
The adoption of stock options is associated with higher growth in income, but to a significantly
lower return on assets (ROA), which is evidence that options promote sub-optimal over
investment.
The company’s measurements are consistent with vision, mission and strategies for long-
term performance and the financial criteria to monitor CEO compensation (Epstein and Roy
2005). Usually in the USA the compensation programs combine incentives for short- and long-
term periods with a set of performance measurements.
For these reasons, and because this subject is pertinent, it is interesting to examine these
issues using these performance measurements and to contribute to enrich research in this area,
improving the understanding on CEO compensation how and that influence before and after
SFAS 123 (R) implementations.

11
4 Data and summary statistics
The chosen database was the ExecuComp, which was used to find the variables and to
create a sample of firms between 2000 and 2010. The ExecuComp database provides yearly
data on salary, bonus, stock option and restricted stock grants, as well as managerial stock and
option holdings for top executives in firms within the Standard & Poor’s Index (S&P 1500).To
test this hypothesis, the following specification is run on the balanced panel of high-technology
firms. High-Technology firms are the firms that operate in an industry with a four-digit SIC
code of 3570, 3571, 3572, 3576, 3577, 3661, 3674, 4812, 4813, 5045, 5961, 7370, 7371, 7372,
or 7373, using the Fama and French classification of 48 industry groups, instead of four-digit
Standard Industrial Classification (SIC) codes (Fama and French 1997).
According to Bebchuk et al. (2011), in order to test the variables and to assess the
abovementioned research hypotheses there are independent variables that will possibly be used
by the regression model to perform the estimation. The total compensation and cash
compensation are analyzed depending on some firm performance metrics.
At an empirical level, this analysis focuses on a sample of 1500 companies in the Standard
& Poor's (stock market index based on the common stock prices) index (S&P1500), for the
period between 2000 and 2010, which constitutes a sample of about 19800 observations. The
SFAS 123 (R) was beginning of the first annual reporting period after December 15, 2005.
Thus, all firms’ observations during 2006 were excluded because this is a transition year and
the quality of the statements is lower. After this restriction, the final sample comprises 1500
firm-year observations with 2000-2005 as the period before SFAS 123 (R) and 2007-2010 as
the period after SFAS 123 (R).
The ExecuComp database collects information on seven independent variables – Assets and
year to year percentage change of assets (ΔASSETS), sales, operation income before
depreciation (OIDB), net items and discontinued operation (NIBEX), earning per share
(EPSEX), The sum of Common Stock Capital Surplus (COMMEQ), net annual sales (SALES)
– and dependent total compensation (T_COMP) and cash compensation (CASH) variables are
listed by each year and company. Several measurements were used in this study, such as
control variables. These include assets, increase in sales, the net Income and the earning per
share, as a proxy of firm size, firm performance and shareholder wealth, the common predictors
of executive pay. The two primary measurements of CEO pay were used. The short-term
compensation consisted of annual salary and bonus, which represents the total cash
compensation received during a specific year. Annual salary and bonus for 2000 and 2010 (in
12
thousands of dollars) were taken from the ExecuComp data set. The long-term compensation
represents the equity-based compensation of a CEO, as reported by Frydman (2009). As she
reported in the case study of General Electric, salary and bonus are defined as the level of
salaries and current bonuses, both awarded and paid out throughout the year. Long-term bonus
measures the amount paid out during the year according to long-term bonuses awarded in prior
years. Total compensation is the sum of salary, bonus, long-term bonus and the Black–Scholes
value of stock options granted (Frydman 2009).
The main variables of the analysis in the system equation are T_COMP (defined by the sum
of salary, bonus, non-equity incentive plan compensation and other compensations) and CASH
(Salary plus bonus) of all top executives in each company. Table 2 presents the descriptive
statistics and correlations for variables used in the CEO compensation analysis. Some
interesting outcomes were found as a result of this study.
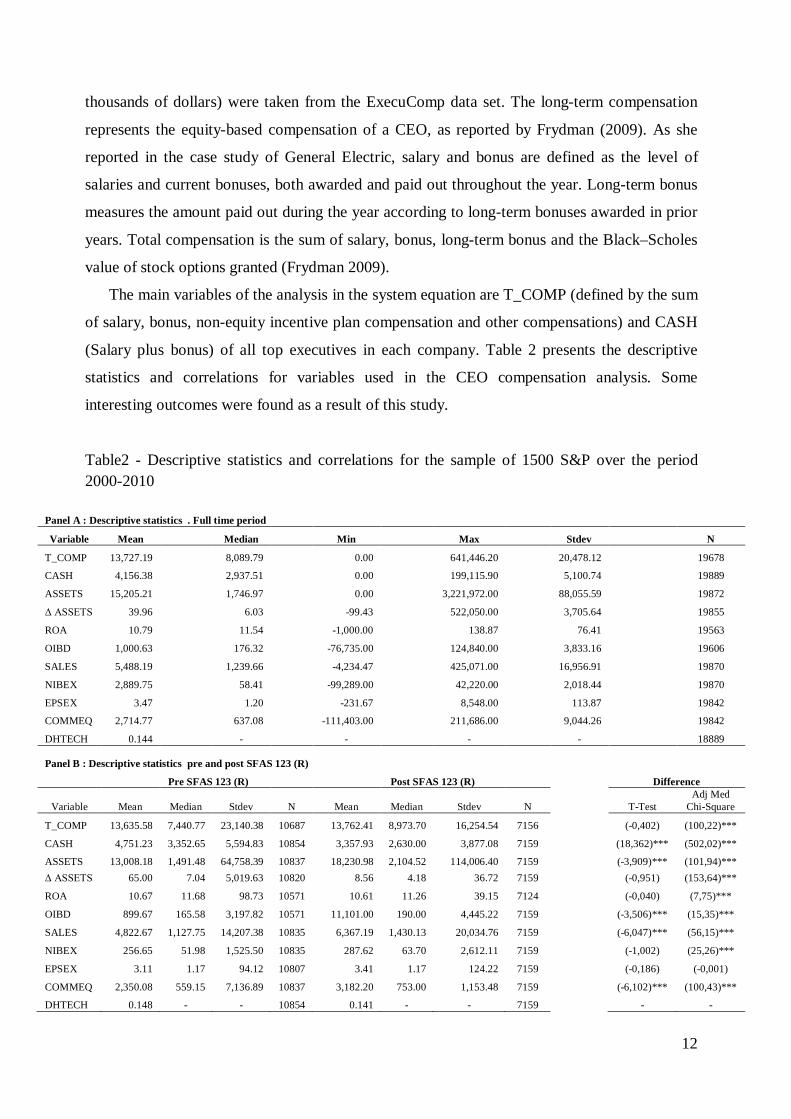
Table2 - Descriptive statistics and correlations for the sample of 1500 S&P over the period 2000-2010
Panel A : Descriptive statistics . Full time period
Variable Mean Median Min Max Stdev N
T_COMP 13,727.19 8,089.79 0.00 641,446.20 20,478.12 19678
CASH 4,156.38 2,937.51 0.00 199,115.90 5,100.74 19889
ASSETS 15,205.21 1,746.97 0.00 3,221,972.00 88,055.59 19872
Δ ASSETS 39.96 6.03 -99.43 522,050.00 3,705.64 19855
ROA 10.79 11.54 -1,000.00 138.87 76.41 19563
OIBD 1,000.63 176.32 -76,735.00 124,840.00 3,833.16 19606
SALES 5,488.19 1,239.66 -4,234.47 425,071.00 16,956.91 19870
NIBEX 2,889.75 58.41 -99,289.00 42,220.00 2,018.44 19870
EPSEX 3.47 1.20 -231.67 8,548.00 113.87 19842
COMMEQ 2,714.77 637.08 -111,403.00 211,686.00 9,044.26 19842
DHTECH 0.144 - - - - 18889
Panel B : Descriptive statistics pre and post SFAS 123 (R)
Pre SFAS 123 (R) Post SFAS 123 (R) Difference
Variable Mean Median Stdev N Mean Median Stdev N T-Test Adj Med
Chi-Square
T_COMP 13,635.58 7,440.77 23,140.38 10687 13,762.41 8,973.70 16,254.54 7156 (-0,402) (100,22)***
CASH 4,751.23 3,352.65 5,594.83 10854 3,357.93 2,630.00 3,877.08 7159 (18,362)*** (502,02)***
ASSETS 13,008.18 1,491.48 64,758.39 10837 18,230.98 2,104.52 114,006.40 7159 (-3,909)*** (101,94)*** Δ ASSETS 65.00 7.04 5,019.63 10820 8.56 4.18 36.72 7159 (-0,951) (153,64)***
ROA 10.67 11.68 98.73 10571 10.61 11.26 39.15 7124 (-0,040) (7,75)***
OIBD 899.67 165.58 3,197.82 10571 11,101.00 190.00 4,445.22 7159 (-3,506)*** (15,35)***
SALES 4,822.67 1,127.75 14,207.38 10835 6,367.19 1,430.13 20,034.76 7159 (-6,047)*** (56,15)***
NIBEX 256.65 51.98 1,525.50 10835 287.62 63.70 2,612.11 7159 (-1,002) (25,26)***
EPSEX 3.11 1.17 94.12 10807 3.41 1.17 124.22 7159 (-0,186) (-0,001)
COMMEQ 2,350.08 559.15 7,136.89 10837 3,182.20 753.00 1,153.48 7159 (-6,102)*** (100,43)***
DHTECH 0.148 - - 10854 0.141 - - 7159 - -
13
The descriptive statistics of the variables for total compensation and cash compensation for
high-tech firms are presented in Table 2. Panel A of table 2 provides descriptive statistics for
the full sample. The firms in the sample are large with a mean of 15,201.20 million USD and
median assets of 1,746.97 million USD.
In the S&P1500, before and after SFAS (R), for the period between 2000 and 2010, there
are about 14.415% high-technology firms, and it is possible to observe that the group of top
executives in each company has an average total compensation around 13,727 million USD and
earn in cash around 4,156 million USD. Other interesting finding is that, in this period and in
this group of companies, and consistent with the overall economic growth, there is an increase
in assets and returns on assets around 39.96% and 10.79 %, respectively. Panel B of Table 2
reports the same descriptive statistic partitioned by time period. Consistent with the overall
economic growth, it is possible to observe that almost all firm performance measurements
increase in the period after SFAS 123 (R). Total compensations maintain an average around
13,727 million USD (value for full period) for the periods before and after SFAS 123 (R). The
same cannot be said about the compensation for the short-term as variable cash presents a
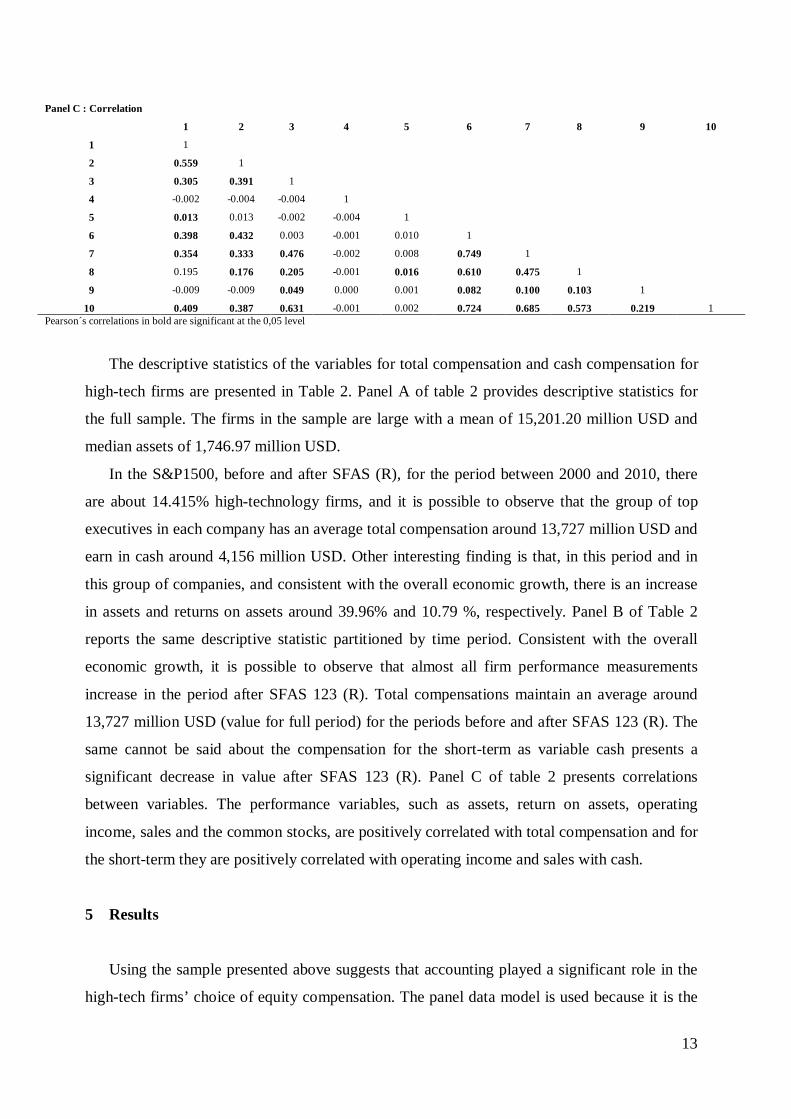
significant decrease in value after SFAS 123 (R). Panel C of table 2 presents correlations
between variables. The performance variables, such as assets, return on assets, operating
income, sales and the common stocks, are positively correlated with total compensation and for
the short-term they are positively correlated with operating income and sales with cash.
5 Results
Using the sample presented above suggests that accounting played a significant role in the
high-tech firms’ choice of equity compensation. The panel data model is used because it is the
Panel C : Correlation
1 2 3 4 5 6 7 8 9 10
1 1
2 0.559 1
3 0.305 0.391 1
4 -0.002 -0.004 -0.004 1
5 0.013 0.013 -0.002 -0.004 1
6 0.398 0.432 0.003 -0.001 0.010 1
7 0.354 0.333 0.476 -0.002 0.008 0.749 1
8 0.195 0.176 0.205 -0.001 0.016 0.610 0.475 1
9 -0.009 -0.009 0.049 0.000 0.001 0.082 0.100 0.103 1
10 0.409 0.387 0.631 -0.001 0.002 0.724 0.685 0.573 0.219 1 Pearson´s correlations in bold are significant at the 0,05 level
14
most suitable way of studying a large set of repeated observations and due to the fact that it
assesses evolution over time. With panel data it is possible to simultaneously explore several
variations over time and between different individuals. The use of such models has increased
immensely and, in fact, combining time and cross-sectional data brings many advantages: it is
possible to use a larger number of observations and the degree of freedom in estimates
increases, thus making statistical inferences more credible. At the same time, the risk of
multicollinearity is reduced since the data in companies present different structures. Moreover,
this model provides access to further information and the efficiency and stability of the
estimators increase, while enabling the introduction of dynamic adjustments (Gujarati 2004;
William 2003).
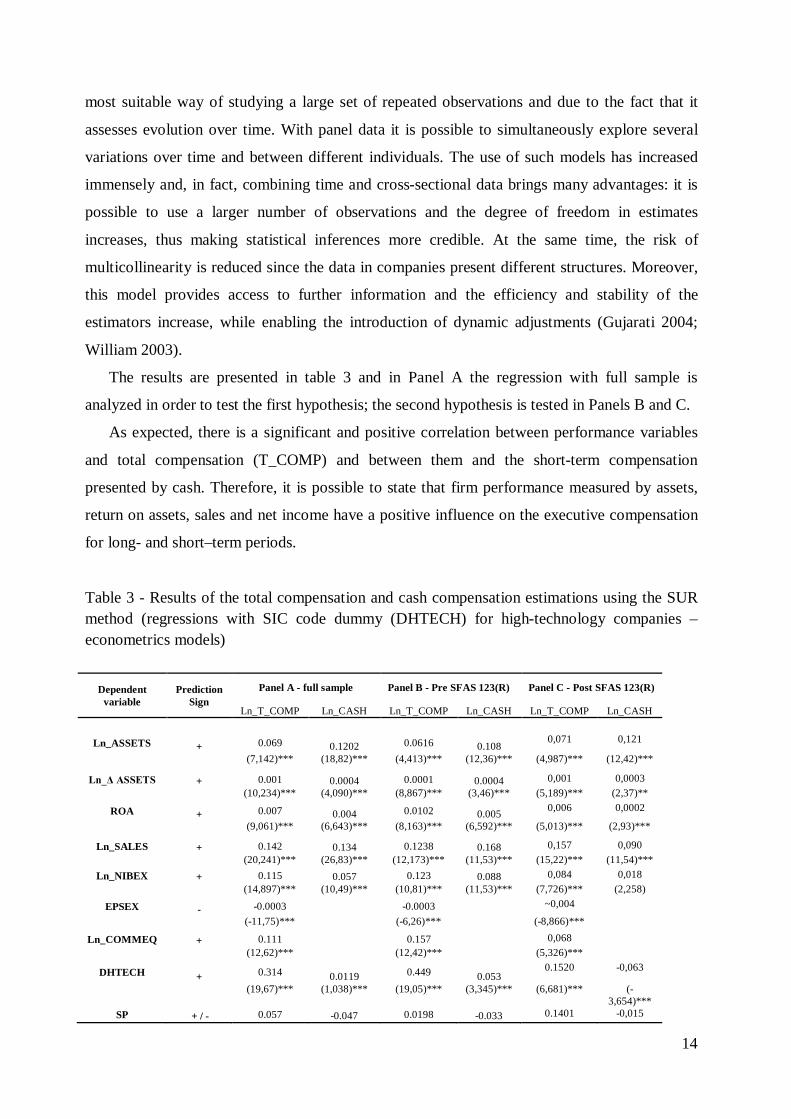
The results are presented in table 3 and in Panel A the regression with full sample is
analyzed in order to test the first hypothesis; the second hypothesis is tested in Panels B and C.
As expected, there is a significant and positive correlation between performance variables
and total compensation (T_COMP) and between them and the short-term compensation
presented by cash. Therefore, it is possible to state that firm performance measured by assets,
return on assets, sales and net income have a positive influence on the executive compensation
for long- and short–term periods.
Table 3 - Results of the total compensation and cash compensation estimations using the SUR method (regressions with SIC code dummy (DHTECH) for high-technology companies – econometrics models)
Dependent variable
Prediction Sign
Panel A - full sample Panel B - Pre SFAS 123(R) Panel C - Post SFAS 123(R)
Ln_T_COMP Ln_CASH Ln_T_COMP Ln_CASH Ln_T_COMP Ln_CASH
Ln_ASSETS + 0.069 0.1202 0.0616 0.108
0,071 0,121
(7,142)*** (18,82)*** (4,413)*** (12,36)*** (4,987)*** (12,42)***
Ln_Δ ASSETS + 0.001 0.0004 0.0001 0.0004 0,001 0,0003
(10,234)*** (4,090)*** (8,867)*** (3,46)*** (5,189)*** (2,37)**
ROA + 0.007 0.004 0.0102 0.005 0,006 0,0002
(9,061)*** (6,643)*** (8,163)*** (6,592)*** (5,013)*** (2,93)***
Ln_SALES + 0.142 0.134 0.1238 0.168 0,157 0,090
(20,241)*** (26,83)*** (12,173)*** (11,53)*** (15,22)*** (11,54)***
Ln_NIBEX + 0.115 0.057 0.123 0.088 0,084 0,018
(14,897)*** (10,49)*** (10,81)*** (11,53)*** (7,726)*** (2,258)
EPSEX - -0.0003 -0.0003 ~0,004
(-11,75)*** (-6,26)*** (-8,866)***
Ln_COMMEQ + 0.111 0.157 0,068
(12,62)*** (12,42)*** (5,326)***
DHTECH + 0.314 0.0119 0.449 0.053 0.1520 -0,063
(19,67)*** (1,038)*** (19,05)*** (3,345)*** (6,681)*** (-
3,654)*** SP + / - 0.057 -0.047 0.0198 -0.033 0.1401 -0,015
15
(3,908)*** (0-4,444)*** (0,967) (-2,395)** (6,113)*** (-0,912)
SM + / - -0.167 -0.016 -0.1531 -0.046 -0.207 -0,054 (-12,30)*** (-1,633) (-7,536)*** (-
3,321)*** (.10,44)*** (-
3,596)***
Year = 2001 + / - 0.0108 -0.029 0,020 -0,020
(0,443) (-1,618) (0,787) (-1,182)
Year = 2002 + / - -0.045 0,052 -0,035 0,061
(-1,865)** (2,946)** (-1,376) (3,478)***
Year = 2003 + / - -0.0504 0,108 -0,047 0,115
(-2,148)** (6,342)*** (-1,884)* (6,714)***
Year = 2004 + / - 0.0214 0,152 0,019 0,150
(0,921) (8,995)*** (0,770) (8,841)***
Year = 2005 + / - 0.0183 0,134 0,012 0,120
(0,776) (7,790)*** (0,470) (6,960)***
Year = 2006 + / - -0.0072 -0,243
(-0314) -14,559)***
Year = 2007 + / - .00454 -0,306
(1,969)* (-18,217)***
Year = 2008 + / - 0.0521 -0,301 0,001 0,007
(2,140)* (-16,968)*** (0,068) (0,439)
Year = 2009 + / - 0.0445 -0,208 -0,006 0,019
(1,824)* (-15,962)*** (-0,288) (1,203)
Year = 2010 + / - 0.1514 -0,305 0,111 0,010
(6,229)*** (.17,208)*** (5,374)*** (0,686)
Adj R2 0.565 0.546 0.538 0.603 0.611 0.443 N 15109 15265 8103 8223 5433 5435
T-Statistics are reported in parenthesis below the coefficient and White´s corrected for heteroskedasticity *, **, *** indicate significance at the 0,10, 0,05 and 0,01 level, respectly
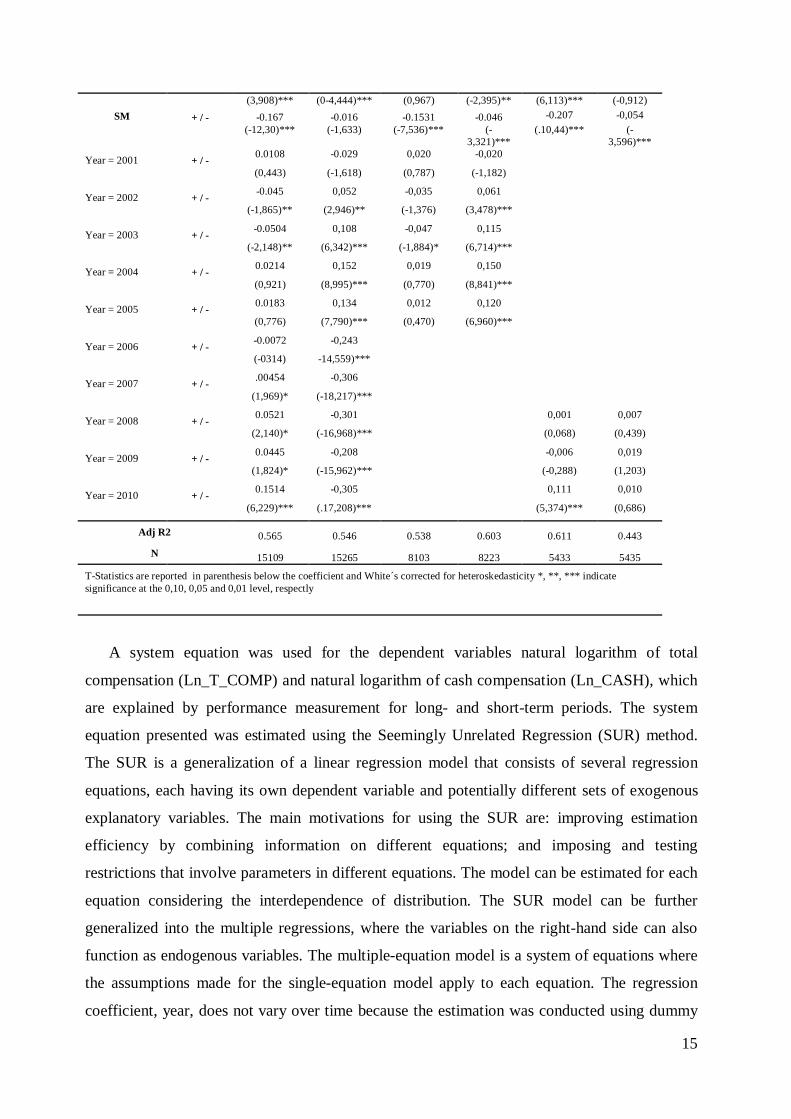
A system equation was used for the dependent variables natural logarithm of total
compensation (Ln_T_COMP) and natural logarithm of cash compensation (Ln_CASH), which
are explained by performance measurement for long- and short-term periods. The system
equation presented was estimated using the Seemingly Unrelated Regression (SUR) method.
The SUR is a generalization of a linear regression model that consists of several regression
equations, each having its own dependent variable and potentially different sets of exogenous
explanatory variables. The main motivations for using the SUR are: improving estimation
efficiency by combining information on different equations; and imposing and testing
restrictions that involve parameters in different equations. The model can be estimated for each
equation considering the interdependence of distribution. The SUR model can be further
generalized into the multiple regressions, where the variables on the right-hand side can also
function as endogenous variables. The multiple-equation model is a system of equations where
the assumptions made for the single-equation model apply to each equation. The regression
coefficient, year, does not vary over time because the estimation was conducted using dummy
16
variables for year, and assuming that the company’s heterogeneity is captured in the constant
part (William 2003).
The results in table 3 reflect the estimation of equations (1) and (2). Panel A is consistent
with hypothesis 1, the estimated coefficient for total compensation for long–term periods and
cash compensation for short-term periods. As it is possible to observe the regressions are
globally significant, with a 5% significance level. The following table presents the results of the
estimation for the studied data.
The sample includes 15109 observations for full time, the period before SFAS 123 (R)
represented by 8103 observations and period after SFAS 123 (R) represented by 5433
observations. The result of the SUR model is depicted for total compensation and cash
compensation in the period between 2000 and 2010. Adjusted R2 is 0.565, which means that the
dependent variables total compensation is explained by this set of regressors present in the
model. For the period after SFAS 123 (R), the adjusted R2 is 0.611, meaning that the model
can be explained by the group of variables and is higher than that the adjustment or the model
is better for this sample. These indicate that the variables addressed here play a significant role
in explaining executive compensation for short- and long-term periods, as stated by Chi-Square
test (Probability=0).
It is possible to note that in full period in high-tech firms CEO compensation is higher than
in other firms of the S&P 1500 at about 31.4%, but in the period before SFAS 123(R) it was
about 44.9% higher and dropped to 15.2% in the period after SFAS 123(R). CEO compensation
in high-technology firms is higher than in the other firms but with a smaller difference than
previously. It is important to highlight that the implementation of the SFAS 123 (R) has an
influence on awards in the long-term, but not for short-term periods. Stock options represent
awards for the long–term, and the negative influence on CEO compensation in high-tech firms
after the SFAS 123 (R) is confirmed. However, for long-term S&P 500, for the biggest S&P
firms, CEO compensations are higher than in S&P small firms. When the annual effects are
analyzed, it is possible to find a decrease in CEO compensation for the long-term in 2002 and
2003 over 2000 and an increase in the period between 2007 and 2010.
In table 3, the coefficient signs are similar in both specifications. However, the magnitudes
of the coefficients are sensitive to the specification. As expected, earnings per share are
negative and significantly related to total compensation for the long-term. This indicates that
there are no explicit contractual arrangements linking compensations and earnings per share.
The performance ratio of firms measured by return has a negative influence on CEO
Compensation (Core et al. 2003a; Young and Jing 2011). According to Aboody et al. (2004),
17
there is a significant negative relation between share price and the SFAS 123 expense when it is
relevant to investors and well measured (Aboody et al. 2004). A positive and statistically
significant relationship was found between sales, asset growth and return on assets, and for
adding the same level of total CEO compensation and cash compensation Gabaix and Landier
(2008) also empirically test the relation between the level of pay and firm size. Ln (assets), a
variable proxy for firm size is positively related to pay with a coefficient total compensation
and cash compensation in the regression.When the adjustment is performed for the long-term
compensation, it is possible to understand that when firm sizes are compared using the current
S&P index membership, S&P500 firms have an increase around 5.7% and for the S&P Small
caps 600 there is a decrease around 16.7%, comparatively to the S&P mid firms. In terms of
cash compensation, the S&P 500 firms are 4.7% below mid cap, and the S&P small firms are
1.6% below, comparatively to the same group of S&P mid firms.
Another finding is that the influence on CEO pay for the short-term between the year 2006
and 2008 does not have the same meaning in long-term compensations. As expected, there is an
increase around 5% for each year between 2007 and 2010 as a result of the introduction of the
SFAS 123(R).
There is a positive relation between CEO compensation and firm performance in high-tech
firms after the implementation of the SFAS 123 (R), but with less intensity than before. For the
S&P 500 firms, the implementation of the SFAS 123 (R) is profitable to CEOs because it
increases their compensations, while for high-tech CEOs it increases the value, although not as
strongly, and it is possible to verify the normalization for all S&P 500 firms. Some authors,
such as Hall and Murphy (2002), advocate that this adjustment of stock options is necessary to
restrict options and to consequently increase CEO compensation. That suggests that firms find
it difficult to downsize the executive pay packages and shift toward restricted options to
provide more incentives for long-term CEO compensation (Carter et al. 2007). Restricted stock
awards are profitable for executives because the income tax consequences can be more
favorable to employees than stock options. The special case of the USA and the consequences
of a restricted stock mean that in some cases the award can be structured to allow for the
deferral of all tax until the time of stock sale, and for all appreciation to be taxed at capital gain
rates even if the stock is appreciated prior to vesting. In contrast, stock options can result in
ordinary income to the recipient the stock has appreciated prior to vesting, with only the post-
exercise appreciation being deferred to the time of sale at capital gain rates. Furthermore, the
preferred stock usually carries no voting rights but may carry a dividend and may have priority
over common stock in the payment of dividends and upon liquidation. The preferred share
18
investor is entitled to a preset rate of dividend that must be paid out of earnings before any
dividends are distributed to common shareholders.
6 Conclusion and future research
This paper will contribute to a better understanding of the relationship between
compensation and performance in high-technology firms, and of the behavior caused by the
new role of expensing stock options with the SFAS 123 (R).The main purpose of this study was
to examine whether the total compensation paid to CEOs in high-technology firms in the S&P
1500 is related in corporate finance and how it is influenced by the introduction of the SFAS
123 (R).
The results presented are consistent with those achieved by Carter et al. (2007), who stated
that the favorable accounting treatment for stock options possibly lead to overall higher CEO
compensations. There is no evidence of a decrease in total compensation combined with the
positive association between financial reporting. They find that after controlling standard
economic determinants of compensation, expensing options in firms decrease compensation
from options and increase compensation from restricted stock. These results suggest that
accounting plays an important role in executives plan design (Carter et al. 2007).
There was an increase in CEO compensation after the introduction of the SFAS 123 (R).
Although the change in the plan design was not analyzed, a new accommodation of CEO
compensation was found as a result of the new rules of the SFAS 123 (R). The influence of
firm performance on the CEO compensation is positive and consistent in this group of high-
technology firms in the period between 2000 and 2010.
As concluded by Graham et al. (2012), there are differences in corporate culture and in the
managers’ latent traits, which are difficult to observe or measure. These latent traits could be an
innate ability, personality, risk aversion or, in this case, propensity to innovation, managing
uncertain times in order to boost (enhance) returns to the firm and reaction to stakeholders. The
CEOs of high-tech firms had to maximize returns, facing a big competition with new
technological solutions, thereby warranting a higher compensation than others.
However, this work is not without limitations. This study focuses only on high-technology
firms in the S&P 1500 in the period between 2000 and 2010, and the results of this study may
not be generalized to include other sectors due the specificity of high-tech firms. Another
limitation is the definition of high-technology used in this study that can be extended, as
performed by Shim et al. (2009), to include other important item measurements, such as value

19
of R&D expenditures, number of patents by firm and citation of patents (Gomez-Mejia et al.
2000; Shim et al. 2009). The level of R&D expenditures and new product introductions are
viewed as proxies for innovation, risk-taking and long-term decision-making, which are crucial
to characterize high-technology firms. Furthermore, innovation constitutes an indispensable
component of corporate strategies.
In the future, it will be important to analyze other developments, such as the effect of
managerial attributes for the short- and long-term in executive compensation (Graham et al.
2012). Furthermore, it will also be important to broaden the period of analysis in order to
investigate the effect of the financial crisis in the USA, which started in 2007.
7 References
Aboody, D., M. E. Barth, and R. Kasznik. 2004. SFAS No. 123 Stock‐Based Compensation
Expense and Equity Market Values. The Accounting Review 79 (2):251-275.
Akpotaire, B. U. 2011. Agency Cost Problems in Executive Compensation: An Evaluation of
Dividend Equivalent Rights on Restricted Stocks. Social Science Research Network.
Bebchuk, L. A., M. Cremers, and U. Peyer. 2011. The CEO pay slice. Journal of Financial
Economics In Press, Accepted Manuscript.
Bebchuk, L. A., and J. M. Fried. 2003. Executive Compensation as an Agency Problem.
National Bureau of Economic Research Working Paper Series No. 9813 (published as
Bebchuk, Lucian Arye and Jesse M. Fried. "Executive Compensation As An Agency
Problem," Journal of Economic Perspectives, 2003, v17(3,Summer), 71-92.).
Carter, M. E., L. J. Lynch, and İ. Tuna. 2007. The Role of Accounting in the Design of CEO
Equity Compensation. Accounting Review 82 (2):327-357.
Core, J. E., W. R. Guay, and D. F. Larcker. 2003. Executive Equity Compensation and
Incentives: A Survey. Economic Policy Review, Vol. 9, No. 1, April 2003.
Core, J. E., W. R. Guay, and R. E. Verrecchia. 2003a. Price versus Non‐Price Performance
Measures in Optimal CEO Compensation Contracts. The Accounting Review 78
(4):957-981.
Eisenhardt, K. M. 1989. Agency Theory: An Assessment and Review. The Academy of
Management Review 14 (1):57-74.
Epstein, M. J., and M.-J. Roy. 2005. Evaluating and monitoring CEO performance: evidence
from US compensation committee reports. Corporate Governance 5 (4):75 - 87.
20
Fama, E. F., and K. R. French. 1997. Industry costs of equity. Journal of Financial Economics
43 (2):153-193.
Frydman, C. 2009. Learning from the Past: Trends in Executive Compensation over the 20th
Century. CESifo Economic Studies 55 (3-4):458-481.
Gabaix, X., and A. Landier. 2008. Why has CEO Pay Increased So Much? The Quarterly
Journal of Economics 123 (1):49-100.
Gomez-Mejia, L. R., D. M. Gideon, and D. B. Balkin. 2000. Is CEO Pay in High-Technology
Firms Related to Innovation? The Academy of Management Journal 43 (6):1118-1129.
Graham, J. R., S. Li, and J. Qiu. 2012. Managerial Attributes and Executive Compensation.
Review of Financial Studies 25 (1):144-186.
Gujarati, D. N. 2004. Basic Econometrics. Vol. Fourth Edition.
Hall, B. J., and J. B. Liebman. 1998. Are CEOS Really Paid Like Bureaucrats?*. Quarterly
Journal of Economics 113 (3):653-691.
Hall, B. J., and K. J. Murphy. 2002. Stock options for undiversified executives. Journal of
Accounting and Economics 33 (1):3-42.
Hall, B. J., and K. J. Murphy. 2003. The Trouble with Stock Options. Journal of Economic
Perspectives 17 (3):49-70.
Heltzer, W. 2010. The impact of SFAS No. 123(R) on financial statement conservatism.
Advances in Accounting 26 (2):227-235.
Jensen, M., and W. Meckling. 1976. Theory of the firm: managerial behaviour, agency costs,
and ownership structure. Journal of Financial Economics (3):308-360.
Jensen, M. C., and K. J. Murphy. 1990. Performance Pay and Top-Management Incentives.
Journal of Political Economy 98 (2):225-264.
Jensen, M. C., and K. J. Murphy. 1990b. CEO Incentives: Itʼs Not How Much You Pay, But
How. Harvard Business Review 3:138-153.
Makri, M., P. J. Lane, and L. R. Gomez-Mejia. 2006. CEO incentives, innovation, and
performance in technology-intensive firms: a reconciliation of outcome and behavior-
based incentive schemes. Strategic Management Journal 27 (11):1057-1080.
Matsunaga, S. R. 1995. The Effects of Financial Reporting Costs on the Use of Employee
Stock Options. The Accounting Review 70 (1):1-26.
Murphy, K. J. 1999. Chapter 38 Executive compensation. In Handbook of Labor Economics,
edited by C. A. Orley and C. David: Elsevier, 2485-2563.
Sesil, J., Y.-P. Lin, and S. M. Director. 2006. Stock Option Adoption and Irrational
Exuberance: The Impact On Profitability. working papers series.

21
Shim, D., J. Lee, and n. K. Joo. 2009. CEO Compensation and US High-tech and Low-tech
Firms’ Corporate Performance. Contemporary Management Research Vol. 5:93-106.
William, G. 2003. Econometric analysis. edited by t. ed. New Jersey: Prentice-Hall.
Young, S., and Y. Jing. 2011. Stock Repurchases and Executive Compensation Contract
Design: The Role of Earnings per Share Performance Conditions. Accounting Review
86 (2):703-733.
Zmijewski, M. E., and R. L. Hagerman. 1981. An income strategy approach to the positive
theory of accounting standard setting/choice. Journal of Accounting and Economics 3
(2):129-149.

Editorial Board ([email protected])Download available at: http://wps.fep.up.pt/wplist.php
also in http://ideas.repec.org/PaperSeries.html
23