CEO Compensation and Shareholder Value Orientation … 43_4/03 Taekjin Shin article.pdf · CEO...
26
The Economic and Social Review, Vol. 43, No. 4, Winter, 2012, pp. 535–559 CEO Compensation and Shareholder Value Orientation Among Large US Firms* TAEKJIN SHIN University of Illinois, USA Abstract: The rise of shareholder value orientation among US firms has been studied extensively during the past few decades as a key component of financialisation. The firm-level mechanisms of how such institutional changes have affected firm behaviours are not well understood, however. This study examines the relationship between the shareholder value orientation of firms and financial rewards for the executive managers who run those companies. Using compensation data for 290 CEOs for an 11-year period, I demonstrate that CEOs at the firms with the appearance of shareholder value orientation – such as monitoring and incentive-alignment mechanisms – receive greater compensation than non-shareholder-value-orientation CEOs. Moreover, when the firms strengthen the appearance of shareholder value orientation, CEO pay increases the subsequent year. This suggests that firms adopt monitoring and incentive-alignment mechanisms in order to gain the appearance of shareholder value orientation rather than to curb executive compensation. By employing such symbolic management tactics, top managers at such firms earn greater legitimacy, a better reputation, and a higher valuation of the firms and executive talent. The findings suggest that executive compensation has played an important role in providing incentives for top managers to make strategic decisions that conform to the shareholder value maximisation principle. I INTRODUCTION S cholars have documented financialisation as a profound transformation of the American economy that occurred during the past three decades (Davis, 2009; Krippner, 2005, 2011; Tomaskovic-Devey and Lin, 2011). Whereas various institutional backgrounds that led to financialisation – the increasing 535 * Earlier versions of this paper were presented at the 2011 American Sociological Association meeting and the Organizational Behavior Seminar at the College of Business, University of Illinois at Urbana-Champaign. Email: [email protected]
Transcript of CEO Compensation and Shareholder Value Orientation … 43_4/03 Taekjin Shin article.pdf · CEO...

The Economic and Social Review, Vol. 43, No. 4, Winter, 2012, pp. 535–559
CEO Compensation and Shareholder ValueOrientation Among Large US Firms*
TAEKJIN SHINUniversity of Illinois, USA
Abstract: The rise of shareholder value orientation among US firms has been studied extensivelyduring the past few decades as a key component of financialisation. The firm-level mechanisms ofhow such institutional changes have affected firm behaviours are not well understood, however.This study examines the relationship between the shareholder value orientation of firms andfinancial rewards for the executive managers who run those companies. Using compensation datafor 290 CEOs for an 11-year period, I demonstrate that CEOs at the firms with the appearance ofshareholder value orientation – such as monitoring and incentive-alignment mechanisms –receive greater compensation than non-shareholder-value-orientation CEOs. Moreover, when thefirms strengthen the appearance of shareholder value orientation, CEO pay increases thesubsequent year. This suggests that firms adopt monitoring and incentive-alignment mechanismsin order to gain the appearance of shareholder value orientation rather than to curb executivecompensation. By employing such symbolic management tactics, top managers at such firms earngreater legitimacy, a better reputation, and a higher valuation of the firms and executive talent.The findings suggest that executive compensation has played an important role in providingincentives for top managers to make strategic decisions that conform to the shareholder valuemaximisation principle.
I INTRODUCTION
Scholars have documented financialisation as a profound transformation ofthe American economy that occurred during the past three decades (Davis,
2009; Krippner, 2005, 2011; Tomaskovic-Devey and Lin, 2011). Whereasvarious institutional backgrounds that led to financialisation – the increasing
535
* Earlier versions of this paper were presented at the 2011 American Sociological Associationmeeting and the Organizational Behavior Seminar at the College of Business, University ofIllinois at Urbana-Champaign.Email: [email protected]
03 Taekjin Shin article_ESRI Vol 43-4 10/12/2012 15:51 Page 535

importance of financial firms and the increasing involvement of non financialfirms in financial activity – have been extensively studied (Davis, 2009;Krippner, 2011; Tomaskovic-Devey and Lin, 2011), the exact mechanisms thatunderlie these processes remain unclear. The main reason is because most ofthe discussions so far have relied on the analyses at the level of economies(Hacker and Pierson, 2010; Krippner, 2005) or industries (Tomaskovic-Deveyand Lin, 2011), whereas the scholars have increasingly recognised the need forfirm-level research that explores how firms changed strategies and structureas both the causes and consequences of financialisation (Krippner, 2005).
This study examines firm-level dynamics that contributed to thefinancialisation of the US economy. More specifically, this paper analyses therelationship between shareholder value orientation – a key component offinancialisation in the contemporary context – and the financial rewards forcorporate executives. Shareholder value orientation is the managementprinciple that emerged during the 1980s and 1990s as a dominant model ofcorporate governance in the American business community (Dobbin and Jung,2010; Fligstein and Shin, 2007; Goldstein, 2012; Lazonick and O’Sullivan,2000). As a collective norm or ideology, shareholder value orientation urges topmanagers to focus solely on maximising financial returns for corporateinvestors. The increased focus on financial metrics, such as share prices anddividends, is an integral part of financialisation, in which non financial firmsreallocate their investment and business operations away from traditionalproduction processes and increasingly towards finance-related activities(Krippner, 2005; Tomaskovic-Devey and Lin, 2011). Understanding how suchnon financial firms have become increasingly more finance-oriented in theirstrategies and structure requires an analysis of the incentives and rewards forthe top decision-makers at these firms. This study shows that (1) executivemanagers are financially rewarded for espousing shareholder value principles;(2) they adopt certain kinds of practices and strategies that they know willsignal the board and investors that they conform with shareholder valueprinciples such as monitoring and incentive alignment mechanisms, and; (3)the adoption of these practices and strategies increase their legitimacy andapproval, and in return their compensation, regardless of the quality of theirperformance.
Compensation for executive managers at publicly traded companies hasattracted much attention from scholars in various disciplines, includingeconomics (Jensen and Murphy, 1990a; Hall and Murphy, 2003), sociology(Allen, 1981; DiPrete, Eirich, and Pittinsky, 2010), and management (Devers,Cannella, Reilly, and Yoder, 2007; Finkelstein, Hambrick, and Cannella, 2009).Despite a large volume of research, a fundamental question is yetunanswered: Why is executive compensation still going unchecked? In other
536 THE ECONOMIC AND SOCIAL REVIEW
03 Taekjin Shin article_ESRI Vol 43-4 10/12/2012 15:51 Page 536

words, why do CEOs at poorly performing companies continue to receive heftypay, as exorbitant pay packages for executives at banks and automobilecompanies with poor performance have often became headline news in recentyears? This has puzzled critics (e.g., Crystal, 1991) and academics (e.g., Jensenand Murphy, 1990b) who have advocated reforms that would have arguablycorrected the executive pay system. Their suggestions were based on twoprinciples: more effective monitoring of executive behaviours and tighteralignment of executive incentives to those of shareholders. According to thislogic, firms should strengthen the monitoring system to ensure that theexecutives do not abuse their power to influence the pay settings. Boards ofdirectors, and more increasingly these days, large institutional investors, areexpected to perform such monitoring. Incentives are the other side of the story.Financial economists have argued that executive compensation should bedesigned so that it would align the incentives of the managers to those of theowners. Only when the managers see their own money at risk, would theyhave the incentives not to waste shareholders’ money on inefficient, wastefulprojects and instead focus their efforts on maximising shareholder value,which is tied to their own personal wealth.
In this paper, I show that the two principles of effective monitoring andincentive alignment have failed to prevent the continuing rise of executivecompensation and the decoupling of pay from performance. Drawing insightsfrom institutional theory (DiMaggio and Powell, 1983; Meyer and Rowan,1977), I argue that firms adopt monitoring mechanisms and incentivecompensation policies, not because of the inherent efficiency benefits of suchmechanisms, but because of the institutional pressure from influentialexternal constituents such as activist investors, investment fund managers,and security analysts. Monitoring and incentives not only fail to preventexecutive entrenchment and excessive pay awards, but the adoption ofmonitoring and incentive mechanisms make the firms appear in conformity toshareholder preferences and grant them more legitimacy in the eyes of theinvestors and the board. The competencies of the executives at such firms arefavourably evaluated. To reward and to retain such executives within thecompany, the firms award them greater compensation packages. As aconsequence, the appearance of effective monitoring and incentive alignmentplays a role in justifying the surge of pay for those who were deemed to deserveit, rather than functioning as a curb on executive excess.
To empirically demonstrate this, I analyse compensation data for 290CEOs from non financial US firms for the period of 1996–2006. Firms thatadopted monitoring mechanisms and incentive compensation plans, followingthe diagnosis from shareholder advocates and financial economists, areidentified by examining the board composition, institutional investor
CEO COMPENSATION AND SHAREHOLDER VALUE 537
03 Taekjin Shin article_ESRI Vol 43-4 10/12/2012 15:51 Page 537

ownership, and the structure of executive compensation packages. I labelthese firms as shareholder value orientation firms, because thesecharacteristics together aim to maximise shareholder value and curbmanagerial entrenchment. Contrary to financial economists’ argument, theresults indicate that CEO compensation is greater at firms with a strongerdisplay of shareholder value orientation than at non-shareholder-value firms.Also inconsistent with financial economists’ prediction is that executive pay isnot more sensitive to firm performance at shareholder value orientation firmsthan at non-shareholder-value firms. These findings suggest that somethingother than effective monitoring and incentive alignment is at work. Consistentwith the alternative view that I develop in this paper, firms that appear tostrengthen the shareholder value orientation – namely by enhancingmonitoring and incentive pay systems – increase the CEO pay in thesubsequent period. Shareholder value mechanisms did not curb the surge ofpay; rather, it preceded the CEO pay raise.
This study contributes to organisational theory and economic sociology bydemonstrating the impact of the transformation of corporate control thatoccurred during the past few decades (Davis, Diekmann, and Tinsley, 1994;Davis and Thompson, 1994; Fligstein, 2001; Useem, 1996). Scholars who areinterested in the issue of corporate control have observed the rise ofshareholder value as the primary goal of the public corporation (Fligstein,2001; Lazonick and O’Sullivan, 2000). For the advocates of shareholderprimacy, excessive executive pay has been a frequent target of criticism. Alongwith corporate scandals, exorbitant CEO pay and the lack of pay-for-performance have become symbols of executive excess and managerialentrenchment, which have provided an opportune rationale for shareholderadvocates and activist investors to demand managerial accountability andshareholder rights. If shareholder primacy should have weakened executivepower, why has executive pay continued to rise even at firms with poorperformance? This paper provides an answer: executive compensation playedan important role in rewarding the managers based on their appearance ofconformity to shareholder value mandates. CEOs who adopted governancereform programmes were handsomely rewarded, regardless of actual firmperformance. While organisational scholars have illustrated the role ofexternal constituencies – such as the government, investors, and stockanalysts – in this process (e.g., Useem, 1996; Zorn, 2004; Zuckerman, 2000), itremained unclear what roles top managers played. In this paper, I argue thattop managers played an active role and strategically used symbolicmanagement tactics to gain shareholders’ approval and improve legitimacy inexecutive compensation policies. These managers were financially rewardedfor doing this.
538 THE ECONOMIC AND SOCIAL REVIEW
03 Taekjin Shin article_ESRI Vol 43-4 10/12/2012 15:51 Page 538

II SHAREHOLDER VALUE ORIENTATION AND CEO COMPENSATION:FINANCIAL ECONOMIC PERSPECTIVE
So far, the academic literature on executive compensation has beendominated by a financial economic perspective, particularly, an agency theoryperspective (Fama and Jensen, 1983; Jensen and Meckling, 1976). Agencytheory starts from Berle and Mean’s (1932) classic observation that theownership of large, modern corporations is largely separated from the actualday-to-day control of the organisation. Professional managers who are notowners of the firm are appointed to control the capital and assets of theowners. In this situation, managers, as agents of the owners, have incentivesto use the assets in ways that are not necessarily in the best interests of theowners. Agency theorists apply the economic view of human behaviour thatmanagers are apt to seek their own self-interests, even at the cost ofshareholder wealth. Examples of such discretionary activities that arewasteful to shareholders include managers’ obsession to acquire unrelatedbusinesses to build unprofitable conglomerates and their exercise of influenceover the process of compensation setting.
Agency theory suggests that firms adopt governance mechanisms in orderto mitigate this problem and to reduce the inefficiencies. Two types ofgovernance mechanisms are widely proposed. First, executive behaviours needto be closely monitored to ensure that they act in a way that would maximiseshareholder wealth. A board of directors is traditionally responsible for such amonitoring task. Since shareholders do not and cannot actively involvethemselves in the day-to-day operations of the company, they elect directors tomonitor the business, advise the management, and advocate shareholderinterests. Their primary duties and rights include the decisions about theappointment, compensation, and termination of executive managers. In sum,a board of directors is considered one of the most important governancemechanisms to mitigate the agency problem and to advocate shareholdervalue, at least in theory.
To strengthen the monitoring power of boards of directors, agencytheorists and shareholder value advocates argue for board independence,which in practice means appointing more outsiders to the board (Fama andJensen, 1983). The advocates maintain that outsiders are better able tomonitor, evaluate, and challenge managers than are insiders; thus, boardscomposed largely of outsiders function as an effective monitoring mechanism.Therefore, agency theorists suggest that firms with more powerful,independent boards would more effectively prevent excessive executive paypackages and more tightly link executive pay to actual performance, comparedto firms with weaker boards. In a meta-analysis of 219 studies, van Essen,
CEO COMPENSATION AND SHAREHOLDER VALUE 539
03 Taekjin Shin article_ESRI Vol 43-4 10/12/2012 15:51 Page 539

Otten, and Carberry (2012) showed that the proportion of outsiders on theboard is positively associated with the sensitivity of CEO pay to firmperformance.
Large institutional investors constitute another monitoring mechanismthat has gained power in recent decades (Useem, 1996). The percentage ofcorporate shares held by institutional investors such as pension funds, mutualfunds, and insurance companies increased from 25 per cent in 1980 to 50 percent by the early 1990s and to nearly 60 per cent by 2000 (Zorn, Dobbin,Dierkes and Kwok, 2005). Compared to scattered individual investors, largeinstitutional investors have a greater ability to monitor corporate operationsand managerial behaviour, communicate with management and the board,and when necessary, coordinate actions of intervention. One of the ways inwhich they pressure management is to sponsor shareholder resolutions ontopics such as corporate governance and firm strategy. Executivecompensation has become the most frequently addressed issue in suchresolutions (Gillan and Starks, 2007). As outsider monitors, large institutionalowners may affect the amount and the structure of executive compensation. Ina study of executive compensation at nearly 2,000 firms, Hartzell and Starks(2003) found that the concentration of institutional ownership is negativelyassociated with the level of executive pay and positively associated with thesensitivity of pay to performance. In the meta-analysis mentioned previously,van Essen et al. (2012) showed that institutional ownership is positivelyrelated to performance-pay sensitivity for CEOs.
Whereas monitoring by either boards or institutional investors is one kindof mechanism that mitigates the agency problem and curbs executivecompensation, the other important mechanism is to align managerialincentives with shareholder interests. To achieve incentive alignment, firmsintroduce compensation packages that link managerial pay to performance.There are a few ways to design a pay package to reflect performance.Commonly, executive bonuses have specific terms and conditions thatdetermine the amount based on the future performance of the firm, often inaccounting and financial performance metrics. Firms can directly awardcompany stocks, often with certain restrictions, so that executives can actuallybecome shareholders. Also popular are stock options, which provide executiveswith the right to purchase company stocks at a pre-determined price at pre-determined time in the future, thereby giving executives incentives to booststock price (Murphy, 1999).
Agency theorists have long advocated greater use of pay packages thatalign managerial incentives with shareholder value (Hall and Murphy, 2003;Jensen and Murphy, 1990b). The theory implies that if the incentivealignment is effective, the level of executive pay should be on average
540 THE ECONOMIC AND SOCIAL REVIEW
03 Taekjin Shin article_ESRI Vol 43-4 10/12/2012 15:51 Page 540

lower after controlling for firm performance. This is because most of thevariations in pay should be accounted for by variations in performance, sothere is relatively little room for managerial excess. Another implication ofincentive alignment is that executive compensation is tied to firmperformance. Many academic studies based on the agency theory perspectivemeasured the sensitivity of executive pay to firm performance (Hall andLiebman, 1998; Jensen and Murphy, 1990a; Murphy, 1999). An influentialstudy by Jensen and Murphy (1990a) reported that the pay-performancesensitivity was too low; CEO compensation increased by a mere $3.25 for every$1,000 increase in shareholder wealth. Citing this result, agency theoristscalled for greater pay-performance sensitivity and more effective incentivealignment, most notably by using stock options and other equity-basedcompensation plans.
Taken together, monitoring and incentive-alignment mechanisms aim tostrengthen shareholders’ power and control over management. The explicitrationale behind the shareholder power argument is to minimise managers’potential to waste company assets and to maximise shareholder wealth.Implicit in the argument is that maximisation of shareholder wealth is theprimary goal of public corporations. Agency theorists argue that shareholdersare the residual claimants of the corporations (Fama and Jensen, 1983). Sinceshareholders receive the residual gain from the business and bear the residualrisk associated with the corporate enterprise, they have the greatestincentives to ensure efficient operation of the company. Therefore, theargument goes, maximising shareholder value is equivalent to maximising thevalue of corporations, and it should be the most important goal of corporations(Jensen, 2001; Sundaram and Inkpen, 2004).
Since the two mechanisms – monitoring and incentives – generally aim toachieve the common goal of strengthening shareholder power and maximisingshareholder value, I formulate two hypotheses that link governancemechanisms and executive compensation.
Hypothesis 1. The level of CEO compensation is lower at firms withgreater monitoring abilities and a greater use of incentive compensationthan at firms with less monitoring abilities and less use of incentivecompensation.
Hypothesis 2. The sensitivity of CEO compensation to firm performanceis greater at firms with greater monitoring abilities and a greater use ofincentive compensation than at firms with less monitoring abilities andless use of incentive compensation.
CEO COMPENSATION AND SHAREHOLDER VALUE 541
03 Taekjin Shin article_ESRI Vol 43-4 10/12/2012 15:51 Page 541

III AN INSTITUTIONAL PERSPECTIVE: SYMBOLIC MANAGEMENTAND REWARDS FOR CONFORMITY
While agency theory is dominant in the literature, there are scholars whoquestion the theory. First, critics argue that board monitoring has not beeneffective in reality. Even with an increased number of outsiders, directors onboards are still under considerable influence from management. Studies havefound that social, psychological, and political dynamics between directors andexecutive managers often affect director behaviours and the functioning of theboard (Bebchuk and Fried, 2004; O’Reilly and Main, 2010; Wade, O’Reilly, andChandratat, 1990). Institutional investors, on the other hand, may also havelimited influence over the actual decision-making process of corporations.Davis (2008) illustrated that even the largest mutual funds are reluctant toexercise influence over corporate management. Contrary to agency theory’sprediction, Hartzell and Starks (2003) found that the level of institutionalownership is positively associated with the level of executive compensation atS&P 1,500 firms. This suggests that despite the call for strengthening externalmonitoring, corporate executives still maintain a considerable degree ofdiscretion and influence over the executive pay settings (Bebchuk and Fried,2004).
To agency theorists’ disappointment, the actual evolution of executivecompensation has not been very responsive to the corporate governancereforms that strengthened monitoring and incentive alignment. While majorcorporations have increasingly appointed more and more outside directors andincreased institutional investor ownership, the level of executive compensa -tion has continued to rise, except for the brief period after the burst of the dot-com bubble in the early 2000s (Bebchuk and Grinstein, 2005). Despite agreater use of incentive pay systems such as restricted stock grants and stockoptions, the sensitivity of pay to performance has remained disappointinglylow (Tosi, Werner, Katz, and Gomez-Mejia, 2000). Excessive pay packages forexecutives at poorly performing companies have often become headline news.
To account for the continued rise of executive pay despite governancereforms, I propose an alternative explanation. It draws from two relatedthoughts in organisational theory: (1) decoupling of institutionalised practicefrom the actual implementation of the practice, and (2) symbolic managementof external constituencies. First, neo-institutional theory suggests thatorganisations often adopt new practices and policies not from internalmotivation to innovate and change, but from external influence (Meyer andRowan, 1977; DiMaggio and Powell, 1983). When organisations adopt newpractices due to such external forces, they tend to eschew total commitment tothe new practices. Rather, organisations seek ways to preserve many of its
542 THE ECONOMIC AND SOCIAL REVIEW
03 Taekjin Shin article_ESRI Vol 43-4 10/12/2012 15:51 Page 542

own characteristics from the past, while presenting the appearance of change.Meyer and Rowan (1977) called this “decoupling” of formal structures fromactual activities. Empirical studies demonstrated that the adoption of a newpractice is often decoupled from its implementation (for a review, see Bromleyand Powell [2012]). For example, Westphal and Zajac (1994) found that firmsoften announce the adoption of long-term incentive plans for executivemanagers, but do not actually implement them. In a similar manner, adoptionof monitoring mechanisms may have also been decoupled from implementa -tion. Indeed, Westphal and Zajac (1998) showed that firms that successfullydecouple the adoption of long-term incentive plans from its implementationoften avoid board reforms, including the appointment of outside directors.
Second, related to the idea of decoupling, firms often adopt new practicesin order to gain approval from important external constituencies. Such effortsare focused on symbols and appearances rather than objective criteria (Pfeffer,1981). Symbolic management delivers considerable benefits to the firm,including greater legitimacy and a better reputation (Elsbach, 1994; Staw andEpstein, 2000). Consistent with this idea, Zajac and Westphal (2004) showedthat the stock market reacts favourably to firms that adopt share repurchaseplans as a mechanism to increase shareholder value. Valuation is significantlyaffected by the appearance of legitimacy, as Zuckerman (1999) demonstratedthat market valuation of the firms is shaped by the stock analysts’ perceptionof legitimacy. The appearance of legitimacy, rather than objective metrics, iseven more important in the valuation of executive skills, because it is difficultto determine how much changes in firm performance can really be attributedto top management (Lieberson and O’Connor, 1972; Pfeffer, 1977). As March(1984) suggested, ambiguity in evaluating managerial ability on the basis offirm performance may stimulate the management of accounts and reputationthrough symbolic management (Wade, Porac, and Pollock, 1997; Westphal andZajac, 1998).
The ideas of decoupling and symbolic management suggest that firms mayadopt monitoring and incentive-alignment mechanisms due to the pressurefrom external constituencies such as institutional investors, fund managers,and stock analysts who generally espouse shareholder value orientation. Theadoption of new governance mechanisms provides the firms with symboliclegitimacy and a better reputation among the external constituencies.However, firms engage in decoupling strategies to limit the impact of newgovernance mechanisms, so the actual effect of monitoring and incentives isminimal.
With successful decoupling and symbolic management, executives at thefirms with stronger governance mechanisms are perceived as more competentand trustworthy in the eyes of the directors and investors. As a consequence,
CEO COMPENSATION AND SHAREHOLDER VALUE 543
03 Taekjin Shin article_ESRI Vol 43-4 10/12/2012 15:51 Page 543

executive compensation is greater at the firms that instituted monitoring andincentive-alignment mechanisms. In this sense, greater executive pay is aform of rewards for the executives who conformed to shareholder valueorientation. The board members, particularly those who sit on thecompensation committee, may believe that such a reward is necessary toretain valuable executive talent, since the directors may feel that theshareholder value oriented CEOs are in great demand in the executive labormarket. If the compensation committee of the board acts on this perceivedneed for rewarding the executives, CEO compensation is expected to increasesubsequent to the adoption of and improvement in the governancemechanisms, controlling for any changes in firm performance and in any otherdeterminants of executive compensation. Following this logic, two hypothesesare proposed. Note that Hypothesis 3 is an alternative hypothesis ofHypothesis 1, an agency-theoretic prediction.
Hypothesis 3. The level of CEO compensation is higher at firms withgreater monitoring abilities and a greater use of incentive compensationthan at firms with less monitoring abilities and less use of incentivecompensation.
Hypothesis 4. Firms that strengthen their monitoring abilities andincrease the use of incentive compensation increase the executive pay inthe subsequent time period.
IV DATA AND METHODS
To test these hypotheses, I analysed compensation data for 290 CEOs fromUS firms for the period of 1996–2006. Due to the regulatory changes in theSecurities and Exchange Commission (SEC) requirements for executivecompensation disclosure, where the compensation data for this study comefrom, post-2006 compensation data are not compatible with the data for theearlier period. The 11-year period (1996–2006) spans both economic boom andbust: the dot-com boom and bust, the 2001 recession, and the subsequentboom. To construct the sample, the largest (by revenue) 200 publicly tradedcompanies were selected from the Fortune 500 list for each year of the studyperiod. In total, 290 firms appeared on the list. I selected 272 firms thatappeared in the sample a minimum of three years. The analysis excluded 51firms in finance, insurance, and real estate (Standard Industrial Classification[SIC] codes 60-67), because the purpose of the study is to analyse thebehaviour of non-financial firms as the main actors of financialisation(Krippner, 2005).
544 THE ECONOMIC AND SOCIAL REVIEW
03 Taekjin Shin article_ESRI Vol 43-4 10/12/2012 15:51 Page 544

Two firms were dropped because their primary industry could not beclassified (SIC code 99). After excluding the firms that do not have completeinformation on all variables, the final sample included 178 firms, or 960 firm-year observations. The t-tests suggest that total sales and the number ofemployees are not significantly different at the 5 per cent level between thefinal sample and the non-selected top-200 firms on the Fortune lists. Twohundred and ninety CEOs led the sample firms during the study period. Insome models, the number of observations is smaller due to missing values.
The dependent variable in the regression models is CEO compensation,defined as the logarithm of the total amount of annual compensation for eachCEO. The compensation measure includes salary, bonuses, the Black-Scholesvalue of stock option grants, restricted stock grants, and long-term incentiveplans. The regression models use the logarithm of the compensation to reducethe impact of extreme values.
The key independent variable is the monitoring and incentive-alignmentmechanisms. To construct a measure that effectively summarises the jointeffect of the disparate mechanisms, I used factor analysis to combine severalindicators of shareholder value orientation. Initially, the factor analysisincluded a wide selection of variables that broadly represent shareholdervalue orientation, such as the percentage of company shares held byinstitutional investors, the Herfindahl measure of concentration ofinstitutional ownership, the percentage of institutional ownership held by thetop-five investors, the percentage of outsiders on the board of directors, thepercentage of incentive pay (i.e., compensation components that arecontingent on future performance) in the CEO compensation package, theamount of dividends per share, and the number of business segments indifferent three-digit SIC industries. Dividends payout represents the firm’sdirect distribution of corporate profits to shareholders (Lazonick andO’Sullivan, 2000; Julio and Ikenberry, 2004). The number of businesssegments measures the level of corporate diversification, which has becomethe target of criticism as shareholder value proponents advocated forrefocusing on core competencies (Davis et al., 1994; Zuckerman, 2000).
Table 1 presents the result of a principal-components factor analysis witha Varimax rotation. Each variable loads unambiguously on a single factor at0.60 or greater. The first factor represents the concentration of institutionalownership: Herfindahl measure of institutional ownership concentration andthe percentage of institutional ownership held by the top-five investors. Notsurprisingly, these two variables are designed to measure a common concept:the concentration of institutional ownership. The second factor summarisesthe monitoring and incentive-alignment mechanisms: institutional ownership(percentage of shares held by institutional investors), board independence
CEO COMPENSATION AND SHAREHOLDER VALUE 545
03 Taekjin Shin article_ESRI Vol 43-4 10/12/2012 15:51 Page 545
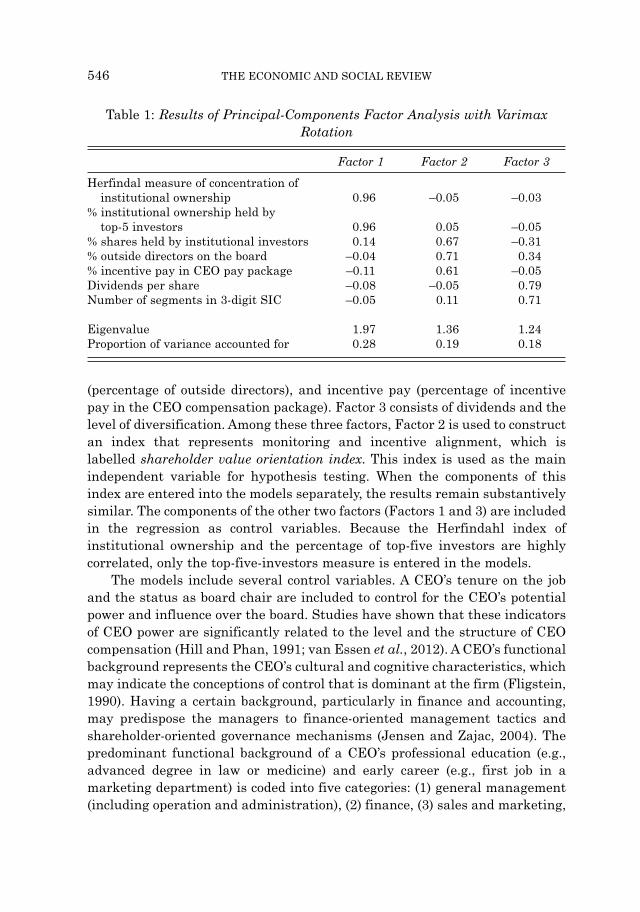
(percentage of outside directors), and incentive pay (percentage of incentivepay in the CEO compensation package). Factor 3 consists of dividends and thelevel of diversification. Among these three factors, Factor 2 is used to constructan index that represents monitoring and incentive alignment, which islabelled shareholder value orientation index. This index is used as the mainindependent variable for hypothesis testing. When the components of thisindex are entered into the models separately, the results remain substantivelysimilar. The components of the other two factors (Factors 1 and 3) are includedin the regression as control variables. Because the Herfindahl index ofinstitutional ownership and the percentage of top-five investors are highlycorrelated, only the top-five-investors measure is entered in the models.
The models include several control variables. A CEO’s tenure on the joband the status as board chair are included to control for the CEO’s potentialpower and influence over the board. Studies have shown that these indicatorsof CEO power are significantly related to the level and the structure of CEOcompensation (Hill and Phan, 1991; van Essen et al., 2012). A CEO’s functionalbackground represents the CEO’s cultural and cognitive characteristics, whichmay indicate the conceptions of control that is dominant at the firm (Fligstein,1990). Having a certain background, particularly in finance and accounting,may predispose the managers to finance-oriented management tactics andshareholder-oriented governance mechanisms (Jensen and Zajac, 2004). Thepredominant functional background of a CEO’s professional education (e.g.,advanced degree in law or medicine) and early career (e.g., first job in amarketing department) is coded into five categories: (1) general management(including operation and administration), (2) finance, (3) sales and marketing,
546 THE ECONOMIC AND SOCIAL REVIEW
Table 1: Results of Principal-Components Factor Analysis with VarimaxRotation
Factor 1 Factor 2 Factor 3
Herfindal measure of concentration of institutional ownership 0.96 –0.05 –0.03
% institutional ownership held by top-5 investors 0.96 0.05 –0.05
% shares held by institutional investors 0.14 0.67 –0.31% outside directors on the board –0.04 0.71 0.34% incentive pay in CEO pay package –0.11 0.61 –0.05Dividends per share –0.08 –0.05 0.79Number of segments in 3-digit SIC –0.05 0.11 0.71
Eigenvalue 1.97 1.36 1.24Proportion of variance accounted for 0.28 0.19 0.18
03 Taekjin Shin article_ESRI Vol 43-4 10/12/2012 15:51 Page 546
and (4) technical (e.g., engineering, medicine, etc.). General management isthe reference category omitted in the regression models. CEOs recruited fromoutside the firm start the job with a considerable bonus (Fee and Hadlock,2003; Elsaid and Davidson, 2009), so I control for such cases using an indicatorvariable for outsider CEOs. Studies have repeatedly demonstrated that firmsize and performance affect executive compensation (Tosi et al., 2000). Firmsize is measured in a logarithm of total sales. For firm performance, bothaccounting and market measures are used: return on assets (ROA) and one-year total shareholder returns. The shareholder returns measure is computedby dividing the sum of the change in stock price and dividends paid during theyear by the stock price at the beginning of the year. Dividends per share anddiversification level (measured by the number of business segments indifferent 3-digit SIC industries) are the other indicators of shareholder valueorientation that were not captured in the construction of the shareholdervalue orientation index. These two variables are entered into the model ascontrols. I also control for the concentration of institutional ownership(measured by the percentage of institutional ownership held by top-fiveinvestors), because this is not included in the construction of shareholdervalue orientation index. All dollar values are adjusted for inflation using theConsumer Price Index. Table 2 presents means, standard deviations, andPearson’s correlation coefficients for all variables.
Information on CEO compensation and characteristics came fromStandard and Poor’s ExecuComp database. Financial and operational data atthe firm level came from various sources including Compustat, MergentOnline, company annual reports, and various corporate directories. Boardcomposition data came from RiskMetrics Directors dataset and proxystatements. The information about institutional shareholding came fromThomson Financial’s 13f Institutional Holdings (CDA/Spectrum s34) data.Finally, the CEOs’ functional backgrounds were manually collected fromvarious sources including Dun and Bradstreet Reference Book of CorporateManagements, Who’s Who in Finance and Industry, and executive biographiesin BusinessWeek and Forbes.
The panel data consist of annually repeated observations for each firm.The unit of analysis is the firm-years. Because the annual observations fromthe same firm are likely to be correlated, the OLS regression would violate theassumption of independent observations. Therefore, random-effectsregressions with robust standard errors are estimated. A random-effects modeldecomposes the error terms into the part that is unique to the firms and thepart that is unique to the firm-years. Because a random-effects model uses theinformation about the variations within the firms across different time periodsand the variations between the firms, it is more efficient than a fixed-effects
CEO COMPENSATION AND SHAREHOLDER VALUE 547
03 Taekjin Shin article_ESRI Vol 43-4 10/12/2012 15:51 Page 547

548 THE ECONOMIC AND SOCIAL REVIEW
Mea
n
S.D
.1.
2.
3.
4.
5.
6.
7.
8.
9.
10
. 11
. 12
. 13
. 14
. 15
. 16
. 17
.
1.C
EO
com
pen
sati
on (
logg
ed)
8.96
0.87
2.C
EO
ten
ure
(in
yea
rs)
7.33
6.42
–0.0
6
3.C
EO
is c
hai
r (b
inar
y)0.
800.
400.
11*
0.22
*
4.C
EO
bac
kgro
un
d: g
ener
al (
bin
ary)
0.
490.
500.
03–0
.02
0.06
*
5.C
EO
bac
kgro
un
d: f
inan
ce (
bin
ary)
0.
120.
32–0
.01
–0.0
9*–0
.02
–0.3
6*
6.C
EO
bac
kgro
un
d: m
arke
tin
g an
d sa
les
(bin
ary)
0.
210.
40–0
.01
0.03
–0.1
3*–0
.50*
–0.1
9*
7.C
EO
bac
kgro
un
d: t
ech
nic
al (
bin
ary)
0.19
0.39
–0.0
10.
07*
0.07
*–0
.47*
–0.1
8*–0
.25*
8.O
uts
ider
CE
O (
bin
ary)
0.
21
0.41
0.
00
0.15
*0.
06
0.02
–0
.01
–0.0
5 0.
03
9.S
ales
(lo
gged
, 1-y
ear
lagg
ed)
9.89
0.
67
0.24
*–0
.12*
–0.0
4 –0
.04
0.03
–0
.08*
0.11
*0.
00
10.R
OA
(lo
gged
, 1-y
ear
lagg
ed)
0.05
0.
050.
09*
0.08
*–0
.06
–0.0
4 –0
.06
0.11
*–0
.01
–0.0
9*0.
05
11.T
otal
sh
areh
olde
r re
turn
s 0.
01
0.39
–0
.01
0.03
0.
04
–0.0
3 0.
04
–0.0
3 0.
04–0
.05
–0.0
6 –0
.10*
12.D
ivid
ends
per
sh
are
(1-y
ear
lagg
ed)
0.76
0.71
–0.0
1–0
.10*
0.17
*–0
.04
0.01
–0.1
1*0.
15*
–0.1
2*0.
07*
–0.0
1–0
.05
13.N
um
ber
of s
egm
ents
in d
iffe
ren
t 2.
131.
150.
14*
0.07
*0.
08*
0.14
*–0
.05
–0.1
6*0.
03–0
.04
0.15
*–0
.14*
–0.0
10.
24*
3-di
git
SIC
s (1
-yea
r la
gged
)
14.I
nst
itu
tion
al o
wn
ersh
ip c
once
ntr
atio
n
34.0
79.
73–0
.19*
0.06
0.05
–0.0
10.
06–0
.01
–0.0
20.
11*
–0.1
9*–0
.38*
0.09
*–0
.11*
–0.0
9*(%
inst
itu
tion
al o
wn
ersh
ip h
eld
by
top-
5 in
vest
ors,
1-y
ear
lagg
ed)
15.%
sh
ares
hel
d by
inst
itu
tion
al63
.91
14.8
30.
050.
020.
03–0
.04
0.08
*0.
06–0
.08*
–0.0
2–0
.16*
–0.1
1*–0
.01
–0.1
7*–0
.03
0.15
*in
vest
ors
(1-y
ear
lagg
ed)
16.%
ou
tsid
e di
rect
ors
(1-y
ear
lagg
ed)
69.8
615
.75
0.16
*–0
.10*
0.24
*0.
05–0
.02
–0.1
5*0.
11*
–0.0
9*0.
09*
–0.0
50.
060.
18*
0.16
*–0
.01
0.18
*
17.%
ince
nti
ve p
ay in
CE
O p
ay p
acka
ge
61.3
124
.36
0.30
*–0
.06
0.06
*–0
.05
–0.0
40.
030.
07*
–0.0
9*0.
09*
–0.0
3–0
.08*
–0.0
20.
04–0
.07*
0.06
0.17
*(1
-yea
r la
gged
)
18.S
har
ehol
der
valu
e or
ien
tati
on in
dex
–0.1
00.
990.
25*
–0.0
8*0.
18*
–0.0
10.
01–0
.04
0.05
–0.1
0*0.
02–0
.10*
–0.0
10.
010.
10*
0.03
0.62
*0.
74*
0.59
*(f
acto
r sc
ale,
1-y
ear
lagg
ed)
* p<
0.0
5.
Tab
le 2
: Mea
ns,
Sta
nd
ard
Dev
iati
ons
and
Cor
rela
tion
s
03 Taekjin Shin article_ESRI Vol 43-4 10/12/2012 15:51 Page 548
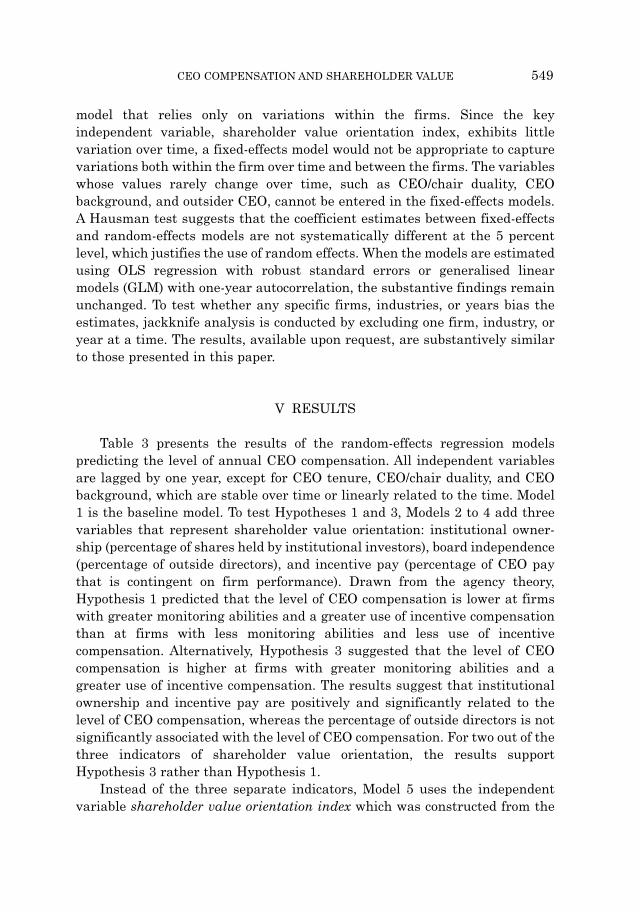
model that relies only on variations within the firms. Since the keyindependent variable, shareholder value orientation index, exhibits littlevariation over time, a fixed-effects model would not be appropriate to capturevariations both within the firm over time and between the firms. The variableswhose values rarely change over time, such as CEO/chair duality, CEObackground, and outsider CEO, cannot be entered in the fixed-effects models.A Hausman test suggests that the coefficient estimates between fixed-effectsand random-effects models are not systematically different at the 5 percentlevel, which justifies the use of random effects. When the models are estimatedusing OLS regression with robust standard errors or generalised linearmodels (GLM) with one-year autocorrelation, the substantive findings remainunchanged. To test whether any specific firms, industries, or years bias theestimates, jackknife analysis is conducted by excluding one firm, industry, oryear at a time. The results, available upon request, are substantively similarto those presented in this paper.
V RESULTS
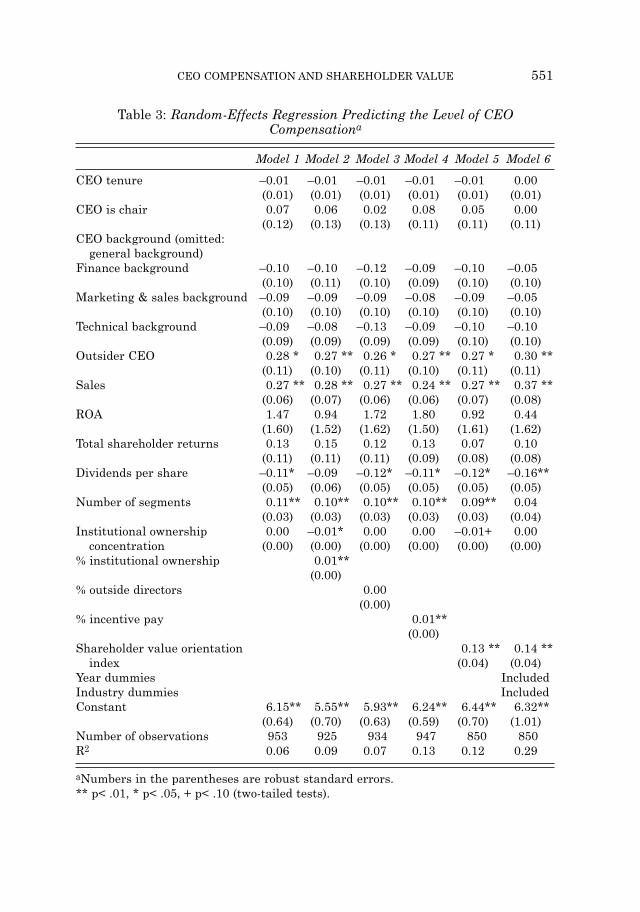
Table 3 presents the results of the random-effects regression modelspredicting the level of annual CEO compensation. All independent variablesare lagged by one year, except for CEO tenure, CEO/chair duality, and CEObackground, which are stable over time or linearly related to the time. Model1 is the baseline model. To test Hypotheses 1 and 3, Models 2 to 4 add threevariables that represent shareholder value orientation: institutional owner -ship (percentage of shares held by institutional investors), board independence(percentage of outside directors), and incentive pay (percentage of CEO paythat is contingent on firm performance). Drawn from the agency theory,Hypothesis 1 predicted that the level of CEO compensation is lower at firmswith greater monitoring abilities and a greater use of incentive compensationthan at firms with less monitoring abilities and less use of incentivecompensation. Alternatively, Hypothesis 3 suggested that the level of CEOcompensation is higher at firms with greater monitoring abilities and agreater use of incentive compensation. The results suggest that institutionalownership and incentive pay are positively and significantly related to thelevel of CEO compensation, whereas the percentage of outside directors is notsignificantly associated with the level of CEO compensation. For two out of thethree indicators of shareholder value orientation, the results supportHypothesis 3 rather than Hypothesis 1.
Instead of the three separate indicators, Model 5 uses the independentvariable shareholder value orientation index which was constructed from the
CEO COMPENSATION AND SHAREHOLDER VALUE 549
03 Taekjin Shin article_ESRI Vol 43-4 10/12/2012 15:51 Page 549

factor analysis. The variable shareholder value orientation index representsthe strength of monitoring and incentive alignment. Contrary to Hypothesis 1,CEO compensation is greater at firms with a higher value of shareholdervalue orientation. This supports the alternative hypothesis, Hypothesis 3.This suggests that firms with shareholder value orientation mechanisms –such as monitoring and incentive alignment – do not effectively curb executivecompensation. On the contrary, such firms pay their CEOs more than didother firms. This result is consistent with the argument that firms espouseshareholder value orientation not to limit managerial power, but to gainapproval and legitimacy in the eyes of those who evaluate the quality of topmanagement. This is not due to the possibility that firms with shareholdervalue orientation may have higher firm performance, thereby increasing thevalue of equity-based compensation for the executives, because the modelcontrols for firm performance both in accounting and market metrics. Model 6adds dummy variables for year and 2-digit SIC industries, whose coefficientsare not presented due to space constraints. The results are substantivelysimilar to those of Model 5.
Turning to the test of Hypotheses 2 and 4, random-effects models areestimated to predict annual changes in CEO compensation from year t-1 to t.Table 4 presents the results. Since the dependent variable is the changebetween two years, the models include both the level and the annual changesin the independent variables. The change in CEO tenure is not includedbecause every year, CEO tenure increases by one. Shareholder returnsvariable is not transformed into the annual change form, because thedefinition of shareholder returns already includes the changes in stock pricebetween two years. The models include a dummy variable for CEOs recruitedfrom outside the firm.
Models 1 to 4 in Table 4 test Hypothesis 2, which predicted that firms withshareholder value orientation – measured by greater monitoring abilities anda greater use of incentive compensation – have a greater pay-performancesensitivity than do other firms. This was drawn from the agency theory. I testthis hypothesis by using interaction terms between firm performance and theshareholder value orientation index. Models 1 and 2 use an accountingmeasure of performance: ROA. In Models 3 and 4, a market-based measure isused: total shareholder returns. Models 2 and 4 add dummy variables for yearand 2-digit SIC industries. In Models 1 to 4, the interaction terms are notstatistically significant, contrary to agency theory’s prediction (Hypothesis 2).Models 5 and 6 test Hypothesis 4, which was drawn from an alternativeexplanation based on the idea of institutional decoupling and symbolicmanagement. Model 6 includes dummy variables for year and 2-digit SICindustries. Supporting Hypothesis 4, CEO compensation increases subsequent
550 THE ECONOMIC AND SOCIAL REVIEW
03 Taekjin Shin article_ESRI Vol 43-4 10/12/2012 15:51 Page 550
CEO COMPENSATION AND SHAREHOLDER VALUE 551
Table 3: Random-Effects Regression Predicting the Level of CEOCompensationa
Model 1 Model 2 Model 3 Model 4 Model 5 Model 6
CEO tenure –0.01 –0.01 –0.01 –0.01 –0.01 0.00 (0.01) (0.01) (0.01) (0.01) (0.01) (0.01)
CEO is chair 0.07 0.06 0.02 0.08 0.05 0.00 (0.12) (0.13) (0.13) (0.11) (0.11) (0.11)
CEO background (omitted: general background)
Finance background –0.10 –0.10 –0.12 –0.09 –0.10 –0.05 (0.10) (0.11) (0.10) (0.09) (0.10) (0.10)
Marketing & sales background –0.09 –0.09 –0.09 –0.08 –0.09 –0.05 (0.10) (0.10) (0.10) (0.10) (0.10) (0.10)
Technical background –0.09 –0.08 –0.13 –0.09 –0.10 –0.10 (0.09) (0.09) (0.09) (0.09) (0.10) (0.10)
Outsider CEO 0.28 * 0.27 ** 0.26 * 0.27 ** 0.27 * 0.30 ** (0.11) (0.10) (0.11) (0.10) (0.11) (0.11)
Sales 0.27 ** 0.28 ** 0.27 ** 0.24 ** 0.27 ** 0.37 ** (0.06) (0.07) (0.06) (0.06) (0.07) (0.08)
ROA 1.47 0.94 1.72 1.80 0.92 0.44 (1.60) (1.52) (1.62) (1.50) (1.61) (1.62)
Total shareholder returns 0.13 0.15 0.12 0.13 0.07 0.10 (0.11) (0.11) (0.11) (0.09) (0.08) (0.08)
Dividends per share –0.11* –0.09 –0.12* –0.11* –0.12* –0.16** (0.05) (0.06) (0.05) (0.05) (0.05) (0.05)
Number of segments 0.11** 0.10** 0.10** 0.10** 0.09** 0.04 (0.03) (0.03) (0.03) (0.03) (0.03) (0.04)
Institutional ownership 0.00 –0.01* 0.00 0.00 –0.01+ 0.00concentration (0.00) (0.00) (0.00) (0.00) (0.00) (0.00)
% institutional ownership 0.01** (0.00)
% outside directors 0.00 (0.00)
% incentive pay 0.01** (0.00)
Shareholder value orientation 0.13 ** 0.14 **index (0.04) (0.04)
Year dummies Included Industry dummies Included Constant 6.15** 5.55** 5.93** 6.24** 6.44** 6.32**
(0.64) (0.70) (0.63) (0.59) (0.70) (1.01) Number of observations 953 925 934 947 850 850 R2 0.06 0.09 0.07 0.13 0.12 0.29
aNumbers in the parentheses are robust standard errors. ** p< .01, * p< .05, + p< .10 (two-tailed tests).
03 Taekjin Shin article_ESRI Vol 43-4 10/12/2012 15:51 Page 551

to the increase in the shareholder value orientation index. This suggests thatwhen a firm strengthens governance mechanisms that aim to maximiseshareholder value, the CEO is financially rewarded in the subsequent year,controlling for the changes in performance. Such a pay raise is hard tointerpret as incentive alignment, as agency theorists would argue. For this to
552 THE ECONOMIC AND SOCIAL REVIEW
Table 4: Random-Effects Regression Predicting the Annual Changes in CEOCompensationa
Model 1 Model 2 Model 3 Model 4 Model 5 Model 6
CEO tenure –0.01 –0.01 –0.01 –0.01 0.00 0.00 (0.01) (0.01) (0.01) (0.01) (0.00) (0.00)
Outsider CEO 0.00 0.01 0.01 0.01 –0.02 0.00 (0.09) (0.09) (0.09) (0.09) (0.04) (0.04)
Sales 0.01 0.01 0.01 0.01 –0.01 0.04* (0.03) (0.04) (0.03) (0.04) (0.02) (0.02)
ΔSales 0.18 0.11 0.19 0.12 0.41** 0.44** (0.19) (0.19) (0.19) (0.19) (0.13) (0.14)
ROA –1.04 –1.22 –1.05 –1.21 0.02 0.72 (1.59) (1.77) (1.58) (1.77) (0.34) (0.45)
ΔROA 1.42 1.17 1.34 1.11 0.57 0.74 (1.02) (0.99) (1.03) (0.99) (0.86) (0.85)
Total shareholder returns 0.20* 0.24* 0.17 + 0.23* 0.13* 0.15 + (0.09) (0.10) (0.09) (0.10) (0.07) (0.08)
Institutional ownership –0.01 0.00 –0.01 0.00 0.00* 0.00concentration (0.00) (0.00) (0.00) (0.00) (0.00) (0.00)
ΔInstitutional ownership –0.02** –0.01** –0.02** –0.01** –0.01** –0.01* concentration (0.01) (0.01) (0.01) (0.01) (0.00) (0.00)
Shareholder value –0.25** –0.27** –0.25** –0.28** –0.01 0.03+orientation index (0.03) (0.04) (0.03) (0.04) (0.02) (0.02)
ΔROA x Shareholder value 0.75 0.71orientation index (1.25) (1.22)
Total sharehold returns x –0.04 –0.02Shareholder value (0.05) (0.05)orientation index
Δ(Shareholder value 0.76** 0.83** orientation index) (0.05) (0.05)
Year dummies Included Included Included Industry dummies Included Included Included Constant 0.21 0.72 0.21 0.75 + 0.15 –0.59*
(0.34) (0.44) (0.34) (0.44) (0.21) (0.25) Number of observations 960 960 960 960 936 936 R2 0.08 0.11 0.08 0.11 0.40 0.45
aNumbers in the parentheses are robust standard errors. ** p< 0.01, * p< 0.05, + p< 0.10 (two-tailed tests).
03 Taekjin Shin article_ESRI Vol 43-4 10/12/2012 15:51 Page 552

be true incentives for better performance, CEO pay raises should be associatedwith increases in firm performance. This was not the case, as Hypothesis 2was not supported (see Models 1 to 4 in Table 4). Rather, it is more plausibleto view this raise as a reward for CEOs who adopt shareholder valueorientation and thus gain shareholder approval and external legitimacy.
VI DISCUSSIONS AND CONCLUSION
This study has several important contributions. First, at the more generallevel, the findings of this study shed light on the financialisation of the USeconomy. The sources of financialisation have often been attributed to societal-or institutional-level changes such as deregulation and neo-liberal publicpolicies (Krippner, 2011; Tomaskovic-Devey and Lin, 2011). Whereas there isno doubt that such macro-level changes played crucial roles, the actual processof financialisation in non-financial firms was undertaken by the firms and,more precisely, their top decision makers. Without understanding the motivesand incentives of these key actors of financialisation, it is difficult to reconcilethe paradox that shareholder value reforms challenging managerial powercoincided with the continuous increase in managerial income (Goldstein,2012). Corporate executives participated in the parallel processes of bothfinancialisation and the shareholder value revolution. By carrying out theshareholder value mantra, the executives have redistributed corporateresources and profits away from traditional business and toward finance-related activities such as mergers and acquisitions, leveraged buyouts, andstock repurchases (Davis et al., 1994; Fligstein, 2001; Zajac and Westphal,2004). For this, they were handsomely rewarded.
Second, the study offers an explanation for the continuing rise in executivecompensation despite the widespread adoption of governance reforms thataimed to strengthen monitoring and incentive alignment. Whereas financialeconomists and activist investors have advocated adopting governancemechanisms that strengthen monitoring and incentive alignment, executivecompensation has continued to rise without a strong link to performance.Here, I proposed an alternative explanation that firms adopt monitoring andincentive-alignment mechanisms in order to gain the appearance ofshareholder value orientation. By employing such symbolic managementtactics, top managers at such firms earn legitimacy and a better reputation inthe eyes of those who favourably evaluate executive managers. In theempirical analysis, I demonstrated that CEOs at the firms with theappearance of shareholder value orientation – such as monitoring andincentive-alignment mechanisms – received greater pay packages than did
CEO COMPENSATION AND SHAREHOLDER VALUE 553
03 Taekjin Shin article_ESRI Vol 43-4 10/12/2012 15:51 Page 553

other CEOs with weaker shareholder value orientation. In addition, when thefirms strengthened the appearance of shareholder value orientation, CEO payincreased in the subsequent year, controlling for any changes in performance.These findings suggest that the firms were subject to significant pressure toconform to the shareholder value orientation, but top executives were strategicenough to manage symbolically the external, institutional pressures to theiradvantage. Governance mechanisms that aimed to strengthen shareholders’power and control over the management were largely decoupled from thepractice. Executives maintained, and in some sense strengthened, their powerand discretion by espousing the dominant business principle of shareholdervalue maximisation. Even though the shareholder value ideology was initiallyproposed to curb managerial power, it may have paradoxically providedpowerful managers with a symbolic and rhetorical tool for accumulatingpersonal wealth. This may explain a significant part of the rise in CEOcompensation. Together with the recent studies that demonstrate howcompensation benchmarking among peer firms leads to a dramatic rise inCEO pay over time (DiPrete et al., 2010; Faulkender and Yang, 2010), thepresent study underscores the behavioural and institutional sources of the risein CEO compensation.
Third, the findings of this study suggest how prescriptions from aneconomic theory, particularly agency theory, were strategically adopted andmisapplied by firms. Agency theory provides normative prescriptions abouthow to reduce agency cost and maximise efficiencies. Although the theory maycorrectly state what firms should do, it fails to describe what American firmsactually do, as I demonstrate in this paper. I argue that American firmsfollowed agency theorists’ prescriptions and adopted governance practices thatare supposed to reduce agency cost and maximise shareholder value, but theiradoptions were largely symbolic and decoupled from actual effectiveness.Dobbin and Jung (2010) recently made a similar argument: Americancompanies selectively adopted agency theory’s prescriptions, embracingstrategies that increased firm risks while failing to adopt practices such asboard reforms that moderate risks. The current study complements thisargument and suggests that top managers who adopted agency theory’sprescriptions in a symbolic way were financially rewarded. This implies thatthe academic theory clearly went beyond the academia and provided asymbolic tool for top executives who realised the predominance of shareholdervalue ideology and gained financially for showing their conformity to thedominant ideology.
The study has significant implications for institutional theory as well.Institutional pressures such as the shareholder value principle may exist inthe organisational field, but the adoption and implementation of new
554 THE ECONOMIC AND SOCIAL REVIEW
03 Taekjin Shin article_ESRI Vol 43-4 10/12/2012 15:51 Page 554

organisational forms and practices require a substantial degree of power andresource mobilisation within the organisations. The shareholder valuerevolution aimed to curb managerial power that has prevailed in the Americancorporations for decades since Berle and Mean’s (1932) managerialism thesis,but the power and privileges of executive managers as corporate elites turnedout to be formidable. Powerful CEOs do not passively conform to institutionalpressures, as the original proposition of institutional theory may imply.Instead, they are politically savvy and resourceful enough to align theirrhetorical positions and material interests with the new dominant discourse ofthe time. Such an account of powerful actors highlights the political as well asstrategic nature of institutional processes, as argued in Oliver (1991) andPorac, Wade, and Pollock (1999).
Several limitations of this study suggest avenues for future research.First, the presence of shareholder value orientation was inferred from indirectindicators rather than from direct observation of executive behaviour orattitudes. Innovative research methods, perhaps a combination of qualitativeand quantitative approaches, are needed. Second, the sample was limited tothe largest firms. It is still unknown whether and how shareholder valueorientation has diffused across mid-size and small firms. Third, this studyfocused on the period of 1996–2006. Whereas the 11-year period is long enoughfor a longitudinal analysis, future research should examine an even longertimespan (perhaps from the late 1970s) to cover the entire evolution ofshareholder value orientation. It is also important to examine how the recentfinancial crisis and recession affected shareholder value orientation. Finally,parallel studies should be done in non-US settings. Corporate governancesystems vary significantly across countries (Aguilera and Jackson, 2010).There has been considerable debate about the convergence and divergence ofcorporate governance systems across different countries (Cheffins, 2003;Hansmann and Kraakman, 2001). A cross-national analysis of financialisationand shareholder value orientation would be immensely valuable.
REFERENCES
AGUILERA, R. V. and G. JACKSON, 2010. “Comparative and International CorporateGovernance”, Academy of Management Annals, Vol. 4, No. 1, pp. 485-556.
ALLEN, M. P., 1981. “Power and Privilege in the Large Corporation: Corporate Controland Managerial Compensation”, American Journal of Sociology, Vol. 86, No. 5, pp. 1112-1123.
BEBCHUK, L. and J. M. FRIED, 2004. Pay Without Performance: The UnfulfilledPromise of Executive Compensation, Cambridge, MA: Harvard University Press.
BEBCHUK, L. and Y. GRINSTEIN, 2005. “The Growth of Executive Pay”, OxfordReview of Economic Policy, Vol. 21, No. 2, pp. 283-303.
CEO COMPENSATION AND SHAREHOLDER VALUE 555
03 Taekjin Shin article_ESRI Vol 43-4 10/12/2012 15:51 Page 555

BERLE, A. Jr. and G. C. MEANS, 1932. The Modern Corporation and Private Property,New York: Macmillan.
BROMLEY, P. and W. W. POWELL, 2012. “From Smoke and Mirrors to Walking theTalk: Decoupling in the Contemporary World”, Academy of Management Annals,Vol. 6, No. 1, pp. 483-530.
CHEFFINS, B. R., 2003. “Will Executive Pay Globalise Along American Lines?”Corporate Governance: An International Review, Vol. 11, No. 1, pp. 8-24.
CRYSTAL, G. S., 1991. In Search of Excess, New York: Norton.DAVIS, G. F., 2008. “A New Finance Capitalism? Mutual Funds and Ownership
Re-concentration in the United States”, European Management Review, Vol. 5, pp. 11-21.
DAVIS, G. F., 2009. Managed by the Markets: How Finance Reshaped America, NewYork: Oxford University Press.
DAVIS, G. F. and T. A. THOMPSON, 1994. “A Social Movement Perspective onCorporate Control”, Administrative Science Quarterly, Vol. 39, pp. 141-173.
DAVIS, G. F., K. A. DIEKMANN and C. H. TINSLEY, 1994. “The Decline and Fall ofthe Conglomerate Firm in the 1980s: The Deinstitutionalization of anOrganizational Form”, American Sociological Review, Vol. 59, No. 4, pp. 547-570.
DEVERS, C. E., A. A. CANNELLA, G. P. REILLY and M. E. YODER, 2007. “ExecutiveCompensation: A Multidisciplinary Review of Recent Developments”, Journal ofManagement, Vol. 33, No. 6, pp. 1016-1072.
DIMAGGIO, P. J. and W. W. POWELL, 1983. “The Iron Cage Revisited: InstitutionalIsomorphism and Collective Rationality in Organizational Fields”, AmericanSociological Review, Vol. 48, pp. 147-160.
DIPRETE, T. A., G. M. EIRICH and M. PITTINSKY, 2010. “CompensationBenchmarking, Leapfrogs, and the Surge in Executive Pay”, American Journal ofSociology, Vol. 115, No. 6, pp. 1671-1712.
DOBBIN, F. and J. JUNG, 2010. “The Misapplication of Mr. Michael Jensen: HowAgency Theory Brought Down the Economy and Why It Might Again”, Research inthe Sociology of Organizations, Vol.30B, pp. 29-64.
ELSAID, E. and W. N. DAVIDSON, 2009. “What Happens to CEO CompensationFollowing Turnover and Succession?”, Quarterly Review of Economics and Finance,Vol. 49, pp. 424-447.
ELSBACH, K. D., 1994. “Managing Organizational Legitimacy in the California CattleIndustry: The Construction and Effectiveness of Verbal Accounts”, AdministrativeScience Quarterly, Vol. 39, pp. 57-88.
FAMA, E. F. and M. C. JENSEN, 1983. “Separation of Ownership and Control”,Journal of Law and Economics, Vol. 26, No. 2, pp. 301-325.
FAULKENDER, M. and J. YANG, 2010. “Inside the Black Box: The Role andComposition of Compensation Peer Groups”, Journal of Financial Economics, Vol.96, pp. 257-270.
FEE, C. E., and C. J. HADLOCK. 2003. “Raids, Rewards, and Reputations in theMarket for Managerial Talent.” Review of Financial Studies, Vol. 16, No. 4, pp. 1315-1357.
FINKELSTEIN, S., D. C. HAMBRICK, and A. A. CANNELLA. 2009. StrategicLeadership: Theory and Research on Executives, Top Management Teams, andBoards. New York: Oxford University Press.
556 THE ECONOMIC AND SOCIAL REVIEW
03 Taekjin Shin article_ESRI Vol 43-4 10/12/2012 15:51 Page 556

FLIGSTEIN, N., 1990. The Transformation of Corporate Control, Cambridge, MA:Harvard University Press.
FLIGSTEIN, N., 2001. The Architecture of Markets: An Economic Sociology of Twenty-First-Century Capitalist Societies, Princeton, NJ: Princeton University Press.
FLIGSTEIN, N. and T. SHIN, 2007. “Shareholder Value and the Transformation of theU.S. Economy, 1984-2000”, Sociological Forum, Vol. 22, No. 4, pp. 399-424.
GILLAN, S. L. and L. T. STARKS, 2007. “The Evolution of Shareholder Activism in theUnited States”, Journal of Applied Corporate Finance, Vol. 19, No. 1, pp. 55-73.
GOLDSTEIN, A., 2012. “Revenge of the Managers: Labor Cost-cutting and theParadoxical Resurgence of Managerialism in the Shareholder Value Era, 1984 to2001”, American Sociological Review, Vol. 77, No. 2, pp. 268-294.
HACKER, J. S. and P. PIERSON, 2010. “Winner-Take-All Politics: Public Policy,Political Organization, and the Precipitous Rise of Top Incomes in the UnitedStates”, Politics and Society, Vol. 38, pp. 152-204.
HALL, B. J. and J. B. LIEBMAN, 1998. “Are CEOs Really Paid Like Bureaucrats?”,Quarterly Journal of Economics, Vol. 113, No. 3, pp. 653-691.
HALL, B. J. and K. J. MURPHY, 2003. “The Trouble with Stock Options”, Journal ofEconomic Perspectives, Vol. 17, No. 3, pp. 49-70.
HANSMANN, H. and R. KRAAKMAN, 2001. “The End of History for Corporate Law”,Georgetown Law Journal, Vol. 89, pp. 439-468.
HARTZELL, J. C. and L. T. STARKS, 2003. “Institutional Investors and ExecutiveCompensation”, Journal of Finance, Vol. 58, pp. 2351-2374.
HILL, C. W. L. and P. PHAN, 1991. “CEO Tenure as a Determinant of CEO Pay”,Academy of Management Journal, Vol. 34, No. 3, pp. 707-717.
JENSEN, M. C., 2001. “Value Maximization, Stakeholder Theory, and the CorporateObjective Function”, Journal of Applied Corporate Finance, Vol. 14, No. 3, pp. 8-21.
JENSEN, M. C. and W. H. MECKLING, 1976. “Theory of the Firm: ManagerialBehavior, Agency Costs and Ownership Structure”, Journal of FinancialEconomics, Vol. 3, pp. 305-360.
JENSEN, M. C. and K. J. MURPHY, 1990a. “Performance Pay and Top-managementIncentives”, Journal of Political Economy, Vol. 98, No. 2, pp. 225-264.
JENSEN, M. C. and K. J. MURPHY, 1990b. “CEO Incentives – It’s Not How Much YouPay, But How”, Harvard Business Review, Vol. 68, No. 3, pp. 138-153.
JENSEN, M. and E. J. ZAJAC, 2004. “Corporate Elites and Corporate Strategy: HowDemographic Preferences and Structural Position Shape the Scope of the Firm,Strategic Management Journal, Vol. 25, No. 6, pp. 507-524.
JULIO, B. and D. K. IKENBERRY, 2004. “Reappearing Dividends”, Journal of AppliedCorporate Finance, Vol. 16, No. 4, pp. 89-100.
KRIPPNER, G. R., 2005. “The financialization of the American Economy”, Socio-Economic Review, Vol. 3, pp. 173-208.
KRIPPNER, G. R., 2011. Capitalizing on Crisis: The Political Origins of the Rise ofFinance, Cambridge, MA: Harvard University Press.
LAZONICK, W. and M. O’SULLIVAN, 2000. “Maximizing Shareholder Value: A New Ideology for Corporate Governance”, Economy and Society, Vol. 29, No. 1,pp. 13-35.
LIEBERSON, S. and J. F. O’CONNOR, 1972. “Leadership and OrganizationalPerformance: A Study of Large Corporations”, American Sociological Review, Vol.37, No. 2, pp. 117-130.
CEO COMPENSATION AND SHAREHOLDER VALUE 557
03 Taekjin Shin article_ESRI Vol 43-4 10/12/2012 15:51 Page 557
MARCH, J. G., 1984. “Notes on Ambiguity and Executive Compensation”,Scandinavian Journal of Management Studies, August, pp. 53-64.
MEYER, J. W. and B. ROWAN, 1977. “Institutionalized Organizations: FormalStructure as Myth and Ceremony”, American Journal of Sociology, Vol. 83, No. 2,pp. 340-363.
MURPHY, K. J., 1999. “Executive Compensation” in O. Ashenfelter and D. Card (eds.),Handbook of Labor Economics, Vol. 3b, pp. 2485-2563, Amsterdam: North Holland.
OLIVER, C., 1991. “Strategic Responses to Institutional Processes”, Academy ofManagement Review, Vol. 16, No. 1, pp. 145-179.
O’REILLY, C. A. and B. G. M. MAIN. 2010. “Economic and Psychological Perspectiveson CEO Compensation: A Review and Synthesis”, Industrial and CorporateChange, Vol. 19, No. 3, pp. 675-712.
PFEFFER, J., 1977. “The Ambiguity of Leadership”, Academy of Management Review,Vol. 2, No. 1, pp. 104-112.
PFEFFER, J., 1981. “Management as Symbolic Action: The Creation and Maintenanceof Organizational Paradigms” in L. L. Cummings and B. Staw (eds.), Research inOrganizational Behavior, Vol, 3, pp. 1-52, Greenwich, CT: JAI Press.
PORAC, J. F., J. B. WADE and T. G. POLLOCK, 1999. “Industry Categories and thePolitics of the Comparable Firm in CEO Compensation”, Administrative ScienceQuarterly, Vol. 44, pp. 112-144.
SCOTT, W. R., 2001. Institutions and Organizations, 2nd edition, Thousand Oaks, CA:Sage.
STAW, B. M. and L. D. EPSTEIN, 2000. “What Bandwagons Bring: Effects of PopularManagement Techniques on Corporate Performance, Reputation, and CEO Pay”,Administrative Science Quarterly, Vol. 45, pp. 523-556.
SUNDARAM, A. K. and A. C. INKPEN, 2004. “The Corporate Objective Revisited”,Organization Science, Vol. 15, No. 3, pp. 350-363.
TOMASKOVIC-DEVEY, D. and K-H. LIN, 2011. “Income Dynamics, Economic Rents,and the Financialization of the U.S. Economy”, American Sociological Review, Vol. 76, No. 4, pp. 538-559.
TOSI, H. L., S. WERNER, J. P. KATZ, and L. R. GOMEZ-MEJIA. 2000. “How MuchDoes Performance Matter? A Meta-analysis of CEO Pay Studies.” Journal ofManagement, Vol. 26, No. 2, pp. 301-339.
USEEM, M. 1996. Investor Capitalism: How Money Managers Are Changing the Faceof Corporate America. New York: Basic Books.
VAN ESSEN, M., J. OTTEN and E. J. CARBERRY, 2012. “Assessing Managerial PowerTheory: A Meta-analytic Approach to Understanding the Determinants of CEOCompensation, Journal of Management, in print.
WADE, J., C. A. O’REILLY and I. CHANDRATAT, 1990. “Golden Parachutes: CEOs and the Exercise of Social Influence”, Administrative Science Quarterly, Vol. 35, pp. 587-603.
WADE, J. B., J. F. PORAC and T. G. POLLOCK, 1997. “Worth, Words and theJustification of Executive Pay”, Journal of Organizational Behavior, Vol. 18, pp. 641-664.
WESTPHAL, J. D. and E. J. ZAJAC, 1994. “Substance and Symbolism in CEOs’ Long-term Incentive Plans”, Administrative Science Quarterly, Vol. 39, pp. 367-390.
WESTPHAL, J. D. and E. J. ZAJAC, 1998. “The Symbolic Management ofStockholders: Corporate Governance Reforms and Shareholder Reactions”,Administrative Science Quarterly, Vol. 43, pp. 127-153.
558 THE ECONOMIC AND SOCIAL REVIEW
03 Taekjin Shin article_ESRI Vol 43-4 10/12/2012 15:51 Page 558

ZAJAC, E. J. and J. D. WESTPHAL, 2004. “The Social Construction of Market Value:Institutionalization and Learning Perspectives on Stock Market Reactions”,American Sociological Review, Vol. 69, No. 3, pp. 433-457.
ZORN, D. M., 2004. “Here a Chief, There a Chief: the Rise of the CFO in the AmericanFirm”, American Sociological Review, Vol. 69, pp. 345-364.
ZORN, D., F. DOBBIN, J. DIERKES and M-S. KWOK, 2005. “Managing Investors:How Financial Markets Reshaped the American Firm” in K. K. Cetina and A.Preda (eds.), The Sociology of Financial Markets, pp. 269-289, New York: OxfordUniversity Press.
ZUCKERMAN, E. W., 1999. “The Categorical Imperative: Securities Analysts and theIllegitimacy Discount”, American Journal of Sociology, Vol. 104, No. 5, pp. 1398-1438.
ZUCKERMAN, E. W., 2000. “Focusing the Corporate Product: Securities Analysts andDe-diversification”, Administrative Science Quarterly, Vol. 45, No. 3, pp. 591-619.
CEO COMPENSATION AND SHAREHOLDER VALUE 559
03 Taekjin Shin article_ESRI Vol 43-4 10/12/2012 15:51 Page 559

03 Taekjin Shin article_ESRI Vol 43-4 10/12/2012 15:51 Page 560