CEO Compensation and Board Structure - Miami
31
THE JOURNAL OF FINANCE • VOL. LXIV, NO. 1 • FEBRUARY 2009 CEO Compensation and Board Structure VIDHI CHHAOCHHARIA and YANIV GRINSTEIN ∗ ABSTRACT In response to corporate scandals in 2001 and 2002, major U.S. stock exchanges issued new board requirements to enhance board oversight. We find a significant decrease in CEO compensation for firms that were more affected by these requirements, compared with firms that were less affected, taking into account unobservable firm effects, time-varying industry effects, size, and performance. The decrease in compensation is particularly pronounced in the subset of affected firms with no outside blockholder on the board and in affected firms with low concentration of institutional investors. Our results suggest that the new board requirements affected CEO compensation decisions. IN MODERN CORPORATIONS, the decision of how to compensate the manager is dele- gated to the board of directors. In recent years, experts have debated the impor- tance of this delegation mechanism in affecting CEO compensation. On the one hand, many scholars point to the labor market for talent as the major force that determines the level and design of compensation contracts (e.g., Rosen (1990), Himmelberg and Hubbard (2000), Hubbard (2005), Gabaix and Landier (2008)). On the other hand, a number of scholars argue that the delegation mechanism has a crucial effect on CEO compensation, and that board decisions with re- spect to compensation can deviate considerably from labor market values (e.g., Fama (1980), Fama and Jensen (1983), Jensen (1993), Hall and Murphy (2003), Bebchuk and Fried (2003, 2004)). How important is the board of directors in setting CEO compensation? How do procedural requirements adopted by boards affect CEO compensation de- cisions? The purpose of this article is to examine these questions. We study the effect of the new U.S. laws on corporate boards to shed light on this is- sue. In response to the corporate scandals in the United States in 2001 and 2002, the Sarbanes-Oxley Act and the new rules of the major exchanges estab- lished new restrictions on the structure and operations of boards. The purpose ∗ Chhaochharia is with University of Miami and Grinstein is with the Johnson School of Man- agement, Cornell University. An earlier version of this paper was circulated under the name “CEO Compensation and Board Oversight.” For their helpful comments, we thank an anonymous ref- eree, Cam Harvey (the editor), John Graham (the coeditor), Prasun Aggarwal, Lucian Bebchuk, Ola Bengtsson, Hal Bierman, Dirk Jenter, Roni Michaely, Maureen O’Hara, N.R. Prabhala, Amir Rubin, Siddharth Sharma, Chester Spatt, David Weinbaum, Bilal Zia, and seminar participants at Columbia University, Cornell University, Hebrew University, London Business School, London School of Economics, University of Maryland, University of Miami, NBER Summer Institute, Stock- holm School of Economics, Syracuse University, Yale University, the Third Annual Conference of the Caesaria Center, and the Bank of Israel Conference on Corporate Governance. 231
Transcript of CEO Compensation and Board Structure - Miami
THE JOURNAL OF FINANCE • VOL. LXIV, NO. 1 • FEBRUARY 2009
CEO Compensation and Board Structure
VIDHI CHHAOCHHARIA and YANIV GRINSTEIN∗
ABSTRACT
In response to corporate scandals in 2001 and 2002, major U.S. stock exchanges issuednew board requirements to enhance board oversight. We find a significant decrease inCEO compensation for firms that were more affected by these requirements, comparedwith firms that were less affected, taking into account unobservable firm effects,time-varying industry effects, size, and performance. The decrease in compensationis particularly pronounced in the subset of affected firms with no outside blockholderon the board and in affected firms with low concentration of institutional investors.Our results suggest that the new board requirements affected CEO compensationdecisions.
IN MODERN CORPORATIONS, the decision of how to compensate the manager is dele-gated to the board of directors. In recent years, experts have debated the impor-tance of this delegation mechanism in affecting CEO compensation. On the onehand, many scholars point to the labor market for talent as the major force thatdetermines the level and design of compensation contracts (e.g., Rosen (1990),Himmelberg and Hubbard (2000), Hubbard (2005), Gabaix and Landier (2008)).On the other hand, a number of scholars argue that the delegation mechanismhas a crucial effect on CEO compensation, and that board decisions with re-spect to compensation can deviate considerably from labor market values (e.g.,Fama (1980), Fama and Jensen (1983), Jensen (1993), Hall and Murphy (2003),Bebchuk and Fried (2003, 2004)).
How important is the board of directors in setting CEO compensation? Howdo procedural requirements adopted by boards affect CEO compensation de-cisions? The purpose of this article is to examine these questions. We studythe effect of the new U.S. laws on corporate boards to shed light on this is-sue. In response to the corporate scandals in the United States in 2001 and2002, the Sarbanes-Oxley Act and the new rules of the major exchanges estab-lished new restrictions on the structure and operations of boards. The purpose
∗Chhaochharia is with University of Miami and Grinstein is with the Johnson School of Man-agement, Cornell University. An earlier version of this paper was circulated under the name “CEOCompensation and Board Oversight.” For their helpful comments, we thank an anonymous ref-eree, Cam Harvey (the editor), John Graham (the coeditor), Prasun Aggarwal, Lucian Bebchuk,Ola Bengtsson, Hal Bierman, Dirk Jenter, Roni Michaely, Maureen O’Hara, N.R. Prabhala, AmirRubin, Siddharth Sharma, Chester Spatt, David Weinbaum, Bilal Zia, and seminar participantsat Columbia University, Cornell University, Hebrew University, London Business School, LondonSchool of Economics, University of Maryland, University of Miami, NBER Summer Institute, Stock-holm School of Economics, Syracuse University, Yale University, the Third Annual Conference ofthe Caesaria Center, and the Bank of Israel Conference on Corporate Governance.
231
232 The Journal of Finance R©
of these rules was to “. . . strengthen corporate governance practices of listedcompanies.”1 The main provisions of these rules require that (1) a majority ofboard members on a single board be independent, (2) members of compensa-tion, audit, and nominating committees be independent, (3) separate meetingsby nonemployee directors be conducted, and (4) specific written procedures,so-called charters, be used to evaluate CEOs and elect new board members.
In this study we test whether these requirements had an effect on compensa-tion decisions. We use the difference-in-difference approach to compare changesin compensation between firms that were already complying with these re-quirements and firms that were not complying with them. To measure level ofcompliance, we focus on three board structure variables required by the rules:the requirement for a majority of independent directors on a single board, therequirement for an independent nominating committee, and the requirementfor an independent compensation committee.
We find that firms that did not comply with these requirements significantlydecreased CEO compensation in the period after the rules went into effect, com-pared to the complying firms. The decrease is on the order of 17%, after takinginto account performance, size, time-varying shocks to different industries dur-ing that period, firm fixed effects, and other variables affecting compensationthat changed during that time.
We also find that the one requirement that is strongly associated with adrop in compensation is the requirement that the majority of board membersbe independent, and that the significant relative drop in compensation comesfrom the decrease in the bonus and the stock-based compensation.
To further explore the importance of the board in affecting compensation, westudy the extent to which the decrease in compensation is related to the exis-tence of other monitoring mechanisms in the noncomplying firms. In particular,we focus on two mechanisms that have been shown to affect compensation. Thefirst is the concentration of institutional holdings (Hartzell and Starks (2003)),and the second is the existence of a nonemployee blockholder on the board(Core, Holthausen, and Larcker (1999)). We find that noncomplying firms thatalready have a blockholder as well as noncomplying firms that have large con-centrations of institutional investors were less affected by the rules. In fact, thereduction in compensation comes mostly from noncomplying firms that did nothave these mechanisms in place.
Our finding that director independence is associated with a reduction in com-pensation is interesting, partly because requiring more independent directorson the board might not necessarily lead to any material effect on director ac-tions. To the extent that CEOs tend to handpick their directors, the legal re-quirements for independence might not lead to truly independent directors.2 Webelieve that the requirement for independent directors had a bite partly becauseof the additional requirements from boards. For example, the new nomination
1 Securities and Exchange Commission press release 34–48745, November 2003.2 See, for example, Shivdasani and Yermack (1999) for evidence on the effect of CEOs on director
nomination decisions.

CEO Compensation and Board Structure 233
procedures have likely reduced reliance on the CEO in the nomination of direc-tors and the newly elected directors are more likely to be truly independent. Inaddition, to the extent that directors in noncomplying firms had a weak bar-gaining position vis-a-vis the CEO, the new procedures may have given them astronger bargaining position.
We pay particular attention to potential confounding effects that could driveour results. First, the corporate scandals that focused attention on the need fornew compensation rules also gave rise to many shareholder groups vigorouslyadvocating certain governance structures, and it is possible that firms that didnot have boards with a majority of independent members caught the attentionof the public and were under greater pressure to reduce CEO compensation.Second, in 2004, the new requirement by FASB (FAS 123R) to expense optionscould have led to changes in compensation structure, and it is possible thatfirms with noncompliant boards reacted differently to the option expensingrule.
We find that these confounding effects are not responsible for the relative dropin compensation. Among noncomplying firms, compensation dropped even infirms that were not affected by the expensing requirement, and variation inshareholder pressure is unrelated to the relative drop in compensation.
This study belongs to a group of studies that look at the effect of boardstructure on executive compensation (e.g., Yermack (1996), Angbazo andNarayanan (1997), Hallock (1997), Core et al. (1999), Cyert, Kang, andKumar (2002), Vafeas (2003), Bertrand and Mullainathan (2001), Grinsteinand Hribar (2004)). By and large, the studies show that, controlling for theeconomic determinants of executive compensation, board structure does helpto explain cross-sectional variation in CEO compensation. However, such evi-dence is often criticized as being inconclusive since board structure is an en-dogenous variable, determined by unobservable firm and CEO characteristicsthat, in turn, determine CEO compensation (e.g., Thorburn (1997), Hermalinand Weisbach (2003)).
Our research, unlike that of the other studies mentioned here, examinesthe effect of director regulation on executive compensation. Analyzing a reg-ulation event helps mitigate the endogeneity problem, since changes to boardstructure can often be attributed to the rulings rather than to unobservablefirm and CEO characteristics. By using the difference-in-difference approach,we control for any economic shocks that occurred during the legislation eventand that could have affected compensation levels in all firms. We also con-tribute to the existing literature by shedding light on the importance of pro-cedural changes in boards when firms have other monitoring mechanisms inplace.
This study also contributes to research that examines the relation betweengovernance regulations and firms’ policies. For example, Dahya, McConnell,and Travlos (2002) find that U.K. firms changed their CEO replacement policyin response to the Cadbury committee recommendations, and Leuz, Triantis,and Wang (2008) find an increase in the number of firms that go dark after theSarbanes-Oxley Act.
234 The Journal of Finance R©
The remainder of the paper is organized as follows. In Section I we describepreviously existing empirical literature and the stock exchanges recent rules.Section II describes the data and the variables. Section III explains the resultsof our study, and Section IV describes robustness tests. Section V discusses ourresults and Section VI concludes.
I. Review of the Literature and Recent Legislation
In most public corporations, compensation decisions are made by a boardof directors, which represents the shareholders. Several scholars have empha-sized the importance of board structure in determining manager compensa-tion. For example, Fama (1980) and Fama and Jensen (1983) argue that com-pensation decisions should be delegated to outside directors, that is, directorswho do not work for the firm or have an affiliation with officers of the firm.These scholars argue that such directors are better able to make unbiasedjudgments about the quality of the CEO and in turn efficient compensation,hiring, and firing decisions. Jensen (1993) argues that major problems existwith regard to the quality of monitoring by board members in public U.S. firms.These problems arise because CEOs in public U.S. firms have great influ-ence over the nomination of new directors and directors who are nominatedby the CEO feel obligated to the CEO. Further, directors typically have littletime to monitor managers effectively, and in many cases have little stake inthe corporation. Jensen also argues that CEOs often control a board’s agenda,leaving little opportunity for boards to question CEOs. Bebchuk and Fried(2003, 2004) argue that such problems have a significant effect on compen-sation arrangements and that lack of board oversight can lead to suboptimalcompensation practices, such as overcompensation. John and Senbet (2003)and Spatt (2006) also point to the agency conflict of directors. Spatt (2006) ar-gues that giving board members incentive compensation could motivate themtoward greater involvement and John and Senbet (2003) recommend that com-pensation arrangements be voted by the shareholders in order to avoid directorbiases.3
Several studies have shown that board structure explains cross-sectionalvariation in compensation. For example, Hallock (1997) looks at Forbes 500firms in 1992 and finds that when the board has directors with interlocking
3 While these studies point mainly to the costs associated with having nonindependent directorson the board, other studies argue that there are also benefits of having nonindependent directors.For example, Harris and Raviv (2008) argue that independent directors are less informed, Adamsand Ferreira (2006) argue that monitoring by independent directors can be excessive, and Raheja(2005) argues that having employee directors can be good because competition among employeedirectors over the CEO position can lead to efficient CEO replacements. Since our study onlyconsiders the effect of board structure and procedures on compensation, we cannot address the op-timality of board structure in general. Indeed, empirical evidence supports the notion that optimalboard structure differs across firms (e.g., Hermalin and Weisbach (1998), Linck, Netter, and Young(2007), Coles, Naveen, and Naveen (2008), Boone et al. (2007), Wintoki (2007), Chhaochharia andGrinstein (2007)). See Section V for additional discussion.
CEO Compensation and Board Structure 235
relations (i.e., the CEO of company A sits on the board of company B and theCEO of company B sits on the board of company A), compensation to both CEOsis higher. Core et al. (1999) look at the level of compensation to CEOs in largeU.S. firms in the mid 1980s and find that the level of CEO compensation ishigher when the CEO is involved in the nomination of new directors, when thepercentage of affiliated directors on the board is higher, when no director holdsa substantial stake in the firm, when the CEO is also board chair, and whenthe number of directors on the board is large. Cyert et al. (2002) look at thedeterminants of executive compensation in the early 1990s in a large sampleof U.S. public firms, and they find that CEOs who also are board chairs receivehigher compensation. Grinstein and Hribar (2004) look at the effect of CEOs’board power on the size of the bonuses they receive for acquiring other firms.Grinstein and Hribar find that the size of the bonus is higher when the CEOis involved in the nomination process for new directors and when the CEO isalso board chair.
While, by and large, the association between board structure and compensa-tion practices is established in the literature cited, it is harder to establish fromthat literature that board structure has a causal effect on compensation prac-tices, because compensation practices and board structure are both endogenousvariables determined by unobservable firm and CEO characteristics. To illus-trate this endogeneity problem, consider, for example, the model proposed byHermalin and Weisbach (1998) in which perceived managerial talent increasesmanagerial bargaining power over the filling of vacancies on the board of direc-tors. According to this model, firms in which CEOs are more talented will tendto have directors that are closely tied to the CEO. But since talent is a variablethat determines compensation, we should observe a positive relation betweencompensation levels and the number of members of the board that have tieswith the CEO. Yet, this association does not imply that board structure affectscompensation decisions. To establish such an effect, one has to control for theunobservable-talent variable.
In this study we use a U.S. legislative event to mitigate this identificationissue. In structure, our research is reminiscent of Bertrand and Mullainathan(1999), who study the effect of antitakeover legislation on executive compen-sation. We, however, focus on the effect of board structure on executive com-pensation. Since our study looks at the effect of an external intervention withrespect to board structure on executive compensation, the endogeneity problemis mitigated.
In February 2002, about 2 months after Enron declared bankruptcy, the thenchair of the Securities and Exchange Commission (SEC), Mr. Harvey Pitt, re-quested that the exchanges look for ways to improve their governance listingstandards.4 In response, the New York Stock Exchange (NYSE) and the Na-tional Association of Securities Dealers, through its subsidiary, the NasdaqStock Market (Nasdaq), came up with proposed changes that they sent to the
4 Securities and Exchange Commission press release 2002–23, February 13, 2002.
236 The Journal of Finance R©
SEC in August 2002 (NYSE) and October 2002 (Nasdaq). The SEC approvedthese proposals with minor changes in November 2003.5
The main provisions of the final NYSE rule are as follows:6
(i) All firms must have a majority of independent directors.(ii) An independent director as defined by the NYSE rule is a director that
has no material relationship with the listed company, directly, or as apartner, shareholder, or officer of an organization that has a relationshipwith the company (NYSE 303A.1). In addition, the rule points to certaindirector ties that disqualify board members from being independent.The main ties are current employment or recent former employment inthe firm, family affiliation with the executives of the firm, substantialbusiness ties with the firm, and family affiliation with persons that havesuch ties with the firm. In general, a director retains his or her affiliationstatus until 3 years after the termination of such affiliation.
(iii) The compensation committee, nominating committee, and audit commit-tee shall consist of independent directors.7
(iv) The compensation committee and the nomination committee must havea written charter that defines the obligations of these committees. Thecommittees should also have self-evaluation procedures.
(v) All audit committee members should be financially literate. In addition,at least one member of the audit committee would be required to haveaccounting or related financial management expertise.
(vi) Nonmanagement directors of a company must meet at regularly sched-uled executive sessions without management in order to empower non-management directors to serve as a more effective check on management.
The NYSE and Nasdaq required firms to adopt these policies during theirfirst annual meeting after January 15, 2004, but no later than October 31, 2004.Firms with classified boards were given until the second annual meeting butnot past December 31, 2005, to comply with the requirements.8
It is natural to expect the requirement for an independent compensationcommittee to directly affect compensation. Since the compensation committeeis ultimately responsible for setting compensation, a change in its structuremight lead to different compensation arrangements. However, the require-ments for a majority of independent directors and an independent nominat-ing committee can also influence compensation. First, the entire board is ul-timately responsible for nominating the compensation committee and hence
5 Securities and Exchange Commission press release 34–48745, November 4, 2003.6 Nasdaq followed with similar rulings. Nasdaq relaxes some of the NYSE provisions to fit
smaller firms. The main difference between the rulings is that Nasdaq allows the compensationand nomination decisions to be held by a majority of independent directors if a formal committee isnot established. In our sample, all Nasdaq firms have established a compensation committee anda nominating committee.
7 The Sarbanes-Oxley Act, which became effective on July 30, 2002, also requires independenceof the audit committee.
8 A classified board (also known as a staggered board) is a board for which only a portion of themembers (usually one-third) are up for reelection in any given year.

CEO Compensation and Board Structure 237
has the ultimate power to affect whether the compensation committee is go-ing to be savvy, well informed, and in possession of the appropriate negotiat-ing skills. One can argue that a board that has more independent directorschooses a compensation committee differently. Second, the entire board ratifiescompensation committee recommendations, and thus the bargaining processbetween the compensation committee and management will be influenced bythe composition of the entire board and by the process by which directors arenominated.
Beyond the potential direct effects of these requirements on compensation,there could also be indirect effects. Firms that are less compliant with theindependence requirement are potentially more affected by other require-ments from the board, such as the requirement for a written charter to ex-plain the compensation policy of the firm, the requirement for a performanceevaluation of the committees, and the requirement for board sessions withoutmanagement.
In this study we do not attempt to distinguish between direct effects andindirect effects. A relation between our director independence measures andcompensation can be attributed to either of these effects.
II. Data, Variables, and Methodology
A. Data
Our data source for executive compensation is the Execucomp database,which has all compensation information about firms that belong to the S&P1500 index, or that once belonged to this index. Our data source for boardstructure and director information comes from the Investor ResponsibilityResearch Center database (IRRC), which was recently bought by the Insti-tutional Shareholder Services (ISS) company. We have IRRC data for the years2000 to 2005. The database includes information about directors in firms thatbelong to the S&P 1500 index. In particular, the database has information aboutwhether the director is independent and about whether the director serves onthe compensation and nominating committees.9
Our analysis spans the years 2000 to 2005. We use the Execucomp databaseand the director information data for the years 2000 to 2005. To ensure thatwe do not capture changes in compensation due to firms entering and leavingthe samples, and to ensure that the firms are subject to the rules, we includein the analysis only U.S. firms that existed in these two databases for the en-tire period and that are members of the NYSE or Nasdaq. We retrieve finan-cial information for each of the firms from Compustat. Our final sample com-prises 865 firms. All variables are adjusted for inflation using 2002 as the baseyear.
9 As with any study that looks at a subset of firms, the selection criteria could bias the results.However, the use of firm fixed effects (difference-in-differences) mitigates this concern.

238 The Journal of Finance R©
B. Variables
B.1. Director Independence
The IRRC database has a variable that classifies a director as an independentdirector. IRRC defines an independent director as a director who is neitheraffiliated nor currently an employee of the company. An affiliated director is aformer employee of the company or of a majority-owned subsidiary; a providerof professional services—such as legal, consulting, or financial—to the companyor an executive; a customer of or supplier to the company; a designee, such as asignificant shareholder, under a documented agreement between the companyand a group; a director who controls more than 50% of the company’s votingpower (and thus would not be considered to represent the broader interests ofminority shareholders); a family member of an employee; or an employee of anorganization or institution that receives charitable gifts from the company.
This definition closely follows that of the exchanges. However, it is somewhatmore restrictive. According to the IRRC definition, a director who is a formeremployee of the firm is not independent, even if the employment terminatedmore than 3 years before the director was seated. A director who has businessrelations with the firm is also not independent according to this definition, evenif the business relationship is insignificant. In contrast, NYSE and Nasdaqallow former employees to become independent directors if more than 3 yearshave passed since their employment. NYSE and Nasdaq also allow independentdirectors to have business relations with the firm as long as the transactionsare not significant.
We therefore adjust the IRRC definition to be more in line with the exchanges’definition. We make a partial adjustment by reclassifying nonindependent di-rectors as independent if they were former employees of a firm and 3 or moreyears have passed since the termination of their employment. Unfortunately,we cannot reclassify nonindependent directors as independent if their businessrelations are small, because we cannot observe the size of these business trans-actions. Therefore, our adjusted definition is still somewhat stricter than thatof the exchanges.
Table I, Panel A, shows the trend in compliance with the independence re-quirements, according to our modified definition, between 2000 and 2005.
The table shows that the fraction of firms that comply with the requirementof maintaining a majority of independent directors has increased steadily by16% from 2000 to 2005. The table also shows that the largest annual increaseoccurs between 2002 and 2003. This is consistent with the notion that manyfirms began to change their board structure once the recommendations wereput forth by the exchanges. We observe a similar pattern in the fraction offirms that have an independent compensation committee and in the fractionof firms that have an independent nominating committee. Compliance withthe compensation committee requirement increased by 11% between 2000 and2005, and compliance with the nominating committee requirement increasedby 49% during that period. The largest increases in compliance with the inde-pendence requirement of the compensation committee occur in 2002 (5%) and

CEO Compensation and Board Structure 239
Table ISummary Statistics
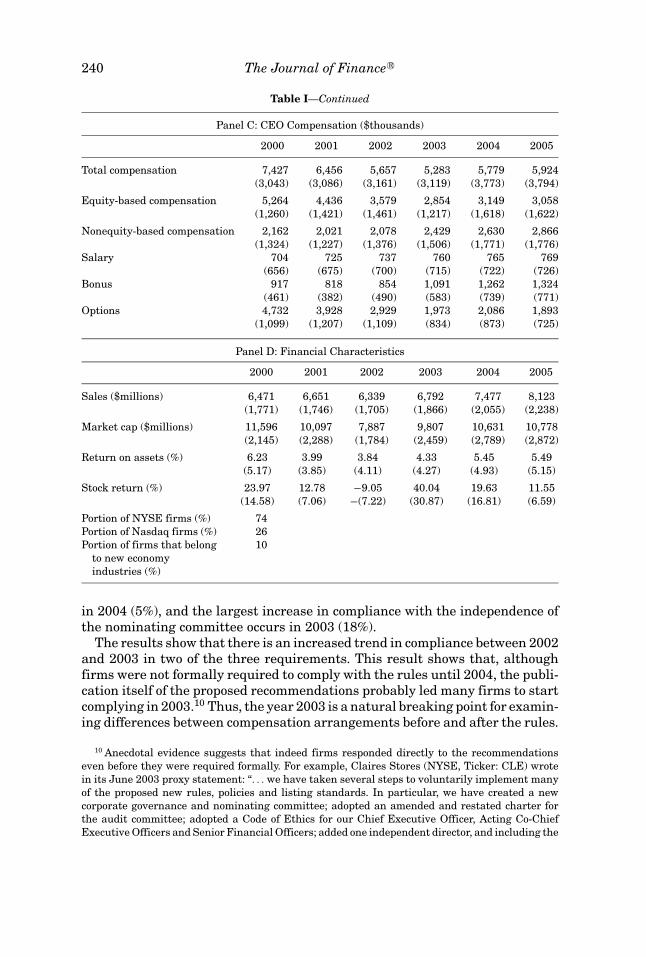
The table shows financial, compensation, and governance characteristics of U.S. public firms be-tween 2000 and 2005. The sample consists of 865 firms that have executive compensation informa-tion as well as board structure information in the IRRC and the Execucomp databases. In Panel A,an independent director is defined as a director who has not been an employee in the firm in the last3 years, does not have business transactions with the firm, and has no family ties with employeesof the firm. In Panels C and D, numbers without parentheses are averages, and numbers withinparentheses are medians. In Panel C, total compensation is the variable tdc1 in Execucomp, whichconsists of salary, bonus, value of restricted stock granted, value of options granted (using Black–Scholes), long-term incentive payouts, and other compensation. The equity-based portion consistsof the value of the options (Execucomp variable BLK VALUE) and the value of the restricted stock(Execucomp variable RSTKGRNT). Nonequity-based compensation is total compensation (tdc1)minus equity-based compensation. In Panel D, market value is the market capitalization of equity.Return on assets is net income before extraordinary items and discontinued operations dividedby the book value of assets, and stock return is annual stock return (dividend reinvested). Neweconomy firms are as defined in Murphy (2003), and consist of firms that belong to high-techindustries.
Panel A: Governance Characteristics
2000 2001 2002 2003 2004 2005
Portion of boards with majority ofindependent directors (%)
79 78 83 90 93 94
Portion of boards with independentcompensation committee (%)
75 72 77 81 86 86
Portion of boards with independentnominating committee (%)
30 32 44 62 78 79
Other board characteristicsAverage board size 9.89 9.84 9.81 9.73 9.75 9.68Portion of boards with a nominating
committee (%)47 56 68 88 97 98
Portion of boards with a compensationcommittee (%)
98 98 98 99 100 100
Portion of boards with a CEO chair (%) 67 68 68 69 66 64
Panel B: Changes in the Structure of Boards That Did Not Have a Majority of IndependentDirectors in 2002 and Became Compliant between 2003 and 2005
Only leaving directors (%) 12%Only new directors arrive (%) 40%Both directors leaving and new directors arrive (%) 36%Did not change any board members (%) 13%
Average # independent arriving 1.31Average # employee leaving 0.38Average # independent leaving 0.34Average # linked leaving 0.37
Total number of firms 86
(continued)
240 The Journal of Finance R©
Table I—Continued
Panel C: CEO Compensation ($thousands)
2000 2001 2002 2003 2004 2005
Total compensation 7,427 6,456 5,657 5,283 5,779 5,924(3,043) (3,086) (3,161) (3,119) (3,773) (3,794)
Equity-based compensation 5,264 4,436 3,579 2,854 3,149 3,058(1,260) (1,421) (1,461) (1,217) (1,618) (1,622)
Nonequity-based compensation 2,162 2,021 2,078 2,429 2,630 2,866(1,324) (1,227) (1,376) (1,506) (1,771) (1,776)
Salary 704 725 737 760 765 769(656) (675) (700) (715) (722) (726)
Bonus 917 818 854 1,091 1,262 1,324(461) (382) (490) (583) (739) (771)
Options 4,732 3,928 2,929 1,973 2,086 1,893(1,099) (1,207) (1,109) (834) (873) (725)
Panel D: Financial Characteristics
2000 2001 2002 2003 2004 2005
Sales ($millions) 6,471 6,651 6,339 6,792 7,477 8,123(1,771) (1,746) (1,705) (1,866) (2,055) (2,238)
Market cap ($millions) 11,596 10,097 7,887 9,807 10,631 10,778(2,145) (2,288) (1,784) (2,459) (2,789) (2,872)
Return on assets (%) 6.23 3.99 3.84 4.33 5.45 5.49(5.17) (3.85) (4.11) (4.27) (4.93) (5.15)
Stock return (%) 23.97 12.78 −9.05 40.04 19.63 11.55(14.58) (7.06) −(7.22) (30.87) (16.81) (6.59)
Portion of NYSE firms (%) 74Portion of Nasdaq firms (%) 26Portion of firms that belong
to new economyindustries (%)
10
in 2004 (5%), and the largest increase in compliance with the independence ofthe nominating committee occurs in 2003 (18%).
The results show that there is an increased trend in compliance between 2002and 2003 in two of the three requirements. This result shows that, althoughfirms were not formally required to comply with the rules until 2004, the publi-cation itself of the proposed recommendations probably led many firms to startcomplying in 2003.10 Thus, the year 2003 is a natural breaking point for examin-ing differences between compensation arrangements before and after the rules.
10 Anecdotal evidence suggests that indeed firms responded directly to the recommendationseven before they were required formally. For example, Claires Stores (NYSE, Ticker: CLE) wrotein its June 2003 proxy statement: “. . . we have taken several steps to voluntarily implement manyof the proposed new rules, policies and listing standards. In particular, we have created a newcorporate governance and nominating committee; adopted an amended and restated charter forthe audit committee; adopted a Code of Ethics for our Chief Executive Officer, Acting Co-ChiefExecutive Officers and Senior Financial Officers; added one independent director, and including the

CEO Compensation and Board Structure 241
The fact that we do not observe almost complete compliance in the year 2005is puzzling. One possibility is that Nasdaq firms chose not to have formal com-mittees, and therefore only 86% of the firms have an independent compensationcommittee in 2005 and only 79% of the firms have an independent nominatingcommittee in 2005. However, our results in Panel A show that almost all firmsin our sample have compensation committees and nominating committees in2005, and, therefore, they should all comply with the committee independencerequirements. Another possibility is that some firms simply decided not to com-ply with the rules.11 However, looking at the proxy statements in 2005 for asample of these noncomplying firms, we find that a vast majority of the firmsdeclare that they do comply with the exchange requirements. A closer look atthese firms suggests to us that some firms in our sample are defined as non-compliant in 2005 because the definition we use for director independence isstricter than that of the exchanges.
This measurement error is likely to bias our results against finding an effectof board change on compensation because some firms that are in our noncom-pliant sample were actually compliant according to the exchanges.
Table I, Panel B, shows the way the firms that did not comply in 2002 withthe requirement for a majority of independent directors later became com-pliant. The table shows that 40% of the firms became compliant by addingmore independent directors to their boards. About 36% became compliant byboth adding independent directors and dismissing nonindependent directors.Another 12% became compliant by dismissing nonindependent directors, and13% did not change the composition of the board at all but became compliantwhen directors who were former employees or had business transactions be-came independent because 3 years had passed since their transactions with thefirms.
The table also shows that, across all noncomplying firms that became com-pliant, the average number of independent directors arriving is 1.31, andthe average number of independent directors leaving is 0.34. These numberssuggest a net increase of about one independent director. The average num-ber of employee–directors and linked directors leaving the firm is 0.38 and0.37, respectively. Thus, in the sample of noncomplying firms, one indepen-dent director entered the board and 0.75 nonindependent directors left theboard.
B.2. Executive Compensation
Our dependent variable of interest is CEO compensation. We use the totalcompensation variable, which includes base salary, bonuses, options (Black–
two new directors our board is recommending to our shareholders, recommended a slate of directorscomprised of a majority of independent directors; and granted our committees the authority toretain independent advisors and consultants whenever they deem such action to be in our bestinterest.”
11 The exchanges have the authority to delist firms that do not comply with the governancerequirements. However, they use this option only in extreme cases. See NYSE Governance Rule303A, Section 13 (penalties).
242 The Journal of Finance R©
Scholes value), restricted stocks, and other compensation. This variable is re-ferred to as tdc1 in the Execucomp database. We also separately look at equity-based compensation and nonequity-based compensation. Equity-based compen-sation is defined as the total value of options and restricted stock awarded to theCEO, and nonequity-based compensation is the total compensation to the CEOminus the equity-based compensation.12 We adjust the compensation variablesfor inflation, using 2002 as the base year.
Panel C of Table I shows summary statistics of CEO compensation in oursample. Average total compensation decreased from $7.427 million to $5.283million between 2000 and 2003 and then increased to $5.924 million in 2005.Interestingly, the median compensation increased steadily from $3.043 millionin 2000 to 3.794 million in 2005. This result suggests that the decrease in com-pensation is due to the decrease in the amounts paid to the highly compensatedmanagers.
The average equity-based portion of compensation decreased from an av-erage of $5.264 million in 2000 to $3.058 million in 2005, a drop of $2.206million. Much of the drop is attributed to the drop in option compensation,which decreased from an average of $4.732 million in 2000 to $1.893 millionin 2005, a drop of $2.839 million. In contrast, nonequity compensation hasshown an almost steady increase from $2.162 million in 2000 to $2.866, an in-crease of $0.704 million, most of which is explained by the increase in bonuscompensation.
B.3. Control Variables
We use several control variables in the various tests we perform. To controlfor firm size we use the natural log of the sales of the corporation (in $mil-lions). To control for performance we use two measures. The first measure isthe natural log of the gross annual stock return (dividends reinvested) of thefirm. The second measure is the natural log of the gross return on assets, wherereturn on assets is defined as net income before extraordinary items dividedby the book value of assets. Both performance measures are lagged 1 year toavoid measuring the effect of compensation on performance. To control for CEOseniority in the firm, we use the natural log of one plus the tenure of the CEO(in years).13 Finally, we control for industry shocks that can affect the supply
12 Execucomp uses the following inputs into the Black–Scholes calculation: The exercise strikeprice is that specified by the company in its proxy statement. The market price at the time of thegrant is assumed to equal the strike price. The term of the grant is 70% of the stated term (toaccount for early exercise by executives). The risk-free rate is the approximate average yield of aTreasury bond carrying a 7-year term. The volatility is calculated over the 60 months prior to thegrant. The dividend yield is the 3-year average dividend yield. Both the dividend yield and thevolatility are winsorized at the 5% and 95% levels, using the distribution of the S&P 1500 firms.Execucomp takes the value of the restricted stock grants, salary, and bonuses directly from theCEO compensation table in the SEC filings. In general, firms provide the value of restricted stockusing the number of shares granted times the price of share at the time of the grant.
13 Since we run our regression with firm fixed effects, CEO seniority is likely to be capturedby the fixed effects. However, if the CEO is replaced, then the firm fixed effect is not going to
CEO Compensation and Board Structure 243
and demand for CEOs in different industries in different years by interactingindustry dummies with year dummies. Our industry classification follows thatof Fama and French (1997). All variables are adjusted for inflation, using 2002as the base year.
Table I, Panel D, shows summary statistics of the financial variables of firmsin our sample. Average sales in 2000 are about $6.5 billion, increasing to about$8.1 billion in 2005. Median sales are much lower (on the order of $1.8 billion).The difference between average and median sales suggests that several verylarge firms skew the sample. Consistent with the downturn in the economybetween the years 2000 and 2002, and the upturn between the years 2003and 2005, average market value decreased between 2000 and 2002 and thenincreased between 2003 and 2005. Returns on assets and stock returns show asimilar pattern.
C. Methodology
We hypothesize that if the board and committee requirements by the ex-changes affect CEO compensation, then boards that did not comply with theserequirements should respond more to the rules than boards that did complywith them. Our measure of the level of compliance is whether the firm hada majority of independent directors, an independent compensation committee,and an independent nominating committee in 2002 (before the rules were an-nounced). To test this hypothesis, we run the following specification over thebalanced panel of 865 firms in the years 2000 to 2005:
Log(Compensationit) = a0 + a1 ∗ Dummy(Noncompliant Board ′02)i
∗ Dummy(′03 − ′05)t + a2 ∗ Dummy(Noncompliant Compensation committee ′02)i
∗ Dummy(′03 − ′05)t + a3 ∗ Dummy(Noncompliant Nominating committee ′02)i
∗ Dummy(′03 − ′05)t + [Controlsit] + Firm Effectsi + εIt . (1)
In the above specification, the variables a1, a2, and a3 represent the changein the compensation of the noncomplying firms in the postregulation period(years 2003 to 2005) compared to the compensation of the complying firms.The control variables are as specified in the previous section. To account forthe potential change in compensation practices for all firms as a result of thecorporate scandals, we also interact each of the above size and performancecontrols with dummy variables for whether the year belongs to the period beforethe new rules (years 2000 to 2002) or after the new rules (years 2003 to 2005).We also include firm fixed effects to control for any unobservable fixed firmcharacteristics that can affect compensation, such as the complexity of the tasksthat the CEO faces in the firm. In all the regressions we cluster the errors atthe firm-period level.14
capture the change in seniority. Therefore, the tenure variable mostly captures replacements ofCEOs.
14 As a robustness check, we also ran our specification over the period 1996 to 2005 on a subsetof 618 firms and clustered the errors at the firm level. The results we got are similar to those

244 The Journal of Finance R©
III. Results
A. Compensation, Majority of Independent Directors, and CommitteeIndependence
Table II, column 1, shows the results of regression (1) for the sample of 865firms between 2000 and 2005 (a total of 5,190 firm-years). In the first threecolumns we show the results from separate runs of each compliance variable,and in the last column we show the results of runs from all compliance variablestaken together.
Column 1 shows that the coefficient on the interaction dummy of firms thatdid not comply with the requirement for a majority of independent board direc-tors is negative and significant, with a magnitude of −0.192. The magnitude ofthe coefficient suggests a 17.5% drop in the compensation of firms not comply-ing with the rules, relative to complying firms.15
The coefficients on the interaction dummies of firms that did not comply withthe requirement for an independent compensation committee and the require-ment for an independent nominating committee are also negative (columns 2and 3). However, these coefficients are of much smaller magnitude and are notstatistically different from zero. The results are similar when we include allthe compliance variables in the same regression (column 4). The interactionvariable for the coefficient on the interaction dummy of firms that did not com-ply with the requirement for a majority of independent directors is negativeand significant, with a magnitude of –0.218. The interaction dummies for thecommittee requirements are insignificant.
The results suggest that the requirement for a majority of independent di-rectors, rather than that of compensation committee independence or nomi-nating committee independence, is important to compensation decisions. Thisfinding is interesting because it suggests that board-level attributes are moreimportant than committee-level attributes, consistent with the notion that theboard has power over the compensation committee and the nominating com-mittee (in the sense that it nominates the compensation committee membersand the nominating committee members and it approves the recommendationof those committees). Therefore, the committee actions and power, vis-a-vis themanager, will be influenced by the power of the board of directors. Other expla-nations for the results are that we have larger measurement error in the levelof independence of the compensation committee or the nominating committeethan for the majority independence requirement, and that the close correlation
reported. As another robustness check we used a specification over the period 2000 to 2005 butexcluding the year 2003 from the sample because it was a transition year. The results are notaffected when excluding 2003 from the sample. Finally, we also tried a specification where weinclude only the years 2002, 2004, and 2005 in the regression. The results are also not affectedunder this specification.
15 When the explanatory variable is continuous, then the coefficient represents the drop in com-pensation for a 1% drop in the explanatory variable. Since the dummy variable is not continuous,the coefficient represents the drop in the log compensation for a change in the dummy variablefrom zero to one. A drop of 19.2% in the log compensation translates to a discount of exp (–0.192)(0.825), or a 17.5% drop.

CEO Compensation and Board Structure 245
Table IITotal Compensation and Board Compliance
The table shows the results of panel regressions, where the dependent variable is the natural log of totalCEO compensation (variable tdc1 in Execucomp). The sample consists of a balanced panel of 865 firmsthat exist in Execucomp between 2000 and 2005. Sales is the natural log of company sales (Compustatdata item 12). ROA is the natural log of one plus net income before extraordinary items and discontinuedoperations divided by the book value of assets—all measured in (t−1). Returns is the natural log of theannual gross stock return (dividend reinvested), measured in year (t−1). Tenure is the number of yearsthe CEO served in the firm. Dummy (board noncompliant 2002) is a dummy variable that equals one if thefirm did not have a majority of independent directors on the board in 2002 and zero otherwise. Dummy(compensation committee noncompliant 2002) is a dummy variable that equals one if the firm did nothave an independent compensation committee on the board in 2002 and zero otherwise. Dummy (nom-inating committee noncompliant 2002) is a dummy variable that equals one if the firm did not have anindependent nominating committee and zero otherwise. A director is defined as an independent directorif the director was not an employee of the firm during the previous 3 years, if the director does not havefamily affiliation of the officers of the firm, and if the director does not have any business transactionswith the firm. Dummy (’00–’02) is a dummy variable that equals one if the observation is in the period2000 to 2002 and zero otherwise. Dummy (’03–’05) is a dummy variable that equals one if the observa-tion is in the period 2003 to 2005 and zero otherwise. Industry–year fixed effects are the Fama–French48-industry dummies (Fama and French (1997)) interacted with year dummies. All variables are adjustedfor inflation using 2002 as the base year. The numbers in parentheses are robust standard errors, clusteredat the firm-period level. ∗, ∗∗, and ∗∗∗ indicate significance at the 10%, 5%, and 1% levels, respectively.
Dependent Variable:Log(Total Compensation) (1) (2) (3) (4)
Dummy (board noncompliant ’02) ∗ −0.192∗∗ −0.218∗∗
dummy (’03–’05) (0.086) (0.093)Dummy (compensation committee −0.014 0.060
noncompliant ’02) ∗ dummy (0.064) (0.058)(’03–’05)
Dummy (nominating committee −0.033 −0.006noncompliant ’02) ∗ dummy (0.033) (0.053)(’03–’05)
Sales ∗ dummy (’00–’02) 0.305∗∗∗ 0.290∗∗∗ 0.291∗∗∗ 0.304∗∗∗
(0.066) (0.068) (0.071) (0.066)Sales ∗ dummy (’03–’05) 0.268∗∗∗ 0.259∗∗∗ 0.258∗∗∗ 0.266∗∗∗
(0.072) (0.073) (0.075) (0.071)ROA∗ dummy (’00–’02) 0.321 0.346 0.351 0.332
(0.399) (0.404) (0.405) (0.397)ROA ∗ dummy (’03–’05) 0.260∗ 0.248∗ 0.252∗ 0.257∗
(0.150) (0.148) (0.146) (0.149)Returns ∗ dummy (’00–’02) 0.123∗∗∗ 0.124∗∗∗ 0.124∗∗∗ 0.124∗∗∗
(0.033) (0.034) (0.034) (0.033)Returns ∗ dummy (’03–’05) 0.269∗∗∗ 0.269∗∗∗ 0.269∗∗∗ 0.270∗∗∗
(0.048) (0.048) (0.048) (0.048)Tenure −0.034 −0.029 −0.030 −0.034
(0.022) (0.024) (0.022) (0.022)
Firm fixed effect + + + +Industry-year fixed effect + + + +N 5,190 5,180 5,180 5,180Adjusted -R2 26% 26% 24% 25%

246 The Journal of Finance R©
between independence of the board and independence of the committee reducesthe statistical power of the test.16
As expected, size and performance have a significantly positive effect on com-pensation. Moreover, the sensitivity of compensation to stock return is signif-icantly higher after the scandals occurred (years 2003 to 2005) than before,suggesting that overall compensation schemes in years following the scandalsdiffer from schemes that existed before the scandals occurred. The coefficienton the tenure variable is not statistically significant from zero, suggesting thatperhaps the firm fixed effects capture the tenure effect for most firms in thesample.
To get a better sense of whether the large drops in compensation were due toother factors, we read the proxy statements between 2003 and 2005 for someof the noncomplying firms that had the largest drop in compensation. We findevidence that, at least in some of these firms, the drop in compensation wasassociated with a reevaluation of the equity-based portion of compensation bythe board. For example, Adobe Systems announced in 2003 that it stopped issu-ing option compensation to its executives in 2003 because it was reevaluatingtheir incentive compensation plans. Similarly, Compuware announced in 2004that it revised its executive incentive compensation program. Thus, at least insome of the firms, the drop in the compensation seems to have been associatedwith reevaluations of incentive compensation plans by the firms’ boards.
Finally, it is interesting to compare the magnitude of the effect of board in-dependence in this study to previous studies. Our results suggest a 17.5% dropin compensation for firms that became compliant. Core et al. find that a 1%decrease in the percentage of linked directors on the board is associated witha 0.75% decrease in compensation. They also find that a 1% increase in insidedirectors is associated with a 0.57% decrease in compensation.17 Our resultsin Table I suggest that among the sample of noncomplying firms, the fractionof linked directors decreased by about 4% and the fraction of inside directorsdecreased by about 4%. Using the estimates from Core et al., the decrease inlinked directors should therefore translate to a decrease of about 3% in com-pensation, and the decrease in insiders on the board should translate to anincrease of about 2.2% in compensation. Thus, the total decrease should be onthe order of about 0.8%.
This decrease is much lower than the decrease of 17.5% that we find. Weattribute the difference to several effects. First, it is likely that firms in the two
16 We also checked to see whether the effect is coming from the fact that firms that were iden-tified as noncompliant in 2005 were actually compliant to begin with. We therefore restricted ourdefinition of noncomplying firms to include firms that were not compliant in 2002 and becamecompliant by 2005. Our results are practically the same for this specification as those reportedabove.
17 Core et al. find that a 1% decrease in the percentage of linked directors on the board isassociated with a $7,354 decrease in compensation and that a 1% decrease in the percentage ofinside directors on the board is associated with a $5,639 increase in compensation. The averagecompensation in their sample is $985,000, which means that a 1% decrease in the percentage oflinked directors and inside directors is associated on average with a 0.75% decrease and a 0.57%increase in compensation, respectively.

CEO Compensation and Board Structure 247
samples differ from one another considerably because of the different periodsinvolved. In addition, the sample of Core et al. is based on a survey, which couldlead to a downward bias in the results. Third, the sample used by Core et al.is from the 1980s—during the 1980s, firms faced increased pressure from themarket for corporate control to maximize value and internal monitoring mech-anisms were likely to be less important in aligning incentives (Jensen (1993)).The lack of pressure from the market for corporate control during the 1990scould have created a larger effect of board structure on compensation contracts.Fourth, it is also possible that the larger drop in compensation is because therules also reduced the influence of the CEO in the nomination of new directors.Core et al. find that a 1% increase in the number of directors appointed by theCEO is associated with a 0.42% increase in compensation. Assuming that theexiting directors in our sample were appointed by the CEO and that the newdirectors on the board (10% of board size) were not appointed by the CEO, thedecrease in compensation should amount to an additional 4.2%. The decreasein compensation can be even higher if directors in noncomplying firms weremore influenced by the CEO before the rules and became less influenced afterthe rules because of the new board procedures.
B. Changes to the Components of Compensation
The results described in the previous section suggest that firms without amajority of independent directors reduced their CEO compensation after theregulation went into effect more than did firms with a majority of independentdirectors. We now explore which of the compensation components is responsiblefor the drop.
To test which components of compensation are affected, we repeat the anal-ysis in the previous section (focusing on the effect of compliance with themajority-of-independent-directors requirement in reducing CEO compensa-tion), but this time we include as dependent variables the equity-based portionand the nonequity-based portion of compensation.
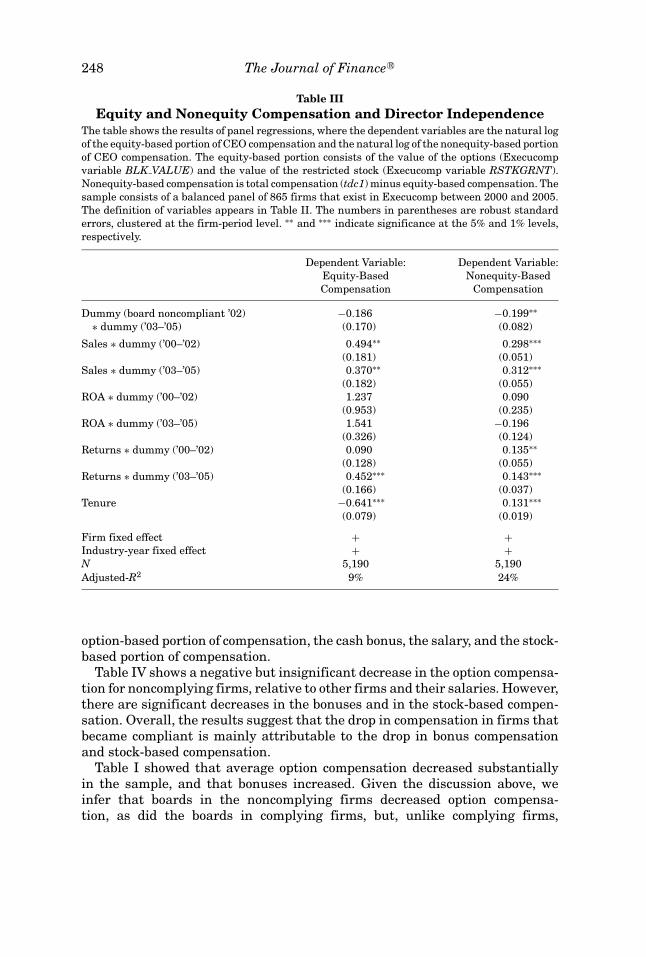
Table III reports the results. In the first column, the dependent variableis the natural log of the equity-based component of compensation, and in thesecond column the dependent variable is the natural log of the nonequity-basedcomponent of compensation.
The coefficient on the majority independent variable is negative in both spec-ifications, with similar magnitude, but it is statistically significant from zeroonly for the nonequity-based portion of compensation. The magnitude of thecoefficient suggests that the decrease in both portions of compensation is onthe order of 17% to 18%.
Overall, the results suggest that firms that were not compliant reducedboth the equity-based portion of compensation and the nonequity-based por-tion of compensation. The decrease is significant only in the nonequity-basedportion.
We can further explore which of the components of the equity-based andnonequity-based compensation decreased. To do so, we look separately at the
248 The Journal of Finance R©
Table IIIEquity and Nonequity Compensation and Director Independence
The table shows the results of panel regressions, where the dependent variables are the natural logof the equity-based portion of CEO compensation and the natural log of the nonequity-based portionof CEO compensation. The equity-based portion consists of the value of the options (Execucompvariable BLK VALUE) and the value of the restricted stock (Execucomp variable RSTKGRNT).Nonequity-based compensation is total compensation (tdc1) minus equity-based compensation. Thesample consists of a balanced panel of 865 firms that exist in Execucomp between 2000 and 2005.The definition of variables appears in Table II. The numbers in parentheses are robust standarderrors, clustered at the firm-period level. ∗∗ and ∗∗∗ indicate significance at the 5% and 1% levels,respectively.
Dependent Variable: Dependent Variable:Equity-Based Nonequity-BasedCompensation Compensation
Dummy (board noncompliant ’02) −0.186 −0.199∗∗∗ dummy (’03–’05) (0.170) (0.082)
Sales ∗ dummy (’00–’02) 0.494∗∗ 0.298∗∗∗(0.181) (0.051)
Sales ∗ dummy (’03–’05) 0.370∗∗ 0.312∗∗∗(0.182) (0.055)
ROA ∗ dummy (’00–’02) 1.237 0.090(0.953) (0.235)
ROA ∗ dummy (’03–’05) 1.541 −0.196(0.326) (0.124)
Returns ∗ dummy (’00–’02) 0.090 0.135∗∗(0.128) (0.055)
Returns ∗ dummy (’03–’05) 0.452∗∗∗ 0.143∗∗∗(0.166) (0.037)
Tenure −0.641∗∗∗ 0.131∗∗∗(0.079) (0.019)
Firm fixed effect + +Industry-year fixed effect + +N 5,190 5,190Adjusted-R2 9% 24%
option-based portion of compensation, the cash bonus, the salary, and the stock-based portion of compensation.
Table IV shows a negative but insignificant decrease in the option compensa-tion for noncomplying firms, relative to other firms and their salaries. However,there are significant decreases in the bonuses and in the stock-based compen-sation. Overall, the results suggest that the drop in compensation in firms thatbecame compliant is mainly attributable to the drop in bonus compensationand stock-based compensation.
Table I showed that average option compensation decreased substantiallyin the sample, and that bonuses increased. Given the discussion above, weinfer that boards in the noncomplying firms decreased option compensa-tion, as did the boards in complying firms, but, unlike complying firms,

CEO Compensation and Board Structure 249
Table IVCompensation Components and Director Independence
The table shows the results of four panel regressions with different dependent variables. Thedependent variables are: the natural log of the option portion of CEO compensation (Execucompvariable Blk Value), the natural log of the salary portion of compensation (Execucomp variableSalary), the natural log of the bonus portion of compensation (Execucomp variable Bonus), and thenatural log of stock-based compensation (Execucomp variable RSTKGRNT). The sample consistsof a balanced panel of 865 firms that exist in Execucomp between 2000 and 2005. The definition ofvariables appears in Table II. The numbers in parentheses are robust standard errors, clusteredat the firm-period level. All variables are adjusted for inflation using 2002 as the base year. ∗, ∗∗,and ∗∗∗ indicate significance at the 10%, 5%, and 1% levels, respectively.
Dependent DependentVariable: Dependent Dependent Variable:Option Variable: Variable: Stock-Based
Compensation Salary Bonus Compensation
Dummy (board noncompliant ’02) −0.031 −0.099 −0.108∗∗ −0.503∗∗∗ dummy (’03–’05) (0.190) (0.096) (0.053) (0.208)
Sales ∗ dummy (’00–’02) 0.346∗ 0.371∗∗∗ 0.389∗∗∗ 0.079(0.198) (0.115) (0.074) (0.199)
Sales ∗ dummy (’03–’05) 0.207 0.370∗∗∗ 0.427∗∗∗ 0.175(0.197) (0.12) (0.072) (0.201)
ROA ∗ dummy (’00–’02) 0.503 −0.345 −0.450 1.596∗(0.942) (0.29) (0.278) (0.936)
ROA ∗ dummy (’03–’05) 1.701∗∗∗ 0.019 −0.308∗∗ −0.558(0.304) (0.126) (0.15) (0.587)
Returns ∗ dummy (’00–’02) −0.026 0.029 0.222∗∗∗ 0.062(0.13) (0.037) (0.048) (0.135)
Returns ∗ dummy (’03–’05) 0.480∗∗ 0.036 0.099∗∗ 0.333∗(0.177) (0.037) (0.049) (0.186)
Tenure −0.502∗∗∗ 0.120∗∗∗ 0.046∗ −0.601∗∗∗(0.085) (0.023) (0.025) (0.082)
Firm fixed effect + + + +Industry-year fixed effect + + + +N 5,190 5,190 5,190 5,190Adjusted-R2 6% 10% 33% 16%
noncomplying firms did not substitute option compensation for bonuses or stockcompensation.
IV. Robustness Checks
A. Interaction between the Drop in Compensation and CEO Turnover
The corporate scandals and the drop in market performance in 2002 led tomany CEO dismissals. It is possible that our results are due to CEOs enteringand exiting firms rather than a decrease in compensation to the same CEOs.Although we control for the tenure variable in regression (1), it is possible thatwe do not fully capture the replacement effect with that variable. We therefore

250 The Journal of Finance R©
Table VCEO Compensation and CEO Replacements
The table shows the results of a panel regression, where the dependent variable is the natural logof CEO compensation (Execucomp variable tdc1). Same CEO is a dummy variable that equals oneif the CEO was not replaced during the period 2000 to 2005 and zero otherwise. The definitionsof the rest of the variables appear in Table II. The numbers in parentheses are robust standarderrors, clustered at the firm-period level. ∗ and ∗∗∗ indicate significance at the 10% and 1% levels,respectively.
Dependent Variable: Log(Total Compensation)
Dummy (same CEO) ∗ dummy (board noncompliant 2002) −0.274∗∗ dummy (postregulation period) (0.148)
Dummy (not same CEO) ∗ dummy (board noncompliant 2002) −0.081∗ dummy (postregulation period) (0.072)
Sales ∗ dummy (’00–’02) 0.305∗∗∗(0.066)
Sales ∗ dummy (’03–’05) 0.269∗∗∗(0.073)
ROA ∗ dummy (’00–’02) 0.329(0.399)
ROA ∗ dummy (’03–’05) 0.257∗(0.148)
Returns ∗ dummy (’00–’02) 0.123∗∗∗(0.033)
Returns ∗ dummy (’03–’05) 0.271∗∗∗(0.048)
Tenure −0.025(0.022)
Firm fixed effect +Industry–year fixed effect +N 5,190Adjusted-R2 24%
run regression (1) except that we test for the decrease in compensation sepa-rately for noncomplying firms that did not replace their CEOs throughout theperiod 2000 to 2005 and noncomplying firms that did replace their CEOs duringthat time. If CEO replacements account for the drop in compensation, then thedecrease in compensation should come from the sample of firms that replacedtheir CEOs. A total of 61 noncomplying firms (43% of all noncomplying firms)replaced their CEOs within the 6-year period. This result implies a replacementrate of 7% of CEOs per year. That number is consistent with other studies thatlook at CEO turnover during that time (e.g., Kaplan and Minton (2006)).
Table V presents the results. The table shows that the group of firms thatdid not replace their CEOs saw a statistically significant decrease in log com-pensation of about 27% (about a 23.5% drop in compensation), whereas firmsthat did replace their CEOs saw a nonsignificant decrease of 8%. The resultssuggest that the drop in compensation came from firms that did not replacetheir CEOs, suggesting that the results are not driven by CEO replacements.

CEO Compensation and Board Structure 251
B. Controlling for Other Potential Explanatory Variables
One concern with our difference-in-difference approach is that the event itselfmight not be exogenous. If the ruling event is related to changes in market- andfirm-level variables, and if these changes are related to governance structure,then the effect we capture is not related to the rules but to these firm-levelvariables (Meyer (1995)). For example, a potential reason for the change incompensation and the ruling events could be related to the fall of the high-techindustry. Although we control for the Fama–French 48 industries over time, thisindustry categorization might not capture well enough the high-tech sector. Wetherefore use the categorization of the high-tech sector proposed by Murphy(2003). We find that all of the results follow through, even when we control forsuch categorization.
The passage of the rules was associated also with large changes in the in-formation structure in the market. Corporate scandals led to rulings that en-hance transparency in firms and potentially reduce risk and stock price volatil-ity. The literature suggests that firms facing larger risk with respect to theirprospects tend to provide higher compensation to their managers (e.g., Core etal. (1999)). If volatility in the prospects of firms with nonindependent boardswas reduced more dramatically than that of other firms, then we should expecta larger drop in compensation in these firms regardless of the passage of thelaw. To rule out this possibility, we run the regressions described in the previ-ous sections, but this time we also include the standard deviation of the stockreturn (measured monthly over the 48 months and 12 months ending in thebeginning of the fiscal year). The inclusion of stock volatility does not alter ourresults.
A third possible explanation for the change in compensation could be re-lated to systematic differences in changes to growth opportunities over timebetween complying and noncomplying firms. It is possible that the passage ofthe law was associated with the fall in growth opportunities in the market.Since growth opportunities are correlated with higher compensation, we couldbe seeing this effect. We note that our fixed effect and industry–year effectscontrol for growth opportunities at the firm level and for changes in these op-portunities at the industry level. However, as a robustness check, we includethe q-ratio in the regression, defined as the market value of equity plus thebook value of liabilities, all divided by the book value of assets. The inclusionof the q-ratio does not alter our results.
C. Outside Pressure from Investors
The period following the corporate scandals witnessed increased scrutinyfrom firm investors. For example, several shareholder groups and rating agen-cies, such as Institutional Shareholder Services, Standard and Poor’s, Moody’s,and the Corporate Library, established scoring schemes to evaluate firm gover-nance, and institutional investor groups such as the Council for Institutional

252 The Journal of Finance R©
Investors protested existing compensation schemes in firms.18 It is possiblethat firms that did not comply with the exchange regulations faced strongerscrutiny from investors because of the firms’ low governance score and feltmore pressure to reduce the compensation of their CEOs.
To account for this possibility, we perform two tests. First, we test whethercorporate governance scores issued by shareholder groups in 2002 better ex-plain the drop in compensation than noncompliance with board independencerequirements. If, indeed, noncomplying firms were targeted by shareholdergroups because of a general lack of governance, then the drop in compensationshould be associated with the measurement of lack of governance rather thanwith the independence requirement. We use the Corporate Governance Quo-tient (CGQ), established by Institutional Shareholder Services (ISS), as ourmeasure of perceived lack of governance. CGQ measures the strength of thegovernance structure of a firm (as defined by ISS). For each firm, ISS evalu-ates the quality of governance based on a list of prespecified criteria and thenranks the firm based on this evaluation relative to a peer group; CGQ is basedon this ranking. ISS provides rankings relative to two groups. The first groupcomprises all public companies and the second group comprises all companieswithin the same industry group. We add these two measures to regression (1) tosee if they better explain the drop in compensation than does the lack of boardindependence.
Table VI shows the results. In column 1 we add two dummy variables forwhether the CGQ of the firm is in the lowest quartile of all CGQs in the sampleand for whether the CGQ of the firm is in the highest quartile. In column 2 weadd dummy variables for the industry CGQs. Each of these dummy variables isinteracted with the postregulation dummy. If, indeed, firms that were targetedby shareholder rankings reduced the compensation, then we should observe anegative and significant coefficient on the low CGQ coefficient.
We find that the CGQ does not explain any of the decrease in compensation.In contrast, the coefficient on the noncomplying board dummy is significantlynegative in each of the specifications.
As another robustness check for whether market pressure is responsible forthe drop in compensation, we look at whether firms that were subject to classaction lawsuits reduced their compensation in the postruling event. Arguably,firms that are involved in class action lawsuits are under the highest pressure tochange their conduct. If, indeed, this pressure applies to reduced compensation,then we should observe it in these firms. We therefore add to regression (1) adummy variable for whether the firm was subject to a class action lawsuit in2002. In our sample, 19 firms were subject to such a lawsuit in 2002.
Table VI, column 3, shows the results of this specification. The coefficienton the class action lawsuit variable is positive but not statistically different
18 See, for example, “Here Comes Politically Correct Pay: Board Members Are Looking at CEOPay Practices through the Eyes of Angry Shareholders,” Wall Street Journal, April 12, 2004, and“Boards Are Urged to Better Detail Executive Pay,” Wall Street Journal, October 13, 2004.

CEO Compensation and Board Structure 253
Table VICEO Compensation and Pressure by Investors
The table shows the results of panel regressions for whether shareholder pressure caused firms tochange their compensation, where the dependent variable is the natural log of CEO compensation(Execucomp variable tdc1). CGQ (Corporate governance quotient) is a rating developed by Institu-tional Shareholder Services to measure the quality of corporate governance in a firm compared toother public firms in the economy. Similarly, industry CGQ measures the quality of corporate gov-ernance compared to other public firms in the same industry sector. Low CGQ is a dummy variablethat equals one if the firm’s CGQ score in 2002 is in the 25th percentile of the score distribution inthe sample. High CGQ is a dummy variable that equals one if the firm’s CGQ score in 2002 is in the75th percentile of the score distribution in the sample. Class action lawsuit is a dummy variablethat equals one if the firm had a class action lawsuit filed against it in 2002 and zero otherwise.The definitions of the rest of the variables appear in Table II. The numbers in parentheses arerobust standard errors, clustered at the firm firm-period level. ∗, ∗∗, and ∗∗∗ indicate significanceat the 10%, 5%, and 1% levels, respectively.
Dependent Variable: Log(Total Compensation) (1) (2) (3)
Dummy (board noncompliant 2002) −0.220∗∗∗ −0.213∗∗ −0.192∗∗∗ Dummy (’03–’05) (0.107) (0.106) (0.093)
Low CGQ ∗ dummy (’03–’05) 0.083(0.054)
High CGQ ∗ dummy (’03–’05) 0.039(0.048)
Low industry CGQ ∗ (’03–’05) 0.060(0.053)
High industry CGQ ∗ (’03–’05) −0.003(0.047)
Class action lawsuit ∗ (’03–’05) 0.136(0.128)
Sales ∗ dummy (’00–’02) 0.309∗∗∗ 0.306∗∗∗ 0.309∗∗∗(0.065) (0.065) (0.065)
Sales ∗ dummy (’03–’05) 0.268∗∗∗ 0.266∗∗∗ 0.271∗∗∗(0.072) (0.072) (0.071)
ROA ∗ dummy (’00–’02) 0.316 0.322 0.302(0.398) (0.398) (0.396)
ROA ∗ dummy (’03–’05) 0.265∗ 0.261∗ 0.263∗(0.153) (0.151) (0.151)
Returns ∗ dummy (’00–’02) 0.118∗∗∗ 0.121∗∗∗ 0.122∗∗∗(0.034) (0.034) (0.033)
Returns ∗ dummy (’03–’05) 0.269∗∗∗ 0.269∗∗∗ 0.268∗∗∗(0.048) (0.048) (0.048)
Tenure −0.032 −0.032 −0.034(0.022) (0.022) (0.023)
Firm fixed effect + + +Industry–year fixed effect + + +N 5,190 5,190 5,190Adjusted-R2 24% 26% 25%
from zero. In contrast, the coefficient on the noncomplying board dummy issignificantly negative. This result does not support the notion that marketpressure is the cause of the reduction in compensation in the noncomplyingfirms.
254 The Journal of Finance R©
D. Director Independence and Shareholder Monitoring
The result that CEO compensation has decreased in firms that were affectedby the rules still does not mean that independent boards are stronger monitors,or that such monitoring is necessary. In this section we wish to establish more di-rectly the monitoring role of independent directors by examining the interactionbetween board independence and other monitoring mechanisms. Prior studieshave found that firms with stronger shareholder monitoring tend to give lowercompensation to their managers. To the extent that such monitoring substitutesfor the need of monitoring by independent directors, the exchange require-ments from the noncomplying firms should not have an effect on the compen-sation arrangements in firms that have other monitoring mechanisms in place.
We focus on two shareholder mechanisms that were found to have a sig-nificant effect on compensation arrangements. The first is the existence ofa nonemployee blockholder on the board. Core et al. (1999) show that whena blockholder sits on the board of directors, compensation to the manager islower. This result supports Spatt’s (2006) conjecture that stronger incentivesto directors are likely to make them more effective. The second mechanism isthe concentration of institutional holdings. Hartzell and Starks (2003) find thatfirms with high concentrations of institutional holdings tend to give more ef-ficient compensation schemes to their managers; in particular, compensationto managers is lower. We therefore hypothesize that noncomplying firms thathave a nonemployee blockholder on the board or a large concentration of own-ership by institutional investors should not decrease the firm’s compensationas much as firms that do not have a large concentration of holdings.
To test this hypothesis, we run two specifications based on regression (1). Inthe first specification we replace the noncompliance dummy with two interac-tion dummies. The first is the noncompliance dummy interacted with a dummythat equals one if the firm has a blockholder director and zero otherwise. Thesecond is the noncompliance dummy interacted with a dummy that equalsone if the firm does not have a blockholder director and zero otherwise. Wedefine a director blockholder as a nonemployee director who holds 5% or moreof the shares in the firm. A total of 34 firms that did not comply with the in-dependence requirements in 2002 had a director blockholder (about 25% of allnoncomplying firms). In the second specification we repeat the above specifi-cation, except that we interact the noncompliance dummy with dummies forhigh concentration of institutional ownership and low concentration of institu-tional ownership. As in Hartzel and Starks (2003), we define concentration ofownership as the ratio of the combined holdings of the five largest holdings byinstitutions to the holdings of all institutions. We define high (low) ownershipconcentration as concentration in the upper (lowest) quartile of the distributionin our sample.
Table VII column 1 shows that noncomplying firms that have a blockholderdid not reduce their compensation after the announcement of the rules. Incontrast, firms that did not have a blockholder reduced the log compensationby as much as 27% (which translates to a drop of 23.5% in compensation). A

CEO Compensation and Board Structure 255
Table VIICEO Compensation and Other Monitoring Mechanisms
The table shows the results of panel regressions, where the dependent variable is the natural log ofCEO compensation. The sample consists of a balanced panel of 865 firms that exist in Execucompbetween 2000 and 2005. Block ownership is a dummy variable that equals one if in the year 2002a nonemployee director has more than 5% of the outstanding shares and zero otherwise. No blockownership is one minus block ownership. Concentration of institutional holdings is the sum of thefive largest holdings by institutions divided by total institutional holdings. Institutional holdingsare from the Thomson Financials 13F database. Low concentration of institutional holdings is adummy variable that equals one if the concentration level is in the 25th quartile of the sample andzero otherwise. High concentration of institutional holdings is a dummy variable that equals oneif the concentration level is in the 75th quartile of the sample and zero otherwise. The definitionsof the rest of the variables appear in Table II. The numbers in parentheses are robust standarderrors, clustered at the firm-period level. ∗∗ and ∗∗∗ indicate significance at the 5% and 1% levels,respectively.
Dependent Variable: Log(Total Compensation) (1) (2)
Block ownership ∗ dummy (board noncompliant 2002) 0.054∗ Dummy (’03–’05) (0.106)
No block ownership ∗ dummy (board noncompliant 2002) −0.270∗∗∗∗ Dummy (’03–’05) (0.063)
High concentration of institutional holdings −0.176∗ dummy (board noncompliant 2002) ∗ dummy (’03–’05) (0.112)
Low concentration of institutional holdings −0.238∗∗∗ dummy (board noncompliant 2002) ∗ dummy (’03–’05) (0.107)
Sales ∗ dummy (’00–’02) 0.333∗∗∗ 0.304∗∗∗(0.055) (0.065)
Sales ∗ dummy (’03–’05) 0.298∗∗∗ 0.266∗∗∗(0.056) (0.071)
ROA ∗ dummy (’00–’02) 0.285 0.326(0.256) (0.398)
ROA ∗ dummy (’03–’05) 0.249 0.258(0.161) (0.15)
Returns ∗ dummy (’00–’02) 0.122∗∗∗ 0.123∗∗∗(0.037) (0.036)
Returns ∗ dummy (’03–’05) 0.265∗∗∗ 0.270∗∗∗(0.051) (0.048)
Tenure −0.034 −0.033(0.022) (0.003)
Firm fixed effect + +Industry–year fixed effect + +N 5,190 5,190Adjusted- R2 28% 28%
test for the difference in the coefficients of the two variables rejects the null ofno difference between the coefficients at the 1% level.
Table VII column 2 shows that firms with low concentration of ownershipreduced log compensation by 0.238. The drop is statistically significant fromzero. Firms with high concentration of ownership reduced log compensation

256 The Journal of Finance R©
by only 0.176, and the drop is not statistically significant from zero. However,a test of differences between the two coefficients cannot reject the null of nodifference.
Overall, our results suggest that the existence of other monitoring mech-anisms reduces the importance of board independence for compensationdecisions.
E. Expensing of Options
Changes to the exchange regulations were accompanied by another eventthat could have had an impact on executive compensation during that period,specifically, the ruling regarding expensing of options. After the collapse ofEnron, voices among investors and regulators were calling for more preciseways to expense options from corporate earnings. The accounting rules thatprevailed before 2004 allowed firms to decide how to expense options, and manyfirms were using the intrinsic value method, which gave a value of zero for at-the-money options. In December 2004, after several iterations, FASB issueda revised ruling for option expensing, requiring firms to use more accuratemethods to account for option value in the financial statements.
Evidently, the expensing rule had a direct effect on corporations. Employeesof companies such as Cisco and Intel raised their voices against expensing, forfear it would cause companies to stop offering options. Several companies, suchas Apple and Berkshire Hathaway announced that they would start expensingoptions. Other companies, such as Microsoft, announced that they would stoppaying options and move to stock-based compensation. It is therefore plausiblethat the option expensing rule has led some firms to abandon option-basedcompensation and to move toward stock-based compensation for fear that optionexpensing would adversely affect the market’s perception about the true costof these options. To the extent that the expensing rule affected noncomplyingfirms and complying firms differently, we might be capturing this confoundingeffect.
Our previous results show that the significant reduction in compensationcame from the nonequity-based portion of compensation, and that the dif-ferential drop in option compensation after the scandals was negative butinsignificant. Together, these results do not support the notion that optionexpensing caused the differential drop in compensation. To further ensurethat we are not capturing the expensing effect, we first analyze the dis-tribution of the use of options across noncomplying and complying firms.We measure the extent of option use as the total grant value of options toCEO in the years 2000 to 2002 divided by the total grant value of CEOcompensation during that period. We present the results in Table VIII,Panel A.
The panel shows small differences in the use of options across the two sub-samples. On average, about 45% of the CEO compensation of complying firmscomprises options, whereas only 39% of the CEO compensation of noncomplyingfirms comprises options. This result suggests that, if anything, noncomplying
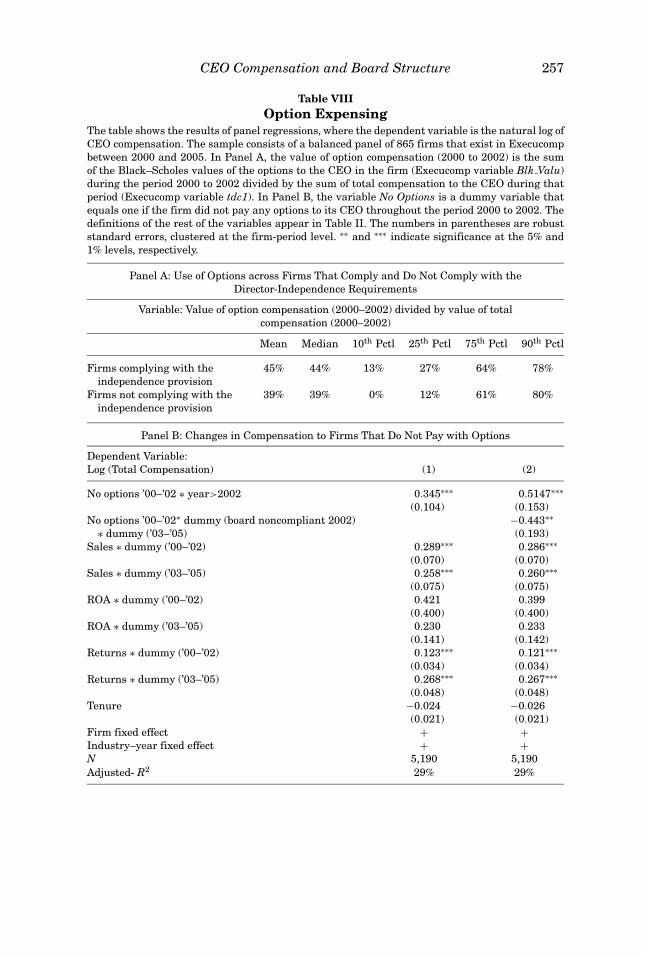
CEO Compensation and Board Structure 257
Table VIIIOption Expensing
The table shows the results of panel regressions, where the dependent variable is the natural log ofCEO compensation. The sample consists of a balanced panel of 865 firms that exist in Execucompbetween 2000 and 2005. In Panel A, the value of option compensation (2000 to 2002) is the sumof the Black–Scholes values of the options to the CEO in the firm (Execucomp variable Blk Valu)during the period 2000 to 2002 divided by the sum of total compensation to the CEO during thatperiod (Execucomp variable tdc1). In Panel B, the variable No Options is a dummy variable thatequals one if the firm did not pay any options to its CEO throughout the period 2000 to 2002. Thedefinitions of the rest of the variables appear in Table II. The numbers in parentheses are robuststandard errors, clustered at the firm-period level. ∗∗ and ∗∗∗ indicate significance at the 5% and1% levels, respectively.
Panel A: Use of Options across Firms That Comply and Do Not Comply with theDirector-Independence Requirements
Variable: Value of option compensation (2000–2002) divided by value of totalcompensation (2000–2002)
Mean Median 10th Pctl 25th Pctl 75th Pctl 90th Pctl
Firms complying with theindependence provision
45% 44% 13% 27% 64% 78%
Firms not complying with theindependence provision
39% 39% 0% 12% 61% 80%
Panel B: Changes in Compensation to Firms That Do Not Pay with Options
Dependent Variable:Log (Total Compensation) (1) (2)
No options ’00–’02 ∗ year>2002 0.345∗∗∗ 0.5147∗∗∗(0.104) (0.153)
No options ’00–’02∗ dummy (board noncompliant 2002) −0.443∗∗∗ dummy (’03–’05) (0.193)
Sales ∗ dummy (’00–’02) 0.289∗∗∗ 0.286∗∗∗(0.070) (0.070)
Sales ∗ dummy (’03–’05) 0.258∗∗∗ 0.260∗∗∗(0.075) (0.075)
ROA ∗ dummy (’00–’02) 0.421 0.399(0.400) (0.400)
ROA ∗ dummy (’03–’05) 0.230 0.233(0.141) (0.142)
Returns ∗ dummy (’00–’02) 0.123∗∗∗ 0.121∗∗∗(0.034) (0.034)
Returns ∗ dummy (’03–’05) 0.268∗∗∗ 0.267∗∗∗(0.048) (0.048)
Tenure −0.024 −0.026(0.021) (0.021)
Firm fixed effect + +Industry–year fixed effect + +N 5,190 5,190Adjusted- R2 29% 29%

258 The Journal of Finance R©
firms should show a lower drop in compensation because they use options lessoften than do complying firms.
As another check for whether our results are driven by option expensing,we focus on a subset of firms that do not use option compensation as part oftheir compensation package in the years 2000 to 2002. This subset of firmsis unlikely to reduce compensation as a result of the expensing rule becausethe rule is unlikely to affect it. A total of 60 firms did not give their managersoptions at all during the period 2000 to 2002. Among the 60 firms, 23 did notcomply with the majority-of-independent-directors requirement in 2002.
We first check whether, indeed, these 60 firms show a different compensationpattern in the period 2003 to 2005 compared to other firms in the sample. Todo so, we run regression (1), but we replace the noncompliance dummy witha dummy for whether the firm does not pay option compensation. Regressionresults are in Table VIII, Panel B, column 1. The results show that firms thatdo not use options increased their compensation between 2003 and 2005 com-pared to firms that use options. The increase is on the order of 40%. This resultsupports the claim that, indeed, the reduction in compensation across all firmswas related to their use of option compensation during the period 2000 to 2002.However, it still does not tell us whether the drop in compensation for noncom-plying firms is driven by the use of option compensation. To disentangle theoption-compensation effect for noncomplying firms, we add to the specificationanother dummy variable for whether the firms that did not use option compen-sation also did not have a majority of independent directors. If our results aredriven by the use of options, then noncomplying firms that did not pay with op-tions should not show a different compensation pattern compared to complyingfirms that did not pay with options. We present the results in column 2.
The results in column 2 show that, after controlling for the increase in com-pensation for firms that did not pay with options, firms that did not have amajority of independent directors significantly reduced the compensation. Thereduction in log compensation is on the order of 40%, which translates to abouta 30% drop in compensation.
Together, our findings suggest that the drop in compensation associated withnoncomplying firms is not driven by the option expensing rule.
V. Discussion
The results establish that board characteristics play a major role in the de-termination of compensation practices after the exchange rules. An importantquestion is whether such changes to boards are optimal, in the sense that theyincrease shareholder value. According to Bebchuk and Fried (2003, 2004) andJensen (1993), these changes to board structure should reduce the power thatmanagers have over boards of directors and should therefore enhance share-holder value.
However, such changes could also have a detrimental effect on shareholdervalue. If boards become too harsh, not giving CEOs the true value of their talent,then in the long run qualified CEOs might not be willing to work in these
CEO Compensation and Board Structure 259
jobs, and the quality of these firms would likely deteriorate. Moreover, suchrequirements might lead to less competition from middle-level managers withrespect to CEO positions, since the positions would be associated with lowercompensation. Less competition could therefore adversely affect the quality ofthe management pool in the future. Also, too great a reduction in the incentivebase for compensation could make managers less willing to take risks and resultin their incentives becoming misaligned with those of the firm.
In this study, we cannot fully resolve the optimality question, partly becausenot enough time has passed since the relevant legislation became effective tocheck its effect on the operation of CEOs and firms. However, we point to severalpieces of evidence that suggest that the effect could differ across firms. First,we find that the existence of other monitoring mechanisms reduces the effectof independent directors on compensation. To the extent that the independencerequirements are costly, and to the extent that other mechanisms already exist,these requirements might be suboptimal in firms that have other monitoringmechanisms in place. Second, in other studies, Chhaochharia and Grinstein(2007) and Wintoki (2007) look at the announcement effect of director rules onequity value. Chhaochharia and Grinstein (2007) compare the announcementeffect of the more affected firms to the announcement effect of the less affectedfirms and find that the effect is positive in large firms but negative in smallfirms. Wintoki (2007) constructs a composite index of the costs and benefitsof having independent directors. He finds that firms with higher costs andlower benefits have a lower announcement effect than firms with lower costsand higher benefits. Together, these findings suggest that the requirements forboards could be suboptimal, at least with respect to some of the firms.19
VI. Conclusion
Using the difference-in-difference approach we find that the firms that wereleast compliant with the new governance regulations passed in 2002 decreasedcompensation to their CEOs after the announcement of the rules. The decreasewas on the order of 17% over and above the decrease in firms that were morecompliant before the rules. These results suggest that requirements for boardstructure and board procedures have a significant effect on the structure andsize of CEO compensation. We also show that other monitoring mechanismssuch as the existence of a large blockholder on the board reduce the effect ofboard structure and procedures on compensation decisions.
We do not find support for the argument that the effect above comes frominvestor pressure or from the option expensing rule. The results suggest that
19 Since small firms seem to suffer more by the rules than larger firms, we check whether thedrop in the compensation is related to firm size. We therefore rerun regression (1) except that weseparate noncomplying firms that belong to the SmallCap 600 index (a total of 40 firms) from therest of the firms. We find that the coefficient on the small cap firms is –0.11 (standard deviation0.08) while the coefficient on the larger firms is –0.21 (standard deviation 0.12). Thus, it seemsthat larger firms observed a somewhat larger drop in compensation than small firms. However, atest for differences in the coefficients fails to reject the null that the two coefficients are the same.
260 The Journal of Finance R©
it is the change in board structure and procedures that is associated with thedrop in compensation.
We see two avenues for future research. First, it would be interesting toexplore whether changes in board structure affected other board policies, suchas CEO replacement policies or nomination policies of new directors. Second, itwould be important to explore whether these changes in boards had an actualimpact on corporate performance in the long run.
REFERENCESAdams, Renee, and Daniel Ferreira, 2006, A theory of friendly boards, Journal of Finance 62,
217–250.Angbazo, Lazarus, and Ranga Narayanan, 1997, Top management compensation and the structure
of the board of directors in commercial banks, European Finance Review 1, 237–257.Bebchuk, Lucian A., and Jesse M. Fried, 2003, Executive compensation as an agency problem,
Journal of Economic Perspectives 17, 71–92.Bebchuk, Lucian A., and Jesse M. Fried, 2004, Pay Without Performance (Harvard University
Press, Cambridge, MA).Bertrand, Marianne, and Sendhil Mullainathan, 1999, Corporate governance and executive pay:
Evidence from takeover legislation, Working paper, Harvard University.Bertrand, Marianne, and Sendhil Mullainathan, 2001, Are CEOs rewarded for luck? The ones
without principals are, Quarterly Journal of Economics, 116, 901–932.Boone, Audra, Laura C. Field, Jonathan M. Karpoff, and Charu G. Raheja, 2007, The determinants
of corporate board size and composition: An empirical analysis, Journal of Financial Economics85, 66–101.
Chhaochharia, Vidhi, and Yaniv Grinstein, 2007, Corporate governance and firm value: The impactof the 2002 governance rules, Journal of Finance 62, 1789–1826.
Coles, Jeffrey L., Daniel D. Naveen, and Lalitha Naveen, 2008, Boards: Does one size fit all, Journalof Financial Economics 87, 329–356.
Core, John E., Robert W. Holthausen, and David F. Larcker, 1999, Corporate governance, CEOcompensation, and firm performance, Journal of Financial Economics 51, 371–406.
Cyert, Richard, Sok-Hyon Kang, and Praveen Kumar, 2002, Corporate governance, takeovers, andtop-management compensation: Theory and evidence, Management Science 48, 453–469.
Dahya, Jay, John J. McConnell, and Nickolaos G. Travlos, 2002, The Cadbury committee, corporateperformance, and top management turnover, Journal of Finance 67, 461–483.
Fama, Eugene F., 1980, Agency problems and the theory of the firm, Journal of Political Economics88, 288–307.
Fama, Eugene F., and Kenneth R. French, 1997, Industry cost of equity, Journal of FinancialEconomics 43, 153–193.
Fama, Eugene F., and Michael C. Jensen, 1983, Separation of ownership and control, Journal ofLaw and Economics 26, 301–325.
Gabaix, Xavier, and Augustin Landier, 2008, Why has CEO pay increased so much? QuarterlyJournal of Economics 123, 49–100.
Grinstein, Yaniv, and Paul Hribar, 2004, CEO compensation and incentives: Evidence from M&Abonuses, Journal of Financial Economics 73, 119–143.
Hall, Brian J., and Kevin J. Murphy, 2003, The trouble with stock options, Journal of EconomicPerspectives 17, 49–70.
Hallock, Kevin F., 1997, Reciprocally interlocking boards of directors and executive compensation,Journal of Financial and Quantitative Analysis 32, 331–344.
Harris, Milton, and Artur Raviv, 2008, A theory of board control and size, Review of FinancialStudies 21, 1787–1832.
Hartzell, Jay C., and Laura T. Starks, 2003, Institutional investors and executive compensation,Journal of Finance 58, 2351–2374.
CEO Compensation and Board Structure 261
Hermalin, Benjamin H., and Michael S. Weisbach, 1998, Endogenously chosen boards of directorsand their monitoring of the CEO, American Economic Review 88, 96–118.
Hermalin, Benjamin H., and Michael S. Weisbach, 2003, Boards of directors as an endogenously de-termined institution: A survey of the economic literature, Federal Bank of New York EconomicPolicy Review 9, 7–26.
Himmelberg, Charles P., and Glenn R. Hubbard, 2000, Incentive pay and the market for CEOs: Ananalysis of pay-for-performance sensitivity, Working paper, Columbia University.
Hubbard, Glenn R., 2005, Pay without performance: A market equilibrium critique, Journal ofCorporation Law, (Summer 2005), 717–720.
Jensen, Michael C., 1993, The modern industrial revolution, exit, and the failure of internal controlsystems, Journal of Finance 48, 831–880.
John, Kose, and Lemma W. Senbet, 2003, Executive compensation: Issues and reform proposals,Working paper, University of Maryland.
Kaplan, Steven N., and Bernadette Minton, 2006, How has CEO turnover changed? Increasinglyperformance sensitive boards and increasingly uneasy CEOs, Working paper, University ofChicago.
Leuz, Christian, Alexander J. Triantis, and Tracy Wang, 2008, Why do firms go dark? Causesand economic consequences of voluntary SEC deregistrations, Journal of Accounting and Eco-nomics 45, 181–208.
Linck, James S., Jeffry M. Netter, and Tina Yang, 2008, The determinants of board structure,Journal of Financial Economics 87, 308–328.
Meyer, Bruce D., 1995, Natural and quasi-experiments in economics, Journal of Business & Eco-nomic Statistics 13, 151–161.
Murphy, Kevin J., 2003, Stock-based pay in new-economy firms, Journal of Accounting and Eco-nomics 34, 129–147.
Raheja, Charu, 2005, Determinants of board size and composition: A theory of corporate boards,Journal of Financial and Quantitative Analysis 40, 283–306.
Rosen, Sherwin, 1990, Contracts and the market for executives, NBER Working paper #W3542.Shivdasani, Anil, and David Yermack, 1999, CEO involvement in the selection of new board mem-
bers: An empirical analysis, Journal of Finance 54, 1829–1853.Spatt, Chester, 2006, Executive compensation and contracting, Working paper, SEC and Carnegie
Mellon University.Thorburn, Karin S., 1997, Comment on top management compensation and the structure of the
board of directors in commercial banks, European Finance Review 1, 261–264.Vafeas, Nikos, 2003, Length of board tenure and outside director independence, Journal of Business
Finance & Accounting 30, 1043–1064.Wintoki, Babajide M., 2007, Corporate boards and regulation: The effect of the Sarbanes-Oxley
Act and the exchange listing requirements on firm value, Journal of Corporate Finance 13,229–250.
Yermack, David, 1996, Higher market valuation of companies with a small board of directors,Journal of Financial Economics 40, 185–211.