Central Role for MCP-1/CCL2 in Injury-Induced Inflammation...
18
Central Role for MCP-1/CCL2 in Injury-Induced Inflammation Revealed by In Vitro, In Silico, and Clinical Studies Cordelia Ziraldo 1,2,4. , Yoram Vodovotz 1,3. , Rami A. Namas 1 , Khalid Almahmoud 1 , Victor Tapias 5 , Qi Mi 3,6 , Derek Barclay 1 , Bahiyyah S. Jefferson 1 , Guoqiang Chen 1,7 , Timothy R. Billiar 1,3 , Ruben Zamora 1,3 * 1 Department of Surgery, University of Pittsburgh School of Medicine, Pittsburgh, Pennsylvania, United States of America, 2 Department of Computational and Systems Biology, University of Pittsburgh School of Medicine, Pittsburgh, Pennsylvania, United States of America, 3 Center for Inflammation and Regenerative Modeling, McGowan Institute for Regenerative Medicine, Pittsburgh, Pennsylvania, United States of America, 4 Joint Carnegie Mellon University – University of Pittsburgh Ph.D. Program in Computational Biology, Pittsburgh, Pennsylvania, United States of America, 5 Department of Neurology and Pittsburgh Institute for Neurodegenerative Diseases, University of Pittsburgh, Pittsburgh, Pennsylvania, United States of America, 6 Sports Medicine and Nutrition, University of Pittsburgh School of Medicine, Pittsburgh, Pennsylvania, United States of America, 7 Department of Anesthesiology, Shanghai Tenth People’s Hospital, Tongji University School of Medicine, Shanghai, China Abstract The translation of in vitro findings to clinical outcomes is often elusive. Trauma/hemorrhagic shock (T/HS) results in hepatic hypoxia that drives inflammation. We hypothesize that in silico methods would help bridge in vitro hepatocyte data and clinical T/HS, in which the liver is a primary site of inflammation. Primary mouse hepatocytes were cultured under hypoxia (1% O 2 ) or normoxia (21% O 2 ) for 1–72 h, and both the cell supernatants and protein lysates were assayed for 18 inflammatory mediators by Luminex TM technology. Statistical analysis and data-driven modeling were employed to characterize the main components of the cellular response. Statistical analyses, hierarchical and k-means clustering, Principal Component Analysis, and Dynamic Network Analysis suggested MCP-1/CCL2 and IL-1a as central coordinators of hepatocyte-mediated inflammation in C57BL/6 mouse hepatocytes. Hepatocytes from MCP-1-null mice had altered dynamic inflammatory networks. Circulating MCP-1 levels segregated human T/HS survivors from non-survivors. Furthermore, T/HS survivors with elevated early levels of plasma MCP-1 post-injury had longer total lengths of stay, longer intensive care unit lengths of stay, and prolonged requirement for mechanical ventilation vs. those with low plasma MCP-1. This study identifies MCP-1 as a main driver of the response of hepatocytes in vitro and as a biomarker for clinical outcomes in T/HS, and suggests an experimental and computational framework for discovery of novel clinical biomarkers in inflammatory diseases. Citation: Ziraldo C, Vodovotz Y, Namas RA, Almahmoud K, Tapias V, et al. (2013) Central Role for MCP-1/CCL2 in Injury-Induced Inflammation Revealed by In Vitro, In Silico, and Clinical Studies. PLoS ONE 8(12): e79804. doi:10.1371/journal.pone.0079804 Editor: Ioannis P. Androulakis, Rutgers University, United States of America Received August 7, 2013; Accepted October 4, 2013; Published December 3, 2013 Copyright: ß 2013 Ziraldo et al. This is an open-access article distributed under the terms of the Creative Commons Attribution License, which permits unrestricted use, distribution, and reproduction in any medium, provided the original author and source are credited. Funding: This work was supported by National Institutes of Health grants P50-GM-53789 and UO1-DK072146. The funders had no role in study design, data collection and analysis, decision to publish, or preparation of the manuscript. Competing Interests: The authors have declared that no competing interests exist. * E-mail: [email protected] . These authors contributed equally to this work. Introduction Among many other functions, the liver plays a critical role in inflammation and innate immunity, processes that are controlled by multiple cell types including hepatocytes, Kupffer cells, and other non-parenchymal cells. Although at least 15 different cell types can be found in normal liver [1], hepatocytes constitute the largest pool of parenchymal cells, comprising approximately 60– 80% of the total liver cells [1,2]. Inflammatory conditions such as ischemia/reperfusion (I/R) and post-trauma hemorrhagic shock (T/HS) are associated with liver hypoxia [3,4]. It is now accepted that hypoxia is not merely an outcome of the inflammatory response, but rather is a key driver of the development of inflammation through the regulation of O 2 -dependent signal transduction and gene expression [5,6]. Mathematical and computational (in silico) methods have emerged as adjuncts to in vitro and in vivo studies of acute inflammation [7]. For example, we have recently applied both mechanistic and data-driven computational modeling to help define the dynamic, multi-dimensional inflammatory response to T/HS in vivo [8–12]. The goal of the present study was to determine if combined in vitro/in silico studies could help elucidate key hepatic inflammatory mediators relevant to human T/HS. This study identifies the chemokine Monocyte Chemoattractant Protein-1 (MCP-1/CCL2) as a main driver of the response of hepatocytes in vitro and as a biomarker for organ damage in clinical settings of T/HS, and, more generally, suggests a pathway for combined experimental and computa- tional studies to facilitate the discovery of novel clinical biomarkers of inflammation. PLOS ONE | www.plosone.org 1 December 2013 | Volume 8 | Issue 12 | e79804
Transcript of Central Role for MCP-1/CCL2 in Injury-Induced Inflammation...
Central Role for MCP-1/CCL2 in Injury-InducedInflammation Revealed by In Vitro, In Silico, and ClinicalStudiesCordelia Ziraldo1,2,4., Yoram Vodovotz1,3., Rami A. Namas1, Khalid Almahmoud1, Victor Tapias5,
Qi Mi3,6, Derek Barclay1, Bahiyyah S. Jefferson1, Guoqiang Chen1,7, Timothy R. Billiar1,3,
Ruben Zamora1,3*
1 Department of Surgery, University of Pittsburgh School of Medicine, Pittsburgh, Pennsylvania, United States of America, 2 Department of Computational and Systems
Biology, University of Pittsburgh School of Medicine, Pittsburgh, Pennsylvania, United States of America, 3 Center for Inflammation and Regenerative Modeling, McGowan
Institute for Regenerative Medicine, Pittsburgh, Pennsylvania, United States of America, 4 Joint Carnegie Mellon University – University of Pittsburgh Ph.D. Program in
Computational Biology, Pittsburgh, Pennsylvania, United States of America, 5 Department of Neurology and Pittsburgh Institute for Neurodegenerative Diseases,
University of Pittsburgh, Pittsburgh, Pennsylvania, United States of America, 6 Sports Medicine and Nutrition, University of Pittsburgh School of Medicine, Pittsburgh,
Pennsylvania, United States of America, 7 Department of Anesthesiology, Shanghai Tenth People’s Hospital, Tongji University School of Medicine, Shanghai, China
Abstract
The translation of in vitro findings to clinical outcomes is often elusive. Trauma/hemorrhagic shock (T/HS) results in hepatichypoxia that drives inflammation. We hypothesize that in silico methods would help bridge in vitro hepatocyte data andclinical T/HS, in which the liver is a primary site of inflammation. Primary mouse hepatocytes were cultured under hypoxia(1% O2) or normoxia (21% O2) for 1–72 h, and both the cell supernatants and protein lysates were assayed for 18inflammatory mediators by LuminexTM technology. Statistical analysis and data-driven modeling were employed tocharacterize the main components of the cellular response. Statistical analyses, hierarchical and k-means clustering, PrincipalComponent Analysis, and Dynamic Network Analysis suggested MCP-1/CCL2 and IL-1a as central coordinators ofhepatocyte-mediated inflammation in C57BL/6 mouse hepatocytes. Hepatocytes from MCP-1-null mice had altered dynamicinflammatory networks. Circulating MCP-1 levels segregated human T/HS survivors from non-survivors. Furthermore, T/HSsurvivors with elevated early levels of plasma MCP-1 post-injury had longer total lengths of stay, longer intensive care unitlengths of stay, and prolonged requirement for mechanical ventilation vs. those with low plasma MCP-1. This studyidentifies MCP-1 as a main driver of the response of hepatocytes in vitro and as a biomarker for clinical outcomes in T/HS,and suggests an experimental and computational framework for discovery of novel clinical biomarkers in inflammatorydiseases.
Citation: Ziraldo C, Vodovotz Y, Namas RA, Almahmoud K, Tapias V, et al. (2013) Central Role for MCP-1/CCL2 in Injury-Induced Inflammation Revealed by In Vitro,In Silico, and Clinical Studies. PLoS ONE 8(12): e79804. doi:10.1371/journal.pone.0079804
Editor: Ioannis P. Androulakis, Rutgers University, United States of America
Received August 7, 2013; Accepted October 4, 2013; Published December 3, 2013
Copyright: � 2013 Ziraldo et al. This is an open-access article distributed under the terms of the Creative Commons Attribution License, which permitsunrestricted use, distribution, and reproduction in any medium, provided the original author and source are credited.
Funding: This work was supported by National Institutes of Health grants P50-GM-53789 and UO1-DK072146. The funders had no role in study design, datacollection and analysis, decision to publish, or preparation of the manuscript.
Competing Interests: The authors have declared that no competing interests exist.
* E-mail: [email protected]
. These authors contributed equally to this work.
Introduction
Among many other functions, the liver plays a critical role in
inflammation and innate immunity, processes that are controlled
by multiple cell types including hepatocytes, Kupffer cells, and
other non-parenchymal cells. Although at least 15 different cell
types can be found in normal liver [1], hepatocytes constitute the
largest pool of parenchymal cells, comprising approximately 60–
80% of the total liver cells [1,2]. Inflammatory conditions such as
ischemia/reperfusion (I/R) and post-trauma hemorrhagic shock
(T/HS) are associated with liver hypoxia [3,4]. It is now accepted
that hypoxia is not merely an outcome of the inflammatory
response, but rather is a key driver of the development of
inflammation through the regulation of O2-dependent signal
transduction and gene expression [5,6].
Mathematical and computational (in silico) methods have
emerged as adjuncts to in vitro and in vivo studies of acute
inflammation [7]. For example, we have recently applied both
mechanistic and data-driven computational modeling to help
define the dynamic, multi-dimensional inflammatory response
to T/HS in vivo [8–12]. The goal of the present study was to
determine if combined in vitro/in silico studies could help
elucidate key hepatic inflammatory mediators relevant to
human T/HS. This study identifies the chemokine Monocyte
Chemoattractant Protein-1 (MCP-1/CCL2) as a main driver of
the response of hepatocytes in vitro and as a biomarker for organ
damage in clinical settings of T/HS, and, more generally,
suggests a pathway for combined experimental and computa-
tional studies to facilitate the discovery of novel clinical
biomarkers of inflammation.
PLOS ONE | www.plosone.org 1 December 2013 | Volume 8 | Issue 12 | e79804

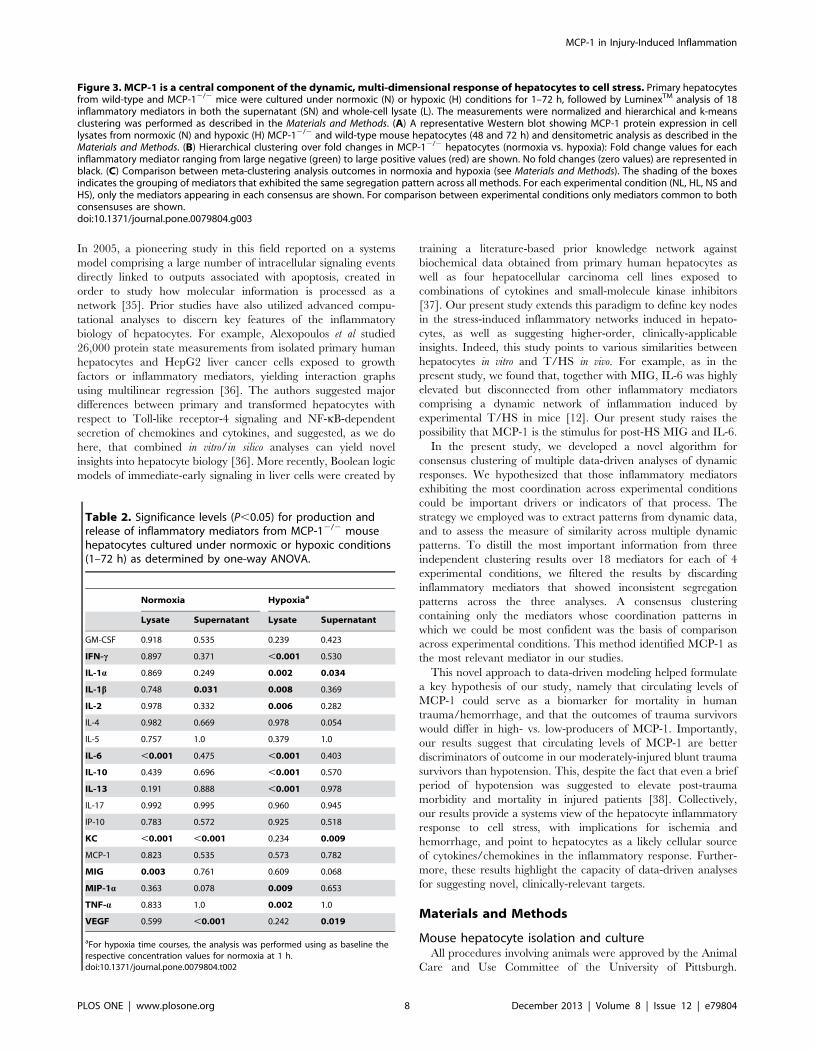
Results
MCP-1 is a central component of the dynamic, multi-dimensional response of hepatocytes to cell stress
To assess the response of hepatocytes to hypoxia, primary wild-
type mouse hepatocytes were subjected to 1% O2 for 1–72 h, and
18 mouse cytokines were measured in both the supernatant and
whole-cell lysate. Hepatocytes cultured under normoxic (21% O2)
conditions served as controls. One-way ANOVA showed that, in
normoxic hepatocytes, MCP-1, KC, and IP-10 (in lysates) and
MCP-1, KC, and MIG (in supernatants) were altered significantly
(Table 1). In hypoxic hepatocytes, the significantly altered
mediators were MCP-1, MIG, IL-1a, IL-1b, IL-10, and IL-13
(in lysates) and MCP-1, IP-10, IL-1a, and VEGF (in supernatants).
Thus, MCP-1 was the only mediator that exhibited significant
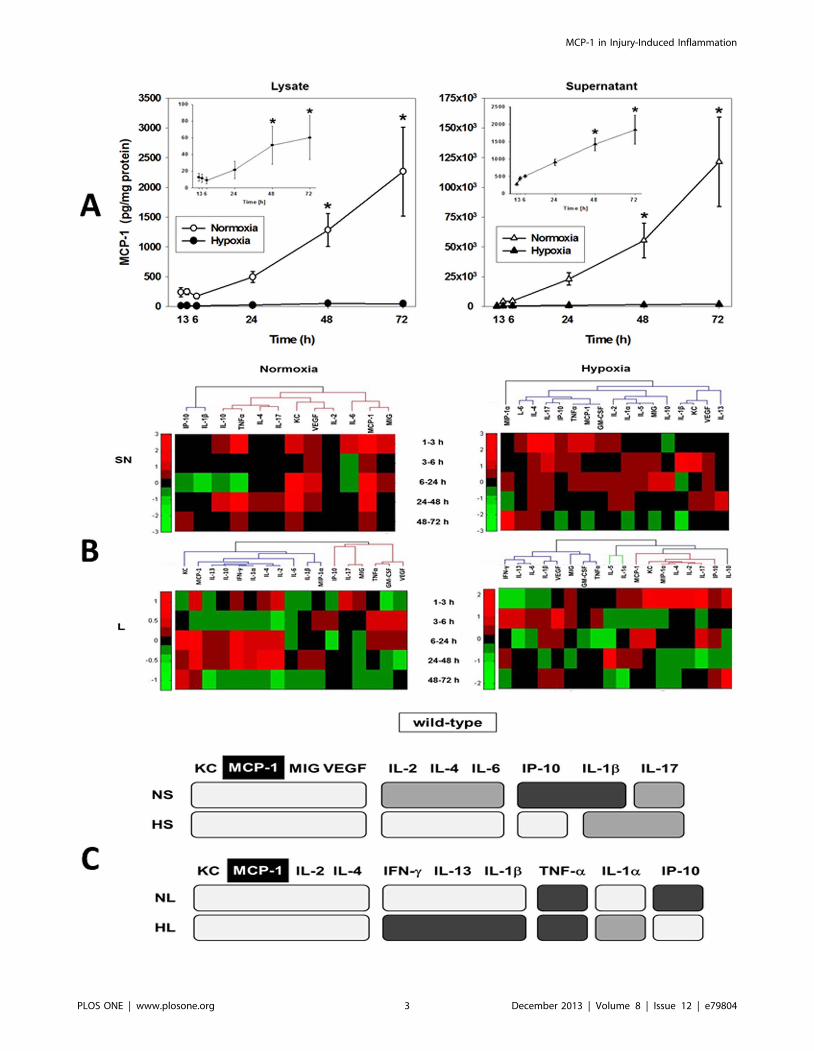
changes in all four conditions examined, as shown in Fig. 1A.
Hierarchical Clustering and Principal Component Analysisreveal key differences in inflammatory mediatorproduction/release in the hepatocyte response to cellstress
In order to address the question of which groups of mediators
exhibit similar dynamics in normoxic and hypoxic hepatocytes, we
performed hierarchical clustering on fold changes for each
mediator at each pair of consecutive time points. We examined
both raw values and fold change values for all mediators over each
time interval. Each inflammatory mediator’s values over time
made up its dynamic pattern of expression and release. To identify
those inflammatory mediators that showed similar production or
secretion behavior, these patterns were then compared and
grouped using hierarchical clustering, with inflammatory media-
tors in the resulting dendrogram ordered according to their
membership in the clusters that emerged (Fig. 1B).
We also sought to determine the subset of mediators that evolve
dynamically in a manner that is most characteristic of the response
to normoxia or hypoxia, respectively. Inflammatory mediators that
have similar patterns of covariance have similar loadings onto
principal components, and so would be expected to project in a
similar direction in principal component space. We therefore used
the angle of an inflammatory mediator’s projection into principal
component space as the basis of a distance metric in k-means
clustering (Figures S1, S2, S3, S4). This analysis suggested that,
despite an overlap in common mediators, k-means clustering could
differentiate normoxia from hypoxia and lysates from superna-
tants. Furthermore, MCP-1 and KC were generally grouped
together and were the predominant mediators along the first
principal component.
A predominant role for MCP-1, KC, and IL-1a in thehepatocyte response to stress inferred from DynamicNetwork Analysis
We sought to determine the consensus of the three aforemen-
tioned, independent clustering experiments. If the cluster mem-
berships were similar, then those mediators that did not segregate
consistently across different clusterings could be treated as noise.
In contrast, those inflammatory mediators that consistently
segregated together were considered as mediators exhibiting
similar or correlated dynamic trajectories. We first calculated an
Adjusted Rand Index (ARI) [13–16] to quantify the degree to
which any two clustering results were in agreement. This
comparison (see Figures S9, S10, S11, S12) resulted in a
‘‘consensus clustering’’ showing the inflammatory mediators that
exhibited the same segregation pattern across all analysis methods,
suggesting that MCP-1 and KC segregate together across all
experimental conditions (Fig. 1C).
This meta-clustering analysis suggested groups of inflammatory
mediators with similar dynamic patterns. We next performed
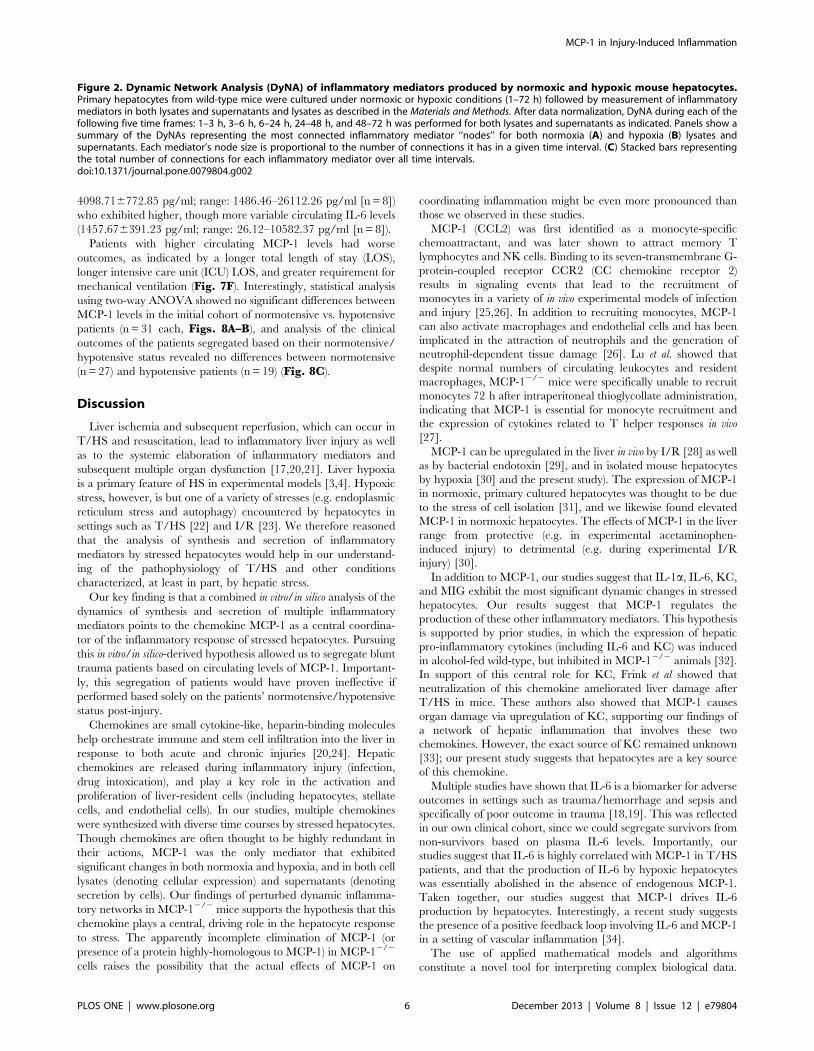
Dynamic Network Analysis (DyNA) [12] to suggest mediators that
appear to be ‘‘hubs’’ (or most connected to other mediators).
(Figs. 2A–B; Figure S17). The total number of dynamic network
connections is shown in Fig. 2C. Based on DyNA, MCP-1 and
KC were the most connected mediators across all time points in
normoxia supernatants, and at 24–72 h in normoxia lysates
(Fig. 2A). In hypoxia, the most connected inflammatory mediators
were IL-1a and VEGF in supernatants and IL-1a and MIP-1a in
lysates (Fig. 2B). Overall, the most connected inflammatory
mediators were MCP-1 and IL-1a, with MCP-1 being the only
highly-connected node present in all experimental conditions
examined (Fig. 2C).
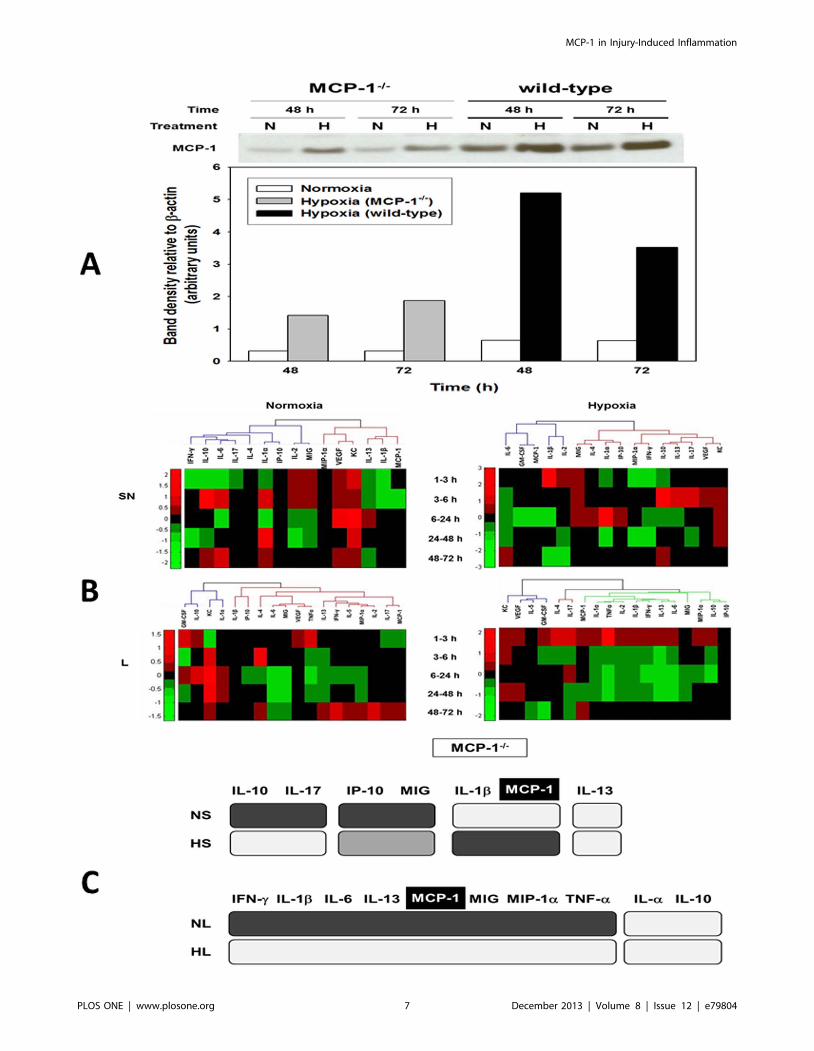
Inflammatory dynamics and networks are disrupted inMCP-12/2 hepatocytes
Hypothesizing a central role for MCP-1 in the response of
mouse hepatocytes to cell stress based on the above analyses, we
repeated these experiments using hepatocytes from MCP-12/2
mice. We first sought to verify that MCP-1 was absent in MCP-
12/2 mice. As shown in Fig. 3A, normoxic hepatocytes from
MCP-12/2 mice did not express MCP-1 by Western blot, while a
weaker band of approx. 30 kDa was detected in the lysates from
hypoxic cells. In contrast, MCP-1 protein expression was
significantly higher in cell lysates of both normoxic and hypoxic
hepatocytes from wild-type mice at 48 and 72 h (Fig. 3A). This
Table 1. Significance levels (P,0.05) for production andrelease of inflammatory mediators from wild-type mousehepatocytes cultured under normoxic or hypoxic conditions(1–72 h) as determined by one-way ANOVA.
Normoxia Hypoxiaa
Lysate Supernatant Lysate Supernatant
GM-CSF 0.721 1.0 0.753 0.086
IFN-c 0.105 1.0 0.452 1.0
IL-1a 0.591 1.0 0.023 0.007
IL-1b 0.559 0.664 0.026 0.886
IL-2 0.126 0.929 0.240 0.919
IL-4 0.901 0.942 0.935 0.656
IL-5 1.0 1.0 0.123 0.101
IL-6 0.091 0.914 0.223 0.059
IL-10 0.346 0.947 0.035 0.832
IL-13 0.601 1.0 0.002 0.650
IL-17 0.980 0.921 0.958 0.999
IP-10 0.045 0.513 0.135 0.046
KC 0.002 ,0.001 0.374 0.283
MCP-1 0.001 ,0.001 0.003 ,0.001
MIG 0.150 0.002 0.016 0.177
MIP-1a 0.636 0.416 0.081 0.543
TNF-a 0.987 0.685 0.056 0.999
VEGF 0.271 ,0.001 0.073 ,0.001
aFor hypoxia time courses, the analysis was performed using as baseline therespective concentration values for normoxia at 1 h.doi:10.1371/journal.pone.0079804.t001
MCP-1 in Injury-Induced Inflammation
PLOS ONE | www.plosone.org 2 December 2013 | Volume 8 | Issue 12 | e79804
MCP-1 in Injury-Induced Inflammation
PLOS ONE | www.plosone.org 3 December 2013 | Volume 8 | Issue 12 | e79804
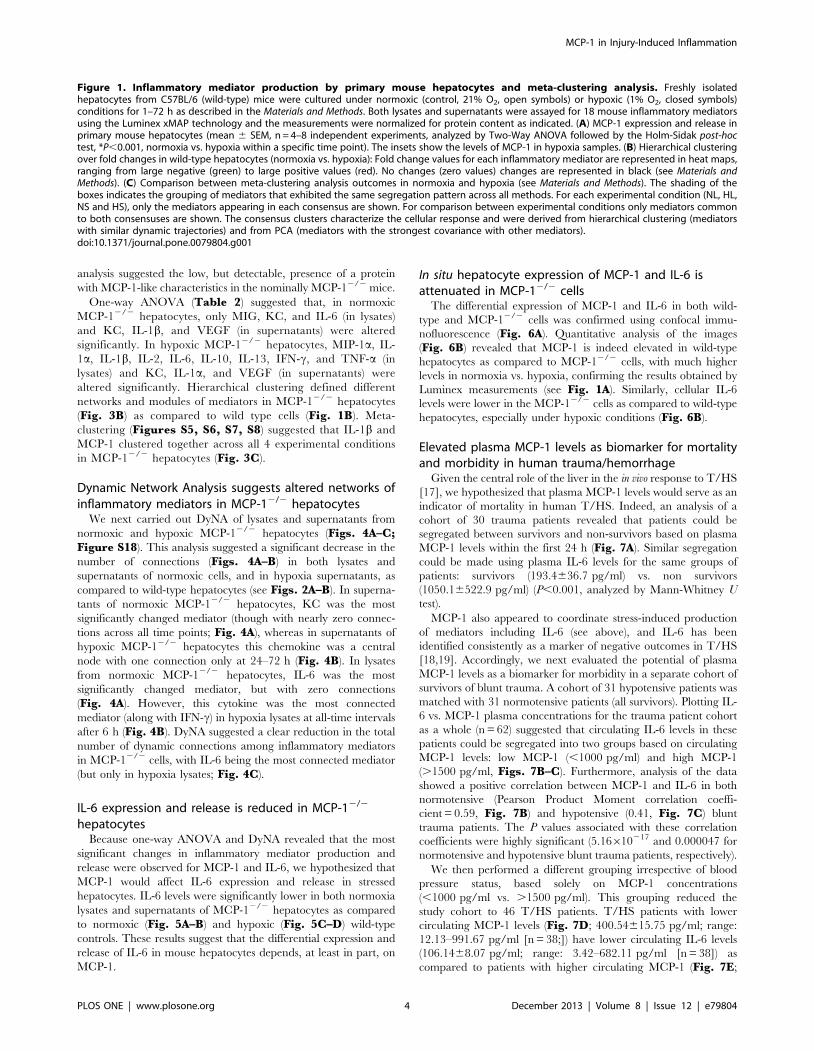
analysis suggested the low, but detectable, presence of a protein
with MCP-1-like characteristics in the nominally MCP-12/2 mice.
One-way ANOVA (Table 2) suggested that, in normoxic
MCP-12/2 hepatocytes, only MIG, KC, and IL-6 (in lysates)
and KC, IL-1b, and VEGF (in supernatants) were altered
significantly. In hypoxic MCP-12/2 hepatocytes, MIP-1a, IL-
1a, IL-1b, IL-2, IL-6, IL-10, IL-13, IFN-c, and TNF-a (in
lysates) and KC, IL-1a, and VEGF (in supernatants) were
altered significantly. Hierarchical clustering defined different
networks and modules of mediators in MCP-12/2 hepatocytes
(Fig. 3B) as compared to wild type cells (Fig. 1B). Meta-
clustering (Figures S5, S6, S7, S8) suggested that IL-1b and
MCP-1 clustered together across all 4 experimental conditions
in MCP-12/2 hepatocytes (Fig. 3C).
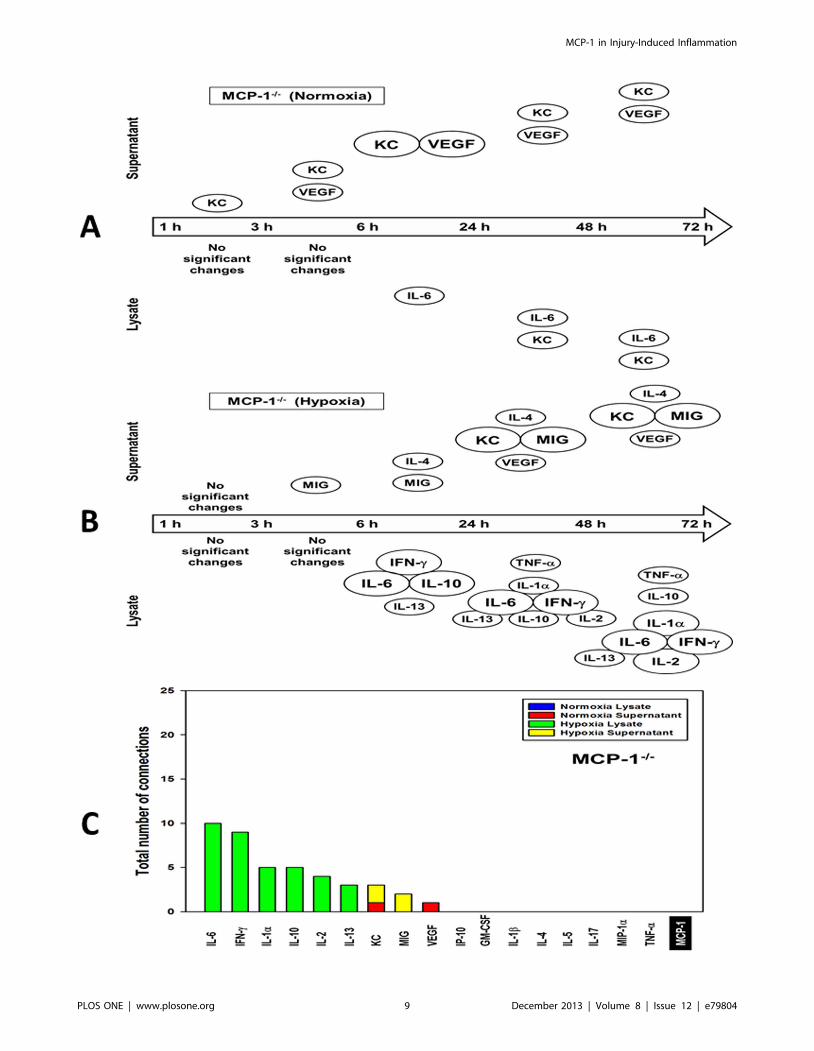
Dynamic Network Analysis suggests altered networks ofinflammatory mediators in MCP-12/2 hepatocytes
We next carried out DyNA of lysates and supernatants from
normoxic and hypoxic MCP-12/2 hepatocytes (Figs. 4A–C;Figure S18). This analysis suggested a significant decrease in the
number of connections (Figs. 4A–B) in both lysates and
supernatants of normoxic cells, and in hypoxia supernatants, as
compared to wild-type hepatocytes (see Figs. 2A–B). In superna-
tants of normoxic MCP-12/2 hepatocytes, KC was the most
significantly changed mediator (though with nearly zero connec-
tions across all time points; Fig. 4A), whereas in supernatants of
hypoxic MCP-12/2 hepatocytes this chemokine was a central
node with one connection only at 24–72 h (Fig. 4B). In lysates
from normoxic MCP-12/2 hepatocytes, IL-6 was the most
significantly changed mediator, but with zero connections
(Fig. 4A). However, this cytokine was the most connected
mediator (along with IFN-c) in hypoxia lysates at all-time intervals
after 6 h (Fig. 4B). DyNA suggested a clear reduction in the total
number of dynamic connections among inflammatory mediators
in MCP-12/2 cells, with IL-6 being the most connected mediator
(but only in hypoxia lysates; Fig. 4C).
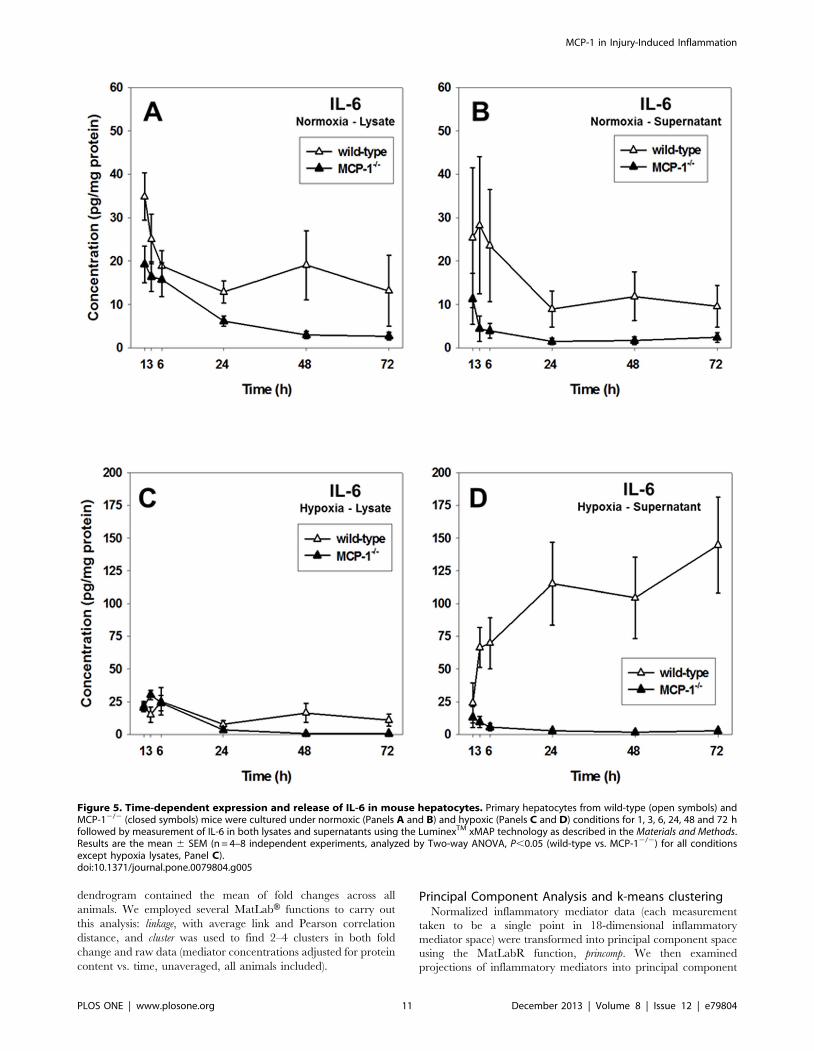
IL-6 expression and release is reduced in MCP-12/2
hepatocytesBecause one-way ANOVA and DyNA revealed that the most
significant changes in inflammatory mediator production and
release were observed for MCP-1 and IL-6, we hypothesized that
MCP-1 would affect IL-6 expression and release in stressed
hepatocytes. IL-6 levels were significantly lower in both normoxia
lysates and supernatants of MCP-12/2 hepatocytes as compared
to normoxic (Fig. 5A–B) and hypoxic (Fig. 5C–D) wild-type
controls. These results suggest that the differential expression and
release of IL-6 in mouse hepatocytes depends, at least in part, on
MCP-1.
In situ hepatocyte expression of MCP-1 and IL-6 isattenuated in MCP-12/2 cells
The differential expression of MCP-1 and IL-6 in both wild-
type and MCP-12/2 cells was confirmed using confocal immu-
nofluorescence (Fig. 6A). Quantitative analysis of the images
(Fig. 6B) revealed that MCP-1 is indeed elevated in wild-type
hepatocytes as compared to MCP-12/2 cells, with much higher
levels in normoxia vs. hypoxia, confirming the results obtained by
Luminex measurements (see Fig. 1A). Similarly, cellular IL-6
levels were lower in the MCP-12/2 cells as compared to wild-type
hepatocytes, especially under hypoxic conditions (Fig. 6B).
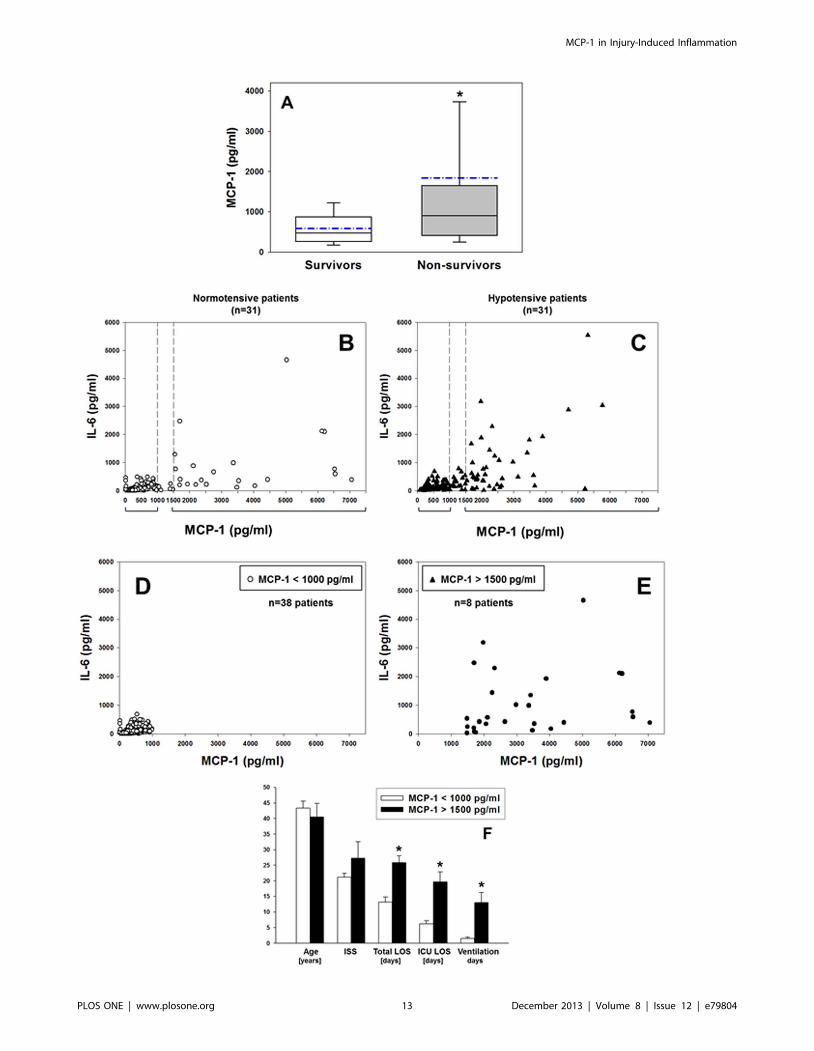
Elevated plasma MCP-1 levels as biomarker for mortalityand morbidity in human trauma/hemorrhage
Given the central role of the liver in the in vivo response to T/HS
[17], we hypothesized that plasma MCP-1 levels would serve as an
indicator of mortality in human T/HS. Indeed, an analysis of a
cohort of 30 trauma patients revealed that patients could be
segregated between survivors and non-survivors based on plasma
MCP-1 levels within the first 24 h (Fig. 7A). Similar segregation
could be made using plasma IL-6 levels for the same groups of
patients: survivors (193.4636.7 pg/ml) vs. non survivors
(1050.16522.9 pg/ml) (P,0.001, analyzed by Mann-Whitney U
test).
MCP-1 also appeared to coordinate stress-induced production
of mediators including IL-6 (see above), and IL-6 has been
identified consistently as a marker of negative outcomes in T/HS
[18,19]. Accordingly, we next evaluated the potential of plasma
MCP-1 levels as a biomarker for morbidity in a separate cohort of
survivors of blunt trauma. A cohort of 31 hypotensive patients was
matched with 31 normotensive patients (all survivors). Plotting IL-
6 vs. MCP-1 plasma concentrations for the trauma patient cohort
as a whole (n = 62) suggested that circulating IL-6 levels in these
patients could be segregated into two groups based on circulating
MCP-1 levels: low MCP-1 (,1000 pg/ml) and high MCP-1
(.1500 pg/ml, Figs. 7B–C). Furthermore, analysis of the data
showed a positive correlation between MCP-1 and IL-6 in both
normotensive (Pearson Product Moment correlation coeffi-
cient = 0.59, Fig. 7B) and hypotensive (0.41, Fig. 7C) blunt
trauma patients. The P values associated with these correlation
coefficients were highly significant (5.16610217 and 0.000047 for
normotensive and hypotensive blunt trauma patients, respectively).
We then performed a different grouping irrespective of blood
pressure status, based solely on MCP-1 concentrations
(,1000 pg/ml vs. .1500 pg/ml). This grouping reduced the
study cohort to 46 T/HS patients. T/HS patients with lower
circulating MCP-1 levels (Fig. 7D; 400.54615.75 pg/ml; range:
12.13–991.67 pg/ml [n = 38;]) have lower circulating IL-6 levels
(106.1468.07 pg/ml; range: 3.42–682.11 pg/ml [n = 38]) as
compared to patients with higher circulating MCP-1 (Fig. 7E;
Figure 1. Inflammatory mediator production by primary mouse hepatocytes and meta-clustering analysis. Freshly isolatedhepatocytes from C57BL/6 (wild-type) mice were cultured under normoxic (control, 21% O2, open symbols) or hypoxic (1% O2, closed symbols)conditions for 1–72 h as described in the Materials and Methods. Both lysates and supernatants were assayed for 18 mouse inflammatory mediatorsusing the Luminex xMAP technology and the measurements were normalized for protein content as indicated. (A) MCP-1 expression and release inprimary mouse hepatocytes (mean 6 SEM, n = 4–8 independent experiments, analyzed by Two-Way ANOVA followed by the Holm-Sidak post-hoctest, *P,0.001, normoxia vs. hypoxia within a specific time point). The insets show the levels of MCP-1 in hypoxia samples. (B) Hierarchical clusteringover fold changes in wild-type hepatocytes (normoxia vs. hypoxia): Fold change values for each inflammatory mediator are represented in heat maps,ranging from large negative (green) to large positive values (red). No changes (zero values) changes are represented in black (see Materials andMethods). (C) Comparison between meta-clustering analysis outcomes in normoxia and hypoxia (see Materials and Methods). The shading of theboxes indicates the grouping of mediators that exhibited the same segregation pattern across all methods. For each experimental condition (NL, HL,NS and HS), only the mediators appearing in each consensus are shown. For comparison between experimental conditions only mediators commonto both consensuses are shown. The consensus clusters characterize the cellular response and were derived from hierarchical clustering (mediatorswith similar dynamic trajectories) and from PCA (mediators with the strongest covariance with other mediators).doi:10.1371/journal.pone.0079804.g001
MCP-1 in Injury-Induced Inflammation
PLOS ONE | www.plosone.org 4 December 2013 | Volume 8 | Issue 12 | e79804

MCP-1 in Injury-Induced Inflammation
PLOS ONE | www.plosone.org 5 December 2013 | Volume 8 | Issue 12 | e79804
4098.716772.85 pg/ml; range: 1486.46–26112.26 pg/ml [n = 8])
who exhibited higher, though more variable circulating IL-6 levels
(1457.676391.23 pg/ml; range: 26.12–10582.37 pg/ml [n = 8]).
Patients with higher circulating MCP-1 levels had worse
outcomes, as indicated by a longer total length of stay (LOS),
longer intensive care unit (ICU) LOS, and greater requirement for
mechanical ventilation (Fig. 7F). Interestingly, statistical analysis
using two-way ANOVA showed no significant differences between
MCP-1 levels in the initial cohort of normotensive vs. hypotensive
patients (n = 31 each, Figs. 8A–B), and analysis of the clinical
outcomes of the patients segregated based on their normotensive/
hypotensive status revealed no differences between normotensive
(n = 27) and hypotensive patients (n = 19) (Fig. 8C).
Discussion
Liver ischemia and subsequent reperfusion, which can occur in
T/HS and resuscitation, lead to inflammatory liver injury as well
as to the systemic elaboration of inflammatory mediators and
subsequent multiple organ dysfunction [17,20,21]. Liver hypoxia
is a primary feature of HS in experimental models [3,4]. Hypoxic
stress, however, is but one of a variety of stresses (e.g. endoplasmic
reticulum stress and autophagy) encountered by hepatocytes in
settings such as T/HS [22] and I/R [23]. We therefore reasoned
that the analysis of synthesis and secretion of inflammatory
mediators by stressed hepatocytes would help in our understand-
ing of the pathophysiology of T/HS and other conditions
characterized, at least in part, by hepatic stress.
Our key finding is that a combined in vitro/in silico analysis of the
dynamics of synthesis and secretion of multiple inflammatory
mediators points to the chemokine MCP-1 as a central coordina-
tor of the inflammatory response of stressed hepatocytes. Pursuing
this in vitro/in silico-derived hypothesis allowed us to segregate blunt
trauma patients based on circulating levels of MCP-1. Important-
ly, this segregation of patients would have proven ineffective if
performed based solely on the patients’ normotensive/hypotensive
status post-injury.
Chemokines are small cytokine-like, heparin-binding molecules
help orchestrate immune and stem cell infiltration into the liver in
response to both acute and chronic injuries [20,24]. Hepatic
chemokines are released during inflammatory injury (infection,
drug intoxication), and play a key role in the activation and
proliferation of liver-resident cells (including hepatocytes, stellate
cells, and endothelial cells). In our studies, multiple chemokines
were synthesized with diverse time courses by stressed hepatocytes.
Though chemokines are often thought to be highly redundant in
their actions, MCP-1 was the only mediator that exhibited
significant changes in both normoxia and hypoxia, and in both cell
lysates (denoting cellular expression) and supernatants (denoting
secretion by cells). Our findings of perturbed dynamic inflamma-
tory networks in MCP-12/2 mice supports the hypothesis that this
chemokine plays a central, driving role in the hepatocyte response
to stress. The apparently incomplete elimination of MCP-1 (or
presence of a protein highly-homologous to MCP-1) in MCP-12/2
cells raises the possibility that the actual effects of MCP-1 on
coordinating inflammation might be even more pronounced than
those we observed in these studies.
MCP-1 (CCL2) was first identified as a monocyte-specific
chemoattractant, and was later shown to attract memory T
lymphocytes and NK cells. Binding to its seven-transmembrane G-
protein-coupled receptor CCR2 (CC chemokine receptor 2)
results in signaling events that lead to the recruitment of
monocytes in a variety of in vivo experimental models of infection
and injury [25,26]. In addition to recruiting monocytes, MCP-1
can also activate macrophages and endothelial cells and has been
implicated in the attraction of neutrophils and the generation of
neutrophil-dependent tissue damage [26]. Lu et al. showed that
despite normal numbers of circulating leukocytes and resident
macrophages, MCP-12/2 mice were specifically unable to recruit
monocytes 72 h after intraperitoneal thioglycollate administration,
indicating that MCP-1 is essential for monocyte recruitment and
the expression of cytokines related to T helper responses in vivo
[27].
MCP-1 can be upregulated in the liver in vivo by I/R [28] as well
as by bacterial endotoxin [29], and in isolated mouse hepatocytes
by hypoxia [30] and the present study). The expression of MCP-1
in normoxic, primary cultured hepatocytes was thought to be due
to the stress of cell isolation [31], and we likewise found elevated
MCP-1 in normoxic hepatocytes. The effects of MCP-1 in the liver
range from protective (e.g. in experimental acetaminophen-
induced injury) to detrimental (e.g. during experimental I/R
injury) [30].
In addition to MCP-1, our studies suggest that IL-1a, IL-6, KC,
and MIG exhibit the most significant dynamic changes in stressed
hepatocytes. Our results suggest that MCP-1 regulates the
production of these other inflammatory mediators. This hypothesis
is supported by prior studies, in which the expression of hepatic
pro-inflammatory cytokines (including IL-6 and KC) was induced
in alcohol-fed wild-type, but inhibited in MCP-12/2 animals [32].
In support of this central role for KC, Frink et al showed that
neutralization of this chemokine ameliorated liver damage after
T/HS in mice. These authors also showed that MCP-1 causes
organ damage via upregulation of KC, supporting our findings of
a network of hepatic inflammation that involves these two
chemokines. However, the exact source of KC remained unknown
[33]; our present study suggests that hepatocytes are a key source
of this chemokine.
Multiple studies have shown that IL-6 is a biomarker for adverse
outcomes in settings such as trauma/hemorrhage and sepsis and
specifically of poor outcome in trauma [18,19]. This was reflected
in our own clinical cohort, since we could segregate survivors from
non-survivors based on plasma IL-6 levels. Importantly, our
studies suggest that IL-6 is highly correlated with MCP-1 in T/HS
patients, and that the production of IL-6 by hypoxic hepatocytes
was essentially abolished in the absence of endogenous MCP-1.
Taken together, our studies suggest that MCP-1 drives IL-6
production by hepatocytes. Interestingly, a recent study suggests
the presence of a positive feedback loop involving IL-6 and MCP-1
in a setting of vascular inflammation [34].
The use of applied mathematical models and algorithms
constitute a novel tool for interpreting complex biological data.
Figure 2. Dynamic Network Analysis (DyNA) of inflammatory mediators produced by normoxic and hypoxic mouse hepatocytes.Primary hepatocytes from wild-type mice were cultured under normoxic or hypoxic conditions (1–72 h) followed by measurement of inflammatorymediators in both lysates and supernatants and lysates as described in the Materials and Methods. After data normalization, DyNA during each of thefollowing five time frames: 1–3 h, 3–6 h, 6–24 h, 24–48 h, and 48–72 h was performed for both lysates and supernatants as indicated. Panels show asummary of the DyNAs representing the most connected inflammatory mediator ‘‘nodes’’ for both normoxia (A) and hypoxia (B) lysates andsupernatants. Each mediator’s node size is proportional to the number of connections it has in a given time interval. (C) Stacked bars representingthe total number of connections for each inflammatory mediator over all time intervals.doi:10.1371/journal.pone.0079804.g002
MCP-1 in Injury-Induced Inflammation
PLOS ONE | www.plosone.org 6 December 2013 | Volume 8 | Issue 12 | e79804
MCP-1 in Injury-Induced Inflammation
PLOS ONE | www.plosone.org 7 December 2013 | Volume 8 | Issue 12 | e79804
In 2005, a pioneering study in this field reported on a systems
model comprising a large number of intracellular signaling events
directly linked to outputs associated with apoptosis, created in
order to study how molecular information is processed as a
network [35]. Prior studies have also utilized advanced compu-
tational analyses to discern key features of the inflammatory
biology of hepatocytes. For example, Alexopoulos et al studied
26,000 protein state measurements from isolated primary human
hepatocytes and HepG2 liver cancer cells exposed to growth
factors or inflammatory mediators, yielding interaction graphs
using multilinear regression [36]. The authors suggested major
differences between primary and transformed hepatocytes with
respect to Toll-like receptor-4 signaling and NF-kB-dependent
secretion of chemokines and cytokines, and suggested, as we do
here, that combined in vitro/in silico analyses can yield novel
insights into hepatocyte biology [36]. More recently, Boolean logic
models of immediate-early signaling in liver cells were created by
training a literature-based prior knowledge network against
biochemical data obtained from primary human hepatocytes as
well as four hepatocellular carcinoma cell lines exposed to
combinations of cytokines and small-molecule kinase inhibitors
[37]. Our present study extends this paradigm to define key nodes
in the stress-induced inflammatory networks induced in hepato-
cytes, as well as suggesting higher-order, clinically-applicable
insights. Indeed, this study points to various similarities between
hepatocytes in vitro and T/HS in vivo. For example, as in the
present study, we found that, together with MIG, IL-6 was highly
elevated but disconnected from other inflammatory mediators
comprising a dynamic network of inflammation induced by
experimental T/HS in mice [12]. Our present study raises the
possibility that MCP-1 is the stimulus for post-HS MIG and IL-6.
In the present study, we developed a novel algorithm for
consensus clustering of multiple data-driven analyses of dynamic
responses. We hypothesized that those inflammatory mediators
exhibiting the most coordination across experimental conditions
could be important drivers or indicators of that process. The
strategy we employed was to extract patterns from dynamic data,
and to assess the measure of similarity across multiple dynamic
patterns. To distill the most important information from three
independent clustering results over 18 mediators for each of 4
experimental conditions, we filtered the results by discarding
inflammatory mediators that showed inconsistent segregation
patterns across the three analyses. A consensus clustering
containing only the mediators whose coordination patterns in
which we could be most confident was the basis of comparison
across experimental conditions. This method identified MCP-1 as
the most relevant mediator in our studies.
This novel approach to data-driven modeling helped formulate
a key hypothesis of our study, namely that circulating levels of
MCP-1 could serve as a biomarker for mortality in human
trauma/hemorrhage, and that the outcomes of trauma survivors
would differ in high- vs. low-producers of MCP-1. Importantly,
our results suggest that circulating levels of MCP-1 are better
discriminators of outcome in our moderately-injured blunt trauma
survivors than hypotension. This, despite the fact that even a brief
period of hypotension was suggested to elevate post-trauma
morbidity and mortality in injured patients [38]. Collectively,
our results provide a systems view of the hepatocyte inflammatory
response to cell stress, with implications for ischemia and
hemorrhage, and point to hepatocytes as a likely cellular source
of cytokines/chemokines in the inflammatory response. Further-
more, these results highlight the capacity of data-driven analyses
for suggesting novel, clinically-relevant targets.
Materials and Methods
Mouse hepatocyte isolation and cultureAll procedures involving animals were approved by the Animal
Care and Use Committee of the University of Pittsburgh.
Figure 3. MCP-1 is a central component of the dynamic, multi-dimensional response of hepatocytes to cell stress. Primary hepatocytesfrom wild-type and MCP-12/2 mice were cultured under normoxic (N) or hypoxic (H) conditions for 1–72 h, followed by LuminexTM analysis of 18inflammatory mediators in both the supernatant (SN) and whole-cell lysate (L). The measurements were normalized and hierarchical and k-meansclustering was performed as described in the Materials and Methods. (A) A representative Western blot showing MCP-1 protein expression in celllysates from normoxic (N) and hypoxic (H) MCP-12/2 and wild-type mouse hepatocytes (48 and 72 h) and densitometric analysis as described in theMaterials and Methods. (B) Hierarchical clustering over fold changes in MCP-12/2 hepatocytes (normoxia vs. hypoxia): Fold change values for eachinflammatory mediator ranging from large negative (green) to large positive values (red) are shown. No fold changes (zero values) are represented inblack. (C) Comparison between meta-clustering analysis outcomes in normoxia and hypoxia (see Materials and Methods). The shading of the boxesindicates the grouping of mediators that exhibited the same segregation pattern across all methods. For each experimental condition (NL, HL, NS andHS), only the mediators appearing in each consensus are shown. For comparison between experimental conditions only mediators common to bothconsensuses are shown.doi:10.1371/journal.pone.0079804.g003
Table 2. Significance levels (P,0.05) for production andrelease of inflammatory mediators from MCP-12/2 mousehepatocytes cultured under normoxic or hypoxic conditions(1–72 h) as determined by one-way ANOVA.
Normoxia Hypoxiaa
Lysate Supernatant Lysate Supernatant
GM-CSF 0.918 0.535 0.239 0.423
IFN-c 0.897 0.371 ,0.001 0.530
IL-1a 0.869 0.249 0.002 0.034
IL-1b 0.748 0.031 0.008 0.369
IL-2 0.978 0.332 0.006 0.282
IL-4 0.982 0.669 0.978 0.054
IL-5 0.757 1.0 0.379 1.0
IL-6 ,0.001 0.475 ,0.001 0.403
IL-10 0.439 0.696 ,0.001 0.570
IL-13 0.191 0.888 ,0.001 0.978
IL-17 0.992 0.995 0.960 0.945
IP-10 0.783 0.572 0.925 0.518
KC ,0.001 ,0.001 0.234 0.009
MCP-1 0.823 0.535 0.573 0.782
MIG 0.003 0.761 0.609 0.068
MIP-1a 0.363 0.078 0.009 0.653
TNF-a 0.833 1.0 0.002 1.0
VEGF 0.599 ,0.001 0.242 0.019
aFor hypoxia time courses, the analysis was performed using as baseline therespective concentration values for normoxia at 1 h.doi:10.1371/journal.pone.0079804.t002
MCP-1 in Injury-Induced Inflammation
PLOS ONE | www.plosone.org 8 December 2013 | Volume 8 | Issue 12 | e79804
MCP-1 in Injury-Induced Inflammation
PLOS ONE | www.plosone.org 9 December 2013 | Volume 8 | Issue 12 | e79804

Hepatocytes were harvested from wild-type C57BL/6 mice (n = 8
animals from Charles River Laboratories, Wilmington, MA) or
MCP-1/CCL2-null (MCP-12/2) mice (n = 4 animals from The
Jackson Laboratory, Bar Harbor, ME) [27] and plated as
previously described [39]. After overnight incubation, the medium
was removed and cells were further incubated with fresh media
containing 5% heat-inactivated calf serum. Hypoxic conditions
were obtained by placing the cells into a modular incubator
chamber (Billups-Rothenburg, Del Mar, CA) flushed with a
hypoxic gas mixture containing 1% O2, 5% CO2 and 94% N2.
Normoxic hepatocytes served as control.
Protein isolation, sample preparation and Western blotanalysis
At the end of each experiment, the supernatants were stored at
220uC until further analysis and the cell monolayers were washed
twice with ice-cold PBS and resuspended in ice-cold lysis buffer
(Cell Lysis Buffer 106 from Cell Signaling Technology, Danvers,
MA) containing the protease inhibitors leupeptin (0.1 mg/ml) and
phenylmethylsulfonyl fluoride (1 mM) followed by total protein
isolation as previously described [39]. Protein samples (50 mg) were
separated on 15% SDS-polyacrylamide gels followed by electro-
blotting onto PVDF nitrocellulose membranes. Immunodetection
of MCP-1 was done using a mouse specific rabbit polyclonal anti-
MCP-1 antibody (Cell Signaling, Danvers, MA) at 1:1000 dilution,
and the immunoreactive bands were visualized after incubation
with the SuperSignal West Dura Extended Duration Substrate
mouse kit (Thermo Scientific, Rockford, IL). For normalization,
the membranes were stripped and re-probed with an anti-b-actin
antibody from Abcam (Cambridge, MA).
Measurement of inflammatory mediatorsMouse inflammatory mediators were detected in both cell
lysates and supernatants using the MilliplexTM Mouse Cytokine/
Chemokine Panel I beadset (Millipore, Billerica, MA) and the
LuminexTM 100 IS system (Luminex, Austin, TX) as per
manufacturer’s specifications. The antibody bead kit included:
Granulocyte-Macrophage Colony-Stimulating Factor (GM-CSF),
Interferon-c (IFN-c), Interleukin (IL)-1a, IL-1b, IL-2, IL-4, IL-5, IL-6, IL-10, IL-13, IL-17, Interferon-c-inducible Protein 10
(IP-10/CXCL10), Keratinocyte-derived Cytokine (KC/CXCL1), Monocyte Chemoattractant Protein-1 (MCP-1/CCL2), Monokine induced by Interferon-c (MIG/CXCL9),
Macrophage Inflammatory Protein-1a (MIP-1a/CCL3), Tumor
Necrosis Factor-a (TNF-a), and Vascular Endothelial Growth
Factor (VEGF).
ImmunocytochemistryFreshly isolated mouse hepatocytes (wild-type and MCP-12/2)
plated on coverslips (26105 cells/22-mm glass coverslip, BD
Biocoat, Bedford, MA) were cultured under normoxic (control) or
hypoxic (1% O2) conditions for 48 h. Cells were then fixed and
visualized as described previously [40]. For immunostaining the
following primary and secondary antibodies (diluted in PBS
containing 1% donkey serum) were used: LEAFTM Purified anti-
mouse MCP-1 antibody (1:2000; Cat. No. 505905, BioLegend,
San Diego, CA), rabbit polyclonal anti-IL-6 antibody (1:2000; Cat.
No. ab6672, Abcam), Cy3-conjugated anti-mouse (1:1000; Cat.
No. 715-165-151, Jackson-ImmunoResearch Laboratories, West
Grove, PA), Alexa Fluor-conjugated 647 anti-rabbit (1:1000; Cat.
No. A31573, Invitrogen, Grand Island, NY), and 488-conjugated
anti-phalloidin (1:1000; Cat. No. A12379, Invitrogen). For nuclei
detection the slides were counterstained with Hoechst 33342
(1:3000) for 5 min at room temperature followed by 3 washes in
PBS for 10 min.
Statistical analysis and data-driven modelingBefore the statistical analyses and in order to account for
experimental variability in cell number and protein concentration
between individual experiments, the final mediator concentrations
adjusted for protein content (CF) were obtained from the Luminex
analysis for each individual mediator measurement (C) and its
respective lysate protein concentration (as determined by BCA, see
above) using the following formulas:
For cell supernatants CF~
C pg=mlð Þ|VSN mlð Þ� ��
BCA mg protein=mlð Þ� ��
|
VL mlð Þ�|1000;
and for cell lysates CF~
C pg=mlð Þ�
BCA mg protein=mlð Þ� �
|
1000:
The final mediator concentrations (CF) are thus expressed in pg/
mg total protein, where the supernatant volume (VSN) and lysis
buffer volume (VL) values used were as follows: 60 mm Petri dish
(36106 cells, VSN = 3 ml, VL = 200 ml) and 100 mm Petri dish
(56106 cells, VSN = 5 ml, VL = 400 ml).
Experimental data are presented as mean 6 SEM. Analysis was
performed by t- test, One-way or Two-way Analysis of Variance
(ANOVA) followed by the Holm-Sidak post-hoc test as indicated.
Significance of differences in clinical outcomes was determined by
Mann-Whitney U test using SigmaPlot (Systat Software, San Jose,
CA).
Before any dynamic analysis, the final mediator concentrations
(CF) were first normalized for each inflammatory mediator, so that
all mediator levels were converted into the same scale (from 0 to 1).
All measurements of a given inflammatory mediator from a single
animal were normalized as a group, by dividing each value by the
Euclidean norm of the group. In this way, any artifactual effects on
variance due to the different ranges of concentration observed for
different mediators were eliminated.
Hierarchical clusteringFold change values were calculated by dividing the difference
between the later (x2) and earlier (x1) mediator values by the earlier
value: (x2-x1)/x1; we avoided division by 0 by replacing x1 with a
very small number (1025) when necessary. The columns of the
Figure 4. Dynamic Network Analysis (DyNA) of inflammatory mediators produced by normoxic and hypoxic mouse hepatocytesisolated from MCP-12/2 mice. Primary hepatocytes isolated from MCP-12/2 mice were cultured under normoxic or hypoxic conditions (1–72 h)followed by measurement of inflammatory mediators in both lysates and supernatants as described in the Materials and Methods. After datanormalization, DyNA was performed for both lysates and supernatants during each of the following five time frames: 1–3 h, 3–6 h, 6–24 h, 24–48 h,and 48–72 h as indicated. Panels show a summary of the DyNAs representing the principal inflammatory mediator ‘‘nodes’’ for both normoxia (A)and hypoxia (B) lysates and supernatants. (C) Stacked bars representing the total number of connections for each inflammatory mediator over alltime intervals.doi:10.1371/journal.pone.0079804.g004
MCP-1 in Injury-Induced Inflammation
PLOS ONE | www.plosone.org 10 December 2013 | Volume 8 | Issue 12 | e79804
dendrogram contained the mean of fold changes across all
animals. We employed several MatLabH functions to carry out
this analysis: linkage, with average link and Pearson correlation
distance, and cluster was used to find 2–4 clusters in both fold
change and raw data (mediator concentrations adjusted for protein
content vs. time, unaveraged, all animals included).
Principal Component Analysis and k-means clusteringNormalized inflammatory mediator data (each measurement
taken to be a single point in 18-dimensional inflammatory
mediator space) were transformed into principal component space
using the MatLabR function, princomp. We then examined
projections of inflammatory mediators into principal component
Figure 5. Time-dependent expression and release of IL-6 in mouse hepatocytes. Primary hepatocytes from wild-type (open symbols) andMCP-12/2 (closed symbols) mice were cultured under normoxic (Panels A and B) and hypoxic (Panels C and D) conditions for 1, 3, 6, 24, 48 and 72 hfollowed by measurement of IL-6 in both lysates and supernatants using the LuminexTM xMAP technology as described in the Materials and Methods.Results are the mean 6 SEM (n = 4–8 independent experiments, analyzed by Two-way ANOVA, P,0.05 (wild-type vs. MCP-12/2) for all conditionsexcept hypoxia lysates, Panel C).doi:10.1371/journal.pone.0079804.g005
MCP-1 in Injury-Induced Inflammation
PLOS ONE | www.plosone.org 11 December 2013 | Volume 8 | Issue 12 | e79804

Figure 6. Differential expression of MCP-1 and IL-6 in wild-type and MCP-12/2 hepatocytes. Primary hepatocytes isolated from wild-typeand MCP-12/2 mice (n = 3 each) were cultured under normoxic and hypoxic conditions for 48 h in three independent experiments. The cells werethen fixed and processed for confocal immunofluorescence imaging as described in the Materials and Methods. (A) Fluorescent labeling: Phalloidin(white), MCP-1 (red), IL-6 (green), Hoechst (blue). (B) Quantification of immunostained cells (fluorescence intensity from 600–700 hepatocytes from 3independent fields, n = 3 coverslips/experiment). Results are the mean 6 SEM (*P,0.001 wild-type vs. MCP-12/2, analyzed by t-test).doi:10.1371/journal.pone.0079804.g006
MCP-1 in Injury-Induced Inflammation
PLOS ONE | www.plosone.org 12 December 2013 | Volume 8 | Issue 12 | e79804
MCP-1 in Injury-Induced Inflammation
PLOS ONE | www.plosone.org 13 December 2013 | Volume 8 | Issue 12 | e79804

space by using the score coefficients for the first 2, 3, or 4 principal
components. We employed k-means clustering using the MatLabHfunction, kmeans, using as a distance metric the cosine of the angle
between a point and the origin. We computed clusters starting
with k = 2, 3, or 4 random centroids. At each level of k, we
repeated the clustering 10 times, resetting new centroids each time
and taking the lowest mean distance between points and their
nearest centroids as the best result.
Figure 7. Elevated plasma MCP-1 levels are associated with mortality and morbidity in human trauma/hemorrhage. (A) MCP-1 levelsin plasma samples from trauma patients (survivors vs. non-survivors, n = 15 each) taken within the first 24 h after trauma as described in the Materialsand Methods. Results represent the mean 6 SEM (The dotted line represents the mean value, *P = 0.001, survivors vs. non-survivors analyzed byMann-Whitney U test). (B–C) Plot of IL-6 vs. MCP-1 levels in blood samples from normotensive (B) and hypotensive (C) trauma patients (n = 31 each)taken within the first 24 h after trauma, followed by sampling at 48, 72 and 96 h as described in the Materials and Methods. (D–E) Grouping of T/HSpatients based on circulating MCP-1/CCL2 levels: Panel D shows MCP-1 values ,1000 pg/ml (n = 38 patients) and Panel E shows values .1500 pg/ml(n = 8 patients). Panel F shows the overall demographics (Age, ISS, total LOS, ICU LOS, and ventilation days) of T/HS patients segregated according toplasma MCP-1 levels (,1000 pg/ml; [n = 38 patients] vs. .1500 pg/ml; [n = 8 patients]). Results represent the mean 6 SEM. (*P,0.05, analyzed by,MCP-1,1000 pg/ml vs. MCP-1.1500 pg/ml).doi:10.1371/journal.pone.0079804.g007
Figure 8. Plasma MCP-1 levels in blood samples from trauma patients. Plasma MCP-1 levels in blood samples from normotensive (Panel A)and hypotensive (Panel B) trauma patients (n = 31 each as in Fig. 7 Panels B–C). Panel C shows the overall demographics of the normotensive(n = 27) and hypotensive patients (n = 19) segregated according to plasma MCP-1 levels (,1000 pg/ml and .1500 pg/ml) and blood pressure status.Results represent the mean 6 SEM.doi:10.1371/journal.pone.0079804.g008
MCP-1 in Injury-Induced Inflammation
PLOS ONE | www.plosone.org 14 December 2013 | Volume 8 | Issue 12 | e79804
Meta-clusteringThe Adjusted Rand Index (ARI) was first calculated pairwise
between clustering results including 2, 3, or 4 principal compo-
nents, choosing the result that captured the most information with
the fewest principal components. We then used ARI to compare
hierarchical clustering results with k = 2, 3, and 4 to k-means
clustering results with k = 2, 3 and 4 in a pairwise manner. The
maximum Rand Index dictated the k of the hierarchical and k-
means clustering results that were moved forward into further
analysis. We compared PCA k-means clustering to each of fold
change hierarchical clustering and raw data hierarchical clustering
individually. The k was chosen for k-means clustering that
maximized both ARI values. We then filtered the results by
discarding inflammatory mediators that showed inconsistent
segregation patterns across the three analyses. The basis of
comparison across different experiments was a consensus cluster-
ing containing only the mediators for whose coordination patterns
we had confidence, as shown in detail in Figures S9, S10, S11,S12, S13, S14, S15, S16. Briefly, a block of data was constructed
with one mediator in each row and its corresponding cluster label
for each of the three results in the columns using Microsoft ExcelH.
Sorting this block of data by each of the cluster label columns
successively allowed us to compare the memberships of clusters
across the three results and to identify corresponding clusters
between results. These were clusters that contained a common set
of mediators across all three results. We used the following
heuristic to determine consensus: once a cluster from one result
was associated with clusters from the other results, (e.g. Cluster A
from Raw Data was associated with Cluster 2 from Fold Change
and Cluster IV from PCA clustering) it could not be associated
with any other clusters. For example Cluster 1 could not associate
with both Cluster A and Cluster B. Mediators that did not
segregate into corresponding clusters across all results were
deemed inconsistent and omitted from the consensus clustering
result. This consensus outcome became the basis of comparison
among experimental conditions (see Figures S9, S10, S11, S12,S13, S14, S15, S16).
Dynamic Network Analysis (DyNA)Inflammatory mediator networks were created over time
periods between consecutive measurements (1–3 h, 3–6 h, 6–
24 h, 24–48 h, and 48–72 h) using MatlabH and InkscapeHsoftware (http://inkscape.org/). In order to be included in the
DyNA, a given mediator had to be statistically significantly
different from its baseline value (no treatment [time = 1 h];
P,0.05 by Student’s t-test). Connections in the network were
created if the correlation coefficient between two nodes (inflam-
matory mediators) was greater or equal to a threshold of 0.7 (based
on a total of 12 samples with 10 degrees of freedom, P,0.05).
Human trauma patient selection and analysisAll human sampling was done following approval by the
University of Pittsburgh Institutional Review Board and written
informed consent was obtained from each patient or next of kin as
per Institutional Review Board regulations. From a cohort of 493
blunt trauma patients admitted to Presbyterian University
Hospital (part of the University of Pittsburgh Medical Center),
we selected two cohorts of blunt trauma patients (all $18 years
old). Exclusion criteria included: life expectancy ,24 h, penetrat-
ing trauma only, and traumatic brain injury. The first cohort
included 30 trauma patients separated into two groups: 15
survivors (mean age: 60.563.7 years, range: 43–86 years, mean
ISS: 24.562.8, range: 9–50), and 15 non-survivors (mean age:
59.564.9 years, range: 25–86 years, mean ISS: 24.862.3, range:
10–38). The second cohort included 62 patients (all survivors)
separated into two groups matched on age, gender, and Injury
Severity Score (ISS): 31 normotensive patients (19 males and 12
females; systolic blood pressure .90 mmHg, mean age: 44.462.2
years, range: 24–75 years, mean ISS: 23.561.3, range: 10–38),
matched with 31 hypotensive patients (19 males and 12 females;
systolic blood pressure ,90 mmHg, duration of hypotension post-
injury: 861 h, range: 2–21 h, mean age: 45.163.4 years, range:
20–89 years, mean ISS: 23.562.2, range: 4–54). One to four
blood plasma samples per patient were collected within the first
24 h post-injury, followed by additional sampling at 48, 72, and
96 h. All blood samples were stored at 280uC until analysis.
MCP-1 and IL-6 were measured using the LuminexTM 100 IS
system and the Human 25-plexH LuminexTM beadset (BioSource,
now Invitrogen) or the MilliplexTM MAP kit (Millipore, Billerica,
MA).
Supporting Information
Figure S1 Relevant inflammatory mediator groupingsin the hepatocyte response to normoxia as determinedby consensus of clustering methods. Primary hepatocytes
from wild-type mice were cultured under normoxic (control,
21% O2) conditions for 1, 3, 6, 24, 48 and 72 h as described in the
Materials and Methods. At the end of the experiments, samples from
lysates (L) and supernatants (SN, see Fig. S3 below) were assayed
for 18 mouse inflammatory mediators using the Luminex xMAP
technology, the measurements were normalized for protein
content and over each inflammatory mediator and each sample
and k-means clustering was performed over dynamic inflamma-
tory mediator measurements from 4 experimental conditions (N
vs. H, and L vs. SN) using MatLabH software as described in the
Materials and Methods. The tridimensional grouping of significant
inflammatory mediators according to k-means clustering is
represented and the percentage of total variance corresponding
to the analysis is shown on the top of the graph.
(TIF)
Figure S2 Relevant inflammatory mediator groupingsin the hepatocyte response to hypoxia as determined byconsensus of clustering methods. Primary hepatocytes from
wild-type mice were cultured under hypoxic (1% O2) conditions
for 1, 3, 6, 24, 48 and 72 h as described in the Materials and
Methods. At the end of the experiments, samples from both lysates(L) and supernatants (SN, see Fig. S4 below) were assayed for 18
mouse inflammatory mediators using the Luminex xMAP
technology, the measurements were normalized for protein
content and over each inflammatory mediator and each sample
and k-means clustering was performed over dynamic inflamma-
tory mediator measurements from 4 experimental conditions (N
vs. H, and L vs. SN) using MatLabH software as described in the
Materials and Methods. The tridimensional grouping of significant
inflammatory mediators according to k-means clustering is
represented and the percentage of total variance corresponding
to the analysis is shown on the top of the graph.
(TIF)
Figure S3 Relevant inflammatory mediator groupingsin the hepatocyte response to normoxia as determinedby consensus of clustering methods: wild-type superna-tant. (See legend of Figure S1 for detailed description).
(TIF)
Figure S4 Relevant inflammatory mediator groupingsin the hepatocyte response to hypoxia as determined by
MCP-1 in Injury-Induced Inflammation
PLOS ONE | www.plosone.org 15 December 2013 | Volume 8 | Issue 12 | e79804

consensus of clustering methods: wild-type supernatant.(See legend of Figure S2 for detailed description)
(TIF)
Figure S5 Relevant inflammatory mediator groupingsin the hepatocyte response to normoxia as determinedby consensus of clustering methods. Primary hepatocytes
from MCP-12/2 mice were cultured under normoxic (control,
21% O2) conditions for 1, 3, 6, 24, 48 and 72 h as described in the
Materials and Methods. At the end of the experiments, samples from
both lysates (L) and supernatants (SN, see Fig. S7 below) were
assayed for 18 mouse inflammatory mediators using the Luminex
xMAP technology, the measurements were normalized for protein
content and over each inflammatory mediator and each sample
and k-means clustering was performed over dynamic inflamma-
tory mediator measurements from 4 experimental conditions (N
vs. H, and L vs. SN) using MatLabH software as described in the
Materials and Methods. The tridimensional grouping of significant
inflammatory mediators according to k-means clustering is
represented and the percentage of total variance corresponding
to each analysis is shown on the top of the graph.
(TIF)
Figure S6 Relevant inflammatory mediator groupingsin the hepatocyte response to hypoxia as determined byconsensus of clustering methods. Primary hepatocytes from
MCP-12/2 mice were cultured under hypoxic (1% O2)
conditions for 1, 3, 6, 24, 48 and 72 h as described in the
Materials and Methods. At the end of the experiments, samples from
both lysates (L) and supernatants (SN, see Fig. S8 below) were
assayed for 18 mouse inflammatory mediators using the Luminex
xMAP technology, the measurements were normalized for protein
content and over each inflammatory mediator and each sample
and k-means clustering was performed over dynamic inflamma-
tory mediator measurements from 4 experimental conditions (N
vs. H, and L vs. SN) using MatLabH software as described in the
Materials and Methods. The tridimensional grouping of significant
inflammatory mediators according to k-means clustering is
represented and the percentage of total variance corresponding
to each analysis is shown on the top of the graph.
(TIF)
Figure S7 Relevant inflammatory mediator groupingsin the hepatocyte response to normoxia as determinedby consensus of clustering methods: MCP-12/2 super-natant. (See legend of Figure S5 for detailed description).
(TIF)
Figure S8 Relevant inflammatory mediator groupingsin the hepatocyte response to hypoxia as determined byconsensus of clustering methods: MCP-12/2 superna-tant. (See legend of Figure S6 for detailed description).
(TIF)
Figure S9 Meta-clustering process: from three indepen-dent clustering results to a consensus clustering. Each
method is colored one hue (blue = hierarchical clustering of raw
data, orange = hierarchical clustering on fold changes, green = k-
means clustering in PCA space). Clusters within each method are
demarcated by shades and tones of each hue (Step 1). Each
column was sorted alphabetically by mediator name (Step 2), and
the clustering results were combined into a single matrix (Step 3).
The rows of this matrix were sorted by cluster labels, for each
method sequentially (Step 4). This sorting allowed visual
identification of clusters that were associated across methods.
From here, a consensus (Step 6) was determined by identifying
associated clusters and removing inconsistent mediators (Step 5)
that fell outside of the associated clusters. Associated clusters are
those that contain the same mediators across all three clustering
methods. If two or more clusters from one method were associated
with one cluster from each of the other methods, they were
considered to be part of the same cluster, provided neither cluster
was associated with any other clusters. Analysis for normoxiasupernatants (wild-type): In Step 4 for this matrix, the rows
were first sorted according to fold change cluster labels (orange),
then by raw data cluster labels (blue), and finally by PCA clusters
(green). In Step 5, all mediators from Cluster A (light blue) were
also found in Cluster 2 (bright orange) and Cluster IV (dark green).
Likewise, all mediators from Cluster 1 (light orange) were found in
Clusters B (bright blue) and II (light green). Members of those
clusters that were not found in Cluster 1 were discarded.
(TIF)
Figure S10 Meta-clustering analysis (see legend of Fig.S9) for hypoxia supernatants (wild-type): In Step 4 forthis matrix, the rows were first sorted according to rawdata cluster labels (blue), then by fold change clusterlabels (orange), and finally by PCA clusters (green). In
Step 5, all mediators from Cluster D (dark blue) were also found in
Cluster 2 (bright orange) and Cluster II (light green) and therefore,
these three clusters were considered to be the same. Any mediators
associated with Cluster II, but not with both Cluster 2 and Cluster
D were then marked as inconsistent and discarded from the
analysis. Clusters I (grey), III (medium green), and IV (dark green)
were all associated with Cluster B (bright blue) and Cluster 2
(bright orange).
(TIF)
Figure S11 Meta-clustering analysis (see legend of Fig.S9) for normoxia lysates (wild-type): In Step 4 for thismatrix, the rows were first sorted according to foldchange cluster labels (orange), then by raw data clusterlabels (blue), and finally by PCA clusters (green). In Step
5, all mediators from Cluster C (medium blue) were also found in
Cluster 1 (light orange) and Cluster I (grey) and therefore, these
three clusters were considered to be the same. Any mediators
associated with Cluster C, but not with both Cluster 1 and Cluster
I were then marked as inconsistent and discarded from the
analysis. Clusters B (bright blue) and D (dark blue) were both
associated with Cluster II (light green) and Cluster 2 (bright
orange).
(TIF)
Figure S12 Meta-clustering analysis (see legend of Fig.S9) for hypoxia lysates (wild-type): In Step 4 for thismatrix, the rows were first sorted according to foldchange cluster labels (orange), then by raw data clusterlabels (blue), and finally by PCA clusters (green). In Step
5, most mediators from Cluster A (light blue) were also found in
Cluster 2 (medium orange) and Cluster I (grey) and therefore,
these three clusters were considered to be the same. Any mediators
associated with Cluster A, but not with both Cluster 2 and Cluster
I were then marked as inconsistent and discarded from the
analysis. Clusters C (medium blue) and D (dark blue) were both
associated with Cluster 4 (dark orange) and Cluster III (medium
green).
(TIF)
Figure S13 Meta-clustering analysis (see legend of Fig.S9) for normoxia supernatants (MCP-12/2): In Step 4 forthis matrix, the rows were first sorted according to foldchange cluster labels (orange), then by raw data clusterlabels (blue), and finally by PCA clusters (green). In Step
MCP-1 in Injury-Induced Inflammation
PLOS ONE | www.plosone.org 16 December 2013 | Volume 8 | Issue 12 | e79804

5, a majority of mediators from Cluster II (light green) were also
found in Cluster B (bright blue) and Cluster 1 (light orange) and
therefore, these three clusters were considered to be the same. Any
mediators associated with Cluster II, but not with both Cluster B
and Cluster 1 were marked as inconsistent and discarded from the
analysis. Likewise, Clusters D (dark blue), 2 (bright orange), and III
(medium green) were associated.
(TIF)
Figure S14 Meta-clustering analysis (see legend of Fig.S9) for hypoxia supernatants (MCP-12/2): In Step 4 forthis matrix, the rows were first sorted according to foldchange cluster labels (orange), then by raw data clusterlabels (blue), and finally by PCA clusters (green). In Step
5, all mediators from Cluster A (light blue) were also found in
Cluster 2 (bright orange) and Cluster III (medium green) and
therefore, these three clusters were considered to be the same. Any
mediators associated with Cluster A, but not with both Cluster 2
and Cluster III were marked as inconsistent and discarded from
the analysis.
(TIF)
Figure S15 Meta-clustering analysis (see legend of Fig.S9) for normoxia lysates (MCP-12/2): In Step 4 for thismatrix, the rows were first sorted according to foldchange cluster labels (orange), then by raw data clusterlabels (blue), and finally by PCA clusters (green). In Step
5, all mediators from Cluster 1 (light orange) were also found in
Cluster B (bright blue) and Cluster II (light green) and therefore,
these three clusters were considered to be the same. Any mediators
associated with Cluster 1, but not with both Cluster B and Cluster II
were marked as inconsistent and discarded from the analysis.
Clusters III (medium green) and IV (dark green) were both
associated with Cluster B (bright blue) and Cluster 2 (bright orange).
(TIF)
Figure S16 Meta-clustering analysis (see legend of Fig.S9) for hypoxia lysates (MCP-12/2): In Step 4 for thismatrix, the rows were first sorted according to raw datacluster labels (blue), then by fold change cluster labels(orange), and finally by PCA clusters (green). In Step 5, all
mediators from Cluster B (medium blue) were also found in
Cluster 3 (bright orange) and Cluster III (medium green) and
therefore, these three clusters were considered to be the same. Any
mediators associated with Cluster B, but not with both Cluster 3
and Cluster III were marked as inconsistent and discarded from
the analysis. Clusters I (grey), II (light green), and IV (dark green)
were all associated with Cluster A (light blue) and Cluster 1 (light
orange).
(TIF)
Figure S17 Dynamic Network Analysis (DyNA) of in-flammatory mediators produced by normoxic andhypoxic mouse hepatocytes. Primary hepatocytes from
wild-type mice were cultured under normoxic or hypoxic
conditions (1–72 h) followed by measurement of cytokines/
chemokines in both lysates and supernatants and lysates as
described in the Materials and Methods. Gray boxes indicate that the
mediator is statistically significantly different from its baseline
value (no treatment [time = 1 h]; P,0.05) and the digits represent
the number of connections resulting from the DyNAs during each
of the following five time frames: 1–3 h, 3–6 h, 6–24 h, 24–48 h,
and 48–72 h for both lysates and supernatants.
(TIF)
Figure S18 Dynamic Network Analysis (DyNA) of in-flammatory mediators produced by normoxic andhypoxic mouse hepatocytes from MCP-12/2 mice.Primary hepatocytes from MCP-12/2 mice were cultured under
normoxic or hypoxic conditions (1–72 h) followed by measure-
ment of cytokines/chemokines in both lysates and supernatants
and lysates as described in the Materials and Methods. Gray boxes
indicate that the mediator is statistically significantly different from
its baseline value (no treatment [time = 1 h]; P,0.05) and the
digits represent the number of connections resulting from the
DyNAs during each of the following five time frames: 1–3 h, 3–
6 h, 6–24 h, 24–48 h, and 48–72 h for both lysates and
supernatants.
(TIF)
Acknowledgments
The authors would like to acknowledge Susan Rominski (Dept. of Surgery)
for her skillful assistance with hepatocyte harvest and Theresa L. Hayden
(Dept. of Neurology) for coordinating the immunofluorescence analysis.
Author Contributions
Conceived and designed the experiments: YV TRB RZ. Performed the
experiments: RAN BSJ VT DB GC. Analyzed the data: CZ YV VT QM
KWA TRB RZ. Contributed reagents/materials/analysis tools: YV VT
TRB RZ. Wrote the paper: CZ YV TRB RZ.
References
1. Malarkey DE, Johnson K, Ryan L, Boorman G, Maronpot RR (2005) New
insights into functional aspects of liver morphology. Toxicol Pathol 33: 27–34.
2. Baratta JL, Ngo A, Lopez B, Kasabwalla N, Longmuir KJ, et al. (2009) Cellular
organization of normal mouse liver: a histological, quantitative immunocyto-
chemical, and fine structural analysis. Histochem Cell Biol 131: 713–726.
3. McCloskey CA, Kameneva MV, Uryash A, Gallo DJ, Billiar TR (2004) Tissue
hypoxia activates JNK in the liver during hemorrhagic shock. Shock 22: 380–
386.
4. Kan WH, Hsieh CH, Schwacha MG, Choudhry MA, Raju R, et al. (2008)
Flutamide protects against trauma-hemorrhage-induced liver injury via
attenuation of the inflammatory response, oxidative stress, and apopotosis.
Journal of Applied Physiology 105: 595–602.
5. Johnson AB, Denko N, Barton MC (2008) Hypoxia induces a novel signature of
chromatin modifications and global repression of transcription. Mutation
Research/Fundamental and Molecular Mechanisms of Mutagenesis 640: 174–
179.
6. Safronova O, Morita I (2010) Transcriptome remodeling in hypoxic
inflammation. J Dent Res 89: 430–444.
7. Vodovotz Y, Csete M, Bartels J, Chang S, An G (2008) Translational systems
biology of inflammation. PLoS Comput Biol 4: e1000014.
8. Chow CC, Clermont G, Kumar R, Lagoa C, Tawadrous Z, et al. (2005) The
acute inflammatory response in diverse shock states. Shock 24: 74–84.
9. Prince JM, Levy RM, Bartels J, Baratt A, Kane JM, et al. (2006) In silico and in
vivo approach to elucidate the inflammatory complexity of CD14-deficient mice.
Mol Med 12: 88–96.
10. Lagoa CE, Bartels J, Baratt A, Tseng G, Clermont G, et al. (2006) The role of
initial trauma in the host’s response to injury and hemorrhage: Insights from a
comparison of mathematical simulations and hepatic transcriptomic analysis.
Shock 26: 592–600.
11. Torres A, Bentley T, Bartels J, Sarkar J, Barclay D, et al. (2009) Mathematical
modeling of post-hemorrhage inflammation in mice: Studies using a novel,
computer-controlled, closed-loop hemorrhage apparatus. Shock 32: 172–178.
12. Mi Q, Constantine G, Ziraldo C, Solovyev A, Torres A, et al. (2011) A dynamic
view of trauma/hemorrhage-induced inflammation in mice: principal drivers
and networks. PLoS One 6: e19424.
13. Hubert L, Arabie P (1985) Comparing partitions. Journal of Classification 2:
193–218.
14. Yeung KY, Ruzzo WL (2001) Principal component analysis for clustering gene
expression data. Bioinformatics 17: 763–774.
15. Yeung KY, Haynor DR, Ruzzo WL (2001) Validating clustering for gene
expression data. Bioinformatics 17: 309–318.
16. Wang HM, Hsiao CL, Hsieh AR, Lin YC, Fann CSJ (2012) Constructing
Endophenotypes of Complex Diseases Using Non-Negative Matrix Factoriza-
tion and Adjusted Rand Index. PLoS ONE 7: e40996.
MCP-1 in Injury-Induced Inflammation
PLOS ONE | www.plosone.org 17 December 2013 | Volume 8 | Issue 12 | e79804

17. Peitzman AB, Billiar TR, Harbrecht BG, Kelly E, Udekwu AO, et al. (1995)
Hemorrhagic shock. Curr Probl Surg 32: 925–1002.
18. Yang S, Hu S, Hsieh YC, Choudhry MA, Rue LW III, et al. (2006) Mechanism
of IL-6-mediated cardiac dysfunction following trauma-hemorrhage. Journal of
Molecular and Cellular Cardiology 40: 570–579.
19. Maier B, Lefering R, Lehnert M, Laurer HL, Steudel WI, et al. (2007) Early
versus late onset of multiple organ failure is associated with differing patterns of
plasma cytokine biomarker expression and outcome after severe trauma. Shock
28: 668–674.
20. Frangogiannis NG (2007) Chemokines in ischemia and reperfusion. Thromb
Haemost 97: 738–747.
21. Saiman Y, Friedman SL (2012) The role of chemokines in acute liver injury.
Front Physiol 3: 213.
22. Duvigneau JC, Kozlov AV, Zifko C, Postl A, Hartl RT, et al. (2010) Reperfusion
Does Not Induce Oxidative Stress But Sustained Endoplasmic Reticulum Stress
in Livers of Rats Subjected to Traumatic-Hemorrhagic Shock. Shock 33.
23. Evankovich J, Zhang R, Cardinal JS, Zhang L, Chen J, et al. (2012) Calcium/
calmodulin-dependent protein kinase IV limits organ damage in hepatic
ischemia-reperfusion injury through induction of autophagy. American Journal
of Physiology - Gastrointestinal and Liver Physiology 303: G189–G198.
24. Sahin H, Trautwein C, Wasmuth HE (2010) Functional role of chemokines in
liver disease models. Nat Rev Gastroenterol Hepatol 7: 682–690.
25. Charo IF, Ransohoff RM (2006) The many roles of chemokines and chemokine
receptors in inflammation. N Engl J Med 354: 610–621.
26. Hildebrand F, Hubbard WJ, Choudhry MA, Frink M, Pape HC, et al. (2006)
Kupffer cells and their mediators: the culprits in producing distant organ
damage after trauma-hemorrhage. Am J Pathol 169: 784–794.
27. Lu B, Rutledge BJ, Gu L, Fiorillo J, Lukacs NW, et al. (1998) Abnormalities in
monocyte recruitment and cytokine expression in monocyte chemoattractant
protein 1-deficient mice. J Exp Med 187: 601–608.
28. Yamaguchi Y, Matsumura F, Liang J, Okabe K, Ohshiro H, et al. (1999)
Neutrophil elastase and oxygen radicals enhance monocyte chemoattractant
protein- expression after ischemia/reperfusion in rat liver. Transplantation 68:
1459–1468.
29. Barclay D, Zamora R, Torres A, Namas R, Steed D, et al. (2008) A simple,
rapid, and convenient Luminex-compatible method of tissue isolation. J Clin
Lab Anal 22: 278–281.
30. Laurens M, Defamie V, Scozzari G, Schmid-Alliana A, Gugenheim J, et al.
(2005) Hypoxia-reoxygenation-induced chemokine transcription is not prevent-ed by preconditioning or intermittent hypoxia, in mice hepatocytes. Transpl Int
18: 444–452.
31. Wang H, Gao X, Fukumoto S, Tademoto S, Sato K, et al. (1999) Differentialexpression and regulation of chemokines JE, KC, and IP-10 gene in primary
cultured murine hepatocytes. J Cell Physiol 181: 361–370.32. Mandrekar P, Ambade A, Lim A, Szabo G, Catalano D (2011) An essential role
for monocyte chemoattractant protein-1 in alcoholic liver injury: Regulation of
proinflammatory cytokines and hepatic steatosis in mice. Hepatology 54: 2185–2197.
33. Frink M, Lu A, Thobe BM, Hsieh YC, Choudhry MA, et al. (2007) Monocytechemoattractant protein-1 influences trauma-hemorrhage-induced distal organ
damage via regulation of keratinocyte-derived chemokine production. AmericanJournal of Physiology - Regulatory, Integrative and Comparative Physiology
292: R1110–R1116.
34. Tieu BC, Lee C, Sun H, Lejeune W, Recinos A, et al. (2009) An adventitial IL-6/MCP1 amplification loop accelerates macrophage-mediated vascular inflam-
mation leading to aortic dissection in mice. J Clin Invest 119: 3637–3651.35. Janes KA, Albeck JG, Gaudet S, Sorger PK, Lauffenburger DA, et al. (2005) A
systems model of signaling identifies a molecular basis set for cytokine-induced
apoptosis. Science 310: 1646–1653.36. Alexopoulos LG, Saez-Rodriguez J, Cosgrove BD, Lauffenburger DA, Sorger
PK (2010) Networks Inferred from Biochemical Data Reveal ProfoundDifferences in Toll-like Receptor and Inflammatory Signaling between Normal
and Transformed Hepatocytes. Molecular & Cellular Proteomics 9: 1849–1865.37. Saez-Rodriguez J, Alexopoulos LG, Zhang M, Morris MK, Lauffenburger DA,
et al. (2011) Comparing Signaling Networks between Normal and Transformed
Hepatocytes Using Discrete Logical Models. Cancer Res 71: 5400–5411.38. Zenati MS, Billiar TR, Townsend RN, Peitzman AB, Harbrecht BG (2002) A
brief episode of hypotension increases mortality in critically ill trauma patients.J Trauma 53: 232–236.
39. Metukuri MR, Beer-Stolz D, Namas RA, Dhupar R, Torres A, et al. (2009)
Expression and subcellular localization of BNIP3 in hypoxic hepatocytes andliver stress. Am J Physiol Gastrointest Liver Physiol 296: G499–G509.
40. Tapias V, Greenamyre JT, Watkins SC (2013) Automated imaging system forfast quantitation of neurons, cell morphology and neurite morphometry in vivo
and in vitro. Neurobiol Dis 54: 158–168.
MCP-1 in Injury-Induced Inflammation
PLOS ONE | www.plosone.org 18 December 2013 | Volume 8 | Issue 12 | e79804