Cell Systems, Volume 2 · Cell Systems, Volume 2 ... coupled to a BD Accuri C6 Flow Cytometer ......
12
Cell Systems, Volume 2 Supplemental Information The Genomic Landscape of Position Effects on Protein Expression Level and Noise in Yeast Xiaoshu Chen and Jianzhi Zhang
Transcript of Cell Systems, Volume 2 · Cell Systems, Volume 2 ... coupled to a BD Accuri C6 Flow Cytometer ......

Cell Systems, Volume 2
Supplemental Information
The Genomic Landscape of Position Effects
on Protein Expression Level and Noise in Yeast
Xiaoshu Chen and Jianzhi Zhang
Supplementary Materials for
The genomic landscape of position effects on protein expression level and noise in yeast
Xiaoshu Chen and Jianzhi Zhang Supplementary materials include: Figures S1-S4 Tables S1-S2 Supplementary Experimental Procedures In a separate Excel file: Data S1. Mean, S.D., CV, and DM of GFP intensities in the 482 GFP strains. All values are relative to those of the reference strain. Related to Fig. 3.

Properties of the four chosen promoters
Promoter name
Percent rank of mean expression under YPD (higher ranks indicate
higher expressions)
Percent rank of DM under YPD (higher ranks
indicate higher DM)
Percent rank of mean expression
under SC Percent rank of DM under SC
Presence of TATA box1
pRPL5 97.5 38.7 96.8 95.0 No pTDH3 99.9 44.3 N/A N/A Yes pTYS1 89.4 99.1 88.5 97.1 No pARF1 95.7 99.9 92.8 99.9 No
1Rhee, H. S. & Pugh, B. F. Genome-wide structure and organization of eukaryotic pre-initiation complexes. Nature 483, 295-301 (2012).
Figure S1. Schematic drawings of the kanMX module and pRPL5-GFP cassette and properties of the four chosen promoters. Related to Fig. 1. (a) One allele of an endogenous gene. (b) The kanMX module that replaces one allele of an endogenous gene in each heterozygous yeast gene deletion strain. (c) The pRPL5-GFP cassette that replaces the kanMX module in each heterozygous yeast gene deletion strain. Arrows indicate promoters and directions of transcription. Dotted lines indicate regions replaced in strain constructions. (d) Properties of the four chosen promoters.
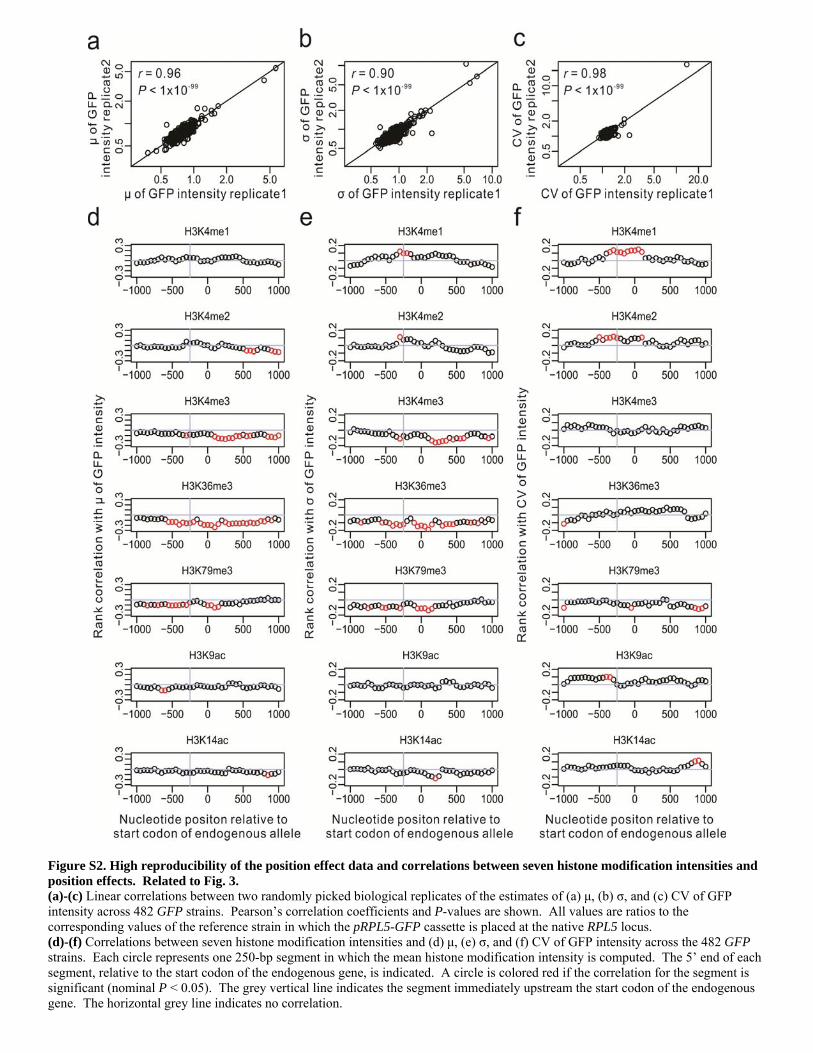
Figure S2. High reproducibility of the position effect data and correlations between seven histone modification intensities and position effects. Related to Fig. 3. (a)-(c) Linear correlations between two randomly picked biological replicates of the estimates of (a) μ, (b) σ, and (c) CV of GFP intensity across 482 GFP strains. Pearson’s correlation coefficients and P-values are shown. All values are ratios to the corresponding values of the reference strain in which the pRPL5-GFP cassette is placed at the native RPL5 locus. (d)-(f) Correlations between seven histone modification intensities and (d) μ, (e) σ, and (f) CV of GFP intensity across the 482 GFP strains. Each circle represents one 250-bp segment in which the mean histone modification intensity is computed. The 5’ end of each segment, relative to the start codon of the endogenous gene, is indicated. A circle is colored red if the correlation for the segment is significant (nominal P < 0.05). The grey vertical line indicates the segment immediately upstream the start codon of the endogenous gene. The horizontal grey line indicates no correlation.
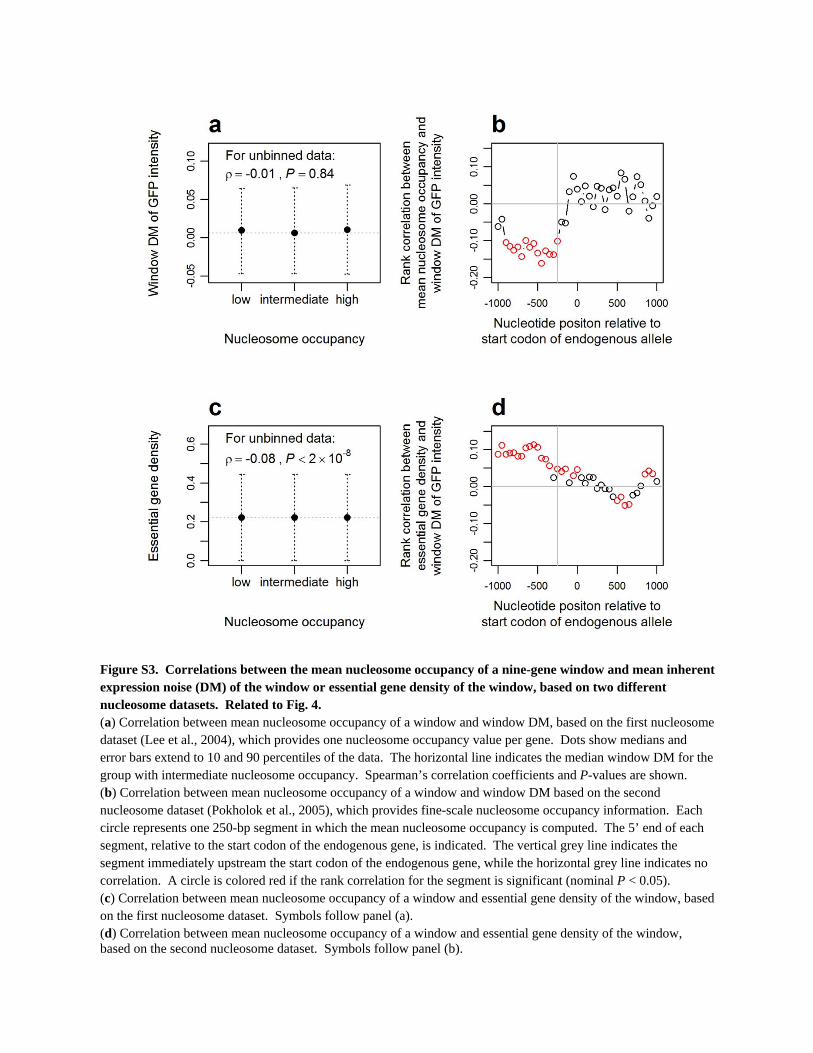
Figure S3. Correlations between the mean nucleosome occupancy of a nine-gene window and mean inherent expression noise (DM) of the window or essential gene density of the window, based on two different nucleosome datasets. Related to Fig. 4. (a) Correlation between mean nucleosome occupancy of a window and window DM, based on the first nucleosome dataset (Lee et al., 2004), which provides one nucleosome occupancy value per gene. Dots show medians and error bars extend to 10 and 90 percentiles of the data. The horizontal line indicates the median window DM for the group with intermediate nucleosome occupancy. Spearman’s correlation coefficients and P-values are shown. (b) Correlation between mean nucleosome occupancy of a window and window DM based on the second nucleosome dataset (Pokholok et al., 2005), which provides fine-scale nucleosome occupancy information. Each circle represents one 250-bp segment in which the mean nucleosome occupancy is computed. The 5’ end of each segment, relative to the start codon of the endogenous gene, is indicated. The vertical grey line indicates the segment immediately upstream the start codon of the endogenous gene, while the horizontal grey line indicates no correlation. A circle is colored red if the rank correlation for the segment is significant (nominal P < 0.05). (c) Correlation between mean nucleosome occupancy of a window and essential gene density of the window, based on the first nucleosome dataset. Symbols follow panel (a). (d) Correlation between mean nucleosome occupancy of a window and essential gene density of the window, based on the second nucleosome dataset. Symbols follow panel (b).
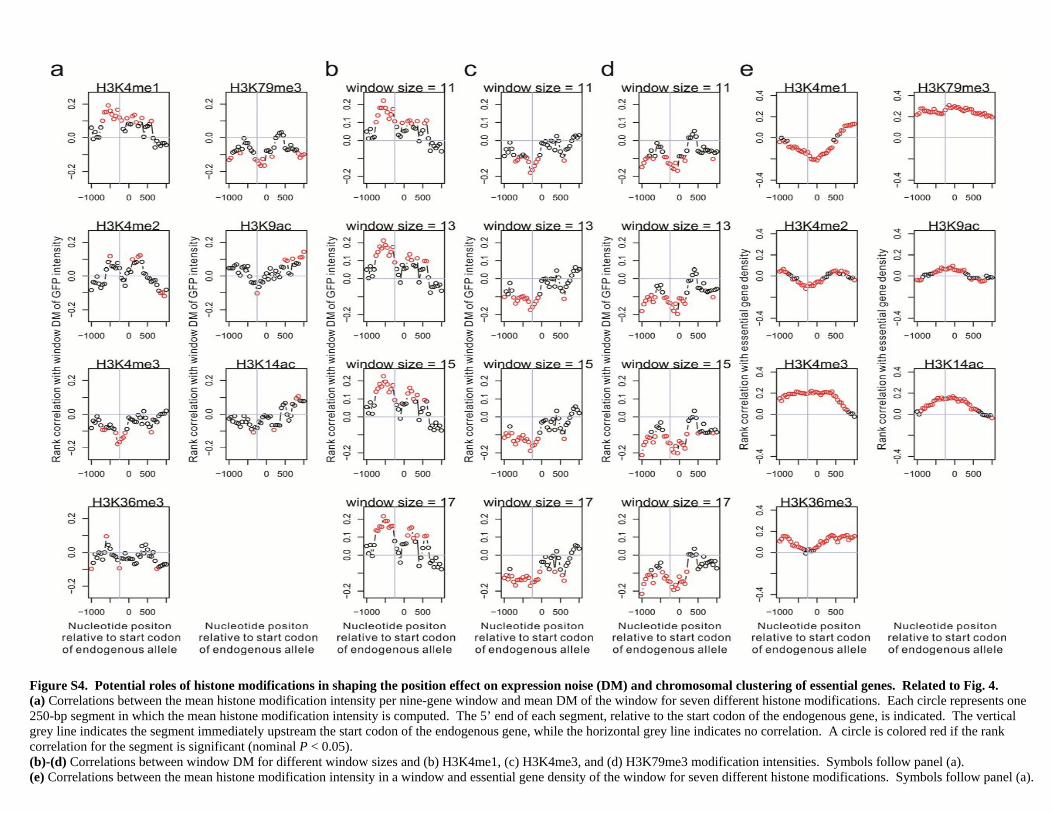
Figure S4. Potential roles of histone modifications in shaping the position effect on expression noise (DM) and chromosomal clustering of essential genes. Related to Fig. 4. (a) Correlations between the mean histone modification intensity per nine-gene window and mean DM of the window for seven different histone modifications. Each circle represents one 250-bp segment in which the mean histone modification intensity is computed. The 5’ end of each segment, relative to the start codon of the endogenous gene, is indicated. The vertical grey line indicates the segment immediately upstream the start codon of the endogenous gene, while the horizontal grey line indicates no correlation. A circle is colored red if the rank correlation for the segment is significant (nominal P < 0.05). (b)-(d) Correlations between window DM for different window sizes and (b) H3K4me1, (c) H3K4me3, and (d) H3K79me3 modification intensities. Symbols follow panel (a). (e) Correlations between the mean histone modification intensity in a window and essential gene density of the window for seven different histone modifications. Symbols follow panel (a).
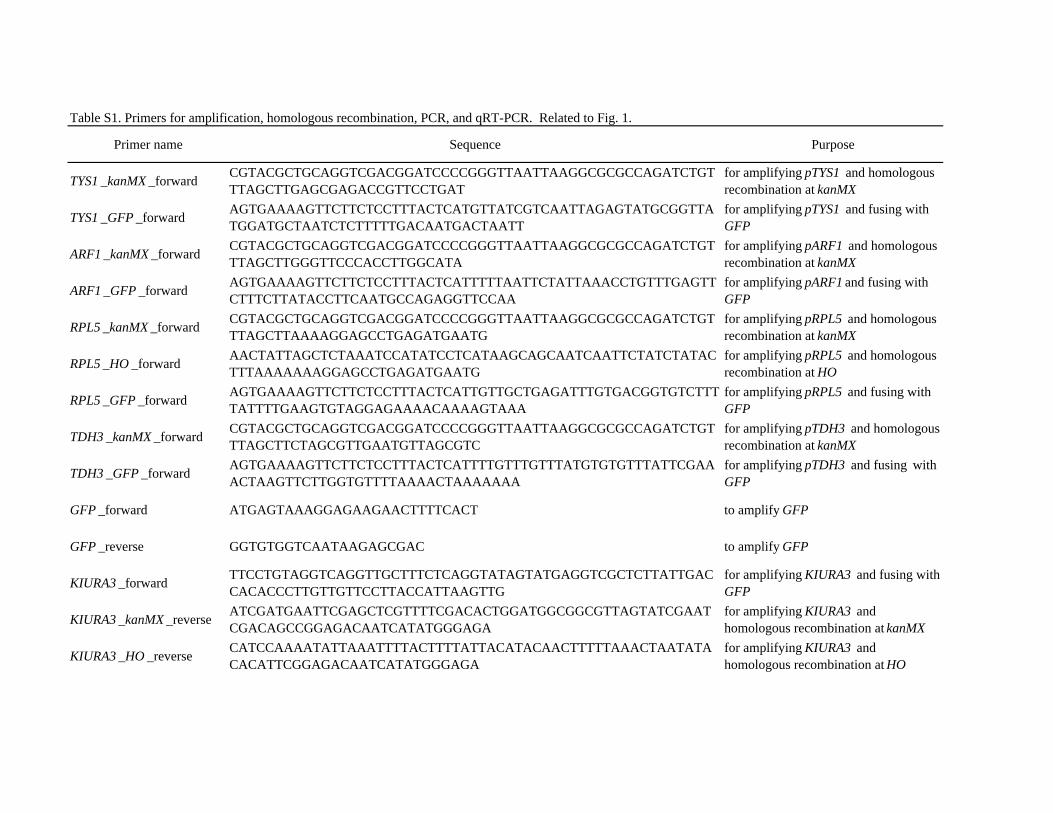
Table S1. Primers for amplification, homologous recombination, PCR, and qRT-PCR. Related to Fig. 1.
Primer name Sequence Purpose
TYS1 _kanMX _forward CGTACGCTGCAGGTCGACGGATCCCCGGGTTAATTAAGGCGCGCCAGATCTGTTTAGCTTGAGCGAGACCGTTCCTGAT
for amplifying pTYS1 and homologous recombination at kanMX
TYS1 _GFP _forward AGTGAAAAGTTCTTCTCCTTTACTCATGTTATCGTCAATTAGAGTATGCGGTTATGGATGCTAATCTCTTTTTGACAATGACTAATT
for amplifying pTYS1 and fusing with GFP
ARF1 _kanMX _forward CGTACGCTGCAGGTCGACGGATCCCCGGGTTAATTAAGGCGCGCCAGATCTGTTTAGCTTGGGTTCCCACCTTGGCATA
for amplifying pARF1 and homologous recombination at kanMX
ARF1 _GFP _forward AGTGAAAAGTTCTTCTCCTTTACTCATTTTTAATTCTATTAAACCTGTTTGAGTTCTTTCTTATACCTTCAATGCCAGAGGTTCCAA
for amplifying pARF1 and fusing with GFP
RPL5 _kanMX _forward CGTACGCTGCAGGTCGACGGATCCCCGGGTTAATTAAGGCGCGCCAGATCTGTTTAGCTTAAAAGGAGCCTGAGATGAATG
for amplifying pRPL5 and homologous recombination at kanMX
RPL5 _HO _forward AACTATTAGCTCTAAATCCATATCCTCATAAGCAGCAATCAATTCTATCTATACTTTAAAAAAAGGAGCCTGAGATGAATG
for amplifying pRPL5 and homologous recombination at HO
RPL5 _GFP _forward AGTGAAAAGTTCTTCTCCTTTACTCATTGTTGCTGAGATTTGTGACGGTGTCTTTTATTTTGAAGTGTAGGAGAAAACAAAAGTAAA
for amplifying pRPL5 and fusing with GFP
TDH3 _kanMX _forward CGTACGCTGCAGGTCGACGGATCCCCGGGTTAATTAAGGCGCGCCAGATCTGTTTAGCTTCTAGCGTTGAATGTTAGCGTC
for amplifying pTDH3 and homologous recombination at kanMX
TDH3 _GFP _forward AGTGAAAAGTTCTTCTCCTTTACTCATTTTGTTTGTTTATGTGTGTTTATTCGAAACTAAGTTCTTGGTGTTTTAAAACTAAAAAAA
for amplifying pTDH3 and fusing with GFP
GFP _forward ATGAGTAAAGGAGAAGAACTTTTCACT to amplify GFP
GFP _reverse GGTGTGGTCAATAAGAGCGAC to amplify GFP
KIURA3 _forward TTCCTGTAGGTCAGGTTGCTTTCTCAGGTATAGTATGAGGTCGCTCTTATTGACCACACCCTTGTTGTTCCTTACCATTAAGTTG
for amplifying KIURA3 and fusing with GFP
KIURA3 _kanMX _reverse ATCGATGAATTCGAGCTCGTTTTCGACACTGGATGGCGGCGTTAGTATCGAATCGACAGCCGGAGACAATCATATGGGAGA
for amplifying KIURA3 and homologous recombination at kanMX
KIURA3 _HO _reverse CATCCAAAATATTAAATTTTACTTTTATTACATACAACTTTTTAAACTAATATACACATTCGGAGACAATCATATGGGAGA
for amplifying KIURA3 and homologous recombination at HO
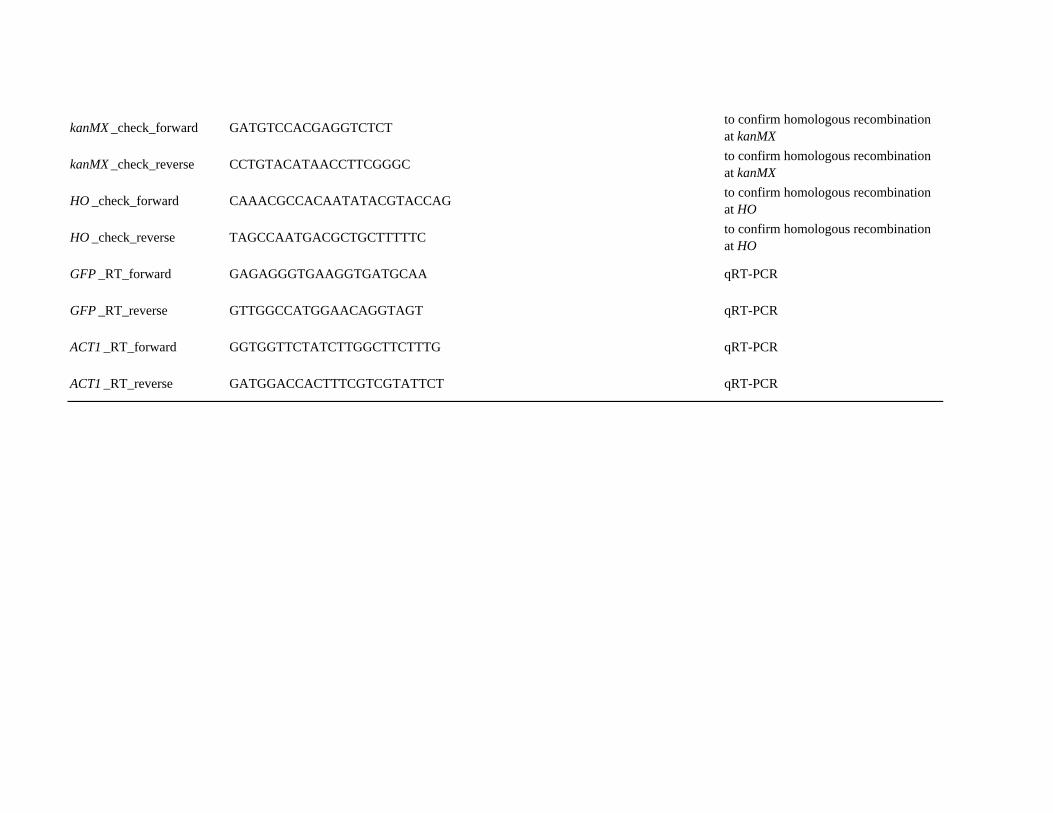
kanMX _check_forward GATGTCCACGAGGTCTCT to confirm homologous recombination at kanMX
kanMX _check_reverse CCTGTACATAACCTTCGGGC to confirm homologous recombination at kanMX
HO _check_forward CAAACGCCACAATATACGTACCAG to confirm homologous recombination at HO
HO _check_reverse TAGCCAATGACGCTGCTTTTTC to confirm homologous recombination at HO
GFP _RT_forward GAGAGGGTGAAGGTGATGCAA qRT-PCR
GFP _RT_reverse GTTGGCCATGGAACAGGTAGT qRT-PCR
ACT1 _RT_forward GGTGGTTCTATCTTGGCTTCTTTG qRT-PCR
ACT1 _RT_reverse GATGGACCACTTTCGTCGTATTCT qRT-PCR
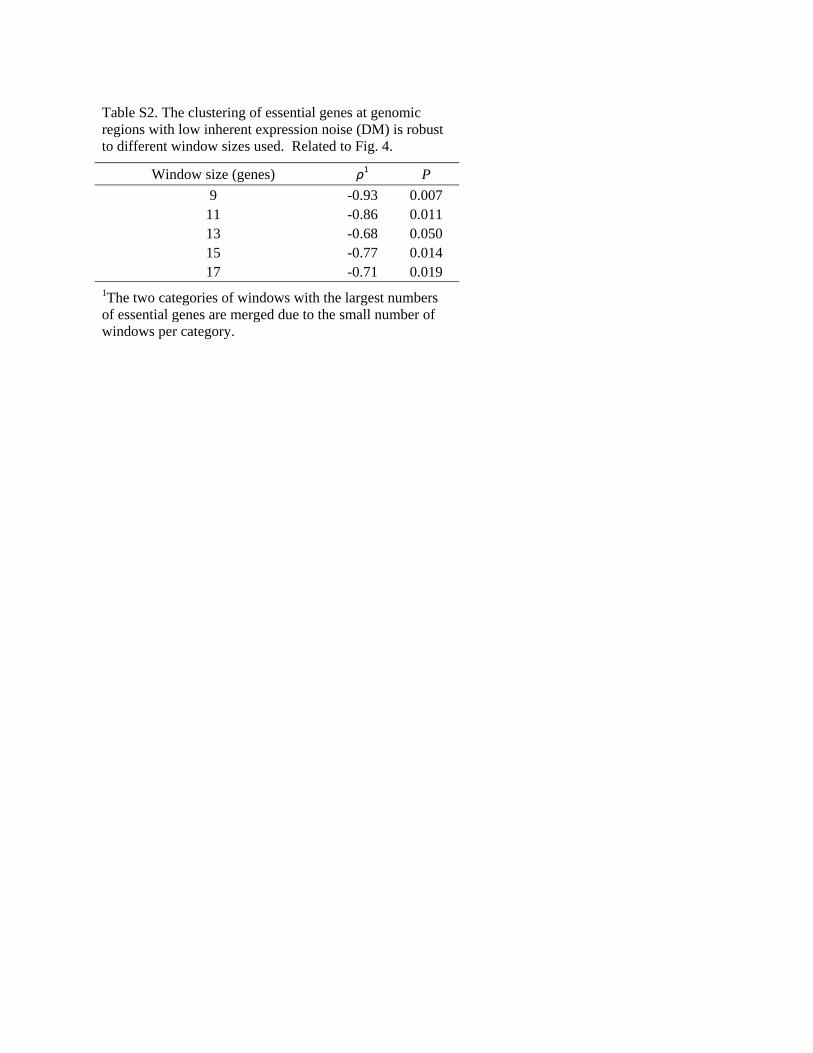
Table S2. The clustering of essential genes at genomic regions with low inherent expression noise (DM) is robust to different window sizes used. Related to Fig. 4.
Window size (genes) ρ1 P
9 -0.93 0.007 11 -0.86 0.011 13 -0.68 0.050 15 -0.77 0.014 17 -0.71 0.019
1The two categories of windows with the largest numbers of essential genes are merged due to the small number of windows per category.
SUPPLEMENTARY EXPERIMENTAL PROCEDURES Strain construction
The 606 nucleotides upstream of the start codon of RPL5 (ribosomal 60S subunit protein L5) in S. cerevisiae strain BY4743, the coding region and the terminator of GFP from plasmid pFA6a (Wach et al., 1997), and the URA3 cassette from plasmid pGSKU (Storici and Resnick, 2006) were linked by fusion PCR. This construct, named the pRPL5-GFP cassette, was confirmed by Sanger sequencing. We similarly constructed and confirmed the pTYS1-GFP, pARF1-GFP, and pTDH3-GFP cassettes, where the promoter driving GFP is the 823 nucleotides upstream of the start codon of the cytoplasmic tyrosyl-tRNA synthetase gene TYS1, the 650 nucleotides upstream of the start codon of the ADP-ribosylation factor gene ARF1, and the 797 nucleotides upstream of the start codon of the glyceraldehyde-3-phosphate dehydrogenase gene TDH3, respectively. Each of the four GFP cassettes was used to replace the kanMX module in each of six randomly picked heterozygous gene deletion strains (the genes deleted are YFL007W, YFL021W, YFL055W, YFR016C, YFR030W, and YFR039C, respectively), creating 24 GFP strains. Transformations followed a published protocol (Gietz and Schiestl, 2007). The transformants were spread on synthetic complete medium without uracil (SC-ura) plates for one week. We picked single colonies, and confirmed the replacements by PCR.
We replaced the kanMX module of additional selected heterozygous gene deletion strains with the pRPL5-GFP cassette, creating a total of 482 pRPL5-GFP strains, including 63 in which the GFP cassette is placed on chromosome 1. From the same set of 63 heterozygous gene deletion strains, we replaced one allele of the HO pseudogene with the pRPL5-GFP cassette, creating 63 HO-replaced strains. The replacements in all strains were confirmed by PCR.
When choosing the loci to place the pRPL5-GFP cassette at, we first picked all verified genes of chromosomes 1 and 6. We then randomly selected verified genes from the other 14 chromosomes, with two constraints that were set to maximize the power in testing the BH hypothesis. First, for each focal gene, we considered a window that included the focal gene as well as four consecutive genes on each side of the focal gene. Let the number of windows with k essential genes be Nk, where k is between 0 and 7 (no window has k > 7). We tried to minimize the variation in Nk for different k. Second, for each k, we tried to have similar numbers of essential and nonessential focal genes.
Florescence activated cell sorting (FACS)
The GFP protein concentration of each cell was estimated using FACS following a recent study (Duveau et al., 2014). For each strain, at least five replicate populations, each with >10,000 cells, were randomly arrayed in a 96-well plate. In addition, a reference strain in which the pRPL5-GFP cassette is placed at the native position of RPL5 was arrayed in all wells in a plate to control for the well effect. Cells were first transferred to 0.5 ml of YPD in a 96 deep-well plate. They were then maintained in suspension by the addition of a 3 mm glass bead in each well and were shaken at 250 rpm overnight at 30°C. Fifty μl of each culture were diluted in 0.5 ml of YPD in another 96-well plate for 4 hours before flow cytometry. Fluorescence was quantified using a HyperCyt Autosampler (IntelliCyt Corp.) coupled to a BD Accuri C6 Flow Cytometer (533/30 nm optical filter for GFP acquisition). Each culture was sampled for 1 second, resulting in approximately 10,000 recorded events.
Florescence data were analyzed with custom R scripts. First, a set of cytometric events considered to be single fluorescing cells were filtered for each sample using Bioconductor prada package. Next, cells were gated based on cell size and shape (forward and side scatter pulse area, FSC-A and SSC-A) and doublets were removed (width). Finally, the GFP intensity (FL1-A) of each cell in each well of 96-well plates was collected, and was divided by the mean GFP intensity of the corresponding well in the control plate containing the reference strain. A wild-type strain carrying no GFP was used to estimate background autofluorescence. GFP strains with mean GFP intensities below the above background level plus 1 standard deviation of the background level were removed from further analysis.
Quantitative RT-PCR
Following a previous study (Chen et al., 2013), we purified mRNAs from each of the 63 strains in which the pRPL5-GFP cassette was placed in chromosome 1. Briefly, cell cultures were treated with lyticase (Sigma) for 30 min at 30C, and total RNA was isolated and reverse transcribed in 96-well format using a Cells-2-Ct kit (Ambion). RNA extraction was replicated three times for each strain. GFP and ACT1 primers for quantitative RT-PCR were designed using NCBI (National Center for Biotechnology Information) Primer3-BLAST (Table S1). Quantitative RT-PCR was carried out on an Applied Biosystems 7500 Fast Real-Time PCR System with a 10 μl reaction volume containing 1 μl cDNAs, 1× Power SYBR Green PCR Master Mix (Ambion), and 4 picomoles each of forward and reverse primers. The reaction was repeated three times for each RNA extraction. The crossing-point
value was determined in the supplied software of the instrument with default settings. The difference in crossing point values measured for GFP and ACT1 of each strain was calculated. The expression level was estimated as 2 to the power of the crossing-point-value difference. Replication timing
DNA replication timing data (Koren et al., 2010) were previously collected from S. cerevisiae strain BY4741 grown in YPD at 30°C. The replication timing was estimated by FACS-sorting G1- and S-phase cells and co-hybridizing their DNA to Agilent genomic tiling arrays; a higher S-to-G1 signal ratio indicates earlier replication (Koren et al., 2010). The original report normalized the hybridization intensity to a mean of 0 and a standard deviation of 1 and provided one value per 10 nucleotides from the leftmost to the rightmost probe on each chromosome (Koren et al., 2010). We downloaded the DNA replication timing data from NCBI GEO (accession number: GSE17120), and defined the replication timing of a gene as the negative mean value of these 10-nucleotide-spaced genomic sites that are covered by the gene, where gene annotation was downloaded from NCBI GEO (GPL4131). Histone modifications
The yeast high-resolution genome-wide ChIP-chip data for histone acetylation and histone methylation (Pokholok et al., 2005) were downloaded from http://younglab.wi.mit.edu/nucleosome/. For each of seven histone modifications (H3K4me1, H3K4me2, H3K4me3, H3K36me3, H3K79me3, H3K9ac, and H3K14ac), average values from experimental replicates were used (Chen et al., 2013). The level of histone modification for a promoter was defined by the mean modification for the 250-bp segment that starts 250 bp upstream of the start codon of the endogenous gene that was replaced (Fig. S1). We also conducted a sliding segment analysis, with segment size equal to 250 bp and step size equal to 50 bp (Figs. S2, S4).
Nucleosome occupancy
We used two datasets to examine the relationship between nucleosome occupancy and expression noise. The first dataset is the above mentioned ChIP-chip data (Pokholok et al., 2005), and the analysis of histone H4 occupancy followed the above section. The results are presented in Fig. S3b, d. We also analyzed the dataset used by Batada and Hurst (Batada and Hurst, 2007). This ChIP-chip dataset (Lee et al., 2004) of Myc-tagged histone H4 was generated from S. cerevisiae strain UCC1111 in YPD at 30°C and was downloaded from University of North Carolina Microarray Database (https://genome.unc.edu/). The dataset provided estimates of nucleosome occupancy per gene and the median value in seven replicates for each gene annotated by SGD was used. The results are presented in Fig. S3a, c. Loci interacting in 3D chromosome architecture
We used the haploid yeast 3D chromosome architecture inferred by chromosome conformation capture-on-chip (4C) coupled with massively parallel sequencing (Duan et al., 2010). Files containing a list of chromosomal interactions identified from HindIII libraries at a false discovery rate of 1% were downloaded from the supplementary materials (Duan et al., 2010). After dividing all pairs of loci on different chromosomes into interacting (756,738) and noninteracting (11,075,082) pairs, we examined several properties of the nine-gene window that includes the focal gene as well as four consecutive genes on each side the focal gene. For each property considered, we define dissimilarity between two windows by the absolute difference between the windows in the average values of the property. Statistical analyses
To test if the mean between-promoter correlation in μ among the six examined genomic positions is significantly greater than expected by chance, we randomly shuffled the μ values among positions for each promoter and recalculated the mean between-promoter correlation. This was repeated 1000 times, and the fraction of times when the mean correlation from shuffled data exceeds that from the actual data is the P-value presented in Fig. 1e. The same was done for σ and CV, respectively.
To generate pseudo protein levels that have comparable estimation errors as mRNA levels, we conducted a computer simulation. For each strain, let the estimated mean GFP level be a and standard error be b. The true mean GFP level, referred to as X, follows the normal distribution N(a, b). We generated an X by drawing a random number from N(a, b). Let the CV of the mRNA level among replicates for the same strain be c. If protein level has the same measurement error (CV) as mRNA level, the S.D. for protein measurement would be cX. We then generated five normal variables from N(X, cX), and calculated the mean (Y) of the five variables. For the 63 strains
considered, 63 Y values were acquired. We tested if the CV of these 63 Y values is significantly smaller than that of mRNA measurements. To be conservative, this was repeated 1,000 times and the largest P-value was reported.
To examine if the observed fold change in μ among the 482 GFP strains is greater than expected under no position effect, we randomly reassigned μ values in all the replicates of all strains to form 482 sets of five μ values and calculated the 482 mean μ values. This was repeated 1000 times and the expected fold change without position effect is calculated by the median of the 1000 highest means divided by the median of the 1000 smallest means. The same was done for σ and CV, respectively. We found that the largest value is expected to be 4.7, 3.3, and 3.2 times the smallest value for μ, σ, and CV, respectively, should position effect be absent.
To study the chromosomal clustering of essential genes in the yeast genome, we followed Pal et al. (Pal and Hurst, 2003). Briefly, we calculated the variance in the number of essential genes per window across windows. To determine if the observed variance is larger than the random expectation, we followed Pal et al.’s randomization protocol. We randomly shuffled the locations of all genes and then recalculated the variance. This was repeated 1000 times, and the fraction of times when the variance in the shuffled genome exceeds that observed from the actual genome is reported. The same was performed in studying the chromosomal clustering of nucleosome occupancy, histone modifications, and DM. Because not all genes have the relevant data for the property considered, random shuffling was performed among loci that have the relevant data. References Batada, N.N., and Hurst, L.D. (2007). Evolution of chromosome organization driven by selection for reduced gene
expression noise. Nat Genet 39, 945-949. Chen, M., Licon, K., Otsuka, R., Pillus, L., and Ideker, T. (2013). Decoupling epigenetic and genetic effects through
systematic analysis of gene position. Cell Rep 3, 128-137. Duan, Z., Andronescu, M., Schutz, K., McIlwain, S., Kim, Y.J., Lee, C., Shendure, J., Fields, S., Blau, C.A., and
Noble, W.S. (2010). A three-dimensional model of the yeast genome. Nature 465, 363-367. Duveau, F., Metzger, B.P., Gruber, J.D., Mack, K., Sood, N., Brooks, T.E., and Wittkopp, P.J. (2014). Mapping
small effect mutations in Saccharomyces cerevisiae: impacts of experimental design and mutational properties. G3 (Bethesda) 4, 1205-1216.
Gietz, R.D., and Schiestl, R.H. (2007). Microtiter plate transformation using the LiAc/SS carrier DNA/PEG method. Nature protocols 2, 5-8.
Koren, A., Soifer, I., and Barkai, N. (2010). MRC1-dependent scaling of the budding yeast DNA replication timing program. Genome Res 20, 781-790.
Lee, C.K., Shibata, Y., Rao, B., Strahl, B.D., and Lieb, J.D. (2004). Evidence for nucleosome depletion at active regulatory regions genome-wide. Nat Genet 36, 900-905.
Pal, C., and Hurst, L.D. (2003). Evidence for co-evolution of gene order and recombination rate. Nat Genet 33, 392-395.
Pokholok, D.K., Harbison, C.T., Levine, S., Cole, M., Hannett, N.M., Lee, T.I., Bell, G.W., Walker, K., Rolfe, P.A., Herbolsheimer, E., et al. (2005). Genome-wide map of nucleosome acetylation and methylation in yeast. Cell 122, 517-527.
Storici, F., and Resnick, M.A. (2006). The delitto perfetto approach to in vivo site-directed mutagenesis and chromosome rearrangements with synthetic oligonucleotides in yeast. Methods Enzymol 409, 329-345.
Wach, A., Brachat, A., Alberti-Segui, C., Rebischung, C., and Philippsen, P. (1997). Heterologous HIS3 marker and GFP reporter modules for PCR-targeting in Saccharomyces cerevisiae. Yeast 13, 1065-1075.