CCQM Pilot Study P-140: Quantitative Surface Analysis of ...€¦ · CCQM Pilot Study P-140:...
28
1 CCQM Pilot Study P-140: Quantitative Surface Analysis of Multi-Element Alloy Films Kyung Joong KIM 1 , Jong Shik JANG 1 , An Soon KIM 1 , Jung Ki SUH 1 , Yong-Duck CHUNG 2 , Vasile-Dan HODOROABA 3 , Thomas WIRTH 3 , Wolfgang UNGER 3 , Hee Jae KANG 4 , Oleg POPOV 5 , Inna POPOV 5 , Ilya KUSELMAN 5 , Yeon Hee LEE 6 , David E. SYKES 7 , Meiling WANG 8 , Hai WANG 8 , Toshiya OGIWARA 9 , Mitsuaki NISHIO 9 , Shigeo TANUMA 9 , David SIMONS 10 , Christopher SZAKAL 10 , William OSBORN 10 , Shinya TERAUCHI 11 , Mika ITO 11 , Akira KUROKAWA 11 , Toshiyuki FUJIMOTO 11 , Werner JORDAAN 12 , Chil Seong JEONG 13 , Rasmus HAVELUND 14 , Steve SPENCER 14 , Alex SHARD 14 , Cornelia STREECK 15 , Burkhard BECKHOFF 15 , Axel EICKE 16 , Ralf TERBORG 17 1 Korea Research Institute of Standards and Science (KRISS), Republic of Korea 2 Electronics and Telecommunications Research Institute (ETRI), Republic of Korea 3 BAM Bundesanstalt für Materialforschung und – Prüfung, Germany 4 Chungbuk National University (CNU), Republic of Korea 5 National Physical Laboratory of Israel (INPL), Israel. 6 Korea Institute of Science and Technology (KIST), Republic of Korea 7 Loughborough Surface Analysis Ltd (LSA), UK 8 National Institute of Metrology (NIM), China. 9 National Institute for Materials Science (NIMS), JAPAN 10 National Institute of Standards and Technology (NIST), USA 11 National Metrology Institute of Japan (NMIJ), Japan. 12 National Metrology Institute of South Africa, (NMISA), South Africa. 13 National Nanofab Center (NNFC), Republic of Korea. 14 National Physical Laboratory (NPL), UK 15 Physikalisch-Technische Bundesanstalt (PTB), Germany 16 Zentrum für Sonnenenergie- und Wasserstoff-Forschung (ZSW), Germany. 17 Bruker Nano, Germany * Electronic mail: [email protected]
Transcript of CCQM Pilot Study P-140: Quantitative Surface Analysis of ...€¦ · CCQM Pilot Study P-140:...

1
CCQM Pilot Study P-140: Quantitative Surface Analysis
of Multi-Element Alloy Films
Kyung Joong KIM1, Jong Shik JANG1, An Soon KIM1, Jung Ki SUH1, Yong-Duck CHUNG2,
Vasile-Dan HODOROABA3, Thomas WIRTH3, Wolfgang UNGER3, Hee Jae KANG4, Oleg POPOV5,
Inna POPOV5, Ilya KUSELMAN5, Yeon Hee LEE6, David E. SYKES7, Meiling WANG8, Hai
WANG8, Toshiya OGIWARA9, Mitsuaki NISHIO9, Shigeo TANUMA9, David SIMONS10,
Christopher SZAKAL10, William OSBORN10, Shinya TERAUCHI11, Mika ITO11, Akira
KUROKAWA11, Toshiyuki FUJIMOTO11, Werner JORDAAN12, Chil Seong JEONG13,
Rasmus HAVELUND14, Steve SPENCER14, Alex SHARD14, Cornelia STREECK15,
Burkhard BECKHOFF15, Axel EICKE16, Ralf TERBORG17
1 Korea Research Institute of Standards and Science (KRISS), Republic of Korea 2 Electronics and Telecommunications Research Institute (ETRI), Republic of Korea 3 BAM Bundesanstalt für Materialforschung und – Prüfung, Germany 4 Chungbuk National University (CNU), Republic of Korea 5 National Physical Laboratory of Israel (INPL), Israel. 6 Korea Institute of Science and Technology (KIST), Republic of Korea 7 Loughborough Surface Analysis Ltd (LSA), UK 8 National Institute of Metrology (NIM), China. 9 National Institute for Materials Science (NIMS), JAPAN 10 National Institute of Standards and Technology (NIST), USA 11 National Metrology Institute of Japan (NMIJ), Japan. 12 National Metrology Institute of South Africa, (NMISA), South Africa. 13 National Nanofab Center (NNFC), Republic of Korea. 14 National Physical Laboratory (NPL), UK 15 Physikalisch-Technische Bundesanstalt (PTB), Germany 16 Zentrum für Sonnenenergie- und Wasserstoff-Forschung (ZSW), Germany. 17 Bruker Nano, Germany *Electronic mail: [email protected]

2
Abstract
A pilot study for a quantitative surface analysis of multi-element alloy films has been
performed by the Surface Analysis Working Group (SAWG) of the Consultative Committee
for Amount of Substance (CCQM). The aim of this pilot study is to evaluate a protocol for a
key comparison to demonstrate the equivalence of measures by National Metrology Institutes
(NMIs) and Designated Institutes (DI) for the mole fractions of multi-element alloy films.
A Cu(In,Ga)Se2 (CIGS) film with non-uniform depth distribution was chosen as a
representative multi-element alloy film. The mole fractions of the reference and the test CIGS
films were certified by isotope dilution - inductively coupled plasma/mass spectrometry. A
total number counting (TNC) method was used as a method to determine the signal intensities
of the constituent elements acquired in SIMS, XPS and AES depth profiling. TNC method is
comparable with the certification process because the certified mole fractions are the average
values of the films.
The mole fractions of the CIGS films were measured by Secondary Ion Mass
Spectrometry (SIMS), Auger Electron Spectroscopy (AES), X-ray Photoelectron
Spectroscopy (XPS), X-Ray Fluorescence (XRF) Analysis and Electron Probe Micro
Analysis (EPMA) with Energy Dispersive X-ray Spectrometry (EDX). Fifteen laboratories
from eight NMIs, one DI, and six non-NMIs participated in this pilot study.
The average mole fractions of the reported data showed relative standard deviations from
5.5 % to 6.8 % and average relative expanded uncertainties in the range from 4.52 % to 4.86 %
for the four test CIGS specimens. These values are smaller than those in the key comparison
K-67 for the measurement of mole fractions of Fe-Ni alloy films. As one result it can be
stated that SIMS, XPS and AES protocols relying on the quantification of CIGS films using
the TNC method are mature to be used in a CCQM key comparison.

3
1. INTRODUCTION Several pilot studies and key comparisons have been performed by the Surface Analysis
Working Group (SAWG) of the Consultative Committee for Amount of Substance
(CCQM) since 2004.[1-4] The aim of the pilot studies and key comparisons is to ensure
equivalency of measurements made by National Metrology Institutes (NMIs) and Designated
Institutes (DIs). Up to now, two key comparisons have been performed by the SAWG for the
thickness measurement of nanometer SiO2 films and for the quantitative analysis of binary
alloy films. Cu(In,Ga)Se2 (CIGS) thin film solar cells are next-generation solar cells with high
conversion efficiency and low fabrication cost.[5,6] The conversion efficiency of CIGS thin
film solar cells depends on the chalcopyrite crystal structure of the CIGS film.[7] For the
formation of chalcopyrite CIGS films, the relative mole fractions and in-depth distributions
of the constituent elements should be regulated precisely to control the fabrication procedure.
Due to the high technological interest of CIGS films, elemental depth profiles have been
studied by several characterization methods, among them many conventional analytical
techniques, confirming the analytical challenges when appropriate calibration samples are not
available.[8-14]
Although Auger Electron Spectroscopy (AES) and X-ray Photoelectron Spectroscopy
(XPS) are generally used for the surface compositional analysis of multi-element alloy films,
accurate surface composition analysis is difficult due to matrix effects. Pure element relative
sensitivity factors (PERSFs) determined from pure elements are generally applied for the
quantification of alloy materials. However, matrix effects due to atomic density, attenuation
lengths of electrons and the electron backscattering factor in the matrix materials should be
taken into account. [15-17]
A calibration method using alloy reference materials is recommended for the
quantitative analysis of binary alloys to compensate for the matrix effects. The best method
for the quantification of binary alloys is to use an alloy reference with a similar composition
to the sample to be analyzed, and the next best approach is to use a calibration curve
measured using a series of alloy reference materials with different compositions spanning the
unknown composition. [18-21]
A CIGS film with a non-uniform depth distribution was chosen as a representative multi-
element alloy film. The mole fractions of the reference and test CIGS films were certified by

4
the method of inductively coupled plasma mass spectrometry with isotope dilution (ID-
ICP/MS). Total number counting (TNC) method was used as a method to determine the
signal intensities of the constituent elements in the CIGS films after SIMS, XPS and AES
sputter depth profiling by most participants. This method is comparable to the certification
process by ID-ICP/MS because the film material is fully dissolved within a solvent in ID-
ICP/MS and the measured mole fractions are the average values over the depth of the film.
The analyses of CIGS films were confirmed to be quantitative by Secondary Ion Mass
Spectrometry (SIMS) and AES depth profiling analyses using the TNC method. [22,23]
In this CCQM pilot study, the mole fractions of CIGS films were measured by various
surface analysis methods such as SIMS, AES, XPS, X-ray Fluorescence (XRF) and Electron
Probe Micro Analysis (EPMA) with Energy Dispersive X-ray Spectrometry (EDX). 18 data
sets were collected from 15 laboratories. The relative expanded uncertainties of this pilot
study are smaller than 5 %. The quantification of CIGS films was found to be a good subject
for a CCQM key comparison.
2. SPECIMENS Polycrystalline CIGS thin films of about 2 μm thickness were grown on 100 mm x 100
mm soda-lime glass (SLG) substrates by 3-step thermal evaporation.[24] Before the growth
of the CIGS layer, a Mo back contact layer of about 900 nm was deposited on a soda lime
glass substrate using a DC sputtering system. Four CIGS test films with different mole
fractions were produced by varying the mole fraction of Ga. The mole fractions of Cu, In, Ga
and Se are not homogeneous with depth, which is similar with those of the real solar cells.
The specimens were kept in vacuum packs to prevent a change of surface state due to
oxidation by exposure to the atmosphere. Figure 1 shows photographs of the specimen
packages delivered to the participants.
Figure 1. Photographs of the reference specimen package and test specimen package.

5
The relative mole fractions of Cu, In, Ga and Se in the reference and test CIGS films
were certified by ID-ICP/MS. The isotopic ratios of n(63Cu)/n(65Cu), n(113In)/n(115In),
n(69Ga)/n(71Ga) and n(78Se)/n(82Se) were precisely measured for the quantification of metallic
elements.
The CIGS film wafers of 100 mm x 100 mm were cut to small specimens of 10 mm x 10
mm for the certification. The sample solution was prepared by dissolving the CIGS films in a
30% HNO3 solution. The mass difference of the CIGS films after dissolution was about 1.8
mg. The enriched spike isotopic standards were added quantitatively to an aliquot of the
sample solution to yield isotope ratios in the range 0.5 - 1. The isotope ratios in this range
minimize the error propagation factor and measurement uncertainty. The spiked sample
solutions were diluted with deionized water appropriately for ICP/MS measurement.
The enriched isotopes provided by Oak Ridge National Lab were 65Cu (Batch 165740), 113In (Batch 115840) and 82Se (Batch 195291). The isotope of 71Ga (99.60%) was purchased
from U.S Service Inc. All analytical measurements were performed by means of a quadrupole
ICP/MS.
Table 1. Uncertainty in the determination of the mass fraction of Cu in the CIGS thin film CRM by ID-ICP/MS.
No Analytical results (mg/kg)
Standard deviation due to systematic effects (mg/kg)
Degree of freedom (ν)
1 148204 633 3 2 143044 611 3 3 152015 649 3 4 146861 627 3 5 143723 614 3 6 155643 665 3 7 150411 642 3 8 140177 599 3 9 150584 643 3
10 145342 621 3 Mean 147600 630 3
Standard deviation 1482 Combined standard uncertainty 1611 Blank 0.98 Determined value 147599
Combined standard uncertainty (uc) 1611 Degree of freedom 11 Coverage factor (k) 2.201
Expanded uncertainty (U) at 95 % level of confidence 3546
Relative expanded uncertainty 2.40 %

6
Table 2. The measurement uncertainties for Cu, In, Ga and Se in the CIGS thin film CRM.
Element Certification result (g/kg) Relative Uncertainty (%) value uc k* U* uc U*
Cu 147.6 1.61 2.20 3.55 1.09 2.40 In 213.2 3.13 2.20 6.89 1.47 3.23 Ga 44.6 0.86 2.45 2.12 1.93 4.72 Se 390.2 5.03 2.23 11.2 1.29 2.87
Table 1 shows an example of the quantification results and the measurement uncertainty
for the quantification of Cu in the CIGS thin film CRM. The quantification results and the
measurement uncertainty for Cu, In, Ga and Se in the CIGS thin film CRM are summarized
in Table 2. The expanded uncertainties are in the range of 2% - 5%. The measured mass was
divided by atomic mass and converted to relative molar concentration. The relative mole
fractions of Cu, In, Ga and Se in the four CIGS films were determined from the assumption
that the CIGS films are composed of only four elements. The mole fractions and the
measurement uncertainties for Cu, In, Ga and Se in the reference CIGS film are summarized
in Table 3.
Table 4 shows the mole fractions of the four test CIGS films certified by ID-ICP/MS. The
relative mole fractions of Cu, In, Ga and Se in the four CIGS films were determined from the
assumption that the CIGS films are composed of only four elements. The reference CIGS
film was used as a test specimen (Test 2 CIGS specimen) to confirm the reliability of the
analysis. The analysis results of the Test 2 specimen give a chance to compare the reliability
of the analysis methods involved in this pilot study.
Table 3. Certified mole fractions ( ) and the measurement uncertainties for Cu, In, Ga and Se in the reference CIGS film.
Element Mole
Fraction (% mol/mol)
Standard Uncertainty (uCRM; %)
Degrees of Freedom (νCRM)
Coverage Factor
(k)
Expanded Uncertainty (UCRM; %)
Cu 23.80 1.09 11 2.201 2.40 In 19.02 1.47 11 2.201 3.24 Ga 6.55 1.94 6 2.447 4.75 Se 50.63 1.29 10 2.230 2.88
Table 4. The certified mole fractions for the each test CIGS films by ID-ICP/MS.
Element Mole fraction (% mol/mol) Test 1 Test 2 Test 3 Test 4
Cu 23.62 23.80 23.81 25.10 In 19.99 19.02 19.48 18.06 Ga 5.52 6.55 6.83 7.48 Se 50.87 50.63 49.88 49.35
ARiC

7
3. OUTLINE OF THE PILOT STUDY
3.1. Objective, Timetable and Participation
The objective of the CCQM pilot study P-140 was to evaluate protocols to determine the
mole fractions of CIGS films and to verify the equivalency of NMIs and DIs in the
measurement of the mole fractions of multi-element alloy films with non-uniform depth
distributions. In April 2010, the quantitative analysis of CIGS films was first suggested as a
new subject for the pilot study in the CCQM SAWG. In April 2012, after certification of the
relative mole fractions of CIGS films by ID-ICP/MS the quantitative analysis of CIGS films
was approved as a project for a pilot study in the CCQM SAWG. The possibility of
quantitative SIMS, XPS and AES sputter depth profiling by the TNC method had been
confirmed also in 2012/13.[22,23] The protocol and the specimens were delivered to the
participants in May of 2013. The results of the pilot study were collected by the end of 2013.
15 laboratories including 8 NMIs, 1 DI and 6 non-NMI laboratories participated in this pilot
study as shown in Table 5.
Table 5. Participants in P-140
Country Institution Method NMI or DI
Germany Bundesanstalt für Materialforschung und – Prüfung (BAM) AES,EPMA DI
Korea Chungbuk National University (CNU) AES No
Israel National Physical Laboratory of Israel (INPL) EPMA NMI
Korea Korea Institute of Science and Technology (KIST) SIMS No
Korea Korea Research Institute of Standards & Science (KRISS) SIMS NMI
UK Loughborough Surface Analysis Ltd (LSA) SIMS No
China National Institute of Metrology (NIM) XPS NMI
Japan National Institute for Materials Science (NIMS) AES No
USA National Institute of Standards and Technology (NIST) SIMS,XPS NMI
Japan National Metrology Institute of Japan (NMIJ) AES NMI
S. Africa National Metrology Institute of South Africa (NMISA) XPS NMI
Korea National Nanofab Center (NNFC) SIMS No
UK National Physical Laboratory (NPL) SIMS,XPS NMI
Germany Physikalisch-Technische Bundesanstalt (PTB) XRF NMI
Germany Zentrum für Sonnenenergie- und Wasserstoff-Forschung (ZSW) XRF No

8
3.2. Quantification Methods
In the quantitative analysis of an alloy film by ID-ICP/MS, the mole fractions of the
constituent elements are average values of the film because all the film material is dissolved
in a solvent. In the same manner, the TNC method was suggested as a new method to
quantify multi-element alloy films by surface analysis methods using depth profiling analysis.
In this method, the average mole fractions of the constituent elements are determined because
all the individual signal intensities are integrated to determine the signal intensities of the
elements after depth profiling analysis. The average mole fractions of the alloy films and the
in-depth distributions of the constituent elements could be quantitatively determined using a
reference material with similar composition as those of the test specimens.[22,23]
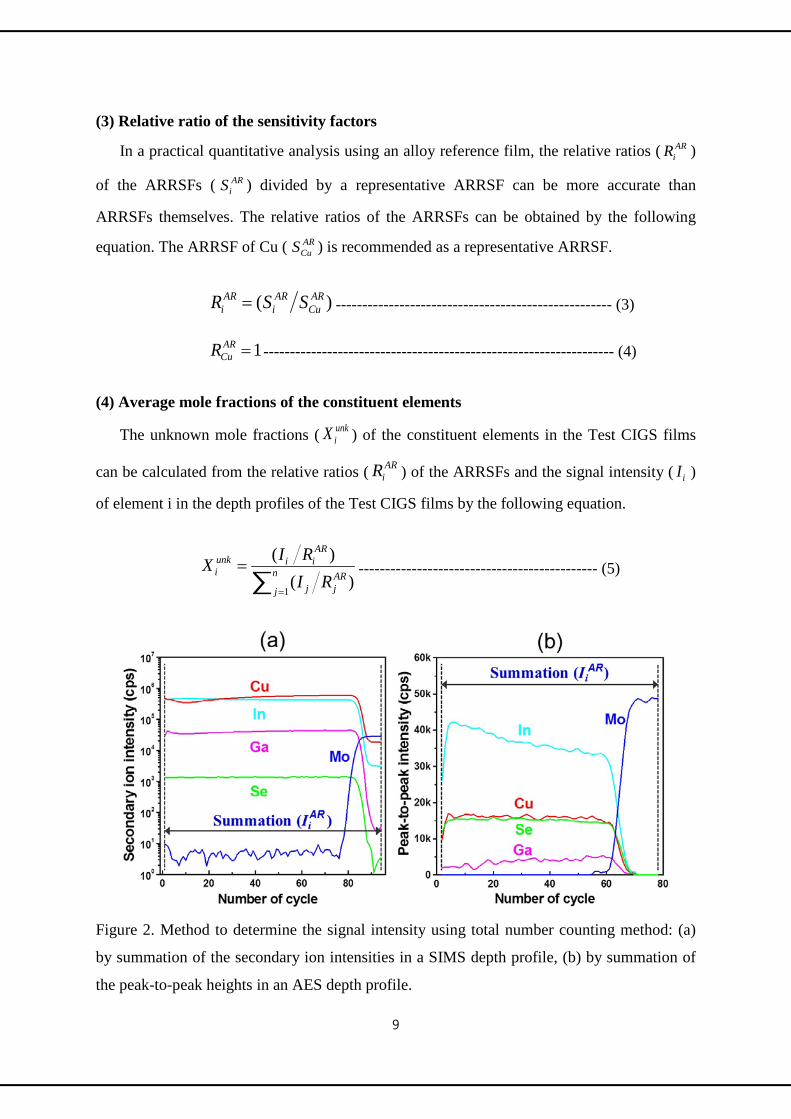
(1) Determination of signal intensity by TNC
Figure 2 shows an example of the signal intensities of Cu, In, Ga and Se in a raw SIMS
and an AES depth profile of the reference CIGS film. The signal intensities ( ARiI ) of the
constituent elements are determined from the summation of the individual intensities of
element i (ARkii , ) of the constituent element i over the whole measurement cycles (k) by the
TNC method after depth profiling of the reference CIGS film.
∑m
kARki
ARi iI
1 ,== ---------------------------------------------------- (1)
The peak areas and the peak-to-peak heights can also be used as the signal intensities for
the quantitative analysis by XPS and AES depth profiling analyses, respectively.
(2) Determination of sensitivity factors
Alloy reference relative sensitivity factors (ARRSFs) are recommended as RSFs for the
quantification of CIGS alloy films by surface analysis methods. The ARRSFs ( ARiS ) of the
multi-element alloy films can be determined by dividing the signal intensities ( ARiI ) of the
constituent elements by the certified mole fractions ( ARiC ) from the following equation,
)(= ARi
ARi
ARi CIS ------------------------------------------------- (2)
9
(3) Relative ratio of the sensitivity factors
In a practical quantitative analysis using an alloy reference film, the relative ratios ( )
of the ARRSFs ( ) divided by a representative ARRSF can be more accurate than
ARRSFs themselves. The relative ratios of the ARRSFs can be obtained by the following
equation. The ARRSF of Cu ( ) is recommended as a representative ARRSF.
---------------------------------------------------- (3)
------------------------------------------------------------------ (4)
(4) Average mole fractions of the constituent elements
The unknown mole fractions ( unkiX ) of the constituent elements in the Test CIGS films
can be calculated from the relative ratios ( ARiR ) of the ARRSFs and the signal intensity ( iI )
of element i in the depth profiles of the Test CIGS films by the following equation.
)()(
1∑n
jARjj
ARiiunk
iRI
RIX=
= --------------------------------------------- (5)
Figure 2. Method to determine the signal intensity using total number counting method: (a)
by summation of the secondary ion intensities in a SIMS depth profile, (b) by summation of
the peak-to-peak heights in an AES depth profile.
ARiR
ARiS
ARCuS
)( ARCu
ARi
ARi SSR =
1=ARCuR

10
The signal intensities in the denominator of Eqn 5 for Cu, In, Ga and Se, derived from Eqn 1,
are the sums of the individual signal intensities over the whole depth range in a raw SIMS,
XPS or AES depth profiles. Here, j and n mean the constituent elements and the number of
them.
(5) Determination of Uncertainty
In the quantification of the CIGS films using ARRSFs, the combined standard uncertainty
(uc) is calculated from the following simple relation,
----------------------------------------- (6)
where uCRM is the combined standard uncertainty in the certification of the reference CIGS
film as shown in Table 3. uRSF and uquant are the standard uncertainties in the determination of
the ARRSFs and the quantification of the CIGS films, respectively. The standard uncertainty
in the determination of RSF (uRSF) of RCuAR is fixed to be zero because Cu is the
representative ARRSF in Eqn 4. An example of the determination of the combined standard
uncertainty uc and the expanded uncertainty U = kuc, with 95 % confidence level is shown in
Table 6. The effective degrees of freedom (νeff) were estimated from the standard
uncertainties and the degrees of freedom by the Welch-Sattert hwaite formula, as in the
following equation.
----------------------------------------------------- (7)
Table 6. Example of an uncertainty budget for the quantification of the test2 CIGS film by
SIMS with a 5 keV O2+ ion beam using the ARRSFs.
2222quantRSFCRMc uuuu ++=
∑=
=N
i i
iceff
uu1
44
νν
Uncertainty component Element
Cu In Ga Se Standard uncertainty uCRM (%) 1.09 1.47 1.94 1.29 Standard uncertainty uRSF (%) 0 0.82 0.80 0.93 Standard uncertainty uquant (%) 0.94 0.49 0.7 0.23
Combined standard uncertainty uc (%) 1.44 1.75 2.21 1.60 Degree of freedom,νCRM 11 11 6 10 Degree of freedom,νRSF 4 4 4 4 Degree of freedom,νquant 4 4 4 4
Effective degree of freedom, νeff 13 17 9 14 Coverage factor, k 2.16 2.11 2.26 2.14
U = kuc (%) 3.11 3.70 5.00 3.43

11
4. RESULTS
The mole fractions reported by 15 laboratories including 8 NMIs, 1 DI and 6 non-NMI
laboratories are shown in Table 7. Average relative standard deviations of the Test 1, Test 2,
Test 3 and Test 4 specimens are 5.53 %, 6.16 %, 6.77 % and 6.07 %, respectively. These large
relative standard deviations are dominated by several results which show large discrepancies
from the certified values. In order to investigate the quality of the data sets, the relative
differences (Di) of the measured mole fractions (Mi) from the certified values (Ci) were
determined from the following equation,
(%)100×−
=i
iii C
CMD
--------------------------------------------- (8)
Table 8 shows the relative differences of the measured mole fractions from the certified
mole fractions for all data sets. The average differences of some laboratories (5, 6, 9, 10 and
18) are larger than 5 %.
The expanded uncertainties of the measured mole fractions of the four test CIGS films
were evaluated by Eqn 6. Table 9 shows the relative expanded uncertainties with 95 %
confidence level.
Table 7. Measured mole fractions of the four test CIGS films.
Specimen SIMS XPS AES XRF EPMA
Ave. RSD 1 2 3 4 5 6 7 8 9 10 11 12 13 14 15 16 17 18
Test 1
Cu 22.50 22.98 23.60 24.44 21.35 21.62 24.35 23.59 24.01 23.04 23.90 24.02 24.00 23.50 23.65 23.78 23.60 23.52 23.41 3.62
In 20.00 20.19 19.90 19.87 16.06 21.87 19.52 20.24 19.91 17.77 20.10 19.63 20.80 20.22 20.07 19.64 20.20 20.65 19.81 6.14
Ga 5.40 6.07 5.50 5.95 5.86 5.62 5.79 5.64 5.39 7.77 6.00 5.88 5.70 5.70 5.62 5.73 5.60 6.49 5.87 9.22
Se 52.10 50.77 51.00 49.75 56.72 50.03 50.33 50.53 50.69 51.42 49.90 50.48 49.60 50.57 50.69 50.85 50.60 49.34 50.85 3.15
Test 2
Cu 23.40 23.85 23.40 24.61 22.97 26.92 24.02 24.13 24.04 23.00 23.60 23.63 23.90 23.65 23.81 23.79 23.70 22.77 23.84 3.72
In 18.90 19.51 19.60 19.17 18.23 22.07 18.87 19.53 19.15 16.77 19.30 18.84 18.80 19.71 19.12 19.06 19.10 23.92 19.43 7.66
Ga 6.30 6.63 6.50 6.67 6.95 6.40 6.56 6.49 5.66 8.96 6.80 6.65 6.40 6.37 6.52 6.58 6.60 6.83 6.66 9.54
Se 51.50 50.00 50.60 49.55 51.85 44.17 50.55 49.85 51.16 51.27 50.30 50.88 50.90 50.27 50.62 50.57 50.70 46.49 50.07 3.71
Test 3
Cu 24.30 23.47 22.80 24.47 21.98 26.33 23.71 23.85 23.84 22.26 23.60 23.56 23.40 23.75 23.66 23.59 23.50 22.54 23.59 4.00
In 18.10 19.62 20.10 19.12 16.04 19.59 18.69 19.19 19.42 17.73 19.30 18.88 17.80 19.32 19.16 19.04 19.20 25.00 19.18 8.99
Ga 6.50 6.70 6.80 6.89 7.51 6.77 6.67 6.52 5.23 8.99 6.80 6.88 6.80 6.52 6.57 6.68 6.50 7.04 6.80 10.26
Se 51.10 50.22 50.20 49.53 54.47 46.40 50.94 50.44 51.51 51.02 50.30 50.68 52.00 50.40 50.68 50.70 50.70 45.42 50.37 3.84
Test 4
Cu 25.30 25.36 24.50 25.79 25.19 25.78 24.98 24.56 24.38 23.60 24.70 24.65 24.70 24.78 24.71 24.95 24.80 24.02 24.82 2.21
In 17.40 18.50 18.70 17.91 15.45 20.61 16.89 17.32 18.58 15.78 17.90 17.39 17.00 18.09 18.01 17.78 18.00 22.31 17.98 8.68
Ga 7.20 6.99 7.60 7.42 8.36 7.48 7.56 7.19 5.65 9.77 7.50 7.28 7.50 6.87 7.12 7.27 7.10 7.61 7.42 10.58
Se 50.00 49.15 49.20 48.88 51.00 46.96 50.57 50.93 51.39 50.86 50.00 50.67 50.80 50.26 50.26 50.01 50.10 46.07 49.84 2.79

12
Table 8. Relative differences of the measured mole fractions from the certified values.
Specimen SIMS XPS AES XRF EPMA
1 2 3 4 5 6 7 8 9 10 11 12 13 14 15 16 17 18
Test 1
Cu 4.74 2.71 0.08 3.47 9.61 8.47 3.09 0.13 1.65 2.46 1.19 1.69 1.61 0.51 0.13 0.68 0.08 0.42 In 0.05 1.00 0.45 0.60 19.66 9.40 2.35 1.25 0.40 11.11 0.55 1.80 4.05 1.15 0.40 1.75 1.05 3.30 Ga 2.17 9.96 0.36 7.79 6.16 1.81 4.89 2.17 2.36 40.76 8.70 6.52 3.26 3.26 1.81 3.80 1.45 17.57 Se 2.42 0.20 0.26 2.20 11.50 1.65 1.06 0.67 0.35 1.08 1.91 0.77 2.50 0.59 0.35 0.04 0.53 3.01
Test 2
Cu 1.68 0.21 1.68 3.40 3.49 13.11 0.92 1.39 1.01 3.36 0.84 0.71 0.42 0.63 0.04 0.04 0.42 4.33 In 0.63 2.58 3.05 0.79 4.15 16.04 0.79 2.68 0.68 11.83 1.47 0.95 1.16 3.63 0.53 0.21 0.42 25.76 Ga 3.82 1.22 0.76 1.83 6.11 2.29 0.15 0.92 13.59 36.79 3.82 1.53 2.29 2.75 0.46 0.46 0.76 4.27 Se 1.72 1.24 0.06 2.13 2.41 12.76 0.16 1.54 1.05 1.26 0.65 0.49 0.53 0.71 0.02 0.12 0.14 8.18
Test 3
Cu 2.06 1.43 4.24 2.77 7.69 10.58 0.42 0.17 0.13 6.51 0.88 1.05 1.72 0.25 0.63 0.92 1.30 5.33 In 7.08 0.72 3.18 1.85 17.66 0.56 4.06 1.49 0.31 8.98 0.92 3.08 8.62 0.82 1.64 2.26 1.44 28.34 Ga 4.83 1.90 0.44 0.88 9.96 0.88 2.34 4.54 23.43 31.63 0.44 0.73 0.44 4.54 3.81 2.20 4.83 3.07 Se 2.45 0.68 0.64 0.70 9.20 6.98 2.13 1.12 3.27 2.29 0.84 1.60 4.25 1.04 1.60 1.64 1.64 8.94
Test 4
Cu 0.80 1.04 2.39 2.75 0.36 2.71 0.48 2.15 2.87 5.98 1.59 1.79 1.59 1.27 1.55 0.60 1.20 4.30 In 3.65 2.44 3.54 0.83 14.45 14.12 6.48 4.10 2.88 12.62 0.89 3.71 5.87 0.17 0.28 1.55 0.33 23.53 Ga 3.74 6.55 1.60 0.80 11.76 0.00 1.07 3.88 24.47 30.61 0.27 2.67 0.27 8.16 4.81 2.81 5.08 1.74 Se 1.32 0.41 0.30 0.95 3.34 4.84 2.47 3.20 4.13 3.06 1.32 2.67 2.94 1.84 1.84 1.34 1.52 6.65
Average 2.70 2.14 1.44 2.11 8.59 6.64 2.05 1.96 5.16 13.15 1.64 1.99 2.60 1.96 1.24 1.28 1.39 9.30
Table 9. Relative expanded uncertainties of the measured mole fractions.
Specimen SIMS XPS AES XRF EPMA
1 2 3 4* 5 6 7 8 9 10* 11 12 13 14 15** 16 17 18
Test 1
Cu 2.49 2.64 3.79 - 2.85 2.17 3.41 2.53 2.86 - 2.41 2.46 2.49 2.71 4.24 2.42 2.42 2.67 In 6.51 3.67 4.74 - 5.61 3.04 4.42 3.53 8.89 - 3.62 3.38 9.85 3.64 10.81 3.32 3.25 10.77 Ga 5.14 4.97 5.32 - 4.80 3.81 5.71 5.51 32.00 - 4.94 5.66 6.66 5.58 7.14 4.79 4.76 11.48 Se 3.20 3.40 4.52 - 3.54 4.59 2.90 3.64 3.25 - 3.10 2.91 5.19 2.87 5.33 2.89 2.89 5.09
Test 2
Cu 2.56 3.11 2.64 - 2.71 2.78 2.51 2.47 2.64 - 2.46 2.48 3.15 2.41 4.21 2.42 2.40 2.15 In 6.34 3.70 3.76 - 5.00 3.09 4.72 3.60 6.53 - 3.56 3.44 7.94 3.63 10.81 3.33 3.25 6.21 Ga 5.14 5.00 4.77 - 4.73 3.81 5.55 5.79 24.87 - 4.81 6.24 6.13 4.80 7.18 4.79 4.84 11.21 Se 3.16 3.43 3.78 - 3.52 4.60 3.02 3.63 3.09 - 3.09 2.91 5.07 2.90 5.19 2.89 2.90 4.40
Test 3
Cu 2.64 2.99 3.44 - 3.40 2.36 2.46 2.55 3.11 - 2.43 3.18 4.07 2.43 4.23 2.42 2.41 2.38 In 6.26 3.77 3.98 - 5.36 2.98 4.01 3.53 5.86 - 3.55 3.40 7.89 3.68 10.78 3.30 3.28 6.19 Ga 5.12 5.12 4.86 - 4.70 3.81 5.49 5.58 24.49 - 4.89 7.34 5.96 4.72 7.15 4.77 4.80 11.11 Se 3.15 3.40 4.12 - 3.55 4.60 2.99 3.69 3.14 - 3.10 2.92 4.88 2.89 5.19 2.89 2.88 4.25
Test 4
Cu 2.83 2.87 3.21 - 3.03 3.87 2.43 2.46 3.53 - 2.45 2.53 2.67 2.50 4.21 2.42 2.41 2.58 In 6.35 3.86 4.06 - 5.52 3.96 4.59 4.10 5.64 - 3.55 3.39 6.81 3.67 10.78 3.30 3.28 6.18 Ga 5.13 5.46 5.28 - 4.68 3.80 6.85 5.20 24.72 - 5.50 5.45 5.98 4.79 7.17 4.77 4.73 10.73 Se 3.15 3.42 4.21 - 3.65 4.13 2.95 3.64 3.21 - 3.09 2.88 4.59 2.88 5.09 2.89 2.88 4.27
Average 4.32 3.80 4.16 - 4.16 3.59 4.00 3.84 9.86 3.53 3.79 5.58 3.51 6.84 3.35 3.34 6.35 * Uncertainty is difficult to determine due to the small number of measurement (one time). ** The number of independent measurements per sample varied between one and two; the respective
uncertainties were derived as described in section D.

13
4.1. Secondary Ion Mass Spectrometry (SIMS)
In this P-140 pilot study, six laboratories (1 to 6) participated in the quantification of
CIGS films by SIMS as shown in Tables 7, 8 and 9. The details of the instruments and the
experimental conditions of the participating laboratories are described in Table 10. Five
magnetic sector SIMS and one TOF-SIMS were used.
In the case of NIST, the mole fractions and depth distributions of the CIGS thin films
were analyzed by a magnetic sector SIMS (IMS-1270, Cameca, France). An oxygen ion beam
(O2+) with impact energy of 8 keV at an incidence angle of 43o from the sample normal is
achieved by combination of a primary ion energy of 15 keV and a sample bias voltage of 7
keV was rastered over an area of 250 μm x 250 μm on the film surface. Secondary ions of 63Cu+, 71Ga+, 80Se+ and 113In+ were collected from an area of 40 μm x 40 μm in the center of
the rastered area and were detected by an electron multiplier. The raw SIMS depth profiles of
the test CIGS films were converted to compositional depth profiles using the TNC method.
KRISS used a magnetic sector SIMS (IMS-7f, Cameca, France). The CIGS films were
sputtered by an O2+ ion beam with an impact energy of 5 keV at an incidence angle of 46o.
63Cu+, 113In+, 71Ga+ and 80Se+ ions ejected from an area of 56 x 56 μm2 in the center of the
rastered area were detected by an electron multiplier. The experimental conditions of the
Cameca IMS-3f of LSA were very similar with those of KRISS.
Table 10. Details of the SIMS instruments and the experimental parameters of the
participating laboratories.*
*Certain commercial instruments are identified in this report to specify the experimental procedure adequately. Such identification is not intended to imply recommendation or endorsement by the National Institute of Standards and Technology and the other NMIs nor is it intended to imply that the instruments identified are necessarily the best available for the purpose.
Laboratory NIST KRISS NPL LSA NNFC KIST
Maker Cameca Cameca ION-TOF Cameca Cameca Cameca
Model IMS-1270 IMS-7f TOF-SIMS IV IMS-3f IMS-7f IMS4FE7
Sputtering Ion O2+ O2
+ Cs+ O2+ Cs+ O2
+
Impact Energy (keV) 8 5 10 5.5 5 8
Incidence Angle ( º ) 43 46 45 42 45 38.7
Rastering Area (μm2) 250 × 250 120 × 120 150 x 150 200 × 200 175 × 175 150 × 150
Collection Area (μm2) 40 x 40 56 x 56 - 50 x 50 - -
Zalar Rotation No No No No No No
14
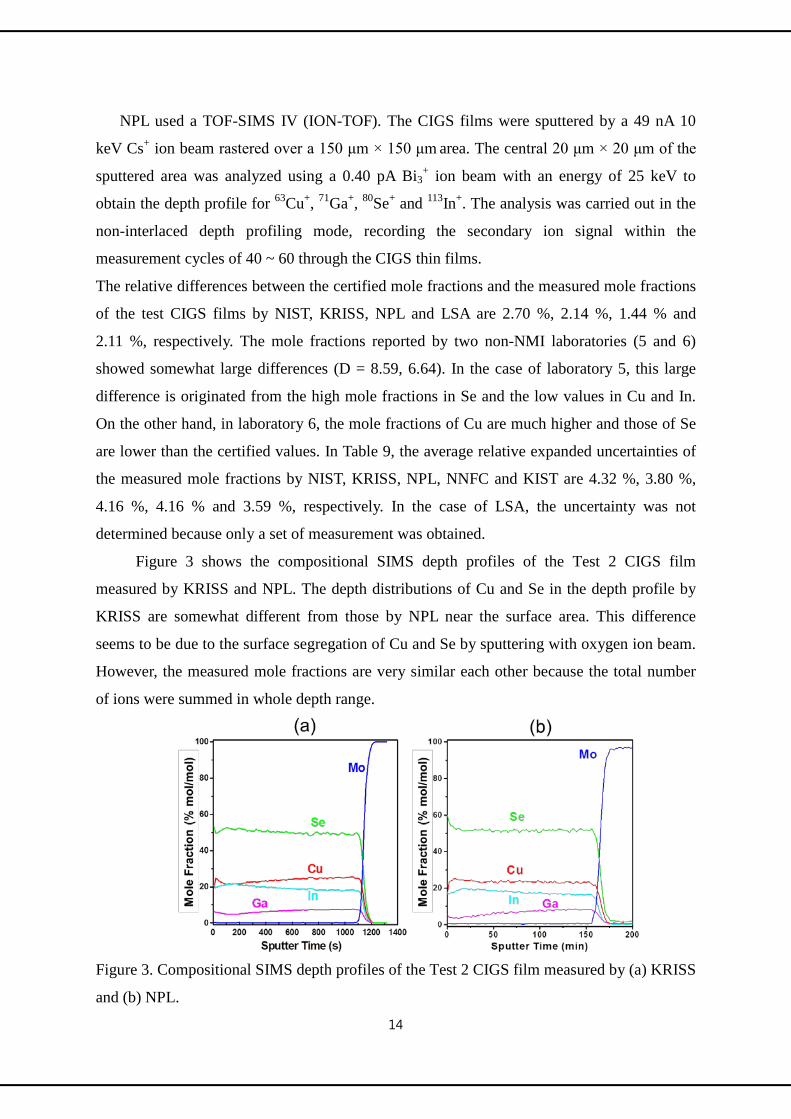
NPL used a TOF-SIMS IV (ION-TOF). The CIGS films were sputtered by a 49 nA 10
keV Cs+ ion beam rastered over a 150 μm × 150 μm area. The central 20 μm × 20 μm of the
sputtered area was analyzed using a 0.40 pA Bi3+ ion beam with an energy of 25 keV to
obtain the depth profile for 63Cu+, 71Ga+, 80Se+ and 113In+. The analysis was carried out in the
non-interlaced depth profiling mode, recording the secondary ion signal within the
measurement cycles of 40 ~ 60 through the CIGS thin films.
The relative differences between the certified mole fractions and the measured mole fractions
of the test CIGS films by NIST, KRISS, NPL and LSA are 2.70 %, 2.14 %, 1.44 % and
2.11 %, respectively. The mole fractions reported by two non-NMI laboratories (5 and 6)
showed somewhat large differences (D = 8.59, 6.64). In the case of laboratory 5, this large
difference is originated from the high mole fractions in Se and the low values in Cu and In.
On the other hand, in laboratory 6, the mole fractions of Cu are much higher and those of Se
are lower than the certified values. In Table 9, the average relative expanded uncertainties of
the measured mole fractions by NIST, KRISS, NPL, NNFC and KIST are 4.32 %, 3.80 %,
4.16 %, 4.16 % and 3.59 %, respectively. In the case of LSA, the uncertainty was not
determined because only a set of measurement was obtained.
Figure 3 shows the compositional SIMS depth profiles of the Test 2 CIGS film
measured by KRISS and NPL. The depth distributions of Cu and Se in the depth profile by
KRISS are somewhat different from those by NPL near the surface area. This difference
seems to be due to the surface segregation of Cu and Se by sputtering with oxygen ion beam.
However, the measured mole fractions are very similar each other because the total number
of ions were summed in whole depth range.
Figure 3. Compositional SIMS depth profiles of the Test 2 CIGS film measured by (a) KRISS
and (b) NPL.
15
B. X-ray Photoelectron Spectroscopy (XPS)
The quantification of CIGS films were performed using XPS by four laboratories (7 ~
10). Table 11 shows the details of the XPS instruments for which the results were retained
and the experimental conditions of the participating laboratories.
NPL carried out the experiments using a Kratos Axis Ultra DLD with a monochromated
aluminium X-ray source operated at 15 kV and 10 mA emission. The analysis area on the
sample was approximately 220 µm in diameter. Spectra were acquired using a pass energy of
160 eV, 0.5 eV steps, 0.1 s dwell per step and the charge neutraliser was turned on during
acquisition of XPS spectra. The X-rays and charge neutraliser were switched off during
sputtering. A Kratos Minibeam IV ion gun was used to sputter the samples with Ar+ ions at a
beam energy of 4 keV and at an angle of incidence 45o from the surface normal rastered over
an area of approximately 4 mm x 4 mm on the sample.
For NPL, the typical beam current was 8 µA. The sputtering rate was approximately 0.4
nm/s. No sample rotation was used during sputtering. The peaks used for quantification were
Ga 2p3/2, Cu 2p3/2, O 1s, In 3d5/2 and Se 3p. The peak intensities were determined by
measuring the raw peak area after removal of a Tougaard background using CasaXPS
software. The surface and substrate boundaries were excluded from the quantification
procedure.
In the case of NIM, the mole fractions and depth distributions of the CIGS thin films
were analyzed with an Escalab 250Xi (Thermo Fisher Scientific) using a monochromatic Al
Kα radiation source with a pass energy of 20 eV and a beam spot diameter of 400 μm. An
argon ion beam of 3 keV and medium current at an incidence angle of 40° was used as the
sputtering source with a rastered area of 2 mm x 2 mm (the sample rotation was not used).
Table 11. Details of the XPS instruments and the experimental parameters
Laboratory NPL NIM NMISA NIST
Maker Kratos Analytical Ltd
ThermoFisher Scientific
Physical Electronics
Kratos Analytical Ltd
Model Axis Ultra DLD Escalab 250 Xi Quantum 2000 Axis Ultra DLD
Sputtering Ion Ar+ Ar+ Ar+ Ar+
Impact Energy (keV) 4 3 2 2
Incidence Angle ( º ) 45 40 45 45
Rastering Area (mm2) 4 x 4 2 x 2 1 x 1 1.5 x 1.5
Zalar Rotation No No No Yes

16
The sputtering rate was estimated to be about 0.13 nm/s from the sputtering time and the
thickness. The raw peak areas of Cu 2p3/2, In 3d5/2, Ga 2p3/2 and Se 3d were measured after
removal of a Smart background using Avatagesystem software provided by the manufacturer.
Using TNC method including surface and substrate boundaries, the mole fractions and depth
distributions of the CIGS thin films were obtained by the peak areas of Cu 2p3/2, In 3d5/2,
Ga 2p3/2 and Se 3d and the ARRSFs from the reference CIGS film.
The relative differences between the certified mole fractions and the measured mole
fractions of the test CIGS by XPS are 2.05 %, 1.96 %, 5.16 % and 13.15% as shown in Table
8. In the case of laboratory 10, the mole fractions of Ga were greatly overestimated and those
of In were greatly underestimated. The origin of the over- and underestimations needs to be
better understood. The average expanded uncertainties of the measured mole fractions by
NPL, NIM and NMISA are 4.00 %, 3.84 %, and 9.86 %, respectively. The uncertainty of
NIST is not described in the table because only a set of measurement was reported.
Figure 4 shows the compositional XPS depth profiles of the Test 2 CIGS film measured
by NPL and NIM. In these cases, the depth distributions of Mo were estimated from the
decrease of the intensities of Cu, In, Ga and Se at the interface region because the core level
peak of Mo was not observed.
The results of NPL are plotted by lines with symbols due to the small number of
measurements. Although there are some small fluctuations in the NPL results, the two
profiles show good agreement in the depth distributions of all elements because the depth
profiles were produced by argon ion beams with similar sputtering parameters.
Figure 4. Compositional XPS depth profiles of the Test 2 CIGS film measured by (a) NPL
and (b) NIM.

17
C. Auger Electron Spectroscopy (AES)
Four laboratories were involved in the quantification of CIGS films by AES. Table 12
shows the details of the AES instruments that were used and the experimental conditions of
the participated laboratories. Two laboratories used Zalar rotation to minimize the
development of surface topography.
BAM used a PHI 700 Scanning Auger Probe (ULVAC-PHI Inc.) equipped with a
cylindrical mirror analyzer. The Auger electrons were excited by a primary electron beam of
5 keV with a current of 20 nA. The primary electron beam hit the surface at 30° to the surface
normal. Analyzing the CIGS film the Auger transitions Cu LMM (922 eV), In MNN (405 eV),
Ga LMM (1070 eV), Se LMM (1311 eV), Na KLL (996 eV), C KLL (275 eV) and O KLL
(510 eV) were detected. The relative energy resolution of the analyzer ∆E/E was 0.5 %.
Depth profiling was carried out by applying Ar+ ion beam sputtering at 3 keV with a current
of 2 µA. The ion beam was rastered across an area of 0.8 mm x 0.8 mm creating a flat crater
bottom with little roughness. The incidence angle of the ion beam referred to the surface
normal was 420. Depth profiles were performed by Auger signal detection and ion etching in
alternating mode. In order to minimize surface roughening the primary electron beam was
defocused to about 1 µm diameter.
NMIJ used a PHI SAM680 Scanning Auger Microprobe (ULVAC-PHI Inc.). For the
depth profiling an Ar ion beam with an impact energy of 3 keV and an incidence angle of 60°
was rastered over an area of 1.0 mm ×1.0 mm on the sample surface. The sample stage used
Zalar rotation at a rate of 0.40 rotations per minute during the sputtering. The Zalar rotation
was halted during the AES spectrum acquisition. The AES EN(E) spectra were obtained with
an electron probe energy of 5 keV and with a current of 10 nA.
Table 12. AES instruments and the experimental parameters of the participated laboratories.
Laboratory BAM NMIJ NIMS CNU
Maker ULVAC-PHI ULVAC-PHI JEOL ULVAC-PHI
Model PHI 700 SAM 680 JAMP-9500F PHI 700
Sputtering Ion Ar+ Ar+ Ar+ Ar+
Impact Energy (keV) 3 3 3 3
Incidence Angle ( º ) 42 30 39 75
Rastering Area (mm2) 0.8 x 0.8 1 x 1 3 x 3 0.8 x 0.8
Zalar Rotation No Yes No Yes
18
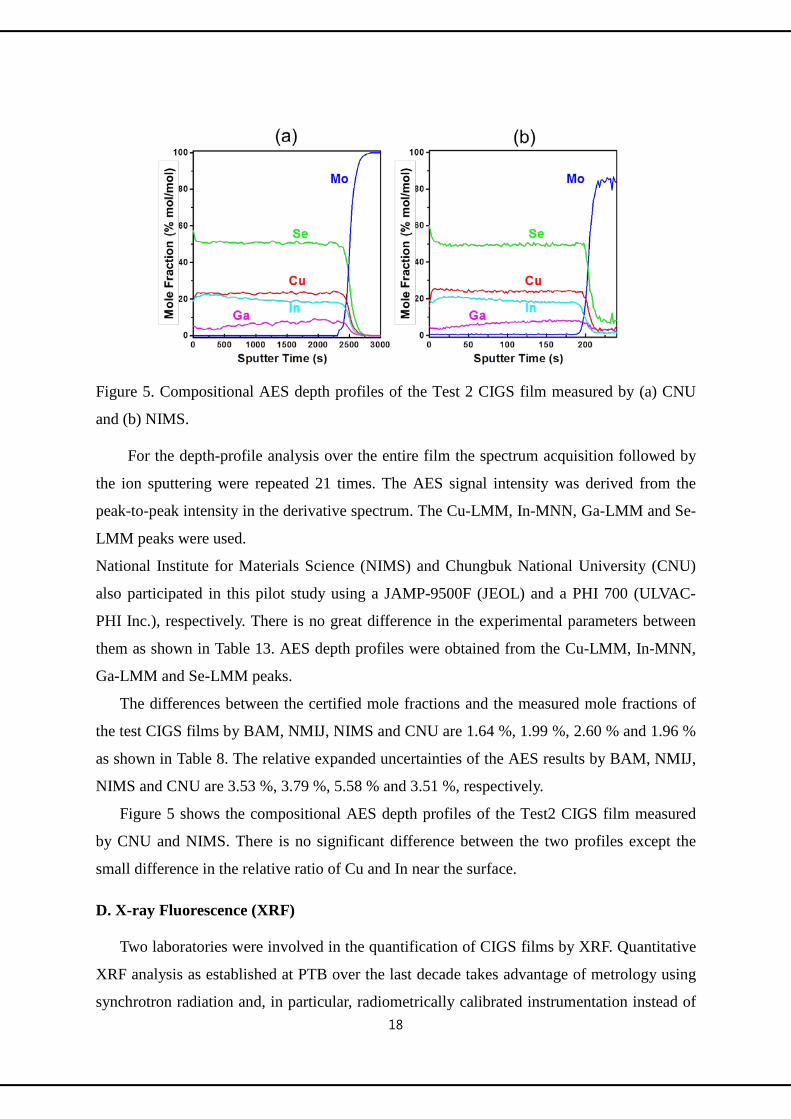
Figure 5. Compositional AES depth profiles of the Test 2 CIGS film measured by (a) CNU
and (b) NIMS.
For the depth-profile analysis over the entire film the spectrum acquisition followed by
the ion sputtering were repeated 21 times. The AES signal intensity was derived from the
peak-to-peak intensity in the derivative spectrum. The Cu-LMM, In-MNN, Ga-LMM and Se-
LMM peaks were used.
National Institute for Materials Science (NIMS) and Chungbuk National University (CNU)
also participated in this pilot study using a JAMP-9500F (JEOL) and a PHI 700 (ULVAC-
PHI Inc.), respectively. There is no great difference in the experimental parameters between
them as shown in Table 13. AES depth profiles were obtained from the Cu-LMM, In-MNN,
Ga-LMM and Se-LMM peaks.
The differences between the certified mole fractions and the measured mole fractions of
the test CIGS films by BAM, NMIJ, NIMS and CNU are 1.64 %, 1.99 %, 2.60 % and 1.96 %
as shown in Table 8. The relative expanded uncertainties of the AES results by BAM, NMIJ,
NIMS and CNU are 3.53 %, 3.79 %, 5.58 % and 3.51 %, respectively.
Figure 5 shows the compositional AES depth profiles of the Test2 CIGS film measured
by CNU and NIMS. There is no significant difference between the two profiles except the
small difference in the relative ratio of Cu and In near the surface.
D. X-ray Fluorescence (XRF)
Two laboratories were involved in the quantification of CIGS films by XRF. Quantitative
XRF analysis as established at PTB over the last decade takes advantage of metrology using
synchrotron radiation and, in particular, radiometrically calibrated instrumentation instead of

19
using any reference materials or calibration samples [9]. The intensity of the element-specific
fluorescence radiation emitted from a sample of interest is used to non-destructively
determine its matrix and trace element composition by XRF. In general, conventional XRF
quantification is based on the use of appropriate calibration samples or reference materials,
the spatial matrix structure of which has to be as similar as possible to the sample to be
analyzed. In contrast to this standard calibration procedure, quantification in reference-free
XRF at PTB is based on reliable knowledge of all relevant atomic fundamental, experimental
and instrumental parameters involved in both the sample and the measurement.
The matrix- and energy-dependent information depth of XRF can be tuned by varying the
angle of incidence of the exciting radiation, thus providing an access to the compositional
depth gradient of a sample. For typical CIGS thin films in the thickness range of only a few
micrometers the highest sensitivity for the gradient composition is reached at very shallow
angles of incidence below 3° from the surface plane in Grazing Incidence (GI) XRF [10]. The
integral composition of a CIGS thin film can be determined best at a large angle of incidence
of 45°. In the current study the samples were investigated with monochromatized synchrotron
radiation at the FCM beamline in the PTB laboratory [11] at the electron storage ring BESSY
II using an excitation energy of 11 keV with different angles of incidence in the 0° to 45°
range. Here, the Cu-Kα, Ga-Kα and In-Lα fluorescence lines have been used for the
reference-free XRF quantification. Detailed information is described in a published paper [12].
In addition to the task objectives, the reference-free XRF methodology also provides
direct access to the compositional information of the certified reference sample as shown in
Table 13. The values in the table are in a good agreement within their uncertainties with the
values as determined by ICP-MS in the range of 0.16 % mol/mol to 0.27 % mol/mol in all the
constituent elements (see Table 4). Furthermore, the thickness of the reference CIGS sample
was determined by reference-free XRF to be 2.06 ± 0.06 μm. Apart from counting statistics
to a minor extent, the uncertainties of the fundamental atomic, experimental and instrumental
parameters determine the expanded uncertainties (U) and relative expanded uncertainties (RU)
given in the Table 13 using standard propagation of uncertainty contributions. The standard
deviation of the reference sample and of the test sample 1 and 2, which were measured twice,
were better than 0.01, confirming the high repeatability reliability of the XRF method. The
same estimate was used for test sample 3 and 4, although they were measured only once.
Table 13. Mole fractions (X) and expanded uncertainties (U) of the reference CIGS film as

20
determined by reference-free XRF.
Specimen Element Atomic Fraction
(% mol/mol)
Expanded Uncertainty
U (% mol/mol)
Relative Expanded Uncertainty
RU (%)
Difference D
(% mol/mol)
Reference CIGS
Specimen
Cu 23.96 0.83 3.47 0.16 In 19.29 1.99 10.30 0.27 Ga 6.34 0.34 5.35 0.21 Se 50.42 2.18 4.32 0.21
Further main contributors to the uncertainty budget of the reference-free XRF results are
relevant fundamental atomic parameters such as fluorescence yields ranging from 0.03 for Cu
to 0.1 for In as well as photoelectric cross sections of 0.01 and transition probabilities ranging
from 0.01 to 0.02. More detailed information can be found in [13].
The reference-free XRF quantification benefits from fundamental atomic parameter
values of relevant CIGS matrix elements that were recently determined with reduced
uncertainties. Model calculations based on the well-known XRF quantification equations [14]
yield a contribution of 0.01 from secondary fluorescence excitation channels to the
uncertainty budget of the atomic concentrations of Cu and In. No secondary fluorescence
excitation channel is excited for Ga-K fluorescence.
For the sake of completeness, Table 14 (a) shows the mole fractions for the four test samples
as determined by reference-free XRF analysis as well as the respective uncertainties as
described above and differences from the certified values. Using, in addition to the reference-
free XRF procedure, the certified KRISS reference CIGS sample (see Table 3) for the
calibration procedure as intended in the current study, the mole fractions that were
determined for the four test samples are shown in Table 14 (b). The corrected mole fractions
( testcoriX , , Table 14 (b)) were determined from the mole fractions measured by XRF ( test
XRFiX , ,
Table 14 (a)) using the sensitivity factors ( iS ).
itest
XRFitestcori SXX /,, = --------------------------------------------- (9)
ARi
ARXRFii CXS /,= ------------------------------------------------ (10)
The correction related fraction of the expanded uncertainty originating from the certified
KRISS sample as an additional contributor to the uncertainties of the reference-free XRF
analysis is included in the uncertainty given in Table 14 (b). The combined standard
uncertainties were determined by combining the standard uncertainties of the XRF

21
measurements and the standard uncertainties of the CRM as given in equation (6). The
standard uncertainty of the determination of the ARRSFs is neglected as they are not relevant
for the XRF quantification.
The relative average difference (D) between the certified mole fractions of the four CIGS
test specimens and that by reference-free XRF is 1.99%. This value is slightly decreased to
1.27% by means of a correction taking into account the given CRM composition. The small
deviations in the mole fractions obtained by reference-free XRF and CRM based XRF
provide a clear indication that the quantification of multi-element alloy films by the
reference-free XRF analysis is very reliable. From the uncertainties in Table 14, the average
relative expanded uncertainty (RU) is about 5.86% without correction and that corrected by
CRM is about 6.84%. This result means that the improvement in the average relative
difference D’ is estimated to be partially masked by the increased uncertainties.
Atomic concentrations and thicknesses of CIGS layers were also determined by ZSW
with an energy-dispersive XRF, using the EAGLE XXL instrument from
EDAX/Roentgenanalytik. For analysis, a Rh X-ray source was used, operating at 50 keV,
with an aperture of 1 mm diameter. The energy of the emitted fluorescent X-radiation was
determined by a Si (Li) detector under vacuum conditions and recorded by a multi-channel
analyser. For quantification of CIGS thin films the peak areas of the fitted K lines of Cu, In,
Ga and Se were used. Mole fractions and layer thickness were determined by a special
program for the characterization of complete CIGS solar cells, based on the fundamental
parameter method, and calibrated by layer systems of CIGS solar cells. The measured mole
fractions of the test CIGS films by XRF are shown in Table 14 (c).
As the concentrations for the reference CIGS film calculated by the normal calibration
file differed up to 2 % mol/mol from the certified mole fractions determined by ID-ICP/MS,
the calibration file for CIGS layers was modified for this study. Ten points were analysed on
each of the four test samples and the reference sample. Low standard deviations in the range
of 0.1% to 0.8 % were achieved for all concentrations of the five samples.
The uncertainties were estimated by a combination of the standard uncertainties in the
measurement, the standard uncertainties of the CRM and those in the quantification process.
The uncertainties of ZSW are considerably lower than those derived by PTB because they
were determined from the average values of 10 measurements and, in particular, because they
are directly based on the CRM calibration und related CRM uncertainties.
Table 14. Measured mole fractions (X), relative expanded uncertainties (RU) and difference
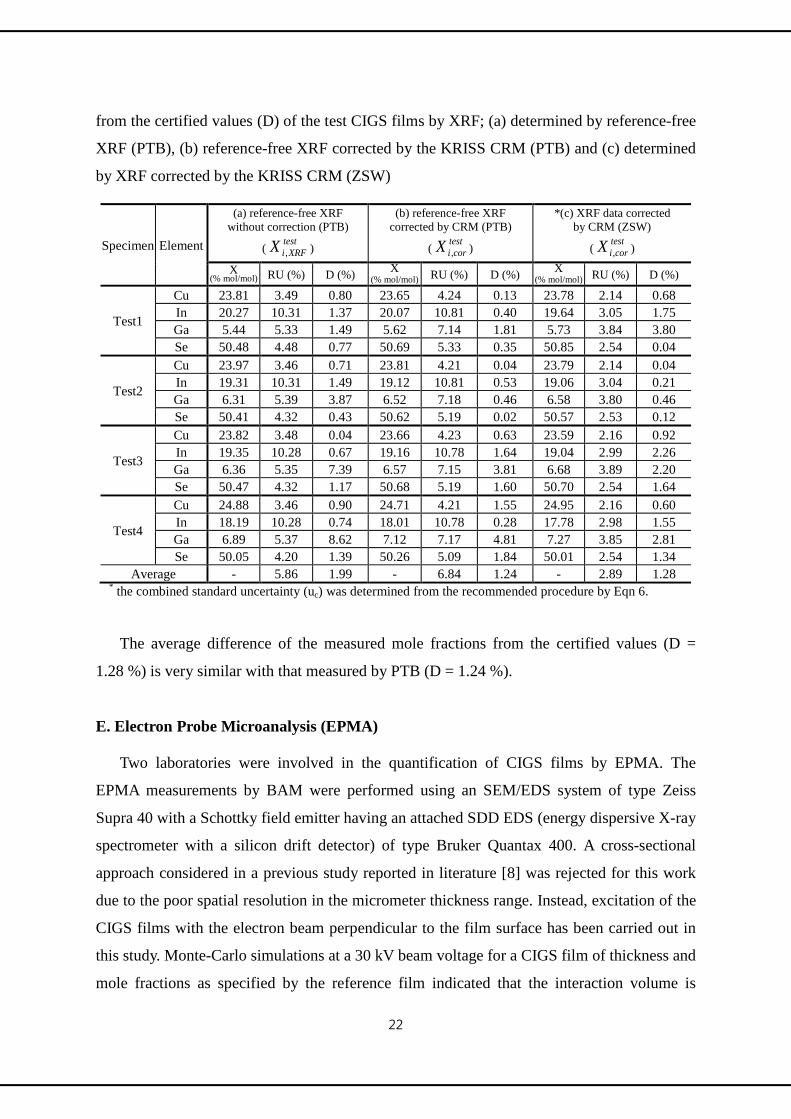
22
from the certified values (D) of the test CIGS films by XRF; (a) determined by reference-free
XRF (PTB), (b) reference-free XRF corrected by the KRISS CRM (PTB) and (c) determined
by XRF corrected by the KRISS CRM (ZSW)
Specimen Element
(a) reference-free XRF without correction (PTB)
(test
XRFiX , )
(b) reference-free XRF corrected by CRM (PTB)
(testcoriX , )
*(c) XRF data corrected by CRM (ZSW)
(testcoriX , )
X (% mol/mol) RU (%) D (%) X
(% mol/mol) RU (%) D (%) X (% mol/mol) RU (%) D (%)
Test1
Cu 23.81 3.49 0.80 23.65 4.24 0.13 23.78 2.14 0.68 In 20.27 10.31 1.37 20.07 10.81 0.40 19.64 3.05 1.75 Ga 5.44 5.33 1.49 5.62 7.14 1.81 5.73 3.84 3.80 Se 50.48 4.48 0.77 50.69 5.33 0.35 50.85 2.54 0.04
Test2
Cu 23.97 3.46 0.71 23.81 4.21 0.04 23.79 2.14 0.04 In 19.31 10.31 1.49 19.12 10.81 0.53 19.06 3.04 0.21 Ga 6.31 5.39 3.87 6.52 7.18 0.46 6.58 3.80 0.46 Se 50.41 4.32 0.43 50.62 5.19 0.02 50.57 2.53 0.12
Test3
Cu 23.82 3.48 0.04 23.66 4.23 0.63 23.59 2.16 0.92 In 19.35 10.28 0.67 19.16 10.78 1.64 19.04 2.99 2.26 Ga 6.36 5.35 7.39 6.57 7.15 3.81 6.68 3.89 2.20 Se 50.47 4.32 1.17 50.68 5.19 1.60 50.70 2.54 1.64
Test4
Cu 24.88 3.46 0.90 24.71 4.21 1.55 24.95 2.16 0.60 In 18.19 10.28 0.74 18.01 10.78 0.28 17.78 2.98 1.55 Ga 6.89 5.37 8.62 7.12 7.17 4.81 7.27 3.85 2.81 Se 50.05 4.20 1.39 50.26 5.09 1.84 50.01 2.54 1.34
Average - 5.86 1.99 - 6.84 1.24 - 2.89 1.28 * the combined standard uncertainty (uc) was determined from the recommended procedure by Eqn 6.
The average difference of the measured mole fractions from the certified values (D =
1.28 %) is very similar with that measured by PTB (D = 1.24 %).
E. Electron Probe Microanalysis (EPMA)
Two laboratories were involved in the quantification of CIGS films by EPMA. The
EPMA measurements by BAM were performed using an SEM/EDS system of type Zeiss
Supra 40 with a Schottky field emitter having an attached SDD EDS (energy dispersive X-ray
spectrometer with a silicon drift detector) of type Bruker Quantax 400. A cross-sectional
approach considered in a previous study reported in literature [8] was rejected for this work
due to the poor spatial resolution in the micrometer thickness range. Instead, excitation of the
CIGS films with the electron beam perpendicular to the film surface has been carried out in
this study. Monte-Carlo simulations at a 30 kV beam voltage for a CIGS film of thickness and
mole fractions as specified by the reference film indicated that the interaction volume is

23
confined mainly in the CIGS film so that the excitation of the Mo contact layer is negligible.
This was confirmed by the fact that in all measured 30 kV EDX spectra no Mo Kα peak
could be identified.
By choosing the approach of excitation with the electron beam perpendicular to the
CIGS film surface instead of the excitation onto the “cross-section” an integral analysis of the
“bulk” of the film is achieved. The availability of a reference CIGS film of similar elemental
concentration and thickness also contributes significantly to an accurate quantification. The
excitation approach considered yields integral values of the mole fractions in a rather similar
way as to the TNC approach. Moreover, SEM/EDS is a high throughput analytical method (a
few minutes is necessary for a spectrum with good counting statistics) and a non-destructive
one, too, in the sense that no sputtering is necessary to access the top few micrometers of the
sample.
A standardless (reference-free) quantification has also been performed and the results are
not significantly different from those obtained with the standard specimen. Moreover, the
quantitative results agree fairly well when two different beam voltages, 20 kV and 30 kV, are
applied. The characteristic X-ray lines taken into account for quantification are all well-
separated K lines (Cu, Ga and Se) apart from In for which the L series must be considered. In
order to calculate the concentrations based on the net intensities the “XPP” matrix correction
procedure [25] was applied. Hence, the reliable results obtained with EPMA in previous
metrological tasks such as [26,27] for the analysis of alloy films are confirmed in this pilot
study.
In the results of laboratory 18, the average relative difference of 9.30 between the
measured mole fractions and the certified values is too large. Especially the deviations of the
mole fractions of Ga and In, as shown in Table 8, are considered to be too large.
5. DISCUSSION
Although five different analysis methods were used and 15 laboratories from 8 countries
were involved, the results of this pilot study showed a good agreement as tabulated in Table 7,
8 and 9. The relative expanded uncertainties in the range of 4.52 % to 4.86 % for the four Test
CIGS specimens are not much larger than those in the key comparison K-67 for composition
of a Fe-Ni alloy film. The average relative differences (D) between the certified mole
fractions (C) and average measured mole fractions (A) of Test1, Test2, Test3 and Test4 CIGS

24
films are 3.60 %, 3.25 %, 4.07 %, and 4.05 %, respectively.
We used a specimen with the same mole fractions as the reference CIGS film to confirm
the reliability of the measurement. The mole fractions of the Test2 CIGS specimen (Table 4)
and those of the reference CIGS film (Table 3) are the same because they were taken from the
same batch. For this reason, the average measured mole fractions of the Test2 specimen are
much closer to the certified values than those of the other test specimens.
The mole fractions and the expanded uncertainties of the Test3 specimen are plotted in
Figure 6 as a simulation of a key comparison to ensure the equivalency in the measurement
capability of national metrology institutes for the quantification of multi-element alloy films.
Two data without uncertainty values (laboratories 4 and 10) were also included in the figure
without error bars. The reference values (blue solid lines) of the pilot comparison were
determined by the arithmetic mean method. The uncertainties (Uref) of the reference values
(red broken lines) were calculated from the standard deviation (s) of the individual laboratory
values (x) and a coverage factor (k) of 2.
-------------------------------------------------- (9)
--------------------------------------------------------- (10)
Here, uref is the expression of the repeatability standard deviation in the interlaboratories
study. m and i indicate the number of participating laboratories and the atomic species.
Although some data show large deviations from the average values, the reference values
(blue solid line) are close to the certified values (green solid line) within the uncertainty
limits (red broken lines)
In the case of SIMS, two non-NMI laboratories (5 and 6) show large deviations in the
mole fractions of Cu, In and Se. In the case of XPS, two NMI laboratories (9 and 10) show
large deviations in the mole fraction of Ga. The results by AES and XRF do not show any
deviations within the uncertainty limits. However, in the case of EPMA, one NMI laboratory
(18) shows large deviations of the mole fractions of In and Se.
mxsu iref /)(=
refref kuU =

25
Figure 6. The reference values and uncertainties of CCQM P-140 for the Test3 CIGS film.
The error bars are the expanded uncertainties in Table 9.
6. CONCLUSIONS
A pilot study P-140 for the quantitative surface analysis of CIGS films has been
performed by the CCQM SAWG. The mole fractions of CIGS films were measured by SIMS,
XPS and AES, using the TNC method and by XRF and EPMA protocols. Fifteen laboratories
from nine NMIs, one DI and six non-NMIs participated in this pilot study. The average mole
fractions of 18 data sets showed relative standard deviations of 5.5 % to 6.8 % and average
relative expanded uncertainties in the range of 4.52 % to 4.86 % for the four Test CIGS
specimens. These results mean that the total number counting method as a way to determine
the signal intensities is useful for the quantification of multi-element alloy films with non-
uniform depth distributions by depth profiling with surface analysis methods.

26
The plot of P-140 with the average mole fractions and the uncertainties showed that the
average mole fractions are close to the certified values within the uncertainty level. The
results of this study provide a possibility of a new key comparison for the quantitative surface
analysis of multi-element alloy films by surface analysis methods.
ACKNOWLEDGMENTS
The authors are grateful for support from the project "Tandem CIGS Thin Film Solar Cell
Core Technology" of the Ministry of Knowledge Economy and the Korea Research Council
for Industrial Science and Technology of the Republic of Korea.
REFERENCES
[1] Seah M P, Spencer S J, Bensebaa F, Vickridge I, Danzebrink H, Krumrey M, Gross T, Oesterle W,
Wendler E, Rheinländer B, Azuma Y, Kojima I, Suzuki N, Suzuki M, Tanuma S, Moon D W, Lee
H J, Cho H M, Chen H Y, Wee A T S, Osipowicz T, Pan J S, Jordaan W A, Hauert R, Klotz U,
Marel C, Verheijen M, Tamminga Y, Jeynes C, Bailey P, Biswas S, Falke U, Nguyen N V,
Chandler-Horowitz D, Ehrstein J R, Muller D and Dura J A 2004 Surf. Interface Anal., 36 1269–
1303
[2] Seah M P, Unger W E S, Wang H, Jordaan W, Gross Th, Dura J A, Moon D W, Totarong P,
Krumrey, M, Hauert R, and Zhiqiang M 2009 Surf. Interface Anal. 41 430-439
[3] Kim K J, Wirth T, Hodoroaba V-D, Gross T, Unger W, Jordaan W, Van Staden M, Prins S, Kim J
W, Moon D W, Wang H, Song X, Zhang L, Fujimoto T and Kojima I, 2010 Metrologia 47 Tech.
Suppl. 08011
[4] Kim K J, Unger W E S, Kim J W, Moon D W, Gross T, Hodoroaba V-D, Schmidt D, Wirth T,
Jordaan W, Van Staden M, Prins S, Zhang L, Fujimoto T, Song X P and Wang H 2012 Surf.
Interface Anal., 44 192-199
[5] Repins I, Contreras M A, Egaas B, DeHart C, Scharf J, Perkins C L, To B, and Noufi R, 2008

27
Progress in Photovoltaics 16 235–239
[6] Decocket K, Khelifi S and Burgelman M 2011 Solar Energy Materials & Solar Cells 95 1550–
1554
[7] Topič M, Smole F and Furlan J 1996 J. Appl. Phys. 79 8537–8540
[8] Abou-Ras D, Caballero R, Fischer C-H, Kaufmann C A, Lauermann I, Mainz R, Mönig H,
Schöpke A, Stephan C, Streeck C, Schorr S, Eicke A, Döbeli M, Gade B, Hinrichs J, Nunney T,
Dijkstra H, Hoffmann V, Klemm D, Efimova V, Bergmaier A, Dollinger G, Wirth T, Unger W,
Rockett A A, Perez-Rodriguez A, Alvarez-Garcia J, Izquierdo-Roca V, Schmid T, Choi P.-P.,
Müller M, Bertram F, Christen J, Khatri H, Collins R W, Marsillac S, and Kötschau I 2011
Microsc. Microanal. 17 728–751
[9] Beckhoff B 2008 J. Anal. Atom. Spectrometry 23 845-853
[10] Streeck C, Beckhoff B, Reinhardt F, Kolbe M, Kanngiesser B, and Kaufmann C A 2010 Nu
cl. Instrum. Methods B 268 277-281
[11] Beckhoff B, Gottwald A, Klein R, Krumrey M, Müller R, Richter M, Scholze F, Thornagel
R, and Ulm G 2009 Phys. Status Solidi B 246 1415-1434
[12] Streeck C, Brunken S, Gerlach M, Herzog C, Hönicke P, Kaufmann CA, Lubeck J, Pollakowski
B, Unterumsberger R, Weber A, Beckhoff B, Kanngießer B, Schock H-W and Mainz R 2013 Appl.
Phys. Let. 103 113904
[13] Beckhoff B, Fliegauf R, Kolbe M, Müller M, Weser and Ulm G 2007 Anal. Chem. 79 7873–7882
[14] Mantler, M, Willis, J P, Lachance G R, Vrebos B A R, Mauser K-E, Kawahara N, Rousseau R M,
Brouwer P N, in Handbook of Practical X-Ray Fluorescence Analysis, edited by Beckhoff B,
Kanngießer B, Langhoff N, Wedell R, and Wolff H (Springer-Verlag Berlin Heidelberg 2006), pp.
309-410.
[15] Seah M P 2003 in "Surface Analysis by Auger and X-Ray Photoelectron Spectroscopy", edited by
D. Briggs and J.T. Grant, Chap. 13 (IM Publications and Surface Spectra Ltd.,)
[16] Tanuma S. Powell C J, and Penn D R 1994 Surf. Interface Anal. 21, 165-176
[17] Seah M P, and Gilmore I S 2001 Surf. Interface Anal. 31 835-846
[18] Yoshitake M and Yoshihara K 1989 Surf. Interface Anal. 17 711-718

28
[19] Kim K J, Moon D W, Park C J, Simons D, Gillen G, Jin H and Kang H J 2007 Surf. Interface
Anal. 39 665-673
[20] Kim K J 2009 Metrologia 46 Tech. Supple. 08006
[21] Kim K J, Simons D and Gillen G 2007 Appl. Surf. Sci. 253 6000 – 6005
[22] Jang J S, Hwang H H, Kang H J, Suh J K, Min H S, Han M S, Cho K H, Chung Y D, Cho D H,
Kim J and Kim K J 2012 Metrologia 49 522–529
[23] Jang J S, Hwang H H, Kang H J, Chae H C, Chung Y D and Kim K J 2013 Appl. Surf. Sci. 282
777-781
[24] Chung Y-D, Cho D-H, Han W-S, Park N-M, Lee K-S, and Kim J 2010 J. Korean Phys. Soc. 57
1826-1830
[25] Pouchou J-L 1994, Microchim. Acta 114/115, 33-52
[26] Hodoroaba V-D, Kim K J and Unger W E S 2012 Surf. Interface Anal. 44 1459-1461
[27] Kühn J, Hodoroaba V-D, Linke S, Moritz W and Unger W E S 2012 Surf. Interface Anal. 44
1456–1458