CCQM-K103 MELAMINE IN MILK POWDER Final … “Melamine in Milk Powder” Final Report CCQM-K103...
20
CCQM-K103 “Melamine in Milk Powder” Final Report CCQM-K103 “MELAMINE IN MILK POWDER” Final Report March 2017 Xiuqin Li,Qinghe Zhang,Hongmei Li,Mengwan Li With contribution from: Xiuqin Li,Qinghe Zhang,Hongmei Li,Mengwan Li National Institute of Metrology, China (NIM) Siu-kay Wong, Foo-Wing Lee Government Laboratory, Hong Kong, China (GLHK) Elias Kakoulides Chemical Metrology Laboratory General Chemical State Laboratory–Hellenic Metrology Institute, Greece (EXHM) Evaldas Naujaus State Research Institute Center for Physical Science and Technology, Lithuania (FTMC) Maria Fernandes-Whaley, Des Prevoo-Franzsen, Laura Quinn National Metrology Institute of South Africa (NMISA) Preeyaporn Pookrod National Institute of Metrology, Thailand (NIMT) Leonid Konopelko Mendeleyev Research Institute for Metrology, Russia (VNIIM) A key comparison and parallel pilot study agreed upon by the Organic Analysis Working Group (OAWG) of the CCQM and coordinated by NIM and GLHK. Coordinating Laboratories (CL): NIM and GLHK Coordinating Laboratories Contact: Dr. Xiuqin Li, NIM [email protected]
Transcript of CCQM-K103 MELAMINE IN MILK POWDER Final … “Melamine in Milk Powder” Final Report CCQM-K103...
CCQM-K103 “Melamine in Milk Powder” Final Report
CCQM-K103
“MELAMINE IN MILK POWDER”
Final Report
March 2017
Xiuqin Li,Qinghe Zhang,Hongmei Li,Mengwan Li
With contribution from:
Xiuqin Li,Qinghe Zhang,Hongmei Li,Mengwan Li
National Institute of Metrology, China (NIM)
Siu-kay Wong, Foo-Wing Lee
Government Laboratory, Hong Kong, China (GLHK)
Elias Kakoulides
Chemical Metrology Laboratory General Chemical State Laboratory–Hellenic Metrology
Institute, Greece (EXHM)
Evaldas Naujaus
State Research Institute Center for Physical Science and Technology, Lithuania (FTMC)
Maria Fernandes-Whaley, Des Prevoo-Franzsen, Laura Quinn
National Metrology Institute of South Africa (NMISA)
Preeyaporn Pookrod
National Institute of Metrology, Thailand (NIMT)
Leonid Konopelko
Mendeleyev Research Institute for Metrology, Russia (VNIIM)
AA kkeeyy comparison and parallel pilot study agreed upon by the Organic Analysis Working
Group (OAWG) of the CCQM and coordinated by NIM and GLHK.
Coordinating Laboratories (CL): NIM and GLHK
Coordinating Laboratories Contact: Dr. Xiuqin Li, NIM

CCQM-K103 “Melamine in Milk Powder” Draft B Report September 2015
i
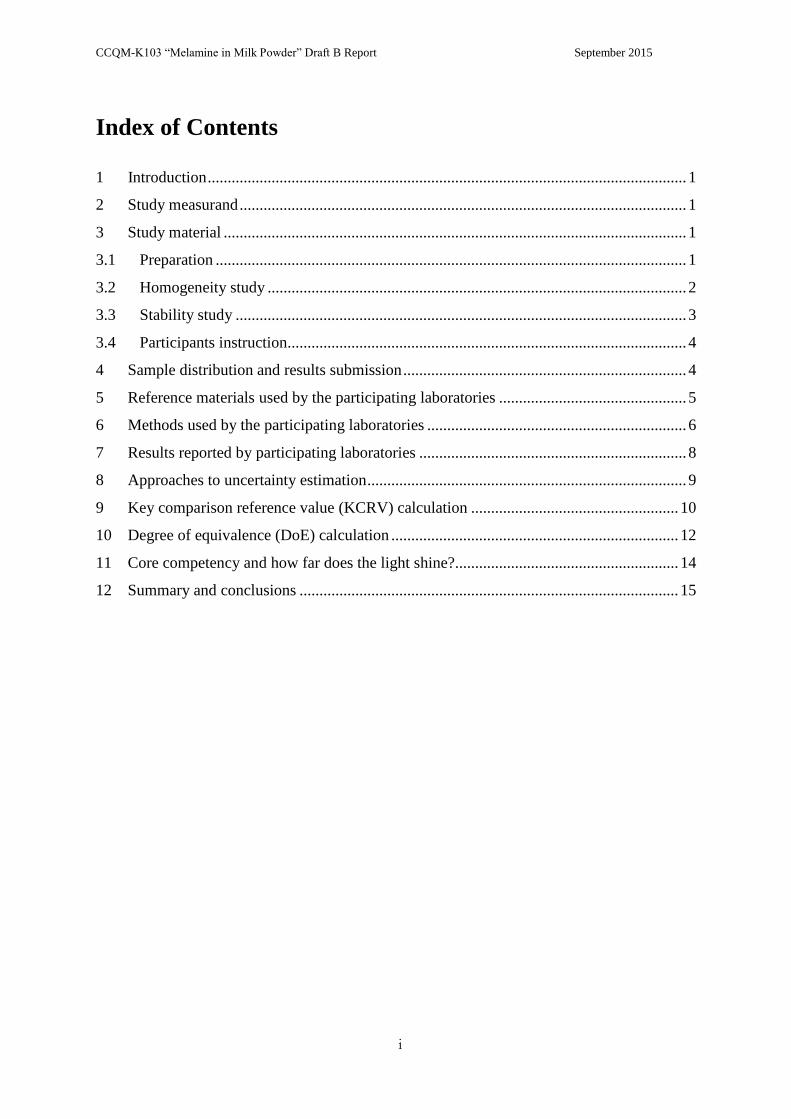
Index of Contents
1 Introduction ........................................................................................................................ 1
2 Study measurand ................................................................................................................ 1
3 Study material .................................................................................................................... 1
3.1 Preparation ...................................................................................................................... 1
3.2 Homogeneity study ......................................................................................................... 2
3.3 Stability study ................................................................................................................. 3
3.4 Participants instruction.................................................................................................... 4
4 Sample distribution and results submission ....................................................................... 4
5 Reference materials used by the participating laboratories ............................................... 5
6 Methods used by the participating laboratories ................................................................. 6
7 Results reported by participating laboratories ................................................................... 8
8 Approaches to uncertainty estimation ................................................................................ 9
9 Key comparison reference value (KCRV) calculation .................................................... 10
10 Degree of equivalence (DoE) calculation ........................................................................ 12
11 Core competency and how far does the light shine?........................................................ 14
12 Summary and conclusions ............................................................................................... 15

CCQM-K103 “Melamine in Milk Powder” Draft B Report September 2015
1
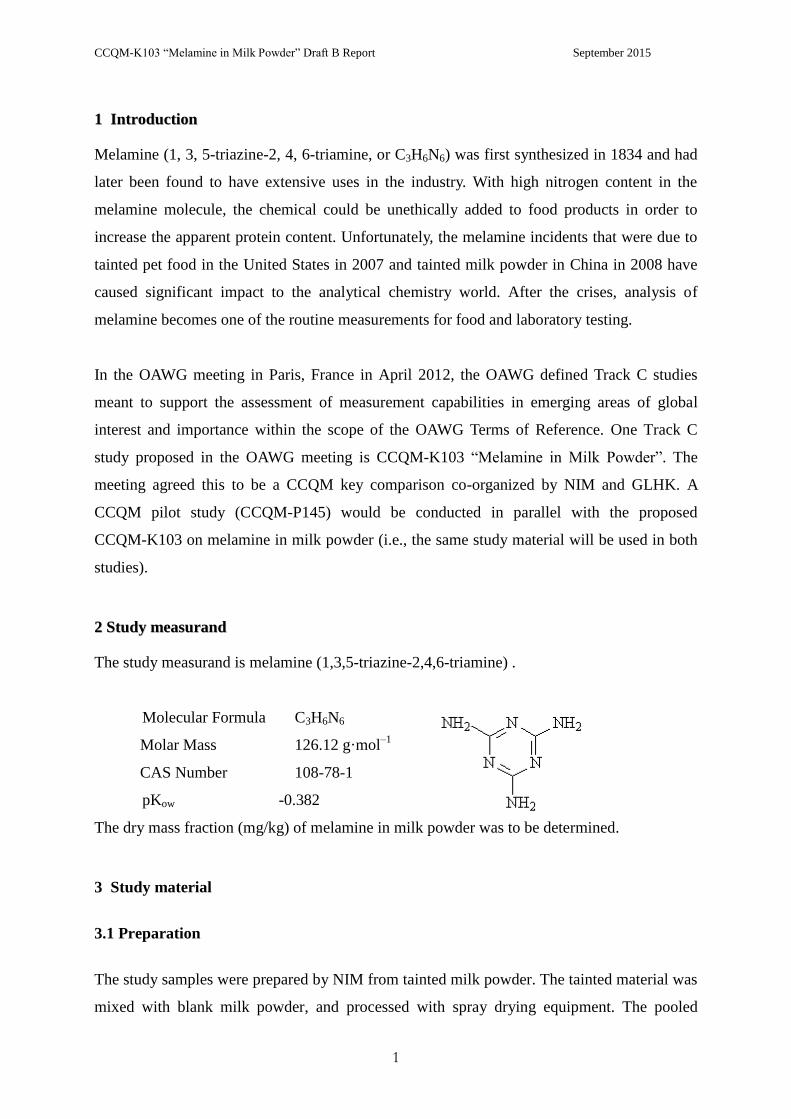
11 IInnttrroodduuccttiioonn
Melamine (1, 3, 5-triazine-2, 4, 6-triamine, or C3H6N6) was first synthesized in 1834 and had
later been found to have extensive uses in the industry. With high nitrogen content in the
melamine molecule, the chemical could be unethically added to food products in order to
increase the apparent protein content. Unfortunately, the melamine incidents that were due to
tainted pet food in the United States in 2007 and tainted milk powder in China in 2008 have
caused significant impact to the analytical chemistry world. After the crises, analysis of
melamine becomes one of the routine measurements for food and laboratory testing.
In the OAWG meeting in Paris, France in April 2012, the OAWG defined Track C studies
meant to support the assessment of measurement capabilities in emerging areas of global
interest and importance within the scope of the OAWG Terms of Reference. One Track C
study proposed in the OAWG meeting is CCQM-K103 “Melamine in Milk Powder”. The
meeting agreed this to be a CCQM key comparison co-organized by NIM and GLHK. A
CCQM pilot study (CCQM-P145) would be conducted in parallel with the proposed
CCQM-K103 on melamine in milk powder (i.e., the same study material will be used in both
studies).
22 SSttuuddyy mmeeaassuurraanndd
The study measurand is melamine (1,3,5-triazine-2,4,6-triamine) .
Molecular Formula C3H6N6
Molar Mass 126.12 g·mol–1
CAS Number 108-78-1
pKow -0.382
The dry mass fraction (mg/kg) of melamine in milk powder was to be determined.
3 Study material
3.1 Preparation
The study samples were prepared by NIM from tainted milk powder. The tainted material was
mixed with blank milk powder, and processed with spray drying equipment. The pooled
CCQM-K103 “Melamine in Milk Powder” Draft B Report September 2015
2
material was milled and mixed to ensure its homogeneity. The final product was filled in 15
gram portions into amber glass bottles and stored at room temperature. A total of 300 bottles
of material were prepared.
3.2 Homogeneity study
For the homogeneity study, 15 samples (with a sample size of about 1.0 g) were selected with
a random stratified sample picking scheme and analysed for their melamine content by IDMS
using LC-ESI-MS. Samples were measured in a random order and analyzed at least in
duplicate to determine the sample inhomogeneity. The analytical results without moisture
content correction (as the variation due to moisture correction was insignificant compared
with that of the method precision) were used for evaluating the material homogeneity during
the study.
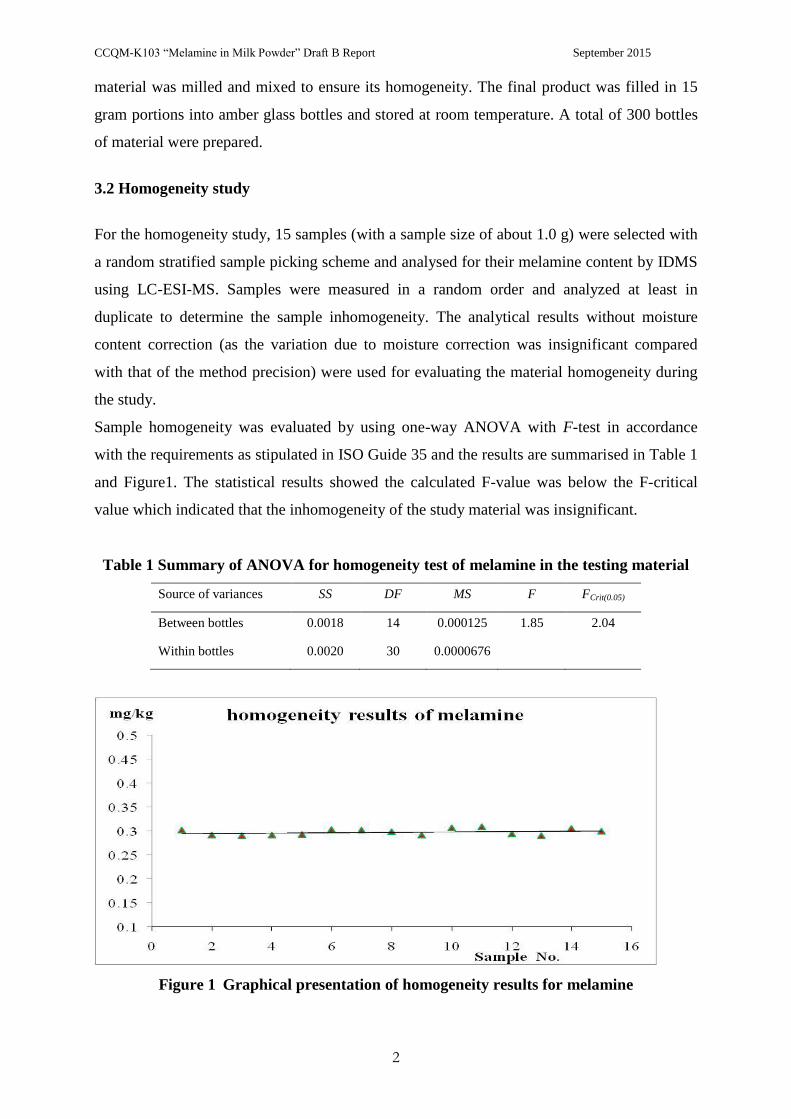
Sample homogeneity was evaluated by using one-way ANOVA with F-test in accordance
with the requirements as stipulated in ISO Guide 35 and the results are summarised in Table 1
and Figure1. The statistical results showed the calculated F-value was below the F-critical
value which indicated that the inhomogeneity of the study material was insignificant.
Table 1 Summary of ANOVA for homogeneity test of melamine in the testing material
Source of variances SS DF MS F FCrit(0.05)
Between bottles 0.0018 14 0.000125 1.85 2.04
Within bottles 0.0020 30 0.0000676
Figure 1 Graphical presentation of homogeneity results for melamine
CCQM-K103 “Melamine in Milk Powder” Draft B Report September 2015
3
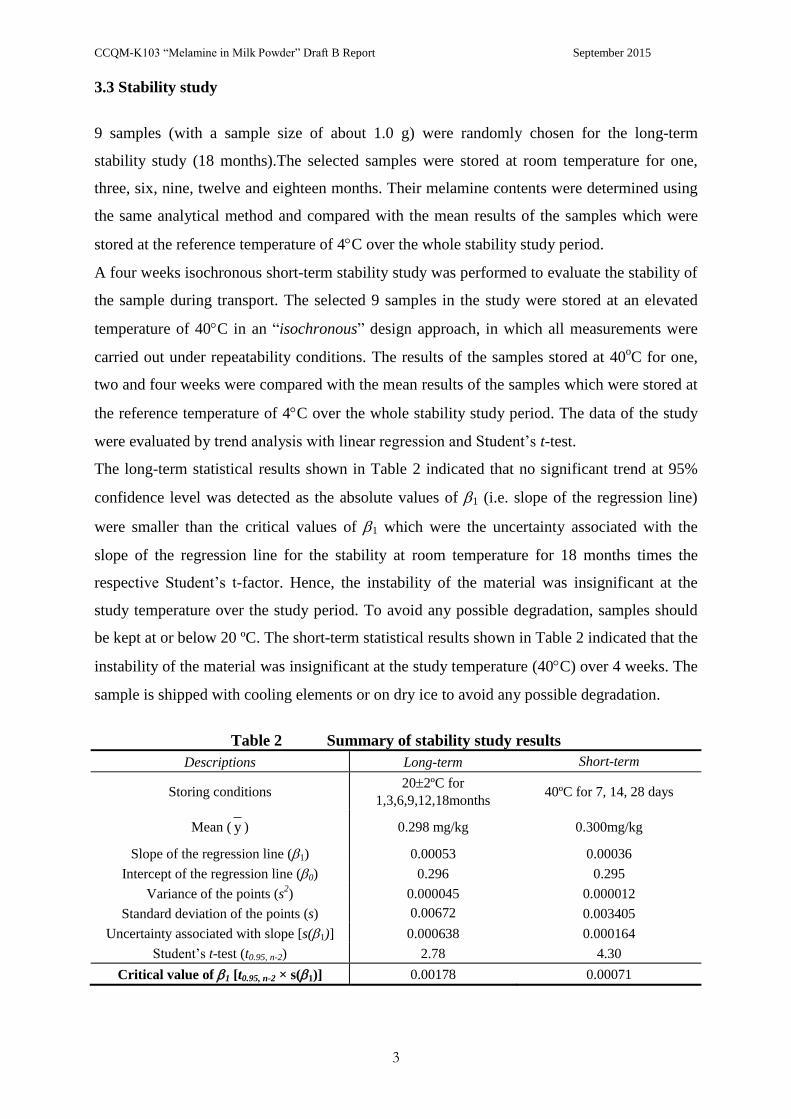
3.3 Stability study
9 samples (with a sample size of about 1.0 g) were randomly chosen for the long-term
stability study (18 months).The selected samples were stored at room temperature for one,
three, six, nine, twelve and eighteen months. Their melamine contents were determined using
the same analytical method and compared with the mean results of the samples which were
stored at the reference temperature of 4C over the whole stability study period.
A four weeks isochronous short-term stability study was performed to evaluate the stability of
the sample during transport. The selected 9 samples in the study were stored at an elevated
temperature of 40C in an “isochronous” design approach, in which all measurements were
carried out under repeatability conditions. The results of the samples stored at 40oC for one,
two and four weeks were compared with the mean results of the samples which were stored at
the reference temperature of 4C over the whole stability study period. The data of the study
were evaluated by trend analysis with linear regression and Student’s t-test.
The long-term statistical results shown in Table 2 indicated that no significant trend at 95%
confidence level was detected as the absolute values of 1 (i.e. slope of the regression line)
were smaller than the critical values of 1 which were the uncertainty associated with the
slope of the regression line for the stability at room temperature for 18 months times the
respective Student’s t-factor. Hence, the instability of the material was insignificant at the
study temperature over the study period. To avoid any possible degradation, samples should
be kept at or below 20 ºC. The short-term statistical results shown in Table 2 indicated that the
instability of the material was insignificant at the study temperature (40C) over 4 weeks. The
sample is shipped with cooling elements or on dry ice to avoid any possible degradation.
Table 2 Summary of stability study results
Descriptions Long-term Short-term
Storing conditions 202ºC for
1,3,6,9,12,18months 40ºC for 7, 14, 28 days
Mean ( y ) 0.298 mg/kg 0.300mg/kg
Slope of the regression line (1) 0.00053 0.00036
Intercept of the regression line (0) 0.296 0.295
Variance of the points (s2) 0.000045 0.000012
Standard deviation of the points (s) 0.00672 0.003405
Uncertainty associated with slope [s(1)] 0.000638 0.000164
Student’s t-test (t0.95, n-2) 2.78 4.30
Critical value of 1 [t0.95, n-2 × s(1)] 0.00178 0.00071
CCQM-K103 “Melamine in Milk Powder” Draft B Report September 2015
4
3.4 Participants instruction
Participants received two bottles of the study material, each bottle containing about 15 g of
milk powder. Participants are requested to determine the mass fractions (in mg/kg) of
melamine on a dry mass basis in one of the bottles using their preferred methods. The other
bottle could be used for their method development. A minimum sample size of 1.0 g for
testing is recommended.
For the dry mass correction, participants should follow the protocol for determination of
moisture content:
i. A minimum of three separate portions (recommended size of 1 g each) of the sample
should be taken.
ii. Place the portions over anhydrous calcium sulphate in a desiccator at room temperature
for a minimum of 7 days.
iii. Weigh the samples until a constant mass is reached.
iv. Perform moisture determination at the same time as the test sample portions are to be
analyzed.
44 SSaammppllee ddiissttrriibbuuttiioonn aanndd rreessuullttss ssuubbmmiissssiioonn
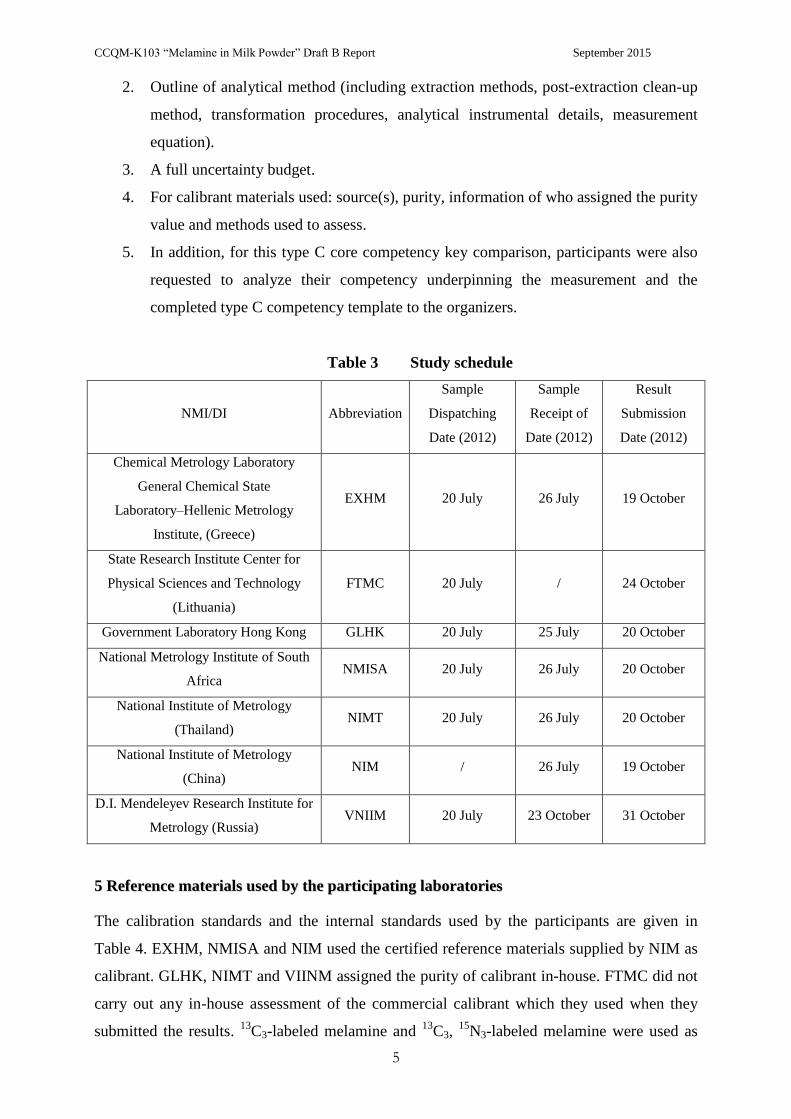
Seven NMIs/ DIs participated in CCQM-K103. Two bottles of sample each containing about
15 g of the milk powder with dry ice in a foam box were sent to each participant via couriers
at 20 July 2012. Relevant documents, including Technical Protocol, Sample Receipt Form,
Result Report Form and Type C Competency Template were sent to participants by e-mail.
Participants were asked to check the physical conditions of the sample upon receipt of the
sample pack. All samples were received by the participants in good condition not later than
the first week of 26 July 2012 except VNIIM which received the samples at 23 October 2012
due to the customs problems. The Table 3 showed the detailed information of the study
schedule.
The participants were requested to report the following data in the Data Report Sheet
provided to the organisers by email to [email protected]. The detailed submission date can be
seen in the Table 3.
1. For one bottle sample, the dry mass fraction of melamine in the milk powder in
mg/kg as analyte content in milk powder and the overall, combined result for the
bottle should be reported with the standard uncertainty, uc, and the expanded
uncertainty, U.
CCQM-K103 “Melamine in Milk Powder” Draft B Report September 2015
5
2. Outline of analytical method (including extraction methods, post-extraction clean-up
method, transformation procedures, analytical instrumental details, measurement
equation).
3. A full uncertainty budget.
4. For calibrant materials used: source(s), purity, information of who assigned the purity
value and methods used to assess.
5. In addition, for this type C core competency key comparison, participants were also
requested to analyze their competency underpinning the measurement and the
completed type C competency template to the organizers.
Table 3 Study schedule
NMI/DI Abbreviation
Sample
Dispatching
Date (2012)
Sample
Receipt of
Date (2012)
Result
Submission
Date (2012)
Chemical Metrology Laboratory
General Chemical State
Laboratory–Hellenic Metrology
Institute, (Greece)
EXHM 20 July 26 July 19 October
State Research Institute Center for
Physical Sciences and Technology
(Lithuania)
FTMC 20 July / 24 October
Government Laboratory Hong Kong GLHK 20 July 25 July 20 October
National Metrology Institute of South
Africa NMISA 20 July 26 July 20 October
National Institute of Metrology
(Thailand) NIMT 20 July 26 July 20 October
National Institute of Metrology
(China) NIM / 26 July 19 October
D.I. Mendeleyev Research Institute for
Metrology (Russia) VNIIM 20 July 23 October 31 October
55 RReeffeerreennccee mmaatteerriiaallss uusseedd bbyy tthhee ppaarrttiicciippaattiinngg llaabboorraattoorriieess
The calibration standards and the internal standards used by the participants are given in
Table 4. EXHM, NMISA and NIM used the certified reference materials supplied by NIM as
calibrant. GLHK, NIMT and VIINM assigned the purity of calibrant in-house. FTMC did not
carry out any in-house assessment of the commercial calibrant which they used when they
submitted the results. 13
C3-labeled melamine and 13
C3, 15
N3-labeled melamine were used as
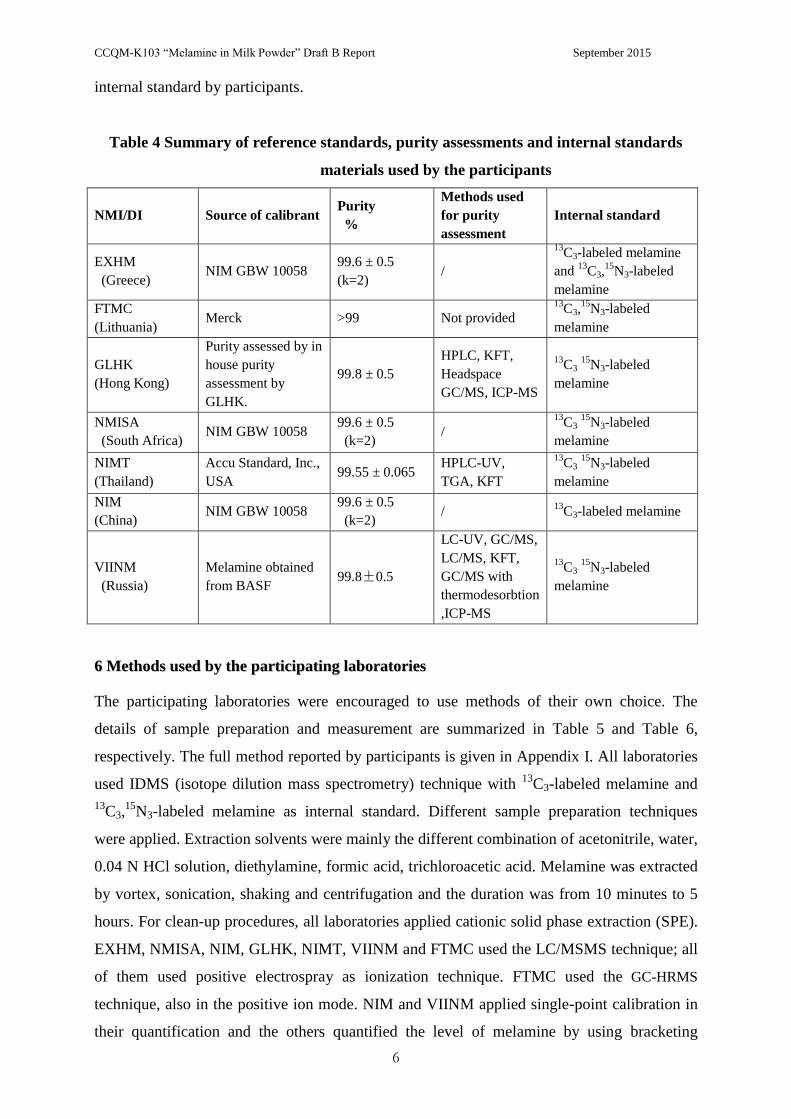
CCQM-K103 “Melamine in Milk Powder” Draft B Report September 2015
6
internal standard by participants.
Table 4 Summary of reference standards, purity assessments and internal standards
materials used by the participants
NMI/DI Source of calibrant Purity
%
Methods used
for purity
assessment
Internal standard
EXHM
(Greece) NIM GBW 10058
99.6 ± 0.5
(k=2) /
13C3-labeled melamine
and 13
C3,15
N3-labeled
melamine
FTMC
(Lithuania) Merck >99 Not provided
13C3,
15N3-labeled
melamine
GLHK
(Hong Kong)
Purity assessed by in
house purity
assessment by
GLHK.
99.8 ± 0.5
HPLC, KFT,
Headspace
GC/MS, ICP-MS
13C3
15N3-labeled
melamine
NMISA
(South Africa) NIM GBW 10058
99.6 ± 0.5
(k=2) /
13C3
15N3-labeled
melamine
NIMT
(Thailand)
Accu Standard, Inc.,
USA 99.55 ± 0.065
HPLC-UV,
TGA, KFT
13C3
15N3-labeled
melamine
NIM
(China) NIM GBW 10058
99.6 ± 0.5
(k=2) /
13C3-labeled melamine
VIINM
(Russia)
Melamine obtained
from BASF 99.8±0.5
LC-UV, GC/MS,
LC/MS, KFT,
GC/MS with
thermodesorbtion
,ICP-MS
13C3
15N3-labeled
melamine
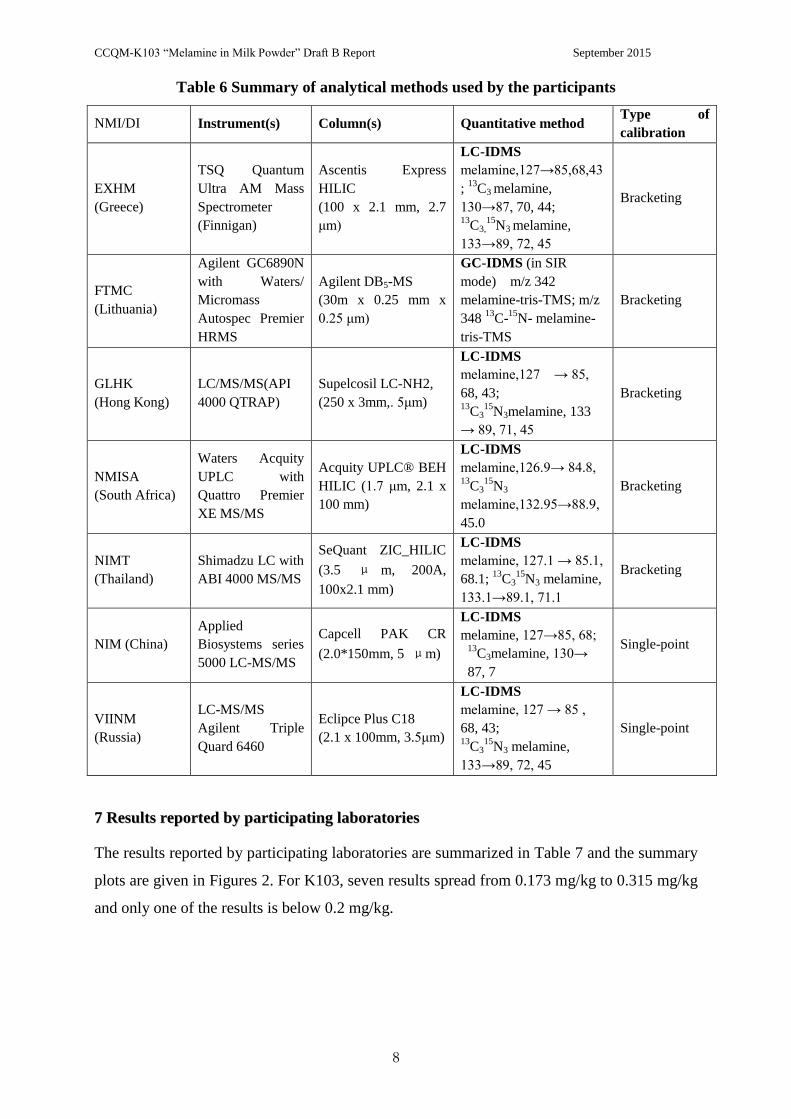
66 MMeetthhooddss uusseedd bbyy tthhee ppaarrttiicciippaattiinngg llaabboorraattoorriieess
The participating laboratories were encouraged to use methods of their own choice. The
details of sample preparation and measurement are summarized in Table 5 and Table 6,
respectively. The full method reported by participants is given in Appendix I. All laboratories
used IDMS (isotope dilution mass spectrometry) technique with 13
C3-labeled melamine and
13C3,
15N3-labeled melamine as internal standard. Different sample preparation techniques
were applied. Extraction solvents were mainly the different combination of acetonitrile, water,
0.04 N HCl solution, diethylamine, formic acid, trichloroacetic acid. Melamine was extracted
by vortex, sonication, shaking and centrifugation and the duration was from 10 minutes to 5
hours. For clean-up procedures, all laboratories applied cationic solid phase extraction (SPE).
EXHM, NMISA, NIM, GLHK, NIMT, VIINM and FTMC used the LC/MSMS technique; all
of them used positive electrospray as ionization technique. FTMC used the GC-HRMS
technique, also in the positive ion mode. NIM and VIINM applied single-point calibration in
their quantification and the others quantified the level of melamine by using bracketing
CCQM-K103 “Melamine in Milk Powder” Draft B Report September 2015
7
calibration. All of the participants followed the suggested protocol for moisture determination.
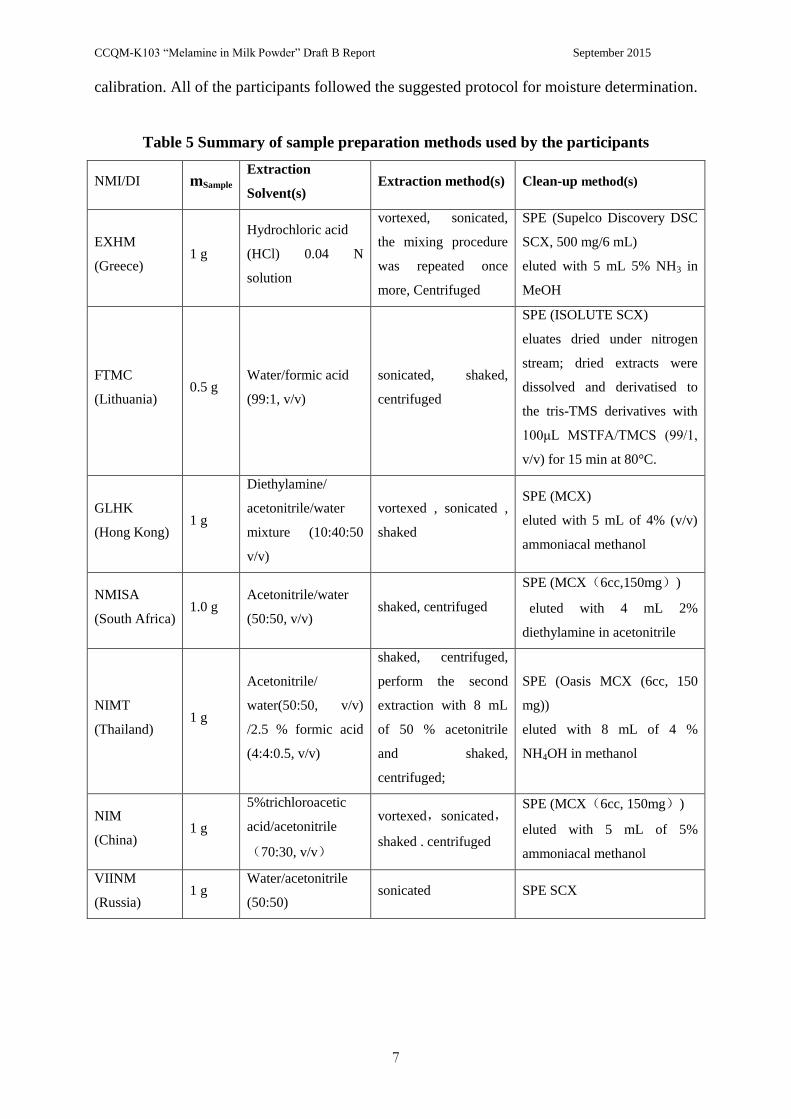
Table 5 Summary of sample preparation methods used by the participants
NMI/DI mSample Extraction
Solvent(s) Extraction method(s) Clean-up method(s)
EXHM
(Greece) 1 g
Hydrochloric acid
(HCl) 0.04 N
solution
vortexed, sonicated,
the mixing procedure
was repeated once
more, Centrifuged
SPE (Supelco Discovery DSC
SCX, 500 mg/6 mL)
eluted with 5 mL 5% NH3 in
MeOH
FTMC
(Lithuania) 0.5 g
Water/formic acid
(99:1, v/v)
sonicated, shaked,
centrifuged
SPE (ISOLUTE SCX)
eluates dried under nitrogen
stream; dried extracts were
dissolved and derivatised to
the tris-TMS derivatives with
100μL MSTFA/TMCS (99/1,
v/v) for 15 min at 80°C.
GLHK
(Hong Kong) 1 g
Diethylamine/
acetonitrile/water
mixture (10:40:50
v/v)
vortexed , sonicated ,
shaked
SPE (MCX)
eluted with 5 mL of 4% (v/v)
ammoniacal methanol
NMISA
(South Africa) 1.0 g
Acetonitrile/water
(50:50, v/v) shaked, centrifuged
SPE (MCX(6cc,150mg))
eluted with 4 mL 2%
diethylamine in acetonitrile
NIMT
(Thailand) 1 g
Acetonitrile/
water(50:50, v/v)
/2.5 % formic acid
(4:4:0.5, v/v)
shaked, centrifuged,
perform the second
extraction with 8 mL
of 50 % acetonitrile
and shaked,
centrifuged;
SPE (Oasis MCX (6cc, 150
mg))
eluted with 8 mL of 4 %
NH4OH in methanol
NIM
(China) 1 g
5%trichloroacetic
acid/acetonitrile
(70:30, v/v)
vortexed,sonicated,
shaked . centrifuged
SPE (MCX(6cc, 150mg))
eluted with 5 mL of 5%
ammoniacal methanol
VIINM
(Russia) 1 g
Water/acetonitrile
(50:50) sonicated SPE SCX
CCQM-K103 “Melamine in Milk Powder” Draft B Report September 2015
8
Table 6 Summary of analytical methods used by the participants
NMI/DI Instrument(s) Column(s) Quantitative method Type of
calibration
EXHM
(Greece)
TSQ Quantum
Ultra AM Mass
Spectrometer
(Finnigan)
Ascentis Express
HILIC
(100 x 2.1 mm, 2.7
μm)
LC-IDMS
melamine,127→85,68,43
; 13
C3 melamine,
130→87, 70, 44; 13
C3,15
N3 melamine,
133→89, 72, 45
Bracketing
FTMC
(Lithuania)
Agilent GC6890N
with Waters/
Micromass
Autospec Premier
HRMS
Agilent DB5-MS
(30m x 0.25 mm x
0.25 μm)
GC-IDMS (in SIR
mode) m/z 342
melamine-tris-TMS; m/z
348 13
C-15
N- melamine-
tris-TMS
Bracketing
GLHK
(Hong Kong)
LC/MS/MS(API
4000 QTRAP)
Supelcosil LC-NH2,
(250 x 3mm,. 5μm)
LC-IDMS
melamine,127 → 85,
68, 43; 13
C315
N3melamine, 133
→ 89, 71, 45
Bracketing
NMISA
(South Africa)
Waters Acquity
UPLC with
Quattro Premier
XE MS/MS
Acquity UPLC® BEH
HILIC (1.7 μm, 2.1 x
100 mm)
LC-IDMS
melamine,126.9→ 84.8, 13
C315
N3
melamine,132.95→88.9,
45.0
Bracketing
NIMT
(Thailand)
Shimadzu LC with
ABI 4000 MS/MS
SeQuant ZIC_HILIC
(3.5 μ m, 200A,
100x2.1 mm)
LC-IDMS
melamine, 127.1 → 85.1,
68.1; 13
C315
N3 melamine,
133.1→89.1, 71.1
Bracketing
NIM (China)
Applied
Biosystems series
5000 LC-MS/MS
Capcell PAK CR
(2.0*150mm, 5 μm)
LC-IDMS
melamine, 127→85, 68; 13
C3melamine, 130→
87, 7
Single-point
VIINM
(Russia)
LC-MS/MS
Agilent Triple
Quard 6460
Eclipce Plus C18
(2.1 x 100mm, 3.5μm)
LC-IDMS
melamine, 127 → 85 ,
68, 43; 13
C315
N3 melamine,
133→89, 72, 45
Single-point
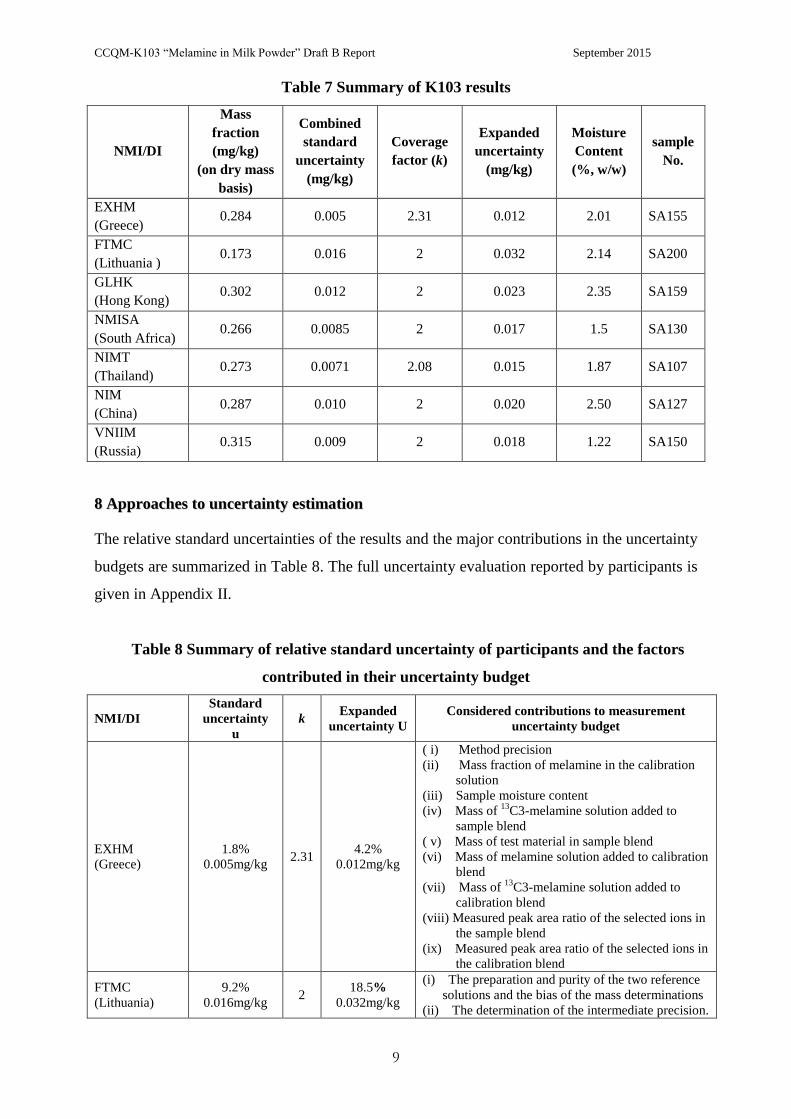
77 RReessuullttss rreeppoorrtteedd bbyy ppaarrttiicciippaattiinngg llaabboorraattoorriieess
The results reported by participating laboratories are summarized in Table 7 and the summary
plots are given in Figures 2. For K103, seven results spread from 0.173 mg/kg to 0.315 mg/kg
and only one of the results is below 0.2 mg/kg.
CCQM-K103 “Melamine in Milk Powder” Draft B Report September 2015
9
Table 7 Summary of K103 results
NMI/DI
Mass
fraction
(mg/kg)
(on dry mass
basis)
Combined
standard
uncertainty
(mg/kg)
Coverage
factor (k)
Expanded
uncertainty
(mg/kg)
Moisture
Content
(%, w/w)
sample
No.
EXHM
(Greece) 0.284 0.005 2.31 0.012 2.01 SA155
FTMC
(Lithuania ) 0.173 0.016 2 0.032 2.14 SA200
GLHK
(Hong Kong) 0.302 0.012 2 0.023 2.35 SA159
NMISA
(South Africa) 0.266 0.0085 2 0.017 1.5 SA130
NIMT
(Thailand) 0.273 0.0071 2.08 0.015 1.87 SA107
NIM
(China) 0.287 0.010 2 0.020 2.50 SA127
VNIIM
(Russia) 0.315 0.009 2 0.018 1.22 SA150
88 AApppprrooaacchheess ttoo uunncceerrttaaiinnttyy eessttiimmaattiioonn
The relative standard uncertainties of the results and the major contributions in the uncertainty
budgets are summarized in Table 8. The full uncertainty evaluation reported by participants is
given in Appendix II.
Table 8 Summary of relative standard uncertainty of participants and the factors
contributed in their uncertainty budget
NMI/DI
Standard
uncertainty
u
k Expanded
uncertainty U
Considered contributions to measurement
uncertainty budget
EXHM
(Greece)
1.8%
0.005mg/kg 2.31
4.2%
0.012mg/kg
( i) Method precision
(ii) Mass fraction of melamine in the calibration
solution
(iii) Sample moisture content
(iv) Mass of 13
C3-melamine solution added to
sample blend
( v) Mass of test material in sample blend
(vi) Mass of melamine solution added to calibration
blend
(vii) Mass of 13
C3-melamine solution added to
calibration blend
(viii) Measured peak area ratio of the selected ions in
the sample blend
(ix) Measured peak area ratio of the selected ions in
the calibration blend
FTMC
(Lithuania)
9.2%
0.016mg/kg 2
18.5%
0.032mg/kg
(i) The preparation and purity of the two reference
solutions and the bias of the mass determinations
(ii) The determination of the intermediate precision.

CCQM-K103 “Melamine in Milk Powder” Draft B Report September 2015
10
NMISA (South
Africa)
3.2%
0.0085mg/kg 2
6.4%
0.017mg/kg
( i) MELCRM solution added to calibration blend
(ii) Mass MELCRM solution added to calibration
blend
(iii) Mass of melamine isotope solution added to
sample blend
(iv) Mass of melamine isotope solution added to
calibration blend
(v) Mass of milk powder sample
(vi) Ratio of peaks areas of MEL/ISO MEL in the
sample blends
(vii) Ratio of peaks areas of MEL CRM/ ISO MEL
in the calibration blends
(viii) ESDM of independent repeat measurements
( n=8)
NIMT
(Thailand)
2.6%
0.0071mg/kg 2.08
5.5%
0.015mg/kg
( i) The mass fraction of analyte in the calibration
(ii) The masses
(iii) The precision factor
(iv) The interference effect
( v) The extraction efficiency factor
(vi) The dry mass correction factor
NIM (China) 3.5%
0.010mg/kg 2
7.0%
0.020mg/kg
( i) Method Precision
(ii) Calibrant solution
(iii) Weight of sample taken for analysis
(iv) Weight of 13
C3- melamine solution spiked into
sample taken for analysis
(v) Moisture Content
GLHK (Hong
Kong)
3.9%
0.012mg/kg 2
7.7%
0.023mg/kg
( i) Precision
(ii) Method recovery
(iii) Sample Recovery
(iv) Purity of calibrant
(v) Moisture Content
(vi) R: isotope amount ratio
VIINM
(Russia)
2.8%
0.009 mg/kg 2
5.7%
0.018 mg/kg
( i) Mass of sample (m)
(ii) Mass of internal standard added to sample
before extraction (m IS)
(iii) Response factor (F)
(iv) RSD of results, %
99 KKeeyy ccoommppaarriissoonn rreeffeerreennccee vvaalluuee ((KKCCRRVV)) ccaallccuullaattiioonn
The criteria of OAWG to cover the results in the calculation of the KCRV included the use of
a method that had been verified as appropriate for the measurand and of higher metrological
order, and the use of a primary standard with a metrological traceable assigned purity – that
means, either a Certified Reference Material from an NMI or Di with demonstrated capability
or a material the purity of which has been suitably assessed by the reporting participant. For
melamine, the seven results spread from 0.173 mg/kg to 0.315 mg/kg. Seven results were
principally available for the KCRV calculation. Data from FTMC were not included since the
laboratory did not provide metrological traceable results (lack of reference material
characterization). As a result, six sets of valid results were used for the estimation of the
KCRV for melamine (Table 9).
CCQM-K103 “Melamine in Milk Powder” Draft B Report September 2015
11
Table 9 Results of provisional KCRV and the associated uncertainties calculated by
different approaches.
KCRV-1
Arithmetic Mean 0.288 mg/kg
Standard deviation (SD) 0.018 mg/kg
Standard uncertainty(u) ( ) 0.0074 mg/kg
KCRV-2
Median 0.286 mg/kg
MADe 0.021 mg/kg
Standard uncertainty( ) 0.011 mg/kg
No. of data used (N=6)
Considering no significant difference among the calculated KCRV results from the two
different approaches, the piloting institutes, NIM and GLHK recommended the use of median
approach for calculation of KCRVs as it is robust, simple to calculate and understand, and has
a very clear relationship with the data from which it was derived.
The KCRV calculated as the median of the six remaining values was 0.286 mg/kg, the
standard uncertainty of the median as 0.011 mg/kg (3.8 %). The k-factor for the estimation of
the expanded uncertainty was chosen as k = 2.57 ( t (0.05;5) ), since the very limited number
of employable results (results of six laboratories, i.e. degrees of freedom=5) and their
distribution should be considered adequately. Thus the expanded uncertainty of the KCRV is
0.028 mg/kg (9.8%).
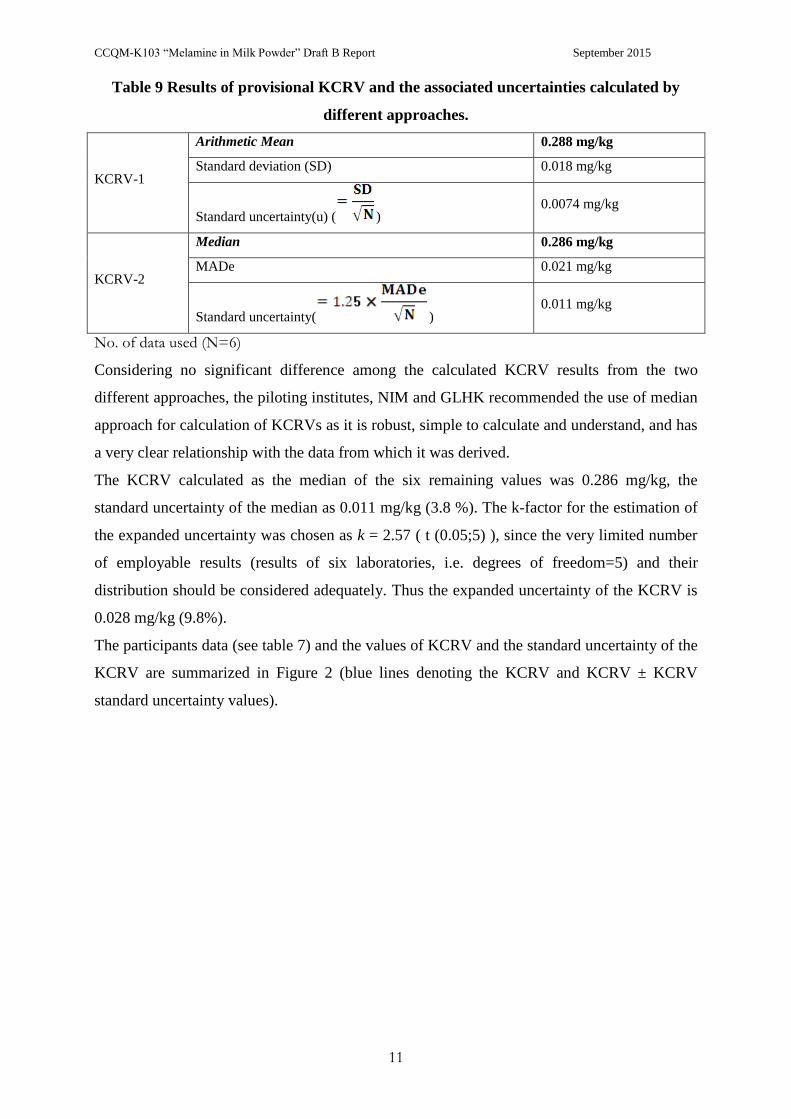
The participants data (see table 7) and the values of KCRV and the standard uncertainty of the
KCRV are summarized in Figure 2 (blue lines denoting the KCRV and KCRV ± KCRV
standard uncertainty values).
CCQM-K103 “Melamine in Milk Powder” Draft B Report September 2015
12
Figure 2 CCQM-K103: KCRV for melamine and its standard uncertainty with
participants’ results and the associated reported standard uncertainties.
1100 DDeeggrreeee ooff eeqquuiivvaalleennccee ((DDooEE)) ccaallccuullaattiioonn
The DoE for NMIs has a value component and an uncertainty component. The DoE and its
uncertainty between an NMI result and the KCRV has been calculated within CCQM
according to the following equations:
i. The value component is Di = Xi - Xref
Where,
Di is the degree of equivalence between the NMI result Xi and the KCRV Xref.
The best possible Di is zero, when the result is identical to Xref.
Xi is the reported result of participant i; Xref is the proposed KCRV value.
ii. The expanded uncertainty component is U (Di) = k * u(Di)
Where,
The expanded uncertainty U(Di) is calculated by combining the expanded uncertainties kiui
of Xi and kref uref of Xi as U(Di) =[(ki2ui
2 + kref
2 uref
2)]
1/2,
kref, uref was under point 9 as described (kref = 2.57, uref = 0.011mg/kg) and ki, ui as
CCQM-K103 “Melamine in Milk Powder” Draft B Report September 2015
13
reported by the participating laboratories.
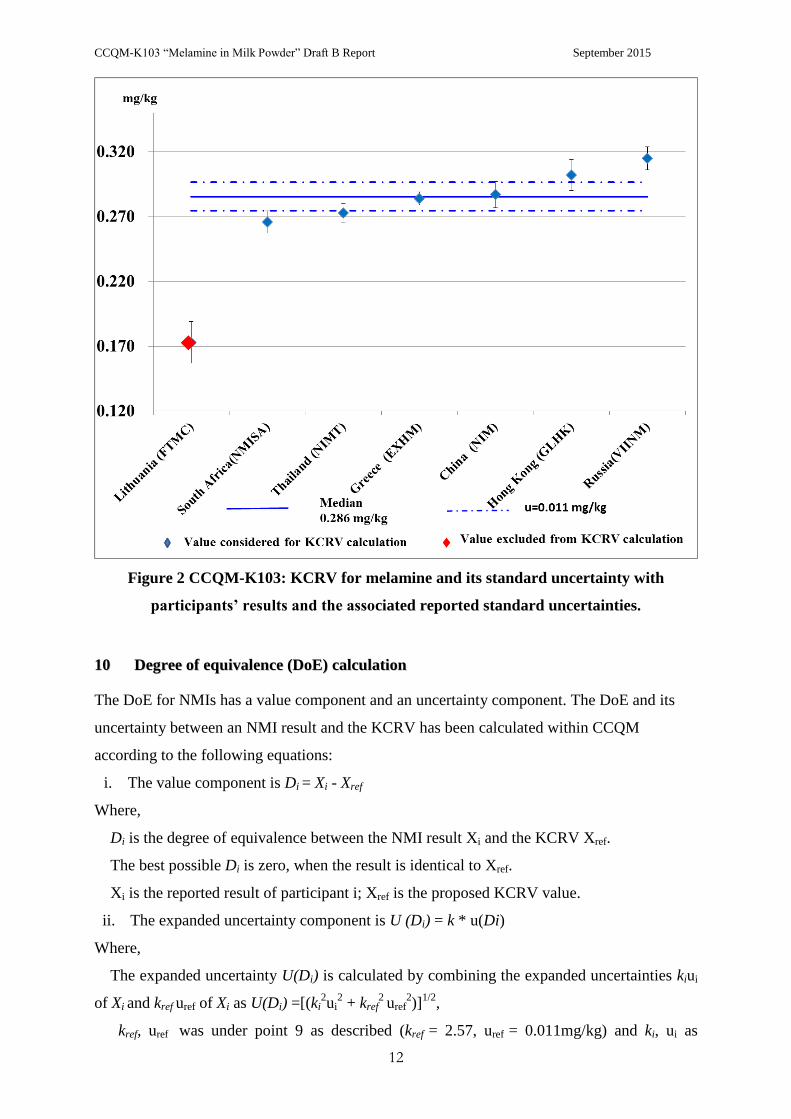
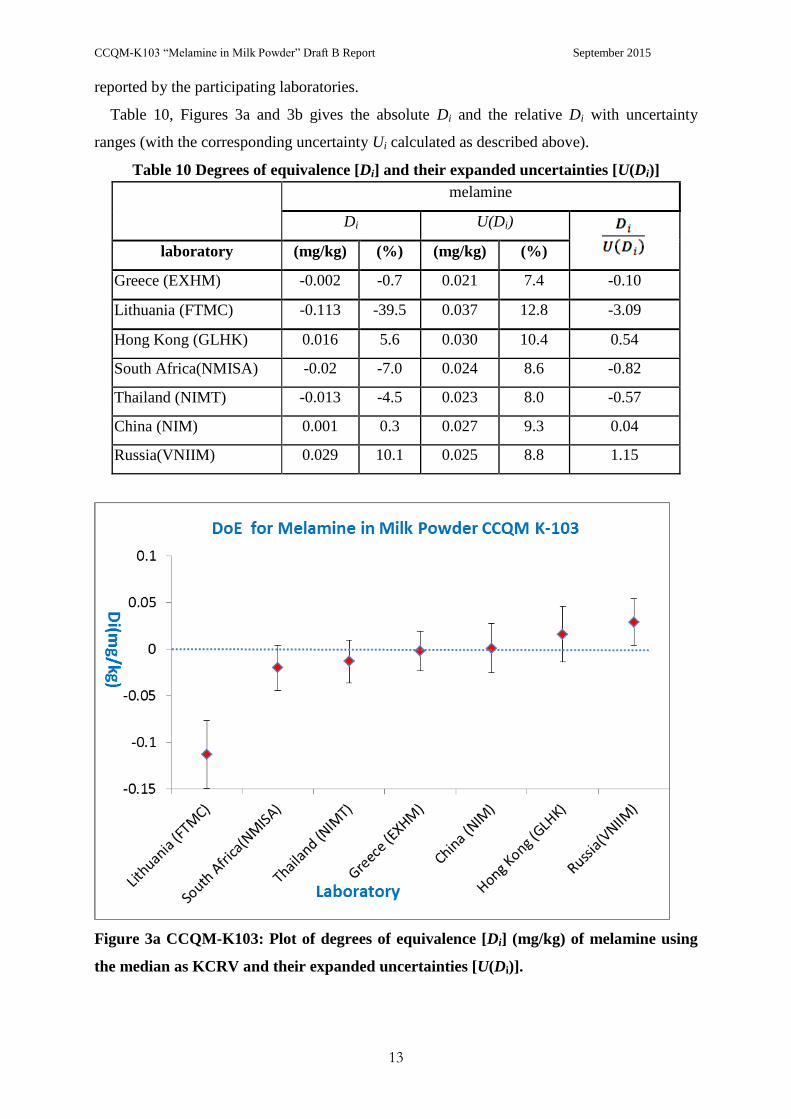
Table 10, Figures 3a and 3b gives the absolute Di and the relative Di with uncertainty
ranges (with the corresponding uncertainty Ui calculated as described above).
Table 10 Degrees of equivalence [Di] and their expanded uncertainties [U(Di)]
melamine
Di U(Di)
laboratory (mg/kg) (%) (mg/kg) (%)
Greece (EXHM) -0.002 -0.7 0.021 7.4 -0.10
Lithuania (FTMC) -0.113 -39.5 0.037 12.8 -3.09
Hong Kong (GLHK) 0.016 5.6 0.030 10.4 0.54
South Africa(NMISA) -0.02 -7.0 0.024 8.6 -0.82
Thailand (NIMT) -0.013 -4.5 0.023 8.0 -0.57
China (NIM) 0.001 0.3 0.027 9.3 0.04
Russia(VNIIM) 0.029 10.1 0.025 8.8 1.15
Figure 3a CCQM-K103: Plot of degrees of equivalence [Di] (mg/kg) of melamine using
the median as KCRV and their expanded uncertainties [U(Di)].
CCQM-K103 “Melamine in Milk Powder” Draft B Report September 2015
14
FFiigguurree 33bb CCCCQQMM--KK110033:: PPlloott ooff ddeeggrreeeess ooff eeqquuiivvaalleennccee [[DDii]] ((%%)) ooff mmeellaammiinnee uussiinngg tthhee
mmeeddiiaann aass KKCCRRVV aanndd tthheeiirr eexxppaannddeedd uunncceerrttaaiinnttiieess [[UU((DDii))]]..
1111 CCoorree ccoommppeetteennccyy aanndd hhooww ffaarr ddooeess tthhee lliigghhtt sshhiinnee??
This study was intended to demonstrate the capability of NMIs/DIs to analyse traces of
melamine in milk and milk powder at concentration levels resulting from legal requirements
for food safety. Additionally the quality of this kind of analysis with respect to compliance
with legal requirements for food control methods and the international comparability of
measurements should be evaluated.
More generally, participants have described the details of the competencies underpinned for
the measurand based on their specific approach/techniques, which are listed in the Type C
Competency Template. The complete core competency tables reported by participants are
given in Appendix III.
Comments on “How far does the light shine?”
The OAWG key comparison for this measurement will assist in ensuring the comparability of
reference measurement procedures, as well as to support the CMC claims of NMIs/DIs in this
measurement field.
Participation in this key comparison can demonstrate the capability to apply IDMS in
CCQM-K103 “Melamine in Milk Powder” Draft B Report September 2015
15
determining mass fractions in the range from 0.1 to 5.0 mg/kg of analytes with low molar
mass (range 50-300 Da) with high polarity (pKow > -2.0) in milk and milk products. Extension
to other analytes and matrices should be applied with care since there is a close linkage to
other relevant parameters as e.g. sample preparation procedures (liquid/liquid extraction, SPE
clean-up) and analytical separation techniques (e.g., GC-MS, LC-MS/MS etc).
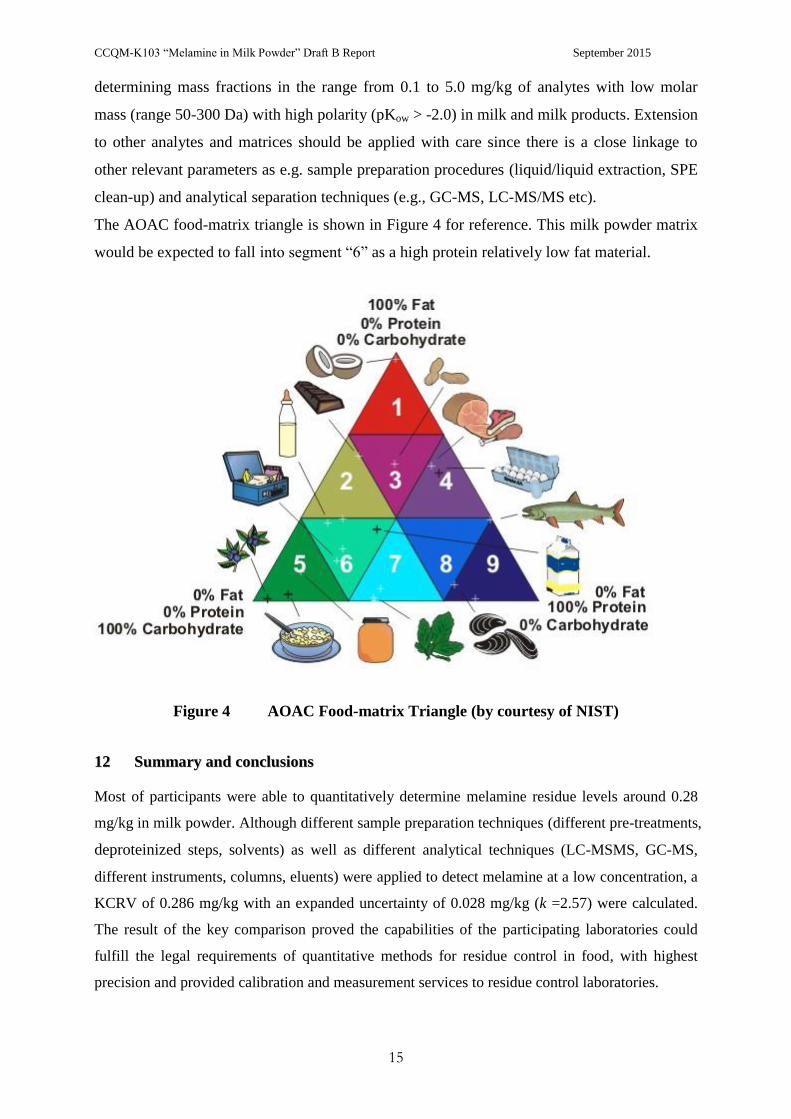
The AOAC food-matrix triangle is shown in Figure 4 for reference. This milk powder matrix
would be expected to fall into segment “6” as a high protein relatively low fat material.
Figure 4 AOAC Food-matrix Triangle (by courtesy of NIST)
1122 SSuummmmaarryy aanndd ccoonncclluussiioonnss
Most of participants were able to quantitatively determine melamine residue levels around 0.28
mg/kg in milk powder. Although different sample preparation techniques (different pre-treatments,
deproteinized steps, solvents) as well as different analytical techniques (LC-MSMS, GC-MS,
different instruments, columns, eluents) were applied to detect melamine at a low concentration, a
KCRV of 0.286 mg/kg with an expanded uncertainty of 0.028 mg/kg (k =2.57) were calculated.
The result of the key comparison proved the capabilities of the participating laboratories could
fulfill the legal requirements of quantitative methods for residue control in food, with highest
precision and provided calibration and measurement services to residue control laboratories.
CCQM-K103 “Melamine in Milk Powder” Draft B Report September 2015
16
References:
[1] OAWG 10/10: CCQM Guidance note: Estimation of a consensus KCRV and associated
Degrees of Equivalence, Version 6, 2010-03-01
[2] Draft CCRVDF Guidelines for the development of performance characteristics for
multiresidue analysis of veterinary drug residues, March 2011; draft of electronic working
group, 19th Session of CCVRDF, Burlington Vermont, USA, August 2010.
[3] CCQM KCRV WG: Data Evaluation Principles for CCQM Key Comparisons, 19 March
2008.
ACKNOWLEDGE
Sincerely thanks for the review and advice by Dr. Lindsey Mackay (NMIA)