Inflation, Unemployment, and Labor Force: The Phillips Curve and Long-term Projections for Japan
Congressional Budget Office
Background Paper
the congress of the united states
CBO’s Labor Force Projections Through 2021
March 2011

Pub. No. 4017
CBO
CBO’s Labor Force ProjectionsThrough 2021
March 2011
The Congress of the United States O Congressional Budget Office
Notes
Unless otherwise indicated, all years are calendar years.
The figures use shaded vertical bars to indicate periods of recession, which extend from the peak of a business cycle to its trough. According to the National Bureau of Economic Research, the most recent recession ended in June 2009.

Preface
CBO
The Congressional Budget Office (CBO) produces regular reports on the state of the U.S. economy and 10-year and longer-term projections of the nation’s budget and economic outlook. In producing those analyses, CBO examines many developments that could have short- or longer-term consequences for the budget and the economy. During the decades to come, one such development is expected to be a slower rate of growth of the labor force relative to the average growth rate of the past few decades. That slowdown is anticipated to occur primarily because of the aging and retirement of large numbers of baby boomers and because women’s participation in the labor force has leveled off since the late 1990s after having risen substantially throughout the three decades before that. This background paper describes the methods CBO uses to project such trends through 2021, updating CBO’s Projections of the Labor Force, a CBO Background Paper published in September 2004.
This paper was prepared by David Brauer of CBO’s Macroeconomic Analysis Division under the direction of Robert Dennis (formerly of CBO) and Kim Kowalewski and with research assistance from Holly Battelle (formerly of CBO), Stephanie Burns, and Priscila Hammett. CBO staff members Naomi Griffin, Joyce Manchester, Jonathan Schwabish, and David Weiner provided helpful comments, as did Bruce Fallick of the Board of Governors of the Federal Reserve System. (The assistance of an external reviewer implies no responsibility for the final product, which rests solely with CBO.)
Kate Kelly edited the paper, and Sherry Snyder proofread it. Maureen Costantino and Jeanine Rees prepared the paper for publication with assistance from Priscila Hammett. Monte Ruffin produced the printed copies, and Linda Schimmel coordinated the print distribution. An electronic version is available from CBO’s Web site (www.cbo.gov).
Douglas W. ElmendorfDirector
March 2011

Contents
Summary and Introduction 1
Population Projections 4Use of SSA and Census Bureau Estimates 4Net Immigration 5
Labor Force Projections 8Effects of Demographics 10Effects of Public Policies 11Effects of Business Cycles 13
Comparison with Other Projections 15
Appendix: Projecting Labor Force Participation Within Demographic Groups 19
CBO
Tables
1.
CBO’s Year-by-Year Projections of the Civilian Noninstitutional Population Age 16 or Older, Labor Force Participation Rate, and Labor Force 32.
Labor Force Participation Rates, by Age and Sex, 2007 103.
Population Shares for the Adult Civilian Noninstitutional Population in Selected Years, by Age Group 114.
Alternative Projections of the Civilian Noninstitutional Population, Labor Force Participation Rate, and Labor Force in 2018 175.
Labor Force Participation Rates, by Age and Sex, for 2007 and 2018 18Figures
1. Long-Run Growth in the Labor Force 2
2.
Labor Force Participation Rate 93.
The Labor Force Participation Rate and the Effect of Demographics 124.
Alternative Labor Force Projections Through 2021 16A-1.
Labor Force Participation Rates, Ages 16 to 24 20A-2.
Labor Force Participation Rates for Men and Women, Ages 25 to 64 21A-3.
Persistence in Labor Force Participation for Men and Women, Ages 60 to 69 24Box
1. Alternative Projections of Net Immigration 6
VI
CBO
CBO’s Labor Force Projections Through 2021
CBO’s Labor Force Projections Through 2021
Summary and IntroductionThe labor force has increased by about 0.8 percent per year, on average, over the past decade. That rate of growth is less than the annual rate of 1.2 percent in the 1990s and much lower than the 2.1 percent rate exhibited over the three decades before that. Although the U.S. population has grown by about 1.1 percent per year over the past 10 years, the labor force participation rate (the percentage of the civilian non-institutional population age 16 years or older who are either working or actively seeking work) has declined, reversing a long-term upward trend.1
The Congressional Budget Office (CBO) anticipates that during the next decade the U.S. labor force will grow at about the same rate, on average, as it did during the past decade; that is, the percentage change in 2020 from 10 years earlier will be about the same as the change was in 2010 (see Figure 1). The labor force is projected to increase from 153.9 million people in 2010 to 168.7 million in 2021 (see Table 1). The aggregate rate of participation in the labor force is projected to fall from 64.7 percent in 2010 to 63.0 percent in 2021.
CBO’s projections combine analyses of demographic and labor market trends:
B Population projections. CBO develops projections for specific groups in the adult civilian noninstitutional population, categorized by age and sex, by applying growth rates developed by the Social Security Administration (SSA) to population estimates for 2010. Those projections are adjusted for differences between CBO’s projections for net immigration and those incorporated in SSA’s population
1. The civilian noninstitutional population consists of U.S. residents who are not on active duty in the military and do not reside in institutions (such as prisons or nursing homes).
CBO
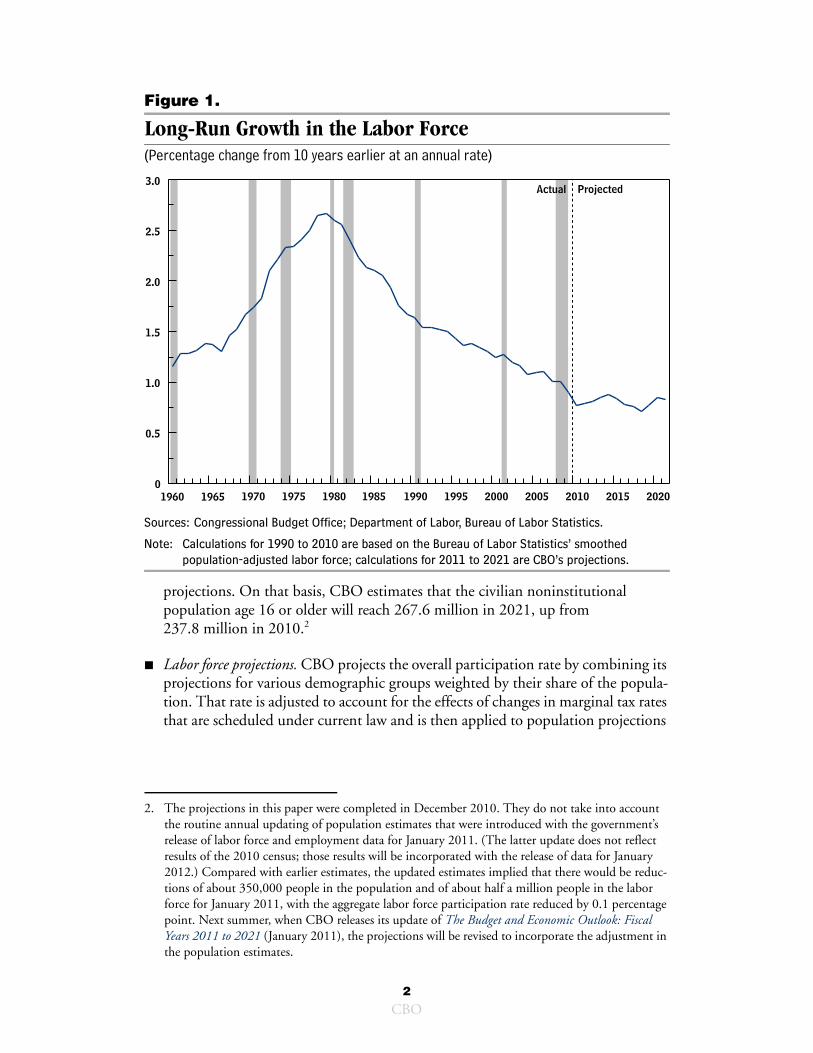
Figure 1.
Long-Run Growth in the Labor Force(Percentage change from 10 years earlier at an annual rate)
Sources: Congressional Budget Office; Department of Labor, Bureau of Labor Statistics.
Note: Calculations for 1990 to 2010 are based on the Bureau of Labor Statistics’ smoothed population-adjusted labor force; calculations for 2011 to 2021 are CBO’s projections.
projections. On that basis, CBO estimates that the civilian noninstitutional population age 16 or older will reach 267.6 million in 2021, up from 237.8 million in 2010.2
B Labor force projections. CBO projects the overall participation rate by combining its projections for various demographic groups weighted by their share of the popula-tion. That rate is adjusted to account for the effects of changes in marginal tax rates that are scheduled under current law and is then applied to population projections
2. The projections in this paper were completed in December 2010. They do not take into account the routine annual updating of population estimates that were introduced with the government’s release of labor force and employment data for January 2011. (The latter update does not reflect results of the 2010 census; those results will be incorporated with the release of data for January 2012.) Compared with earlier estimates, the updated estimates implied that there would be reduc-tions of about 350,000 people in the population and of about half a million people in the labor force for January 2011, with the aggregate labor force participation rate reduced by 0.1 percentage point. Next summer, when CBO releases its update of The Budget and Economic Outlook: Fiscal Years 2011 to 2021 (January 2011), the projections will be revised to incorporate the adjustment in the population estimates.
20202015 2010 2005 2000 1995 1990 1985 1980 1975 1970 1965 1960
3.0
2.5
2.0
1.5
1.0
0.5
0
Actual Projected
2
CBO

Table 1.
CBO’s Year-by-Year Projections of the Civilian Noninstitutional Population Age 16 or Older, Labor Force Participation Rate, and Labor Force
Sources: Congressional Budget Office; Department of Labor, Bureau of Labor Statistics; Department of Commerce, Census Bureau.
Note: CBO’s projections for population and labor force do not take into account the updated population estimates introduced with the release of labor force and employment data for January 2011.
to estimate the potential size of the labor force if the economy were at full employ-ment. Further adjustments for the effects of short-run economic fluctuations (or business cycles) are made to project the actual participation rate and the size of the labor force. CBO projects that the labor force will grow by about 15 million peo-ple (or about 10 percent) over the next decade. Because of a decline in the rate of labor force participation, however, growth in the labor force is expected to be less than the increase in the population, which is expected to grow by 12½ percent during the next 10 years.
Two factors are especially important to the current projections of participation in the labor force. The first is near-term economic conditions. Because of the weakened state of the economy, the labor force is currently well below its potential size; consequently, CBO expects it to grow faster than its long-term trend between now and 2016. By that time, CBO projects, the output gap will have closed (that is, the economy will be oper-ating at its full potential), and the actual labor force will be about equal to the potential labor force.3 After 2016, CBO expects the growth of the labor force to equal, on aver-age, the growth of the potential labor force, and it does not attempt to forecast the tim-ing of subsequent business cycles. The second factor is the impending retirement of the baby-boom generation (people who were born between 1946 and 1964), which will cause the potential labor force participation rate to decline throughout the next decade. In CBO’s estimates, the effect of the second factor outweighs the first, pushing down the labor force participation rate, on balance, over the next decade.
3. The output gap is the difference between actual and potential gross domestic product (GDP) expressed as a percentage of potential GDP. For further detail on the macroeconomic outlook and estimates of potential GDP, see Congressional Budget Office, The Budget and Economic Outlook: Fiscal Years 2011 to 2021.
Actual,2010 2011 2012 2013 2014 2015 2016 2017 2018 2019 2020 2021
Population Age 16 or Older(Millions) 237.8 240.2 242.9 245.8 249.2 252.5 255.3 257.9 260.3 262.8 265.1 267.6
Participation Rate(Percent) 64.7 64.7 64.6 64.4 64.2 63.9 63.7 63.6 63.4 63.3 63.2 63.0
Labor Force(Millions) 153.9 155.4 156.8 158.4 160.0 161.4 162.6 163.9 165.0 166.2 167.4 168.7
3
CBO
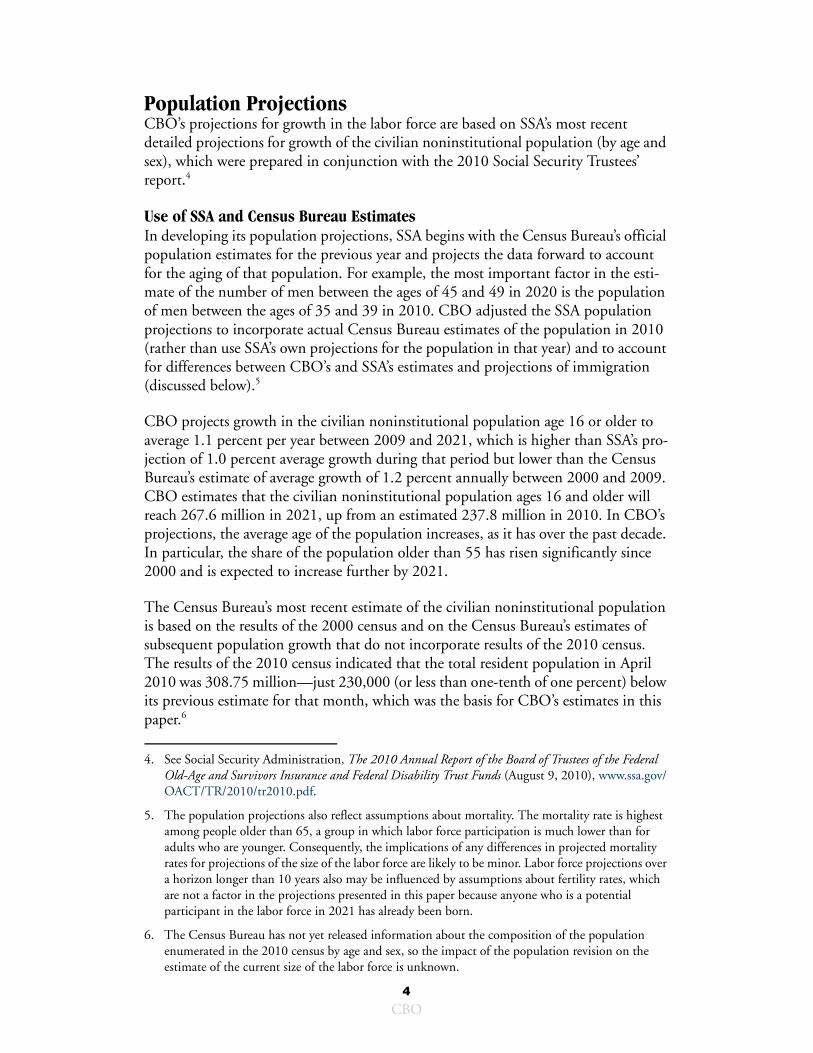
Population ProjectionsCBO’s projections for growth in the labor force are based on SSA’s most recent detailed projections for growth of the civilian noninstitutional population (by age and sex), which were prepared in conjunction with the 2010 Social Security Trustees’ report.4
Use of SSA and Census Bureau EstimatesIn developing its population projections, SSA begins with the Census Bureau’s official population estimates for the previous year and projects the data forward to account for the aging of that population. For example, the most important factor in the esti-mate of the number of men between the ages of 45 and 49 in 2020 is the population of men between the ages of 35 and 39 in 2010. CBO adjusted the SSA population projections to incorporate actual Census Bureau estimates of the population in 2010 (rather than use SSA’s own projections for the population in that year) and to account for differences between CBO’s and SSA’s estimates and projections of immigration (discussed below).5
CBO projects growth in the civilian noninstitutional population age 16 or older to average 1.1 percent per year between 2009 and 2021, which is higher than SSA’s pro-jection of 1.0 percent average growth during that period but lower than the Census Bureau’s estimate of average growth of 1.2 percent annually between 2000 and 2009. CBO estimates that the civilian noninstitutional population ages 16 and older will reach 267.6 million in 2021, up from an estimated 237.8 million in 2010. In CBO’s projections, the average age of the population increases, as it has over the past decade. In particular, the share of the population older than 55 has risen significantly since 2000 and is expected to increase further by 2021.
The Census Bureau’s most recent estimate of the civilian noninstitutional population is based on the results of the 2000 census and on the Census Bureau’s estimates of subsequent population growth that do not incorporate results of the 2010 census. The results of the 2010 census indicated that the total resident population in April 2010 was 308.75 million—just 230,000 (or less than one-tenth of one percent) below its previous estimate for that month, which was the basis for CBO’s estimates in this paper.6
4. See Social Security Administration, The 2010 Annual Report of the Board of Trustees of the Federal Old-Age and Survivors Insurance and Federal Disability Trust Funds (August 9, 2010), www.ssa.gov/OACT/TR/2010/tr2010.pdf.
5. The population projections also reflect assumptions about mortality. The mortality rate is highest among people older than 65, a group in which labor force participation is much lower than for adults who are younger. Consequently, the implications of any differences in projected mortality rates for projections of the size of the labor force are likely to be minor. Labor force projections over a horizon longer than 10 years also may be influenced by assumptions about fertility rates, which are not a factor in the projections presented in this paper because anyone who is a potential participant in the labor force in 2021 has already been born.
6. The Census Bureau has not yet released information about the composition of the population enumerated in the 2010 census by age and sex, so the impact of the population revision on the estimate of the current size of the labor force is unknown.
4
CBO
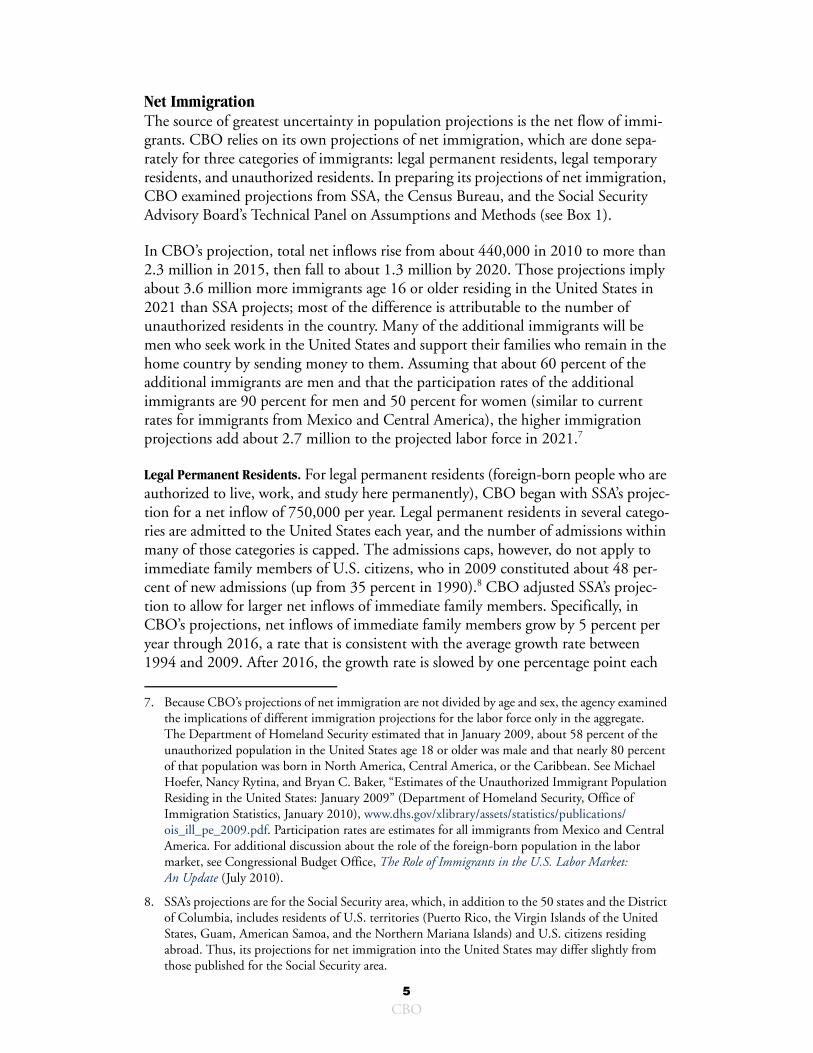
Net ImmigrationThe source of greatest uncertainty in population projections is the net flow of immi-grants. CBO relies on its own projections of net immigration, which are done sepa-rately for three categories of immigrants: legal permanent residents, legal temporary residents, and unauthorized residents. In preparing its projections of net immigration, CBO examined projections from SSA, the Census Bureau, and the Social Security Advisory Board’s Technical Panel on Assumptions and Methods (see Box 1).
In CBO’s projection, total net inflows rise from about 440,000 in 2010 to more than 2.3 million in 2015, then fall to about 1.3 million by 2020. Those projections imply about 3.6 million more immigrants age 16 or older residing in the United States in 2021 than SSA projects; most of the difference is attributable to the number of unauthorized residents in the country. Many of the additional immigrants will be men who seek work in the United States and support their families who remain in the home country by sending money to them. Assuming that about 60 percent of the additional immigrants are men and that the participation rates of the additional immigrants are 90 percent for men and 50 percent for women (similar to current rates for immigrants from Mexico and Central America), the higher immigration projections add about 2.7 million to the projected labor force in 2021.7
Legal Permanent Residents. For legal permanent residents (foreign-born people who are authorized to live, work, and study here permanently), CBO began with SSA’s projec-tion for a net inflow of 750,000 per year. Legal permanent residents in several catego-ries are admitted to the United States each year, and the number of admissions within many of those categories is capped. The admissions caps, however, do not apply to immediate family members of U.S. citizens, who in 2009 constituted about 48 per-cent of new admissions (up from 35 percent in 1990).8 CBO adjusted SSA’s projec-tion to allow for larger net inflows of immediate family members. Specifically, in CBO’s projections, net inflows of immediate family members grow by 5 percent per year through 2016, a rate that is consistent with the average growth rate between 1994 and 2009. After 2016, the growth rate is slowed by one percentage point each
7. Because CBO’s projections of net immigration are not divided by age and sex, the agency examined the implications of different immigration projections for the labor force only in the aggregate. The Department of Homeland Security estimated that in January 2009, about 58 percent of the unauthorized population in the United States age 18 or older was male and that nearly 80 percent of that population was born in North America, Central America, or the Caribbean. See Michael Hoefer, Nancy Rytina, and Bryan C. Baker, “Estimates of the Unauthorized Immigrant Population Residing in the United States: January 2009” (Department of Homeland Security, Office of Immigration Statistics, January 2010), www.dhs.gov/xlibrary/assets/statistics/publications/ois_ill_pe_2009.pdf. Participation rates are estimates for all immigrants from Mexico and Central America. For additional discussion about the role of the foreign-born population in the labor market, see Congressional Budget Office, The Role of Immigrants in the U.S. Labor Market: An Update (July 2010).
8. SSA’s projections are for the Social Security area, which, in addition to the 50 states and the District of Columbia, includes residents of U.S. territories (Puerto Rico, the Virgin Islands of the United States, Guam, American Samoa, and the Northern Mariana Islands) and U.S. citizens residing abroad. Thus, its projections for net immigration into the United States may differ slightly from those published for the Social Security area.
5
CBO
Continued
Box 1.
Alternative Projections of Net ImmigrationThe Congressional Budget Office (CBO) relies on its own projections of net immigra-tion, in which total net flows rise from about 440,000 in 2010 to more than 2.3 million in 2015, then fall to about 1.3 million by 2020. CBO’s estimate for 2010 is much lower, and its projection for 2015 much higher, than are predictions from the Social Security Administration (SSA), the Census Bureau, or the Social Security Advisory Board’s Technical Panel on Assumptions and Methods; the differences arise largely because CBO’s projections explicitly take into account the impact of the reces-sion and subsequent recovery, whereas the other forecasters do not. By 2020, CBO shows somewhat larger net inflows than SSA but somewhat smaller net inflows than the Census Bureau and the Technical Panel.
SSA developed separate projections for legal permanent residents and for all other residents. Under its intermediate assumptions (which underlie its expectations for the most likely outcome), the number of people admitted as legal permanent residents is, beginning in 2011, expected to be a constant 1.0 million per year.1 Although the number of people who are admitted as relatives of U.S. citizens, an important cate-gory of legal immigration, is not subject to numerical limits, SSA’s projection assumes that admissions in this category also will be constant after 2010. Emigration of legal residents is assumed to occur at a rate equal to 25 percent of admissions of legal per-manent residents, which is consistent with patterns observed in recent years; thus, SSA projects that, after 2010, net annual legal permanent immigration will be a con-stant 750,000.2
At the same time, SSA projects that, under its intermediate assumptions, net “other” immigration (among legal temporary residents and unauthorized residents) will decline from 445,000 in 2009 and 435,000 in 2010 to 400,000 by 2015 and 375,000 by 2020. That net inflow includes large offsetting inflows and outflows. The number of people who enter the United States each year as “other” immigrants is much larger than the net amount, both because about a third of those who enter are expected to become legal permanent residents within several years of arrival (and therefore will be counted in the 1.0 million legal permanent residents admitted annually) and because many of the rest who enter the United States in the “other” category eventually leave, reducing the net inflow when they go. SSA projects that about 1.5 million people will enter the United States each year as immigrants in the “other” category, an amount roughly consistent with immigration estimates for 2000 through 2006. The depar-tures for the group are calculated on the basis of a set of estimated annual rates of departure, by age and sex, as a percentage of the “other” immigrant population. Because the base population is increasing over time, the amount of emigration also is
1. That figure includes newly arriving immigrants and people who have been in the country for some period but are adjusting their immigration status.
2. For a discussion of overall emigration rates, see Jonathan Schwabish, Identifying Rates of Emigration in the United States Using Administrative Earnings Records, Congressional Budget Office Working Paper 2009-01 (March 2009).
6
CBO

Box 1. Continued
Alternative Projections of Net Immigrationgrowing. With both the gross inflow of “other” immigrants and shifts from “other” to legal permanent resident status constant, an increase in emigration implies a decline in net “other” immigration. Thus, total net immigration, estimated at 1.26 million in 2009, is projected by SSA to decline to 1.22 million in 2010, to 1.15 million in 2015, and to 1.13 million in 2020 under its intermediate assumptions. (SSA’s alternative projections for 2020 are about 325,000 lower under its high-cost scenario for Social Security and about 350,000 higher under its low-cost scenario.)
Other organizations’ projections give somewhat higher estimates of future net immi-gration. In 2008, the Census Bureau projected net immigration of 1.34 million in 2010, increasing to 1.49 million by 2021.1 Those figures were developed on the basis of detailed projections of arrivals and departures of immigrants in four groups—people from Latin America; people from the non-Spanish-speaking Caribbean islands plus sub-Saharan Africa; people from South Asia, East Asia, Southeast Asia, and the Pacific islands; and people from Canada, Europe, Central Asia, and the Middle East. (In 2009, the Census Bureau issued alternative projections of net immigration for 2021 of 1.28 million in the bureau’s Low Net International Migration series and 1.74 million in its High Net International Migration series.)
Another approach to projecting net immigration is presented in a 2007 report to the Social Security Advisory Board by the Technical Panel on Assumptions and Methods.2 That report concluded that, as the total U.S. population increases, so should the expected number of immigrants, in part because the demand for labor from immi-grants, along with the demand for labor from other groups, is expected to expand as the population grows. Under the panel’s assumptions, instead of declining from its estimated current (as of 2007) amount, net immigration would rise to about 1.5 million by 2020. The panel’s analysis could imply that more legal immigrants will be admitted to the United States than is consistent with current law or that net flows of unauthorized immigrants would be higher than is likely to occur under current policies.
CBO has chosen not to use the approaches to immigration offered by SSA, the Census Bureau, and the Technical Panel, for two reasons: First, whereas CBO’s base-line must be consistent with current law, the other approaches may require legislative changes to take full effect; indeed, the Technical Panel explicitly rejects the assump-tion of current laws and policies. Second, CBO’s estimates incorporate the likely dampening effect of the recession on immigrant flows and the likelihood that those flows will increase sharply as the economy recovers. The recession curtailed demand especially for construction workers (a category disproportionately composed of immi-grants, legal and otherwise) and might have reduced net “other” immigration; emigra-tion of legal permanent residents also might have increased.
1. See Census Bureau, “U.S. Population Projections,” www.census.gov/population/www/projections/2008projections.html.
2. See Technical Panel on Assumptions and Methods, Report to the Social Security Advisory Board (October 2007), www.ssab.gov/documents/2007_TPAM_REPORT_FINAL_copy.PDF.
7
CBO
year through 2020, after which net flows stay constant at their 2020 rate of about 530,000. Projected total net inflows for the other capped categories remain constant at the 2010 estimate of 375,000.
Legal Temporary Residents. CBO projects annual net inflows of 110,000 legal tempo-rary residents (foreign-born people admitted under temporary visas: temporary work-ers, students, exchange visitors, and their families). The number of legal temporary residents admitted to the United States in any year is capped, but with some allow-ance for visas not allocated in one year to be issued in the next. CBO’s projection for this category is consistent with the caps in place and average flows observed between 1989 and 2008.9
Unauthorized Residents. CBO estimates that, on net, about 400,000 unauthorized res-idents (foreign-born people who are not authorized to live, work, or study in the country) left the United States in 2010. It anticipates little change in the number of unauthorized residents in 2011, but it projects net inflows of about 1.4 million in 2014 and again in 2015 as the economy recovers and demand for labor strengthens. Beginning in 2016, the projected net flows of unauthorized residents taper off and reach 270,000 (the same as SSA’s projection) in 2020.
Those estimates begin with estimates of the unauthorized population that the Pew Hispanic Center published for 2000 to 2009, which stated that the unauthorized population increased from 8.4 million in 2000 to 12.0 million in 2007.10 However, with the recession (and especially the decline in demand for construction workers), the Pew Hispanic Center estimated that the unauthorized population had declined to 11.1 million by 2009. CBO’s projections take into account both the underlying trend flows of unauthorized residents and the impact of economic conditions on those flows.
Labor Force Projections Projections of the labor force combine population projections with estimates of the rate of participation in the labor force, which depends on several factors.11 One crucial influence on participation is demographics: The propensity to work varies over a per-son’s lifetime and from one cohort (a group of people defined by year or years of birth) to another. Beyond that, people choose whether to participate in the labor force
9. In 2009, the estimated number of legal temporary residents declined by nearly a quarter million (13 percent), as demand for temporary workers fell sharply during the recession. For the purposes of this discussion, that decline has been removed from the estimate of historical flows of legal temporary residents.
10. See Jeffrey S. Passel and D’Vera Cohn, U.S. Unauthorized Immigration Flows Are Down Sharply Since Mid-Decade (Washington, D.C.: Pew Hispanic Center, September 2010), http://pewhispanic.org/files/reports/126.pdf.
11. For a review of trends in participation before the recession, see Stephanie Aaronson and others, “The Recent Decline in Labor Force Participation and Its Implications for Potential Labor Supply,” Brookings Papers on Economic Activity, vol. 37, no. 1 (2006), pp. 69–134.
8
CBO
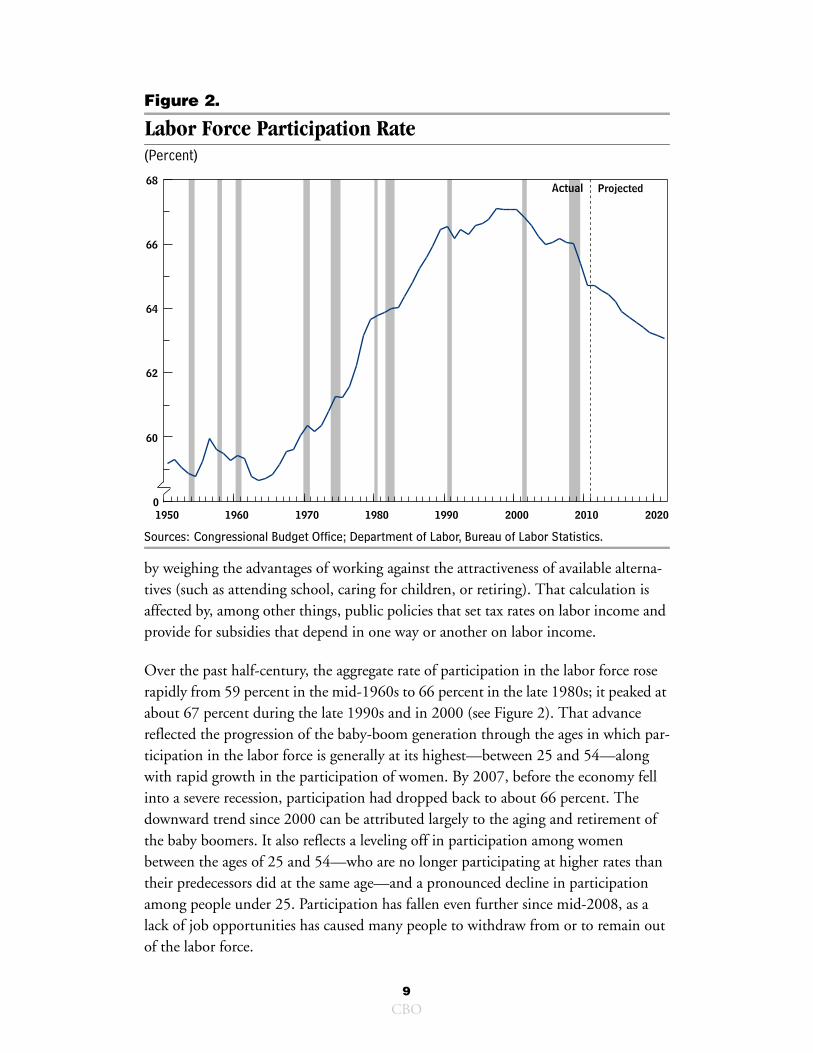
Figure 2.
Labor Force Participation Rate(Percent)
Sources: Congressional Budget Office; Department of Labor, Bureau of Labor Statistics.
by weighing the advantages of working against the attractiveness of available alterna-tives (such as attending school, caring for children, or retiring). That calculation is affected by, among other things, public policies that set tax rates on labor income and provide for subsidies that depend in one way or another on labor income.
Over the past half-century, the aggregate rate of participation in the labor force rose rapidly from 59 percent in the mid-1960s to 66 percent in the late 1980s; it peaked at about 67 percent during the late 1990s and in 2000 (see Figure 2). That advance reflected the progression of the baby-boom generation through the ages in which par-ticipation in the labor force is generally at its highest—between 25 and 54—along with rapid growth in the participation of women. By 2007, before the economy fell into a severe recession, participation had dropped back to about 66 percent. The downward trend since 2000 can be attributed largely to the aging and retirement of the baby boomers. It also reflects a leveling off in participation among women between the ages of 25 and 54—who are no longer participating at higher rates than their predecessors did at the same age—and a pronounced decline in participation among people under 25. Participation has fallen even further since mid-2008, as a lack of job opportunities has caused many people to withdraw from or to remain out of the labor force.
20202010200019901980197019601950
68
66
64
62
60
0
Projected Actual
9
CBO
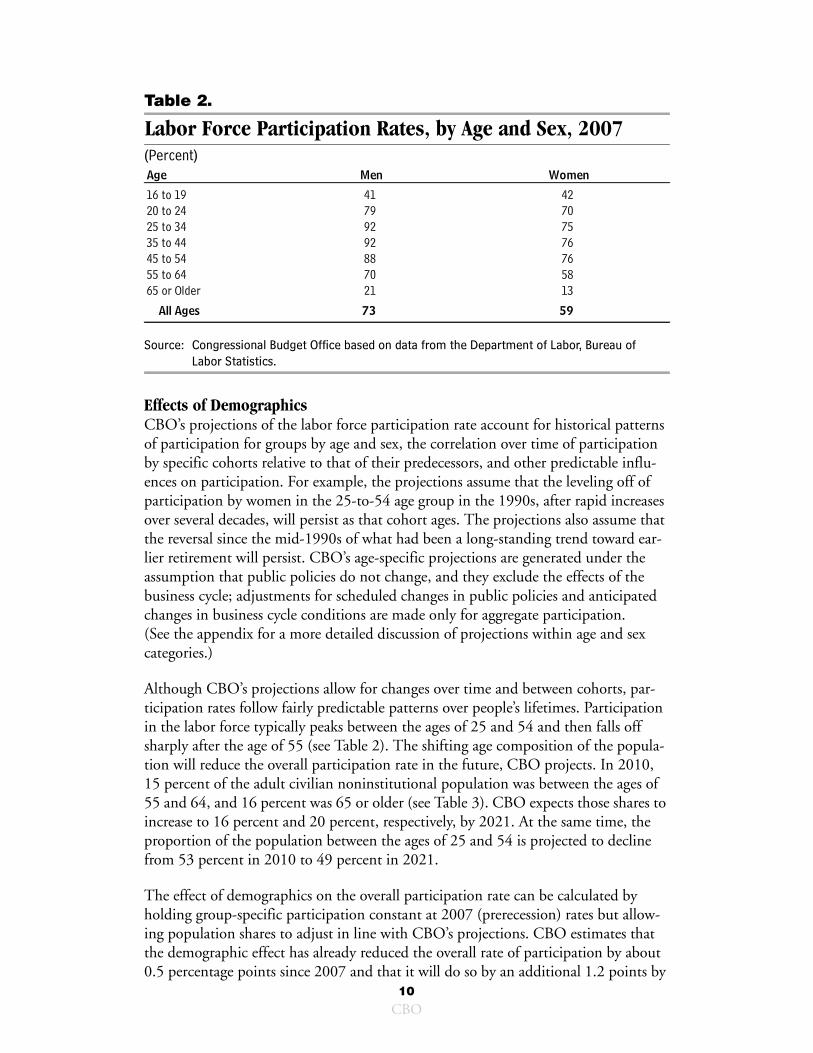
Table 2.
Labor Force Participation Rates, by Age and Sex, 2007(Percent)
Source: Congressional Budget Office based on data from the Department of Labor, Bureau of Labor Statistics.
Effects of Demographics CBO’s projections of the labor force participation rate account for historical patterns of participation for groups by age and sex, the correlation over time of participation by specific cohorts relative to that of their predecessors, and other predictable influ-ences on participation. For example, the projections assume that the leveling off of participation by women in the 25-to-54 age group in the 1990s, after rapid increases over several decades, will persist as that cohort ages. The projections also assume that the reversal since the mid-1990s of what had been a long-standing trend toward ear-lier retirement will persist. CBO’s age-specific projections are generated under the assumption that public policies do not change, and they exclude the effects of the business cycle; adjustments for scheduled changes in public policies and anticipated changes in business cycle conditions are made only for aggregate participation. (See the appendix for a more detailed discussion of projections within age and sex categories.)
Although CBO’s projections allow for changes over time and between cohorts, par-ticipation rates follow fairly predictable patterns over people’s lifetimes. Participation in the labor force typically peaks between the ages of 25 and 54 and then falls off sharply after the age of 55 (see Table 2). The shifting age composition of the popula-tion will reduce the overall participation rate in the future, CBO projects. In 2010, 15 percent of the adult civilian noninstitutional population was between the ages of 55 and 64, and 16 percent was 65 or older (see Table 3). CBO expects those shares to increase to 16 percent and 20 percent, respectively, by 2021. At the same time, the proportion of the population between the ages of 25 and 54 is projected to decline from 53 percent in 2010 to 49 percent in 2021.
The effect of demographics on the overall participation rate can be calculated by holding group-specific participation constant at 2007 (prerecession) rates but allow-ing population shares to adjust in line with CBO’s projections. CBO estimates that the demographic effect has already reduced the overall rate of participation by about 0.5 percentage points since 2007 and that it will do so by an additional 1.2 points by
Age
16 to 19 41 4220 to 24 79 7025 to 34 92 7535 to 44 92 7645 to 54 88 7655 to 64 70 5865 or Older 21 13
All Ages 73 59
Men Women
10
CBO
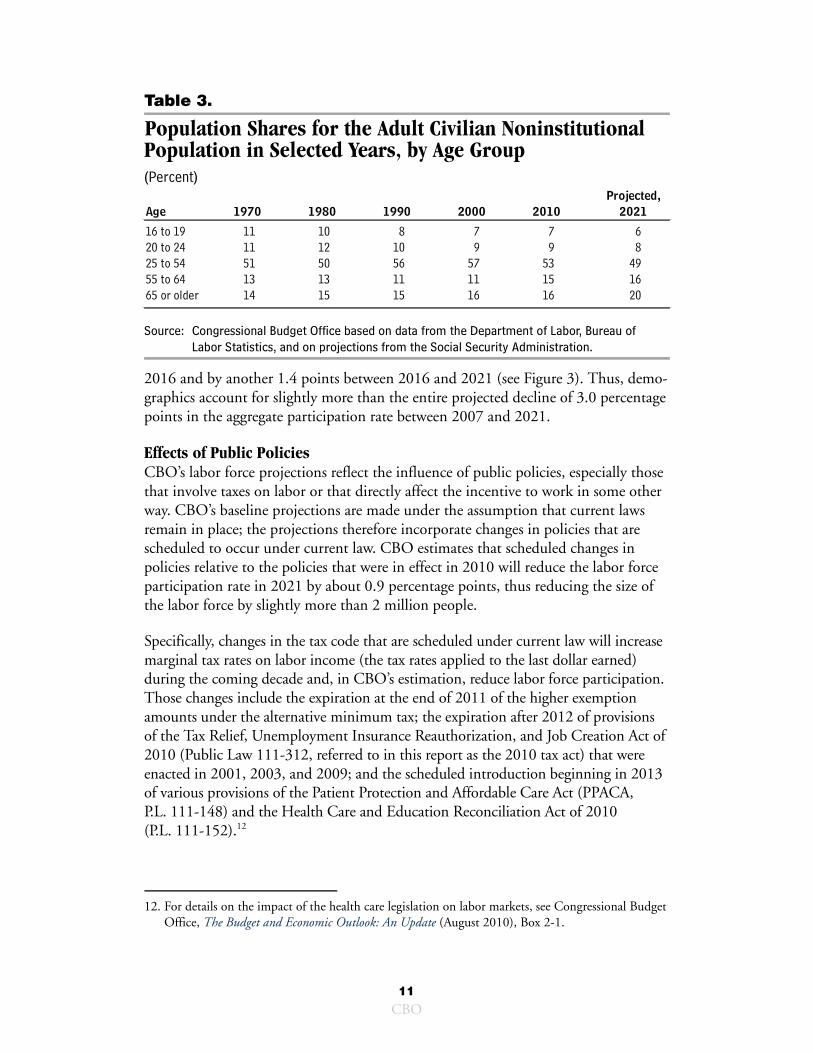
Table 3.
Population Shares for the Adult Civilian Noninstitutional Population in Selected Years, by Age Group(Percent)
Source: Congressional Budget Office based on data from the Department of Labor, Bureau of Labor Statistics, and on projections from the Social Security Administration.
2016 and by another 1.4 points between 2016 and 2021 (see Figure 3). Thus, demo-graphics account for slightly more than the entire projected decline of 3.0 percentage points in the aggregate participation rate between 2007 and 2021.
Effects of Public Policies CBO’s labor force projections reflect the influence of public policies, especially those that involve taxes on labor or that directly affect the incentive to work in some other way. CBO’s baseline projections are made under the assumption that current laws remain in place; the projections therefore incorporate changes in policies that are scheduled to occur under current law. CBO estimates that scheduled changes in policies relative to the policies that were in effect in 2010 will reduce the labor force participation rate in 2021 by about 0.9 percentage points, thus reducing the size of the labor force by slightly more than 2 million people.
Specifically, changes in the tax code that are scheduled under current law will increase marginal tax rates on labor income (the tax rates applied to the last dollar earned) during the coming decade and, in CBO’s estimation, reduce labor force participation. Those changes include the expiration at the end of 2011 of the higher exemption amounts under the alternative minimum tax; the expiration after 2012 of provisions of the Tax Relief, Unemployment Insurance Reauthorization, and Job Creation Act of 2010 (Public Law 111-312, referred to in this report as the 2010 tax act) that were enacted in 2001, 2003, and 2009; and the scheduled introduction beginning in 2013 of various provisions of the Patient Protection and Affordable Care Act (PPACA, P.L. 111-148) and the Health Care and Education Reconciliation Act of 2010 (P.L. 111-152).12
12. For details on the impact of the health care legislation on labor markets, see Congressional Budget Office, The Budget and Economic Outlook: An Update (August 2010), Box 2-1.
Age
16 to 19 11 10 8 7 7 620 to 24 11 12 10 9 9 825 to 54 51 50 56 57 53 4955 to 64 13 13 11 11 15 1665 or older 14 15 15 16 16 20
Projected,20211970 1980 1990 2000 2010
11
CBO
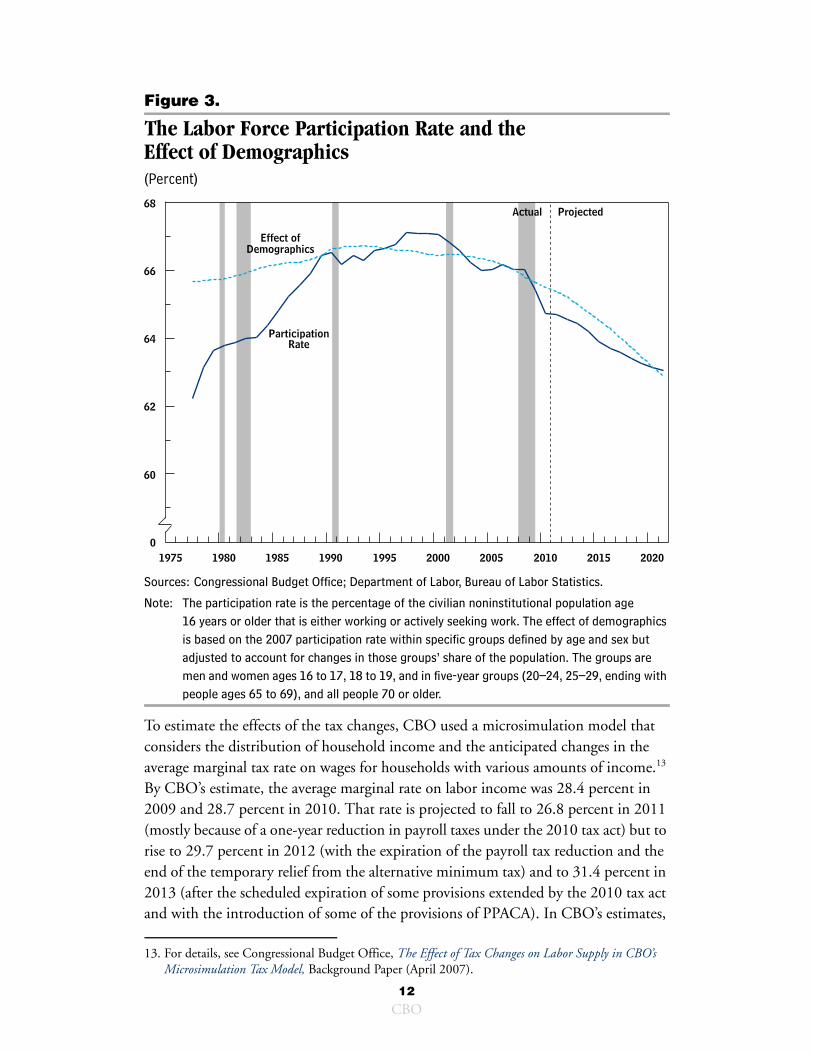
Figure 3.
The Labor Force Participation Rate and the Effect of Demographics (Percent)
Sources: Congressional Budget Office; Department of Labor, Bureau of Labor Statistics.
Note: The participation rate is the percentage of the civilian noninstitutional population age 16 years or older that is either working or actively seeking work. The effect of demographics is based on the 2007 participation rate within specific groups defined by age and sex but adjusted to account for changes in those groups’ share of the population. The groups are men and women ages 16 to 17, 18 to 19, and in five-year groups (20–24, 25–29, ending with people ages 65 to 69), and all people 70 or older.
To estimate the effects of the tax changes, CBO used a microsimulation model that considers the distribution of household income and the anticipated changes in the average marginal tax rate on wages for households with various amounts of income.13 By CBO’s estimate, the average marginal rate on labor income was 28.4 percent in 2009 and 28.7 percent in 2010. That rate is projected to fall to 26.8 percent in 2011 (mostly because of a one-year reduction in payroll taxes under the 2010 tax act) but to rise to 29.7 percent in 2012 (with the expiration of the payroll tax reduction and the end of the temporary relief from the alternative minimum tax) and to 31.4 percent in 2013 (after the scheduled expiration of some provisions extended by the 2010 tax act and with the introduction of some of the provisions of PPACA). In CBO’s estimates,
13. For details, see Congressional Budget Office, The Effect of Tax Changes on Labor Supply in CBO’s Microsimulation Tax Model, Background Paper (April 2007).
2020201520102005200019951990198519801975
68
66
64
62
60
0
ParticipationRate
Effect ofDemographics
ProjectedActual
12
CBO
the rate rises again after 2013 (with the introduction of other provisions of PPACA) and reaches almost 34 percent by 2021.14
CBO’s microsimulation model indicates the percentage change in labor input that would be caused by the expected increase in the marginal tax rate on labor. That model incorporates estimated labor supply elasticities (the percentage change in total hours of work supplied that would result from a 1 percent increase in both after-tax income and the after-tax wage rate) that average 0.07 for primary earners within a household and 0.40 for secondary earners, implying an average elasticity of 0.14 for the entire labor force.15 Consistent with the available evidence, CBO assumed that about half of the response reflects people entering and exiting the labor force; the rest reflects deci-sions by working people to change their hours on the job. In the model, the elasticity of supply for primary earners varies on the basis of their position in the earnings distri-bution. The elasticities range from 0.03 for those in the top 40 percent of the earnings distribution to 0.17 for those in the bottom tenth of that distribution.16
Effects of Business Cycles Participation in the labor force is sensitive to economic conditions, falling in reces-sions and rising in periods of expansion. On average, over the past several decades, the labor force has declined by about 0.2 percent below CBO’s estimate of its potential level for each percentage point by which the unemployment rate exceeds the natural rate of unemployment (the rate that exists when the economy is operating at its potential, currently projected by CBO to be 5.2 percent by the end of the decade).17 At recent participation rates, that relationship corresponds to a reduction of about 0.13 percentage points in the aggregate labor force participation rate for each percent-age point of additional unemployment.
In late 2010, the unemployment rate averaged 9.6 percent, more than 4 percentage points above CBO’s estimate of the long-term natural rate. Accordingly, labor force participation has fallen significantly below its trend rate, as some workers (especially men between the ages of 25 and 54) have withdrawn from the labor force in the face of a poor job market and others (especially teens) have refrained from entering. By the final quarter of 2010, the actual labor force participation rate—64.4 percent—was more than a full percentage point below the potential participation rate as estimated by CBO. It also was lower than what would have been expected on the basis of the
14. Part of the projected increase in average marginal tax rates reflects rising real (inflation-adjusted) income, which pushes more income into higher marginal tax brackets. Because that phenomenon has also affected the historical trend in labor force participation, it is not separately incorporated into CBO’s adjustments for the impact of public policies on the projected labor force participation rate.
15. See Congressional Budget Office, The Effect of Tax Changes on Labor Supply in CBO’s Micro-simulation Tax Model; and Labor Supply and Taxes, CBO Memorandum (January 1996).
16. CBO’s assumptions about relative elasticities among earnings groups are based on Chinhui Juhn, Kevin M. Murphy, and Robert H. Topel, “Current Unemployment, Historically Contemplated,” Brookings Papers on Economic Activity, vol. 33, no. 1 (2002), pp. 79–136.
17. That rate is up from the 4.8 percent CBO had estimated before the latest recession.
13
CBO
historical relationship between the labor force participation rate and the unemployment rate.
As the economy recovers, the labor force is expected to grow at a faster-than-trend rate. In particular, as the unemployment rate declines, CBO expects that the gap between the actual and potential labor force will narrow in line with the historical relationship between the participation rate and the unemployment rate.
On balance, the recession has a modest downward influence on the participation rate projected for the 2016–2021 period, principally because some men in their 50s who have become unemployed or have left the labor force as a consequence of the recession are not expected to return to the labor force. Several factors will be at work, CBO expects. As in past recessions, applications for Social Security Disability Insurance benefits have increased; although not all applications result in awards, most people who are granted benefits can be expected to remain outside the labor force perma-nently. About 2.8 million applications were made in 2009 and 2.9 million were made in 2010, up from about 2.2 million in 2007; awards also were up significantly.18 CBO estimates that the number of workers receiving benefits in 2010 was about 400,000 higher than had been anticipated before the recession. The increase in the number of disabled-worker beneficiaries attributable to the recession is expected to continue, peaking at about 750,000 in 2014, then falling to about 525,000 by 2021. The effect diminishes over time, as some of the growth in the number of beneficiaries will rep-resent people who would have applied later anyway, and as some recipients leave the Disability Insurance rolls because they have reached the full retirement age (and begin to collect Social Security benefits) or have died. By 2021, the increased number of beneficiaries reduces the potential labor force by about 425,000 compared with what it would have been otherwise; however, the effect on projected growth in the labor force is much smaller because nearly all of that effect is already incorporated in CBO’s estimate of the potential labor force in 2010.
In addition to the role of disability benefits, there are other recession-related effects on participation in the labor force. Some displaced workers who return to the labor force are unable to find stable employment. Those workers can be expected to experience further periods of unemployment, nonparticipation in the labor force, or both, before they retire. The sharp decline in wealth over the past several years, however, is likely to
18. See Social Security Administration, “Selected Data from Social Security’s Disability Program,” www.ssa.gov/OACT/STATS/dibStat.html.
14
CBO
induce some workers to delay retirement.19 Indeed, despite the recession, partic-ipation rates have continued to increase for people age 55 or older, rising from 38.6 percent in 2007 to 40.2 percent in 2010.
Comparison with Other ProjectionsBecause different forecasters use different time horizons, CBO compared its forecast with others’ forecasts for 2018, the latest year available for all four of the forecasts con-sidered. CBO’s projection of the labor force in that year—165.0 million people—is close to SSA’s and slightly above that of the commercial forecaster IHS Global Insight (GI) (see Figure 4 and Table 4). CBO’s projection, however, is nearly 2 million below that of the Bureau of Labor Statistics (BLS) and almost 4 million below that of the commercial forecaster Macroeconomic Advisers (MA). Because of its immigration projections, CBO anticipates a significantly higher rate of growth in the population than do the other forecasters.20 However, CBO’s projections tend to call for lower participation rates, mostly because no other organization’s forecast incorporates the effects of changes in marginal tax rates anticipated under current law. Without those effects, CBO’s projections for the participation rate would be about the same as those of SSA, slightly lower than those of BLS, but still substantially lower than those of MA.
CBO’s projections excluding the effects of the tax changes also are similar to the projections of SSA and BLS for men and women between the ages of 25 and 54—by far the largest age category (see Table 5).21 However, the three agencies’ projections differ markedly for some groups. One major difference is in the participation rate for teens. CBO projects a participation rate in 2018 of about 40 percent for people between the ages of 16 and 19, the same as SSA’s projection for that year but well above BLS’s projection of 34 percent. For older groups, CBO anticipates mostly lower participation rates than BLS. Compared with SSA’s projections, CBO anticipates higher participation rates for people between the ages of 55 and 64 but slightly lower rates for people age 65 or older.
19. For evidence that declining stock market wealth is associated with later retirement, see Courtney Coile and Phillip B. Levine, The Market Crash and Mass Layoffs: How the Current Economic Crisis May Affect Retirement, Working Paper 15395 (Cambridge, Mass.: National Bureau of Economic Research, October 2009), www.nber.org/papers/w15395; and Julia Lynn Coronado and Maria Perozek, Wealth Effects and the Consumption of Leisure: Retirement Decisions During the Stock Market Boom of the 1990s, Finance and Economics Discussion Series 2003-20 (June 2003), www.federalreserve.gov/PUBS/feds/2003/200320/200320pap.pdf.
20. SSA’s population projection does not take into account the downward adjustment to the civilian noninstitutional population of about 260,000 in January 2010. BLS’s projection takes into account neither that adjustment nor a downward adjustment of about 480,000 in January 2009. However, SSA, BLS, and MA project similar rates of growth in the population between 2010 and 2018. GI’s projections are based on a different measure of the population and on a participation rate defined for that population. Consequently, its projections of the population and the labor force participa-tion rate cannot be compared directly with those of CBO and the other forecasters.
21. The commercial forecasters do not publish forecasts by age and sex.
15
CBO
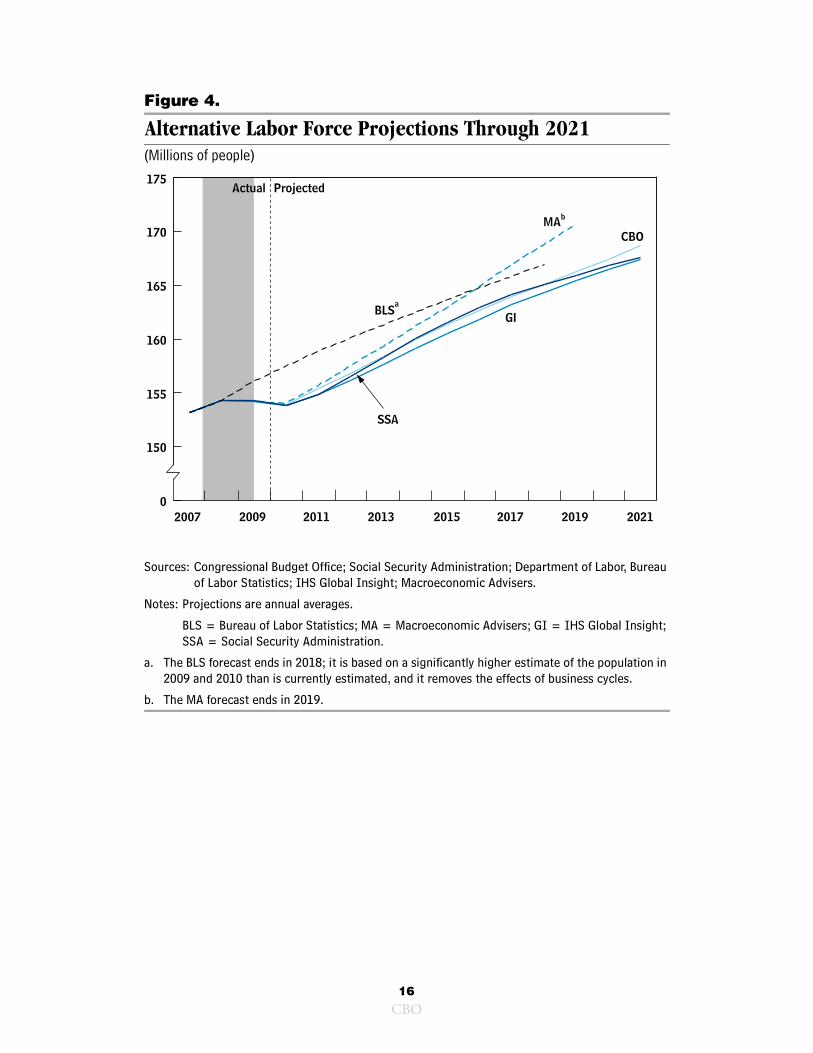
Figure 4.
Alternative Labor Force Projections Through 2021(Millions of people)
Sources: Congressional Budget Office; Social Security Administration; Department of Labor, Bureau of Labor Statistics; IHS Global Insight; Macroeconomic Advisers.
Notes: Projections are annual averages.
BLS = Bureau of Labor Statistics; MA = Macroeconomic Advisers; GI = IHS Global Insight; SSA = Social Security Administration.
a. The BLS forecast ends in 2018; it is based on a significantly higher estimate of the population in 2009 and 2010 than is currently estimated, and it removes the effects of business cycles.
b. The MA forecast ends in 2019.
2021201920172015201320112009
175
170
165
160
155
150
0
Projected Actual
CBO
SSA
GI BLSa
MAb
2007
16
CBO
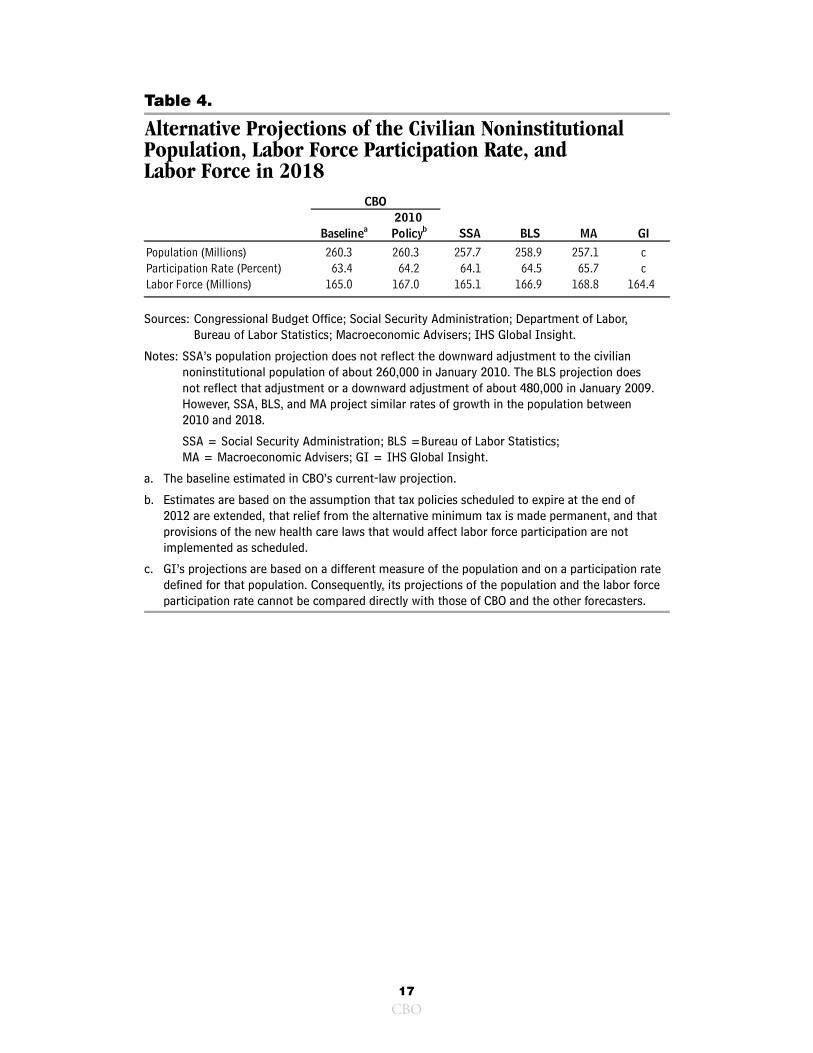
Table 4.
Alternative Projections of the Civilian Noninstitutional Population, Labor Force Participation Rate, and Labor Force in 2018
Sources: Congressional Budget Office; Social Security Administration; Department of Labor, Bureau of Labor Statistics; Macroeconomic Advisers; IHS Global Insight.
Notes: SSA’s population projection does not reflect the downward adjustment to the civilian noninstitutional population of about 260,000 in January 2010. The BLS projection does not reflect that adjustment or a downward adjustment of about 480,000 in January 2009. However, SSA, BLS, and MA project similar rates of growth in the population between 2010 and 2018.
SSA = Social Security Administration; BLS =Bureau of Labor Statistics; MA = Macroeconomic Advisers; GI = IHS Global Insight.
a. The baseline estimated in CBO’s current-law projection.
b. Estimates are based on the assumption that tax policies scheduled to expire at the end of 2012 are extended, that relief from the alternative minimum tax is made permanent, and that provisions of the new health care laws that would affect labor force participation are not implemented as scheduled.
c. GI’s projections are based on a different measure of the population and on a participation rate defined for that population. Consequently, its projections of the population and the labor force participation rate cannot be compared directly with those of CBO and the other forecasters.
Population (Millions) 260.3 260.3 257.7 258.9 257.1Participation Rate (Percent) 63.4 64.2 64.1 64.5 65.7Labor Force (Millions) 165.0 167.0 165.1 166.9 168.8 164.4
2010CBO
Baselinea SSA BLS MA GI
cc
Policyb
17
CBO
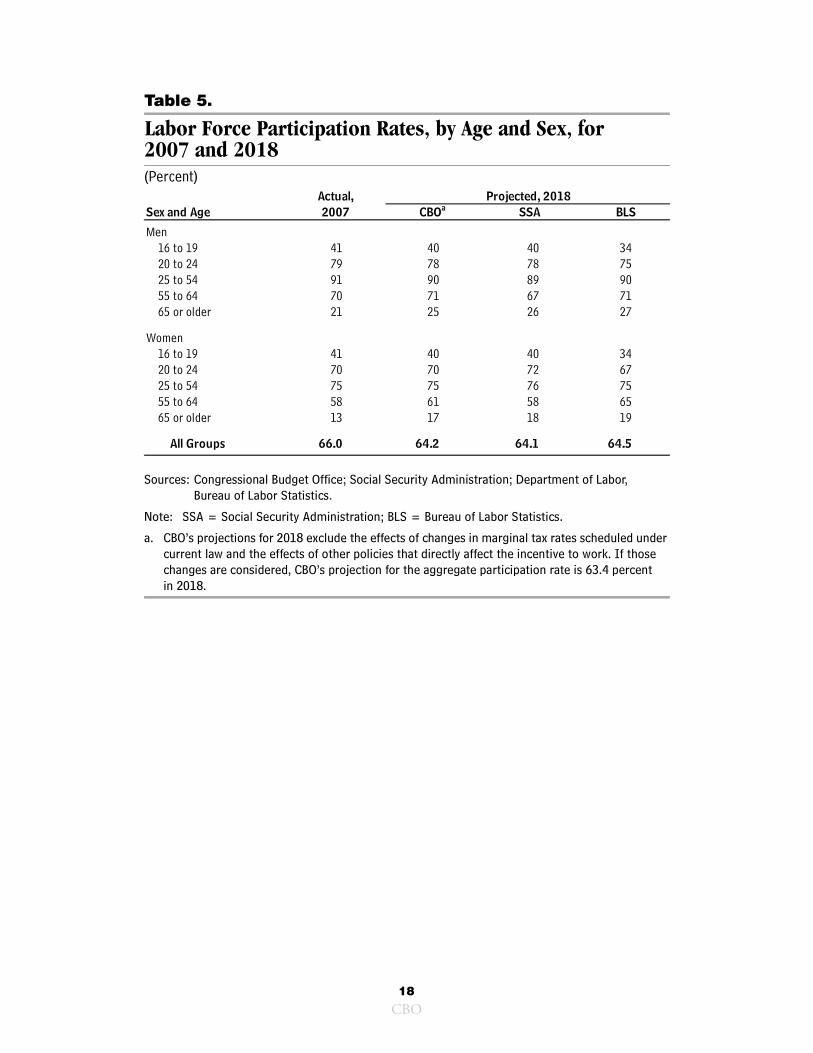
Table 5.
Labor Force Participation Rates, by Age and Sex, for 2007 and 2018(Percent)
Sources: Congressional Budget Office; Social Security Administration; Department of Labor, Bureau of Labor Statistics.
Note: SSA = Social Security Administration; BLS = Bureau of Labor Statistics.
a. CBO’s projections for 2018 exclude the effects of changes in marginal tax rates scheduled under current law and the effects of other policies that directly affect the incentive to work. If those changes are considered, CBO’s projection for the aggregate participation rate is 63.4 percent in 2018.
Sex and Age
Men16 to 19 41 40 40 3420 to 24 79 78 78 7525 to 54 91 90 89 9055 to 64 70 71 67 7165 or older 21 25 26 27
Women16 to 19 41 40 40 3420 to 24 70 70 72 6725 to 54 75 75 76 7555 to 64 58 61 58 6565 or older 13 17 18 19
All Groups 66.0 64.2 64.1 64.5
2007Projected, 2018
CBOa BLSSSAActual,
18
CBO

Appendix: Projecting Labor Force Participation
Within Demographic Groups
The Congressional Budget Office (CBO) develops labor force projections that reflect trends within each age and sex category, along with trends exhibited by particular cohorts relative to their predecessors. The specific age groups that underlie CBO’s analysis are 16–17, 18–19, all five-year age groups between 20 to 24 and 70 to 74, and 75 or older. The historical data on participation rates within those groups are compiled by the Bureau of Labor Statistics on the basis of the monthly Current Population Survey. In most cases, the data begin in 1976. However, data for the three youngest groups and for the combined categories 25–34, 35–44, 45–54, 55–64, and 65 or older are available back to 1948. This appendix concerns projections for the rate of labor force participation within broad demographic categories. The projections dis-cussed here do not consider changes in participation that are attributable to changes in marginal tax rates as projected under current law or to evolving conditions in the business cycle; adjustments for those effects are made at the aggregate level.
People Under 25Rates of participation in the labor force among male and female teens and young adults have declined sharply since 2000. That change appears mostly to reflect a long-term increase in school enrollment (particularly among teens in the summer months) and a declining tendency for students to work while they are enrolled in school.1 The participation of teens, and, to a lesser extent, of young adults, also is particularly sensitive to cyclical conditions.
Participation declined sharply among people between the ages of 16 and 19 during and shortly after the 2001 recession and never rebounded; the rate fell from 52.0 per-cent in 2000 to 41.3 percent in 2007 (see Figure A-1). As the recent recession took hold, the rate declined again, to 37.5 percent in 2009 and 34.9 percent in 2010. CBO
1. For an analysis of declining teen participation between the late 1990s and 2004, see Congressional Budget Office, What Is Happening to Youth Employment Rates? Background Paper (November 2004).
CBO
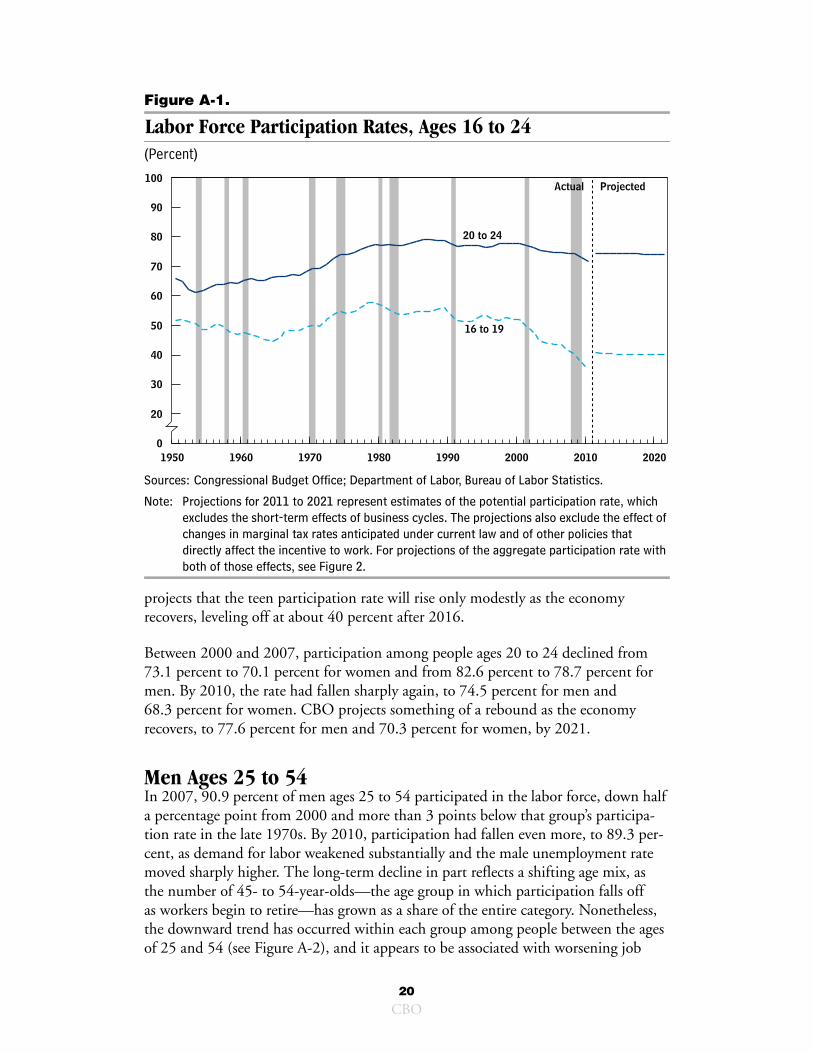
Figure A-1.
Labor Force Participation Rates, Ages 16 to 24(Percent)
Sources: Congressional Budget Office; Department of Labor, Bureau of Labor Statistics.
Note: Projections for 2011 to 2021 represent estimates of the potential participation rate, which excludes the short-term effects of business cycles. The projections also exclude the effect of changes in marginal tax rates anticipated under current law and of other policies that directly affect the incentive to work. For projections of the aggregate participation rate with both of those effects, see Figure 2.
projects that the teen participation rate will rise only modestly as the economy recovers, leveling off at about 40 percent after 2016.
Between 2000 and 2007, participation among people ages 20 to 24 declined from 73.1 percent to 70.1 percent for women and from 82.6 percent to 78.7 percent for men. By 2010, the rate had fallen sharply again, to 74.5 percent for men and 68.3 percent for women. CBO projects something of a rebound as the economy recovers, to 77.6 percent for men and 70.3 percent for women, by 2021.
Men Ages 25 to 54In 2007, 90.9 percent of men ages 25 to 54 participated in the labor force, down half a percentage point from 2000 and more than 3 points below that group’s participa-tion rate in the late 1970s. By 2010, participation had fallen even more, to 89.3 per-cent, as demand for labor weakened substantially and the male unemployment rate moved sharply higher. The long-term decline in part reflects a shifting age mix, as the number of 45- to 54-year-olds—the age group in which participation falls off as workers begin to retire—has grown as a share of the entire category. Nonetheless, the downward trend has occurred within each group among people between the ages of 25 and 54 (see Figure A-2), and it appears to be associated with worsening job
20202010200019901980197019601950
100
90
80
70
60
50
40
30
20
0
Projected
20 to 24
16 to 19
Actual
20
CBO

Figure A-2.
Labor Force Participation Rates for Men and Women, Ages 25 to 64(Percent)
Sources: Congressional Budget Office; Department of Labor, Bureau of Labor Statistics.
Note: Projections for 2011 to 2021 represent estimates of the potential participation rate, which excludes short-term effects of business cycles. The projections also exclude the effect of changes in marginal tax rates anticipated under current law and of other policies that directly affect the incentive to work. For projections of the aggregate participation rate with both of those effects, see Figure 2.
20202010200019901980197019601950
100
90
80
70
60
50
40
30
20
0
Projected25 to 34 35 to 4445 to 54
55 to 64
20202010200019901980197019601950
100
90
80
70
60
50
40
30
20
0
Projected
25 to 34
35 to 44
45 to 54
55 to 64
Actual
Actual
Men
Women
21
CBO
opportunities for men with fewer work skills, particularly in manufacturing, and the interaction of those worsening opportunities with policies that have increased the availability of Disability Insurance benefits.2
In projecting participation rates for men between the ages of 25 and 54, CBO consid-ered both how rapidly the declining trend will proceed and how much of the recent sharp decline represents cyclical factors that should reverse as the economy recovers. For the 25-to-34 age group, whose participation rate has both exhibited the most pro-nounced continuing downward trend and declined especially sharply since the reces-sion began, CBO projects a cyclical rebound followed by a gradual downward trend. For people between the ages of 35 and 54, whose participation rate trend had shown signs of flattening before the onset of the recession, participation is expected to recover to about its prerecession rate and then to flatten. Overall, the participation rate for men between the ages of 25 and 54 will rebound by 2021, but only to about the 2008 rate of 90.5 percent, CBO projects.
Women Ages 25 to 54The participation rate among women between the ages of 25 and 54 surged from just over 40 percent of the population at the end of the 1950s to about 74 percent at the end of the 1980s. That rate continued to rise in the 1990s, although at a much slower pace; it has been edging downward since 2000 (see Figure A-2 on page 21). Much of the increase during the second half of the 20th century reflects a generational shift, as women of the baby-boom generation began to participate in the labor force at signifi-cantly higher rates than their predecessors did. That effect has mostly run its course, although it continues to influence participation among women older than 55. Women’s wages relative to those of men have risen despite the increased supply of women in the workforce.3 Those higher wages also have increased participation among women.
The reasons for the decline in women’s rate of participation in the labor force since 2000 are not entirely clear. Early in the decade, the decline was fairly broad-based, but it was particularly pronounced among highly educated women, those who were mar-ried to high-earning men, and those who were mothers of small children.4 The expla-nations advanced for the change include increased household wealth and shifting preferences toward higher fertility and toward caring for one’s own children instead of
2. See David H. Autor and Mark G. Duggan, “The Rise in the Disability Rolls and the Decline in Unemployment,” Quarterly Journal of Economics, vol. 118, no. 1 (February 2003), pp. 157–206, and Congressional Budget Office, Social Security Disability Insurance: Participation Trends and Their Fiscal Implications, Issue Brief (July 2010).
3. See Congressional Budget Office, Changes in the Distribution of Workers’ Hourly Wages Between 1979 and 2009 (February 2011).
4. See Katharine Bradbury and Jane Katz, “Women’s Rise: A Work in Progress,” Regional Review, Federal Reserve Bank of Boston, vol. 14, no. 3 (2005), pp. 58–67, www.bos.frb.org/economic/nerr/rr2005/q1/section5a.pdf.
22
CBO
placing them with child care providers.5 The participation rate for women between the ages of 25 and 54 has remained roughly unchanged since 2007, averaging 75.2 percent in 2010. That pattern is consistent with the view that rising stock market wealth might have contributed to the earlier decline in participation; when the market fell, participation stopped falling.
Another factor that could be dampening participation of women in that age group is the growing share of recent immigrants in the population. Although male immigrants tend to have participation rates that are higher than those for their native-born counterparts, female immigrants’ participation rate tends to be lower.6 Indeed, some evidence suggests that changes in individual characteristics, most notably the percent-age of Hispanics, could explain much of the decline in participation of 25- to 54-year-old women between 2000 and 2005.7
For women between the ages of 25 and 54, CBO projects a participation rate in 2021 of 75.1 percent—slightly below its average rate during the last expansion. Participa-tion rates for younger subgroups will be roughly constant, according to CBO’s projec-tions, as continued shifts in the demand for labor, increased flexibility in parental leave policies, and perhaps increased telecommuting opportunities boost participation while the growing share of immigrants holds participation down. Participation among women in the 45-to-54 age group is expected to edge downward, in part because the cohorts entering that age group have shown slightly less attachment to the labor force than have their immediate predecessors.
People 55 or OlderThe expanding share of the population age 55 or older will substantially dampen growth in the labor force throughout the next decade, according to CBO’s projec-tions. However, labor force participation rates within older groups have been rising throughout the past decade as a long historical trend toward early retirement among men has reversed somewhat and as women turning 55 have exhibited greater attachment to the workforce throughout their lives than have earlier cohorts. The participation rate for men between the ages of 55 and 64, which was above 80 percent in the 1960s, declined to 66 percent in the mid-1990s and rebounded to about 70 percent, where it has stayed for the past several years (see Figure A-2 on page 21). Participation among women in that age group surged from just above 40 percent in
5. For evidence on shifts in fertility among college-educated women, see Qingyan Shang and Bruce A. Weinberg, Opting for Families: Recent Trends in the Fertility of Highly Educated Women, Working Paper 15074 (Cambridge, Mass.: National Bureau of Economic Research, June 2009), www.nber.org/papers/w15074.
6. See Congressional Budget Office, The Role of Immigrants in the U.S. Labor Market (November 2005), and The Role of Immigrants in the U.S. Labor Market: An Update (July 2010).
7. See Julie L. Hotchkiss, “Changes in Behavioral and Characteristic Determination of Female Labor Force Participation, 1975–2005,” Federal Reserve Bank of Atlanta, Economic Review, vol. 91, no. 2 (Second Quarter 2006), pp. 1–20, www.frbatlanta.org/filelegacydocs/erq206_hotchkiss.pdf.
23
CBO
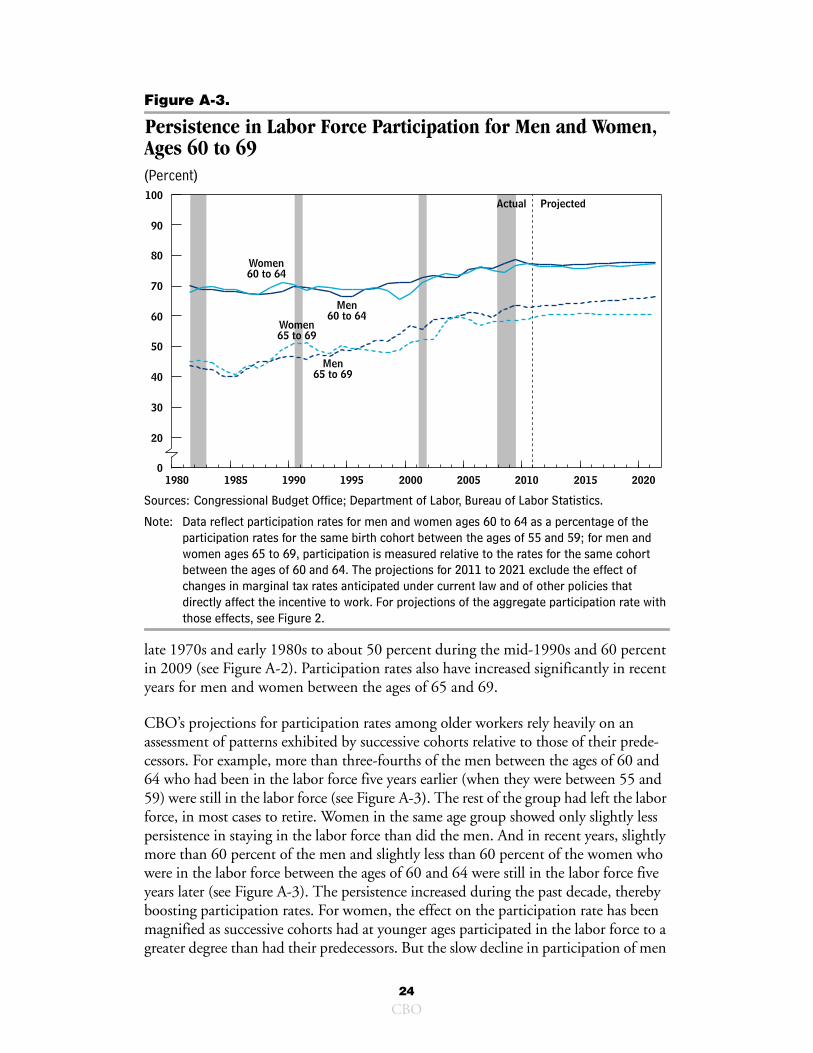
Figure A-3.
Persistence in Labor Force Participation for Men and Women, Ages 60 to 69(Percent)
Sources: Congressional Budget Office; Department of Labor, Bureau of Labor Statistics.
Note: Data reflect participation rates for men and women ages 60 to 64 as a percentage of the participation rates for the same birth cohort between the ages of 55 and 59; for men and women ages 65 to 69, participation is measured relative to the rates for the same cohort between the ages of 60 and 64. The projections for 2011 to 2021 exclude the effect of changes in marginal tax rates anticipated under current law and of other policies that directly affect the incentive to work. For projections of the aggregate participation rate with those effects, see Figure 2.
late 1970s and early 1980s to about 50 percent during the mid-1990s and 60 percent in 2009 (see Figure A-2). Participation rates also have increased significantly in recent years for men and women between the ages of 65 and 69.
CBO’s projections for participation rates among older workers rely heavily on an assessment of patterns exhibited by successive cohorts relative to those of their prede-cessors. For example, more than three-fourths of the men between the ages of 60 and 64 who had been in the labor force five years earlier (when they were between 55 and 59) were still in the labor force (see Figure A-3). The rest of the group had left the labor force, in most cases to retire. Women in the same age group showed only slightly less persistence in staying in the labor force than did the men. And in recent years, slightly more than 60 percent of the men and slightly less than 60 percent of the women who were in the labor force between the ages of 60 and 64 were still in the labor force five years later (see Figure A-3). The persistence increased during the past decade, thereby boosting participation rates. For women, the effect on the participation rate has been magnified as successive cohorts had at younger ages participated in the labor force to a greater degree than had their predecessors. But the slow decline in participation of men
2020 2015 2010 2005 2000 1995 1990 1985 1980
100
90
80
70
60
50
40
30
20
0
Projected Actual
Women 60 to 64
Men 60 to 64
Women 65 to 69
Men 65 to 69
24
CBO
during their prime working years (such that more men than in the past have already left the labor force in their 50s) has offset some of the increased participation that results from greater persistence among men who have worked into their late 50s.
There is no single explanation for the recent increase in labor force participation among older workers. Among the possible contributors is improved health, both because it makes people better able to continue working and because associated increases in life expectancy may lead many workers to prefer to work longer in order to accumulate enough savings to finance what they anticipate will be a longer period of retirement. A shift toward fewer jobs requiring physical strength also could be con-tributing by allowing people with diminishing strength to stay in the labor force lon-ger. In addition, several institutional changes have increased incentives for people to retire later in life. Private pensions increasingly have shifted away from defined-benefit to defined-contribution plans.8 Workers who are covered by defined-benefit plans often have little to gain by remaining on the job once the maximum potential benefit is attained (frequently at age 65), so the incentive to retire at that point is strong. No comparable incentives exist for workers with defined-contribution plans. At the same time, although many employers offer health insurance to current active employees, employer-provided health insurance for retired workers is becoming less common.9 Thus, there has been a growing incentive for people to remain in the workforce until at least the age of 65 and the beginning of eligibility for Medicare.10
Finally, several changes in the Social Security system appear to have boosted participa-tion among older workers. The increase in the full retirement age from 65 to 66, along with the resulting effective reduction in benefits associated with early retire-ment, has encouraged some workers to delay claiming Social Security and remain in the labor force longer.11 In addition, the retirement earnings test, which restricted the ability of recipients who are 69 or younger to receive Social Security benefits while continuing to work, was eliminated in 2000 for those who had reached the full
8. Benefits paid by defined-benefit plans generally are based on a formula that is tied to participants’ length of service and salary history; employees usually do not contribute. Retirees who have defined-contribution plans receive benefits that depend on the total assets accrued in individual accounts that have been funded by deposits from employees and their employers.
9. See Paul Fronstin, Implications of Health Reform for Retiree Health Benefits, EBRI Issue Brief 338 (Washington, D.C.: Employee Benefit Research Institute, January 2010), www.ebri.org/pdf/briefspdf/EBRI_IB_01-2010_No338_RetHlth1.pdf. In 2008, the employers of 22 percent of private-sector workers were offering health benefits to retirees who were not old enough to enroll in Medicare, down from 31 percent in 1997. By 2009, 28 percent of employers with 500 or more employees offered health insurance to early retirees, compared with the 46 percent that had done so in 1993. Most of the decline among the latter group of employers occurred during the 1990s.
10. This effect is, however, expected to diminish somewhat with the implementation of the Patient Protection and Affordable Care Act of 2010 (P.L. 111-148).
11. See Jae Song and Joyce Manchester, Have People Delayed Claiming Retirement Benefits? Responses to Changes in Social Security Rules, Congressional Budget Office Working Paper 2008-04 (May 2008).
25
CBO
retirement age. That change has encouraged some older workers to remain in the labor force even after they have begun to collect benefits.12
The trend toward later retirement continues in CBO’s projections, although at a sig-nificantly slower pace than in the past decade. Declining lifetime labor force attach-ment, as indicated by falling participation rates for men in their late 40s and early 50s, exerts downward pressure on participation for people between the ages of 55 and 64 (although not for people 65 or older), leaving the participation rate in 2021 virtually unchanged from the 70 percent recorded in 2010. However, participation among men between the ages of 65 and 69 rises from 36.5 percent in 2010 to 40 percent in 2021. CBO projects that participation in that period will remain at 68 percent for women between the ages of 55 and 59 but will rise from 51 percent to 52 percent for women ages 60 to 64 and from 27 percent to 32 percent for women ages 65 to 69. Those projections receive a slight boost from the scheduled increase in the full retire-ment age from 66 to 67 beginning with the cohort born in 1955; the impact of that change will probably become substantially larger in the decade after 2021.
12. See Gary V. Englehardt and Anil Kumar, “The Repeal of the Retirement Earnings Test and the Labor Supply of Older Men,” Journal of Pension Economics and Finance, vol. 8, no. 4 (October 2009), pp. 429–450; and Jae G. Song and Joyce Manchester, “New Evidence on Earnings and Benefit Claims Following Changes in the Retirement Earnings Test in 2000,” Journal of Public Economics, vol. 91, nos. 3–4 (April 2007), pp. 669–700.
26
CBO