Case Study on Nepal prepared by PUSHKAR BAJRACHARYA ...
30
United Nations Conference on Trade and Development Ad Hoc Expert Meeting in preparation for the Mid-term Review of the Programme of Action for the Least Developed Countries for the Decade 2001-2010 Case Study on Nepal* prepared by PUSHKAR BAJRACHARYA Kathmandu, Nepal, May 2006 *The opinions expressed in this report are those of the author and do not necessarily reflect the views of the UNCTAD or of the organizations and institutions with which the author may be connected. The document is reproduced in the form and language in which it has been received. The designations and terminology employed and the presentation of material in this report do not imply the expression of any opinion whatsoever on the part of the United Nations concerning the legal status of any country, territory, city or area or of the authorities or of its frontiers or boundaries. ____________________ UNCTAD/LDC/MISC/2006/3
Transcript of Case Study on Nepal prepared by PUSHKAR BAJRACHARYA ...

United Nations Conference on Trade and Development
Ad Hoc Expert Meeting in preparation for the Mid-term Review
of the Programme of Action for the Least Developed Countries
for the Decade 2001-2010
Case Study on Nepal*
prepared by
PUSHKAR BAJRACHARYA
Kathmandu, Nepal,
May 2006
*The opinions expressed in this report are those of the author and do not necessarily reflect the views of the UNCTAD or of the organizations and institutions with which the author may be connected. The document is reproduced in the form and language in which it has been received. The designations and terminology employed and the presentation of material in this report do not imply the expression of any opinion whatsoever on the part of the United Nations concerning the legal status of any country, territory, city or area or of the authorities or of its frontiers or boundaries.
____________________
UNCTAD/LDC/MISC/2006/3
Chapter I Introduction 1.1 Background and Review of the Overall Economy:
Nepal’s economy, despite showing some signs of improvement in the 1990s, has not really been successful in making any substantive change in the structure of poverty and deprivation. The Eighth Five Year Plan (1993-97) recorded a growth rate of nearly 5 per cent, which theoretically, should have reduced the poverty level by approximately 5 percentage points, on the assumption that inequality has not increased. However, the Nepal Living Standard Survey (CBS 1996) indicated that about 42 per cent of the population was living below the estimated poverty level, although the figures are higher than earlier survey estimates (NRB 1988, NPC 1978). In addition, large segments of the poor are hardcore poor, barely able to eke out a subsistence on fragile lands and a vulnerable eco-system. Large areas of the country lack even the most basic infrastructure developments and essential services. There are also wide variations based on a rural-urban divide, geography, ethnic groups and occupational castes. To address the situation, the Ninth Five-Year Plan (1997-2002) and the Tenth Five-Year Plan ( 2002-2007 ) identified poverty alleviation as the single most important objective; but this too, has not yielded the desired effects in terms of poverty reduction, due to the lack of a focused approach and a clear strategy. The situation was further aggravated by political instability, the growing insurgency and, regressive tendencies in some aspects of governance.
Economic development is a daunting task in Nepal, given its limited resource endowment, its landlocked location, its rugged terrain and, its underdeveloped economic and social infrastructure. The economic development efforts of more than four decades, starting from the first economic development plan started in 1956, have yielded an average growth of around four per cent per annum which, if discounted by the population growth rate of about 2.3 per cent during the same period, gives a per capita income growth of less than two per cent per annum. Growth in the industrial sub-sector may be a little bit higher, but it basically depicts a poor development status. The euphoria following the transition to a democratic government in 1990, facilitated by wide-ranging economic reforms in the early nineties, contributed to the acceleration of the economy and, brought about improvements in some key sectors, such as trade, investment and foreign exchange regimes. The ensuing political instability following the mid-nineties, slowed down development and, contributed to increasing politicization, the weakening of administrative and institutional capacity, increasing problems with governance, poor economic policies and, the deterioration of law and order, culminating in the emergency situation in connexion with the insurgency problem. During the last fifteen years or so, a significant change was made in policy direction. Before the nineties, Nepal basically pursued inward-looking policies primarily focusing on import substitution strategies. The introduction of structural reform programmes opened an era of economic reforms. Broad-based economic reforms were initiated in 1992 encompassing liberalization of the trade and foreign exchange regimes, opting for convertibility in current accounts, removing trade barriers, relaxing the industrial licensing system and, the launching of financial sector reforms and privatization programmes. The shift in economic policies has encouraged openness and, the domestic market has become more competitive.
2
Despite these endeavours, Nepal remains one of the poorest countries in the world with about 31 per cent of the population living below the poverty level. Nepal's economy is still dominated by agriculture. In 1998/99, out of about 57 per cent of the population classified as economically active, 76 per cent were engaged in agriculture, which has the lowest value addition per worker. This is only about one fourth in comparison to the industrial sector. The contribution of non-agriculture activities to the GDP has gradually increased in recent years, while the contribution of agriculture to GDP went down to less than 40 per cent in 2003/04, from 48 per cent in 1990/91. Economic reforms have contributed positively to the national economy. The average annual growth rate of GDP increased from around 3.0 per cent in the 1970s and early 1980s to 5.2 per cent during 1985-1996. Employment and value-addition in the manufacturing sector have also grown. Manufacturing employment rose 36 per cent in the first few years after the reforms and, the growth rate of manufacturing added value increased from 5.3 per cent to 13 per cent. Gross national savings improved from around 11 per cent to over 16 per cent during the decade. However, these trends could not be maintained after 1996. GDP recorded a negative growth of 0.4 per cent in 2001/02. The critical factors affecting the situation were problems with foreign trade policies in key export markets, poor implementation of the reforms, bureaucratic burdens, continued political and policy uncertainty and, more importantly, growing insecurity and insurgency in the country. The economy per se is not an encouraging scenario, with the growth rate about the same as the population growth during the last four or five years, meaning that per capita income has stagnated. Growing insurgency, political instability and policy inconsistency, following initial efforts of economic reforms, the lack of infrastructure facilities and, the high costs thereof, and a weak civil service delivery, have all inhibited a fuller growth potential. Thus, Nepal is passing through a phase of economic doldrums and, is unable to take advantage of the exemplary growth of its two big neighbours, China and India. The infrastructure development in the country is still limited, although widespread progress has been reported. Initiatives on infrastructure development began only after 1950, the year the oligarchic Rana regime was overthrown and democratic politics were introduced. However, most parts of the country still remain deprived from access to any sort of connectivity infrastructure, although in some areas the pace of development has been quite appreciable. Roads remain the single most important means of access in this landlocked mountainous country but, road building itself is not an easy task in such a rugged physical terrain. Therefore, connectivity is limited even within the domestic environment and, this does not augur well for external connectivity. The total road length has reached an estimated 18,000 km but, a large part of the country has yet to be connected with modern transport means. Vast areas, especially in the northern part of Nepal, are still deprived of any viable and easy connectivity, making it essential to walk for several days from the nearest road-head as the only alternative. Ten districts out of 75 still do not have any road access. In the communications sector, the number of telephone lines has increased several fold, with vast rural areas now receiving telephone and cellular coverage which originally started in major urban areas and along highways. Although communications have grown fast, they have generally tended to be concentrated in urban areas. Low incomes, a low level of literacy and,
3

low access to electricity, among other factors, have to date limited the expansion of information and communication technologies and, perhaps widened the digital divide between the social groups. Radio and television coverage are still not nation-wide, although the number of privately operated FM radio stations has risen to more than 20. The total electricity available is around 600 megawatts. Electricity is available to just 40 per cent of the country's population, mostly urban and semi-urban but, only 5 per cent of the population in rural areas has access to electricity. International connectivity by air is limited to operations from one international airport at Kathmandu. However, the domestic air transport network is extensive and plays an important role for many parts of the country but, remains unaffordable for much of the population. Rail linkage in the form of cargo movement has only reached Birgunj ICD since 2004.
The challenges in Nepal are not only characterized by income poverty. Large irregularities appear to exist in social indicators when comparing the various geographic regions and socio-economic groups. Taking the example of literacy, rural dwellers are twice as likely to be illiterate than urban dwellers and, illiteracy is highest among the lower castes and disadvantaged groups. In terms of other indicators, such as access to essential services like health, education and safe drinking water, the rural regions tend to be significantly behind, with disadvantaged groups still having less access. Since disadvantaged groups figure prominently in the incidence of both income and capability-poverty, it is essential that the Government’s poverty reduction programmes address the factors that remove such inequalities. In Nepal, social exclusion is primarily driven by feudal institutions and historic processes, that uphold or exacerbate income and capability poverty, on the basis of gender, ethnicity, caste and religion. But, the problem is also driven in some instances, where the voice of the rural poor is muted or virtually excluded from the policy dialogue itself, due to regressive trends and on-going troublesome socio-political inclinations (i.e. poor or weak governance at various levels).
These anomalies apart, the increasingly volatile situation of the country demands an overhauling of approaches and strategies to really focus on poor and disadvantaged groups and, to improve the lives of the most deprived. It is argued that a government that works for the people should be able to develop a policy framework that reflects the voice of the people, can meet poverty reduction targets and, can raise, allocate and account for resources in accordance with those pro-poor policies. In this respect, donor agencies have clamoured for integrated and comprehensive strategies for poverty reduction and, the Government’s recognition of this has helped to create a more congenial environment in which to focus development activities on poverty reduction.
Governance issues have been a major factor undermining the effectiveness of development efforts. They have taken many forms, including excessive political interference and increasing corruption (World Bank 2000). Some of the main examples are political interference in government appointments, the frequent transfer of civil servants and project officials, political involvement even in simple procurement decisions, misuse and diversion of public funds for unauthorized purposes and, cabinet decisions serving parochial interests (ibid.:iii). In this environment, project implementation has suffered and desired goals have not been reached. This has clearly heightened the need for good governance. The recognition of it and, defining it as a strategy, is a major point of departure in the Tenth Plan (PRSP). The potential for better governance and poverty reduction has been further facilitated by the Medium Term Expenditure Framework (MTEF), defined for three years (2003-05). The MTEF has helped to
4
prioritize activities and to be selective in view of the real needs rather than incorporating projects and programmes based on political decisions. The Immediate Action Plan (IAP) designed for 2003-04, is expected to further orient development efforts towards the most tangible needs. All these have tried to reflect the MDGs and, the Programme of Action (PoA) agreed for LDCs in Brussels.
Thus, two things are happening side-by-side. On the one hand, the overall policy framework has become more encouraging but, on the other hand, there are some glaring differences in approach and intent between sectors. Such differences sow confusion and result in poorly defined programmes or, in strategic difficulties in meeting the goals of otherwise well-designed programmes.
1.2 Objectives: The basic objective of this study is to make a mid-term review of the Programme of Action (PoA for LDCs) in Nepal. The specific objectives are:
1. to assess progress in the implementation of the PoA in Nepal; 2. to review the overall socio-economic performance of the country; 3. to analyse international support and assistance; 4. to identify results achieved; 5. to identify challenges and issues and lessons learnt and, 6. to provide policy recommendations.
1.3 Methodology: First of all, relevant literature e.g. the Brussels Programme of Action, Nepal’s Programme of Action, and studies, surveys and progress reports were collected and reviewed. Efforts were made to collect data for all identified indicators Discussions were had with a number of officials, individuals and agencies as specified in the Annex. On the basis of these, this report was prepared. 1.4 Limitations of the study:
• In view of the paucity of data and weak information systems, data for a number of indicators was not available.
• In many cases, data has to be presented for years other than the mid- term review year, (2005) as surveys or information collection were available for different periods or years.
• The vulnerable situation of the country delayed the data collection process significantly.
Chapter II Review of Policies, Actions and Strategies 2.1 Introduction The Programme of Action (PoA) for the Least Developed Countries (LDCs) for the decade 2001 – 2010 is an outcome of the Brussels Declaration of May 2001. The basic objective of the PoA is to achieve substantial progress in meeting the Millennium Development Goals
5
(MDGs) of halving poverty by 2015 and, promoting sustainable development in the LDCs, so that special efforts can be made to upgrade the LDCs and, mainstream them into accelerated development. The priority issues defined in the PoA are: poverty reduction, gender equality, employment generation, governance, capacity building, special problems faced by landlocked and small island developing countries and, the LDCs affected by conflict. The PoA contains 30 international development goals, including the MDGs. The key underlying principle is to achieve results. It is expected that LDCs will be able to achieve development both in human and economic terms in a more focussed way. To implement the PoA, Nepal has constituted a high level National Forum. Its basic task is to monitor and guide its implementation. The National Planning Commission (NPC) Member responsible for the Macro Economic Sector is the chair of the Forum and, it has representatives from Government ministries, civil society, academia and non-governmental organizations. The NPC Member has also been designated as the National Focal Point. The important steps Nepal has taken are to integrate the PoA into the tenth national development plan or, PRSP/(2002 – 07) – the country’s main plan and policy document for the period. 2.2 Implementation of the Brussels Programme of Action for LDCs in Nepal The major goals include attaining an annual GDP growth rate of at least 7 per cent, culminating in 7.5 per cent by 2010; increasing investment to GDP ratio to 25 per cent annually and, halving the proportion of people living in extreme poverty and hunger by 2015. With an overarching goal of poverty reduction, Nepal prepared and implemented its 10th national development plan (2002 – 07), which is also the national Poverty Reduction Strategy Paper (PRSP). The PRSP aims to reduce absolute poverty from 38 per cent in 2001 to 30 per cent by the end of the plan. The PRSP is based on four strategic pillars: (i) high, sustainable and broad-based economic growth; (ii) social sector development (iii) target programmes and local development and (iv) good governance. In implementing the four-pillar strategy, the Plan also stresses strategic cross-cutting approaches with regard to: (i) redefining the role of the state to be more as a facilitator; (ii) promoting private sector development; (iii) supporting greater social diversity in the structure of governance at all levels; and (iv) accelerating the decentralization process. To implement the PRSP, the Government has been preparing annually, a three-year Medium Term Expenditure Framework (MTEF), with detailed actions and project specific allocations, prioritizing them in such a way that more effective activities are included, an annual programme for budget implementation and, an immediate action Plan covering priority policies and actions to be addressed, with high emphasis in the annual programme. To attain high and broad-based economic growth, the PRSP emphasizes agriculture, including agro industries, tourism, infrastructure (irrigation, roads, power and communications) and exports. To develop agriculture, implementation will be based on the APP (Agriculture Perspective Plan, 1995 – 2015) and, for the non-agriculture sector, focus is on promoting the role of the private sector and reducing the role of the state in economic activities. The role of the state is emphasized as enhancing facilitation and creating an environment more conducive to private sector development. Pillar II encompasses the social sector. Social sector programmes mainly consisting of health, education and drinking water, have been given due emphasis. Investment in the sector is considerably increased to improve human goals and the programme in the rural areas. The PRSP advocates participatory and inclusive development, including social inclusion. In order
6
to attain these, the PRSP places special emphasis on focussing on the target groups under Pillar III. It is a two-pronged strategy, to achieve growth by bracketing the base of growth, as well as socially disadvantaged and excluded groups. Under this pillar, programmes are implemented which target disadvantaged groups of the population, including women. Positive discrimination in public sector opportunities, scholarships for poor, girls and scheduled casts, priority to conflict affected people in supplying labour to foreign markets, loans to the poor to enter the foreign labour market, emphasis on the involvement of women in consumer committees and development works, are some examples to promote social inclusion and reduce undesired but persisting gaps. Nepal has continued the reform measures that started in the mid 1980s and became more focussed in the early nineties. For Macro Economic Stability, the PRSP incorporates a macroeconomic framework which emphasizes (i) maintaining fiscal discipline, (ii) ensuring the efficient use of public resources, and (iii) sustaining monetary and external stability. The Government has implemented further financial reforms, improved public expenditure management, strengthened anti-corruption institutions and, improved the financial sector regulatory framework. Financial sector reform has been undertaken to improve the performance of loss making public financial institutions. Agriculture and Agro Industries The Agriculture Perspective Plan (APP) implemented by the Government since 1997 remains the core of the agricultural growth strategy. The APP envisages diversification and commercialization of agriculture by increasing the output of cereals in the Tarai, the production of fruits and high value crops including Non-Timber Forest Products (NTFPs) and, livestock products in the hills and mountain regions of the country. This is to be achieved by managing four key inputs, namely need-based research and extension, easier fertilizer supply, controlled year-round irrigation, linkage of potential production pockets to market through rural agricultural roads and, the expansion of rural electrification. The PRSP has emphasized the necessity to intensify the implementation of the APP. Some important ongoing activities in the sector are:
The focussing of research and extension towards agricultural commercialization and diversification.
Mobilizingthe private sector and NGOs as partner service providers on a contract basis.Monitoring, quality control, and regulation of inputs supplied by the private sector.
The transfer of extension services to local bodies and, veterinary services to the private sector.
Converting agricultural farms/stations into resource centres.The promotion of cooperative and contract farming.
The development of market centres. The integration of rural roads, irrigation and micro-irrigation, for agricultural
intensification. Mainstreaming women and disadvantaged groups into farmer group formations and, in
developing enterprises. Supplying food in food deficit remote districts to maintain food security.
In spite of the policy initiatives, agriculture diversification and commercialization have yet to occur in a substantive manner. There is a need to bring efficiency into marketing by accessing proper infrastructure and support services.
7
2.3 Good governance The PRSP has recognized that development and the attainment of goals cannot be done without improving governance. The PRSP has included this as the fourth pillar under which, various efforts have been made to uphold the rule of law, improve service delivery and, efficiently utilize limited resources. The fundamental goal is to make the government sector accountable, efficient and inclusive. The proposed activities include civil service reform, decentralization (including fiscal devolution) and corruption control. The basic purpose is to strengthen the institutions. Actions are being initiated to right size bureaucracy, to devolve to local bodies, to strengthen institutional capacity and, to combat corruption. A positive discrimination policy has been adopted to increase the representation of women, disadvantaged groups, Janajatis (indigenous people) and disabled populations in the civil service, political, economic and social spheres. Performance-based management systems are being piloted in three ministries: the Ministry of Agriculture and Cooperatives (MOAC), the Ministry of Education and Sports (MOES) and, the Ministry of Health and Population (MHP), which are core service delivery ministries. A permanent body has been established to review the salary structure and pay policy of civil servants and, to recommend salary increases tied to the consumer price index. A contributory pension scheme has been introduced to make the pension system sustainable. Attempts are also being made to develop and place improved MIS to assist the overall management system. Nepal has made significant efforts in the area of decentralization with the enactment of the Local Self-Governance Act 1999 (LSG) and its Regulations, 2000. A full-scale devolution policy has been designed compatible with the Act. Devolution in key sectors such as agriculture and livestock extension, primary health care, basic education, and infrastructure development, has already started in all 75 districts. Accordingly, management responsibility of a number of village agriculture extension activities, sub-health posts, and primary schools, is being handed over to local communities. On the basic of this experience, the Government has piloted from 2005/6 “full” devolution in 14 districts. Under this, all the district level activities and district development offices of the Government, including its resources are being handed over to district public offices –DDC. In view of persisting instability, this effort has to be seen from the implementation perspective. Furthermore, the legal anomalies between the LSG and other Acts are yet to be resolved. Hence, the true pace of decentralization has not been achieved. The country has an impressive legal framework to combat corruption, with a set of anti-corruption acts (Corruption Prevention Act 2002, Commission for the Investigation of Abuse of Authority (CIAA) Act, Second Amendment 2002, Impeachment Act 2002, Act to regulate financing of political parties, 2002) in place. But enforcement and compliance with the laws still remains weak, due to inadequate institutional and technical strengths and, the willpower to implement. Apart from the above, some other notable measures have been taken:
(i) The establishment of a National Human Right Commission. (ii) Promoting industrial peace, healthy and safe working environments for labourers
and, the elimination of child labour.
8
(iii) The amendment of the national country code on women's right to property and, a conditioned right to abortion.
(iv) The identification of 59 indigenous/ethnic people and, the enactment of the Indigenous and Ethnic Peoples' Development National Academy Act 2001, to set up a separate academy with the objective of bringing ethnic and indigenous people into the mainstream of development.
(v) The setting up of the National Dalit (scheduled cast) Commission for Dalit's Uplifting. Work on preparing a Dalits' Rights Preservation Bill is underway. Programmes targeted at the upliftment of Dalit have been implemented through the Dalit Development Board.
The successful implementation of the reform initiatives is a major challenge. The decentralization process received a setback due to the long absence of elected representatives from villages to the central level since July 2002. The ongoing insurgency has had a significant toll. Restoration of the elected parliament is expected to bring metamorphosis in an otherwise difficult environment. 2.4 Human and institutional capacity The PoA for LDCs contains 18 quantifiable goals and 63 targets. They include the areas of nutrition, health, drinking water and sanitation, education and social integration. The second and third pillars of the PRSP address the concerns of the third commitment of the PoA. The second pillar focuses on social sector development including human development in general. The third pillar of the PRSP incorporates measures to reduce disparity by caste, ethnicity and gender, in the implementation of all the pillars. Health Nepal developed and adopted a National Health Policy in 1991. A 20 year (1997 - 2017) Second Long Term Health Plan (SLTHP) is also being implemented. The major strategies and policies under the PRSP include: (i) extension of public health services to provide services to the poor and backward communities; (ii) emphasis on preventive measures ; (iii) management and decentralization of the health sector; (iv) provision and curative measures (v) partnership between the Government, non-government organizations and, the private sector to provide health services, and (vi) control /eradication of specific disease like HIV/Aids, malaria and tuberculosis. They are all in consonance to the PoA and the MDG. The Nepal Health Sector Programme emphasizes (i) providing safety nets for the poor, under-privileged and socially excluded, (ii) developing alternative health financing schemes and, (iii) providing quality health care services. The activities initiated so far included the handing over of health institutions, including one district hospital, to the community. Many campaigns are also being launched related to awareness and prevention. Education The PRSP strategies include: (i) the promotion of universal primary education with emphasis on pre-primary and primary enrolments, (ii) increased literacy by expanding non-formal education, (iii) emphasis on public participation in the overall management of schools, in line with decentralization, iv) increased technical and skilled human resources, (v) increased secondary level access to those completing primary school, (vi) enhancing the quality of education at all levels, (vii) adopting the principle of cost recovery in higher education, (viii)
9
conducting additional programmes for enhanced access to education by Dalit (oppressed people), and backward communities and, (ix) mobilizing youth in community development. Nepal is making further efforts to provide access to primary education for all five to nine year old children under its “Education for All” (EFA) programme (2001-15),. Universal primary education is aimed to be achieved through decentralized planning, the management of school education and, other innovative measures. The Government intends to act as a facilitator only by providing block grants based on the School Improvement Plan, Village and District Education Plans and, on monitoring the results of quality and access to education. In order to enhance the quality of education, steps such as the introduction of a teaching licence system, mandatory women teachers in preschool, at least one women teacher in the primary level and, a school operation grant manual for cost sharing in secondary education, have been introduced to enhance quality. It is also expected to reduce government financial liability. Various efforts have been initiated to enhance access to education by the disadvantaged groups of the population including female children. Scholarships are provided to girls and children from deprived communities. Other agencies are encouraged to run literacy programmes. The Government has recently launched an enrolment campaign (School Welcome Programme) targeting out-of-school children and, focusing on the poor and disadvantaged, as a means to extend the coverage of primary education. The policy of recruiting female teachers and introducing nutrition programmes has also supported the enrolment increase, as well as promoting equity in the education sector. Moreover, the Government has increased investment in the social sector in successive annual budgets. Despite considerable progress in education, there are challenges, particularly with respect to addressing quality and equity. The quality of education in public schools, where generally poorer students pursue studies, is reported to be seriously weak. This further creates disparity between rich and poor. Drinking Water and Sanitation The PRSP strategy in the water supply and sanitation sector, is to increase sustainable access to safe drinking water supply and sanitation facilities to both rural and urban areas. It will improve health, lessen drudgery, and save time, mostly that of women. The Tenth Plan's target is to make basic drinking water services available to 85 per cent (from 72 per cent) of the population. The PRSP has emphasised (i) cost recovery in the operation of drinking water supply (DWS) projects, (ii) participation of consumers’ groups in rural DWS projects, (iii) the implementation of rural DWS projects through consumers’ committees or NGOs, while ensuring conservation of local resources, (iv) priority to DWS projects affordable to consumers’ committees based on simple and appropriate technology, (v) priority to reconstruction and on-going rural DWS projects, (vi) development and conservation of natural water storage, (vii) sanitation as an integral component of drinking water projects, (viii) improvement of water quality, (ix) involvement of the private sector in the development and management of water supply systems in urban areas and, (x) handing over of the projects and their monitoring and evaluation by the Government to local bodies/communities. The Plan’s targets for water supply are likely to be achieved, although the quality and adequacy of water will continue to be major problems and, Nepal will continue to be a country with a serious paucity of sanitation facilities, which will not help to improve health indicators. The sanitation targets are also not likely to be achieved.
10
Social integration Nepal is a multi-lingual and multi-ethnic country. Different races, castes and indigenous populations live in different ecological regions -mountains, hills and the Tarai. The status of women, low castes, and disadvantaged indigenous groups is still poor and, most of them are outside the sphere of change and development. This discriminates between citizens in terms of access to resources and services. People in mountain areas are poorer and, those of the mid-and far west-development regions are even poorer. Society is still marred by feudal characteristics. The PRSP has included the pillar of targeted programmes with various support activities and affirmative actions. However, progress is inadequate due tore source constraints and lack of commitment.. 2.5 Enhance productive capacities to make globalization work for LDCs
Transportation and Communication In the globalizing world, Nepal cannot remain in isolation and hence, necessary capacity has to be built to integrate the economy globally. The WTO and SAFTA further necessitate the process. Improving and modernizing the means of transportation and increasing communication networks to integrate rural areas is necessary to enhance productive capacity to alleviate poverty. Government policies include constructing and expanding road networks for improving connectivity by promoting also public/ private partnerships. The Government adopted a participatory approach in the selection, preparation and implementation of the development projects in rural infrastructure. Private sector involvement is also encouraged with the provision of Build Operate and Transfer (BOT) and Build Operate Own and Transfer (BOOT). Likewise, private sector involvement is promoted also in the maintenance of national and local road networks 54 districts (out of 75 in the country) have prepared district road master plans. Moreover, a 20-year road sector master plan is being prepared for the whole country. Groundwork for developing Nepal as a transit point between India and China has been initiated. The Government has given priority to linking 70 district headquarters with road by mid -2007. In the information and communication sector, enhancing the participation of the private sector, the effective development of broadcasting services and the flow of information and, enhancing the capacity of the postal service, are some major policies of the Government. IT policy 2000 has been revised with the focus on cyber regulation, e-governance and e-commerce. The Government’s Telecommunications Policy 2004, has been made more forward-looking. Three private sector organizations have entered the business and, the mobile service has also expanded by more than 200 thousand. 2.6 Reducing vulnerability and protecting the environment Nepal prepared a 15-year sustainable development agenda (SDA) in May 2003. It aims to guide and influence national level planning and policies up to 2017. In Nepal, the area of effective forest has decreased to 29 per cent and, there is more than 10 per cent opf land as bush land, which was once forest. The Government has emphasized community and leasehold forestry under the APP as one of its strategies. There has been substantial progress in community forestry and, partial progress in leasehold forestry. This is expected to reduce the process of deforestation and, also to help in the alleviation of poverty.
11
The Government has developed different policies in the area of the environment. Chief among them include the preparation of a National Environmental Policy and the implementation of environmental impact assessment guidelines. In the field of disaster, a National Strategy for Disaster Management is also being prepared and, disaster preparedness and mitigation programmes are under implementation. Likewise, water induced disaster management has been given priority in the National Water Plan (2002-27) However, for the last decade the problem of flooding and inundation has been increasing in the Tarai districts of the country due to deforestation in the porous Bhabar Zone. The problem is further aggravated by river- based projects without adequate mitigation measures. 2.7 Mobilizing financial resources Nepal has adopted various strategies to improve resource mobilization. Domestic Resource Mobilization The domestic saving/GDP ratio and revenue/GDP ratio of Nepal remained between 12 to 13 per cent in the first three years of the 10th plan. Since it is below 15 per cent, Nepal has not qualified to receive debt relief from the World Bank. This indicates that despite an increase, domestic resource mobilization is still low. In recent years, the effort to mobilize domestic resources has been further constrained by sluggish growth. The Government has made some notable interventions for the mobilization of domestic resources:
• Programmes for the qualitative improvement in the performance of revenue administration are continuing.
• Improvements and adjustments have been made in taxes including excise duty, income tax, customs and Value Added Tax (VAT).
• Emphasis has been placed on the mobilization of local resources. • The process of enactment of the Micro Credit Policy and, the drafting of the Micro
finance Act is underway. • The restructuring of the Nepal Bank Limited and Rastriya Banijya Bank,
reengineering of the Nepal Rastra Bank, along with developing institutional mechanisms to take action against wilful defaulters, have been continuing. Similarly, restructuring of the rural development banks is progressing. These are expected to reduce non-performing assets.
• Legal arrangements are being made for the creation of regulatory authority for the Employee’s Provident Fund, the Citizen’s Investment Trust, the Postal Saving Bank and, agencies engaged in the trusteeship of pension funds.
• A Public Procurement Ordinance has been designed to make public procurement systems more effective, economic, competitive and transparent.
Foreign Aid
The importance of managing foreign aid appropriately is obvious in a country like Nepal where the bulk of development expenditure is financed through external sources and, about 12 per cent of government revenue goes for external debt servicing. A foreign aid policy was prepared in 2002. Attempts are also being made to improve debt management.
12
Foreign loans ton Nepal have been increasing over the years, while the ratio of outstanding loans to GDP has been maintained at around 50 per cent over the last decade. The ratio of net outstanding loans to GDP was 52 per cent in 2001/02 and 45 per cent in 2004/5, However, the decrease was due to declining development expenditure rather than to resource generation efficiency. The Government has taken the following initiatives to improve aid utilization. • The development and implementation of Foreign Aid Policy 2002, with the objective of
ensuring the compatibility and convergence of foreign aided development activities with nationally determined priorities.
• Improving the quality, effectiveness and efficiency of foreign aid operations through the prioritization of pro-poor projects.
• Enhanced development partnerships between Nepal and donor institutions. • Economic reforms through various measures. • Periodic review of public expenditure to undertake procedural reform measures and,
enhance the spending capacity of the Government. • Prioritization of projects and programmes to facilitate donor harmonization for aid
effectiveness and coordination. • Reduction of the number of projects to a manageable level.
Therefore, in terms of activities, there is no dearth of plans and initiatives. The pertaining results are analysed in the next chapter.
Chapter III Results and Achievements The results and achievements after the implementations of the PoA for LDCs for the period 2001-02 to 2004-05 are assessed below. 3.1 Economic Growth Probably the worst performance among various indicators has been in the area of economic growth. In view of the relatively strong performance of 1999/2000 and 2000/01, when the economy grew by 6.4 per cent and 4.7 per cent respectively, the targets for the first decade of the new millennium were set high and, the economy was postulated to grow at 7 per cent in 2004/05 and by 7.5 per cent in 2009/10. The economy during the last five yeas only grew at 2.25 per cent per annum on average, which is only about equal to the population growth rate, meaning that there was no real per capita income growth during the period 2000-2005. This poor scenario can be attributed to a number of reasons, which include among others, heightened insurgency, growing political instability and uncertain weather conditions, leading to fluctuating agricultural activities. The weather in 2005/06 has also been poor, not only affecting agricultural production, but also leading to a serious decline in hydro – power production, forcing large scale power cuts that would obviously affect all economic activities. On top of this, the continued insurgency and political instability are expected to seriously erode growth prospects for 2005-06. Poultry production, one of the major growth activities in the agricultural sector, has also faced serious a setback, with bird flu in India and, rumours of
13
it having arrived in Nepal. Although the ADB has estimated Nepal’s economy to grow by 2.3 per cent this year, due to the above reasons, the economy is estimated actually to shrink in 2005/06. Thus, economic performance has been far from satisfactory during the first half of the 2001-10 decade. Due to mounting difficulties it is not expected to improve in the near future. However, remittances have contributed to GNP growth. Remittances are estimated at around 12 per cent of GDP. Actually these estimates are reported to be under estimated due to the persistence of large-scale informal transfers. It is estimated that the ratio may have reached around 20 per cent of GDP in 2005 In order to attain higher growth, a commensurate rise in investment is proposed, as investment is probably the most significant contributor to growth. Hence, it is envisaged that the investment to GPD ratio will reach 30.7 per cent in 2010 and, reach the level of 25 per cent by 2005. The actual results show that the investment to GPD ratio has actually been attained, with the ratio reaching 27.4 per cent in 2004/05. The achievement in itself may sound satisfactory but, it poses a number of questions. Inability to generate growth while maintaining higher investment means that the yield has declined or, the incremental capital output ratio (ICOR) has increased. This does not augur will for this impoverished country, trying to alleviate poverty and, generate growth. Although increased investment in the infrastructure sector has been attributed as a major reason, the results would also implicate decreasing efficiency. In a country where the ICOR is already high, estimated at around 4.1, a further increase would only indicate that development has become costlier and resource utilization less efficient. The scenario does not hold much optimism for sustained growth and poverty alleviation. However, Nepal has been able to maintain macro economic indicators at a satisfactory level despite difficult situations and, this could be construed as a major achievement. The fiscal deficit has remained under control consistently and, has remained well under 6 per cent of GPD. It is expected to remain so even in the present year, 2005-06, supposed to be one of the worst years in the annals of the economic history of the country. Similarly, domestic borrowing has remained under 2 per cent of GDP and, although it is expected to exceed 2 per cent in the present ongoing fiscal year, is still well within control. Inflation is one macro-economic indicator which has worsened this year. The average inflation rate was around 4.5 per cent per annum during the period 2001 to 2004-05 but, this year it is expected to reach 8.1 per cent. It may further rise in 2005-06 due to a large number of factors, including external causes such as rising oil prices and internal reasons including disturbances and political instability, besides the economic factors. The current account remained positive during the first half of the present decade, albeit with foreign grants. In view of the current account remaining negative for the eighties and nineties, except for 1998-99, this must be considered as a significant improvement. It may be further recalled that the current account has been positive despite a galloping trade deficit. The trade deficit exceeded 16 per cent of the GDP or, Rs.100 billion, as against 14 per cent in 1999-00. On the other hand, the current account was positive, with the balance estimated at around 4.6 per cent of GDP. Obviously, remittances have contributed towards this situation. The balance of payments has remained positive throughout and, the foreign exchange balance has remained enough to cover ten months of imports. However, the rosier macro-economic indicators have not been able to be translated into growth. This shows that macro-economic stability is a necessary, but not a sufficient condition, to prod development. A sluggish economy in the first half of the decade does not inspire much confidence for the remaining half of the PoA decade. Hence, it may be concluded that the PoA goals have not been achieved and, will also be difficult to achieve in the coming years.
14

Table 1 Growth and Poverty Indicators Goal / Target 2001/02 2004/05 2010
Target Goal 1 Attain a GDP Growth Rate of at least 7 per
cent per annum
1 Real GDP (Rs billion at 1994/95 price at factor cost) 279.2 295.8
2 GDP growth rate -0.3 2.3 7.5 Goal 2 Increase the ratio of investment to GDP to 25
per cent per annum
3 Investment to GDP ratio (%) 23.2 25.7 30.7 Goal 3 Make substantial progress toward halving the
proportion of people living in extreme poverty by 2015 (MDG 1, T-1)
4 % of population below $1/day (PPP) 37.7a 30.8 5 Poverty gap ratio 9.7a 7.5 6 Share of poorest quintile in national consumption 7.6a 6.2
Goal 4 Make substantial progress towards halving the proportion of hungry people by 2015 (MDG 1, T-2)
7 % of population below minimum level of dietary energy consumption 47b NA
Note: NA indicates Not Available. SourceEconomic Survey, CBS (2004), Nepal Living Standards Survey (NLSS);Human Development and MDG Report(Global and Nepal) and MOF (2006), a=1996 data; b=1997 data 3.2 Poverty and Income Distribution: Poverty has been the bane of the Nepalese economy. The widespread persistence of poverty, despite efforts to alleviate it for so long, has been a major setback to national development efforts. It is argued that many of the country’s problems, including the insurgency have emanated from this problem. Contrary to many other indicators, the progress achieved on the poverty reduction front is quite encouraging. According to the Nepal Living Standard Survey 2003-04 ( NLSS II), poverty was estimated at 30.8 per cent, as against 42.0 per cent in 1996, estimated by the Nepal Living Standard Survey 1995-96 (NLSS I). Even if it is compared with the estimated poverty level of 37.7 per cent in 2000-01, this decline is quite laudable and, would indicate that despite difficult situations, Nepal has prospects of making substantial progress toward halving the proportion of people living in extreme poverty by 2015, as defined by the Millennium Development Goals (MDGs). This is no mean achievement, particularly in view of the achievement attained in the past. Actually, up to 1992, poverty tended to grow, * indicating poor efforts and misplaced priorities but, the achievements thereafter have been appreciable. However, the decrease in poverty was relatively higher in urban areas, reflecting the concentration of efforts therein. It may also indicate that most remittances have remained in the urban areas.
15

The continued prevalence of higher poverty in the poorer and deprived areas, particularly the mid-western and far-western development regions, means that the efforts have failed to reach the most needy areas, populace and sectors. Similar deprivation is noted by disadvantaged communities and groups. This only proves that development efforts are more and more concentrated at accessible and easier areas and, have failed to reach the most needy ones. In the present conflict situation, this will happen more often. The issue is not only to bring down the overall level of poverty but, also to reach the traditionally uncared for and, impoverished population groups and regions. ** Therefore, from this perspective, the achievements have not been as positive as expected. The poverty scenario of Nepal shows an interesting picture. The first effort to measure poverty was made in 1978 and, the NPC reports indicated that a third of the total population was living below the poverty line. The Multi-purpose Household Budget Survey 1984-85, showed the poverty level at 41.4 per cent or, a significant rise over the 1978 figure. The 1992 survey by Nepal Rastra Bank showed a further rise in poverty to a level of 45 per cent. Thus, poverty in Nepal was rising up to 1992 due to a lesser impact of growth efforts and, higher population growth. Poverty declined to 42 per cent in 1996 and to 30.8 per cent in 2003 The reduction in the poverty level per se has not helped to improve income concentration and the Gini-coefficient. An economic growth rate of around 5 per cent attained during the first half of the nineties could reduce poverty by around 3 percentage points in four years. The reduction in the past decade, despite fledgling growth, has been mainly attributed to increasing remittances and foreign employment. This may lead to the conclusion that development efforts have either failed or, been inadequate to address the issues of poverty. The Gini-coefficient worsened from 0.34 in 1995-96 to 0.41 in 2003/04, indicating increasing income inequality. It is important to understand that during the stage of early economic development, the Gini-coefficient tends to be low, but, it tends to increase, as growth does not affect all segments. The same may have happened in the case of Nepal too. But the Gini-coefficient of 0.41 definitely should be an issue of concern. Increasing concentration of wealth is also indicated by the share of the poorest quintile in national consumption, which declined to 6.2 per cent in 2003 compared to 7.6 per cent in 1996. Thus, poor people are becoming actually poorer. This does not augur well for a nation trying to free itself from the shackles of poverty and deprivation. Another noteworthy aspect is the higher persistence of the population below the dietary level, which is actually higher than the poverty level, which shows that the real poverty level may be higher than reported. There is an improvement in the poverty level but, associated indicators of poverty do not provide a basis for encouragement. Yet the attainment is encouraging in the existing situation. ** However, a number of projects like the Micro-enterprise Development Project (MEDEP) of UNDP and Livelihood Forestry Project (LFP) of DFID, to name a few, have been reaching such groups and, a change in the poverty level is being noted. Additionally, the poverty alleviation fund (PAF), initiated by the Government is also zeroing on similar strategies.
16
3.3 Health Various efforts are being initiated to improve health and, the results are also visible in the improved indicators. However, many indicators are still very poor and, substantial improvements are required. With respect to the availing reproductive health service, the rate of progress is satisfactory but, the present level of service is still very low and, hence the attainment of goals appears to be suspect. The indicators showing the percentage of births attended by health personnel and, the percentage of women reporting four or more antenatal visits, showed an almost doubling of the service availability. The percentage of births attended by skilled health personnel went up to 22 per cent in 2004-05, from 11 per cent in 2003-04. Similarly, antenatal visits are made by 28.3 per cent compared to 14.3 per cent in 2001-02. However, the rate of 2004-05 is still at a very low level and, reflects the poor access to services. Substantial improvement alone will help to approach the target of service availability to all by 2015. The contraceptive prevalence rate marginally improved to 41.7 per cent in 2004-05, from 38.9 per cent in 2001-02. This is still much below the level required to tackle the persisting high population growth rate of around 2.25 per cent per annum. One of the reasons for the low rate of contraceptive prevalence, is non-accessibility of the services in all areas where there is demand. The condom use rate of 3.2 per cent in 2001-02 is still low and, even all of the high risk group does not seem to be covered, indicating the persistence of high risk. One of the important goals in the health sector is to reduce child mortality. There has been greater improvement in the mortality rate of under fives, compared to infant mortality. Infant mortality was estimated at 61 in 2004-05, against the target of 44 in 2010 and 35 or lower in 2015. There has definitely been a significant improvement in the area but, much more has to be done and, at the present rate of progress, the target of 44 by 2010 may be difficult to attain. Immunization rates have shown significant improvement and, should help to reduce the overall mortality rates. Access to improved sources of water is increasing continuously and reached 81 per cent in 2004-05, not only in difficult situations but, also in difficult physical terrain. However, the quality of water is still suspect and, in many cases the water is reported to be unsafe. Similarly, adequacy of water supply is a serious problem even in the most accessible areas such as Kathmandu. Therefore, quantitatively the target may be achieved but, the issue of access to safe drinking water, as well as adequate water supply, will remain a big issue for some time to come. The HIV prevalence rate almost doubled from 0.29 per cent in 2000-02 to 0.5 per cent in 2004-05. This shows the persisting high risk in the area. Many awareness drives are on but, the condom use rate indicates that knowledge may not have been adequately translated into behaviour. The goal of reducing malnutrition among pregnant women and preschool children to half by 2015, may not be easy to attain but, it is expected that sound progress will be made, although recent figures are not available in this respect. The malnutrition status of women is not known at all. With respect to the goal to reduce mortality and morbidity from some major killer diseases, the achievement has been mixed. The prevalence rate of TB has declined to some extent but, the prevalence rate of malaria has increased. The proportion of the population in malaria risk areas using effective malaria prevention measures, has almost doubled but, the proportion was very small, at 11.4 per cent in 2004-05. In case detection and curing under DOTs, indicators have changed only marginally, implying that more such efforts are warranted to combat these
17
killer diseases. Therefore, the achievements are still not up to the mark and, serious attention is required in this respect. Improvements in sanitation have been notable but, like many other indicators, much more needs to be done. Access to sanitation had reached 39 per cent in 2001-02. The achievement itself shows that a lot more is needed to improve the situation. A widespread promotional campaign has helped to some extent but, greater progress is required in the encouraging of more breastfeeding. Improving health indicators are signs of betterment but, a lot more has to be done with respect to safe drinking water, sanitation, the contraceptive use rate and, the prevention of killer diseases.
18
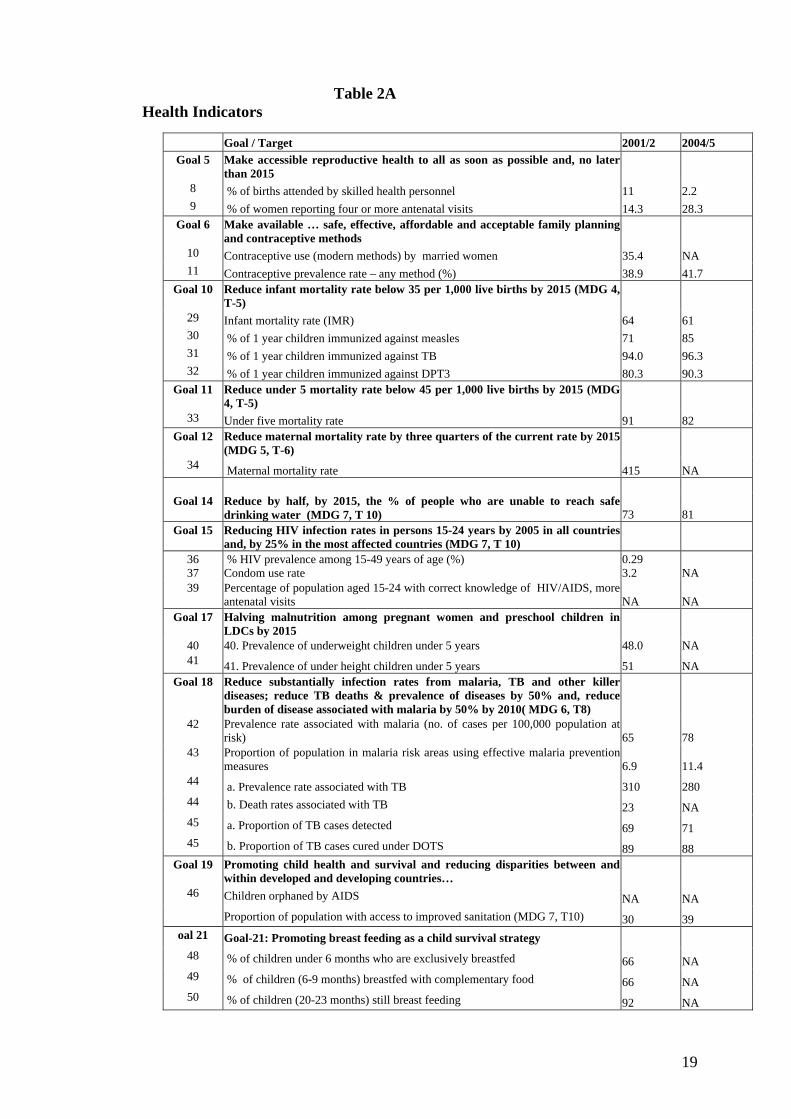
Table 2A Health Indicators
Goal / Target 2001/2 2004/5 Goal 5 Make accessible reproductive health to all as soon as possible and, no later
than 2015 8 % of births attended by skilled health personnel 11 2.2 9 % of women reporting four or more antenatal visits 14.3 28.3
Goal 6 Make available … safe, effective, affordable and acceptable family planning and contraceptive methods
10 Contraceptive use (modern methods) by married women 35.4 NA 11 Contraceptive prevalence rate – any method (%) 38.9 41.7
Goal 10 Reduce infant mortality rate below 35 per 1,000 live births by 2015 (MDG 4, T-5)
29 Infant mortality rate (IMR) 64 61 30 % of 1 year children immunized against measles 71 85 31 % of 1 year children immunized against TB 94.0 96.3 32 % of 1 year children immunized against DPT3 80.3 90.3
Goal 11 Reduce under 5 mortality rate below 45 per 1,000 live births by 2015 (MDG 4, T-5)
33 Under five mortality rate 91 82 Goal 12 Reduce maternal mortality rate by three quarters of the current rate by 2015
(MDG 5, T-6) 34 Maternal mortality rate 415 NA
Goal 14 Reduce by half, by 2015, the % of people who are unable to reach safe drinking water (MDG 7, T 10) 73 81
Goal 15 Reducing HIV infection rates in persons 15-24 years by 2005 in all countries and, by 25% in the most affected countries (MDG 7, T 10)
36 37
% HIV prevalence among 15-49 years of age (%) Condom use rate
0.29 3.2 NA
39 Percentage of population aged 15-24 with correct knowledge of HIV/AIDS, more antenatal visits NA NA
Goal 17 Halving malnutrition among pregnant women and preschool children in LDCs by 2015
40 40. Prevalence of underweight children under 5 years 48.0 NA 41 41. Prevalence of under height children under 5 years 51 NA
Goal 18 Reduce substantially infection rates from malaria, TB and other killer diseases; reduce TB deaths & prevalence of diseases by 50% and, reduce burden of disease associated with malaria by 50% by 2010( MDG 6, T8)
42 Prevalence rate associated with malaria (no. of cases per 100,000 population at risk) 65 78
43 Proportion of population in malaria risk areas using effective malaria prevention measures 6.9 11.4
44 a. Prevalence rate associated with TB 310 280 44 b. Death rates associated with TB 23 NA 45 a. Proportion of TB cases detected 69 71 45 b. Proportion of TB cases cured under DOTS 89 88
Goal 19 Promoting child health and survival and reducing disparities between and within developed and developing countries…
46 Children orphaned by AIDS NA NA Proportion of population with access to improved sanitation (MDG 7, T10) 30 39
oal 21 Goal-21: Promoting breast feeding as a child survival strategy 48 % of children under 6 months who are exclusively breastfed 66 NA 49 % of children (6-9 months) breastfed with complementary food 66 NA 50 % of children (20-23 months) still breast feeding 92 NA
19

3.4 Education Education is one sector where Nepal’s achievement is being claimed as satisfactory. The available data, despite the absence of gender disaggregated data, shows that the achievements have been satisfactory. Yet, a number of caveats persist.. The Net Enrolment ratio (NER) went up to 89 per cent in 2004-05, compared to 81 per cent in 2001-02 and, it is expected to reach nearly 100 per cent well before 2015, the MDG target. However, the PoA target of reaching 100 per cent by 2010 may not be attained. Gross enrolment reached 100 a long time ago. There has also been an improvement in the percentage of pupils starting grade 1 and reaching grade 5. It improved to 76 per cent in 2004-05, from 63 per cent in 2001-02, indicating that the dropout rate, one of the chronic problems of Nepal, is declining at a fast pace, raising the prospect of the number of children completing primary education nearing 100 per cent by 2015. Adult literacy is improving continuously and, reached 48 per cent in 2004-05. The way the literary rate is improving, it can be expected that the MDG target of a 50 per cent improvement in adult literacy by 2015 may be attained. The adult literacy rate for girls has been improving at a very fast pace, recording a 74.2 percent improvement within seven years, reaching at 33.8 per cent in 2003, against 19.4 per cent in 1996. However, much catching up is necessary to reduce the gender gap, as the adult literacy rate for men reached a level of 64.5 per cent in 2003. The literacy rate for the 15-24 age group improved to 73 per cent. The data in itself shows that despite impressive results on the literacy front, much more is still needed, as 73 per cent literacy in the 15-24 age group is not at all satisfactory. As mentioned above, gender disparity, though persisting, has been reduced. The ratio of girls to boys in primary education reached 0.86 from 0.79. The similar ratio at secondary level reached 0.82 from .70, indicating that the gender gap is mitigating at school level and, the indicator is improving significantly. The literacy ratio of girls to boys in the age group 15-24, reached 0.73 in 2004-05. It is expected that the campaign launched recently to enrol girls in schools should help to improve the situation significantly. The data on the education sector shows some notable achievements but, it also indicates the backward stage of the country in the education sector. Much more still needs to be done in the area, in order to develop Nepal’s human resources and raise capability levels in a meaningful way.
20
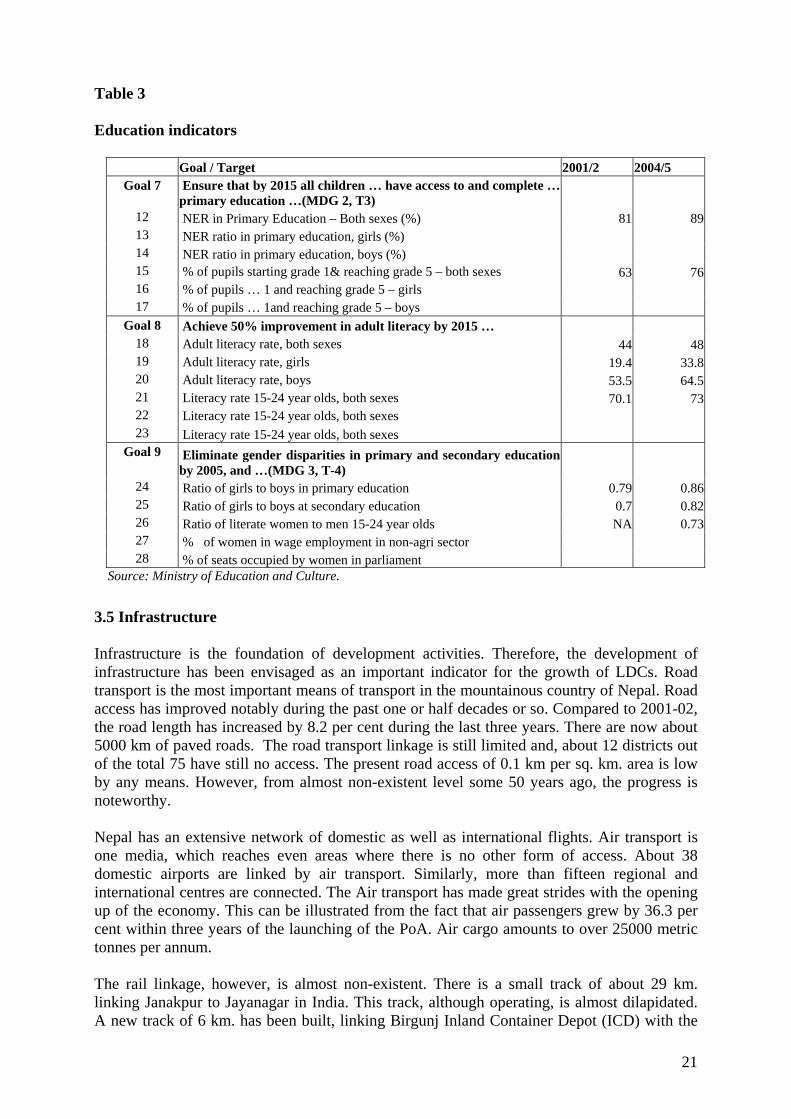
Table 3
Education indicators
Goal / Target 2001/2 2004/5
Goal 7 Ensure that by 2015 all children … have access to and complete … primary education …(MDG 2, T3)
12 NER in Primary Education – Both sexes (%) 81 8913 NER ratio in primary education, girls (%) 14 NER ratio in primary education, boys (%) 15 % of pupils starting grade 1& reaching grade 5 – both sexes 63 7616 % of pupils … 1 and reaching grade 5 – girls 17 % of pupils … 1and reaching grade 5 – boys
Goal 8 Achieve 50% improvement in adult literacy by 2015 … 18 Adult literacy rate, both sexes 44 4819 Adult literacy rate, girls 19.4 33.820 Adult literacy rate, boys 53.5 64.521 Literacy rate 15-24 year olds, both sexes 70.1 7322 Literacy rate 15-24 year olds, both sexes 23 Literacy rate 15-24 year olds, both sexes
Goal 9 Eliminate gender disparities in primary and secondary education by 2005, and …(MDG 3, T-4)
24 Ratio of girls to boys in primary education 0.79 0.8625 Ratio of girls to boys at secondary education 0.7 0.8226 Ratio of literate women to men 15-24 year olds NA 0.7327 % of women in wage employment in non-agri sector 28 % of seats occupied by women in parliament
Source: Ministry of Education and Culture.
3.5 Infrastructure Infrastructure is the foundation of development activities. Therefore, the development of infrastructure has been envisaged as an important indicator for the growth of LDCs. Road transport is the most important means of transport in the mountainous country of Nepal. Road access has improved notably during the past one or half decades or so. Compared to 2001-02, the road length has increased by 8.2 per cent during the last three years. There are now about 5000 km of paved roads. The road transport linkage is still limited and, about 12 districts out of the total 75 have still no access. The present road access of 0.1 km per sq. km. area is low by any means. However, from almost non-existent level some 50 years ago, the progress is noteworthy. Nepal has an extensive network of domestic as well as international flights. Air transport is one media, which reaches even areas where there is no other form of access. About 38 domestic airports are linked by air transport. Similarly, more than fifteen regional and international centres are connected. The Air transport has made great strides with the opening up of the economy. This can be illustrated from the fact that air passengers grew by 36.3 per cent within three years of the launching of the PoA. Air cargo amounts to over 25000 metric tonnes per annum. The rail linkage, however, is almost non-existent. There is a small track of about 29 km. linking Janakpur to Jayanagar in India. This track, although operating, is almost dilapidated. A new track of 6 km. has been built, linking Birgunj Inland Container Depot (ICD) with the
21

ports of Calcutta/Haldia in India. Presently, it is used only for cargo traffic but, there is a plan for passenger movement. Birgunj ICD handled about 10,000 TEU in 2005. Total goods transported through international borders amount to about 7 million metric tonnes. Improvement in the transport sector is taking place at a fast pace but, serious efforts will be needed to link at least all district headquarters. Table 5: Transport and communication Indicators
Goal / Target 2001/2 2004/5 Goal 22 Increasing road networks in LDCs to the current
level of other developing countries & urban road capacities, including sewerage and other related facilities by 2010
51 52
Total road network (km.) Paved Roads
15905 4566
172175000
55 56
Air passengers carried (number) Air freight tons
1879
256225000
Goal 27 Increasing average telephone density to 5 main lines per 100 inhabitants and internet connection to 10 users per 100 inhabitants by the year 2010 (MDG 8, T – 8)
Telephones lines per 100 population 1 3.8 Estimated number of internet users (in thousand)
45 120
Source: MOF (2005) Economic Survey 2004/05; NPC (2002), Tenth Plan; NPC/UNCT (2005), Nepal MDG Progress Report 2005.
3.6 Communications Communication is another area which has recorded fast growth in recent times. This is shown by the fact that the number of telephone/cellular lines per 100 persons increased almost fourfold over a period of three years. This is a commendable achievement. Similarly, estimated the number of internet users has increased threefold, reaching about 120 thousand. The increase, despite being impressive, is still very small if we consider the ratio of use, which is about 0.5 per 100 persons. This status in the present day era may be termed abysmal. However, it is true that it is growing at a very fast pace. Nepal has made some notable progress but, much more will have to be done in view of the rudimentary status of many areas of infrastructure. 3.7 Resource mobilization Improving the socio-economic status of the country and, achieving the PoA and the MDG targets will require adequate investment. Resources need to mobilized and utilized efficiently and effectively. On the resource utilization front, Nepal has not been able to improve, as shown by the increasing incremental output ratio. On the resource mobilization front, Nepal has made some progress but, recently has also encountered a number of problems.
22
Domestic resource mobilization is growing but, still remains below 13 per cent of GDP. The near standstill of the economy did not help to improve it. The sluggish economy has seriously offset improvements in efforts and strategies. With the hightened crisis, the need for foreign assistance is growing. Security expenditures are growing unabated leaving less and less for development expenditures. In this situation, without foreign assistance, very little could be achieved through internal development efforts. It is estimated that Nepal will have to invest US $16 billion in the decade 2005 – 2015 to attain the MDG but, domestic resources are expected to provide only US$8.4 billion, leaving a gap of US$7.6 billion. This can be met only through foreign assistance. The present level of investment as well as foreign assistance are much lower. This will not lead to attaining the PoA or the MDG goals. In view of the 1 February 2005 action of the King, many bilateral agencies such as DANIDA, DFID etc. either froze or reduced activities. In this situation, Nepal may face a serious fiscal crises, with increasing security expenses on the one hand and, declining resources, including foreign assistance, on the other. This does not augur well for attaining the PoA or the MDG goals nor, to move the country onto a growth path to avail of the opportunities created by the fast growth of its two giant neighbours and, by the opening up of the global economy. However, with the restoration of democracy, the scenario is expected to improve rapidly. Chapter IV Issues, Lesson Learnt, Conclusions and Recommendation 4.1 Issues and Challenges Nepal, one of the LDCs on the lower rung of development, is facing the problems of poverty, disadvantage and slow growth on the one hand and, on the other, growing insurgency and the need to create a peaceful environment. Achievements so far, have hardly been awe-inspiring, as is to be expected. However, things have not stood still and, progress has been made in many aspects. At a time when things are expected to move much more positively in the direction of growth and prosperity, translating the MDG/PoA more purposefully, the country is engrossed in diverting resources from development to security, from production to destruction, from welfare to abandonment. The important issues and challenges Nepal has had to encounter are stated below.
1. The growing insurgency, which started in 1996, pushed the country to the threshold of civil war. The insurgency has impacted many problems directly and indirectly, some of which can be listed as, (i). increasing resource diversion from development to security (ii) seriously affected economic activities, particularly industrial activities(iii) increasing internal migration, causing an overflow to urban and semi-urban areas but, reducing the economically active population in the rural areas (iv) dwindling or, virtually no investment in productive sectors (v) rising costs of business and development and vi. enhanced risk. In many areas, no development activities have been able to be undertaken for some years. Therefore, the deprived regions and their inhabitants have become more deprived.
2. On top of the insurgency, political instability has seriously eroded economic prospects and activities. The Government has not been able to bring necessary policies or proactive initiatives to the socio-economic front. On the other hand, frequent lockouts, strikes and agitation have seriously disrupted economic activities. In this situation, it is praiseworthy that
23
the Nepalese economy is still growing even at a marginal level, showing the resilience of the economy.
3. Governance has been a serious issue. Engulfed in the crisis, the Government is increasingly concentrating on security and related issues, rather than development and service delivery. In any case, the influence of the formal Government is shrinking each day. More importantly, the quality and efficiency of service delivery has hardly been inspiring. The agendas for decentralization, efficiency and service delivery, have all become futile platitudes. In difficult situations, it is more pertinent that Government is improved and acts in an assuring manner. In the absence of this, the situation has become less than satisfactory. It is not to belittle efforts from diverse quarters. However, less than satisfactory efforts can be illustrated from fact that the PoA initiatives have mostly been limited to the NPC, in limited quarters only and, have not even reached the ministries. In this situation, governance has become an enigma.
4. Sluggish economic growth, hardly matching population growth, has been a major deterrent. It has not really helped to alleviate poverty. The widening gap between haves and have-nots and, the increasing rural/urban divide, have been far from encouraging. Deprived and disadvantaged communities continued to suffer and, in many cases their problems aggravated. Unless development strategies are clearly focused on targeting these inherent issues, desired effects cannot be generated.
5. Continued high population growth has been a major challenge to Nepal. The population growth rate estimated at 2.25 per cent per annum, is the highest in the SAARC region except for Pakistan. This does not help to achieve desirable results.
6. One of the critical issues is inefficiency in development expenditures, which are declining. Corruption and other malpractices have led to significantly increased costs of development.. It is reported that there is also much wastage in foreign assisted projects. The result has been lesser productivity, higher ICOR and, fewer overall benefits. Another issue is the mode which should be adopted in situations where formal means, particularly the Government, has not been able to reach various regions due to the conflict situation. Even NGOs based outside find it difficult but, local NGOs and CBOs are operating and, have also been able to work in the interior. However, unless the Government finds an appropriate alternative, many of its activities will remain in limited areas and, not much development work may be done.
7. Infrastructure still leaves much to be desired. Inadequate transportation and energy are principal deterrents for quick development. The development of infrastructure is not easy in a difficult physical terrain and, without adequate infrastructure it is not easy to create a socially and economically prosperous nation.
8. Slow growth, a subsistence economy and, limited scope for the collection of revenue, are affecting revenue mobilization. Resource constraints, compounded by reduced foreign assistance and, the situation of the country, has seriously restrained development. However, with the restoration of democracy, it is expected that the situation will improve.
9. Human resources remain underdeveloped. Some educated persons are not in appropriate employment, while others have opted for greener pastures abroad. The inadequacy of quality human resources, worsened by poor utilization of such resources, does not help to improve the country. As a result, the drive against poverty, both in economic and social terms, has become weak.
24

10. Another issue is the stagnation of strategies, policies and approaches. Necessary changes are not incorporated in a timely manner, resulting in less than desired results.
11. Institutional capacity in many cases is also limited. Besides the resource constraints mentioned above, there are slow, inefficient and arduous processes, poor utilization of resources and, a lack of institutionalization of systems. In many cases, persons are more dominant than the systems. More emphasis is given to processes rather than results. Even in good governance, in efforts and initiatives to curb corruption and other malpractices, the emphasis does not appear to have changed from processes to goals. The result has been weak, static and inefficient institutions. 4.2 Lessons Learnt
1. The most important lesson learnt is that things are happening and, it is possible to do things provided that the right approaches and strategies are adopted. CBOs and locally based NGOs have been operating and, have become the means for reaching otherwise unreachable areas. This has helped to continue development and economic activities and many donor-assisted projects have been able to continue.
2. Many development personnel, equipped with tools like “Do No Harm” and “Safe and Effective Working in Conflict Situations” have helped development workers to be more confident and to deliver services. It shows that the right approaches and strategies work even in difficult circumstances.
3. The image that UN agencies have been able to develop is another noteworthy aspect. The accessibility of UN agencies is significantly appreciable.
4. It is not necessary that economic development should precede human or social development. Nepal has been able to achieve more in human and social development, while on the economic front, the scenario is hardly anywhere near a satisfactory level.
5. Institutional strengthening and institution building are requisites for sustained development
efforts. 6. Communities and the private sector are more effective in service delivery than the
Government sector. 7. There is a need to make all efforts cost effective and transparent. An LDC like Nepal, with
pronounced resource deficiency, cannot afford to be wasteful.
8. Activities with better vision will always result in better results. Only through proper vision, strategies and concerted efforts, can development goals be realized.
9. Simple interventions, if done in a right and proper way can make big impacts. There is no need to launch big projects or activities to create favourable impacts.
10. Better results can be derived if purposive segmented strategies, e.g. by target groups, are
adopted. 11. A partnership approach, networking and, using the institutions or agencies according to their
strengths, are more effective than individualistic efforts.
25
4.3 Conclusion Nepal’s achievements in the PoA and the MDG are at best moderate, mainly because of the unfavourable situation in the country. Increasing insurgency and political instability have seriously eroded efforts. On top of that, the national commitment appeas to be poor, as the awareness of the PoA is mostly confined to the NPC and, does not seem to go beyond it. Furthermore, there has been an obvious lack of coordination between the planning body and the executing agencies. Thus, apart from the conflicts and political reasons, Nepal has also lagged behind due to institutional reasons. The growth scenario over the past four or five years has been discouraging, with negative growth in 2002-03. Thus, the growth target will remain heavily underattained, despite the maintenance of macro-economic stability and, the growing contribution of remittances. There is evidence of a reduction in poverty in some area. However, the most disadvantaged communities and regions have lagged behind with hardly any symptoms of change. Gender discrepancy and social discrepancy are still persisting, although the gender gap is declining. However, social and human capacity indicators such as in the education and health sectors are improving and, there are good prospects for their attainment. The achievements in themselves are not small if we consider the prevailing situation in the country. However, it will have to do much more if the MDG/PoA goals are to be attained. 4.4 Recommendations
1. Nepal must try to create a peaceful environment. The conflict is proving too costly, not only in political terms but, also in economic terms. Diversion of more and more resources to security than in development has not the helped the cause of development goals. It has also seriously affected economic activities.
2. There is a need to ensure the most efficient use of available resources. Continuous monitoring,
bench marking, transparency, abatement of corrupt practices and, proper auditing, including social auditing, should help to attain this goal.
3. Institutional strengthening, including human resource development, their proper use and,
systemic approaches, should help to enhance their capacity to attain goals in an easier manner. 4. A positive discrimination policy must be implemented to mitigate gender gaps and community,
regional and ethnic differences. The policy of social inclusion needs to be adopted as a priority.
5. Coordination must be promoted between planning and executing bodies through mutual
operations, networking and the exchange of information. 6. Strategies need to be dynamic and suited to grassroot realities. Segmented strategies as per
specific groups’ needs may help to improve achievement. 7. Transparency, inclusion and participatory approaches must be promoted to attain better results
and, to motivate people. 8. Proper partnerships and networking are essential to develop synergy of resources and
implementation capabilities. Similarly, agencies which are likely to succeed most, should be
26
given the task, whether they be Government agencies, the private sector, local bodies, NGOs or CBOs.
9. Slow government response is another point affecting performance. Necessary legislative and
policy changes are rarely done on time. For example, it was felt that the Industrial Policy of 1992 needed to be changed, to incorporate responses to contemporary challenges, overcome inefficiencies and to make it dynamic. A draft policy was crafted in 2001. Another one was developed in 2004. But it has yet to be seen when the new policy will really come out.
27
References
1. ADB, 2001, ADB Country Strategy for Poverty Reduction, Kathmandu: Asian
Development Bank. 2. Bajracharya, P; A.B.Shrestha and C.Rauniyar. SAARC Regional Multi-Modal
Transport Study, SAARC- ADB, Dec.2005. 3. CBS, HMG Nepal Living Standards Survey (NLSS), Kathmandu, 1997. 4. CBS, HMG Nepal Living Standards Survey (NLSS), Kathmandu, 2004. 5. DFID, 2000, Strategy for Achieving the International Development Targets:
Marking Government Work for Poor People, London: U.K. Department for International Development.
6. DFID/ESP, 2001, Pro-Poor Governance Assessment, Nepal, Kathmandu: U.K. Department for International Development, Enabling State Programme.
7. MOF, HMG Economic Survey 2004-05, Kathmandu, 2005. 8. MOH, Health Survey 2002, Kathmandu, 2003. 9. New eara and ORG Marga Nepal Demographic Health Survey, Kathmandu,
2003. 10. NPC, Tenth Plan (2002-7), Kathmandu, 2003. 11. NPC Tenth Plan PRSP Progress Report, 2004/5 (Draft) Dec 2005. 12. NPC, 2003, Medium Term Expenditure Framework 2003-2005, Kathmandu,
National Planning Commission. 13. NPC, 2003, Tenth Development Plan 2002-2007 (Poverty Reduction Strategy
Paper), Kathmandu: National Planning Commission. 14. UNDP Human Development Reports 2004, New York, 2004. 15. UNDP Nepal Human development Report 2004, Kathmandu, 2005. 16. UNDP/NPC Nepal Millennium Development Goals: Progress Report 2005,
Kathmandu 2005. 17. United Nations Report on the Third United Nations Conference on the Least
Developed Countries, Brussels, Belgium, May 2001.
28
Annex Persons and Agencies met:
1. Dr. Shanker Sharma,Vice-Chairman, NPC 2. Dr.Champak Pokharel , Member, NPC 3. Dr.Bijaya Shrestha, Member, NPC 4. Mr. Bishwa Raj Tewari, Jt. Secretary, NPC 5. Mr. Rabi Sainju, Under Secretary, NPC 6. Mr. Bhanu Acharya, Secretary, MoF 7. Mr.Rameshwar Khanal, Jt Secretary, MoF 8. Mr.Subarna Lal Shrestha, Jt Secretary, MoF 9. Mr. Prachanda Man Shrestha, Jt Secretary, MoICS 10. Mr. Lavs Raj Tripathi, Jt Secretary, MoEC 11. Chief Planning Division, MoH 12. Mr. Sharad Neupane, ARR, UNDP 13. Mr. Anil K.C, Senior Programme Officer, UNDP
Agencies Visited:
1. National Planning Commission(NPC) 2. Ministry of Finance(MoF) 3. Ministry of Education & Culture(MoEC) 4. Ministry of Health(MoH) 5. Ministry of Transport (MoT) 6. Ministry of Industry, Commerce and Supplies( MoICS)] 7. UNDP 8. DFID 9. World Bank 10. Asian Development Bank 11. DANIDA 12. SDC
29
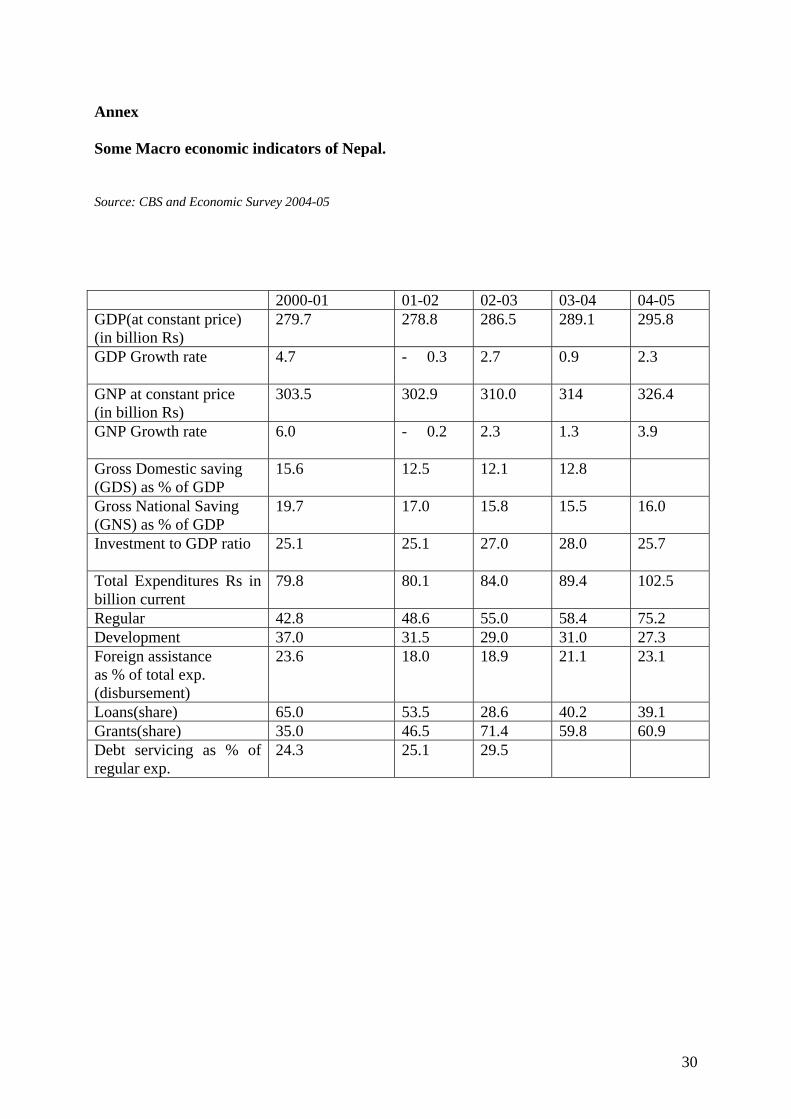
Annex
Some Macro economic indicators of Nepal.
Source: CBS and Economic Survey 2004-05
2000-01 01-02 02-03 03-04 04-05 GDP(at constant price) (in billion Rs)
279.7 278.8 286.5 289.1 295.8
GDP Growth rate 4.7
- 0.3 2.7 0.9 2.3
GNP at constant price (in billion Rs)
303.5
302.9 310.0 314 326.4
GNP Growth rate 6.0
- 0.2 2.3 1.3 3.9
Gross Domestic saving (GDS) as % of GDP
15.6 12.5 12.1 12.8
Gross National Saving (GNS) as % of GDP
19.7 17.0 15.8 15.5 16.0
Investment to GDP ratio
25.1 25.1 27.0 28.0 25.7
Total Expenditures Rs in billion current
79.8 80.1 84.0 89.4 102.5
Regular 42.8 48.6 55.0 58.4 75.2 Development 37.0 31.5 29.0 31.0 27.3 Foreign assistance as % of total exp. (disbursement)
23.6 18.0 18.9 21.1 23.1
Loans(share) 65.0 53.5 28.6 40.2 39.1 Grants(share) 35.0 46.5 71.4 59.8 60.9 Debt servicing as % of regular exp.
24.3 25.1 29.5
30