Case study: Feasibility analysis of renewable energy ...
42
UNLV Theses, Dissertations, Professional Papers, and Capstones 5-2009 Case study: Feasibility analysis of renewable energy supply Case study: Feasibility analysis of renewable energy supply systems in a small grid connected resort systems in a small grid connected resort Jody Robins University of Nevada, Las Vegas Follow this and additional works at: https://digitalscholarship.unlv.edu/thesesdissertations Part of the Hospitality Administration and Management Commons, Oil, Gas, and Energy Commons, Sustainability Commons, and the Technology and Innovation Commons Repository Citation Repository Citation Robins, Jody, "Case study: Feasibility analysis of renewable energy supply systems in a small grid connected resort" (2009). UNLV Theses, Dissertations, Professional Papers, and Capstones. 633. http://dx.doi.org/10.34917/1754532 This Professional Paper is protected by copyright and/or related rights. It has been brought to you by Digital Scholarship@UNLV with permission from the rights-holder(s). You are free to use this Professional Paper in any way that is permitted by the copyright and related rights legislation that applies to your use. For other uses you need to obtain permission from the rights-holder(s) directly, unless additional rights are indicated by a Creative Commons license in the record and/or on the work itself. This Professional Paper has been accepted for inclusion in UNLV Theses, Dissertations, Professional Papers, and Capstones by an authorized administrator of Digital Scholarship@UNLV. For more information, please contact [email protected].
Transcript of Case study: Feasibility analysis of renewable energy ...

UNLV Theses, Dissertations, Professional Papers, and Capstones
5-2009
Case study: Feasibility analysis of renewable energy supply Case study: Feasibility analysis of renewable energy supply
systems in a small grid connected resort systems in a small grid connected resort
Jody Robins University of Nevada, Las Vegas
Follow this and additional works at: https://digitalscholarship.unlv.edu/thesesdissertations
Part of the Hospitality Administration and Management Commons, Oil, Gas, and Energy Commons,
Sustainability Commons, and the Technology and Innovation Commons
Repository Citation Repository Citation Robins, Jody, "Case study: Feasibility analysis of renewable energy supply systems in a small grid connected resort" (2009). UNLV Theses, Dissertations, Professional Papers, and Capstones. 633. http://dx.doi.org/10.34917/1754532
This Professional Paper is protected by copyright and/or related rights. It has been brought to you by Digital Scholarship@UNLV with permission from the rights-holder(s). You are free to use this Professional Paper in any way that is permitted by the copyright and related rights legislation that applies to your use. For other uses you need to obtain permission from the rights-holder(s) directly, unless additional rights are indicated by a Creative Commons license in the record and/or on the work itself. This Professional Paper has been accepted for inclusion in UNLV Theses, Dissertations, Professional Papers, and Capstones by an authorized administrator of Digital Scholarship@UNLV. For more information, please contact [email protected].

Case Study Feasibility Analysis of Renewable Energy Supply
Systems in a Small Grid Connected Resort
By
Jody Robins
Master of Science in Hotel Administration
University of Nevada Las Vegas
2009
Master of Science in Hotel Administration
William F. Harrah College of Hotel Administration
Graduate College
University of Nevada, Las Vegas
May 2009

2
Table of Contents
Table of Contents .................................................................................................... 2
List of Figures and Graphs ....................................................................................... 3
Abstract ................................................................................................................... 4
Part I ........................................................................................................................ 5
Introduction ................................................................................................ 5
Purpose ....................................................................................................... 6
Justification ................................................................................................. 6
Constraints .................................................................................................. 7
Part II ....................................................................................................................... 8
Introduction to the Literature Review .............................................................. 8
The Literature Review ....................................................................................... 8
Solar Power ................................................................................................. 8
Types of Solar Power .............................................................................. 9
Current Solar Market Conditions ........................................................... 9
Federal Government Policy .................................................................. 12
Wind Power............................................................................................... 13
How Wind Power is Harnessed ............................................................ 13
Current Market ..................................................................................... 14
Feasibility of Wind Power ..................................................................... 15
The Future of Wind Energy .................................................................. 17
Fuel Cells ................................................................................................... 18
How They Work .................................................................................... 18
Benefits of Fuel Cells ............................................................................ 20
Cost of Fuel Cells .................................................................................. 20
Feasibility of Energy Independence .......................................................... 21
Previous Studies ................................................................................... 22
Part III .................................................................................................................... 24
Introduction .............................................................................................. 24

3
The Resort ................................................................................................. 25
Methodology ............................................................................................. 28
Data Inputs ........................................................................................... 28
Testing .................................................................................................. 32
Results .................................................................................................. 33
Conclusion ................................................................................................. 35
Recommendations .................................................................................... 37
References ............................................................................................................ 39
List of Figures and Tables
Figure 1. Graph of Solar Energy Capacity Additions ............................................ 10
Figure 2. Graph of Cumulative and Annual Wind Capacity Growth .................... 15
Figure 3. Diagram of the Basic Fuel Cell ............................................................... 19
Figure 4. Graph of Fuel Cell Efficiency compared to Electricity and Gas Costs .. 21
Figure 5. Graph of Average Monthly Solar Radiation .......................................... 29
Figure 6. Graph of Monthly Average Wind Speed ............................................... 30
Figure 7. Energy Flow Diagram for Mackenzie Beach Model .............................. 31
Figure 8. Net Present Cost Equation ................................................................... 32
Figure 9. Capital Recovery Factor Equation ......................................................... 32
Figure 10. Salvage Value Equation ........................................................................ 33
Table 1. Mackenzie Beach Resort Seasons .......................................................... 26
4
ABSTRACT
Case Study Feasibility Analysis of Renewable Energy Supply
Systems in a Small Grid Connected Resort
By
Jody Robins
Dr. Robert Woods, Committee Chair
Professor of Hotel Management
University of Nevada, Las Vegas
This paper presents a case study on the feasibility of a small grid connected resort in the marine
west coast climate of Canada to implement a renewable energy supply system. The current
industry conditions of three renewable energy systems are explored including small and large
wind energy conversion systems, solar photovoltaic cell systems, and energy cell systems.
Furthermore, these three systems are evaluated using the power load, wind, and solar
radiation information from a specific resort. The renewable energy source assessment and
optimization software HOMER (National Renewable Energy Laboratory, US) is used to evaluate
the costs and benefits of each system. The software evaluates the payback period, the net
present cost, and renewable factor of new systems to find the optimal system for the resort.
The findings in the case study result in recommendations for the specific resort being tested as
well as general recommendations for any small resort interested in implementing a renewable
energy system. Furthermore, this paper will help guide small resort owners in simulating and
testing, using the HOMER software, renewable energy systems specific to the needs of their
resort.

5
Part I
Introduction
Volatile oil and energy markets have caused the price of electricity to be unstable which
can be a problem for many small resort operators. Additionally, the threat of global warming
and climate change as a result of CO2 emissions has forced many people to become interested
in renewable energy. This paper will explore the feasibility of electrical energy independence in
small resorts, concentrating on the use of renewable energy sources including wind, solar, and
energy cells. The information presented in this paper will be relevant for both new resorts and
existing resorts that want to retrofit a new energy system in their current property.
The costs of both traditional and renewable energy sources and the effect of climate
conditions on production rates will be examined. Average wind speed maps and how different
average wind speeds change the energy output of wind turbines, therefore changes the cost of
the energy produced will be explored. The solar index and its use to evaluate the cost of solar
power by region will also be explored. This paper will then evaluate the cost of energy cells and
traditional energy from the power grid to see which is cheapest. This information will be used
in a case study about the Mackenzie Beach Resort on Vancouver Island in British Columbia,
Canada. Using the power load, wind, and solar radiation information from the specific resort,
the renewable energy source assessment and optimization software HOMER (National
Renewable Energy Laboratory, US) will be used to evaluate the costs and benefits of each
system.
Next, the results and findings of the HOMER software will be explained and
recommendations will be made to the Mackenzie Beach Resort on the most feasible energy

6
system for there climate conditions and energy use. Further general recommendations will be
made to small resort owners on modeling and testing their own resorts for the most efficient
renewable energy system using the HOMER software.
Purpose
There is little well known comprehensive information about the cost of renewable
energy projects available to resort owners, so they have to research all types of projects in
order to decide on the project that fits their resort best. This paper present the tools that
resort should use to minimize the amount of time the research phase usually takes. This
information will help small resort owners that are interested in achieving energy independence
or implementing a renewable energy hybrid system to make decisions on the best way to
accomplish it. The research will presented in a case study about a specific small resort.
Furthermore, the information and recommendations presented in this paper should be easily
adapted to other industries or personal applications.
Justification
It will be very helpful for small resorts to know if it is feasible for them to produce all or
part of their electricity in an environmentally friendly way. The information presented in this
paper will save both time and money for resort owners and eliminate duplicate research by
resorts. If this paper can help just one hotel to be more friendly to the environment, then it has
done a great deed. Furthermore, this research could easily be adapted to other buildings and

7
businesses and has the potential to have an even bigger impact on environmental
consciousness.
Constraints
The paper will purely be a cost analysis of energy independence and will not take into
account any increase in business that may result from environmentally friendly initiatives. Tax
incentives for green activities will also be ignored as they are different for every state in the
United States and every country. Another factor that will be ignored is the cost of linking a new
resort to a traditional grid as it will cost different amounts for every resort depending on their
situation.
Further constraints come from the limited information that is available. The monthly
average solar radiation will be used and the seasonally average wind speed will be used. More
specific measurements would result in a more accurate study, but it is simply not available.
Electricity usage at the Mackenzie Beach Resort is measured on a bimonthly basis. This data
will be converted to average hourly use. More accurate electricity use data from the resort is
not available, but would result in much more accurate models and recommendations. A
recommendation is made for the resort to upgrade its power meters to allow the hourly data to
be collected.

8
Part II
Introduction to the Literature Review
This literature review will explore previous literature on solar power, wind power,
power cells, and the feasibility of renewable energy systems. The solar power section will look
at the types of solar power, the current conditions of the solar industry, and how government
policies are helping that industry. The wind power section will explain how wind energy is
converted to electricity, look at the current industry conditions for wind power production, and
explore the feasibility and possible future of wind energy. The power cell portion of the
literature review will explain how power cells work and explore their costs and benefits. Lastly,
the feasibility of renewable energy systems section will give a brief overview of previous case
studies of renewable energy systems in the hospitality industry.
The Literature Review
Solar Power
The solar power industry has seen substantial growth over the past decade. This section
of the paper is going to explain the four different types of solar power. The current market
conditions of the solar industry will then be reported. Lastly, there have been many changes in
government policy due to the new presidential administration in the United States. The
changes that affect the solar industry will be highlighted and their effect will be explained.

9
Types of Solar Power
When referring to solar power, we are actually referring to four different ways that the
sun’s power can be harnessed. The most common type of solar power is the photovoltaic cells
that convert sun light to electricity. There are also heating and cooling systems that are
powered by the sun; they are referred to as solar thermal systems. Concentrated solar power is
the third type of solar power; it involves utility scale photovoltaic projects. The last type of
solar power is lighting which involves saving electricity by installing skylights or windows based
on the sun’s position in the sky throughout the year (Solar Energy Industries Association, 2008).
Solar energy can also be broken into two types of systems, active and passive. Active
solar systems convert the sun’s heat and light into another form of energy. Passive solar power
comes from special designs or building material that use the sun’s position in the sky to provide
direct heating or lighting. Passive solar projects also consider the need for shade on the
building (Solar Energy Industries Association, 2008).
Current Solar Market Conditions
The U.S solar energy market has seen sustained increasing growth over the last 8 years
in the photovoltaic market and industry observers expect that growth to continue even in the
current tough economic environment. Total capacity of photovoltaics grew by 1,265
megawatts in 2008. This increased total capacity by a record high of 17 percent to 8,775
megawatts. The following figure shows a graph of the growth in the solar industry over the last
eight years (Solar Energy Industries Association, 2008).
10
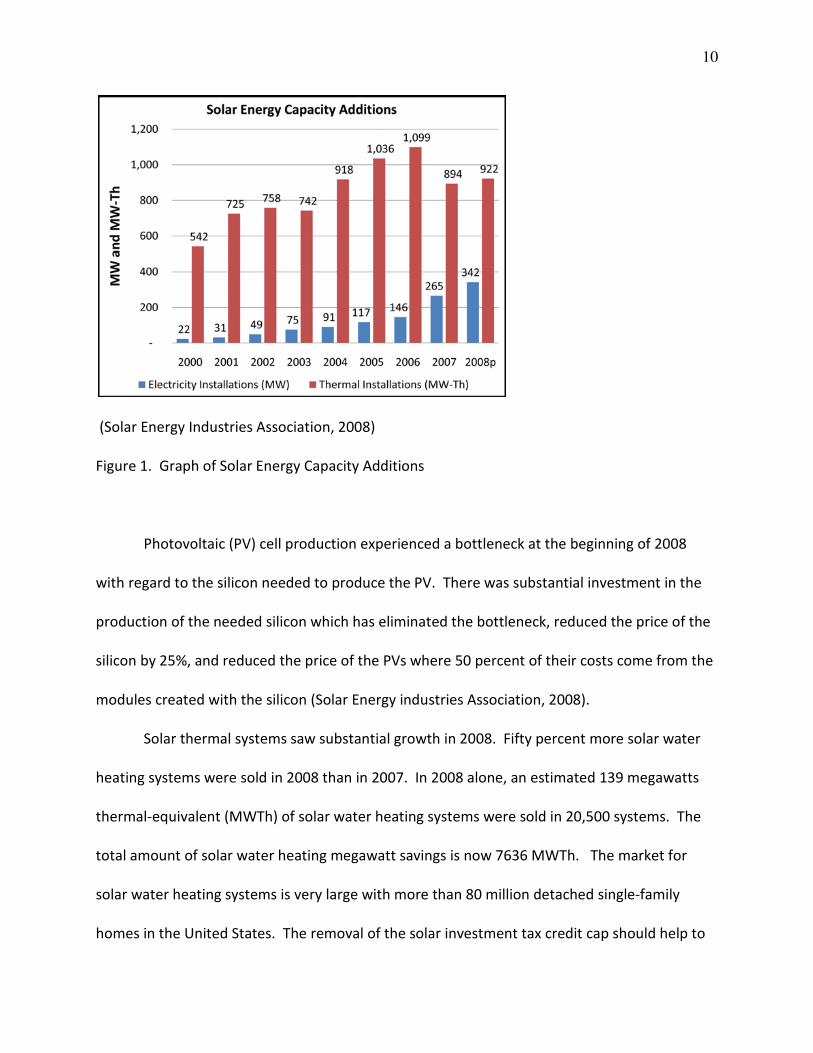
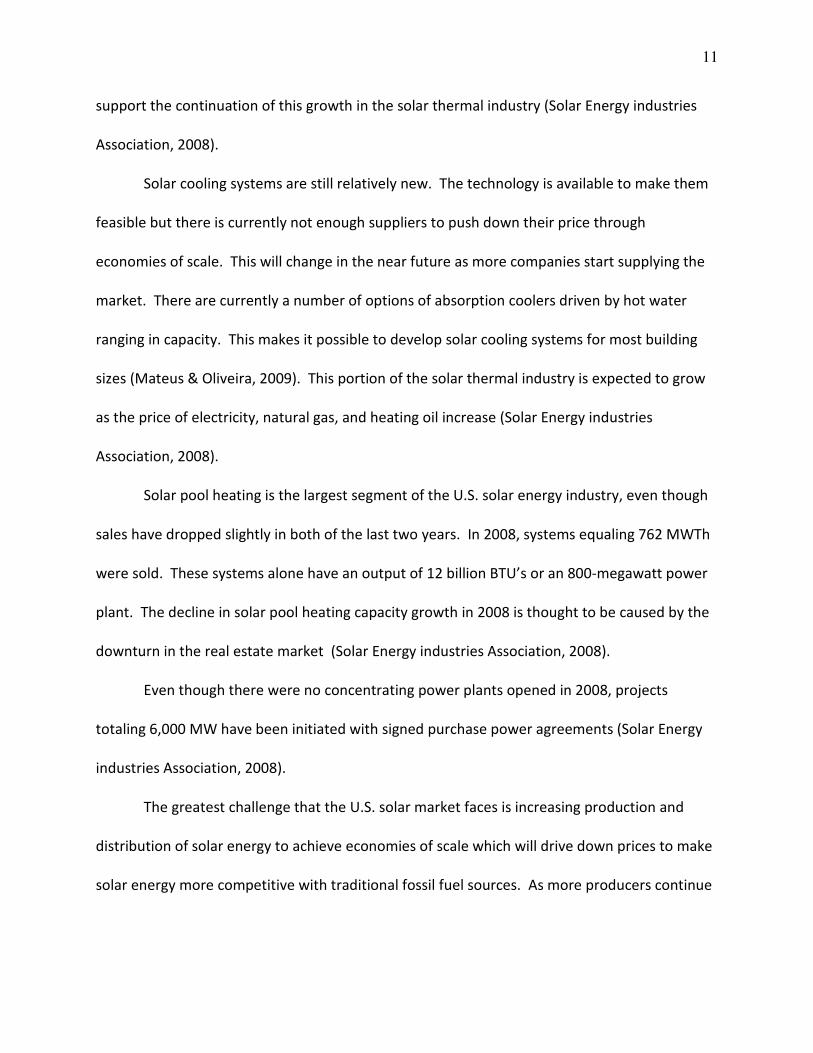
(Solar Energy Industries Association, 2008)
Figure 1. Graph of Solar Energy Capacity Additions
Photovoltaic (PV) cell production experienced a bottleneck at the beginning of 2008
with regard to the silicon needed to produce the PV. There was substantial investment in the
production of the needed silicon which has eliminated the bottleneck, reduced the price of the
silicon by 25%, and reduced the price of the PVs where 50 percent of their costs come from the
modules created with the silicon (Solar Energy industries Association, 2008).
Solar thermal systems saw substantial growth in 2008. Fifty percent more solar water
heating systems were sold in 2008 than in 2007. In 2008 alone, an estimated 139 megawatts
thermal-equivalent (MWTh) of solar water heating systems were sold in 20,500 systems. The
total amount of solar water heating megawatt savings is now 7636 MWTh. The market for
solar water heating systems is very large with more than 80 million detached single-family
homes in the United States. The removal of the solar investment tax credit cap should help to
11
support the continuation of this growth in the solar thermal industry (Solar Energy industries
Association, 2008).
Solar cooling systems are still relatively new. The technology is available to make them
feasible but there is currently not enough suppliers to push down their price through
economies of scale. This will change in the near future as more companies start supplying the
market. There are currently a number of options of absorption coolers driven by hot water
ranging in capacity. This makes it possible to develop solar cooling systems for most building
sizes (Mateus & Oliveira, 2009). This portion of the solar thermal industry is expected to grow
as the price of electricity, natural gas, and heating oil increase (Solar Energy industries
Association, 2008).
Solar pool heating is the largest segment of the U.S. solar energy industry, even though
sales have dropped slightly in both of the last two years. In 2008, systems equaling 762 MWTh
were sold. These systems alone have an output of 12 billion BTU’s or an 800-megawatt power
plant. The decline in solar pool heating capacity growth in 2008 is thought to be caused by the
downturn in the real estate market (Solar Energy industries Association, 2008).
Even though there were no concentrating power plants opened in 2008, projects
totaling 6,000 MW have been initiated with signed purchase power agreements (Solar Energy
industries Association, 2008).
The greatest challenge that the U.S. solar market faces is increasing production and
distribution of solar energy to achieve economies of scale which will drive down prices to make
solar energy more competitive with traditional fossil fuel sources. As more producers continue
12
to join the industry and current industry members grow, economies of scale will be achieved
(Solar Energy Industries Association, 2008).
Federal Government Policy
The end of 2008 proved to be very beneficial for the solar industry with regard
government policy. The Emergency Economic Stabilization Act of 2008 (EESA) extended the
solar Investment Tax Credit for eight years just three months before it would have expired. This
tax credit allows individuals and companies to write off 30 percent of their investment in solar
power against their taxes. Policies were changed so tax credits can now be credited against the
alternative minimum tax. Another improvement in policy with regard to solar power is that
utilities can now get an investment tax credit where it was prohibited before. The American
Recovery and Reinvestment Act of early 2009 also had a beneficial effect on the solar industry
by aggressively promoting investment in solar energy and removing the $2000 tax credit cap on
residential photovoltaic systems, making them more affordable than ever. These policy
changes will result in more stable demand which should allow the industry to continue to grow
and prices to continue to fall. There were also some beneficial changes in state policy (Solar
Energy industries Association, 2008).
A policy change that could have had a negative effect on the industry came from the
Bureau of Land Management which placed a temporary freeze on applications to develop solar
power projects on federal land. This freeze was lifted shortly after it was announced due to the
actions by supporters of solar power and renewable energy advocates. The current economic
downturn has also had a negative effect on the solar industry. Many companies have

13
experienced problems when trying to get credit. Some major investors have decreased their
investments in solar power. The downturn has also forced layoffs in some of the major solar
companies (Solar Energy industries Association, 2008).
Wind Power
Wind power production has seen many advancements in technology and efficiency
recently. This section will detail how wind power is converted to electricity. The current
market conditions of the wind power industry will be explored. Next, the feasibility of different
wind turbine technologies will be investigated. Lastly, potential future wind driven
technologies and how they work will be explored.
How Wind Power is Harnessed
Wind has kinetic energy that is moving the air particles. This kinetic energy is converted
to electricity through the use of a wind turbine. As the air particles fun into the windmill blade
they are forced to rotate. As they rotate a shaft is turned. This shaft enters a gearbox to
increase the speed at which the shaft is rotating. The output shaft that is spinning much faster
than the input shaft is connected to a generator that converts the rotational movement into
electricity at medium voltage. This medium voltage electricity is sent to a transformer where its
voltage is increased, making it flow through power lines more efficiently. The electricity is then
sent to a structure where it will be used. It can also be sent to a substation where the voltage is
increased again to send it long distances or to battery where it can be stored for later use.
Batteries are used on systems that are not connected to the utility grid. The electricity that is

14
stored in a battery must then be sent to an inverter that modifies it to be compatible with
home appliances. The batteries and inverter will increase the cost of this type of wind energy
system (American Wind Energy Association, 2007).
Current Market
There is enough wind energy potential in the United States to power the entire country.
North Dakota alone has enough wind energy potential to power a third of the country.
However, currently less than 1% of the electricity consumed in the U.S. comes from wind
power. Industry advocates feel that changes in regulatory barriers could help grow the
industry. They believe that increasing the proportion of electricity provided by the wind to 20%
is both affordable and feasible (American Wind Energy Association, 2007).
The wind energy industry saw substantial growth in 2008. One study says that sales of
wind turbines will reach $11 billion in 2008, that is an increase of 42% from just one year earlier
(Woody, 2008). It is expected that over 7,500 MW worth of wind power projects will be
completed in 2008, bringing the total capacity to 21,000 MW (American Wind Energy
Association, 2008). This saves about 32 billion tons of carbon dioxide production (Swisher, Real
De Azua, & Clendenin, 2001). The following figure shows a graph of the growth in capacity of
wind energy.

15
Figure 2. Graph of Cumulative and Annual Wind Capacity Growth
Feasibility of Wind Power
In the past 30 years the price of large scale wind energy projects has dropped more than
90%. This price drop is the result of technological innovations and is sufficient enough to allow
wind energy to be produced at a competitive rate to energy produced in a new natural gas
plant. There are five major technological changes that have helped to reduce the cost of wind
energy. The increase in wind turbine size has been the most obvious change. In the early 90’s,
the average turbine size was 100kW. By 2001, that number had grown to 1 MW. Bigger
turbines are more efficient. The weight of turbines have been reduced, this reduces the cost of
the raw materials that are put into the project. Economies of scale have started to take effect
and allow fixed costs to be spread over more products. Electronics and control systems have
16
been improved to increase efficiency. Finally, turbine blade design has allowed the turbine to
capture more of the wind energy (Swisher, Real De Azua, & Clendenin, 2001).
Other changes that have made wind power projects more feasible include the following.
State policy leaders have increased the capacity of wind energy in their states. The cost of wind
power has stayed stable when the cost of electricity from natural gas plants has gyrated sharply
in the past. The cost of wind energy is very predictable because its fuel, the wind, is free.
(Swisher, Real De Azua, & Clendenin, 2001). Forty-six states now have wind power production
projects (American Wind Energy Association, 2007). The growth of competition in the electric
industry and changes in their perceptions of the feasibility of wind plants has resulted in
companies differentiating themselves with wind energy to attract customers that care about
the environment. Now more than 190 utility companies provide wind based energy. The price
of gas has risen in the past years, making wind energy more viable. Investing in wind power
helps utilities to protect themselves from swings in the price of fuel. Lastly, tax credits from the
government for environmentally friendly activities have moved many utility companies toward
wind energy (Swisher, Real De Azua, & Clendenin, 2001).
Small wind turbines have also seen a steady drop in price, increased efficiency, and
increased market share. These small wind turbines can be used for off grid projects, hybrid
systems, and on-grid project. The prices of these systems can be competitive with diesel
generators (Swisher, Real De Azua, & Clendenin, 2001).

17
The Future of Wind Energy
Entrepreneurs are increasingly looking for new ways to harness the power of the wind
to save energy. This section of the paper will look at five ideas that may take off in the future.
One company came up with the idea of attaching a giant paraglider shaped kite to ships. In a
test run, the skysail was able to cut the cost of fuel by $1,000 a day. The company thinks its
product can cut the cost of fuel by 10% to 35% per year. There are also environmental benefits
of the product because it cuts gas emissions from the engine (Woody, 2008).
Another company is producing vertically mounted windmills. The blades are scoop
shaped and can catch wind from any direction. The turbine is silent when operating and
perfect for residential applications in low wind situations. The product comes in two
configurations, a two-kilowatt and four-kilowatt, which is enough to power the average house.
The payback period of this product is about ten years. Furthermore, new tax breaks for small
windmills are now available from the Emergency Economic Stabilization Act of 2008 (EESA)
which lowers the price and payback period even more (Woody, 2008).
The Magenn Air Rotor System (MARS) is a balloon filled with helium that is flown from
400 to 1000ft where there are steady winds. The balloon then starts to rotate and generates
electricity that travels through its tether back to earth. The MARS can be deflated at any time
and moved to new locations off the grid. Each system produces enough kilowatts to power the
average house (Woody, 2008).
Researchers at Delft University have come up with another idea to harness the winds
energy. They call it a Laddermill. It is a series of kites that are tied together and fly up to five
miles high where they then return toward earth in an endless loop. As they fly, they pull ropes

18
that are connected to generators on the ground. The researchers say the system can produce
100 megawatts of electricity or enough to power 100,000 homes (Woody, 2008).
The last wind concept that will be discussed is a combinations between solar and wind
power. The startup Cool Earth is increasing the efficiency of solar photovoltaic cells by putting
them in an air filled balloon that focuses the sunlight on the chip. The key to this product is
capturing the power of the air. The balloon is about 20 pounds, is made from the same
material as a chip bag and costs about $2 to produce. The company uses air pressure to change
the shape of the balloon to constantly focus sun rays on a highly efficient photovoltaic cell. This
increases the electricity production by the cell up to 400 times. Two of these balloons would
power the average house (Woody, 2008).
Fuel Cells
Fuel Cells are very clean and safe, and can be used for both thermal energy and
electricity productions. However, fuel cells can be very costly. This section of the literature
review is going to explain how fuel cells work and explore their costs and benefits.
How They Work
Fuel cells convert the energy from chemical reaction to electricity and thermal energy.
The fuel cell consists of two electrodes and an electrolyte. Hydrogen, the usual fuel, is supplied
to the anode where it is oxidized and gives off electrons. The electrons travel through an
external circuit to the cathode where they are consumed to reduce the oxidant. Ions are
traveling through the electrolyte at the same time to balance the flow of electrons and

19
completing the electrical circuit (Ellis, Von Spakovsky, & Nelson, 2001; Farooque & Maru, 2001).
A diagram of a basic fuel cell is presented in the following figure.
(Farooque & Maru, 2001)
Figure 3. Diagram of the Basic Fuel Cell
Fuel cells are efficient at part and full capacity and come in a variety of sizes. They can
be used for a wide range of activities including powering portable electronics, transportation,
building cogeneration, and being used as a utility power plant. In both portable and
transportation uses a fuel cell is combined with a fuel container that can have very high energy
storage density. In transportation functions, fuel cells have been shown to be much more
efficient and better for the environment than internal combustion engines. Building
cogeneration is accomplished when a fuel cell system is used for electricity and thermal heat.

20
This type of system can be used in high density areas because there are very low emissions and
has been found to be 80% efficient (Ellis, Von Spakovsky, & Nelson, 2001).
Benefits of Fuel Cells
The biggest benefits of fuel cell generators are that they are highly efficient and
extremely clean. They can also be used to provide heat and power to a building. The
cleanliness of fuel cells and the fact that they have produce little to no pollution allows for a
reduction in government regulation. Fuels cell projects usually gain regulatory approval easily.
Fuel cells also have very few moving parts so they are very reliable, quiet, and require very little
maintenance. As mentioned before, fuel cells are efficient no matter the size. This means they
can be located at the site where the power is needed and scaled to reduce costs (Farooque &
Maru, 2001).
Cost of Fuel Cells
Fuel cells have a maintenance cost of between $0.01 to $0.03 per kWh. Consumers can
buy a 200 kilowatt equivalent (kWe) system including installation for about $5,000 to $5,600
per kWe. As the technology used to produce fuel cells improves and production volumes
increase, costs of fuel cells are expected to fall to $1,000 per kWe or even lower. If the cost of
fuel cells falls below $1,000 per kWe, then they will be competitive with conventional power
generating systems. If the price falls even lower, they will surely become a dominate provider
of building electricity and heating. The figure below shows the relationship between the cost of

21
fuel cell systems compared to the cost of electricity and gas (Ellis, Von Spakovsky, & Nelson,
2001).
(Ellis, Von Spakovsky, & Nelson, 2001)
Figure 4. Graph of Fuel Cell Efficiency compared to Electricity and Gas Costs
Feasibility of Energy Independence
When looking at the feasibility of a stand-alone or grid connected hybrid electricity
system that includes a renewable energy source, it is important to consider reliability and cost.
Studies have shown that hybrid systems are usually more reliable and cheaper than systems
with only one source of electricity. It is also important to take climate into account when
designing a system. For example sunny places will be more ideal for photovoltaic hybrid system
than will be places with constant cloud cover (Bernal-Agustin & Dufo-Lopez, 2009).
22
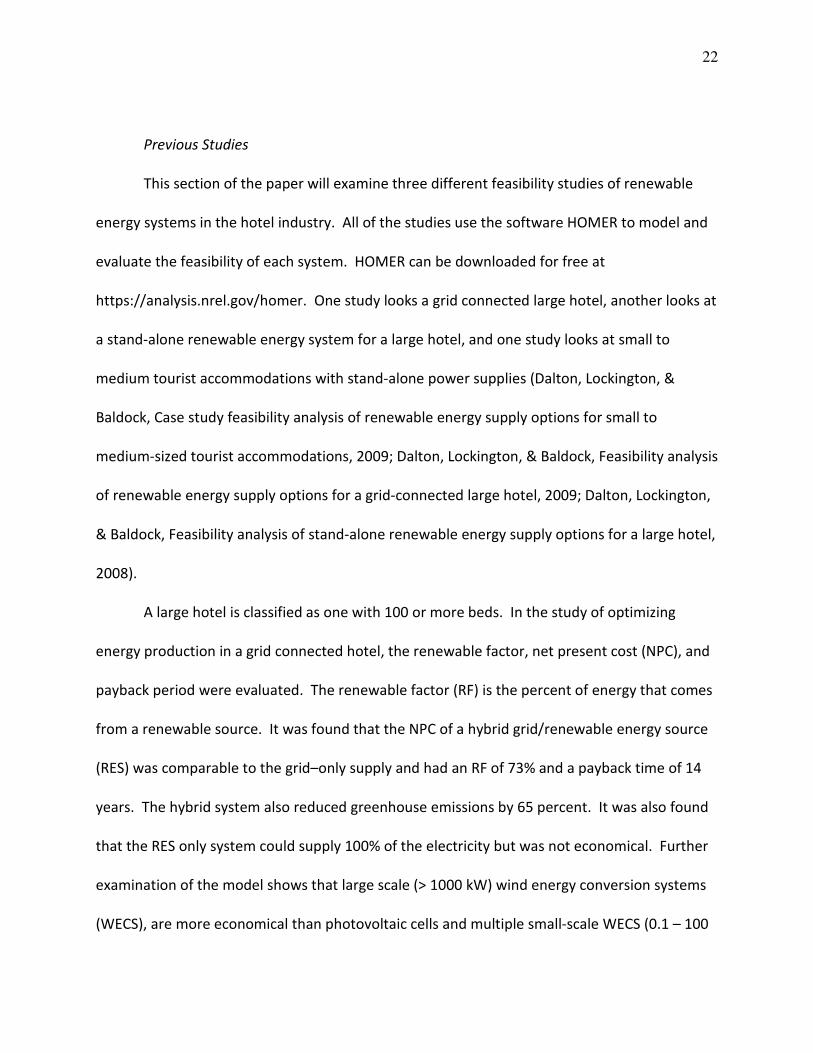
Previous Studies
This section of the paper will examine three different feasibility studies of renewable
energy systems in the hotel industry. All of the studies use the software HOMER to model and
evaluate the feasibility of each system. HOMER can be downloaded for free at
https://analysis.nrel.gov/homer. One study looks a grid connected large hotel, another looks at
a stand-alone renewable energy system for a large hotel, and one study looks at small to
medium tourist accommodations with stand-alone power supplies (Dalton, Lockington, &
Baldock, Case study feasibility analysis of renewable energy supply options for small to
medium-sized tourist accommodations, 2009; Dalton, Lockington, & Baldock, Feasibility analysis
of renewable energy supply options for a grid-connected large hotel, 2009; Dalton, Lockington,
& Baldock, Feasibility analysis of stand-alone renewable energy supply options for a large hotel,
2008).
A large hotel is classified as one with 100 or more beds. In the study of optimizing
energy production in a grid connected hotel, the renewable factor, net present cost (NPC), and
payback period were evaluated. The renewable factor (RF) is the percent of energy that comes
from a renewable source. It was found that the NPC of a hybrid grid/renewable energy source
(RES) was comparable to the grid–only supply and had an RF of 73% and a payback time of 14
years. The hybrid system also reduced greenhouse emissions by 65 percent. It was also found
that the RES only system could supply 100% of the electricity but was not economical. Further
examination of the model shows that large scale (> 1000 kW) wind energy conversion systems
(WECS), are more economical than photovoltaic cells and multiple small-scale WECS (0.1 – 100
23
kW). Not taken into account on this model is the possible increase in grid supplied electrical
costs and the imposition of carbon taxes, which would have a greater negative impact on grid
only systems. Findings indicate that in the situation tested, the hybrid system described above
is indeed more economical over a 20 year life than is the grid only system. The NPC of the
hybrid system is 50% lower than the grid only system (Dalton, Lockington, & Baldock,
Feasibility analysis of renewable energy supply options for a grid-connected large hotel, 2009).
In the study of a stand-alone renewable energy supply for large hotels, it was found that
RES systems can produce 100% of the energy required to sustain the property. However, the
lowest NPC comes from a RES/diesel hybrid system with an RF of 76%. Compared to a diesel
generator-only configuration, the NPC of the project is reduced by 50% and the greenhouse gas
emissions are reduced by 65% with the hybrid system. The hybrid scenario also results in a
payback period of 4.3 years. Similar to the grid connected hotel study, it is found that large-
scale WECS are more efficient than photovoltaic cells or small-scale WECS. It is important to
note that these studies are specific to their locations and not universally applicable for all hotels
(Dalton, Lockington, & Baldock, Feasibility analysis of stand-alone renewable energy supply
options for a large hotel, 2008).
The third study looks at the feasibility of renewable energy supply (RES) systems for
small to medium-scale hotels with less than 100 beds. The properties are also dependent on
stand-alone supplies. Once again the optimization test was based on payback period, net
present cost (NPC), and renewable factor (RF). Three different properties with hybrid systems
already utilized were evaluated. Additionally, all the properties were located in different
climates with different geographic characteristics. It was found that RES only systems can
24
produce enough electricity reliably, but it is more economical to use a hybrid system. In the
majority of cases, the best strategy to reduce NPC was to add further RES to the system,
resulting in a better RF factor and shorter payback times. It was also found that the optimized
RES/hybrid systems were comparable to a diesel generator only system. Furthermore, it was
found in the examined cases that wind energy conversion systems (WECS) were more
economical than photovoltaic cells. There was an increase of about three years in the payback
period from 3.5 years to 6.5 years when photovoltaic cells were used. Fuel cells were also
tested and it was found that they were not economical. When an increase in diesel fuel costs
and the implementation of a carbon tax were modeled into the experiment, the RES/hybrid
configuration became even better of an option at each property (Dalton, Lockington, & Baldock,
Case study feasibility analysis of renewable energy supply options for small to medium-sized
tourist accommodations, 2009).
Part III
Introduction
This portion of the paper is going to present a case study of the feasibility of a
renewable energy system in a specific small resort on Vancouver Island in British Colombia,
Canada. Electricity system simulation and optimization software is used to evaluate different
electricity systems. The results of the simulation and optimization software will then be
discussed and conclusions and recommendations will be made for the resort about the best
type of system to install. General recommendations will also be made to other small resort
owners about how to test renewable energy systems in their resorts.

25
The Resort
This case study is about the feasibility of electrical energy independence for the
Mackenzie Beach Resort, located on Mackenzie Beach in Tofino, British Colombia, Canada.
Mackenzie Beach Resort is the oldest, year round resort in Tofino and has been family owned
and operated since it began in the early 1970’s. Early tourists, eager to reach the ocean, were
only permitted to use the logging road on the weekends when loggers had days off. From this
Tofino’s tourism industry began to grow. That same road, paved since 1972, is Canada’s only
paved road to the open Pacific Ocean with Tofino marking the official western terminus of the
Trans Canada Highway.
Nearly 40 years ago a man named Bob Mackenzie acquired the stretch of coastline and
all the land between the water and highway. He named it Mackenzie Beach. He also purchased
an abandoned building next to the runway at Tofino Airport that had been used as pilot housing
during World War II, placed it on a barge and towed it around the tip of Tofino to where it sits
today as Cabin #1 at the resort. The Mackenzie family lived in this cabin while building their
family home, the resort front office and residence, from wood and other fittings that washed
up on the beach after falling off cargo ships further out in the pacific. Mackenzie Beach Resort
is currently owned by Dorothy and Mirko Lescanec and has resident managers, Sam and Krysta,
who are responsible for the daily operations of the property.
Mackenzie Beach Resort strives to be environmentally friendly. Even though all of its
electricity comes from the grid, the management has implemented other programs to benefit
the environment. The resort pool uses salt to sterilize the water instead of harmful chemicals.

26
All of the light bulbs on the entire property have been replaced with compact florescent light
bulbs which are more efficient and last longer. The fire wood that is supplied to the cabins only
comes from second growth forests. Instead of using thousands of small shampoo and
conditioner bottle, these shower gels are dispensed out of pumps in each shower. Finally, they
have implemented an extensive recycling program where the resort and guests can recycle
many of their used products instead of just throwing them in the garbage.
The resort is classified as a small resort; it currently consists of 14 cabins of various sizes,
18 RV sites with hook-ups and power, 43 tent sites, a pool and hot tub, and a front office with
attached manager residence. The cabins have a total maximum capacity of 70 guests and
contain 40 beds. Each cabin has a full kitchen and two sources of heat. The main heat source
in each cabin is electric baseboard heaters, but each cabin has a wood burning fireplace with
the exception of cabins 11 through 14 which have gas fireplaces. The year is broken up into
four different seasons for the resort. Below is a table of the dates of each season.
Table 1. Mackenzie Beach Resort Seasons
Low Season
Jan 2 to Mar 12
Oct 13 to Nov 6
Nov 10 to Dec 19
Mid Season
Mar 13 to May 15
May 19 to Jun 26
Sept 2 to Oct 9
Dec 19 to Dec 31
High Season
Jun 27 to Sept 1
Holiday Season
April 10, 11, 12,
(Easter)
May 16, 17, 18
(Victoria Day)
Oct 10, 11, 12
(Thanksgiving)
Nov 7, 8, 9
(Remembrance Day)

27
One of the main uses of electricity at this resort is for heating. The temperature
correlates with the occupancy of the resort in that the low season is when it is cold outside and
high season is in the summer when it is warmer. This correlation results in relatively even
energy consumption from month to month even thought the number of guests vary. In the
low season there are few guests, but they use a lot of electricity to heat the cabins. While in
the high season, there are more guests but they do not need to use as much electricity to heat
the cabins.
Mackenzie Beach Resort is connected to a traditional grid and consumes around
320,000 KWh of electricity per year that it purchases from the local utility company, BC Hydro,
for $0.084 per KWh. This results in a yearly electricity bill of $27,840.97. They receive a power
bill every two months. The property contains 16 power meters; the information from each
power meter is combined to equal the total power usage of the entire resort. The electricity
consumption information used to model a new electricity system came from these electricity
bills.
The climate the resort is located in is the marine or humid west coast climate. This
climate is found on the west coast of mid latitude continents and is very humid through most of
the year. Its geographic location results in westerly winds from the ocean that bring cloudy
skies, mild temperatures, and a lot of precipitation. The climate is greatly influenced by the
orientation of the mountain systems in Europe and North America.
The winds generated in this climate are usually mild and has a yearly average speed of
5.09 meters per second. Furthermore, the solar energy production opportunities are also low
because of the cloudy skies. The average daily radiation in Tofino is only 3.290 kilowatt hours

28
per meter squared per day. This climate creates relatively little power production potential for
either wind turbines or solar panels.
Methodology
In the methodology section of this paper, the data input sources will be explored and
evaluated. These data inputs include the electrical use data of the Mackenzie Beach Resort, the
solar radiation and wind speed information for the area of the country where Mackenzie Beach
Resort is located, the cost and efficiency of different solar panels and wind turbines, and the
cost and buyback rate of electricity from the utility grid. The method and criteria that the
HOMER software uses to test the feasibility of different electrical system will also be explained.
Lastly, the results of the optimization test run by the software will be examined and explained.
Data Inputs
The electricity use data inputs for the HOMER software came from the bimonthly
electricity bills the resort received. The average electricity use for each month was then split
evenly to form daily electricity consumption for the resort. These daily electricity consumption
amounts were then split evenly again to form the hourly consumption of the resort. The
model would have been much more accurate if true hourly electrical data from the resort was
used instead of estimates, but that information has not been collected. To make this a more
accurate study, the resort would need to monitor its hourly electricity consumption for an
entire year and import that data into the HOMER software.

29
The monthly solar radiation information was imported from the National Renewable
Energy Laboratory website (U.S. Department of Energy, 2009) automatically by the HOMER
software. Actual daily measurements would have been more accurate, but that information is
not available, so the monthly average was used. It is found that the average solar radiation for
the year is 3.29 kilowatt hours per meter squared per day with a summer peak of 5.98
kWh/m2/day in July and a winter low of .8 kWh/m2/day in December. Below is a graph of the
yearly solar radiations measurements.
Figure 5. Graph of Average Monthly Solar Radiation
The average wind speed information was obtained from the wind atlas website
(Environment Canada, 2008). The measurement of the wind was taken in Tofino, BC, Canada
which is about 2 km from the resort. It was found that the yearly average wind speed is 4.85
meters per second(m/s) with a low of 3.16 m/s in the summer and a high of 7.20 m/s in the
winter. The wind speed information was only available by season. The model would be more

30
accurate if daily average wind speed information was available and used. Below is a graph of
the wind data that was used for the model.
Figure 6. Graph of Monthly Average Wind Speed
Wind turbine wind energy conversion rates were provided by the HOMER software. The
price for each wind turbine was found on the manufactures’ websites. Three different wind
turbine configurations were tested. The first was a single large GE 1500 kW rated wind turbine
with a cost of about $2.5 million with installation. The second system included many small 5
kW rated vertical axis wind turbines manufactured my Enviro Energies with a setup cost of
$30,000 per turbine. There are a number of different sail sized that can be installed on these
turbines. Large sails are better for low wind applications. Since the average wind speed is
relatively low at the location of the resort, the largest sail configuration where tested. The
larger sail also costs $9000 more than the small sails. The third system was a 50 kW capacity
turbine by AOC with a cost of $150,000. All of the initial costs include installation. It was also
assumed that the lifetime of each wind turbine is 25 years.
There were three different Photovoltaic solar cells tested as well. All three cells are
manufactured by Sanyo, a leader in the solar power industry. The first was a 3 kW system with
an initial cost of $14,000. A 5.5 kW rated panel was also tested with a cost of $24,000. Finally,

31
an 8 kW rated panel was tested with an initial cost of $45,000. All of the pricing for the solar
panels came from the manufacturer’s website.
A converter is needed to convert the DC electricity that is produced by the solar panel
and Enviro Energies Wind Turbins. The cost of this continuous 6 kW DC to AC converter is
$5000. It is only required when a solar panel or the Enviro Energies wind turbine is used.
Batteries were not needed in this system because power can be sold back onto the grid
at a better rate than it would cost to store it for later use in a battery. The buyback rate the
utility company, BC Hydro, gives to its customers is $0.054 per kWh.
All of the information about the cost of grid electricity was taken from the recent power
bills the resort received. It was found they are paying $0.084 per kWh of electricity. The
energy flow diagram for the alternating current (AC) and direct current (DC) buses used in the
simulation of new energy systems at the Mackenzie Beach Resort can be found below.
Figure 7. Energy Flow Diagram for Mackenzie Beach Model
32
Testing
The software HOMER was used to simulate the different energy systems available to the
resort. It then finds the optimal system based on the net present cost, renewable factor, and
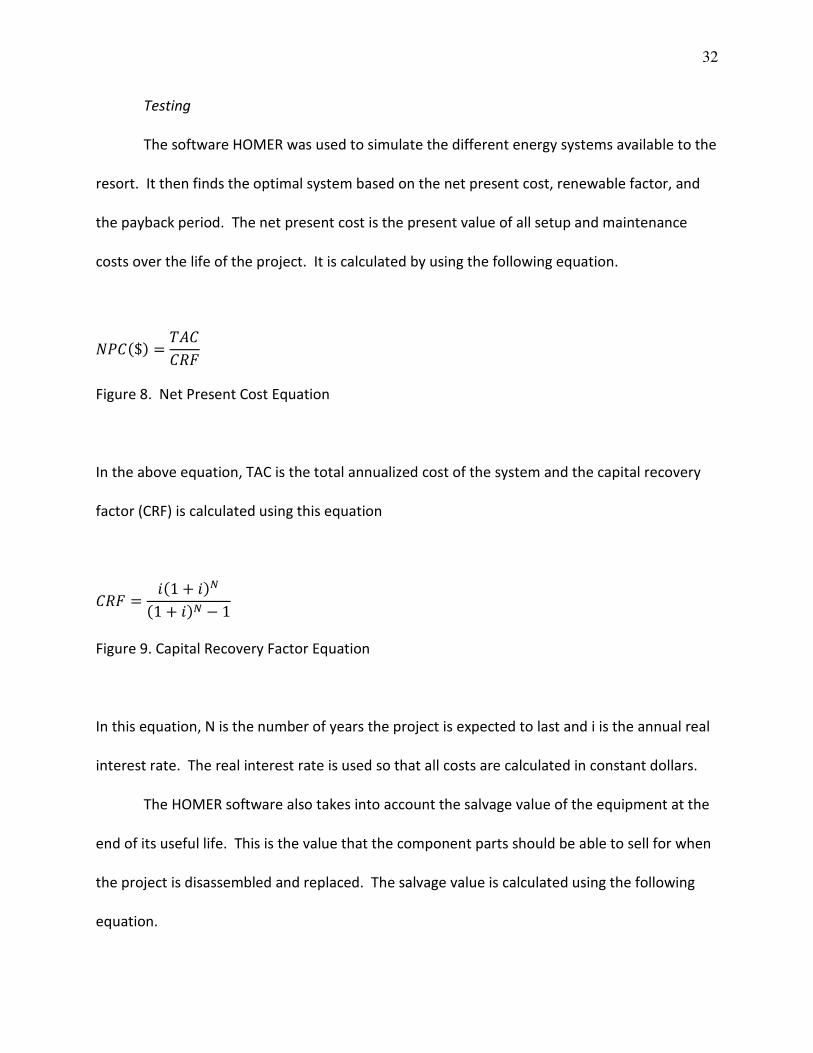
the payback period. The net present cost is the present value of all setup and maintenance
costs over the life of the project. It is calculated by using the following equation.
����$� ���
��
Figure 8. Net Present Cost Equation
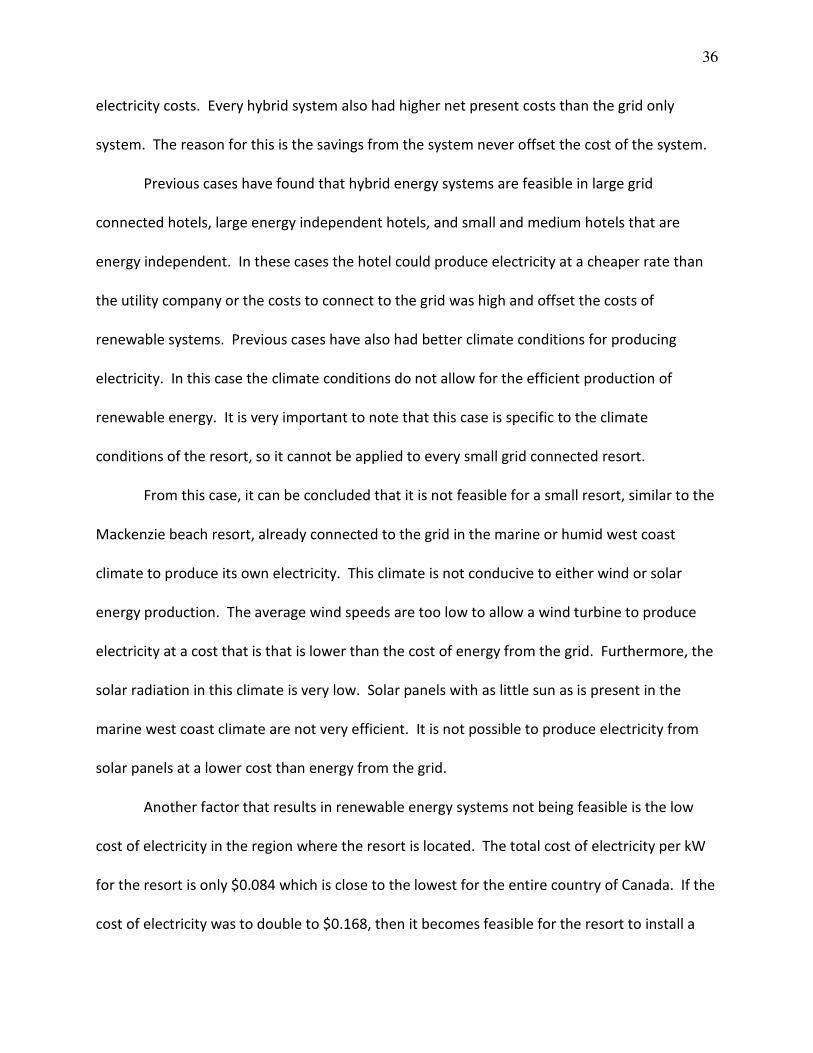
In the above equation, TAC is the total annualized cost of the system and the capital recovery
factor (CRF) is calculated using this equation
�� ���1 � ���
�1 � ��� � 1
Figure 9. Capital Recovery Factor Equation
In this equation, N is the number of years the project is expected to last and i is the annual real
interest rate. The real interest rate is used so that all costs are calculated in constant dollars.
The HOMER software also takes into account the salvage value of the equipment at the
end of its useful life. This is the value that the component parts should be able to sell for when
the project is disassembled and replaced. The salvage value is calculated using the following
equation.

33
��$� � �������
����
Figure 10. Salvage Value Equation
Crep is the replacement costs of each component, Rrem is the remaining life of the component,
and Rcomp is the entire life of the component.
The renewable factor is the amount of energy consumed that comes from a renewable
source. It is calculated simply by dividing the amount of electricity produced by renewable
sources by the total energy consumption of the property.
Finally, the payback period is calculated using grid only costs and grid – renewable
energy source (RES) hybrid system costs. The present value of the annual savings of the hybrid
system over the grid only setup are then calculated and summed to offset the initial
construction costs. The year that the sum of the present value of annual savings is greater than
the initial construction cost is the payback period.
Results
When the optimization test was run on all the data that was entered into the HOMER
software, it was found that the most cost effective energy system is the grid connected system
with no renewable sources of electricity. This is the present configuration of the resort. The
grid only configuration monthly payments are the basis for which other systems’ payback
periods are evaluated. Since there are little to no savings every month with hybrid systems,
there is no payback period for any of them. Furthermore, the overall cost per kilowatt of

34
electricity is lowest in the grid only configuration by $0.02. The electricity is all coming from the
grid which results in a renewable factor of zero. Lastly, the net present cost (NPC) of the future
electricity bills is $382,431 which is the lowest of any of the other system configurations.
The next best setup if renewable electricity is used is a hybrid grid/solar system. The
solar system that would be used is the 3 kW rated system which is the smallest system. The
initial costs for this system would be $15,000. The savings per a year that would result from
this system is only $74. This means that there is no payback period for this system because the
savings will never offset the initial costs. This system results in a very small renewable factor of
01. That means that only 1 percent of the electricity used by the resort would come from a
renewable source. The NPC of this system is $396,377 which is $13,946 more than the grid
only system.
The third best system configuration is a hybrid grid/small wind turbine system that is
rated at 5 kilowatts. This system would have an initial setup cost of $31,000 and result in only
$653 in electrical savings per year. Similar to the hybrid grid/solar system, this system will
never pay for itself. The renewable factor for this system is .06 which means only 6 percent of
the electricity used by the resort is going to come from the Enviro Energies wind turbine. The
NPC on this system is even higher than the grid/solar hybrid system. It is $404.223 which is
$21,792 more than the grid only system.
The least expensive system that incorporated both wind power and solar power with
the grid electricity is one were a 3 kW solar system is used along with a single 5 kW wind
turbine from Enviro Energies. This system results in yearly savings of $755 but has a setup cost
of $45,000. As with the past two hybrid system, this system also will never pay for itself, but it

35
results in the highest renewable factor of any of the previous systems at .07. The NPC of this
system is also very high at $416,786 which is $34,355 greater than the grid only system.
The resort is too small to sustain a large wind turbine, the most efficient system using a
large turbine has a renewable factor of .94, but the NPC is very high at $1,232,837. The yearly
savings to the resort would be $117,043 because they could sell the excess power they
generate back to the utility company, but that is still not enough to pay off the initial
investment of $2.5 million.
Conclusion
The feasibility of renewable energy systems was tested on a grid connected resorts in
the marine west coast climate. Three factors were considered to determine if it was feasible
for a small resort to implement a renew energy system. These three factors were the payback
period, the renewable factor, and the net present cost. In all three hybrid grid/renewable
source systems the payback period was nonexistent. That is to say the present value of the
energy cost savings never equaled the initial cost of the renewable energy source. The
renewable factor in each of the most efficient hybrid systems was very low, less than 10
percent. This can be attributed to the fact that regardless of the size of the system, over its
entire lifetime, the cost per kW of electricity is greater than the cost of a kW of electricity from
the grid. This means the program found the system configuration with the lowest initial setup
cost and added it to the model to make the hybrid system that was the least expensive. The
program knew the price of any hybrid system would never be made up from the savings in
36
electricity costs. Every hybrid system also had higher net present costs than the grid only
system. The reason for this is the savings from the system never offset the cost of the system.
Previous cases have found that hybrid energy systems are feasible in large grid
connected hotels, large energy independent hotels, and small and medium hotels that are
energy independent. In these cases the hotel could produce electricity at a cheaper rate than
the utility company or the costs to connect to the grid was high and offset the costs of
renewable systems. Previous cases have also had better climate conditions for producing
electricity. In this case the climate conditions do not allow for the efficient production of
renewable energy. It is very important to note that this case is specific to the climate
conditions of the resort, so it cannot be applied to every small grid connected resort.
From this case, it can be concluded that it is not feasible for a small resort, similar to the
Mackenzie beach resort, already connected to the grid in the marine or humid west coast
climate to produce its own electricity. This climate is not conducive to either wind or solar
energy production. The average wind speeds are too low to allow a wind turbine to produce
electricity at a cost that is that is lower than the cost of energy from the grid. Furthermore, the
solar radiation in this climate is very low. Solar panels with as little sun as is present in the
marine west coast climate are not very efficient. It is not possible to produce electricity from
solar panels at a lower cost than energy from the grid.
Another factor that results in renewable energy systems not being feasible is the low
cost of electricity in the region where the resort is located. The total cost of electricity per kW
for the resort is only $0.084 which is close to the lowest for the entire country of Canada. If the
cost of electricity was to double to $0.168, then it becomes feasible for the resort to install a
37
single large windmill or a few medium sized windmills. The price of $0.168 per kilowatt is
already being paid in some regions in Canada, including Charlottetown on Prince Edward Island.
If the price of electricity and buyback rate that the utility pays for excess electricity were to
both double, it becomes very feasible for the resort to build a single large wind turbine. The
net present cost of such turbine would be -$732,264. The payback period for this turbine is
11.98 years. Furthermore, the renewable factor is very high at .94. Even though the initial
costs of the turbine is $2.5 million. The company would save $52,977 dollars a year and earn
$229,337 from selling electricity back to the utility company. This results in a net benefit of
$282,314 per year for the resort. Solar panels are still not feasible even if the price of electricity
were to double.
In cases where a new resort is planned, it is important to consider the costs of
connecting to the grid. These initial costs to connect to the grid that the resort would have to
pay may be enough to offset the cost of renewable energy systems and make them feasible
even in the marine west coast climate.
Recommendations
From the research preformed and the tests run in this case study, recommendation can
be made to the Mackenzie Beach Resort to not invest in a renewable energy system yet. The
current economic and environmental conditions are more favorable to buying energy from the
local utility company. There are no configurations of a renewable energy hybrid system that
would result in a lower net present cost of electricity for the resort.

38
More importantly, it can be recommended to the resort to continue to monitor the
economic environment of electricity. If electricity prices are to rise or the prices of renewable
systems are to fall, that data needs to be factored into the modeling software to reevaluate the
feasibility of a renewable energy system.
Recommendations are also made to the resort to better monitor its electricity use. The
model would be much more accurate if hourly electricity use data was available from the entire
resort for an entire year. If possible, the resort should install updated electricity meters with
the capability of recording hourly use data. This is the most accurate and easiest way for the
resort to collect its detailed electricity use data. The resort should also collect hourly wind
speed data in its specific location. There is currently only seasonal wind speed information
available which results in a less accurate model in the HOMER software. These more accurate
data samples will result in a much more accurate model in the HOMER software to determine
the feasibility of a renewable system.
Furthermore, the recommendation is made to any resort that is considering a
renewable energy system to use the same software that was used in this case study to model
the electricity system at the Mackenzie Beach Resort. The HOMER software is free to download
at https://analysis.nrel.gov/homer/ and has been found to be very accurate when accurate data
is used to model the new energy system. The software is a great way to find the optimal
energy system for the project being modeled. It is also important to note that each system
needs to be modeled to determine if it is feasible. There are many inputs, specific to each
project, that affect the feasibility and efficiency of a renewable energy system. It is not possible
to generalize results from one study to an entire industry.

39
References
American Wind Energy Association. (2008, December). AWEA Third Quarter 2008 Market
Report. Retrieved March 20, 2009, from AWEA:
http://www.awea.org/publications/reports/3Q08.pdf
American Wind Energy Association. (2007). Wind Energy Today. Retrieved March 16, 2009,
from Wind Energy Today:
http://www.awea.org/pubs/factsheets/WindPowerTodayFinal.pdf
Ayres, I., & Nalebuff, B. (2006, September 4). Easy Savings. Forbes , pp. 146-146.
Bernal-Agustin, J. L., & Dufo-Lopez, R. (2009). Simutation and optimization of stand-alone
hybrid renewable energy systems. Renewable and Sustainable Energy Reviews , 8.
Chan, W. W. (2005). Predicting and saving the consumption of electricity in sub-tropical hotels.
International Journal of Contemporary Hospitality Management , 17, 228-238.
Dalton, G., Lockington, D., & Baldock, T. (2009). Case study feasibility analysis of renewable
energy supply options for small to medium-sized tourist accommodations. Renewable
Energy , 34, 1134-1144.
Dalton, G., Lockington, D., & Baldock, T. (2009). Feasibility analysis of renewable energy supply
options for a grid-connected large hotel. Renewable Energy , 34, 955-964.
Dalton, G., Lockington, D., & Baldock, T. (2008). Feasibility analysis of stand-alone renewable
energy supply options for a large hotel. Renewable Energy , 33, 1475-1490.
Ellis, M. W., Von Spakovsky, M. R., & Nelson, D. (2001). Feul Cell Systems: Efficient, Flexible
Energy Conversion for the 21st Century. IEEE , 89, 1808-1818.
40
Environment Canada. (2008, July 27). Wind Rose, Wind Speed Histogram, and Turbine Formula.
Retrieved April 1, 2009, from Canadian Wind Energy Atlas:
http://www.windatlas.ca/en/rose.php?field=EU&height=30&season=ANU&no=55&ni=2
16&nj=360
Farooque, M., & Maru, H. C. (2001). Fuel Cells - The Clean and Efficient Power Generators. IEEE ,
89, 1819-1829.
Guizzo, E. (2008, March). IEEE Spectrum. Retrieved March 16, 2009, from IEEE Spectrum:
www.spectrum.ieee.org/mar08/6020
Mateus, T., & Oliveira, A. C. (2009). Energy and economic analysis of an integrated solar
absorption cooling and heating system in different building types and climates. Applied
Energy , 86, 949-957.
Siracusa, G., La Rosa, A. D., Palma, P., & La Mola, E. (2008). New frontiers for sustainability:
emery evaluation of an eco-village. Environ Dev Sustain , 10, 845-855.
Solar Energy industries Association. (2008). 2008 Year in Review. Retrieved March 19, 2009,
from seia: http://www.seia.org/galleries/pdf/2008_Year_in_Review-small.pdf
Solar Energy Industries Association. (2008). About Solar Energy. Retrieved March 20, 2009, from
SEIA: http://www.seia.org/cs/about_solar_energy
Swisher, R., Real De Azua, C., & Clendenin, J. (2001). Strong Winds on the Horizon: Wind Power
Comes of Age. IEEE , 89, 1757-1764.
U.S. Department of Energy. (2009, March 10). NREL: Solar Research Home Page. Retrieved April
1, 2009, from National Renewable Energy Labratory Home Page:
http://www.nrel.gov/solar/

41
Woody, T. (2008, October 27). The Future of Wind Power. Fortune , pp. 59-60.