Carbon Footprint Report 2014 - European Investment Bank · European Investment Bank . Carbon...
34
European Investment Bank Carbon Footprint Report 2014 GHG emissions resulting from EIB Group internal operations January to December 2014 This report has been prepared by Carbon Trust Advisory Ltd for the European Investment Bank using data provided by the EIB. Report dated: v1.5 23 rd July 2015
Transcript of Carbon Footprint Report 2014 - European Investment Bank · European Investment Bank . Carbon...

European Investment Bank
Carbon Footprint Report 2014
GHG emissions resulting from EIB Group
internal operations
January to December 2014
This report has been prepared by Carbon Trust Advisory Ltd for the European
Investment Bank using data provided by the EIB.
Report dated: v1.5 23rd July 2015

CONTENTS
1 EXECUTIVE SUMMARY ............................................................................ 4 2 INTRODUCTION .................................................................................... 5 3 ORGANISATIONAL AND OPERATIONAL BOUNDARY ....................................... 6
3.1 Organisational boundary ......................................................................... 6 3.2 Operational boundary ............................................................................. 6 3.3 Reporting period covered ........................................................................ 7
4 METHODOLOGY .................................................................................... 9 4.1 Emission sources and activity data ........................................................... 9 4.2 Emission factors ................................................................................... 11 4.3 Emissions inventory calculation .............................................................. 12
5 CARBON FOOTPRINT ........................................................................... 13 5.1 Total net emissions ............................................................................... 13 5.2 Mobility emissions analysis..................................................................... 16 5.3 Stationary emissions analysis ................................................................. 19 5.4 Data centres analysis ............................................................................ 21 5.5 Paper consumption analysis ................................................................... 22 5.6 Water analysis ...................................................................................... 23 5.7 Waste analysis ..................................................................................... 24
6 DATA ASSESSMENT AND METHODOLOGY CHANGES ..................................... 26 6.1 Data quality and completeness ............................................................... 26 6.2 Change to relative carbon footprint calculation ......................................... 27
7 ENVIRONMENTAL INDICATORS 2014 ..................................................... 28 7.1 Emissions by scope ............................................................................... 28 7.2 Net emissions by type ........................................................................... 29 7.3 Other indicators .................................................................................... 29
8 ANNEX – SPECIFIC RESPONSES TO GRI INDICATORS ................................ 30 8.1 G4-EN6: Reduction in energy consumption .............................................. 30 8.2 G4-EN19: Reduction of greenhouse gas (GHG) emissions .......................... 31 8.3 G4-EN23: Total weight of waste by type and disposal method .................... 32
FIGURES Figure 1: Boundary diagram ............................................................................................ 8 Figure 2: 2007-2014 total and relative net emissions.......................................................... 13 Figure 3: 2007-2014 scope 1 and 2 emissions breakdown by source ..................................... 14 Figure 4: 2007-2014 scope 3 emissions breakdown ............................................................ 14 Figure 5: Emissions by source ......................................................................................... 15 Figure 6: Contribution of mobility emissions ...................................................................... 16 Figure 7: Contribution of stationary emissions ................................................................... 19 Figure 8: Contribution of data centres emissions ................................................................ 21 Figure 9: Contribution of paper consumption emissions ....................................................... 22 Figure 10: Contribution of water emissions ....................................................................... 23 Figure 11: Contribution of waste emissions ....................................................................... 24 Figure 12: Waste emissions by type ................................................................................. 25

TABLES Table 1: Activity data ..................................................................................................... 10 Table 2: Emission factors ................................................................................................ 11 Table 3: Mobility emissions and activity data ..................................................................... 17 Table 4: Owned vehicles ................................................................................................. 18 Table 5: Stationary emissions and activity data ................................................................. 20 Table 6: Waste emissions and activity data ....................................................................... 24 Table 7: Data quality and completeness assessment ........................................................... 26 Table 8: Energy consumption per employee ...................................................................... 30 Table 9: Waste categories .............................................................................................. 34

Page 4 of 34
1 EXECUTIVE SUMMARY
The EIB Group first calculated the carbon footprint of its head office operations in
2007 and set a target to reduce emissions by 20-30% by 2020. This includes emissions from energy use in the buildings (natural gas for heating and power generation, and purchased electricity and steam for power), from mobility activities
(owned vehicles, business travel and employee commuting), from waste disposal and from the production of paper used in the offices. As purchased electricity is covered
by green guarantees of origin, it is treated as zero carbon on a net basis.
In 2014, the EIB’s total net carbon footprint was 17,510tCO2e, an increase of 22% from 2013 and a decrease of 2% compared to 2007.
The relative carbon footprint in 2014 was 6.85tCO2e per employee. The relative carbon footprint for 2013 was 6.07 tCO2e per FTE, and the baseline year 2007 was
11.95 tCO2e per FTE1. This reflects a 70% increase in staff numbers since 2007. As such, the EIB is on track to achieve its carbon reduction target, which is in line with the EU’s target of 20-30% reduction by 2020.
The most significant source of emissions (94% of total net emissions) relates to
mobility activities. Air travel represents the biggest share of this (78% of total net emissions). Policies related to travel class are in place to minimise emissions, but it is a core part of EIB’s business activity and emissions will therefore remain significant.
1 Note, that in 2014 the EIB changed the methodology for calculating numbers of employees from an FTE
(full time equivalent) basis to a total number of contracted employees. See section 6.2 for more details.

Page 5 of 34
2 INTRODUCTION
The European Investment Bank (EIB) was established in 1958 under the Treaty of
Rome. It is the European Union’s financing institution, with a remit to contribute towards the integration, balanced development and economic and social cohesion of the Member States. It raises funds on the capital markets to finance projects that
meet EU objectives: regional development, trans-European networks of transport, telecommunications and energy, research, development and innovation,
environmental improvement and protection, health and education. Since 2007, the EIB is the largest Green Bonds Issuer, offering the opportunity to investors to
participate in projects in the fields of renewable energy and energy efficiency. Outside of the European Union, the EIB implements the financial components of agreements concluded under the European development aid and cooperation policies.
The European Investment Fund (EIF) is a European Union agency, majority-owned by
the EIB, whose remit is to provide finance through private banks and funds to small and medium-sized enterprises. Together the EIB and the EIF constitute the EIB Group. The EIF is included within the boundary of the EIB’s carbon footprint and
references to the EIB’s emissions in this report include the EIF.
The EIB first calculated its carbon footprint in 2007 and adopted a 20-30% reduction target from this baseline to 2020. This was consistent with the European Commission target for 2020 of a 20% reduction in EU greenhouse gas emissions from 1990 levels
(with an 8% reduction to be achieved between 2008 and 2012 as agreed under the Kyoto Agreement). For Luxembourg, the National Emissions Reduction target was set
at 28% by 2012 based on its relative wealth at the time. The EIB’s commitment to measure and manage its footprint is consistent with its
environmental and social policies, principles and standards for the projects it finances. Understanding its carbon footprint also allows it to identify and implement measures
to reduce emissions and to track performance against its target. Measures taken in previous years include expansion into a BREEAM ‘excellent’ building and investment in the energy efficiency of existing buildings, in addition to some activities to reduce
travel related emissions. Examples of specific measures taken in 2014 to reduce energy consumption include:
Regulation and distribution optimization of heating and cooling systems (adaptation to the real needs);
Implementation of drive system on heating circulation pumps;
Improvement of lighting management; Optimization of ventilation system management;
Replacement of old network printers and copiers with brand new multifunctional devices that can print, copy and scan.
This report presents the analysis of EIB’s 2014 carbon footprint based on the GHG Protocol Corporate Standard and the Global Reporting Initiative principles and
indicators.

Page 6 of 34
3 ORGANISATIONAL AND OPERATIONAL BOUNDARY
3.1 Organisational boundary
The organisational boundary defines the businesses and operations that constitute the company for the purpose of accounting and reporting greenhouse gas emissions. Companies can choose to report either the emissions from operations over which they
have financial or operational control (the control approach) or from operations according to their share of equity in the operation (the equity share approach).
The EIB’s carbon footprint uses the operational control approach. As such, it includes
the EIB and EIF head office operations in Luxemburg (Kirchberg, BHK and the new site PKI). Smaller regional offices are not included due to their non-material share of the total footprint and to difficulties obtaining consistent data.
3.2 Operational boundary
Defining the operational boundary involves identifying emissions associated with its operations, categorising them as direct and indirect emissions, and choosing the scope of accounting and reporting for indirect emissions.
The following definitions are used:
Direct GHG emissions Scope 1: emissions from sources that are owned or controlled by the reporting
entity (i.e. any owned or controlled activities that release emissions straight into the atmosphere).
Indirect GHG emissions Indirect emissions occur as a consequence of the reporting entity’s activities but at
sources that are owned or controlled by another entity (and are therefore their scope 1 emissions). These are classified as:
Scope 2: Indirect GHG emissions from the consumption of purchased electricity, heat, steam or cooling.
Scope 3: Indirect GHG emissions from other activities. A detailed Standard
exists that sets out the rules for 15 categories of scope 3 emissions as indicated in Figure 12.
2 The Corporate Value Chain (Scope 3) Accounting & Reporting Standard:
http://www.ghgprotocol.org/standards/scope-3-standard

Page 7 of 34
The operational boundary for EIB’s carbon footprint report includes the following:
Scope 1: Natural gas combusted in boilers to heat EIB buildings and used in
the co-generation plant to generate heat and power, and transport fuel used to run vehicles owned by the EIB. There are no relevant fugitive emissions because air conditioning systems use ammonia.
Scope 2: Purchased grid electricity (from green tariffs) and steam used for
power in the properties (lighting, air conditioning, small power, elevators, etc).
Scope 3: Transport fuel and power used by air and rail transport operators for
EIB business travel, by the outsourced mini-bus service that operates between the Luxembourg sites and by employee-owned vehicles for commuting to and
from work; emissions from waste management operations due to incineration or recycling of waste generated by the EIB; emissions from energy consumption in external data centres that store EIB data; and, emissions
generated in the production of office paper purchased by the EIB.
In pursuit of continual improvement, the EIB reviews its footprint boundary annually and regularly looks for opportunities to expand its scope of reporting, especially in the areas of scope 3 emissions. In the 2014, the EIB is reporting for the first time
emissions associated with external data centres that store data related to the activities of the EIB. Looking forward, the EIB will continue to explore opportunities to
expand its reporting scope, such as the inclusion of other emissions from business travel such as hotels stays and conferences, the indirect emissions of recruitment drives and the emissions of external associate offices outside its main offices in
Luxembourg.
Figure 1 illustrates the current organisational and operational boundary.
3.3 Reporting period covered
The reporting period covers 1 January 2014 to 31 December 2014.

Page 8 of 34
Figure 1: Boundary diagram

Page 9 of 34
4 METHODOLOGY
EIB Carbon footprint analysis in 2014 follows the GHG Protocol3, consistent with the
approach adopted in 2013. The GHG Protocol is recognized as the most widely used international accounting tool for government and business leaders to understand, quantify, and manage greenhouse gas emissions. It is an international standard used
by a diverse range of organisations, including many in the banking sector, and it is widely accepted as best practice.
To calculate the GHG emissions inventory, we identified all relevant GHG emissions
sources and collected activity data from the EIB then, using emission factors, calculated emissions from each source. This was aggregated to corporate level for EIB’s total carbon footprint.
The following sections set out the details of the process followed.
4.1 Emission sources and activity data
Activity data is a quantitative measure of activity that results in GHG emissions. Table
1 shows the activity data provided by the EIB. It is mainly primary data e.g. the amount of gas used for heating or the distance travelled by air, with the exception of
commuting data that is based on the average number of vehicles and average distance travelled. The activity data is also used as environmental impact indicators as per the Global Reporting Initiative (GRI).
3 http://www.ghgprotocol.org/standards/corporate-standard

Page 10 of 34
Table 1: Activity data
Notes to Table 1: 1 The EIB began to purchase electricity originated 100% from renewable sources (hydropower, wind power and biomass) in 2007 and is the proprietor of the related green guarantees of origin. As such, whilst emissions at a grid average factor are
accounted for under scope 2, there are no net emissions associated with purchased electricity. The EIB has been closely monitoring developments since the publication of
the GHG Protocol Scope 2 Guidance in January 2015 and shall report against the guidance from 2015 onwards. 2 Primary data on distances travelled or fuel consumed for commuting is not currently available. The EIB therefore counts the average number of available parking spaces
on a monthly basis, deducted from the total number of available spaces, to arrive at an assumed number of cars per day. This is then multiplied by an average distance
travelled of 35 km per day, based on a survey conducted by the European Commission of its employees in Luxemburg (and supported by 3rd party research4 as well as by an internal detailed reasonability analysis). This is then multiplied by 220
days.
4 A. Aguilera (1999) ‘Growth in commuting distances in polycentric metropolitan areas: the case of Paris’,
45th Congress of the European Regional Science Association: http://www-sre.wu-
wien.ac.at/ersa/ersaconfs/ersa05/papers/255.pdf
Emission
scope
Emission source Units Resolution
Scope 1
Natural Gas for heating kWh By site, by month
Natural gas for co-generation
kWh By site, by month
Owned vehicles km By vehicle
Scope 2 Purchased electricity1 kWh By site, by month
Purchased steam kWh By site, by month
Scope 3
Business travel – Air Passenger km By journey (including class and distance)
Business travel – Rail Passenger km By journey (inc. class and distance)
Outsourced minibus km Single figure
Employee commuting Parking spaces 2 Average count by month
Couriers Shipments Single figure
Water m3 By site, by month
Waste kg By type and treatment, by site, by month
Paper consumption Tonnes By site
Data centres (NEW from
2014) kWh By site per annum

Page 11 of 34
4.2 Emission factors
Emission factors are calculated ratios relating GHG emissions to a measure of activity
at an emissions source. They are used to convert activity data to carbon emissions. Consistent with prior years, the emission factors represent carbon dioxide equivalent
(CO2e). They convert the impact of each of the six greenhouse gases covered by the Kyoto Protocol — carbon dioxide (CO2), methane (CH4), nitrous oxide (N2O),
hydrofluorocarbons (HFCs), perfluorocarbons (PFCs), and sulphur hexafluoride (SF6) – into a common unit of tonnes of CO2e based on their Global Warming Potential (GWP). The GWP is a measure of how much heat the respective gas retains in the atmosphere
over a given time horizon, based on the Intergovernmental Panel on Climate Change (IPCC) 100-years GWP coefficients.
Table 2 sets out the emission factors used and the sources of data.
Table 2: Emission factors
Notes to Table 2:
1 This is an average figure for all the vehicles owned by the EIB. The factor provided
by the vehicle manufacturers is used for each vehicle to calculate emissions.
Emission
scope Emission source Emission factor
% Change
from 2013
Data
source
Scope 1
Natural Gas for heating
0.182 kgCO2e/kWh 0% EIB
Natural gas for co-generation
0.182 kgCO2e/kWh 0% EIB
Owned vehicles 0.151 kgCO2e/km1 -4% EIB
Scope 2
Purchased
electricity 0.387 kgCO2e/kWh -6% Defra2
Purchased steam 0.043 kgCO2e/kWh 0% Ville de
Luxembourg
Scope 3
Business travel –
Air3
0.176 to 0.576
kgCO2e/Passenger/km -4% to 1% Defra
Business travel –
Rail
0.014
kgCO2e/Passenger/km 13% Defra
Outsourced minibus 0.460 kgCO2e/km 0% EIB
Employee commuting
0.228 kgCO2e/km 20%4 Defra
Courier services 4.830 kgCO2e/shipment 0% DHL
Water5 1.053 kgCO2e/m3 0% Defra
Waste 21 kgCO2e/tonne 0% Defra
Paper consumption 956 kgCO2e/tonnes 0.16% Defra

Page 12 of 34
2 Department for Environment Food and Rural Affairs (Defra) annually updates its
greenhouse gas conversion factors. Access to the emission factors and descriptions of changes in methodology can be found at
http://www.ukconversionfactorscarbonsmart.co.uk/. 3 The emission factor for air travel includes a Radiative Forcing factor that accounts for
impacts other than CO2 emissions (including water vapour, contrails, NOx etc) that magnify the warming effect in the upper atmosphere. The range of factors represents
the distance (i.e. short- and long-haul) and travel class (i.e. economy and business). 4 For all scope 3 emission factors, the upstream emissions of producing fuels (mining,
excavation, and transportation) prior to combustion has now been included in accordance with GHG Protocol scope 3 guidance. This is the main cause of the
significant increase in the emission factor for employee commuting. Emission factors has also been impacted by updates in the Defra conversion factors to include an emission factor for an average car using petrol or diesel.
5 The emission factor includes both emissions associated with the supply of fresh
water and the treatment of waste water.
4.3 Emissions inventory calculation
An inventory of GHG emissions by source was calculated by applying the emission factors to relevant activity data and aggregating the results to calculate EIB’s absolute
carbon footprint. A relative footprint was also calculated using employee numbers. Note, that in 2014 the methodology for calculating numbers of employees was changed from an FTE (full time equivalent) basis to a total number of contracted
employees - see section 6.2 for more details.

Page 13 of 34
5 CARBON FOOTPRINT
5.1 Total net emissions
The EIB’s total carbon footprint in 2014 was 17,510tCO2e, an increase of 22% compared to 2013 and a decrease of 2% compared to the 2007 baseline year.
The relative carbon footprint in 2014 was 6.85 tCO2e per employee. The relative carbon footprint for 2013 was 6.07 tCO2e per FTE, and the baseline year 2007 was
11.95 tCO2e per FTE5. The additional reduction in relative emissions over absolute emission reductions reflects a 70% increase in staff numbers since 2007.
The EIB is on track to achieve the original emission reduction target of 20-30% by 2020 (against a 2007 baseline). This remains true even when the impact of
methodology changes is accounted for.
Figure 2 shows total and relative net emissions broken down by scope for 2007 to 2014.
Figure 2: 2007-2014 total and relative net emissions
5 Note, that in 2014 the EIB changed the methodology for calculating numbers of employees from an FTE
(full time equivalent) basis to a total number of contracted employees. See section 6.2 for more details.
tCO2e/employee, 6.07
tCO2e/employee, 6.85
0
2
4
6
8
10
12
0
5
10
15
20
25
2007 2008 2009 2010 2011 2012 2013 2014
Carb
on e
mis
sio
ns p
er
em
plo
yee (
tCO
2e/F
TE)
Absolu
te c
arb
on e
mis
sio
ns (
ktC
O2e)
Absolute and relative CO2e emissions by year
Scope 3
Scope 2
Scope 1
tCO2e/employee
Page 14 of 34
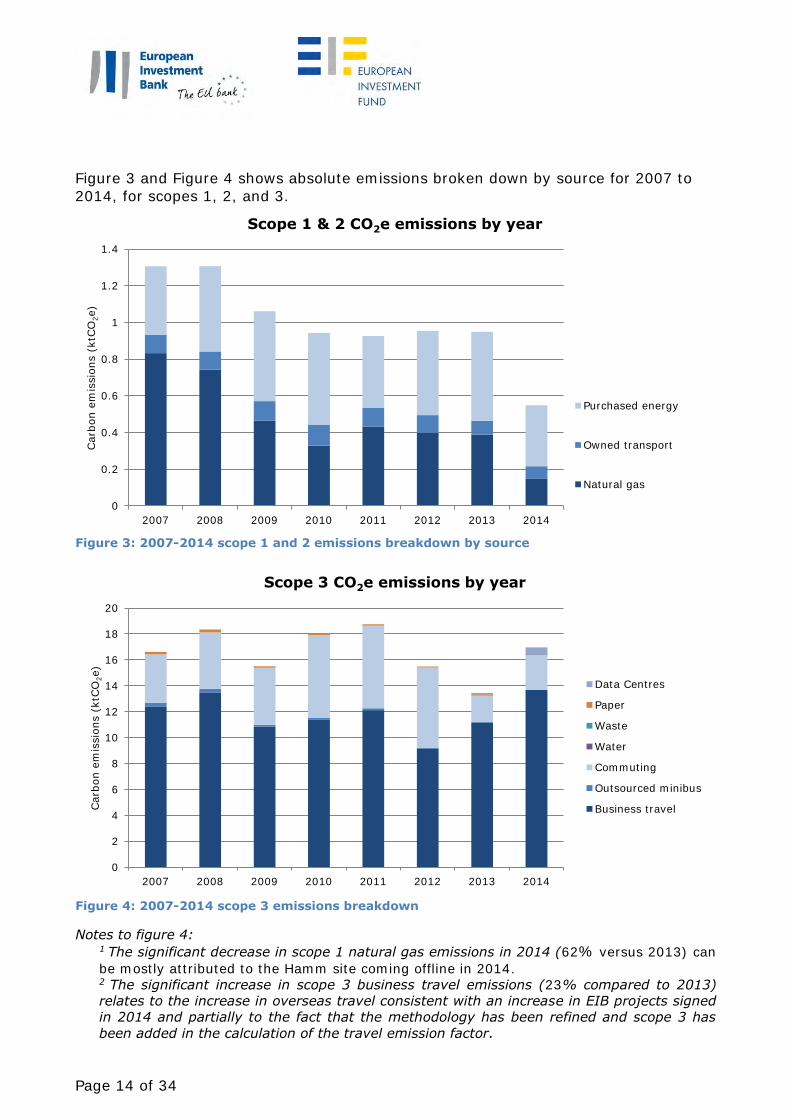
Figure 3 and Figure 4 shows absolute emissions broken down by source for 2007 to
2014, for scopes 1, 2, and 3.
Figure 3: 2007-2014 scope 1 and 2 emissions breakdown by source
Figure 4: 2007-2014 scope 3 emissions breakdown
Notes to figure 4: 1 The significant decrease in scope 1 natural gas emissions in 2014 (62% versus 2013) can
be mostly attributed to the Hamm site coming offline in 2014. 2 The significant increase in scope 3 business travel emissions (23% compared to 2013)
relates to the increase in overseas travel consistent with an increase in EIB projects signed
in 2014 and partially to the fact that the methodology has been refined and scope 3 has
been added in the calculation of the travel emission factor.
0
0.2
0.4
0.6
0.8
1
1.2
1.4
2007 2008 2009 2010 2011 2012 2013 2014
Carb
on e
mis
sio
ns (
ktC
O2e)
Scope 1 & 2 CO2e emissions by year
Purchased energy
Owned transport
Natural gas
0
2
4
6
8
10
12
14
16
18
20
2007 2008 2009 2010 2011 2012 2013 2014
Carb
on e
mis
sio
ns (
ktC
O2e)
Scope 3 CO2e emissions by year
Data Centres
Paper
Waste
Water
Commuting
Outsourced minibus
Business travel

Page 15 of 34
The 2014 carbon footprint is broken down by emissions source as per Figure 5 below. Approximately 94% relates to mobility - travel in owned vehicles and third party transport used for business travel and employee commuting. Air travel represents the
most significant proportion of this as it is a core part of EIB’s business and cannot be avoided. Nevertheless, policies regarding travel class are in place to minimise
emissions.
Figure 5: Emissions by source
Natural gas
(boilers), 27%Natural gas (co-
generation), 0%
Owned
vehicles,
12%
Purchased
steam, 60%
2014 CO2e emissions by source - Scope 1 & 2
Business
travel - air,
80.20%
Commuting,
15.86%
Outsourced
minibus, 0.16%
Business travel -
rail, 0.09%
Courier, 0.41%
Water, 0.30%
Waste, 0.07%
Paper
consumption,
0.43%
Data centres,
2.48%
Other
2014 CO2e emissions by source - scope 3

Page 16 of 34
5.2 Mobility emissions analysis
Figure 6: Contribution of mobility emissions
Net mobility emissions were 16,474tCO2e in 2014, representing 94% of total net emissions. This is 24% higher than 2013 (13,336tCO2e), and 0.32% lower than 2007
(16,526tCO2e).
Mobility emissions relate to the combustion of fuels in the vehicles owned or controlled by the EIB (scope 1) or third party transport for employee business travel and
commuting to and from work (scope 3).
Stationary, 3%
Mobility, 94%
Paper
Consumption,
0.42%
Water, 0.29%
Waste, 0.07%
Data Centres, 2%
Other

Page 17 of 34
The activity data provided by the EIB and resulting emissions are shown in Table 3
Emission source Activity
data (km) tCO2e
tCO2e
variance to 2013
tCO2e
variance to 2007
Owned vehicles (scope 1) 453,816 69 -8% -31%
Outsourced minibus 58,188 27 -52% -90%
Business travel – air (short
haul, economy class) 8,070,226 1,417 -5%
10% For all flights
Business travel – air (short
haul, business/1st class) 7,845,568 2,067 -33%
Business travel – air (medium and long haul, economy class)
945,581 205 68%
Business travel – air (medium
and long haul, business/1st class class)
17,316,101 9,972 54%
Business travel – train 1,129,528 16 18% -35%
Commuting1 11,831,050 2,701 32% -28%
Courier 14,478 70 0% n/a
Total transport emissions 16,544
Less offset courier emissions (70)
Total net transport emissions 16,474 24% -0.32%
Table 3: Mobility emissions and activity data
Note to Table 3:
1 In 2014, the EIB conducted an internal analysis of the methodology used in previous years to
calculate emissions from employee commuting, by taking the postcodes of employees and
calculating the average distance that a typical employee commutes to work. It confirmed that
the average commuting distance of 35km used by the EIB in previous reporting years is
reasonable and no changes to the calculation methodology was required.

Page 18 of 34
The majority of mobility emissions are scope 3 emissions (99.6%), of which 83%
relates to flights. The EIB already has policies in place regarding travel classes to minimise emissions and cost, and requires that alternative means, including
tele/videoconferencing, are considered, whenever compatible with the business interest.
Company owned vehicles fall under scope 1 and represent 13% (69tCO2) of EIB’s net scope 1 and 2 emissions. By definition, the EIB has greater control over these
emissions and it has implemented a policy to replace poor performing vehicles (in carbon efficiency terms). For example, the poorest performing vehicle was replaced with the top performing vehicle during 2014. Rankings are set out in Table 4 below.
Rank Emission gCO2/km KMs Total emission kgCO2
1 01 7 0
1a 01 392 0
2 (replaces 8a) 482 5,446 261
3 99 16,284 1,612
4 (replaces 10) 139 15,741 2,188
5a (replaces 13) 142 9,755 1,385
5b (replaces 9) 142 14,100 2,002
5c (replaces 8b) 142 16,481 2,340
5d 142 23,500 3,337
6 146 62,005 9,053
7a 149 23,018 3,430
7b 149 36,178 5,391
8a (replaced by 2) 150 11,520 1,728
8b (replaced by 5c) 150 28,573 4,286
9 (replaced by 5b) 152 15,912 2,419
10 (replaced by 4) 154 23,392 3,602
11 (replaces 17) 157 9,184 1,442
12b 158 8,501 1,343
12a 158 20,524 3,243
12c 158 25,993 4,107
13 (replaced by 5a) 162 8,845 1,433
14 (replaces 16) 163 18,620 3,035
15 173 11,960 2,069
16 (replaced by 14) 183 26,741 4,894
17 (replaced by 11) 195 21,144 4,123
TOTAL 453,816 68,723
Table 4: Owned vehicles
Notes to Table 4:
1 Vehicle #1 is an electric car used by the IT department to visit data centres. No emissions
are recorded because electricity is accounted for under building use.
2 Vehicle #2 is a full hybrid car.

Page 19 of 34
5.3 Stationary emissions analysis
Figure 7: Contribution of stationary emissions
Stationary energy emissions were 480tCO2e (0.2tCO2e per employee) in 2014,
representing 3% of total net emissions. This is 45% lower than 2013 (874tCO2e), and 60% lower than 2007 (1,206tCO2e).
Stationary emissions relate to the combustion of fuels in stationary equipment owned
or controlled by the EIB for heating and power (scope 1), and from purchased heat and power (scope 2).
Stationary, 3%
Mobility, 94%
Paper
Consumption,
0.42%
Water, 0.29%
Waste, 0.07%
Data Centres, 2%
Other

Page 20 of 34
The activity data provided by the EIB and resulting emissions are shown in Table 5.
Site Emission source Energy (MWh)
Emissions (tCO2e)
tCO2e
Variance to 2013
tCO2e
Variance to 2007
West Kirchberg Heating (steam) 5,542 238 -33% -1%
East Kirchberg Heating (steam) 2,175 94 -26% n/a
PKI Heating (steam) or Boiler (gas) TBD
360 65 n/a n/a
BHK Boiler (gas) 454 83 -10% n/a
All Power (electricity) 15,142 5,860 -15% -2%
Total energy emissions 23,675 6,340
Less green tariff electricity -5,860
Total net energy emissions 480 -45% -60%
Table 5: Stationary emissions and activity data
The reduction in emissions reflects termination of the Hamm site, as well as measures taken to improve the energy efficiency of existing buildings, as described in Section 8.1 below.

Page 21 of 34
5.4 Data centres analysis
Figure 8: Contribution of data centres emissions
Data centres emissions relate to the consumption of electricity in EIB’s external data centres located in Luxembourg. The emissions from the data centres are accounted
as scope 3 emissions as the data centres are not owned or operated by EIB but they hold data associated with the activities of EIB. In 2014, emissions associated with
data centres account for 422 tCO2e ( 1,091,500 kWh).
Emissions from data centres are being reported for the first time in 2014 and is part of the EIB’s overall commitment to continual expansion and improvement in the measurement and reporting of its overall value chain (scope 1, 2 and 3) GHG
emissions. Going forward, emissions from data centres will be reported on an annual basis.
Stationary, 3%
Mobility, 94%
Paper
Consumption,
0.42%
Water, 0.29%
Waste, 0.07%
Data Centres,
2%
Other

Page 22 of 34
5.5 Paper consumption analysis
Figure 9: Contribution of paper consumption emissions
Emissions relating to the 76 tonnes of office paper used accounts for 73tCO2e, 0.4% of total emissions. This is an decrease of 31% compared to 106tCO2e in 2013, and a
decrease of 63% compared to 200tCO2e in 2007. However, 38% of the paper relates to the copy centre which was not accounted for in prior years (an additional 28tCO2e,
without which emissions would have decreased by 57% compared to 2013).
Paper consumption emissions relate to the emissions released in the production of office paper that is then used by the EIB (not paper waste which is accounted for
under waste).
The EIB sourced recycled paper for all paper consumed in the copy centre during 2014.
Stationary, 3%
Mobility, 94%
Paper
Consumption,
0.42%
Water, 0.29%
Waste, 0.07%
Data Centres, 2%
Other

Page 23 of 34
5.6 Water analysis
Figure 10: Contribution of water emissions
Emissions associated with water use (supply and waste water treatment) account for 48tCO2e (45,697m3). This data shows that water consumption has decreased by 5%
since 2013 (51tCO2e, 48,432m3) and decreased by 26% since 2007 (65tCO2e, 61,706m3), despite increases in employee numbers.
Stationary, 3%
Mobility, 94%
Paper
Consumption,
0.42%
Water, 0.29%
Waste, 0.07%
Data Centres, 2%
Other

Page 24 of 34
5.7 Waste analysis
Figure 11: Contribution of waste emissions
Emissions from waste disposal account for 13tCO2e, representing less than 1% of total net emissions.
The activity data provided by the EIB and resulting emissions are shown in Table 6
and Figure 12 below. Due to the small figures involved, variances are not meaningful.
Type Treatment Volume
(tonnes) tCO2e
Mixed Incineration1 331.9 7
Organic Compost 234.44 1
Paper Recycled 119.797 3
Glass Recycled 62.3165 1
Plastic Recycled 12.2415 0
Metal Recycled 3.6485 0
Wood Recycled 0.932 0
TOTAL 765 13
Excluded hazardous waste 8 n/a
Table 6: Waste emissions and activity data
Stationary, 3%
Mobility, 94%
Paper
Consumption,
0.42%
Water, 0.29%
Waste, 0.07%
Data Centres, 2%
Other

Page 25 of 34
Figure 12: Waste emissions by type
Hazardous waste, which includes Waste Electrical and Electronic Equipment (WEEE),
florescent light bulbs, batteries, toner cartridges and other harmful substances, continues to be excluded. Data is collected for regulatory purposes as per 2014 but cannot be converted into emissions because some items are measured in m3 or units
rather than weight and there is insufficient information about waste treatment – it may be sent to landfill, recycled or incinerated. Nonetheless, it would not have a
material impact on the total carbon footprint given the weight of its waste emissions– excluding waste for which weight data was not available - equates to 0.07% of total waste.
7.0
2.5 1.4 1.3 0.3 0.0 0.1 - 1 2 3 4 5 6 7 8
Mix
ed
incin
era
tion
Recycle
d
paper
Org
anic
waste
Recycle
d
gla
ss
Recycle
d
pla
stic
Recycle
d
wood
Meta
l
Em
issio
ns (
tCO
2e)
2014 waste emissions

Page 26 of 34
6 DATA ASSESSMENT AND METHODOLOGY CHANGES
6.1 Data quality and completeness
Table 7 sets out our assessment of the activity data and assumptions applied in 2014.
Emission source Activity data Assumptions applied
Boiler (Hamm &
BHK)
Primary data n/a
Co-generation
(Hamm)
Primary data n/a
Steam heating
(Kirchberg)
Primary data n/a
Purchased
electricity
Primary data n/a
Owned cars Primary data Fuel efficiency conversion based
on manufacturer’s data
Minibus Primary data Fuel efficiency conversion based
on manufacturer’s data
Business travel – air
Primary data Short- / long-haul split at 4,000km
Business travel – train
Primary data n/a
Commuting Number of vehicles is inferred from available spaces and an
average count of empty spaces at Kirchberg
All commuting is by car and the average daily distance of 35km is
applied 220 days per year
Paper consumption Primary data n/a
Waste Primary data All general waste is incinerated
with heat recovery
Data centres Primary Data n/a
Key:
Table 7: Data quality and completeness assessment
EIB regional offices are excluded because data was not available and they are assumed to be less than 5% of total emissions (allowable for exclusion under the GHG Protocol). Hazardous waste is excluded because there is insufficient information about its
treatment to calculate emissions and many of the waste streams are measured in size (m3) or units rather than weight (kg), which is needed to calculate emissions. Again,
emissions are likely to be very small as total waste contributes only 0.07% of the total net carbon footprint.
Weak – priority area for improvement
Satisfactory – could be improved
Good – no changes recommended

Page 27 of 34
In 2014, a data quality check revealed anomalies in the water, electricity and heating
data of the BHK building for the year 2013. Upon investigation, it was ascertained that inaccurate activity data for water, electricity and heating was used in the 2013 report.
The impact was that the EIB over-reported overall GHG emissions by approximately 2.5% in the 2013 report. In this report, all references to 2013 data have been updated to the correct figures.
The EIB is committed to continually improving the data quality of previously reported
data. Going forward, the EIB will also consider new methods of calculating emissions when new data becomes available and/or the activity becomes a material part of EIB’s overall GHG footprint.
6.2 Change to relative carbon footprint calculation
The EIB corporate carbon footprint is calculated and reported as both an absolute value in terms of total tonnes of Carbon Dioxide equivalent (tCO2e), and also as a relative
metric compared to the number of employees measured in terms of tCO2e per employee.
In 2014 the EIB Group changed the methodology for calculating numbers of employees from an FTE (full time equivalent) basis to a total number of contracted employees.
This is to be consistent with EIB Financial Report6 and EIF Annual Report7. Previously, there were some minor variations in the methodology for calculating FTEs, thus going
forward a consistent approach will be followed year by year. Thus direct comparisons of the relative carbon footprint per employee with previous
years are indicative only as they are not calculated on precisely the same basis.
6 EIB Financial Report – Note R, p.55 http://www.eib.org/infocentre/publications/all/financial-report-2014.htm 7 EIF Annual Report – 7.6 General administarative expenses, p.97
http://www.eif.org/news_centre/publications/EIF_annual_report_2014.htm?lang=-en

Page 28 of 34
7 ENVIRONMENTAL INDICATORS 2014
7.1 Emissions by scope
Emissions (tCO2e) 2014 2013 2012 2011 2010 2009 2008 2007
Natural gas 148 389 399 433 329 464 743 833
Owned transport 69 75 96 103 112 107 99 100
Total Scope 1 217 464 495 536 441 570 842 933
Purchased electricity1 5,860 6,900 6,876 7,061 7,111 7,367 7,454 6,085
Purchased steam 332 485 459 390 502 490 374 249
Purchased cold supply 28 32
Total Scope 2 6,192 7,385 7,335 7,451 7,613 7,857 7,857 6,366
Business travel 13,677 11,163 9,168 12,131 11,413 10,858 13,489 12,407
Outsourced minibus 27 56 52 141 130 130 270 270
Commuting 2,701 2,042 6,190 6,369 6,369 4,407 4,363 3,749
Courier 70 70
Water2 48 51 56 68 65 82 70 65
Waste 13 10 -6 -2 -4 0 -1 0
Paper consumption 73 106 83 115 146 120 227 200
Data centres 422 0
Total Scope 3 17,031 13,498 15,488 18,754 18,054 15,515 18,348 16,626
Total Gross emissions 23,440 21,346 23,317 26,741 26,108 23,943 27,047 23,926
Green tariff -5,860 -6,900 -6,876 -7,061 -7,111 -7,367 -7,392 -5,993
Offset courier emissions -70 -70
Total net emissions3 17,510 14,377 16,441 19,682 18,997 16,576 19,653 17,932
% change from previous year 22% -13%
% change from 2007 -2% -20% -8% 10% 6% -8% 10% 0%
Number of employees4 2,556 2,369 2,185 2,175 2,079 1,906 1,769 1,501
Net emissions per employee4 6.85 6.07 7.52 9.05 9.14 8.69 11.11 11.92
% change from previous year 13% -19%
% change from 2007 -43% -49% -37% -24% -24% -27% -7% 0% 1 Assumes the grid average emission conversion factor for Luxembourg in 2009 (latest available) for all years for comparability. 2 Water emissions not reported prior to 2013. Figures here are back-calculated from water usage per employee. 3 Small differences in total due to rounding. 4 Note, that in 2014 the methodology for calculating numbers of employees was changed from an FTE basis to a total number of contracted employees. (See section 6.2 for more details).

Page 29 of 34
7.2 Net emissions by type
Indicators Total
tCO2e
tCO2e per
employee4
tCO2e
per FTE
tCO2e
per FTE
tCO2e
per FTE
tCO2e
per FTE
tCO2e
per FTE
tCO2e
per FTE
tCO2e
per FTE
2014 2014 2013 2012 2011 2010 2009 2008 2007
Energy emissions1 480 0.19 0.37 0.39 0.38 0.41 0.52 0.68 0.82
Mobility emissions1 16,474 6.45 5.63 7.1 8.62 8.67 8.13 10.31 11.1
Copying paper emissions 73 0.03 0.04 0.04 0.053 0.1 0.06 0.13 0.13
Water emissions2 48 0.02 0.02 0.03 0.03 0.03 0.04 0.04 0.04
Waste emissions 13 0.0049 0.0042 -0.0026 -0.0007 -0.002 0.0001 -0.0007 0.0002
Data centres emissions 422 0.17 n/a n/a n/a n/a n/a n/a n/a
Total (net emissions)3 17,510 6.85 6.07 7.52 9.05 9.14 8.69 11.11 11.92
1 Based on net emissions therefore does not include grid electricity under scope 2 or courier services under scope 3. 2 Water emissions not reported prior to 2013. Figures here are back-calculated from water usage per employee. 3 Small differences in total due to rounding.
7.3 Other indicators
Total m3
2014
m3 per
employee4
2014
m3 per
FTE
2013
m3 per
FTE
2012
m3 per
FTE
2011
m3 per
FTE
2010
m3 per
FTE
2009
m3 per
FTE
2008
m3 per
FTE
2007
Water 45,697 17.88 20.44 24.17 29.88 29.57 40.89 37.34 41.11
Total kWh
2014
kWh per
employee4
2014
kWh per
FTE
2013
kWh per
FTE
2012
kWh per
FTE
2011
kWh per
FTE
2010
kWh per
FTE
2009
kWh per
FTE
2008
kWh
per FTE
2007
Purchased electricity
with green certificates 15,142,110 5,924 7,107 8,043 8,297 8,743 9,879 10,680 10,205
Total
tonnes
t per
employee4
2014
t per
FTE
2013
t per
FTE
2012
t per
FTE
2011
t per
FTE
2010
t per
FTE
2009
t per
FTE
2008
t per
FTE
2007
Total copying paper 76 0.03 0.05 0.04 0.04 0.05 0.05 0.07 0.07
4 Note, that in 2014 the methodology for calculating numbers of employees was changed from an FTE basis to a total number of contracted employees. (See section 6.2 for more details).

Page 30 of 34
8 ANNEX – SPECIFIC RESPONSES TO GRI INDICATORS
8.1 G4-EN6: Reduction in energy consumption
Energy savings due to conservation and efficiency improvements have resulted in a decrease by 45% of the fuel and energy purchased by the EIB per employee since
2007, as shown in the following table.
Energy source 2014 2007 Variance %
change
Natural gas (kWh) 814,609 4,040,540 -3,225,931 -80%
Electricity (kWh) 15,142,110 15,619,594 -477,484 -3%
Steam (kWh) 7,717,790 5,785,063 1,932,727 33%
Biogas (kWh) n/a n/a n/a n/a
Total (kWh) 23,674,509 25,445,197 -1,770,688 -7%
Number of employees1 2,556 1,501 954 64%
Energy per employee1 9,262 16,952 -7,309 -43%
Table 8: Energy consumption per employee
Note to table 8: 1In 2014 the methodology for calculating numbers of employees was changed from an
FTE basis to a total number of contracted employees. See section 6.2 for more details.
A major reason for the reduction in energy consumed per employee in 2014 was due to the termination of the HAMM office and the relocation of employees to other existing EIB offices.
Within existing buildings, a number of technical optimisations were implemented
which led to energy reductions at site level. These optimisations included: Regulation and distribution optimization of heating and cooling systems
(adapting consumption to demand in real time); Implementation of drive systems on heating circulation pumps; Improvement in lighting management;
Optimisation of ventilation systems management.
In addition, a number of measures were undertaken to upgrade the EIB’s office equipment, which had the effect of reducing energy use. These included:
Replacement of old individual network printers (HP) and copiers (Xerox) with
brand new multifunctional devices that can print, copy and scan. In 2014, 204 old printers and copiers were replaced by 121 functional devices;
Overall, the EIB reduced the number of devices in its printing fleet from 1,049 in 2013 to 845 in 2014;
Increase in the number of print/copy/scan devices per EIB user from 2.8 users
per device to 3.8 users per device in 2014;

Page 31 of 34
Introduction of the “follow-me printing” functionality which removed the need
for individuals to use personal printers to print confidential documents.
8.2 G4-EN19: Reduction of greenhouse gas (GHG) emissions
In addition to the energy saving measures described in the preceding section, the EIB has implemented a number of initiatives to further reduce its GHG emissions.
Aiming at ‘carbon neutrality’ for its energy supplies, the EIB has been buying 100%
renewable energy (hydropower, biomass and wind) from its electricity supplier LEO SA. This has reduced the annual internal carbon emissions by an average of 6,674 tCO2e each year since 2011.
In 2014, the EIB purchased the equivalent tonnage of carbon credits from the Kasigau
Corridor REDD+ Project to fully offset its entire 2013 corporate carbon footprint. The Kasigau Corridor project is the first Reduced Emissions from Deforestation and Degradation (REDD+) project to gain the Verified Carbon Standard (VCS), as well as
Gold Level of the Climate Community and Biodiversity (CCB) Standard.
The project avoids the unplanned deforestation and degradation of tropical forests in the Tiata Taveta District in the Kasigau Corridor, Kenya, which in the absence of the project would have been deforested and/or degraded for subsistence agriculture.
Historically, areas adjacent to the project areas were converted to crop land for the illegal charcoal trade as well as subsistence agriculture such as maize farming.
In addition to the GHG benefits from the protection of natural carbon sinks, a number of local community based, sustainable development initiatives have also resulted from
the proceeds of the project. These include: The establishment of an organic greenhouse to grow citrus trees and jojoba
trees, creating sustainable industries and employment for the local community; Setting up of ranger stations around the project areas to safeguard the project
and to protect the land from deforestation and illegal production of charcoal;
Construction of an eco-factory to produce organic clothing, helping to create local employment opportunities;
Reforestation project to plant 20,000 indigenous hardwood trees; The construction of schools and the establishment of a bursary programme;
Initiation of project to explore sustainable charcoal such as charcoal derived from bush trimmings.

Page 32 of 34
8.3 G4-EN23: Total weight of waste by type and disposal method
The EIB disposes of waste through the Luxembourg municipal authorities. Waste is
sorted in-house to the extent possible so that it can ultimately be recycled. All unsorted waste is incinerated with energy recovery. Details of the quantities of waste by the official categorisation are shown in Table 10 below.
The Luxembourg SuperDrecksKëscht® fir Betrieber green label was first awarded to
the Bank for its internal waste recycling practices in 2007 and renewed annually to date for the East and West Kirchberg buildings. The criteria for obtaining the label are as follows:
- Motivation of all participants;
- Transposition of all measures for waste prevention; - Visible and accessible collection sites; - Safe and environmentally correct storage;
- Waste collection according to types; - High quality and transparent waste recycling and disposal;
- Environmentally correct management. The SuperDrecksKëscht® fir Betriber label is certified in accordance with the
internationally accepted ISO 14024:2000 standard. This certificate comprises among other things the control procedures and requirements the inspectors have to satisfy.
Thus waste management in the certified businesses fully meets the requirements for ISO 14024.
To further optimize the EIB waste imprint further actions are planned, such as:
- Establishing a new collection process to reduce the volume of paper waste while
maximising the security of confidential documents; - Replacing biodegradable and compostable paper cups by a more sustainable
approach.

Page 33 of 34
The table below discloses 2014 EIB Waste split in accordance to the European Waste
Catalogue as per European Commission’s Decision 2000/532/EC of 3 May 2000.
Code CED Official description of waste Unit Quantity (2014)
Quantity (2013)
Quantity (2012)
15 01 01 Paper and cardboard packaging kg 22,847 80,076 75,606
20 01 01 Paper and cardboard kg 96,950 84,165 77,958
15 01 07 Glass packaging kg 62,250 38,897 39,444
17 02 02 Glass kg 67 n/a n/a
17 04 05 Iron and steel kg 1,510 8 m3 0
17 04 11 Cables other than those in 170410 kg 21 0 141
20 01 40 Metals kg 2,118 1,893 1,575
20 01 37* Wood containing hazardous substances m³ 180 n/a n/a
kg 22 19,642 0
20 01 38 Wood other than that mentioned in 20 01 37
kg 910 0 82
15 01 02 Plastic packaging kg 1,721 1,335 406
15 01 02 15 01 04 15 01 05
Plastic packaging
Metallic packaging Composite packaging
kg 7,880 n/a n/a
15 01 06 Mixed packaging kg 233 5,967 5,952
20 01 39 Plastics kg 2,408 1,554 1,438
17 01 07 Mixtures of concrete, bricks, tiles and ceramics other than those mentioned in 17 01 06
m³ 1 n/a n/a
20 02 01 Biodegradable waste m³ 100 n/a n/a
20 01 25 Eedible oil and fat kg 2,040 2,170 2,172
20 01 08 Biodegradable kitchen and canteen waste
kg 232,400 181,700 136
20 01 35*
Discarded electrical and electronic equipment other than those mentioned in 20 01 21 and 20 01 23 containing hazardous components(commercial)
kg 516 n/a n/a
20 01 35*
Discarded electrical and electronic equipment other than those mentioned in 20 01 21, 20 01 23 and 20 01 35 (household electrical appliances
kg 437 774 392
16 02 14 Discarded equipment other than those mentioned in 16 02 09 to 16 02 13
kg 0 215 0
20 01 36
Discarded electrical and electronic
equipment other than those mentioned in 20 01 21, 20 01 23 and 20 01 35
kg 215 6,348 6,421
20 03 01 Mixed municipal waste kg 331,900 137,550 136,500
08 01 11* waste paint and varnish containing organic solvents or other hazardous substances
kg 203 n/a n/a
08 03 17* waste printing toner containing hazardous substances
Cartridges
4,800 5,700 5,300
13 02 08* Other engine, gear and lubricating oils kg 29 61 0
15 01 10* Packaging containing residues of or contaminated by hazardous substances
kg 532 917 964

Page 34 of 34
Code CED Official description of waste Unit Quantity (2014)
Quantity (2013)
Quantity (2012)
15 02 02*
Aabsorbents, filter materials (including oil filters not otherwise specified), wiping cloths, protective clothing
contaminated by hazardous substances
kg 96 1,363 -
15 02 03 Absorbents, filter materials, wiping cloths and protective clothing other than those mentioned in 15 02 02
kg 404 n/a n/a
16 06 01* Lead batteries kg 55 145 0
16 06 02* Ni Cd batteries kg 60 n/a n/a
18 01 03
Waste whose collection and disposal is
subject to special requirements in view of the prevention of infection
kg 5 n/a n/a
20 01 13* Wastes whose collection and disposal is subject to special requirements in order to prevent infection
kg 24 n/a n/a
20 01 21* Fluorescent tubes and other mercury-containing waste
kg 526 263 230
20 01 27* Paint, inks, adhesives and resins containing hazardous substances
kg 49 37 0
20 01 33*
Batteries and accumulators included in 160601, 160602 or 160603 and unsorted batteries and accumulators containing these batteries
kg 407 437 351
17 06 04 Insulation materials other than those
mentioned in 170601 or 170603 kg 3,168 1,891 1,396
17 09 04 Mixed construction and demolition wastes other than those mentioned in 17 09 01, 17 09 02 and 17 09 03
kg 1,659 5,097 0
16 02 15* Hazardous components removed from discarded equipment
kg 80 n/a n/a
11 01 07* Pickling bases kg 0 96 0
14 06 01* Chlorofluorocarbons, HCFC, HFC kg 0 31 0
14 06 03* Other solvents and solvent mixtures kg 0 9 0
16 01 07* Oil filters kg 0 3 -
16 02 11* Discarded equipment containing chlorofluorocarbons, HCFC, HFC
kg 0 715 0
17 04 01 Copper, bronze, brass kg 0 90 0
17 05 04 Soil and stones other than those mentioned in 17 05 03
m3 0 9 m3 -
Table 9: Waste categories
Any waste marked with an asterisk (*) in the list of wastes shall be considered as hazardous waste
pursuant to Directive 2008/98/EC, unless Article 20 of that Directive applies.