CARBON CREDIT PLAN FOR PULLATNA · Environmental Concerns to help implement a carbon credit program...
31
1 SOA Student Research Case Study Challenge CARBON CREDIT PLAN FOR PULLATNA Walker Reinmann Kinsey Turk Brady Lybarger Joseph Hoffman Team Emission: Impossible Arizona State University
Transcript of CARBON CREDIT PLAN FOR PULLATNA · Environmental Concerns to help implement a carbon credit program...

1
SOA Student Research Case
Study Challenge
CARBON CREDIT
PLAN FOR PULLATNA
Walker Reinmann
Kinsey Turk
Brady Lybarger
Joseph Hoffman
Team Emission: Impossible
Arizona State University
Team Emission Impossible
Team Emission: Impossible
Team Emission Impossible

Team Emission: Impossible
2
Contents
EXECUTIVE SUMMARY ............................................................................................ 4
ASSESSMENT OF RISKS ...................................................................................... 4-6
PROGRAM DESIGN ............................................................................................ 6-12
AGGREGATE EMISSION YEARLY GOALS ................................................................ 6-7
CREDIT LIMITS ......................................................................................................... 7-8
SOCIAL COST OF CARBON ...................................................................................... 8-9
FINANCIAL INSTRUMENTS ..................................................................................... 9-12 Metal Emission Bonds ................................................................................................. 9-10 Transportation Emission Bond................................................................................... 10-11 Secondary Emission Supplement ....................................................................................11 Bond Payment .................................................................................................................12
IMPLEMENTATION PLAN ................................................................................ 12-14
PRIMARY MARKET .................................................................................................... 12
SECONDARY MARKET .............................................................................................. 13
REGULATIONS .......................................................................................................... 13
EFFECTIVENESS OF PROGRAM .......................................................................... 13-14
REVENUE ANALYSIS ....................................................................................... 14-16
REVENUE PROJECTION ............................................................................................ 14
USAGE OF REVENUE ........................................................................................... 15-16
DATA LIMITATIONS, ASSUMPTIONS & SENSITIVTY ANALYSIS .......................... 16-26
DATA LIMITATIONS .............................................................................................. 16-17
ASSUMPTIONS ..................................................................................................... 17-18
SENSITIVITY ANALYSIS ........................................................................................ 18-24 Revenue Sensitivity ................................................................................................... 18-21 Emissions Sensitivity ................................................................................................. 21-23 Extreme Deviations ................................................................................................... 24-26

Team Emission: Impossible
3
CONCLUSION ....................................................................................................... 26
APPENDIX ...................................................................................................... 27-31
APPENDIX A: PROGRAM DESIGN ........................................................................ 27-30 Section A1: 2020 ARIMA Model R Code ................................................................... 27-28 Section A2: Aggregate Emission Yearly Goal Table ........................................................28 Section A3: Nearest Neighbor for Social Cost of Carbon Development ..........................29 Section A4: Entering Mid-Program ..................................................................................29 Section A5: Bond Pricing Equations .......................................................................... 29-30 Section A6: Payment Structure Example with Bronze Emission Bond ............................30
APPENDIX B: RECOMMENDATIONS .......................................................................... 30 Section B1: Revenue Usage/Forecasting Expenses .......................................................30
APPENDIX C: DATA LIMITATIONS, ASSUMPTIONS & SENSITIVTY ANALYSIS .......... 31 Section C1: Distribution of Companies by Emission Level ..............................................31 Section C2: Sensitivity Analysis by Revenue Table .........................................................31
WORKS CITED ...................................................................................................... 32
Team Emission: Impossible
4
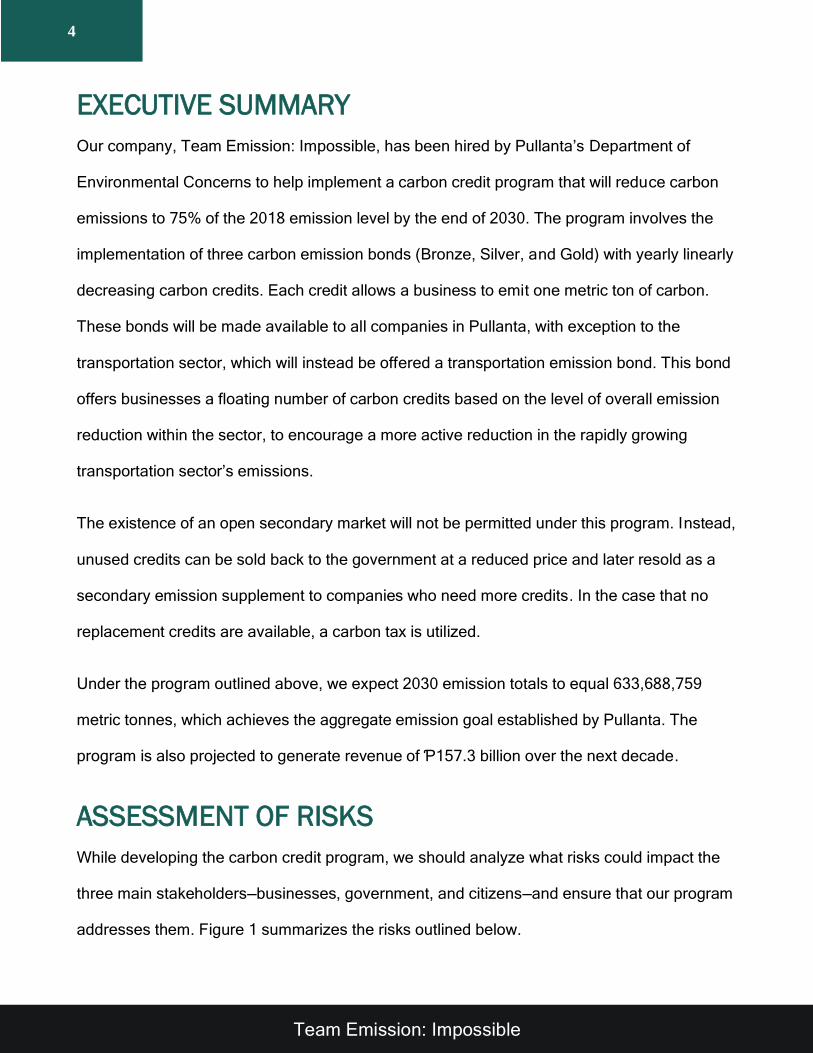
EXECUTIVE SUMMARY
Our company, Team Emission: Impossible, has been hired by Pullanta’s Department of
Environmental Concerns to help implement a carbon credit program that will reduce carbon
emissions to 75% of the 2018 emission level by the end of 2030. The program involves the
implementation of three carbon emission bonds (Bronze, Silver, and Gold) with yearly linearly
decreasing carbon credits. Each credit allows a business to emit one metric ton of carbon.
These bonds will be made available to all companies in Pullanta, with exception to the
transportation sector, which will instead be offered a transportation emission bond. This bond
offers businesses a floating number of carbon credits based on the level of overall emission
reduction within the sector, to encourage a more active reduction in the rapidly growing
transportation sector’s emissions.
The existence of an open secondary market will not be permitted under this program. Instead,
unused credits can be sold back to the government at a reduced price and later resold as a
secondary emission supplement to companies who need more credits. In the case that no
replacement credits are available, a carbon tax is utilized.
Under the program outlined above, we expect 2030 emission totals to equal 633,688,759
metric tonnes, which achieves the aggregate emission goal established by Pullanta. The
program is also projected to generate revenue of Ƥ157.3 billion over the next decade.
ASSESSMENT OF RISKS
While developing the carbon credit program, we should analyze what risks could impact the
three main stakeholders—businesses, government, and citizens—and ensure that our program
addresses them. Figure 1 summarizes the risks outlined below.

Team Emission: Impossible
5
Figure 1: Summary of Risk for Different Stakeholders
The main risk attributed to the creation of a carbon credit program is the improper pricing of
the financial instruments. The price must be adequate for the government to run the program.
If the price is too high it will place an inordinate burden upon companies causing them to
forgo additional production and innovation and could even cause them to move production
out of Pullanta. This will hinder GDP, cause product shortages, and potentially increase
Pullanta’s unemployment rate.
If priced too low, more credits than expected will be sold, and the program's primary objective
of reducing emissions will fail. An additional underpricing risk is that companies will purchase
more credits than they need – whether it be to hurt competitors who do not have enough
credits to operate, or to avoid making any emission reduction changes, negative impacts will
be felt by Pullanta.
Even if the financial instruments are priced perfectly, there is still risk associated with
competing countries. Companies in Pullanta could look to move production to countries
Businesses
• Financial burden
• Not have enough credits to operate
• Product shortages
• Unable to afford innovations
• Misreporting of carbon emissions
Government
• Unable to financially support program
• Reduction in GDP
• Increase in unemployment rate
• Abuse of secondary market by companies
• More imports than exports
Citizens
• Product shortages
• Loss of employment
• High prices for commodities and services
Stakeholders
Team Emission: Impossible
6
where carbon emissions are not so heavily regulated. This will also negatively impact GDP
and unemployment, which hurts both the government and the citizens of Pullanta.
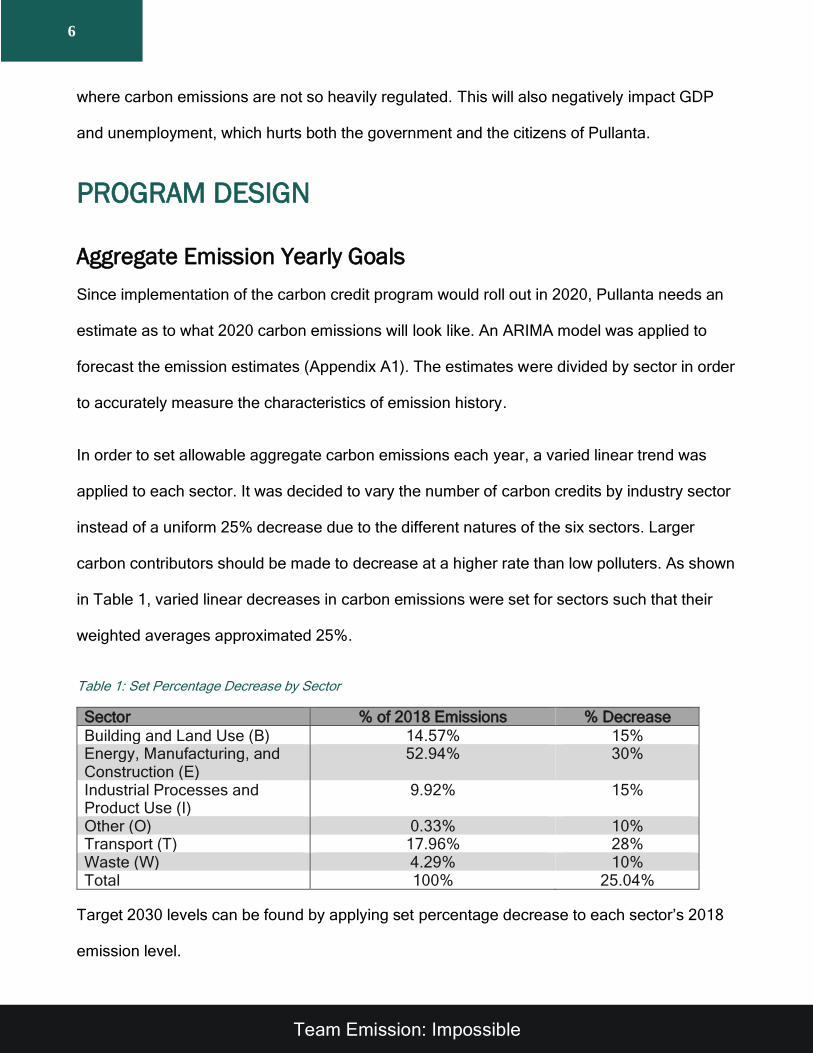
PROGRAM DESIGN
Aggregate Emission Yearly Goals
Since implementation of the carbon credit program would roll out in 2020, Pullanta needs an
estimate as to what 2020 carbon emissions will look like. An ARIMA model was applied to
forecast the emission estimates (Appendix A1). The estimates were divided by sector in order
to accurately measure the characteristics of emission history.
In order to set allowable aggregate carbon emissions each year, a varied linear trend was
applied to each sector. It was decided to vary the number of carbon credits by industry sector
instead of a uniform 25% decrease due to the different natures of the six sectors. Larger
carbon contributors should be made to decrease at a higher rate than low polluters. As shown
in Table 1, varied linear decreases in carbon emissions were set for sectors such that their
weighted averages approximated 25%.
Table 1: Set Percentage Decrease by Sector
Sector % of 2018 Emissions % Decrease
Building and Land Use (B) 14.57% 15% Energy, Manufacturing, and Construction (E)
52.94% 30%
Industrial Processes and Product Use (I)
9.92% 15%
Other (O) 0.33% 10% Transport (T) 17.96% 28% Waste (W) 4.29% 10% Total 100% 25.04%
Target 2030 levels can be found by applying set percentage decrease to each sector’s 2018
emission level.

Team Emission: Impossible
7
To get the yearly breakdown, a linear trend was applied from 2020’s predicted values to the
2030 carbon goal using the set percentage decrease in Table 1. Figure 2 shows the historical
and yearly projected emission goals by sector.
Figure 2: Historical and Projected Emissions by Sector (metric tonnes)
Credit Limits
Credits distributed to companies will come from purchasing the carbon financial instruments.
The specified number of credits for a given year will be issued to the companies at the
beginning of the year. These credits cannot be rolled over to next years. Based on analysis of
emission data (Appendix C1), we allow companies to emit 1,000 tonnes of carbon per year
without any credits. This number allows the lowest 20% of companies in terms of yearly
emissions to maintain their emission amounts without buying any emission bonds.
Companies are encouraged to buy up-front, but this rewards low emission companies by not
requiring them to pay for credits and allows high emission companies to account for
uncertainty in deciding how many bonds to purchase.
0
100,000,000
200,000,000
300,000,000
400,000,000
500,000,000
600,000,000
700,000,000
1995 2000 2005 2010 2015 2020 2025 2030
Source: Appendix A2
Energy,Manufacturing &ConstructionTransport
Buildings & LandUse
IndustrialProcesses &Product UseWaste
Other
Team Emission: Impossible
8
There is no limit as to the number of credits a single entity can purchase. With the exclusion
of an open secondary market and decreasing nature of the financial instruments, companies
are incentivized to only buy what is necessary.
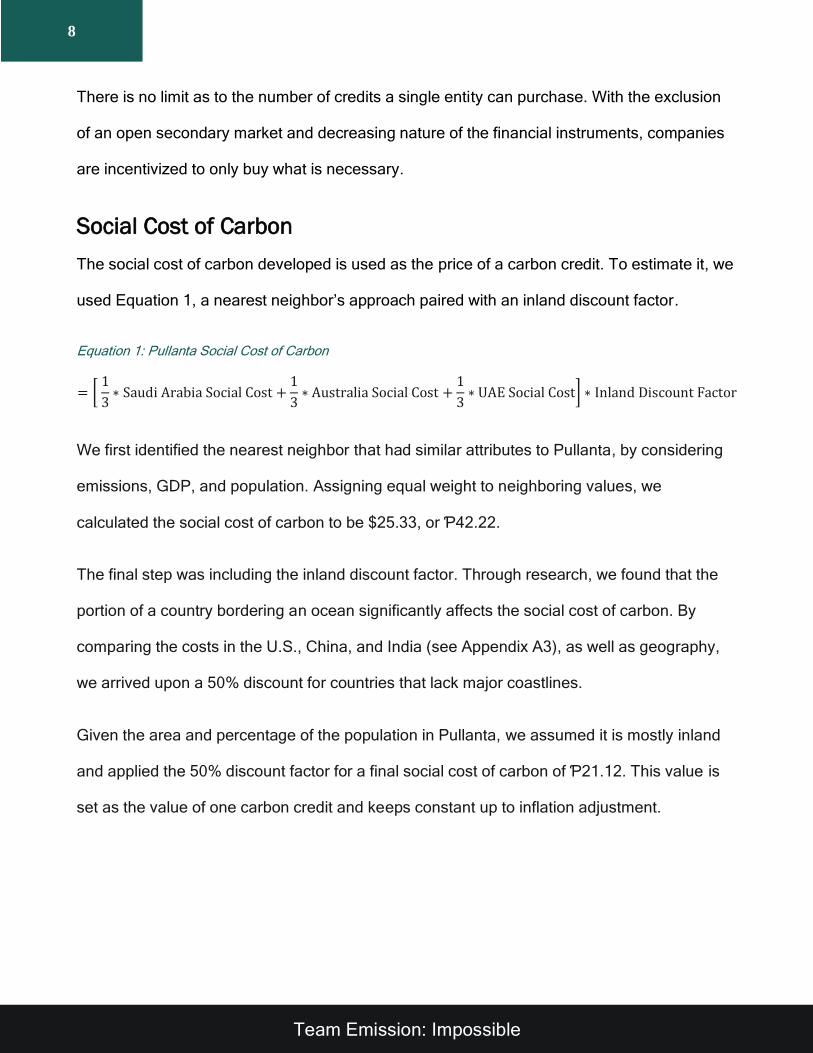
Social Cost of Carbon
The social cost of carbon developed is used as the price of a carbon credit. To estimate it, we
used Equation 1, a nearest neighbor’s approach paired with an inland discount factor.
Equation 1: Pullanta Social Cost of Carbon
= [ 1
3∗ Saudi Arabia Social Cost +
1
3∗ Australia Social Cost +
1
3∗ UAE Social Cost] ∗ Inland Discount Factor
We first identified the nearest neighbor that had similar attributes to Pullanta, by considering
emissions, GDP, and population. Assigning equal weight to neighboring values, we
calculated the social cost of carbon to be $25.33, or Ƥ42.22.
The final step was including the inland discount factor. Through research, we found that the
portion of a country bordering an ocean significantly affects the social cost of carbon. By
comparing the costs in the U.S., China, and India (see Appendix A3), as well as geography,
we arrived upon a 50% discount for countries that lack major coastlines.
Given the area and percentage of the population in Pullanta, we assumed it is mostly inland
and applied the 50% discount factor for a final social cost of carbon of Ƥ21.12. This value is
set as the value of one carbon credit and keeps constant up to inflation adjustment.

Team Emission: Impossible
9
Financial Instruments
Metal Emission Bonds
Three different metal emission bonds – labeled Gold, Silver, and Bronze – will be made
available to non-transport sectors. The rate of decrease will be linear. Companies will be
motivated to cut their emissions gradually.
Each bond will yield 100 carbon credits in the first year. The linear rate of decline will increase
going from the Bronze to Silver to Gold, such that the three bonds ends with 75, 56, and 37
credits, respectively. The yearly credits of the three bonds are visualized in Figure 3.
• Bond with linearly decreasing credits
• Time period: 10 years (or time until 2030) • Bronze: most expensive, yearly decrease of 2.5%
• Silver: price between Bronze and Gold, yearly decrease of 4.4%
• Gold: least expensive, yearly decrease of 6.3%
Metal Emission Bonds
• Companies in transportation sector must purchase this bond
• Floating bond• Time period: 10 years (or time until 2030)
• Cost comparable to that of bronze bond
Transportation Emission Bond
• Redistributes carbon credits sold back to governement
• Applied at end of the year to address excess carbon emissions• Costs 15% above social cost of carbon
• Intended for companies that run out of credits
Secondary Emission
Supplement

Team Emission: Impossible
10
Figure 3: Yearly Carbon Credits Awarded by Bonds
Since the Bronze bond provides the most carbon credits, it will be the most expensive at a
price of Ƥ18,137.92. However, companies will be incentivized to purchase the Silver bond,
with fewer credits, for a price of Ƥ15,431.66, which includes a 5% discount. The Gold bond,
with the least amount of credits, has a discount of 10% for an upfront price of Ƥ12,931.69.
See Appendix A5 for pricing formulas. This encourages companies with the ability to rapidly
decrease emissions to purchase the more progressive Silver and Gold Bonds, while still
allowing companies with less room to reduce emissions to have a base-level reduction plan
under the Bronze bond.
If a company enters the market in the middle of the program, they will receive the same
amount as every other bondholder would receive for that year, and for the years going
forward. For detailed justification see Appendix A4.
Transportation Emission Bond
The transportation sector of Pullanta was identified as having a significant increase in
emissions over the last 25 years, so we designed a separate transportation emissions bond.
75
56
37
0
20
40
60
80
100
2020 2021 2022 2023 2024 2025 2026 2027 2028 2029 2030
Nu
mb
er
of
Cre
dits
Bronze
Silver
Gold

Team Emission: Impossible
11
Table 2: Transportation Average Yearly Increase in Emissions
Sector Average Increase in Yearly
Emissions
Buildings & Land Use 0.62105%
Energy, Manufacturing & Construction
0.53958%
Industrial Processes & Product Use
1.97541%
Other -0.20819%
Transport 3.12891%
Waste 0.75882%
Companies in the transportation sector will not be allowed to buy metal emission bonds.
Instead, the transportation emission bond is designed to promote a more rapid rate of carbon
emissions reduction while providing a steeper reward for doing so. The bond delivers credits
yearly just like the metal emission bonds; however, the number of carbon credits dispersed
are floating — meaning they depend on the previous year’s reduction amount. If the previous
year’s reduction in emissions was greater than the index, a level reduction of 4,930,304
tonnes, the bond would allow for more credits the following year. If a year’s reductions did not
exceed the index, the bond would grant fewer credits.
A critical design in this bond is that payments match the yearly cost of the Bronze emission
bond. Therefore, more substantial decreases in given years result in more carbon credits at a
better price the next year. There is also a built-in reduction of carbon credits to ensure the
overall target reductions are met by 2030.
Secondary Emission Supplement
The secondary emission supplement is designed to redistribute carbon credits that were sold
back to the government. A company can purchase as many of these recycled credits as
needed, which will be packaged as a secondary emission supplement priced at a 15%
increase in the price per credit. These credits will be added to their portfolio at the end of the

Team Emission: Impossible
12
year. The 15% price increase serves to discourage companies from waiting to buy credits
until the last minute, while not being overly inhibitive.
Bond Payment
Expecting revenue from financial instruments sales to be fully earned in a single upfront
payment could put significant financial stress on some companies. Therefore, revenues from
the Bronze, Silver, and Gold bonds can also be collected yearly, where payments are based
on the proportion of that year’s credits to total credits granted by the bond (Appendix A5). The
Transportation bond revenue works on a similar structure to the Bronze bond. In all cases, the
yearly payment must be made before the bond’s credits are dispersed. According to this
structure, the yearly payment slightly understates the value of carbon credits in the first few
years and compensates later. This allows for slight leniency for companies in the early years.
See Appendix A6 for an example of how this works.
IMPLEMENTATION PLAN
Primary Market
In order to allow businesses to participate actively in this program, the government must
establish an online marketplace where companies can register to establish a portfolio of
carbon credits. The marketplace will allow companies to buy and sell credits at appropriate
times, as well as check on the number of outstanding credits available to purchase through
bonds or secondary emission supplements. The online marketplace will also store each
company’s portfolio data, allowing government regulators to check if companies are meeting
all regulations regarding carbon emissions.

Team Emission: Impossible
13
Secondary Market
Under the carbon credit program, companies will not be allowed to trade credits directly to
other companies. If a company wishes to relinquish some of the credits in their portfolio, the
government market, which sells the bonds, will offer a guaranteed buyback of all credits at
80% of the base price. These credits will be made available to other companies exclusively
through the secondary emission supplement.
The purpose of this design is to remove companies' incentives to buy and hoard more credits
than they need, as unused credits will now enforce a minor loss for companies. However,
credits will still maintain a known value due to the guaranteed buyback from the government,
allowing companies to more accurately predict their expenses per credit.
Regulations
In case companies' emissions exceed purchased credits, and no secondary emission
supplements are available, a penalty would be in place. The European Union's Emissions
Trading System uses an excess emissions penalty of €100 per metric ton beyond the allowed
limit. Our program will impose the equivalent penalty of Ƥ181.81 per ton, 8.61 times greater
than the social cost of carbon; thus, it will serve as an effective deterrent to exceeding limits.
Additionally, companies must be required to submit their carbon emissions quarterly to
ensure completeness of data and must be monitored to ensure that their numbers are
accurate.

Team Emission: Impossible
14
Effectiveness of Program
This program’s effectiveness will be evaluated by:
1. Successful reduction of overall emissions to 75% of the 2018 level by 2030.
2. Ability to keep resulting carbon emissions within 90% of the ultimate goal with 90%
certainty.
3. Generate revenue for the government to fund green programs.
In the next section, we will evaluate our program based on these criteria.
REVENUE ANALYSIS
Revenue Projection
Our program, under the assumptions made (found on pages 16-17), generates a total
revenue of approximately Ƥ157.3 billion over the next decade.
Figure 4: Revenues Generated by Financial Instruments: 59.7% of total revenue is generated from the Bronze emissions bond. The Silver and Gold emissions bond account for 14.51% and 6.08% respectively. The Transportation emissions bond accounts19.4% while the secondary emission supplement accounts for the last .31%.
Ƥ 94,037,749,752
Ƥ 22,859,103,840
Ƥ 9,577,932,560
Ƥ 30,566,306,720
Ƥ 492,867,8670
10,000,000,000
20,000,000,000
30,000,000,000
40,000,000,000
50,000,000,000
60,000,000,000
70,000,000,000
80,000,000,000
90,000,000,000
100,000,000,000
Bronze Bond Silver Bond Gold Bond TransportationBond
SecondarySupplement
Ƥ

Team Emission: Impossible
15
Usage of Revenue
Appropriate use of revenue can benefit the society and reduce companies’ costs and risks.
• Pay for the government costs associated with the implementation and management of
the program. Revenue must be used to pay for the marketplace and server costs first.
• To ensure the success of the program, Pullanta can use revenue to fund high
technology programs to monitor companies’ carbon levels. This would decrease the
operational risk of companies misreporting their emissions to avoid the purchasing of
the secondary emission supplement or paying the penalty tax.
• Fund social programs to engage citizens in the carbon reduction effort. We can adopt
the practice of Quebec, using carbon revenue to decrease taxes, indirectly funneling
the costs of carbon back to the citizens, and decrease public debt, allowing cities more
freedom to address the wants of their citizens.
• The revenue can be used for implementing environmentally friendly technology, like
sustainable transportation and buildings, as well as renewable energy sources.
For detailed investment estimates see Appendix B1

Team Emission: Impossible
16
DATA LIMITATIONS, ASSUMPTIONS & SENSITIVTY
ANALYSIS
Data Limitations
Limited data required more assumptions to be made, which have an impact on projections
and analysis.
• When calculating the social cost of carbon, an important consideration is the country’s
geography – such as amount of coastline. Without knowing specific geographical
features, we were somewhat limited in estimating its social cost of carbon.
• Company data is limited – the only data provided are yearly reported emissions, which
prevents us from taking a company’s individual practices into account, such as
whether a large amount of emissions are due to wastefulness or simply the company’s
size. Roughly 27% of the yearly emission data for businesses are zeroes. Without
context for these zeroes, it requires more uncertainty such as the amount of carbon to
allow companies to emit before requiring credits. (See Appendix C1)
• Little data for estimating the expenses of the program in Pullanta. With knowledge
about what resources Pullanta already has to implement this program, more precise
estimates of expenses could be given.
Assumptions
• Interest rate and inflation rates of 4.5% and 2% respectively were chosen for pricing
based on historical inflation and 10-year Treasury Bond data in the United States.
• In order to approximate revenue and emission totals, we chose 0.5% of purchased
credits are sold back to the government per year, and 50% of those credits are resold

Team Emission: Impossible
17
through secondary emission supplements. These numbers were conservative and
unlikely to drastically understate the true values.
• The proportion of metal emission bonds sold were set as 70% Bronze, 20% Silver, and
10% Gold, predicting that most companies will choose to finance primarily with Bronze
emission bonds.
• The Transportation emission bond awards floating amounts of carbon credits to
companies depending on the previous year’s emissions. To estimate the number of
credits the bond will award per year, we assume that companies would be slower to
reduce in the first few years and have greater reductions as the program continues.
This would correspond to lower numbers of credits in early years when compared to
the Bronze bond and have better returns in later years. The assumption for the number
of credits per year are shown in Table 3.
• The currency exchange rate: one Pula = $.60. It impacts the social cost of carbon
calculation.
Table 3: Transportation Credit Assumption Chart
Year Carbon Credits
Granted
2020 100 2021 65 2022 63 2023 71 2024 72 2025 69 2026 67 2027 75 2028 72 2029 78 2030 83

Team Emission: Impossible
18
Sensitivity Analysis
We selected our assumptions described above through careful research and the use of our
actuarial judgement. Despite this, these values may vary from our expectations. To account
for these potential fluctuations, we performed a sensitivity analysis to see how it will affect
aggregate revenue and emissions.
Revenue Sensit iv ity
• The assumption regarding the percentage of unused credits sold back to the
marketplace, increasing from .5% to 1.5%, resulted in minor changes to yearly
revenue. (Table 4)
• The assumption regarding the percentage credits resold through the secondary market
changing from 50% to 60%, resulted in a minor change in yearly revenue. (Table 4)
Table 4: Impact of proportion of credit sold back (increase) and proportion of credits resold (increase) on revenue
Year Percent Change in Revenue (due to proportion of credits
sold back)
Percent Change in Revenue (due to proportion of credits
resold)
2020 -0.254% 0.065%
2021 -0.240% 0.069%
2022 -0.234% 0.070%
2023 -0.238% 0.069%
2024 -0.245% 0.072%
2025 -0.238% 0.073%
2026 -0.232% 0.074%
2027 -0.238% 0.076%
2028 -0.236% 0.076%
2029 -0.231% 0.080%
2030 -0.227% 0.083%

Team Emission: Impossible
19
• Interest rate and inflation rate are the most likely to vary due to their volatile nature. A
1% increase in the interest rate and the inflation rate result in about a 4% decrease
and 4.5% increase in 2030 revenue respectively, while a 1% decrease in each led to a
4.4% increase and 4.2% decrease in 2030 revenue. (Figure 5 and Figure 6)
Figure 5: Impact of Interest Rate Change
Figure 6: Impact of Inflation Rate Change
• The proportions of the metal bonds have a noticeable effect on total revenue. The
worst impact would be 2.4% decrease in 2030 revenue. (Figure 7, Figure 8, and Figure
9)
• Appendix C2 summarizes the impact of these changes on 2030 revenue.
11
12
13
14
15
16
17
18
19
2020 2021 2022 2023 2024 2025 2026 2027 2028 2029 2030
Re
ve
nu
e
Billio
ns Ƥ
Original Interest Rate Interest Rate Increased Interest Rate Decreased
11
12
13
14
15
16
17
18
19
2020 2021 2022 2023 2024 2025 2026 2027 2028 2029 2030
Re
ve
nu
e
Billio
ns Ƥ
Original Inflation Rate Inflation Rate Increased Inflation Rate Decreased

Team Emission: Impossible
20
Figure 7: Impact of Increase in Sales of Bronze Bond. Our initial assumptions were 70% Bronze bonds 20% Silver bonds, and 10% Gold Bonds. 80% Bronze was tested against our assumptions.
Figure 8: Impact of Increase in Sales of Silver Bond. Our initial assumptions were 70% Bronze bonds 20% Silver bonds, and 10% Gold Bonds. 25% Silver was tested against our assumptions.
11
12
13
14
15
16
17
18
2020 2021 2022 2023 2024 2025 2026 2027 2028 2029 2030
Re
ve
nu
e
Billio
ns Ƥ
Expected Revenue Increase Bronze Bond (Decrease Silver)
Increase Bronze Bond (Decrease Gold)
10
11
12
13
14
15
16
17
18
2020 2021 2022 2023 2024 2025 2026 2027 2028 2029 2030
Re
ve
nu
e
Billio
ns Ƥ
Expected Revenue Increase Silver Bond (Decrease Bronze)
Increase Silver Bond (Decrease Gold)
Team Emission: Impossible
21
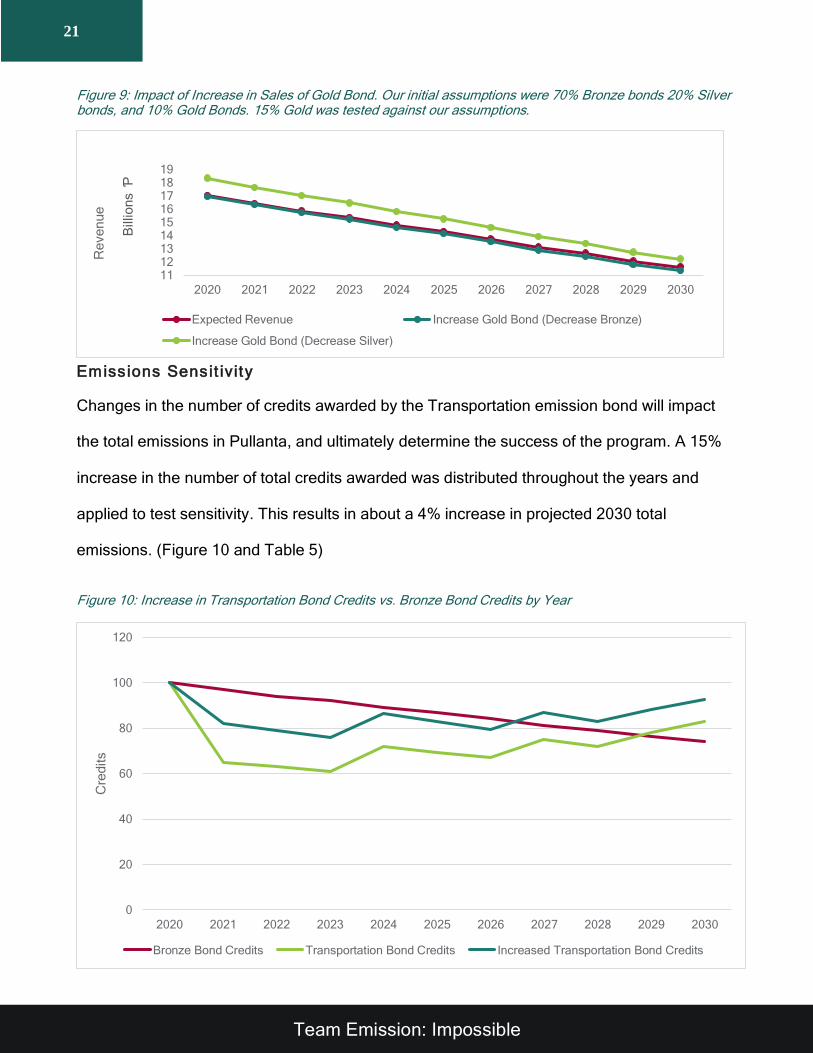
Figure 9: Impact of Increase in Sales of Gold Bond. Our initial assumptions were 70% Bronze bonds 20% Silver bonds, and 10% Gold Bonds. 15% Gold was tested against our assumptions.
Emissions Sensit ivity
Changes in the number of credits awarded by the Transportation emission bond will impact
the total emissions in Pullanta, and ultimately determine the success of the program. A 15%
increase in the number of total credits awarded was distributed throughout the years and
applied to test sensitivity. This results in about a 4% increase in projected 2030 total
emissions. (Figure 10 and Table 5)
Figure 10: Increase in Transportation Bond Credits vs. Bronze Bond Credits by Year
0
20
40
60
80
100
120
2020 2021 2022 2023 2024 2025 2026 2027 2028 2029 2030
Cre
dits
Bronze Bond Credits Transportation Bond Credits Increased Transportation Bond Credits
111213141516171819
2020 2021 2022 2023 2024 2025 2026 2027 2028 2029 2030
Re
ve
nu
e
Billio
ns Ƥ
Expected Revenue Increase Gold Bond (Decrease Bronze)
Increase Gold Bond (Decrease Silver)

Team Emission: Impossible
22
Our program is designed to reduce carbon emissions within 90% of the ultimate goal with
90% certainty. It is possible that companies emit more carbon than allowed. To investigate
this, we looked at companies who emitted more than 1.5 million tonnes. From 2017 to 2018
we found that 14.3% of these large companies had an increase in emissions, for a total
increase of 23,610,568 tonnes. We consider the extreme case that these large companies
emit more than allowed even when there is a penalty. It turns out the aggregate emission still
stays within our desired range in Table 6.
Table 6: Yearly Emission Goals vs 90% Confidence Interval of Yearly Emissions
Year Expected Emissions
Expected Emissions with Lower Limit
Expected Emissions with Upper Limit
2020 908,835,705 911,196,762 953,695,784
2021 822,480,921 824,841,978 867,341,000
2022 793,012,370 795,373,427 837,872,449
2023 767,279,656 769,640,713 812,139,735
2024 760,391,583 762,752,640 805,251,662
2025 733,372,574 735,733,631 778,232,653
2026 702,742,757 705,103,814 747,602,836
2027 689,038,270 691,399,327 733,898,349
2028 662,513,182 664,874,239 707,373,261
2029 645,930,406 648,291,463 690,790,485
2030 633,688,759 636,049,816 678,548,838
Original Emissions
Emissions with Increase in
Transportation Credits % Change in Emissions
Emissions with Extreme Increase in
Transportation Credits % Change in Emissions
2020 908,835,705 908,835,705 0 908,835,705 0
2021 822,480,921 850,074,751 0.0325 889,721,012 0.0756
2022 793,012,370 819,112,074 0.0319 860,252,460 0.0782
2023 767,279,656 791,926,634 0.0311 834,519,747 0.0806
2024 760,391,583 783,396,036 0.0294 827,631,673 0.0812
2025 733,372,574 755,020,730 0.0287 800,612,664 0.0840
2026 702,742,757 723,075,605 0.0281 769,982,848 0.0873
2027 689,038,270 707,907,162 0.0267 756,278,361 0.0889
2028 662,513,182 680,161,013 0.0259 729,753,273 0.0921
2029 645,930,406 662,233,903 0.0246 713,170,497 0.0943
2030 633,688,759 648,712,703 0.0232 700,928,850 0.0959
Table 5: Original Emissions vs Emissions with Increased Transportation Bond Credits

Team Emission: Impossible
23
Extreme Deviat ions
• An increase in interest rate from 4.5% to 10% results in a 2030 revenue change of
-23.87%. If we see extreme changes in our assumed inflation rate, an increase from
2% to 8%, 2030 revenue will increase by 23.56%. (Figure 11 and Figure 12)
Figure 11: Revenue with Extreme Interest Deviation
Figure 12: Revenue with Extreme Inflation Deviation
• A decrease in our assumed Bronze bond purchases of 40% in favor of the Silver bond
will result in a change of 2030 revenue of -11.66%. If the Bronze bond purchases
decreased by 40% in favor of the Gold bond, we will see a change in 2030 revenue of
-24.39% (Figure 13). These changes will also decrease total emissions per year
(Figure 14).
0
5,000,000,000
10,000,000,000
15,000,000,000
20,000,000,000
2020 2021 2022 2023 2024 2025 2026 2027 2028 2029 2030
Ƥ
Original Interest Rate Extreme Interest Rate
0
5,000,000,000
10,000,000,000
15,000,000,000
20,000,000,000
25,000,000,000
2020 2021 2022 2023 2024 2025 2026 2027 2028 2029 2030
Ƥ
Original Inflation Rate Extreme Inflation Rate

Team Emission: Impossible
24
Figure 13: Revenue with Extreme Bond Distribution Deviation
Figure 14: Emissions with Extreme Bond Distribution Deviation
• An increase of 40 credits per year in the transportation emission bond would result in
an increase in projected 2030 total emission of 9.6% (Figure 15).
0
5,000,000,000
10,000,000,000
15,000,000,000
20,000,000,000
2020 2021 2022 2023 2024 2025 2026 2027 2028 2029 2030
Ƥ
Original Bronze Bond Decrease Bronze Bond for Silver Bond
Decrease Bronze Bond for Gold Bond
-
200,000,000
400,000,000
600,000,000
800,000,000
1,000,000,000
2020 2021 2022 2023 2024 2025 2026 2027 2028 2029 2030
Em
issio
ns (
To
nn
es)
Original Total Emission Decrease Bronze Bond for Silver
Decrease Bronze Bond for Gold

Team Emission: Impossible
25
CONCLUSION
• Under the program outlined above, we expect emissions to gradually decrease from
2020 to a 2030 emission total equal to 633,688,759 metric tonnes. Pullanta’s goal for
2030 emissions is below 691,830,798 metric tonnes. The sensitivity analysis and
extreme deviation test show we are 90% confident that 2030 emissions will be within
90% of the target totals.
• This program is predicted to generate over Ƥ17 billion in 2020, with that number
steadily decreasing to Ƥ11.6 billion by 2030 as emission totals reduce. This is
expected to be enough to cover the costs of implementing, maintaining, and regulating
this program, as well as providing enough revenue to fund additional climate change
mitigation efforts.
600000000
650000000
700000000
750000000
800000000
850000000
900000000
950000000
1 2 3 4 5 6 7 8 9 10 11
Em
issio
ns (
Me
tric
To
nn
es)
Expected Total Emissions
Total Emissions with Extreme Increase in Tranportation Bond Credits
Figure 15: Increase in Yearly Total Emissions with Extreme Increase in Transportation Bond Credits

Team Emission: Impossible
26
APPENDIX
APPENDIX A: PROGRAM DESIGN
Section A1: 2020 ARIMA Model R Code
#Loading Packages and Emissions Data EmissionsData <- read_excel("EmissionsData.xlsx") View(EmissionsData) library(readxl) library(forecast) library(ggplot2) library(tseries) library(lmtest) #Testing stat ionary aspects and creat ing arima model for the Build ing sector Bui lding.Data <- ts(Build ings, start = 1, end = 25, frequency = 1) Bui lding.DataClean <- tsclean(Build ing.Data) kpss.test(Build ing.DataClean) #Data appears to be stat ionary plot(Build ing.DataClean) acf(Building.DataClean, lag.max = 20) pacf(Building.DataClean, lag.max = 20) BuildingARIMA1 <- auto.ar ima(Building.DataClean, trace = TRUE) predict(BuildingARIMA1, n.ahead = 1) #137,283,942 #Testing stat ionary aspects and creat ing arima model for the Industry sector Industry.Data <- ts(Industry, start = 1, end = 25, frequency = 1) Industry.DataClean <- tsclean(Industry.Data) kpss.test(Industry.DataClean) Industry.Data.Stat ionary <- diff(Industry.DataClean, differences = 1) kpss.test(Industry.Data.Stationary) #Stationary Industry.ARIMA <- auto.ar ima(Industry.Data.Stat ionary, trace = TRUE) predict(Industry.ARIMA, n.ahead = 1) # dif ference of -2,975,764 #Testing stat ionary aspects and creat ing arima model for the Energy sector Energy.Data <- ts(Energy, start = 1, end = 25, frequency = 1) Energy.Data.Clean <- tsclean(Energy.Data) kpss.test(Energy.Data.Clean) #Stationary Energy.ARIMA <- auto.arima(Energy.Data.Clean, trace = TRUE) predict(Energy.ARIMA, n.ahead = 1) #478,690,473 #Testing stat ionary aspects and creat ing arima model for the Other sector Other.Data <- ts(Other, start = 1, end = 25, frequency = 1) Other.Data.Clean <- tsclean(Other.Data) kpss.test(Other.Data.Clean) #Sta t ionary Other.ARIMA <- auto.ar ima(Other.Data.Clean, trace = TRUE) predict(Other.ARIMA, n.ahead = 1) #3,000,644 #Testing stat ionary aspects and creat ing arima model for the Transportation sector

Team Emission: Impossible
27
Transportation.Data <- ts(Transportation, start = 1, end = 25, frequency = 1) Transportation.Data.Clean <- tsclean(Transportation.Data) kpss.test(Transportation.Data.Clean) Transportation.Data.Difference <- d iff(Transportation.Data.Clean, differences = 1) kpss.test(Transportation.Data.Difference) Transportation.secondDiff <- d iff(Transportation.Data.Difference, d ifferences = 1) kpss.test(Transportation.secondDiff) Transportation.ARIMA <- auto.ar ima(Transportation.secondDiff, trace = TRUE) predict(Transportation.ARIMA, n.ahead = 1) #2nd difference of -150,018 #Testing stat ionary aspects and creat ing arima model for the Waste sector Waste.Data <- ts(Waste, start = 1, end = 25, frequency = 1) Waste.Data.Clean <- tsclean(Waste.Data) kpss.test(Waste.Data.Clean) Waste.ARIMA <- auto.arima(Waste.Data.Clean, trace = TRUE) predict(Waste.ARIMA, n.ahead = 1) #38,014,318
Section A2: Aggregate Emission Yearly Goal Table
*2020 emissions based on ARIMA model predict ions
Year B E I O T W Total
2020* 137,283,942 478,690,473 85,519,741 3,000,644 168,599,530 38,014,318 911,108,648
2021 134,975,790 465,002,599 84,742,825 2,974,567 163,669,226 37,774,876 889,139,882
2022 132,667,638 451,314,726 83,965,909 2,948,489 158,738,921 37,535,433 867,171,116
2023 130,359,485 437,626,852 83,188,992 2,922,412 153,808,617 37,295,991 845,202,350
2024 128,051,333 423,938,978 82,412,076 2,896,334 148,878,313 37,056,549 823,233,584
2025 125,743,181 410,251,105 81,635,160 2,870,257 143,948,009 36,817,107 801,264,818
2026 123,435,029 396,563,231 80,858,244 2,844,179 139,017,704 36,577,664 779,296,051
2027 121,126,876 382,875,357 80,081,327 2,818,102 134,087,400 36,338,222 757,327,285
2028 118,818,724 369,187,484 79,304,411 2,792,025 129,157,096 36,098,780 735,358,519
2029 116,510,572 355,499,610 78,527,495 2,765,947 124,226,791 35,859,338 713,389,753
2030 114,202,420 341,811,736 77,750,579 2,739,870 119,296,487 35,619,895 691,420,987

Team Emission: Impossible
28
Section A3: Nearest Neighbor for Social Cost of Carbon Development
Country Share of Global Emissions Population GDP Social Cost
India 6.82% 1.358 B 3.16 T $86
USA 14.58% 329 M 21.41 T $48
Saudi Arabia 1.76% 34.2 M 790 B $47
China 27.21% 1.4 B 15.47 T $24
UAE 0.64% 9.7 M 449.13 B $24
Italy 0.98% 60.3 M 2.09 T $1.60
Australia 1.14% 25.6 M 1.48 T $5
Turkey 1.24% 82 M 809.55 B $0.89
Pullanta 2.39% 20M 435 B $12.67
*Nearest Neighbor in each category is bolded
Section A4: Entering Mid-Program
If a company is entering late in the program, the bond awards credits on-level with other
bonds of its kind.
For example: if a new company enters the program in mid-2025, and they want to purchase a
Bronze emission bond, they would receive 87 credits for 2025, the same number of credits
that an old company holding a Bronze bond since 2020 would receive in 2025. This new
company would also pay the same amount in 2025 that the old company would pay in 2025.
Payments and credit disbursements in subsequent years would also match exactly. This is
analogous for all other bonds.
Section A5: Bond Pr ic ing Equations
𝐵𝑟𝑜𝑛𝑧𝑒 𝑃𝑟𝑖𝑐𝑒 = ∑(100 − 2.5 × 𝑡) × 21.12 × (1 + .02)𝑡
(1 + .045)𝑡
10
𝑡=0
= 18,137.92
𝑆𝑖𝑙𝑣𝑒𝑟 𝑃𝑟𝑖𝑐𝑒 = .95 ∗ ∑(100 − 4.4 × 𝑡) × 21.12 × (1 + .02)𝑡
(1 + .045)𝑡
10
𝑡=0
= 15,431.66
Team Emission: Impossible
29
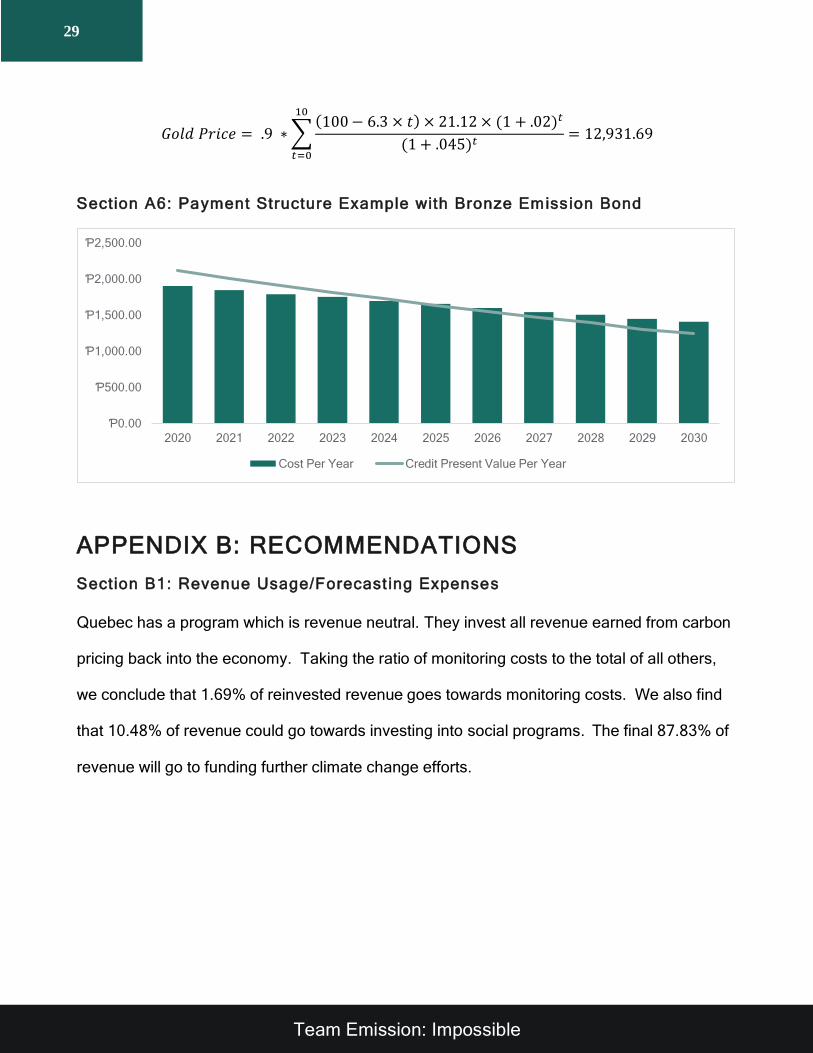
𝐺𝑜𝑙𝑑 𝑃𝑟𝑖𝑐𝑒 = .9 ∗ ∑(100 − 6.3 × 𝑡) × 21.12 × (1 + .02)𝑡
(1 + .045)𝑡
10
𝑡=0
= 12,931.69
Section A6: Payment Structure Example with Bronze Emission Bond
APPENDIX B: RECOMMENDATIONS
Section B1: Revenue Usage/Forecast ing Expenses
Quebec has a program which is revenue neutral. They invest all revenue earned from carbon
pricing back into the economy. Taking the ratio of monitoring costs to the total of all others,
we conclude that 1.69% of reinvested revenue goes towards monitoring costs. We also find
that 10.48% of revenue could go towards investing into social programs. The final 87.83% of
revenue will go to funding further climate change efforts.
Ƥ0.00
Ƥ500.00
Ƥ1,000.00
Ƥ1,500.00
Ƥ2,000.00
Ƥ2,500.00
2020 2021 2022 2023 2024 2025 2026 2027 2028 2029 2030
Cost Per Year Credit Present Value Per Year
Team Emission: Impossible
30
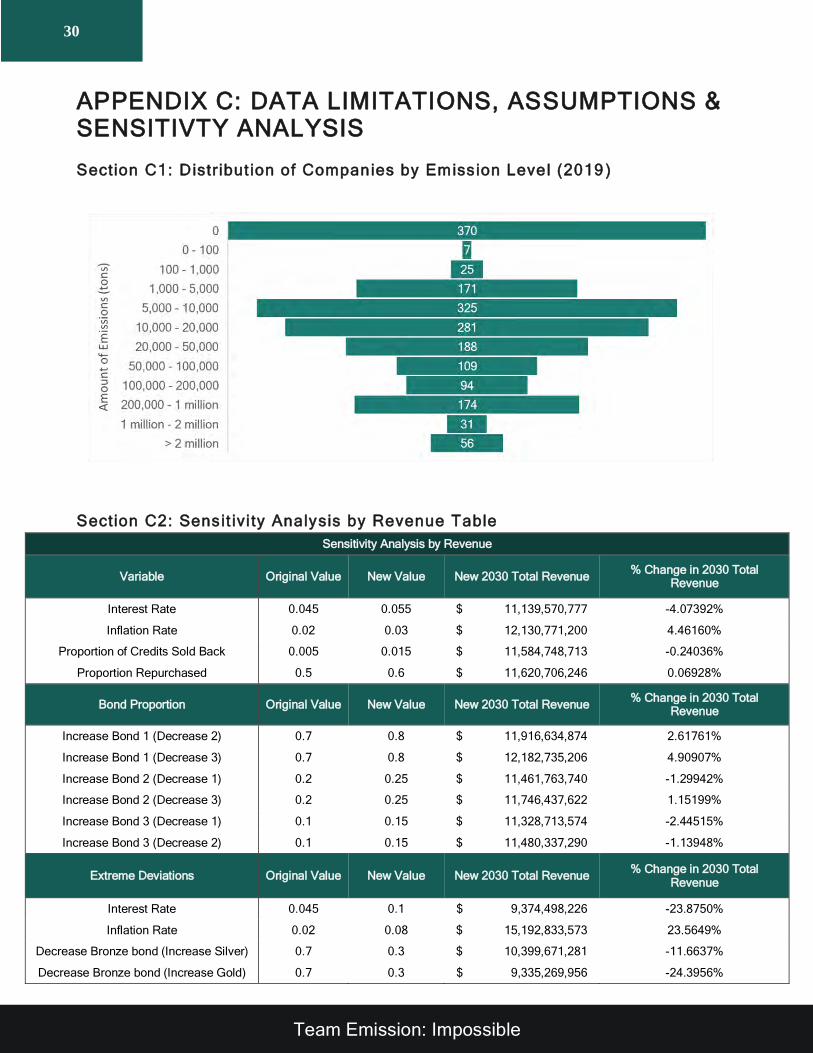
APPENDIX C: DATA LIMITATIONS, ASSUMPTIONS & SENSITIVTY ANALYSIS
Section C1: Distribut ion of Companies by Emission Level (2019 )
Section C2: Sensit ivi ty Analysis by Revenue Table
Sensitivity Analysis by Revenue
Variable Original Value New Value New 2030 Total Revenue % Change in 2030 Total
Revenue
Interest Rate 0.045 0.055 $ 11,139,570,777 -4.07392%
Inflation Rate 0.02 0.03 $ 12,130,771,200 4.46160%
Proportion of Credits Sold Back 0.005 0.015 $ 11,584,748,713 -0.24036%
Proportion Repurchased 0.5 0.6 $ 11,620,706,246 0.06928%
Bond Proportion Original Value New Value New 2030 Total Revenue % Change in 2030 Total
Revenue
Increase Bond 1 (Decrease 2) 0.7 0.8 $ 11,916,634,874 2.61761%
Increase Bond 1 (Decrease 3) 0.7 0.8 $ 12,182,735,206 4.90907%
Increase Bond 2 (Decrease 1) 0.2 0.25 $ 11,461,763,740 -1.29942%
Increase Bond 2 (Decrease 3) 0.2 0.25 $ 11,746,437,622 1.15199%
Increase Bond 3 (Decrease 1) 0.1 0.15 $ 11,328,713,574 -2.44515%
Increase Bond 3 (Decrease 2) 0.1 0.15 $ 11,480,337,290 -1.13948%
Extreme Deviations Original Value New Value New 2030 Total Revenue % Change in 2030 Total
Revenue
Interest Rate 0.045 0.1 $ 9,374,498,226 -23.8750%
Inflation Rate 0.02 0.08 $ 15,192,833,573 23.5649%
Decrease Bronze bond (Increase Silver) 0.7 0.3 $ 10,399,671,281 -11.6637%
Decrease Bronze bond (Increase Gold) 0.7 0.3 $ 9,335,269,956 -24.3956%
Team Emission: Impossible
31
Works Cited
“Annual Share of Global CO2 Emissions.” Our World in Data, University of Oxford,
ourworldindata.org/grapher/annual-share-of-co2
emissions?tab=chart&time=1974..2017&country=AUS BRA CHN IND ITA SAU TUR
ARE USA.
“Carbon Pricing Leadership Coalition.” What Are the Options for Using Carbon Pricing
Revenues,Sept.2016,http://pubdocs.worldbank.org/en/668851474296920877/CPLC-
Use-of-Revenues-Executive-Brief-09-2016.pdf.
Appunn, Kerstine, and Luke Sherman. “Understanding the European Union’s
Emissions Trading System.” Clean Energy Wire, 21 Aug. 2018.
https://www.cleanenergywire.org/factsheets/understanding-european-unions-
emissions-trading-system
National Academies of Sciences, Engineering, and Medicine. 2017. Valuing Climate
Damages: Updating Estimation of the Social Cost of Carbon Dioxide. Washington, DC:
The National Academies Press. doi: https://doi.org/10.17226/24651.
“US INFLATION RATE.” US Inflation, usinflation.org/us-inflation-rate/.
“10 Year Treasury Rate:” YCharts, ycharts.com/indicators/10_year_treasury_rate.