OECD, Addressing Competitiveness and Carbon Leakage Concerns From Carbon Markets
45
Unclassified ENV/EPOC/WPCID(2012)4/FINAL Organisation de Coopération et de Développement Économiques Organisation for Economic Co-operation and Development 06-Sep-2013 ___________________________________________________________________________________________ English - Or. English ENVIRONMENT DIRECTORATE ENVIRONMENT POLICY COMMITTEE Working Party on Climate, Investment and Development ADDRESSING COMPETITIVENESS AND CARBON LEAKAGE CONCERNS ARISING FROM MULTIPLE CARBON MARKETS: A MODELLING ASSESSMENT E. Lanzi, D. Mullaly, J. Chateau, R. Dellink This report examines the macroeconomic and sectoral competitiveness and carbon leakage impacts associated with a range of stylised mitigation policy scenarios. It also investigates border carbon adjustments (BCAs) as well as direct and indirect (offset-based) linking of carbon markets as possible response policies to address these impacts. This report was submitted for declassification to EPOC under the written procedure. As no further comments were received, this paper was declassified on 5 September 2013. A previous draft was discussed at the September 2012 WPCID meeting. The current version incorporates comments from WPCID delegates, provided both at that meeting and via written procedure. This report counts towards the 2011-2012 PWB Output item 2.3.2.1.8 on climate change and green growth. Elisa Lanzi (email: [email protected]), Environment Direcorate / Environment and Economy Integration Division. JT03344031 Complete document available on OLIS in its original format This document and any map included herein are without prejudice to the status of or sovereignty over any territory, to the delimitation of international frontiers and boundaries and to the name of any territory, city or area. ENV/EPOC/WPCID(2012)4/FINAL Unclassified English - Or. English
description
OECD report on competitiveness impacts and carbon leakage from market mechanisms.
Transcript of OECD, Addressing Competitiveness and Carbon Leakage Concerns From Carbon Markets
Unclassified ENV/EPOC/WPCID(2012)4/FINAL Organisation de Coopération et de Développement Économiques Organisation for Economic Co-operation and Development 06-Sep-2013 ___________________________________________________________________________________________
English - Or. English ENVIRONMENT DIRECTORATE ENVIRONMENT POLICY COMMITTEE
Working Party on Climate, Investment and Development
ADDRESSING COMPETITIVENESS AND CARBON LEAKAGE CONCERNS ARISING FROM MULTIPLE CARBON MARKETS: A MODELLING ASSESSMENT E. Lanzi, D. Mullaly, J. Chateau, R. Dellink
This report examines the macroeconomic and sectoral competitiveness and carbon leakage impacts associated with a range of stylised mitigation policy scenarios. It also investigates border carbon adjustments (BCAs) as well as direct and indirect (offset-based) linking of carbon markets as possible response policies to address these impacts. This report was submitted for declassification to EPOC under the written procedure. As no further comments were received, this paper was declassified on 5 September 2013. A previous draft was discussed at the September 2012 WPCID meeting. The current version incorporates comments from WPCID delegates, provided both at that meeting and via written procedure. This report counts towards the 2011-2012 PWB Output item 2.3.2.1.8 on climate change and green growth.
Elisa Lanzi (email: [email protected]), Environment Direcorate / Environment and Economy Integration Division.
JT03344031
Complete document available on OLIS in its original format This document and any map included herein are without prejudice to the status of or sovereignty over any territory, to the delimitation of international frontiers and boundaries and to the name of any territory, city or area.
ENV
/EPOC
/WPC
ID(2012)4/FIN
AL
Unclassified
English - O
r. English
ENV/EPOC/WPCID(2012)4/FINAL
2
ABSTRACT
Competitiveness and carbon leakage issues have been some of the main concerns in the implementation and discussions of climate policies. These concerns are particularly important in the presence of multiple carbon markets, since differences in climate change policy approaches may have impacts on the relative competitiveness of domestic sectors in countries with more stringent policies, and on the environmental effectiveness through carbon leakage.
This paper examines the macroeconomic and sectoral competitiveness and carbon leakage impacts associated with a range of stylised mitigation policy scenarios. The scenarios reflect different depictions of carbon markets in terms of their level of linkages, their coverage (i.e. number of countries participating, types of gases and sectors) and the stringency of the carbon pricing policy across countries. The paper also investigates some policies to address competitiveness and carbon leakage issues. The analysis considers border carbon adjustments (BCAs) as well as direct and indirect (offset-based) linking of carbon markets.
The results show that in the presence of multiple carbon markets, competitiveness can decrease in countries that undertake climate policies, also leading to carbon leakage. The negative sectoral competitiveness and leakage effects can be reduced when more countries act, more emission sources are covered, and when the climate mitigation policy is harmonised across countries. The results also show that response policies, such as BCAs and linking of carbon markets, can address some, but not all, of the competitiveness and carbon leakage issues. Whilst BCAs are more effective than linking instruments in addressing domestic competitiveness concerns, linking instruments better preserve the welfare of countries that are not undertaking a climate policy.
JEL classification: Q54; H25; D58 Keywords: Climate change; mitigation; competitiveness; border tax adjustment; computable general equilibrium model.

ENV/EPOC/WPCID(2012)4/FINAL
3
RÉSUMÉ
Parmi les problèmes fréquemment évoqués quant à la faisabilité des politiques de changement climatique les pertes de compétitivité et les fuites carbones. Ces inquiétudes sont particulièrement pertinentes dans le cas de l’émergence de marchés du carbone multiples et régionaux. Dans le cas de marchés carbone isolés et d’objectifs de réduction d’émissions de gaz à effet de serre propres à chaque région, la différence de valeur du carbone entre les régions qui en résulte affectera les compétitivités sectorielles relatives des pays et pourra amoindrir l’efficacité environnementale des politiques au travers de fuite de carbone d’une région à l’autre.
Ce document examine les éventuelles pertes de compétitivité et les fuites de carbone associées à une panoplie de scénarios stylisés de politiques d’atténuation du changement climatique. Ces scénarios caractérisent différentes structures de marché du carbone en termes de sources d’émissions couvertes par ces marchés, du degré d’intégration des marchés régionaux les uns avec les autres, du nombre de pays mettant en place ce type de marché et de l’intensité de l’effort de maîtrise des émissions. Le document examine ensuite des stratégies additionnelles visant à corriger des pertes de compétitivité et à limiter les fuites de carbone. Deux optiques polaires sont envisagées, la mise en place de taxes carbone aux frontières et des stratégies d’intégration internationale des marchés carbone, de façon directe ou indirecte via la mise en place de crédits d’émissions.
Le premier résultat indique que la multiplicité des marchés carbone entraînerait bien des pertes de compétitivité pour les pays qui mettent en place un prix du carbone, ainsi que des fuites de carbone vers les pays qui n’ont pas de prix du carbone. Cependant, un second résultat indique que les pertes de compétitivités sectorielles se réduisent au fur et à mesure que les marchés de carbone sont étendus à plus de sources d’émissions, à plus de pays. Un résultat supplémentaire montre que quel que soit la stratégie additionnelle adoptée pour contrecarrer les effets des politiques climatiques, elle ne pourra à elles seule régler intégralement les problèmes des pertes de compétitivité et de fuites carbone. Ainsi les mesures aux frontières apparaissent plus efficaces, pour limiter les pertes de compétitivité, que les stratégies d’intégration internationale des marchés carbone, ces dernières sont moins couteuse en termes de bien-être pour les pays qui n’adoptent pas de politique de lutte contre le changement climatique.
Classification JEL : Q54 ; H25 ; D58 Mots-clé : Changement climatique ; atténuation ; compétitivité ; taxe carbone aux frontières ; modèle d’équilibre général calculable.
ENV/EPOC/WPCID(2012)4/FINAL
4
FOREWORD
This report on “Addressing the competitiveness and carbon leakage impacts arising from multiple carbon markets: a modelling assessment” is a follow up paper to the OECD Environmental Outlook to 2050 (2012). The climate change chapter of the Environmental Outlook to 2050 presented an analysis of global climate mitigation scenarios to study the impact of climate policy on key areas of environmental concern. The Outlook also analysed the economic costs of the global scenarios and found that the lack of international co-operation on climate change can lead to additional costs of reducing greenhouse gas emissions. In particular, the Outlook found that uneven levels of mitigation efforts may give rise to competitiveness issues and to carbon leakage. The present report follows up on the analysis carried out for the Outlook, by analysing more into depth the competitiveness and carbon leakage impacts of multiple carbon markets, using stylised mitigation policy scenarios. This report also analyses the economic impacts of some policies aimed at reducing these negative impacts of climate policies.
This report has been authored by Damian Mullaly of the Australian Government and Elisa Lanzi, Rob Dellink and Jean Chateau of the OECD Secretariat. In addition to WPCID delegates, the authors would like to thank Simon Upton, Helen Mountford, Shardul Agrawala, Anthony Cox, Marie-Christine Tremblay, Christa Clapp, Andrew Prag, Jane Ellis, Dale Andrew and Osamu Kawanishi of the OECD for valuable comments and suggestions. The generous in-kind contribution of the Australian Treasury to this project through the secondment of Damian Mullaly to the OECD is gratefully acknowledged.
This document does not necessarily represent the views of either the OECD or its member countries. It is published under the responsibility of the authors.
This paper, once endorsed by EPOC delegates for declassification, is intended for release as part of the OECD Environment Working Paper series.
ENV/EPOC/WPCID(2012)4/FINAL
5
EXECUTIVE SUMMARY
As countries advance in climate change mitigation policy, with different timing and approaches, multiple carbon markets are emerging. Differences in climate change policy approaches may have impacts on the relative competitiveness of domestic sectors in countries with more stringent policies, and on the environmental effectiveness through carbon leakage (i.e. increases in greenhouse gas (GHG) emissions in sectors and countries outside the scope of the mitigation policy). To provide more insights on this important topic, this report examines the macroeconomic and sectoral competitiveness and carbon leakage impacts associated with a range of stylised mitigation policy scenarios. The scenarios reflect different depictions of carbon markets in terms of their level of linkages, their coverage (i.e. number of countries participating, types of gases and sectors) and the stringency of the carbon pricing policy across countries. It then investigates border carbon adjustments (BCAs) as well as direct and indirect (offset-based) linking of carbon markets as possible response policies to address these impacts.
The analysis uses the ENV-Linkages model, a global dynamic Computable General Equilibrium (CGE) model, which is well suited to addressing the policy issues covered in the report. ENV-Linkages describes the interactions between economic activities across sectors and regions, with an emphasis on the energy-related economic activities. It also incorporates the links between economic activity and GHG emissions, and the possibilities for mitigation. While the numerical results generated in this report depend on the specification of the model, a number of interesting findings may be drawn.
First, the analysis shows that in the global climate mitigation scenarios presented in the OECD Environmental Outlook to 2050, macroeconomic and sectoral competiveness impacts (as measured by changes in welfare and sectoral output, respectively) are largest when carbon markets are not linked and the stringency of mitigation action varies substantially across countries.
Second, the report analyses a number of scenarios in which only some regions implement carbon markets and the markets are not internationally linked. These scenarios, referred to as multiple carbon market scenarios, vary in the number of sectors and gases that are included in the carbon pricing policy. The simulation results pertaining to the multiple carbon market scenarios developed in this report shed further light on the nature of the competitiveness impacts. Emission-intensive, trade-exposed (EIT) sectors in acting countries (i.e. countries that impose carbon pricing) are most affected. This in turn leads to an increase in production and exports of EIT goods in non-acting countries. Fossil fuel exporting countries, whether acting or non-acting, are negatively affected by the lower global demand for energy resulting from carbon pricing. The shift in production from acting to non-acting countries also leads to carbon leakage, whereby emission reductions in the acting country are partially offset by emission increases in non-acting countries, thus reducing the overall effectiveness of the climate mitigation policy. The analysis shows that the negative sectoral competitiveness and leakage effects can be reduced when more countries act, more emission sources are covered, and when the climate mitigation policy is harmonised across countries.
Third, the report analyses possible policies aimed at addressing the aforementioned competitiveness and carbon leakage impacts. In particular the report analyses border carbon adjustments (BCAs) and direct linking of carbon markets and indirect linking of carbon market through the use of offsets. Offsets act as an indirect linking mechanism since they offer the possibility, common to all acting countries, to reduce emissions in countries where cheaper emission reduction options are available. The simulation results
ENV/EPOC/WPCID(2012)4/FINAL
6
show that BCAs and (direct or indirect) linking can help address competitiveness losses or carbon leakage. None of these response policies, however, can solve all adverse impacts. BCAs can help preserve the domestic macroeconomic and sectoral competitiveness of acting countries as they extend the burden of emission reductions to non-acting countries. Specifically, in the case of BCAs, the costs of shifting part of the emission reductions to non-acting countries are borne by non-acting countries, whereas in the case of linking through carbon offsets, non-acting countries receive compensation for the reduced emissions. A further complicating factor is the important set of political economy concerns related to BCAs, including potential incompatibility with WTO and the risk of retaliation by other countries. While BCAs are more effective in addressing domestic competitiveness concerns than linking (direct or indirect), the latter are better in preserving the welfare of countries that are not undertaking a climate policy. Combining both direct and indirect linking without the use of BCAs is most effective in reducing the global welfare and EIT sectoral output losses. Direct and indirect linking may also keep carbon prices relatively low compared to BCAs as they ensure that all least-cost measures are adopted.
Since the BCAs scenario negatively affects non-acting countries, it could be more cost-effective for them to undertake domestic climate action than to have BCAs imposed on them. This intuition is supported by comparing the BCAs case to a scenario without BCAs in which non-acting countries adopt small carbon targets leading to the same emissions levels as the BCAs scenario. This scenario comparison shows that non-acting countries can avoid a large part, but not all, of the negative welfare impact of the BCA case by taking action to reduce emissions. This reduces global mitigation efforts and costs, thereby resulting in an improvement of welfare at global level compared to the BCA scenario. Further, the adoption of carbon policies by all countries, even with different policy targets, contributes to re-establishing the initial competitive positions and to level the playing field.
Finally, in terms of environmental effectiveness, the analysis shows that there is no carbon leakage in the global mitigation scenarios of the Outlook as all sources of emissions (all regions, all sectors, and all gases) are included in the climate policy. In the multiple carbon market scenarios, emissions increase in non-acting countries, implying international carbon leakage. When sectors in acting countries are excluded from carbon pricing, there is also an emission increase in uncapped sectors, as higher production costs for capped sectors cause shifts in demand towards uncapped sectors. This effect, labelled as domestic leakage in this report, is generally small but increases with the size and number of excluded sectors. When the policy is limited to CO2, in acting countries there is a decrease in emissions of other GHGs, as they are largely linked to the same economic activities. These complementary emission reductions may counterbalance the leakage effects. However, when the overall emission reduction targets are the same as in the case in which all gases are covered, pricing CO2 only is more costly as a number of cost-effective mitigation measures may be missed. In terms of the policy response considered, the analysis shows that BCAs are most effective in reducing carbon leakage as they induce emission reductions in non-acting countries. Direct and indirect linking dampens carbon leakage by (partially) avoiding shifts in production of emission-intensive sectors to non-acting countries.
While the scenarios investigated in this report lead to positive costs of action (as measured through reduced welfare and EIT sectoral output), it is important to note that there are also benefits associated with mitigation policy. Although not reflected in the present analysis, in the long run the costs of the policies may well be outweighed by the benefits associated with reduced environmental impacts. Furthermore, the shift in relative competitiveness towards greener, low-carbon firms and sectors will be essential for moving toward a low-carbon economy.

ENV/EPOC/WPCID(2012)4/FINAL
7
TABLE OF CONTENTS
ABSTRACT .................................................................................................................................................... 2
RÉSUMÉ ........................................................................................................................................................ 3
FOREWORD .................................................................................................................................................. 4
EXECUTIVE SUMMARY ............................................................................................................................ 5
ADDRESSING COMPETITIVENESS AND CARBON LEAKAGE IMPACTS ARISING FROM MULTIPLE CARBON MARKETS: A MODELLING ASSESSMENT ....................................................... 9
1. Introduction .......................................................................................................................................... 9 2. Competitiveness and carbon leakage impacts of global mitigation policies .................................. 11
2.1 Defining competitiveness and carbon leakage and their associated indicators ......................... 11 2.2 Overview of the global mitigation policy scenarios ................................................................. 13 2.3 Results for the global mitigation policy scenarios .................................................................... 14
2.3.1 Macroeconomic competitiveness .......................................................................................... 14 2.3.2 Sectoral competitiveness ....................................................................................................... 16 2.3.3 Carbon leakage ...................................................................................................................... 18
3. Competitiveness and carbon leakage impacts in stylised multiple carbon market scenarios ......... 19 3.1 Description of the reference multiple carbon market scenario ................................................. 19
3.1.1 Results from the reference multiple carbon market scenario ................................................ 20 3.2 Overview of the multiple carbon market scenarios ................................................................... 21 3.3 Results of the multiple carbon market scenarios ....................................................................... 22
3.3.1 Macroeconomic competitiveness .......................................................................................... 22 3.3.2 Sectoral competitiveness ....................................................................................................... 24 3.3.3 Carbon leakage ...................................................................................................................... 25
4. Response policies to address competitiveness and carbon leakage issues ..................................... 26 4.1 Measures to address competitiveness and carbon leakage impacts .......................................... 26 4.2 Overview of the response policy scenarios ............................................................................... 27 4.3 Results of the response policy scenarios ................................................................................... 29
4.3.1 Macroeconomic competitiveness .......................................................................................... 29 4.3.2 Sectoral competitiveness ....................................................................................................... 31 4.3.3 Carbon leakage ...................................................................................................................... 31
4.4 Active mitigation policy by non-acting countries ..................................................................... 32 5. Concluding remarks ........................................................................................................................ 34
REFERENCES ............................................................................................................................................. 35
ANNEX I: A SNAPSHOT OF THE ENV-LINKAGES MODEL ............................................................... 38
ANNEX II: DETAILED REGIONAL RESULTS ....................................................................................... 43
ENV/EPOC/WPCID(2012)4/FINAL
8
Tables
Table 1. Overview of the Environmental Outlook to 2050 (OECD, 2012) policy scenarios .............. 14 Table 2. Macroeconomic indicators for the Outlook scenarios, 2020 ................................................ 15 Table 3. Output of EIT sectors in the Outlook scenarios, 2020 .......................................................... 18 Table 4. Mitigation efforts in the Partial multiple carbon markets scenario ....................................... 20 Table 5. Impacts of the multiple carbon market policy on key indicators, 2020 ................................ 21 Table 6. Overview of the multiple carbon markets scenarios ............................................................. 22 Table 7. Carbon prices in acting countries in the multiple carbon markets scenarios, 2020 .............. 24 Table 8. Competitiveness impacts of multiple carbon markets scenarios in EIT sectors, 2020 ......... 24 Table 9. Overview of the response policy scenarios ........................................................................... 29 Table 10. Carbon prices in acting countries in the response policy scenarios, 2020 ............................ 30 Table 11. Competitiveness impacts of response policies in EIT sectors, 2020 ..................................... 31 Table A1.1. ENV-Linkages model sectors and regions ............................................................................ 42 Table A2.1. Impacts of the global mitigation policies on welfare, 2020 .................................................. 43 Table A2.2. Impacts of the global mitigation policies on EIT sectoral output, 2020 ................................ 43 Table A2.3. Impacts of the stylised multiple carbon market scenarios on welfare, 2020 ......................... 44 Table A2.4. Impacts of the stylised multiple carbon market scenarios on EIT sectoral output, 2020 ...... 44 Table A2.5. Impacts of response policies on welfare, 2020 ...................................................................... 45 Table A2.6. Impacts of response policies on EIT sectoral output, 2020 ................................................... 45
Figures
Figure 1. Welfare impacts of the multiple carbon markets scenarios, 2020 ......................................... 23 Figure 2. Carbon leakage and complementary emission reductions in the multiple carbon markets scenarios, 2020 .......................................................................................................................................... 26 Figure 3. Welfare impacts of the response policies, 2020 .................................................................... 30 Figure 4. Carbon leakage and complementary emission reductions of the response policies, 2020 .... 32 Figure 5. Competitiveness impacts of the carbon tax in non-Annex I countries .................................. 34 Figure A1.1. Production structure of a generic sector in ENV-Linkages .................................................. 39
Boxes
Box 1. Implementing the policy instruments in a CGE framework .......................................................... 28
ENV/EPOC/WPCID(2012)4/FINAL
9
ADDRESSING COMPETITIVENESS AND CARBON LEAKAGE IMPACTS ARISING FROM MULTIPLE CARBON MARKETS: A MODELLING ASSESSMENT
1. Introduction
Climate change is one of the main global challenges of our time. Recently, countries have been gradually increasing their efforts to address this issue but the path to achieve ambitious global mitigation action is still unclear. The prospects for a globally harmonised carbon market are weak. International climate policy action will, at least in the short term, be built out of a collection of domestic actions (Prag et al, 2011). As countries advance in their climate change mitigation policy efforts, with notable differences in timing and approaches, multiple carbon markets are emerging. While country-level experiences with greenhouse gas (GHG) emissions related taxes remain fairly limited (e.g. Sweden is a notable exception), the international community has made some progress towards implementing Emission Trading Schemes (ETSs) (e.g. the European Union, Norway, New Zealand, Australia and Kazakhstan); see OECD (2012) for an overview of recent policy developments. These schemes vary significantly in terms of their target, size, and other design features such as sectoral coverage. International linkages between ETSs are the exception, as of yet, and at present there are no direct links between these systems. However, with the EU ETS being merged with the Norwegian ETS and being linked with the Australian scheme from 2015, and with more ongoing policy discussions on linking, this trend is starting to shift.
In this context, many countries are worried that ambitious domestic efforts in reducing emissions could generate domestic welfare losses, negatively impacting on the competitiveness of domestic industries and leading to carbon leakage (i.e. an increase in emissions from non-constrained sectors and countries). These concerns have led policymakers to examine more closely the domestic impacts of their climate policies and how the negative impacts may be addressed (Burniaux and Oliveira Martins, 2011). Concerns are particularly focused on the macroeconomic impacts and on the impacts on emission-intensive, trade-exposed (EIT) sectors. The EIT sectors are likely to encounter the largest trade and competitiveness impacts, as their high emission intensity implies relatively high production cost increases and their dependency on international trade implies limited options for passing on the costs of pricing carbon. To address competitiveness concerns, some countries have put in place policies to reduce the burden on domestic industries. For example, the European Commission has authorised its Member States to compensate industries that are large electricity users for some of the costs resulting from the EU ETS. Compensation rules, however, may risk leading to substantial overcompensation for given carbon leakage risk (Martin et al., 2013).
It is important to keep competitiveness concerns in perspective. Climate change mitigation policy will encourage substitution toward low-carbon products and processes. These policies can reduce the relative competitiveness of firms using high-carbon production processes compared with those that are more carbon-efficient (OECD, 2010b). This will be fundamental for moving towards a low-carbon economy. Further, the short- and medium-term costs of the climate policies investigated in this report are likely to be outweighed in the long-term by economic, social, and environmental benefits of action (OECD, 2009a).
ENV/EPOC/WPCID(2012)4/FINAL
10
While these effects are interesting, the focus of this report is specifically on the competitiveness consequences of climate policies.1
The use of border carbon adjustments (BCAs) has been proposed as a way to address adverse competitiveness effects and carbon leakage, especially for EIT sectors. BCAs are import fees and/or export subsidies levied by countries imposing a climate mitigation policy (hereafter acting countries) on goods manufactured in countries that are not imposing a carbon policy (hereafter non-acting countries). The environmental rationale for BCAs is that they would reduce carbon leakage and provide incentives for non-acting countries to strengthen their mitigation policies. Even when carbon leakage is limited, BCAs can potentially contribute to reducing competitiveness and output losses in domestic EIT sectors through levelling domestic and imported prices (Burniaux et al., 2013). However, there are important political-economy concerns related to BCAs, including potential incompatibility with the World Trade Organisation (WTO) rules and the risk of retaliation by other countries which may result in “trade wars”.
Competitiveness impacts may also be addressed by levelling carbon prices across countries through linking of different carbon markets. This report considers direct linking as well as ‘indirect’ linking of carbon markets.2 In this report, indirect linking refers to the possibility to use a common pool of carbon offsets by all acting countries (Dellink et al., 2010). Offsets enable emission targets in acting countries to be met by undertaking emission reductions in non-acting countries for example through the Clean Development Mechanism (CDM). This not only leads to a reduction of costs, but also to a (partial) harmonisation of carbon prices across the acting countries. The direct linking instrument considered in this analysis is the implementation of unlimited permit trading between all acting countries (OECD, 2009a). Compared with the situation where a number of regions meet their emission reduction objectives in isolation, direct or indirect linking of ETSs can reduce mitigation costs by fostering partial or even full convergence in carbon prices, and thus in marginal abatement costs, across the different ETSs. Linking can thus reduce carbon leakage as well as competitiveness losses, as it smoothes distortions across the countries taking action on climate change (Jaffe and Stavins, 2007).
The purpose of this report is first to investigate the consequences of mitigation policies on (1) competitiveness at the national level (including welfare impacts) in acting and non-acting countries; (2) competitiveness of EIT sectors in the acting countries, and (3) carbon leakage. The analysis focuses on mitigation policies that result in multiple carbon markets, that is, a collection of partial carbon markets that exclude some regions, sectors or gases from carbon pricing and that are not internationally harmonised. It then assesses the effectiveness of BCAs and linking of carbon markets to countervail these impacts, and identifying whether these instruments become less effective when used in combination. This report does not look at competitiveness impacts at the sub-sectoral or individual firm level. Impacts of specific policies on specific firms and household groups can deviate from the aggregate picture presented in this report. Therefore, case-studies at the sub-sectoral level could be a useful companion to the analysis presented here.
To quantify the economic effects of the policies investigated in the context of complex economies with existing market distortions, an applied global Computable General Equilibrium (CGE) framework is used. The inclusion of all sectors of the economy in the CGE modelling framework and the presence of
1 Similarly, many factors that affect an industrial sector’s competitiveness, such as labor, capital, energy,
transportation and other input costs, access to raw materials, product quality, and exchange rates, should not be confused with the issue of international competitiveness as it relates to climate policy (Reinaud, 2008). This issue is also not the same as that of competition issues within carbon markets, such as market power and oligopoly (OECD, 2011b).
2 Direct linking of domestic markets could co-exist with indirect linking via crediting mechanisms under the UNFCCC process, even in a world without Kyoto Protocol-style top down international climate policy (for a discussion of options see Prag et al., 2012).
ENV/EPOC/WPCID(2012)4/FINAL
11
intersectoral linkages and feedbacks throughout the economy make the general equilibrium analysis a well-suited tool to address the policy questions posed in this report. For policies that affect relative prices, such as carbon pricing policies, the CGE approach is essential to reflect how differences in relative prices induce substitution mechanisms and indirect effects throughout the economy. For instance, if carbon prices lead to an increase in energy costs, prices of energy-intensive goods will increase relative to those of cleaner commodities. Demand for these commodities will then increase, driving their price back up. Similarly, if labour and capital are freed up from reduced production of energy, this will be re-employed elsewhere in the economy, leading to changes in supply of other goods and services. Changes in international trade patterns further complicate the picture. Essentially, firms and households seek to minimize their costs and maximise their utility, respectively. What emerges is a full new equilibrium in which all prices are adjusted and demand equals supply again for all commodities simultaneously, at different levels of activity for different sectors and at different income levels for households.
The analysis is based on the OECD ENV-Linkages model, a global CGE model (Chateau et al., 2013; see Annex I for a brief overview of the model). The model version used in this report represents the world economy in 15 regions, each with 27 economic sectors, as illustrated in Table A1.1 in Annex I. These include seven electric generation sectors, five agriculture-related sectors (including fishing and forestry), five energy-intensive industries, three fossil fuel extraction sectors, transport, refineries and distribution of petroleum products, services, construction and four other manufacturing sectors. It also incorporates the link between economic activity and emissions of greenhouse gases, and the possibilities for mitigation. The baseline scenario assumes that no new climate policies are implemented.3 It projects future emissions on the basis of assumptions on the long-term evolution of output growth, relative prices of fossil fuels, and potential gains in energy efficiency.4 It thus provides a benchmark against which policy scenarios aimed at achieving emission cuts can be assessed.
The first part of the analysis draws upon the global mitigation scenarios presented in the OECD Environmental Outlook to 2050 (OECD, 2012) to investigate the national and sectoral competitiveness and leakage impacts of such harmonised global policies. The second part considers less ambitious policies that do not rely on full global co-operation and economy-wide carbon pricing, taking the Copenhagen/Cancún pledges as a starting point. It identifies the origins of the competitiveness losses and carbon leakage resulting from multiple carbon markets and from partial coverage of emission sources. The third part uses the same policy targets and focuses on comparing BCAs with direct and indirect carbon market linking options, and combinations of these instruments. The analysis focuses on results to 2020, as competitiveness concerns focus mostly on the short- to medium-term.
2. Competitiveness and carbon leakage impacts of global mitigation policies
2.1 Defining competitiveness and carbon leakage and their associated indicators
Competitiveness is a comparative concept and its measurement is challenging (Krugman, 1994). It is important to distinguish the concept of competitiveness at a macroeconomic, sectoral and firm level as, at each level, competitiveness has different implications and meanings (Reinaud, 2008). Given the difficulties in defining and measuring competitiveness, a number of different indicators are considered. While some aim at highlighting the change in competitive position of firms vis-à-vis their competitors (e.g. terms of 3 The baseline includes energy policies as considered in the energy projections of the IEA (2009, 2010a,c) as well as
the assumption that the EU ETS is implemented over the period 2006-2012, with a permit price that would rise gradually from 5 USD/t CO2e to USD 25/t CO2e (2007 USD) by 2012. Continuation of the EU ETS after 2012 is not part of the baseline but of the policy simulations to reflect that an effort is still needed.
4 The socio-economic drivers in the baseline scenario are described in detail in OECD (2012) and especially in Chateau et al. (2011, 2012).
ENV/EPOC/WPCID(2012)4/FINAL
12
trade), others focus on the consequences of these changes for the economy (e.g. GDP and output of specific sectors).
Macroeconomic (economy-wide) competitiveness issues for countries adopting climate change policies may be evident through reductions in economic output, changes in trade flows and, price changes, etc. The key macroeconomic indicators used in this report to analyse competitiveness impacts include welfare, real regional gross domestic product (GDP), terms of trade and investments in physical capital. The welfare measure used in this analysis is the Hicksian equivalent real income variation.5 It is defined as the change in real income necessary to ensure the same level of utility to consumers as in the baseline projection. Alongside welfare and GDP, terms of trade is an important indicator of macroeconomic competitiveness. It captures trade effects from a region’s climate change policies, particularly the effect of energy and emission-intensive commodities, by measuring the price of a region’s exports relative to the price of the region’s imports. Finally, carbon prices provide an indication of the marginal costs of mitigation action.
At the sectoral level, changes in a sector’s output and trade flows (in real terms) are key indicators. In the short-term, market shares of sectors faced with emissions constraints may be reduced relative to their competitors in others countries that are not faced with similar constraints. In the long term, investment and capital may also shift to non-acting countries (Reinaud, 2008; Dröge, 2009). Mitigation policies may however lead to competitive advantages for first-movers, and may boost the competitive position of adaptive firms by stimulating the development and penetration of efficient and clean technologies (the so-called Porter Hypothesis). Furthermore, mitigation policies can offer relative advantages to efficient firms and clean sectors, as they are less burdened by carbon pricing than more polluting competitors (OECD, 2009). As illustrated in the Environmental Outlook to 2050 (OECD, 2012) competitiveness impacts of carbon pricing are stronger on energy-intensive industries and energy producers. Emission-Intensive & Trade-exposed (EIT) sectors (see details in Table A1.1 in Annex I) are likely to encounter the largest trade and competitiveness impacts. , as their high emission intensity leads to relatively high production cost increases and their trade exposure implies limited options for passing on the costs of carbon pricing. The more homogeneous is the produced commodity, the more likely production patterns will change geographically, as substitution for foreign varieties of the commodity is easier. Thus, the sectoral competitiveness indicators used in the present analysis focus on EIT industries.
Individual firms in turn will look primarily to profits as the key indicator of competitiveness related issues from climate change policy (Reinaud, 2008). There are many factors that contribute to the competitiveness of an individual firm. These factors include costs of primary factors, energy, raw materials, availability of labour, proximity to markets, ability to generate product innovations, quality of products and service standards and interest and exchange rates (Reinaud, 2008; OECD, 2010a). The focus of this report is on macroeconomic and sector measures of competitiveness, not on impacts for individual firms.
Carbon leakage can be a consequence of changes in competitiveness, since its first channel is through trade: industries in countries with stringent mitigation policies lose market share in favour of industries and countries that have less stringent or no mitigation policies. A second channel of leakage, which is not directly related to competitiveness, is the fossil-fuel demand channel: consumers and producers that are faced with carbon pricing substitute away from energy and energy-intensive goods, thus reducing the
5 A limitation of all the results presented throughout the paper is that they do not factor in any benefits of the
mitigation action. The economic impacts therefore reflect purely the cost of action and not the net costs or benefits (OECD, 2012). For the 2020 time horizon, impacts of climate change are expected to be very limited.
ENV/EPOC/WPCID(2012)4/FINAL
13
world demand for fossil fuels. This reduces global fossil fuel prices, resulting in an increased demand for fossil fuels and higher emissions by energy users who are not subjected to carbon pricing.
In the literature, carbon leakage is mostly characterised by shifts in GHG emissions from countries where climate mitigation policies are adopted to countries where climate mitigation policies are less stringent or absent (Aldy and Pizer, 2009; Stern, 2006). More broadly, in this study carbon leakage is defined as emission increases from sources (sectors and countries) that do not face climate mitigation policies. This definition includes not only international carbon leakage, but also domestic sectoral carbon leakage, that is changes of emissions from capped towards non-capped sectors in acting countries (see Lanzi and Sue Wing, 2013). This type of leakage only occurs in situations where not all sectors are covered by the carbon pricing policy. Furthermore, the analysis considers complementary emission changes in non-covered gases. When the policy only covers a specific gas, generally CO2, emissions of other gases may increase, thereby affecting the environmental effectiveness of the mitigation policy.
2.2 Overview of the global mitigation policy scenarios
This section examines the competitiveness and carbon leakage impacts following the global mitigation scenarios used in the OECD Environmental Outlook to 2050 (OECD, 2012). A reference scenario in which GHG emissions are stabilised at 450 parts per million (ppm) by the end of the 21st century (450 Core) is used as a benchmark for the assessment of competitiveness impacts of climate change mitigation policies to 2020. The 450 Core scenario describes a fully harmonised carbon market that encompasses all regions, sector and gasses. This scenario assumes least-cost timing of emission reductions and the use of all available mitigation options. To stabilise GHG emissions at 450 ppm the scenario assumes that carbon is priced starting in 2013 through a global emission trading scheme (ETS). Permits are initially (i.e. in 2013) allocated to countries based on their current share in global emissions, but the allocation rule gradually changes to reflect per-capita emissions by 2050. Domestically, emission permits are auctioned by governments between agents. These permits can be traded both domestically and internationally. This policy is the suitable reference point for evaluating other policies, as it describes the least-cost solution to attaining a given policy target.
The alternative scenarios that are considered differ from the 450 Core either in the level of international collaboration to achieve global emission reductions or in the rule used to allocate permits within the global emission trading scheme. These are two issues that can affect the regional distribution of costs and thus competitiveness and carbon leakage impacts.
To assess the effect of a lack of co-ordinated international action on climate change mitigation, the first alternative policy scenario examined is the 450 Delayed Action scenario. In contrast to the 450 Core scenario the 450 Delayed Action scenario assumes that domestic carbon markets are not linked until 2020 and that countries set their own emission reduction targets. The regional emission reduction targets in this scenario reflect the high end of pledges made in the Copenhagen Accord and Cancún Agreements with strict land-use accounting rules and the inability to carry over surplus emission credits from the current Kyoto Protocol commitment period. By 2020, global emission reductions in the 450 Delayed Action scenario are smaller than in the 450 Core scenario.
The report then investigates a set of alternative policy scenarios that have the same global emission pathway as the 450 Core scenario but where the permit allocation rule is changed. The 450 Per Capita scenario assumes that from 2013 per capita emission allowances are equal across countries (thus leading to higher allowances in populous countries and smaller allowances to countries that historically have high emissions). The 450 Global Carbon Tax scenario assumes that a carbon tax is implemented globally. This is equivalent to allocating allowances so that marginal costs are equal across regions. In such a case, there would be no permit trading.
ENV/EPOC/WPCID(2012)4/FINAL
14
All policy scenarios presented above are summarised in Table 1. Some of the main differences between the scenarios are reflected in the emission pathways post-2020. As the scope of the current report is on mitigation action until 2020, the reader is referred to the more detailed discussions on the policy scenarios and their longer term differences in the OECD Environmental Outlook to 2050 (OECD, 2012). The Outlook also presents more details on the differences in permit allocations across regions for the various alternative allocation schemes.
With the exception of the 450 Delayed Action scenario, the scenarios assume a globally-coordinated response to climate change through a fully harmonised carbon market, with consequent low impacts on competitiveness. Carbon leakage is expected in the 450 Delayed Action scenario as some countries do not take action to reduce emissions. While the 450 Core scenario is taken as a reference point, the purpose of the analysis is to study how changing the degree of international collaboration or the permit allocation rule affects competitiveness and carbon leakage relative to this benchmark scenario. Note that these scenarios do not include any explicit mechanisms to redistribute the costs of action amongst countries in order to address any distributional considerations. In reality, policymakers may wish to complement climate policy action with approaches that address such concerns such as EIT assistance and household assistance measures.
Table 1. Overview of the Environmental Outlook to 2050 (OECD, 2012) policy scenarios until 2020
Scenario Description Reference policy
450 Core Global carbon market. Policy starts in 2013; full mitigation flexibility across time, sources and gases. Permit allocation rule starts from current emission levels and gradually changes to equal per-capita emissions by 2050.
Alternative stabilisation scenario
450 Delayed Action As 450 Core, but no mitigation action beyond Cancún and Copenhagen pledges and fragmented regional carbon markets.
Alternative permit allocation rules
450 Per Capita As 450 Core, but per capita emission allowances are equal across countries immediately from 2013.
450 Global Carbon Tax
Assumes a global carbon tax is implemented globally from 2013 such that the same global emission reductions are achieved as in 450 Core; this variant implies that marginal costs are equal across regions and so there is no permit trading.
Source: OECD Environmental Outlook to 2050 (2012).
2.3 Results for the global mitigation policy scenarios
2.3.1 Macroeconomic competitiveness
Table 2 illustrates how the key indicators of macroeconomic competitiveness discussed in sub-section 2.1 are affected according to the different scenarios. Tables A2.1and A2.2 in Annex II illustrate results for each of the 15 regions individually.
Not surprisingly, competitiveness impacts in the 450 Core scenario are limited, as the mitigation policy assumes full harmonisation. There are some cost differences, as marginal costs before permit trading are not equal across countries. Thus, countries have an incentive to trade emission permits and to mobilise the lowest cost mitigation options. Under the permit allocation of the 450 core scenario, countries

ENV/EPOC/WPCID(2012)4/FINAL
15
in the OECD region are the main buyer of permits. The developing countries in the Rest of the world region are the main suppliers of permits because they have a vast potential for cheap mitigation options and very little domestic mitigation obligations.
Table 2. Macroeconomic indicators for the Outlook scenarios, 2020
(Percentage change with respect to baseline)
Region Welfare GDP Investment Terms of Trade GHG Emissions Carbon price*
450 Core scenario
OECD A1 0.0 0.0 0.2 0.2 -9.3 15** Russia & rest of A1 -0.5 -0.1 -0.8 -0.7 -15.1 6 Rest of BRIICS -0.4 0.0 -0.7 0.4 -15.1 6 Rest of the World 0.0 -0.1 -0.1 -0.2 -12.5 6 World -0.1 0.0 -0.2 - -12.6 6
450 Delayed Action scenario
OECD A1 -0.2 -0.1 -0.5 0.3 -16.5 38 Russia & rest of A1 -0.6 -0.1 -1.0 -0.8 -2.1 2 Rest of BRIICS -0.3 0.0 -0.6 0.1 -8.4 4 Rest of the World -0.4 0.0 -0.7 -0.4 -1.4 0 World -0.3 -0.1 -0.7 - -8.9 38
450 Per capita scenario
OECD A1 -0.2 0.0 0.1 0.2 -9.3 15** Russia & rest of A1 -1.1 -0.1 -1.4 -0.7 -15.3 6 Rest of BRIICS 0.0 0.0 -0.4 0.4 -15.1 6 Rest of the World 1.4 0.2 1.6 -0.3 -12.2 6 World -0.1 0.0 0.0 - -12.6 6
450 Global carbon tax scenario
OECD A1 0.0 0.0 0.2 0.1 -9.3 15** Russia & rest of A1 -0.5 -0.1 -0.8 -0.9 -15.1 6 Rest of BRIICS -0.3 0.0 -0.6 0.5 -15.0 6 Rest of the World -0.4 -0.1 -0.5 0.1 -12.6 6 World -0.1 0.0 -0.2 - -12.6 6
Source: ENV-Linkages model output
* Carbon prices are expressed in USD 2007 / ton of CO2e. The regional carbon prices are an average of national carbon prices weighted by emissions reductions.
** The average carbon price in the OECD A1 region is higher because of the existing EU-ETS in the European Union. For regional aggregation see Table A1.1
Welfare losses are negligible in most OECD countries, thanks to the high efficiency in production that
allows them to limit cost increases for polluting firms as well as to the possibility to achieve their targets through purchasing lower-cost emission permits abroad. Larger welfare losses are concentrated in the Russia and rest of A1 region. Russia, as the Middle East countries (part of Rest of the world) is negatively affected by the lower global demand for fossil fuels, through the trade balance in real terms. Large welfare losses are also found in the Rest of BRIICS region, due to the high welfare losses in China. These are directly related to the permit allocation rule: emissions grow more rapidly than population (OECD, 2012), implying that China will need to either undertake costly domestic mitigation efforts or buy permits on the international market.
ENV/EPOC/WPCID(2012)4/FINAL
16
For the period until 2020, the 450 Delayed Action scenario differs from the 450 Core in three important ways: (i) global mitigation levels are lower, (ii) the regional targets differ, and (iii) permits cannot be traded internationally. Due to the fragmentation of the carbon market in the 450 Delayed Action scenario global welfare is lower than in the 450 Core scenario.6 As the level of global emission reduction is lower under the Delayed Action scenario, there will also be lower benefits in terms of avoided climate damages. Thus, it is by definition not possible to compare the cost-effectiveness of these two policies.
Without the possibility to trade permits, many low-cost mitigation options remain unexploited, driving up the economic costs in the 450 Delayed Action scenario relative to the 450 Core scenario. While in the 450 Core scenario the OECD region could reduce the cost of mitigation by buying permits abroad, the absence of permit trading in the 450 Delayed Action scenario implies welfare and GDP levels are lower. For the BRIICS and the rest of the world regions, welfare and GDP costs are lower or around the same as in the 450 Core scenario. This result reflects higher emission allowances and consequentially lower carbon prices for these regions than in the 450 Core scenario. Investment losses in most regions are also greater than in the 450 Core scenario, especially in regions with relatively higher carbon prices such as most OECD countries.
In the 450 Delayed Action scenario, carbon prices vary across regions and countries. The carbon price is zero in the rest of the world region, where there are no pledges, while it is on average 38 in OECD A1 regions where some countries have pledged ambitious mitigation targets.7 The average global price in the 450 Delayed Action (38 USD 6/tCO2e) is much higher than in the other scenarios (USD 6/tCO2e). While this reflects the marginal effect of the mitigation policy on production costs of polluting firms, there are important indirect costs induced by these policies that are captured in the CGE framework. Thus, the total regional costs of the policies differ substantially from what could be inferred from the marginal carbon price. This effect is especially strong for countries with substantial energy exports, such as Russia, the Middle East (part of Rest of the world) and Indonesia (part of rest of BRIICS).
In the 450 Per Capita scenario and the 450 Global Carbon Tax scenario global welfare levels are unchanged compared to the 450 Core scenario. However, there are substantial distributional effects between regions. Heavily populated developing regions, which are included in the rest of BRIICS and the rest of the world region, benefit from the per capita permit allocation scheme as they become large exporters of permits. In contrast, the OECD region faces relatively higher costs as it is forced to import permits to meet the permit allocation, although the impact on the terms of trade is negligible. Many developing countries (in the Rest of the world region) are worse off in the global tax scenario, as they are not able to benefit from exporting permits. The other indicators presented in the Table confirm that the international permit allocation scheme has relatively little effect on competitiveness as long as emitters are able to buy and sell permits on the carbon market.
2.3.2 Sectoral competitiveness
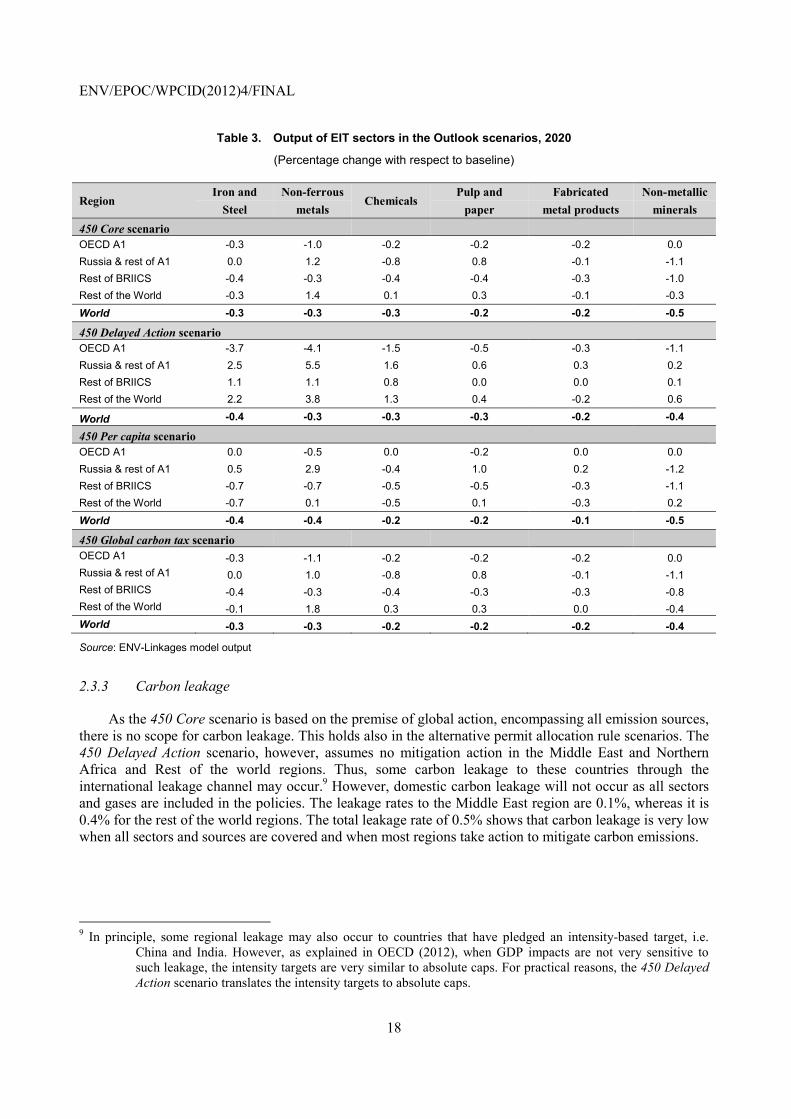
Table 3 shows sectoral competitiveness impacts using one of the key sectoral indicators: change in output of the EIT sectors.8 The analysis shows that there is substitution away from emission-intensive goods such as iron and steel and non-ferrous metals in OECD A1 countries, leading to output reduction of 6 The cost differential will be much larger by 2050, as the scenario assumes that additional mitigation efforts are
needed between 2020 and 2050 to keep concentration levels at the end of the century below 450 ppm; see OECD (2012) for more details.
7 All carbon prices are expressed in USD using 2007 exchange rates. 8 In ENV-Linkages, EIT sectors include chemicals, non-ferrous metals, fabricated metal products, iron and steel, pulp
and paper, and non-metallic mineral products. Hood (2010) provides a review of how governments have proposed to define EIT sectors that are most likely to have negative competitiveness impacts.
ENV/EPOC/WPCID(2012)4/FINAL
17
these sectors. This effect is largest for OECD regions across most EIT sectors (see Annex II for detailed regional results). For these regions, cost increases in EIT production driven by relatively high carbon prices lead to the largest substitution effects. Losses are compounded as a result of changes to their relative competitiveness position and in domestic demand. Furthermore, countries that face the highest carbon prices, have the largest negative effect on EIT sector output. EIT sectors in regions that are not bound by targets such as the rest of the world mostly experience a relative increase in output. These regions benefit from the fall in competitiveness in regions undertaking more substantial climate change mitigation. Regions that do not require much domestic mitigation action, such as Russia and rest of Annex 1 and rest of BRIICS also benefit in terms of their relative competitiveness position.
The sectoral results in the 450 Delayed Action scenario reflect the changes in the relative competitive position of regions. While OECD A1 countries are more negatively affected, all other regions benefit from a smaller global deterioration of their competitive position. In the 450 Per capita and in the 450 Global carbon tax scenario, only the former effect occurs. As global emission levels are not affected and there is scope for emissions trading, global output in EIT sectors is similar to the 450 Core scenario. For OECD Annex I countries, high-cost reduction options are not forced upon domestic sectors as they can participate in the global carbon market and buy permits when these are cheaper than the marginal abatement costs. For some sectors, the profit-maximising approach is to reduce relatively polluting domestic production and sell the freed-up permits on the international market. This is projected to occur for some sectors in the rest of BRIICS countries.
In acting countries, changes in production levels are larger than changes in consumption levels: to some extent, consumers are able to maintain their welfare levels by relying more on relatively cheap imports, while the domestic production sector starts specialising more in producing relatively clean goods and services. This mechanism is essential in keeping the costs of policy action as low as possible, and requires well-functioning international trade markets.
ENV/EPOC/WPCID(2012)4/FINAL
18
Table 3. Output of EIT sectors in the Outlook scenarios, 2020
(Percentage change with respect to baseline)
Region Iron and Non-ferrous
Chemicals Pulp and Fabricated Non-metallic
Steel metals paper metal products minerals 450 Core scenario OECD A1 -0.3 -1.0 -0.2 -0.2 -0.2 0.0 Russia & rest of A1 0.0 1.2 -0.8 0.8 -0.1 -1.1 Rest of BRIICS -0.4 -0.3 -0.4 -0.4 -0.3 -1.0 Rest of the World -0.3 1.4 0.1 0.3 -0.1 -0.3 World -0.3 -0.3 -0.3 -0.2 -0.2 -0.5
450 Delayed Action scenario OECD A1 -3.7 -4.1 -1.5 -0.5 -0.3 -1.1 Russia & rest of A1 2.5 5.5 1.6 0.6 0.3 0.2 Rest of BRIICS 1.1 1.1 0.8 0.0 0.0 0.1 Rest of the World 2.2 3.8 1.3 0.4 -0.2 0.6
World -0.4 -0.3 -0.3 -0.3 -0.2 -0.4
450 Per capita scenario OECD A1 0.0 -0.5 0.0 -0.2 0.0 0.0 Russia & rest of A1 0.5 2.9 -0.4 1.0 0.2 -1.2 Rest of BRIICS -0.7 -0.7 -0.5 -0.5 -0.3 -1.1 Rest of the World -0.7 0.1 -0.5 0.1 -0.3 0.2 World -0.4 -0.4 -0.2 -0.2 -0.1 -0.5
450 Global carbon tax scenario OECD A1 -0.3 -1.1 -0.2 -0.2 -0.2 0.0 Russia & rest of A1 0.0 1.0 -0.8 0.8 -0.1 -1.1 Rest of BRIICS -0.4 -0.3 -0.4 -0.3 -0.3 -0.8 Rest of the World -0.1 1.8 0.3 0.3 0.0 -0.4 World -0.3 -0.3 -0.2 -0.2 -0.2 -0.4
Source: ENV-Linkages model output
2.3.3 Carbon leakage
As the 450 Core scenario is based on the premise of global action, encompassing all emission sources, there is no scope for carbon leakage. This holds also in the alternative permit allocation rule scenarios. The 450 Delayed Action scenario, however, assumes no mitigation action in the Middle East and Northern Africa and Rest of the world regions. Thus, some carbon leakage to these countries through the international leakage channel may occur.9 However, domestic carbon leakage will not occur as all sectors and gases are included in the policies. The leakage rates to the Middle East region are 0.1%, whereas it is 0.4% for the rest of the world regions. The total leakage rate of 0.5% shows that carbon leakage is very low when all sectors and sources are covered and when most regions take action to mitigate carbon emissions.
9 In principle, some regional leakage may also occur to countries that have pledged an intensity-based target, i.e.
China and India. However, as explained in OECD (2012), when GDP impacts are not very sensitive to such leakage, the intensity targets are very similar to absolute caps. For practical reasons, the 450 Delayed Action scenario translates the intensity targets to absolute caps.
ENV/EPOC/WPCID(2012)4/FINAL
19
3. Competitiveness and carbon leakage impacts in stylised multiple carbon market scenarios
3.1 Description of the reference multiple carbon market scenario
The OECD Environmental Outlook to 2050 scenarios analysed in the previous section assume that all sectors and gases are included in the climate change policy. These characteristics implied that competitiveness impacts are small and leakage (in most cases) absent. Results in the previous section also illustrate that negative competitiveness and carbon leakage impacts are stronger in a scenario with multiple carbon markets and with lower international participation such as the 450 Delayed Action Scenario. These results suggest that both competitiveness losses and carbon leakage effects would increase in scenarios where less emission sources and sectors are covered and where fewer countries put a price on carbon. To further investigate the importance of the sectoral coverage of the climate policies, the present section analyses multiple carbon market scenarios emission sources (sectors and GHGs) are excluded from the emission trading schemes.
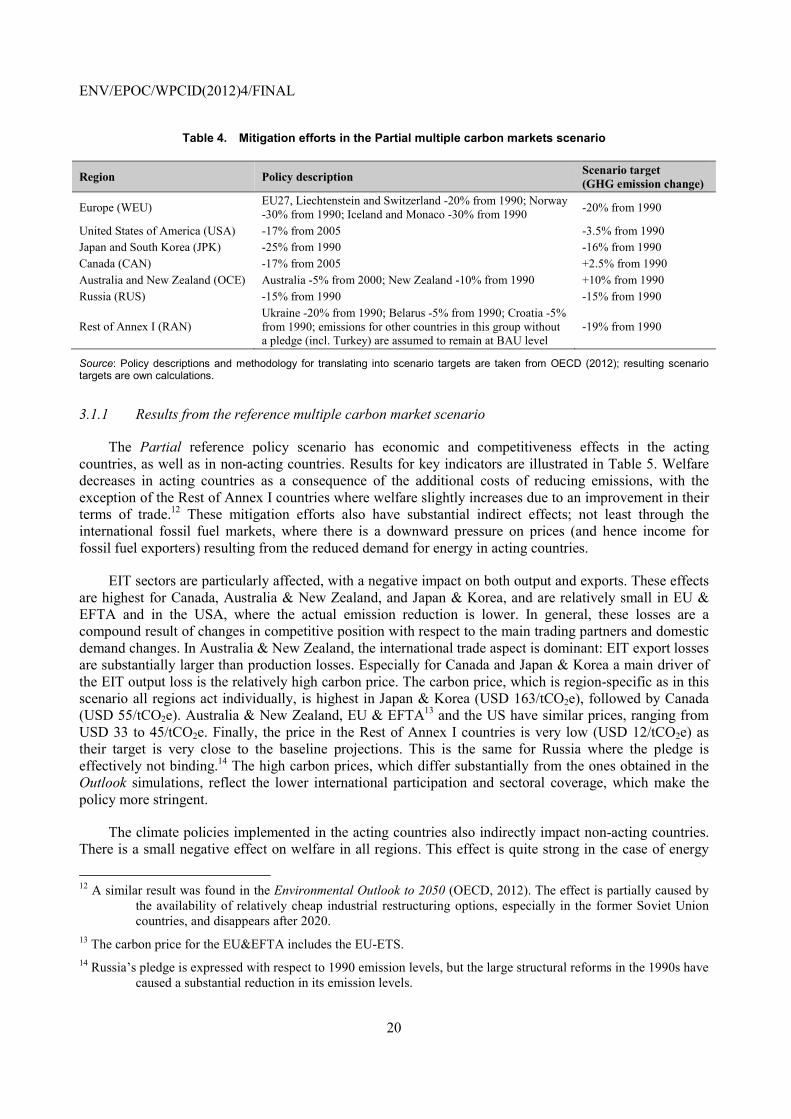
A stylised hypothetical scenario (Partial) is introduced where only a smaller group of countries act, i.e. emission reduction targets are implemented for Annex I countries only, and where not all sectors and emission sources are covered by the climate policy. Emissions from agriculture, from final demands and non-CO2 GHGs are excluded. This reference policy scenario implies multiple carbon markets without international permit trading. The regional emission reduction targets implemented in the Partial policy scenario are based on an assessment of the pledges made by Annex I countries in the Annex to the Copenhagen Accord (FCCC/SB/2011/INF.1/Rev.1; see OECD, 2012 for more details on the interpretation of these targets), with the assumption that (i) the lower end of the pledges will be implemented (as the upper end pledges are normally conditional upon stringent international action and thus not in line with the hypothetical fragmented world represented by this scenario); (ii) land use (LULUCF) credits are excluded; (iii) surplus allowances from the first commitment period of the Kyoto Protocol are also excluded; and (iv) agricultural, final demand emissions and non-CO2 greenhouse gases are not covered by the policy. This hypothetical scenario has similar policy design features to the 450 Delayed Action scenario, though in the Partial scenario only Annex I countries are acting, they adopt the lower pledges and less sectors and emission sources are covered.
The required GHG emission reductions assumed in the Partial policy scenario are summarised in Table 4. They are expressed as reductions from 1990 GHG emission levels. While non-Annex I countries have also provided pledges for mitigation action (see FCCC/AWGLA/2011/INF.1), in this hypothetical scenario only Annex I countries are acting and non-Annex I countries are assumed not to undertake any GHG emission reduction policies. It should be stressed that the reason for this assumption in this stylised scenario is to draw out the potential competitiveness impacts of truly heterogeneous carbon markets, not to accurately reflect current or planned policies by non-Annex I countries.
In the analysis, the targets are defined at the country level for all GHGs and imposed through a domestic Emission Trading Scheme (ETS) on the included CO2 emissions sources only.10 The Partial policy scenario also assumes that the various domestic carbon markets are not linked11 and carbon offsets cannot be used.
10 Implicitly, the assumption is that all required emission reductions have to be achieved within the covered sectors. 11 Except between the EU and EFTA, between Australia & New Zealand and between Japan & Korea, because further
disaggregation of the carbon markets is not possible due to the regional aggregation of the model.
ENV/EPOC/WPCID(2012)4/FINAL
20
Table 4. Mitigation efforts in the Partial multiple carbon markets scenario
Region Policy description Scenario target (GHG emission change)
Europe (WEU) EU27, Liechtenstein and Switzerland -20% from 1990; Norway -30% from 1990; Iceland and Monaco -30% from 1990 -20% from 1990
United States of America (USA) -17% from 2005 -3.5% from 1990 Japan and South Korea (JPK) -25% from 1990 -16% from 1990 Canada (CAN) -17% from 2005 +2.5% from 1990 Australia and New Zealand (OCE) Australia -5% from 2000; New Zealand -10% from 1990 +10% from 1990 Russia (RUS) -15% from 1990 -15% from 1990
Rest of Annex I (RAN) Ukraine -20% from 1990; Belarus -5% from 1990; Croatia -5% from 1990; emissions for other countries in this group without a pledge (incl. Turkey) are assumed to remain at BAU level
-19% from 1990
Source: Policy descriptions and methodology for translating into scenario targets are taken from OECD (2012); resulting scenario targets are own calculations.
3.1.1 Results from the reference multiple carbon market scenario
The Partial reference policy scenario has economic and competitiveness effects in the acting countries, as well as in non-acting countries. Results for key indicators are illustrated in Table 5. Welfare decreases in acting countries as a consequence of the additional costs of reducing emissions, with the exception of the Rest of Annex I countries where welfare slightly increases due to an improvement in their terms of trade.12 These mitigation efforts also have substantial indirect effects; not least through the international fossil fuel markets, where there is a downward pressure on prices (and hence income for fossil fuel exporters) resulting from the reduced demand for energy in acting countries.
EIT sectors are particularly affected, with a negative impact on both output and exports. These effects are highest for Canada, Australia & New Zealand, and Japan & Korea, and are relatively small in EU & EFTA and in the USA, where the actual emission reduction is lower. In general, these losses are a compound result of changes in competitive position with respect to the main trading partners and domestic demand changes. In Australia & New Zealand, the international trade aspect is dominant: EIT export losses are substantially larger than production losses. Especially for Canada and Japan & Korea a main driver of the EIT output loss is the relatively high carbon price. The carbon price, which is region-specific as in this scenario all regions act individually, is highest in Japan & Korea (USD 163/tCO2e), followed by Canada (USD 55/tCO2e). Australia & New Zealand, EU & EFTA13 and the US have similar prices, ranging from USD 33 to 45/tCO2e. Finally, the price in the Rest of Annex I countries is very low (USD 12/tCO2e) as their target is very close to the baseline projections. This is the same for Russia where the pledge is effectively not binding.14 The high carbon prices, which differ substantially from the ones obtained in the Outlook simulations, reflect the lower international participation and sectoral coverage, which make the policy more stringent.
The climate policies implemented in the acting countries also indirectly impact non-acting countries. There is a small negative effect on welfare in all regions. This effect is quite strong in the case of energy
12 A similar result was found in the Environmental Outlook to 2050 (OECD, 2012). The effect is partially caused by
the availability of relatively cheap industrial restructuring options, especially in the former Soviet Union countries, and disappears after 2020.
13 The carbon price for the EU&EFTA includes the EU-ETS. 14 Russia’s pledge is expressed with respect to 1990 emission levels, but the large structural reforms in the 1990s have
caused a substantial reduction in its emission levels.

ENV/EPOC/WPCID(2012)4/FINAL
21
exporting economies, where the reduced energy demand in acting regions reduces income from exporting fossil fuels. The fall in competitiveness of energy intensive products in acting countries is compensated with an increase in production and exports in EIT sectors in Russia, Indonesia and countries in the Middle East & North African region. This positive effect is not enough to compensate the losses from reduced fossil fuel exports in these countries.
Table 5. Impacts of the multiple carbon market policy on key indicators, 2020
Percentage change with respect to baseline
Region Welfare Output (EIT sectors)
Exports (EIT goods)
GHG emissions
Carbon Price
Australia & New Zealand -1.2 -5.3 -15.9 -18.1 33 Canada -1.7 -8.3 -11.5 -22.3 55 EU & EFTA -0.3 -1.3 -1.6 -12.0 45 Japan & Korea -1.3 -9.8 -18.2 -30.2 163 Russia -1.9 7.6 12.5 0.1 0 Other European Annex I countries 0.5 -1.5 -1.5 -6.8 12 USA -0.3 -1.8 -3.2 -15.4 37 Acting countries -0.6 -3.1 -4.0 -13.6 Brazil -0.2 1.7 4.5 0.7 China -0.4 2.0 6.1 0.8 Indonesia -0.8 3.8 6.8 0.4 India 0.0 1.9 4.4 0.9 Mexico -0.3 1.9 5.7 0.5 South Africa 0.2 2.0 5.8 2.1 M. East and N. Africa -2.4 4.9 7.3 0.1 Rest of the World -0.7 3.5 5.5 0.0 Non-acting countries -0.7 2.1 5.3 0.5 World -0.6 -0.7 -0.9 -4.9
Source: ENV-Linkages model output
The policy also causes international carbon leakage in most non acting countries.15 The leakage rate from acting to non-acting countries is of 9% for CO2 and 6% for all GHGs. The CO2 leakage rate is higher as CO2 emissions are linked to more trade exposed activities and are also the only emissions covered in the policy design. This issue will be further explored in Section 3.3.3.
3.2 Overview of the multiple carbon market scenarios
The extent to which competitiveness and leakage impacts hinge on the inclusion of different sectors is examined by varying the emission sources included in the carbon market policies. Table 5 summarises the policy scenarios used in this analysis. All the scenarios described are based on the Partial policy scenario, but include certain sectors or gases. First, the climate policy is expanded to include emissions from the agricultural sectors (Ag), then final demand emissions (emission related to households and government) (FD), and last all GHGs are included in carbon pricing (NonCO2). The remaining four scenarios are combinations of these three main variants. Thus, the most inclusive scenario (All sources) includes all emission sources and sectors in the climate policy. A crucial assumption in all these scenarios is that the same economy-wide emission reduction needs to be achieved, i.e. any low-cost mitigation efforts by sectors or gases that are excluded in the Partial scenario need to be compensated by increased efforts in
15 The (international) leakage rate is conventionally defined as the ratio between the emission increase in non-
regulated countries over the emission reduction in regulated countries.

ENV/EPOC/WPCID(2012)4/FINAL
22
reducing the emission sources that are covered by the scheme. Targets are defined as domestic emissions in CO2-e to keep the environmental effectiveness constant throughout all variants, with the exceptions of indirect effects such as carbon leakage.
Table 6. Overview of the multiple carbon markets scenarios
Scenario Description
Reference policy
Partial Implementation of a carbon policy by each acting country individually including limited domestic sources of emissions (no agriculture, final demand emissions and non-CO2 GHGs)
Variations of reference policy scenario Incl. Agri As the Partial scenario but including emissions from agricultural sectors Incl. Fin. Dem Including final demand emissions (i.e. emissions related to households and governments) Incl. Agri & Fin. Dem. Including agricultural and final demand emissions Incl. Non-CO2 Including emissions from non-CO2 greenhouse gases
Incl. Non-CO2 & Agri Including non-CO2 greenhouse gases and agricultural emissions Incl. Non-CO2 & Fin. Dem. Including non-CO2 greenhouse gases and final demand emissions All sources All domestic sources of emissions are included
Source: ENV-Linkages model
3.3 Results of the multiple carbon market scenarios
3.3.1 Macroeconomic competitiveness
This section investigates the extent to which changes in the design of the multiple carbon market scenarios affect macroeconomic competitiveness. The starting point for this analysis is the Partial reference policy scenario where only limited sources of emissions are covered as described in section 3.1.
Figure 1 illustrates the impacts on welfare for each variant scenario of the analysis; results are expressed as percentage change from the baseline. The environmental pledges outlined in Table 4 are the same in all scenarios; hence, welfare impacts across scenarios are comparable. Climate policies implemented in acting countries also indirectly affect non-acting countries. Notably, in all scenarios the effect on welfare in non-acting countries is negative and larger than in acting countries. As acting countries reduce their demand for carbon-intensive energy-related goods, international fossil fuel prices decrease. While this causes some rebound effect by increasing energy demand and thus emissions in non-acting countries (this is referred to as the competitiveness channel of carbon leakage), total revenues from exporting energy in non-acting countries decreases substantially, thereby inducing lower income levels in these countries.
Including additional sectors (Agri and Fin. Dem.) only slightly improves welfare, as the proportion of emissions that is excluded from the scheme remains large. Although the effects are small, including agriculture has a positive impact on welfare of non-acting countries, whereas including final demand negatively affects these countries. In the former case, the dominant effect is that some agricultural production will shift to non-acting countries. in the latter case, the dominant effect is related to the fact that fossil fuel demand in acting countries is lower when emissions from final demand (mostly from energy use) are priced, leading to lower revenues for non-acting exporting countries.
The scenarios including all gases (i.e. All sources, Non-CO2 & Agri., Non-CO2 & Fin. Dem.) indicate that including emissions from all GHGs largely reduces welfare losses. Including all GHGs reduces
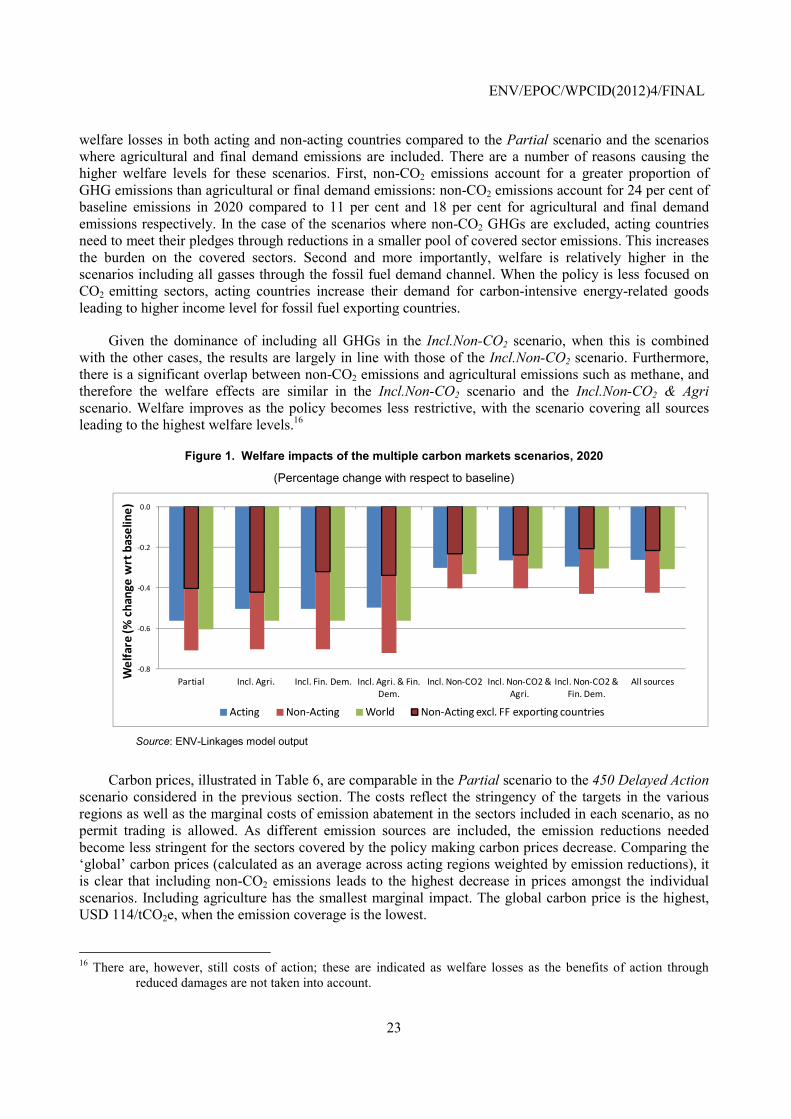
ENV/EPOC/WPCID(2012)4/FINAL
23
welfare losses in both acting and non-acting countries compared to the Partial scenario and the scenarios where agricultural and final demand emissions are included. There are a number of reasons causing the higher welfare levels for these scenarios. First, non-CO2 emissions account for a greater proportion of GHG emissions than agricultural or final demand emissions: non-CO2 emissions account for 24 per cent of baseline emissions in 2020 compared to 11 per cent and 18 per cent for agricultural and final demand emissions respectively. In the case of the scenarios where non-CO2 GHGs are excluded, acting countries need to meet their pledges through reductions in a smaller pool of covered sector emissions. This increases the burden on the covered sectors. Second and more importantly, welfare is relatively higher in the scenarios including all gasses through the fossil fuel demand channel. When the policy is less focused on CO2 emitting sectors, acting countries increase their demand for carbon-intensive energy-related goods leading to higher income level for fossil fuel exporting countries.
Given the dominance of including all GHGs in the Incl.Non-CO2 scenario, when this is combined with the other cases, the results are largely in line with those of the Incl.Non-CO2 scenario. Furthermore, there is a significant overlap between non-CO2 emissions and agricultural emissions such as methane, and therefore the welfare effects are similar in the Incl.Non-CO2 scenario and the Incl.Non-CO2 & Agri scenario. Welfare improves as the policy becomes less restrictive, with the scenario covering all sources leading to the highest welfare levels.16
Figure 1. Welfare impacts of the multiple carbon markets scenarios, 2020
(Percentage change with respect to baseline)
Source: ENV-Linkages model output
Carbon prices, illustrated in Table 6, are comparable in the Partial scenario to the 450 Delayed Action scenario considered in the previous section. The costs reflect the stringency of the targets in the various regions as well as the marginal costs of emission abatement in the sectors included in each scenario, as no permit trading is allowed. As different emission sources are included, the emission reductions needed become less stringent for the sectors covered by the policy making carbon prices decrease. Comparing the ‘global’ carbon prices (calculated as an average across acting regions weighted by emission reductions), it is clear that including non-CO2 emissions leads to the highest decrease in prices amongst the individual scenarios. Including agriculture has the smallest marginal impact. The global carbon price is the highest, USD 114/tCO2e, when the emission coverage is the lowest.
16 There are, however, still costs of action; these are indicated as welfare losses as the benefits of action through
reduced damages are not taken into account.
-0.8
-0.6
-0.4
-0.2
0.0
Partial Incl. Agri. Incl. Fin. Dem. Incl. Agri. & Fin. Dem.
Incl. Non-CO2 Incl. Non-CO2 & Agri.
Incl. Non-CO2 & Fin. Dem.
All sourcesWel
fare
(% c
hang
e w
rt b
asel
ine)
Acting Non-Acting World Non-Acting excl. FF exporting countries
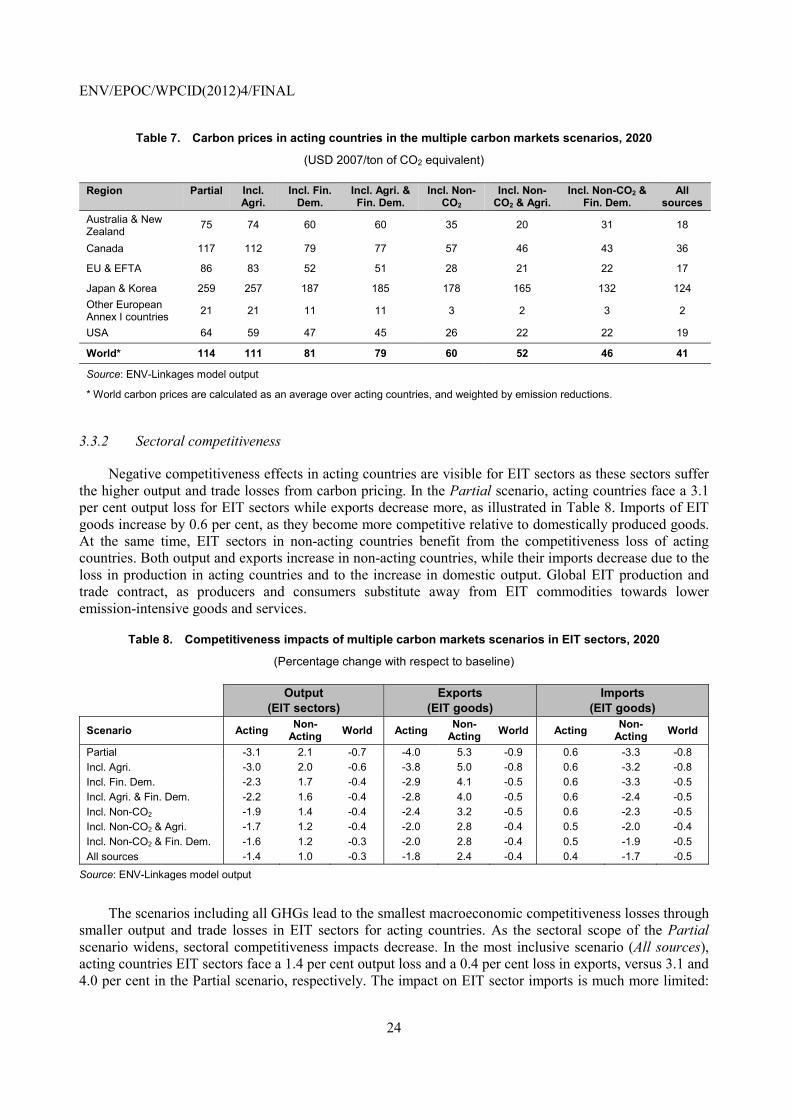
ENV/EPOC/WPCID(2012)4/FINAL
24
Table 7. Carbon prices in acting countries in the multiple carbon markets scenarios, 2020
(USD 2007/ton of CO2 equivalent)
Region Partial Incl. Agri.
Incl. Fin. Dem.
Incl. Agri. & Fin. Dem.
Incl. Non-CO2
Incl. Non-CO2 & Agri.
Incl. Non-CO2 & Fin. Dem.
All sources
Australia & New Zealand 75 74 60 60 35 20 31 18
Canada 117 112 79 77 57 46 43 36
EU & EFTA 86 83 52 51 28 21 22 17
Japan & Korea 259 257 187 185 178 165 132 124 Other European Annex I countries 21 21 11 11 3 2 3 2
USA 64 59 47 45 26 22 22 19
World* 114 111 81 79 60 52 46 41
Source: ENV-Linkages model output
* World carbon prices are calculated as an average over acting countries, and weighted by emission reductions.
3.3.2 Sectoral competitiveness
Negative competitiveness effects in acting countries are visible for EIT sectors as these sectors suffer the higher output and trade losses from carbon pricing. In the Partial scenario, acting countries face a 3.1 per cent output loss for EIT sectors while exports decrease more, as illustrated in Table 8. Imports of EIT goods increase by 0.6 per cent, as they become more competitive relative to domestically produced goods. At the same time, EIT sectors in non-acting countries benefit from the competitiveness loss of acting countries. Both output and exports increase in non-acting countries, while their imports decrease due to the loss in production in acting countries and to the increase in domestic output. Global EIT production and trade contract, as producers and consumers substitute away from EIT commodities towards lower emission-intensive goods and services.
Table 8. Competitiveness impacts of multiple carbon markets scenarios in EIT sectors, 2020
(Percentage change with respect to baseline)
Output
(EIT sectors) Exports
(EIT goods) Imports
(EIT goods)
Scenario Acting Non-Acting World Acting Non-
Acting World Acting Non-Acting World
Partial -3.1 2.1 -0.7 -4.0 5.3 -0.9 0.6 -3.3 -0.8 Incl. Agri. -3.0 2.0 -0.6 -3.8 5.0 -0.8 0.6 -3.2 -0.8 Incl. Fin. Dem. -2.3 1.7 -0.4 -2.9 4.1 -0.5 0.6 -3.3 -0.5 Incl. Agri. & Fin. Dem. -2.2 1.6 -0.4 -2.8 4.0 -0.5 0.6 -2.4 -0.5 Incl. Non-CO2 -1.9 1.4 -0.4 -2.4 3.2 -0.5 0.6 -2.3 -0.5 Incl. Non-CO2 & Agri. -1.7 1.2 -0.4 -2.0 2.8 -0.4 0.5 -2.0 -0.4 Incl. Non-CO2 & Fin. Dem. -1.6 1.2 -0.3 -2.0 2.8 -0.4 0.5 -1.9 -0.5 All sources -1.4 1.0 -0.3 -1.8 2.4 -0.4 0.4 -1.7 -0.5
Source: ENV-Linkages model output
The scenarios including all GHGs lead to the smallest macroeconomic competitiveness losses through smaller output and trade losses in EIT sectors for acting countries. As the sectoral scope of the Partial scenario widens, sectoral competitiveness impacts decrease. In the most inclusive scenario (All sources), acting countries EIT sectors face a 1.4 per cent output loss and a 0.4 per cent loss in exports, versus 3.1 and 4.0 per cent in the Partial scenario, respectively. The impact on EIT sector imports is much more limited:
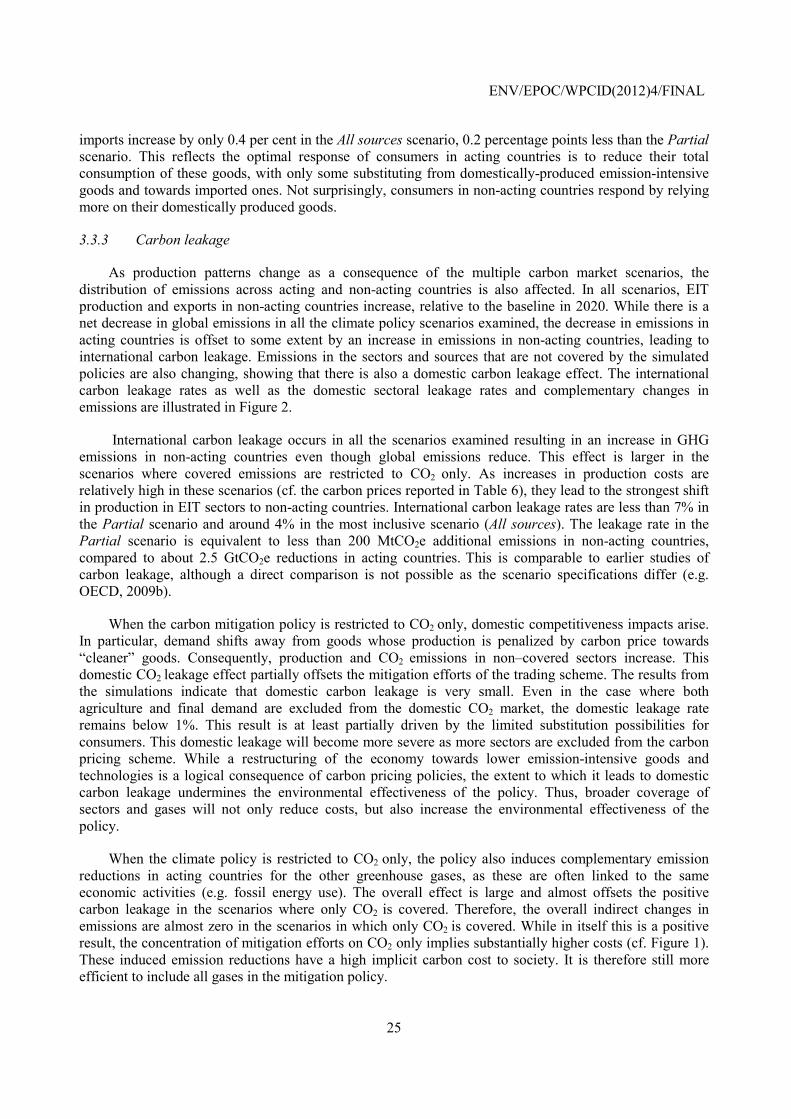
ENV/EPOC/WPCID(2012)4/FINAL
25
imports increase by only 0.4 per cent in the All sources scenario, 0.2 percentage points less than the Partial scenario. This reflects the optimal response of consumers in acting countries is to reduce their total consumption of these goods, with only some substituting from domestically-produced emission-intensive goods and towards imported ones. Not surprisingly, consumers in non-acting countries respond by relying more on their domestically produced goods.
3.3.3 Carbon leakage
As production patterns change as a consequence of the multiple carbon market scenarios, the distribution of emissions across acting and non-acting countries is also affected. In all scenarios, EIT production and exports in non-acting countries increase, relative to the baseline in 2020. While there is a net decrease in global emissions in all the climate policy scenarios examined, the decrease in emissions in acting countries is offset to some extent by an increase in emissions in non-acting countries, leading to international carbon leakage. Emissions in the sectors and sources that are not covered by the simulated policies are also changing, showing that there is also a domestic carbon leakage effect. The international carbon leakage rates as well as the domestic sectoral leakage rates and complementary changes in emissions are illustrated in Figure 2.
International carbon leakage occurs in all the scenarios examined resulting in an increase in GHG emissions in non-acting countries even though global emissions reduce. This effect is larger in the scenarios where covered emissions are restricted to CO2 only. As increases in production costs are relatively high in these scenarios (cf. the carbon prices reported in Table 6), they lead to the strongest shift in production in EIT sectors to non-acting countries. International carbon leakage rates are less than 7% in the Partial scenario and around 4% in the most inclusive scenario (All sources). The leakage rate in the Partial scenario is equivalent to less than 200 MtCO2e additional emissions in non-acting countries, compared to about 2.5 GtCO2e reductions in acting countries. This is comparable to earlier studies of carbon leakage, although a direct comparison is not possible as the scenario specifications differ (e.g. OECD, 2009b).
When the carbon mitigation policy is restricted to CO2 only, domestic competitiveness impacts arise. In particular, demand shifts away from goods whose production is penalized by carbon price towards “cleaner” goods. Consequently, production and CO2 emissions in non–covered sectors increase. This domestic CO2 leakage effect partially offsets the mitigation efforts of the trading scheme. The results from the simulations indicate that domestic carbon leakage is very small. Even in the case where both agriculture and final demand are excluded from the domestic CO2 market, the domestic leakage rate remains below 1%. This result is at least partially driven by the limited substitution possibilities for consumers. This domestic leakage will become more severe as more sectors are excluded from the carbon pricing scheme. While a restructuring of the economy towards lower emission-intensive goods and technologies is a logical consequence of carbon pricing policies, the extent to which it leads to domestic carbon leakage undermines the environmental effectiveness of the policy. Thus, broader coverage of sectors and gases will not only reduce costs, but also increase the environmental effectiveness of the policy.
When the climate policy is restricted to CO2 only, the policy also induces complementary emission reductions in acting countries for the other greenhouse gases, as these are often linked to the same economic activities (e.g. fossil energy use). The overall effect is large and almost offsets the positive carbon leakage in the scenarios where only CO2 is covered. Therefore, the overall indirect changes in emissions are almost zero in the scenarios in which only CO2 is covered. While in itself this is a positive result, the concentration of mitigation efforts on CO2 only implies substantially higher costs (cf. Figure 1). These induced emission reductions have a high implicit carbon cost to society. It is therefore still more efficient to include all gases in the mitigation policy.
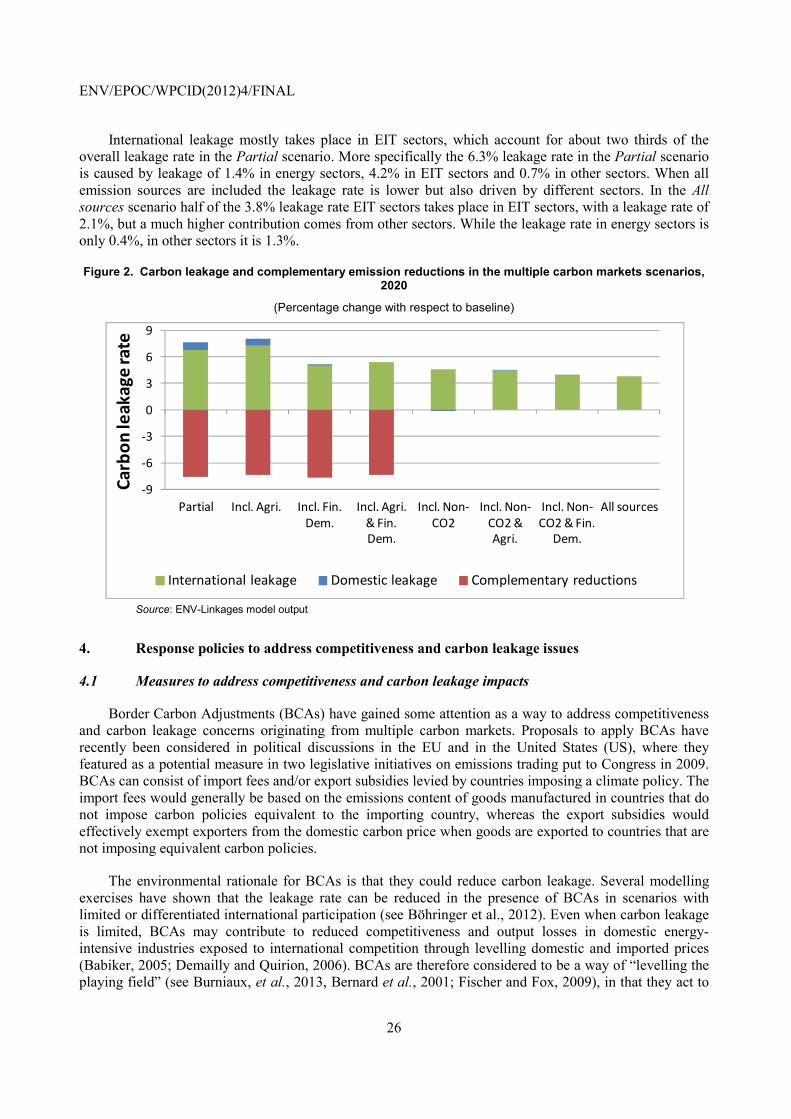
ENV/EPOC/WPCID(2012)4/FINAL
26
International leakage mostly takes place in EIT sectors, which account for about two thirds of the overall leakage rate in the Partial scenario. More specifically the 6.3% leakage rate in the Partial scenario is caused by leakage of 1.4% in energy sectors, 4.2% in EIT sectors and 0.7% in other sectors. When all emission sources are included the leakage rate is lower but also driven by different sectors. In the All sources scenario half of the 3.8% leakage rate EIT sectors takes place in EIT sectors, with a leakage rate of 2.1%, but a much higher contribution comes from other sectors. While the leakage rate in energy sectors is only 0.4%, in other sectors it is 1.3%.
Figure 2. Carbon leakage and complementary emission reductions in the multiple carbon markets scenarios, 2020
(Percentage change with respect to baseline)
Source: ENV-Linkages model output
4. Response policies to address competitiveness and carbon leakage issues
4.1 Measures to address competitiveness and carbon leakage impacts
Border Carbon Adjustments (BCAs) have gained some attention as a way to address competitiveness and carbon leakage concerns originating from multiple carbon markets. Proposals to apply BCAs have recently been considered in political discussions in the EU and in the United States (US), where they featured as a potential measure in two legislative initiatives on emissions trading put to Congress in 2009. BCAs can consist of import fees and/or export subsidies levied by countries imposing a climate policy. The import fees would generally be based on the emissions content of goods manufactured in countries that do not impose carbon policies equivalent to the importing country, whereas the export subsidies would effectively exempt exporters from the domestic carbon price when goods are exported to countries that are not imposing equivalent carbon policies.
The environmental rationale for BCAs is that they could reduce carbon leakage. Several modelling exercises have shown that the leakage rate can be reduced in the presence of BCAs in scenarios with limited or differentiated international participation (see Böhringer et al., 2012). Even when carbon leakage is limited, BCAs may contribute to reduced competitiveness and output losses in domestic energy-intensive industries exposed to international competition through levelling domestic and imported prices (Babiker, 2005; Demailly and Quirion, 2006). BCAs are therefore considered to be a way of “levelling the playing field” (see Burniaux, et al., 2013, Bernard et al., 2001; Fischer and Fox, 2009), in that they act to
-9
-6
-3
0
3
6
9
Partial Incl. Agri. Incl. Fin. Dem.
Incl. Agri. & Fin. Dem.
Incl. Non-CO2
Incl. Non-CO2 & Agri.
Incl. Non-CO2 & Fin.
Dem.
All sources
Carb
on le
akag
e ra
te
International leakage Domestic leakage Complementary reductions
ENV/EPOC/WPCID(2012)4/FINAL
27
reduce disparities in producer conditions created by regional differences in climate policies. EIT sectors have been the main focus of BCA proposals.
The economic effects of BCAs are a priori ambiguous. On the one hand, like any tariff, BCAs increase consumer prices, resulting in a welfare loss. On the other hand, BCAs, helps to restore competiveness losses caused by the carbon pricing policy imposed both domestically and abroad. Previous analysis in CGE frameworks show that BCAs are not generally sufficient to counterbalance the output losses in EIT sectors in acting countries and would cause welfare losses in non-acting countries (Burniaux et al., 2013; Mattoo et al., 2009, Winchester et al., 2011).
The political economy implications of welfare losses in non-acting countries are not well understood. BCAs could lead to WTO retaliations, as exemplified by China’s reaction to the inclusion of aviation in the EU ETS (Bartels, 2012). Further, while BCAs could provide incentives for other countries to implement climate policies to avoid extra costs, some argue that they penalise developing countries and contribute to create an unfair and uncooperative environment (Babiker and Rutherford, 2005; Eckersley, 2010). There are also serious difficulties in the design of BCAs (Cosbey et al., 2012). It is difficult to establish what sectors should be the focus of the BCAs, account and attribute emissions and limit implementation costs.
Competiveness losses and carbon leakage can also be addressed through other response policies that harmonise carbon markets. Specifically, the analysis in this section considers alternative market-design mechanisms oriented towards levelling carbon prices across countries through directly and indirectly linking carbon markets. The direct linking instrument considered here is the implementation of unlimited permit trading between all acting countries. From a theoretical perspective, in a first-best world where the carbon price is the only source of distortion, directly linking ETSs directly lowers the overall cost of meeting their joint targets by allowing higher-cost emission reductions in one ETS to be replaced by lower-cost emission reductions in the other (OECD, 2009). Direct linking can reduce carbon leakage as well as competitiveness losses (Jaffe and Stavins, 2007). Section 2 already illustrated the potential of direct linking in lowering the costs of climate action.
Crediting mechanisms indirectly link the ETSs of countries covered by binding emission caps because the credits are accepted in several different ETSs. Indeed, they result in partial levelling of carbon prices across the different ETSs when the same offset credits are allowed in different ETSs. In principle, well-functioning crediting mechanisms could improve the cost-effectiveness of GHG mitigation policies in developed countries and reduce carbon leakage and competitiveness concerns by partially harmonising the carbon price (OECD, 2009). The analysis in this section considers ‘indirect’ linking in the form of the use of offsets. Offsets are considered to be an indirect linking instrument as they enable emission-reduction commitments in acting countries to be met by undertaking emission reductions in other geographical areas and lead to a (partial) harmonisation of carbon prices across the acting countries (Dellink et al., 2010).
Analogous to the previous sections, the analysis in this section focuses on comparing BCAs and direct and indirect linking with respect to their effectiveness in (1) preserving macroeconomic competitiveness by looking at welfare levels in both acting and non-acting countries and at carbon prices; (2) correcting the negative impacts of asymmetric carbon pricing on sectoral competitiveness, specifically EIT sectors’ output and international trade flows, and (3) reducing carbon leakage. The analysis also considers the effectiveness of these instruments when combined together.
4.2 Overview of the response policy scenarios
The assessment of the economic effects of BCAs and linking on the same benchmark climate policy scenario as the one used in Section 3: the Partial scenario. This benchmark scenario is compared the different policy responses. These are implemented in the model in a stylised way, since the model cannot
ENV/EPOC/WPCID(2012)4/FINAL
28
consider all frictions that are present in the markets or the practical aspects of the instruments as they have been proposed by different countries.
The first response policy considered is the use of border carbon adjustments (BCAs scenario). For this exercise, these have been designed as a combination of carbon-based import tariffs and carbon-based export subsidies. The second response policy considered is a direct linking (Link scenario) among the domestic ETSs of acting countries. In this case, regulated entities can sell/buy emission allowances to/from another ETS to meet their domestic compliance obligations. The allocation of allowances across participating countries corresponds to the domestic targets defined in the Partial scenario. Finally, the third response policy is ‘indirect’ linking in the form of the use of offsets (Offsets scenario). As in the case of the Clean Development Mechanism (CDM), offsets allow emission reduction projects in non-Annex I countries.17 Credits are purchased by (regulated entities in) acting countries to meet part of their emission reduction commitments. By assumption, only sectors in non-acting countries that are covered by ETS in acting countries are considered as eligible sources for offsets. As in OECD (2012) a cap on offsets allowed in acting countries is assumed to be equal to 20% of the emissions reduction in the Partial scenario.18
Box 1. Implementing the policy instruments in a CGE framework
BCAs are represented in the model through the combination of two distinct policy instruments: as carbon-based import tariffs and carbon-based export subsidies. The import tariffs are calculated on direct and indirect (electricity-only) CO2 content of goods produced by non-acting countries. The carbon content of goods is updated each simulation year in order to take into account assumed structural changes in the production processes in non-acting countries. These BCA measures aim at levelling carbon prices across acting and non-acting countries, by correcting (i) the import prices of goods that are not subject to domestic carbon pricing, and (ii) the export prices of domestically produced goods, to restore their competiveness both on domestic and foreign markets. For symmetry, BCA measures are only levied on goods where domestic carbon pricing applies.
Direct linking is implemented by allocating the same permits to each region as in the unlinked case, but then allowing for international permit trading. Emission permits sold to other regions count towards meeting the domestic emission target and thus restrict domestic emissions further. The equilibrium price of permits is used to value the international transactions. The financial flows associated with permit trading are captured in the trade balances of the countries. Changes in permit trade influence exchange rates and terms of trade, to ensure the imposed net current account balance situation is undisturbed.
Offsets are not straightforward to capture adequately in the model. In ENV-Linkages, the ad-hoc assumption is made that donor countries (i.e. countries that import the offset credits) adopt a fixed upper bound on the use of offsets. The reason for this is that if offsets were modelled entirely endogenously, in full competition with domestic permits, effectively a global carbon market will full harmonisation of carbon prices would emerge. Thus, a limit is placed on offset demand, and host countries (i.e. countries that supply offset credits) compete with each other (on an international offset market) to supply these credits. This set-up ensures that the least-cost offset options are implemented. Dellink et al. (2010) investigate the offset mechanism in more detail and compare different offset levels and methodologies for setting baselines for offset credits.
Source: ENV-Linkages model
17 Unlike the CDM, the offsets simulated here are sector-based (rather than project-based), i.e. all emission reductions
in offset host countries in sectors that are included in the domestic ETS of donor countries are eligible. 18 The choice of a project ‘baseline’ against which certified emission rights (CERs) are granted have an impact on the
volume of credits generated and matters for carbon leakage. As in OECD (2009) the reference emission level is set at the emission level in host countries in the corresponding scenario without offsets (i.e. the Partial scenario). Technically credits are modelled as an output-based rebate together with a carbon tax (with a common price for all host countries). The output subsidy is granted by the same sector in a donor country.

ENV/EPOC/WPCID(2012)4/FINAL
29
The analysis compares each policy response applied individually as well as a combination of them: BCAs with direct linking (Link_BCAs) and indirect linking (Offsets_BCAs); direct and indirect linking (Link_Offsets) and all options together (All). Studying these combinations will show whether there is still a case for BCAs in presence of linking. Table 8 summarises the scenarios considered in the analysis. As in the previous sections, all policy scenarios consider policies implemented starting in 2013 and until 2020.
Table 9. Overview of the response policy scenarios
Scenario Description
Reference policy
Partial Implementation of a carbon policy by each acting (Annex I) country individually, where agriculture, final demand and non-CO2 greenhouse gases are excluded (scenario Excl. Ag_End_CO2 in Section 3)
Offsets Acting countries are allowed to implement emissions reduction projects in non-Annex I countries with no emissions constraints
Link The acting regions are linked though an international carbon market Offsets & Link Linking and offsets
BCAs Carbon-based tariffs are levied on non-acting countries and carbon-based export subsidy to acting countries
Offsets & BCAs Offsets and BCAs Link & BCAs Linking and BCAs All Linking, offsets and BCAs
Source: ENV-Linkages model
4.3 Results of the response policy scenarios
4.3.1 Macroeconomic competitiveness
Figure 3 illustrates the impacts of the response policies on welfare as percentage change with respect to the baseline scenario.19 Compared to the partial scenario, when acting countries apply BCAs, their welfare losses are slightly lower. However, welfare decreases substantially for non-acting countries as they are now confronted with carbon pricing for their exporting sectors. As a consequence, welfare at the world level is slightly worsened by the implementation of BCAs.
Both acting and non-acting countries benefit from the implementation of linking. Direct linking is slightly superior to indirect linking in improving welfare impacts, especially in acting countries, although this result depends on the level of offsets allowed in the Offsets scenario. The combination of both types of linking reduces welfare losses even further and leads to the lowest welfare losses at global level for all scenarios, since both acting and non-acting countries benefit from linking.
Implementing linking and/or offsets together with BCAs reduces welfare losses in acting countries more than implementing BCAs only. Thus, for acting countries, even with linking and/or offsets, implementing BCA measures could further address macroeconomic competitiveness losses, albeit at the expense of the competitive position of non-acting countries. While direct linking can still substantially reduce global welfare losses when combined with BCAs, the global benefits from offsets when combined with BCAs are smaller. This is due to the substantial welfare losses in non-acting countries caused by the reduction of their exports following the imposition of BCAs. Thus, in terms of macroeconomic competitiveness of acting countries, both direct linking and BCAs are effective, especially when used in
19 Note again that the benefits of these policies in terms of reduced climate damages are not included in this analysis.
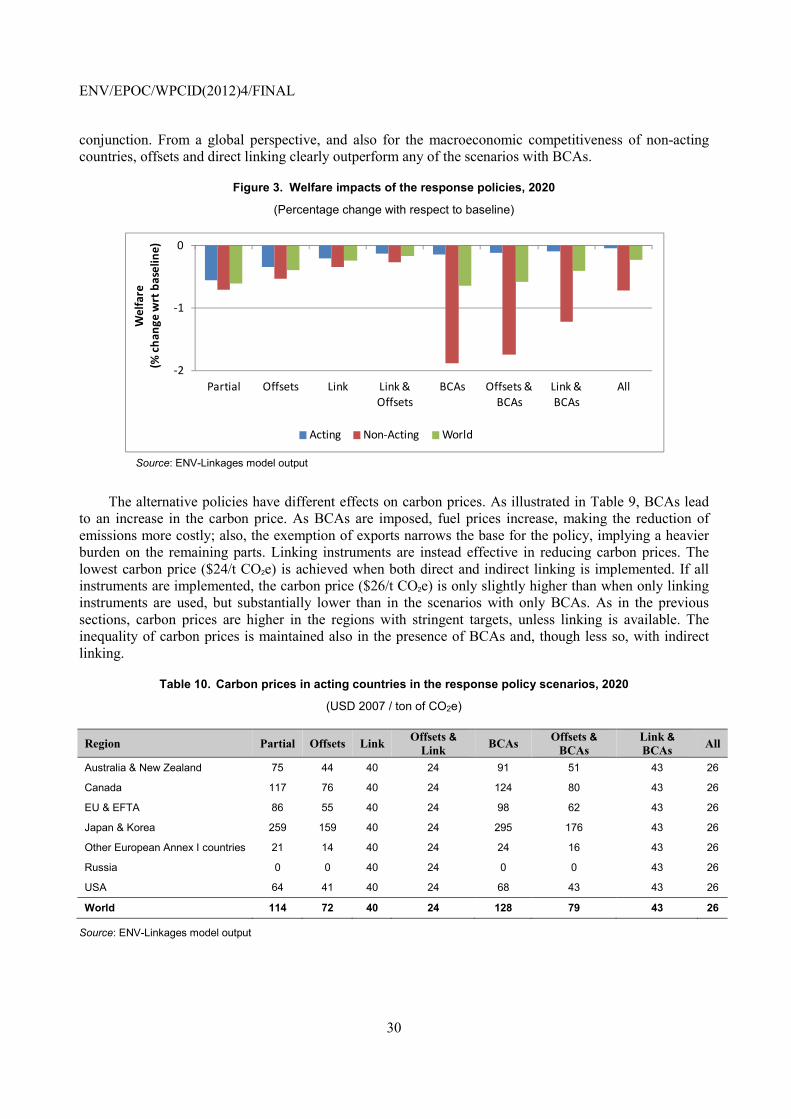
ENV/EPOC/WPCID(2012)4/FINAL
30
conjunction. From a global perspective, and also for the macroeconomic competitiveness of non-acting countries, offsets and direct linking clearly outperform any of the scenarios with BCAs.
Figure 3. Welfare impacts of the response policies, 2020
(Percentage change with respect to baseline)
Source: ENV-Linkages model output
The alternative policies have different effects on carbon prices. As illustrated in Table 9, BCAs lead to an increase in the carbon price. As BCAs are imposed, fuel prices increase, making the reduction of emissions more costly; also, the exemption of exports narrows the base for the policy, implying a heavier burden on the remaining parts. Linking instruments are instead effective in reducing carbon prices. The lowest carbon price ($24/t CO2e) is achieved when both direct and indirect linking is implemented. If all instruments are implemented, the carbon price ($26/t CO2e) is only slightly higher than when only linking instruments are used, but substantially lower than in the scenarios with only BCAs. As in the previous sections, carbon prices are higher in the regions with stringent targets, unless linking is available. The inequality of carbon prices is maintained also in the presence of BCAs and, though less so, with indirect linking.
Table 10. Carbon prices in acting countries in the response policy scenarios, 2020
(USD 2007 / ton of CO2e)
Region Partial Offsets Link Offsets & Link BCAs Offsets &
BCAs Link & BCAs All
Australia & New Zealand 75 44 40 24 91 51 43 26
Canada 117 76 40 24 124 80 43 26
EU & EFTA 86 55 40 24 98 62 43 26
Japan & Korea 259 159 40 24 295 176 43 26
Other European Annex I countries 21 14 40 24 24 16 43 26
Russia 0 0 40 24 0 0 43 26
USA 64 41 40 24 68 43 43 26
World 114 72 40 24 128 79 43 26
Source: ENV-Linkages model output
-2
-1
0
Partial Offsets Link Link & Offsets
BCAs Offsets & BCAs
Link & BCAs
All
Wel
fare
(% ch
ange
wrt
bas
elin
e)
Acting Non-Acting World
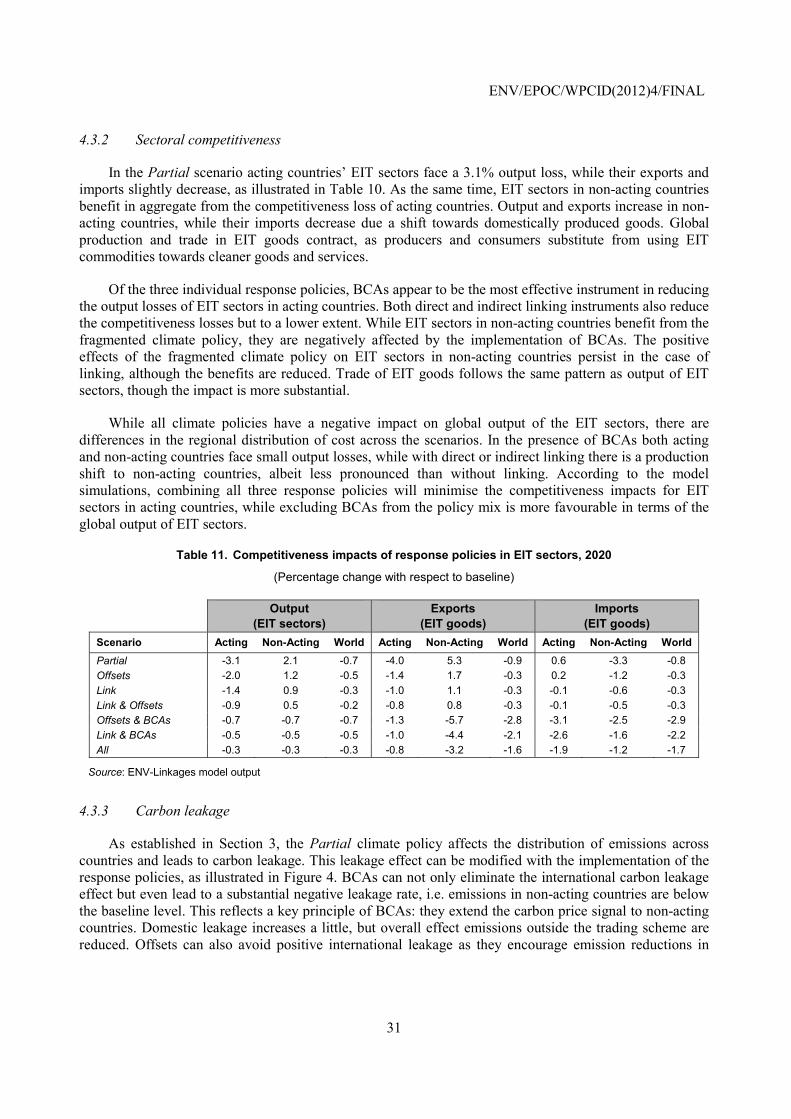
ENV/EPOC/WPCID(2012)4/FINAL
31
4.3.2 Sectoral competitiveness
In the Partial scenario acting countries’ EIT sectors face a 3.1% output loss, while their exports and imports slightly decrease, as illustrated in Table 10. As the same time, EIT sectors in non-acting countries benefit in aggregate from the competitiveness loss of acting countries. Output and exports increase in non-acting countries, while their imports decrease due a shift towards domestically produced goods. Global production and trade in EIT goods contract, as producers and consumers substitute from using EIT commodities towards cleaner goods and services.
Of the three individual response policies, BCAs appear to be the most effective instrument in reducing the output losses of EIT sectors in acting countries. Both direct and indirect linking instruments also reduce the competitiveness losses but to a lower extent. While EIT sectors in non-acting countries benefit from the fragmented climate policy, they are negatively affected by the implementation of BCAs. The positive effects of the fragmented climate policy on EIT sectors in non-acting countries persist in the case of linking, although the benefits are reduced. Trade of EIT goods follows the same pattern as output of EIT sectors, though the impact is more substantial.
While all climate policies have a negative impact on global output of the EIT sectors, there are differences in the regional distribution of cost across the scenarios. In the presence of BCAs both acting and non-acting countries face small output losses, while with direct or indirect linking there is a production shift to non-acting countries, albeit less pronounced than without linking. According to the model simulations, combining all three response policies will minimise the competitiveness impacts for EIT sectors in acting countries, while excluding BCAs from the policy mix is more favourable in terms of the global output of EIT sectors.
Table 11. Competitiveness impacts of response policies in EIT sectors, 2020
(Percentage change with respect to baseline)
Output
(EIT sectors) Exports
(EIT goods) Imports
(EIT goods) Scenario Acting Non-Acting World Acting Non-Acting World Acting Non-Acting World Partial -3.1 2.1 -0.7 -4.0 5.3 -0.9 0.6 -3.3 -0.8 Offsets -2.0 1.2 -0.5 -1.4 1.7 -0.3 0.2 -1.2 -0.3 Link -1.4 0.9 -0.3 -1.0 1.1 -0.3 -0.1 -0.6 -0.3 Link & Offsets -0.9 0.5 -0.2 -0.8 0.8 -0.3 -0.1 -0.5 -0.3 Offsets & BCAs -0.7 -0.7 -0.7 -1.3 -5.7 -2.8 -3.1 -2.5 -2.9 Link & BCAs -0.5 -0.5 -0.5 -1.0 -4.4 -2.1 -2.6 -1.6 -2.2 All -0.3 -0.3 -0.3 -0.8 -3.2 -1.6 -1.9 -1.2 -1.7
Source: ENV-Linkages model output
4.3.3 Carbon leakage
As established in Section 3, the Partial climate policy affects the distribution of emissions across countries and leads to carbon leakage. This leakage effect can be modified with the implementation of the response policies, as illustrated in Figure 4. BCAs can not only eliminate the international carbon leakage effect but even lead to a substantial negative leakage rate, i.e. emissions in non-acting countries are below the baseline level. This reflects a key principle of BCAs: they extend the carbon price signal to non-acting countries. Domestic leakage increases a little, but overall effect emissions outside the trading scheme are reduced. Offsets can also avoid positive international leakage as they encourage emission reductions in
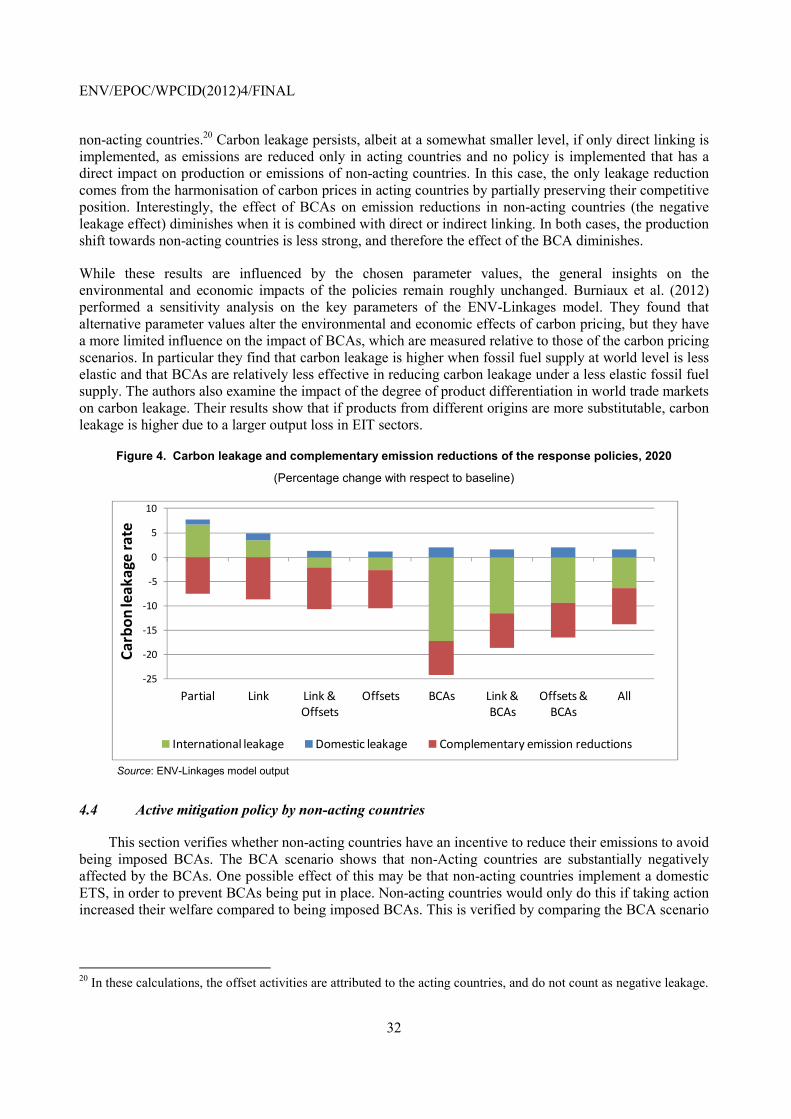
ENV/EPOC/WPCID(2012)4/FINAL
32
non-acting countries.20 Carbon leakage persists, albeit at a somewhat smaller level, if only direct linking is implemented, as emissions are reduced only in acting countries and no policy is implemented that has a direct impact on production or emissions of non-acting countries. In this case, the only leakage reduction comes from the harmonisation of carbon prices in acting countries by partially preserving their competitive position. Interestingly, the effect of BCAs on emission reductions in non-acting countries (the negative leakage effect) diminishes when it is combined with direct or indirect linking. In both cases, the production shift towards non-acting countries is less strong, and therefore the effect of the BCA diminishes.
While these results are influenced by the chosen parameter values, the general insights on the environmental and economic impacts of the policies remain roughly unchanged. Burniaux et al. (2012) performed a sensitivity analysis on the key parameters of the ENV-Linkages model. They found that alternative parameter values alter the environmental and economic effects of carbon pricing, but they have a more limited influence on the impact of BCAs, which are measured relative to those of the carbon pricing scenarios. In particular they find that carbon leakage is higher when fossil fuel supply at world level is less elastic and that BCAs are relatively less effective in reducing carbon leakage under a less elastic fossil fuel supply. The authors also examine the impact of the degree of product differentiation in world trade markets on carbon leakage. Their results show that if products from different origins are more substitutable, carbon leakage is higher due to a larger output loss in EIT sectors.
Figure 4. Carbon leakage and complementary emission reductions of the response policies, 2020
(Percentage change with respect to baseline)
Source: ENV-Linkages model output
4.4 Active mitigation policy by non-acting countries
This section verifies whether non-acting countries have an incentive to reduce their emissions to avoid being imposed BCAs. The BCA scenario shows that non-Acting countries are substantially negatively affected by the BCAs. One possible effect of this may be that non-acting countries implement a domestic ETS, in order to prevent BCAs being put in place. Non-acting countries would only do this if taking action increased their welfare compared to being imposed BCAs. This is verified by comparing the BCA scenario
20 In these calculations, the offset activities are attributed to the acting countries, and do not count as negative leakage.
-25
-20
-15
-10
-5
0
5
10
Partial Link Link & Offsets
Offsets BCAs Link & BCAs
Offsets & BCAs
All
Carb
on le
akag
e ra
te
International leakage Domestic leakage Complementary emission reductions
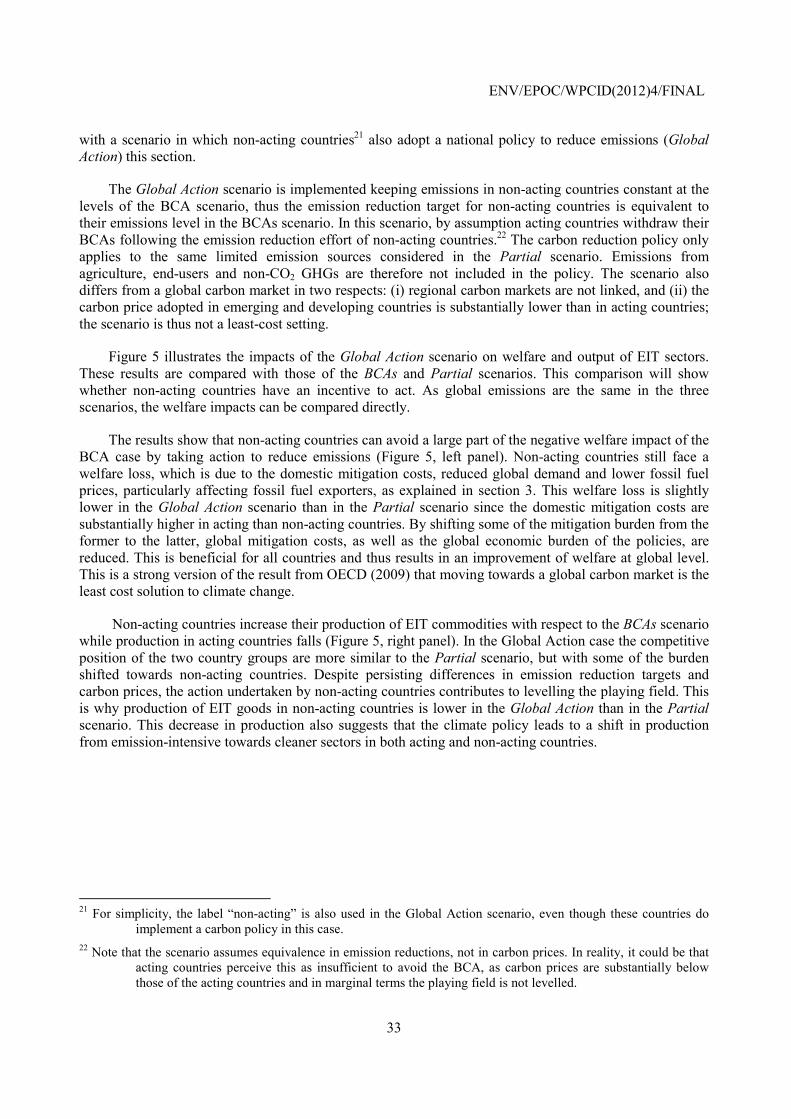
ENV/EPOC/WPCID(2012)4/FINAL
33
with a scenario in which non-acting countries21 also adopt a national policy to reduce emissions (Global Action) this section.
The Global Action scenario is implemented keeping emissions in non-acting countries constant at the levels of the BCA scenario, thus the emission reduction target for non-acting countries is equivalent to their emissions level in the BCAs scenario. In this scenario, by assumption acting countries withdraw their BCAs following the emission reduction effort of non-acting countries.22 The carbon reduction policy only applies to the same limited emission sources considered in the Partial scenario. Emissions from agriculture, end-users and non-CO2 GHGs are therefore not included in the policy. The scenario also differs from a global carbon market in two respects: (i) regional carbon markets are not linked, and (ii) the carbon price adopted in emerging and developing countries is substantially lower than in acting countries; the scenario is thus not a least-cost setting.
Figure 5 illustrates the impacts of the Global Action scenario on welfare and output of EIT sectors. These results are compared with those of the BCAs and Partial scenarios. This comparison will show whether non-acting countries have an incentive to act. As global emissions are the same in the three scenarios, the welfare impacts can be compared directly.
The results show that non-acting countries can avoid a large part of the negative welfare impact of the BCA case by taking action to reduce emissions (Figure 5, left panel). Non-acting countries still face a welfare loss, which is due to the domestic mitigation costs, reduced global demand and lower fossil fuel prices, particularly affecting fossil fuel exporters, as explained in section 3. This welfare loss is slightly lower in the Global Action scenario than in the Partial scenario since the domestic mitigation costs are substantially higher in acting than non-acting countries. By shifting some of the mitigation burden from the former to the latter, global mitigation costs, as well as the global economic burden of the policies, are reduced. This is beneficial for all countries and thus results in an improvement of welfare at global level. This is a strong version of the result from OECD (2009) that moving towards a global carbon market is the least cost solution to climate change.
Non-acting countries increase their production of EIT commodities with respect to the BCAs scenario while production in acting countries falls (Figure 5, right panel). In the Global Action case the competitive position of the two country groups are more similar to the Partial scenario, but with some of the burden shifted towards non-acting countries. Despite persisting differences in emission reduction targets and carbon prices, the action undertaken by non-acting countries contributes to levelling the playing field. This is why production of EIT goods in non-acting countries is lower in the Global Action than in the Partial scenario. This decrease in production also suggests that the climate policy leads to a shift in production from emission-intensive towards cleaner sectors in both acting and non-acting countries.
21 For simplicity, the label “non-acting” is also used in the Global Action scenario, even though these countries do
implement a carbon policy in this case. 22 Note that the scenario assumes equivalence in emission reductions, not in carbon prices. In reality, it could be that
acting countries perceive this as insufficient to avoid the BCA, as carbon prices are substantially below those of the acting countries and in marginal terms the playing field is not levelled.
ENV/EPOC/WPCID(2012)4/FINAL
34
Figure 5. Competitiveness impacts of the carbon tax in non-Annex I countries
(Percentage change with respect to baseline)
Source: ENV-Linkages model output
5. Concluding remarks
This report examined the competitiveness and carbon leakage impacts associated with a range of stylised mitigation policy scenarios. It also investigated border carbon adjustments (BCAs) as well as direct and indirect (offset-based) linking of carbon markets as possible response policies to address these impacts. When the first-best solution of a global carbon market is not reachable, these response policies may address some of the competitiveness and carbon leakage concerns, by going some way towards levelling carbon prices.
One important caveat of the analysis presented in this report is that it assumes stylised policy instruments with frictionless markets. In reality, there are numerous market imperfections and policy distortions which may prevent some of the abatement potential from being fully reaped. These include transaction costs and bottlenecks, information barriers, credit market constraints, and institutional and regulatory barriers to investment. The well-functioning offset mechanism that is modelled in the report may be particularly sensitive to these market imperfections and, thus, the most stylised representation of the instruments investigated in this report. The results presented in this report should also be interpreted in the light of the limitations of the modelling approach adopted. Models are stylised representations of reality, aimed to shed light on specific mechanisms, not as a full reflection of consequences of the policies that are being simulated. CGE models have many advantages as they can account for international trade flows, reproduce the regional economies and assess the effects of policy instruments. However, they also have certain limitations. In particular, the CGE model used does not consider endogenous technical change, which may affect the costs of the policies in the long- and medium-run. CGE models are also unable to consider further sectoral details or the role of firms’ incentives. Competitiveness impacts at the sub-sectoral and firm level may deviate substantially from the aggregated results presented in this report. The results obtained here could be complemented by in-depth analysis of particularly vulnerable sectors.
Finally, while the scenarios investigated in this report lead to positive costs of action (as measured through reduced welfare and EIT sectoral output), it is important to note that there are also benefits associated with mitigation policy. Although not reflected in the present analysis, in the long term the costs of the policies may well be outweighed by the benefits associated with reduced environmental impacts. Furthermore, the shift in relative competitiveness towards greener, low-carbon firms and sectors will be essential for moving toward a low-carbon economy.
-2
-1.5
-1
-0.5
0
Acting Non-Acting World% ch
ange
with
resp
ect t
o ba
selin
e
Welfare
Partial BCAs Global Action
-4-3-2-10123
Acting Non-Acting World% ch
ange
with
resp
ect t
o ba
selin
e EIT sectors output
Partial BCAs Global Action
ENV/EPOC/WPCID(2012)4/FINAL
35
REFERENCES
Babiker M.H. (2005), Climate Change Policy, Market Structure, and Carbon Leakage, Journal of International Economics, Vol. 65.
Babiker, M.H. and T.F. Rutherford (2005), The economic effects of border measures in subglobal climate agreements, The Energy Journal, Vol. 26, No. 4: pp. 99-125.
Bernard, A.L., C. Fischer, and A. Fox (2001), “Is There a Rationale for Output-Based Rebating of Environmental Levies?”, RFF Discussion Paper 01-31.
Böhringer, C., E. J. Balistreri and T. F. Rutherford, eds. (2012), The role of border carbon adjustment in unilateral climate policy: results from EMF 29, Energy Economics, Vol. 34, Supp. 2: pp. S95-S250.
Burniaux, J., G. Nicoletti and J. Oliveira Martins (1992), “GREEN: A Global Model for Quantifying the Costs of Policies to Curb CO2 Emissions”, OECD Economic Studies, 19 (Winter).
Burniaux J-M. and J. Oliveira Martins (2011), “Carbon leakages: a general equilibrium view”, Economic Theory, Vol. 49, No 2, 473-495.
Burniaux, J. and J. Chateau (2008), “An Overview of the OECD ENV-Linkages Model”, OECD Economics Department Working Paper, No. 653, OECD Publishing.
Burniaux, J., J. Chateau and R. Duval (2013), “Is there a Case for Carbon-Based Border Tax Adjustment? An Applied General Equilibrium Analysis”, Applied Economics, 45:16, 2231-2240.
Chateau, J., C. Rebolledo and R. Dellink (2011), “The ENV-Linkages economic baseline projections to 2050”, OECD Environment Working paper 41, OECD Publishing.
Chateau, J., R. Dellink, E. Lanzi and B. Magné (2013), “An overview of the OECD ENV-Linkages model – version 3”, OECD Environment Working paper, OECD Publishing, forthcoming.
Cosbey, A., S. Dröge, C. Fischer, J. Reinaud, J. Stephenson, L. Weischer and P. Wooders (2012), A guide for the concerned: guidance on the elaboration and implementation of border carbon adjustment, ENTWINED/International Institute for Sustainable Development, Stockholm.
Dellink, R.B., S. Jamet, C. Chateau and R. Duval (2010), “Towards global carbon pricing: direct and indirect linking of carbon markets”, OECD Environment Working Paper 20, OECD Publishing.
Dellink, R.B., G. Briner and C. Clapp (2011), “The Copenhagen Accord / Cancun Agreements emissions pledges for 2020: exploring economic and environmental impacts”, Climate Change Economics 2(1), 53-78.
Demailly, D. and P. Quirion, (2006), “CO2 Abatement, Competitiveness and Leakage in the European Cement Industry Under the EU-ETS: Grandfathering vs. Output-based Allocation”, Climate Policy, Vol. 6.
Dröge, S. (2009), “Tackling Leakage in a World of Unequal Carbon Prices”, Climate Strategies Publishing.
Duval, R. and C. de la Maisonneuve (2010), “Long-Run Growth Scenarios for the World Economy”, Journal of Policy Modeling, Vol. 32, No. 1.
ENV/EPOC/WPCID(2012)4/FINAL
36
Eckersley, R. (2010), The politics of carbon leakage and fairness of border measures, Ethics and International Affairs 367, 382.
Fischer, K. and A.K. Fox, (2009), “Comparing Policies to Combat Emissions Leakage: Border Tax Adjustments versus Rebates”. RFF Discussion Paper 09-02.
Hood, C. (2010), “Reviewing existing and proposed emissions trading systems”, OECD Publishing.
Hyman, R.C., J.M. Reilly, M.H. Babiker, A. De Masin, and H.D. Jacoby (2002), “Modeling Non-CO2 Greenhouse Gas Abatement”, Environmental Modeling and Assessment, 8, pp. 175-86.
IEA (2009), World Energy Outlook 2009, OECD Publishing.
IEA (2010a), World Energy Outlook 2010, OECD Publishing .
IEA (2010b), CO2 Emissions from Fuel Combustion 2010, OECD Publishing.
IEA (2010c), Energy Technology Perspectives 2010, OECD Publishing.
IMF (2011), World Economic Outlook Database, www.imf.org/external/pubs/ft/weo/2011/02/weodata/index.aspx.
Jaffe, J. and R. Stavins (2007), “Linking Tradable Permit Systems for Greenhouse Gas Emissions: Opportunities, Implications, and Challenges”, IETA report.
Krugman, P. (1994), “Competitiveness: a dangerous obsession”, Foreign Affairs, Vol.73, No. 2
Lanzi, E. and I. Sue Wing (2013). Capital Malleability, Emission Leakage and the Cost of Partial Climate Policies: General Equilibrium Analysis of the European Union Emission Trading System, Environmental and Resource Economics, Vol. 55/2: pp. 257-289.
Martin, R., Mireabelle Muûls, L.B. de Preux and U. J. Wagner (2013), Industry Compensation under Relocation Risk : a Firm Level Analysis of the EU Emissions Trading Scheme, NBER Working Paper 19097. http://www.nber.org/papers/w19097
Mattoo, A., A. Subramanian, D. van der Mensbrugghe and J. He (2009), “Reconciling Climate change and Trade Policy”, World Bank Policy Research Working Paper No. WPS5123, World Bank, Washington D.C.
Narayanan, B. G. and T. L. Walmsley (2008), ‘Global Trade, Assistance, and Production: The GTAP 7 Data Base’, Narayanan, B. and Walmsey, T. Editors, Center for Global Trade Analysis, Dpt. of Agricultural Economics, Purdue University.
OECD (2006), The Political Economy of Environmentally Related Taxes, OECD Publishing.
OECD (2009a), The Economics of Climate Change Mitigation: Policies and Options for Global Action Beyond 2012, OECD Publishing.
OECD (2009b), Integrating Climate Change Adaptation into Development Co-operation: Policy Guidance, OECD Publishing.
OECD (2010a), Innovation effects of the Swedish NOX charge, OECD Environment Directorate.
OECD (2010b), Interim Report of the Green Growth Strategy: Implementing our commitment for a sustainable future, Meeting of the OECD Council at Ministerial Level, 27-28 May 2010.
OECD (2010c), Taxation, Innovation, and the Environment. OECD Green Growth Strategy, OECD Publishing.
OECD (2010d), Addressing International Competitiveness in a World of Non-uniform Carbon Pricing: Lessons from a decade of OECD analysis, OECD Environment Directorate.
ENV/EPOC/WPCID(2012)4/FINAL
37
OECD (2011a), OECD Economic Outlook, Vol. 2011/2, OECD Publishing.
OECD (2011b), Emission permit trading and competition, OECD Publishing.
OECD (2012), The OECD Environment Outlook to 2050, OECD Publishing.
Prag, A., C. Hood, A. Aasrud and G. Briner (2011), “Tracking and Trading: Expanding on Options for International Greenhouse Gas Unit Accounting After 2012”, OECD/IEA Information Paper.
Prag A., G. Briner and C. Hood (2012), “Making markets: unpacking design and governance of carbon market mechanisms”, OECD/IEA Information paper.
Reinaud, J. (2008), “Issues behind competitiveness and carbon leakage: Focus on heavy industry”, IEA Information Paper, OECD Publishing.
Winchester, N., S. Paltsev and J. Reilly (2011), “Will Border Carbon Adjustments Work?”, The B.E Journal of Economic Analysis and Policy, 11, Article 7, pp.1-27.
World Bank (2011), World Development Indicators, http://data.worldbank.org/data-catalog/world-development-indicators.
ENV/EPOC/WPCID(2012)4/FINAL
38
ANNEX I: A SNAPSHOT OF THE ENV-LINKAGES MODEL
An overview of the ENV-Linkages Model
The analysis is based on ENV-Linkages, a global recursive-dynamic neo-classical Computable General Equilibrium (CGE) model. The ENV-Linkages model is the successor to the OECD GREEN model for environmental studies (Burniaux, et al. 1992). A more comprehensive model description is given in Chateau et al. (2013).
Production in ENV-Linkages is assumed to operate under cost minimisation with perfect markets and constant return to scale technology. The production technology is specified as nested Constant Elasticity of Substitution (CES) production functions in a branching hierarchy (cf. Figure A1.1). This structure is replicated for each output, while the parameterisation of the CES functions may differ across sectors. The nesting of the production function for the agricultural sectors is further re-arranged to reflect substitution between intensification (e.g. more fertiliser use) and extensification (more land use) of crop production; or between intensive and extensive livestock production. The structure of electricity production assumes that a representative electricity producer maximizes its profit by using the different available technologies to generate electricity using a CES specification with a large degree of substitution. The structure of non-fossil electricity technologies is similar to that of other sectors, except for a top nest combining a sector-specific resource with a sub-nest of all other inputs. This specification acts as a capacity constraint on the supply of the electricity technologies.
The model adopts a putty/semi-putty technology specification, where substitution possibilities among factors are assumed to be higher with new vintage capital than with old vintage capital. In the short run this ensures inertia in the economic system, with limited possibilities to substitute away from more expensive inputs, but in the longer run this implies relatively smooth adjustment of quantities to price changes. Capital accumulation is modelled as in the traditional Solow/Swan neo-classical growth model.

ENV/EPOC/WPCID(2012)4/FINAL
39
Figure 6. Figure A1.1. Production structure of a generic sector in ENV-Linkages23
Source: ENV-Linkages model
The energy bundle is of particular interest for analysis of climate change issues. Energy is a composite of fossil fuels and electricity. In turn, fossil fuel is a composite of coal and a bundle of the “other fossil fuels”. At the lowest nest, the composite “other fossil fuels” commodity consists of crude oil, refined oil products and natural gas. The value of the substitution elasticities are chosen as to imply a higher degree of substitution among the other fuels than with electricity and coal.
Household consumption demand is the result of static maximization behaviour which is formally implemented as an “Extended Linear Expenditure System”. A representative consumer in each region – who takes prices as given – optimally allocates disposal income among the full set of consumption 23 This generic structure does not apply to energy and agricultural sectors.

ENV/EPOC/WPCID(2012)4/FINAL
40
commodities and savings. Saving is considered as a standard good in the utility function and does not rely on forward-looking behaviour by the consumer. The government in each region collects various kinds of taxes in order to finance government expenditures. Assuming fixed public savings (or deficits), the government budget is balanced through the adjustment of the income tax on consumer income. In each period, investment net-of-economic depreciation is equal to the sum of government savings, consumer savings and net capital flows from abroad.
International trade is based on a set of regional bilateral flows. The model adopts the Armington specification, assuming that domestic and imported products are not perfectly substitutable. Moreover, total imports are also imperfectly substitutable between regions of origin. Allocation of trade between partners then responds to relative prices at the equilibrium.
Market goods equilibria imply that, on the one side, the total production of any good or service is equal to the demand addressed to domestic producers plus exports; and, on the other side, the total demand is allocated between the demands (both final and intermediary) addressed to domestic producers and the import demand.
CO2 emissions from combustion of energy are directly linked to the use of different fuels in production. Other GHG emissions are linked to output in a way similar to Hyman et al. (2002). The following non-CO2 emission sources are considered: i) methane from rice cultivation, livestock production (enteric fermentation and manure management), fugitive methane emissions from coal mining, crude oil extraction, natural gas and services (landfills and water sewage); ii) nitrous oxide from crops (nitrogenous fertilizers), livestock (manure management), chemicals (non-combustion industrial processes) and services (landfills); iii) industrial gases (SF6, PFCs and HFCs) from chemicals industry (foams, adipic acid, solvents), aluminium, magnesium and semi-conductors production. Over time, there is, however, some relative decoupling of emissions from the underlying economic activity through autonomous technical progress, implying that emissions grow less rapidly than economic activity.
Emissions can be abated through three channels: (i) reductions in emission intensity of economic activity; (ii) changes in structure of the associated sectors away from the ‘dirty’ input to cleaner inputs, and (iii) changes in economic structure away from relatively emission-intensive sectors to cleaner sectors. The first channel, which is not available for emissions from combustion of fossil fuels, entails end-of-pipe measures that reduce emissions per unit of the relevant input. The second channel includes for instance substitution from fossil fuels to renewable in electricity production, or investing in more energy-efficient machinery (which is represented through higher capital inputs but lower energy inputs in production). An example of the third channel is a substitution from consumption of energy-intensive industrial goods to services. In the model, the choice between these three channels is endogenous and driven by the price on emissions.
ENV-Linkages is fully homogeneous in prices and only relative prices matter. All prices are expressed relative to the numéraire of the price system that is arbitrarily chosen as the index of OECD manufacturing exports prices. Each region runs a current account balance, which is fixed in terms of the numéraire. One important implication from this assumption in the context of this report is that real exchange rates immediately adjust to restore current account balance when countries start exporting/importing emission permits.
As ENV-Linkages is recursive-dynamic and does not incorporate forward-looking behaviour, price-induced changes in innovation patterns are not represented in the model. The model does, however, entail technological progress through an annual adjustment of the various productivity parameters in the model, including e.g. autonomous energy efficiency and labour productivity improvements. Furthermore, as production with new capital has a relatively large degree of flexibility in choice of inputs, existing

ENV/EPOC/WPCID(2012)4/FINAL
41
technologies can diffuse to other firms. Thus, within the CGE framework, firms choose the least-cost combination of inputs, given the existing state of technology. The capital vintage structure also ensures that such flexibilities are large in the long run than in the short run.
Finally, it should be stressed that the ENV-Linkages model does not assess the impacts from climate change, and therefore cannot determine the benefits from mitigation action through reduced damages.
Data and calibration of the baseline scenario
The version of the model used here represents the world economy in 15 regions, each with 27 economic sectors, as illustrated in Table A1.1. These include seven electric generation sectors, five agriculture-related sectors (including fishing and forestry), five energy-intensive industries, three fossil fuel extraction sectors, transport, refineries and distribution of petroleum products, services, construction and four other manufacturing sectors. The core of the static 2004 starting year equilibrium is formed by the set of Social Account Matrices (SAMs) that describe how economic sectors are linked; these are based on the GTAP 7 database (Narayanan and Walmsley, 2008). Many key parameters of the model are set on the basis of information drawn from various empirical studies and data sources (see Burniaux and Chateau, 2008).
The Baseline scenario assumes that there are no climate policies, and projects future emissions on the basis of assumptions on the long-term evolution of output growth, relative prices of fossil fuels, and potential gains in energy efficiency. It thus provides a benchmark against which policy scenarios aimed at achieving emission cuts can be assessed.
The socio-economic drivers in the baseline scenario are described in detail in the OECD Environmental Outlook to 2050 (OECD, 2012) and especially in Chateau et al. (2011). It is built on various exogenous trends: employment levels that are derived from labour force projections and from estimates of national unemployment rates provided by the OECD; labour productivity projections, which are based on a conditional-convergence hypothesis (for details see Duval and de la Maisonneuve, 2010); autonomous energy efficiency factors and fossil-fuel production are calibrated on IEA World Energy Outlook projections (IEA, 2010a and 2010b), while emissions of non-CO2 fossil-fuel combustion greenhouse gases are calibrated to match US-EPA projections (2005). Moreover, the Baseline has been adjusted to incorporate the effects of the economic crisis of 2008-2009 using medium-term projections made by the World Bank (2011), IMF (2011) and OECD (2011a). For this report, all values are expressed in constant 2010 USD using Purchasing Power Parities (PPPs).
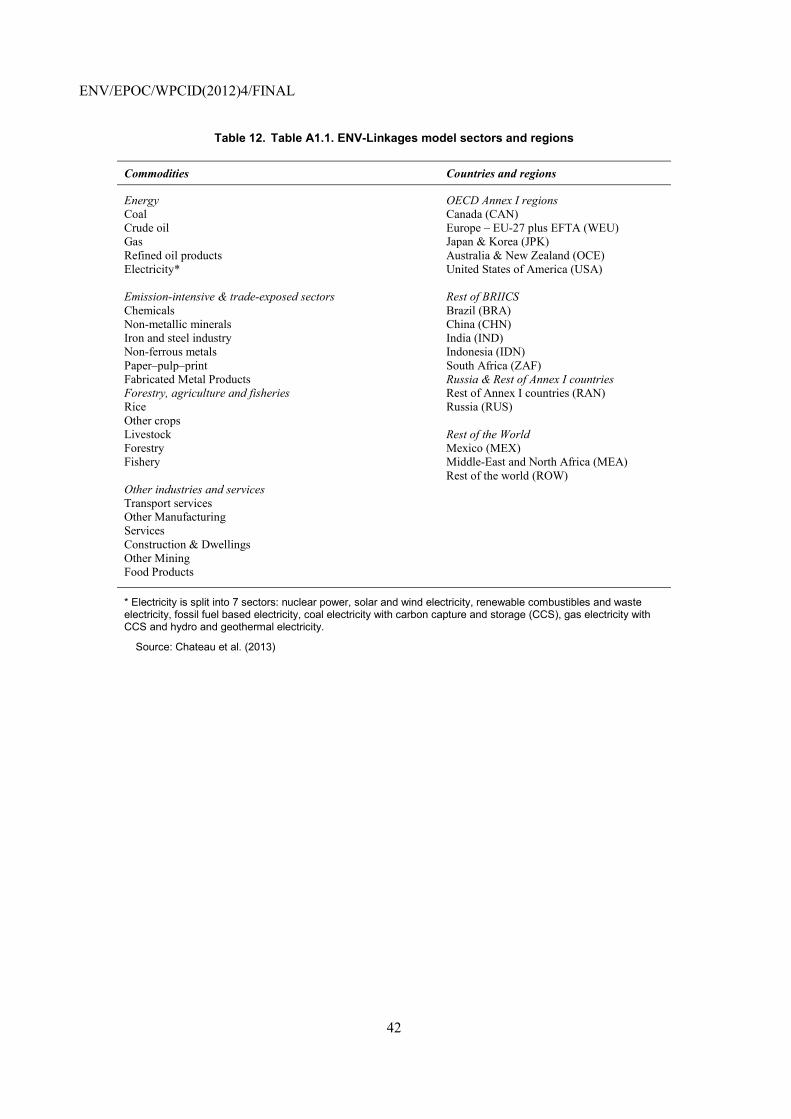
ENV/EPOC/WPCID(2012)4/FINAL
42
Table 12. Table A1.1. ENV-Linkages model sectors and regions
Commodities Countries and regions
Energy OECD Annex I regions Coal Canada (CAN) Crude oil Europe – EU-27 plus EFTA (WEU) Gas Japan & Korea (JPK) Refined oil products Australia & New Zealand (OCE) Electricity* United States of America (USA) Emission-intensive & trade-exposed sectors Rest of BRIICS Chemicals Brazil (BRA) Non-metallic minerals China (CHN) Iron and steel industry India (IND) Non-ferrous metals Indonesia (IDN) Paper–pulp–print South Africa (ZAF) Fabricated Metal Products Russia & Rest of Annex I countries Forestry, agriculture and fisheries Rest of Annex I countries (RAN) Rice Russia (RUS) Other crops Livestock Rest of the World Forestry Mexico (MEX) Fishery Middle-East and North Africa (MEA) Rest of the world (ROW) Other industries and services Transport services Other Manufacturing Services Construction & Dwellings Other Mining Food Products
* Electricity is split into 7 sectors: nuclear power, solar and wind electricity, renewable combustibles and waste electricity, fossil fuel based electricity, coal electricity with carbon capture and storage (CCS), gas electricity with CCS and hydro and geothermal electricity.
Source: Chateau et al. (2013)
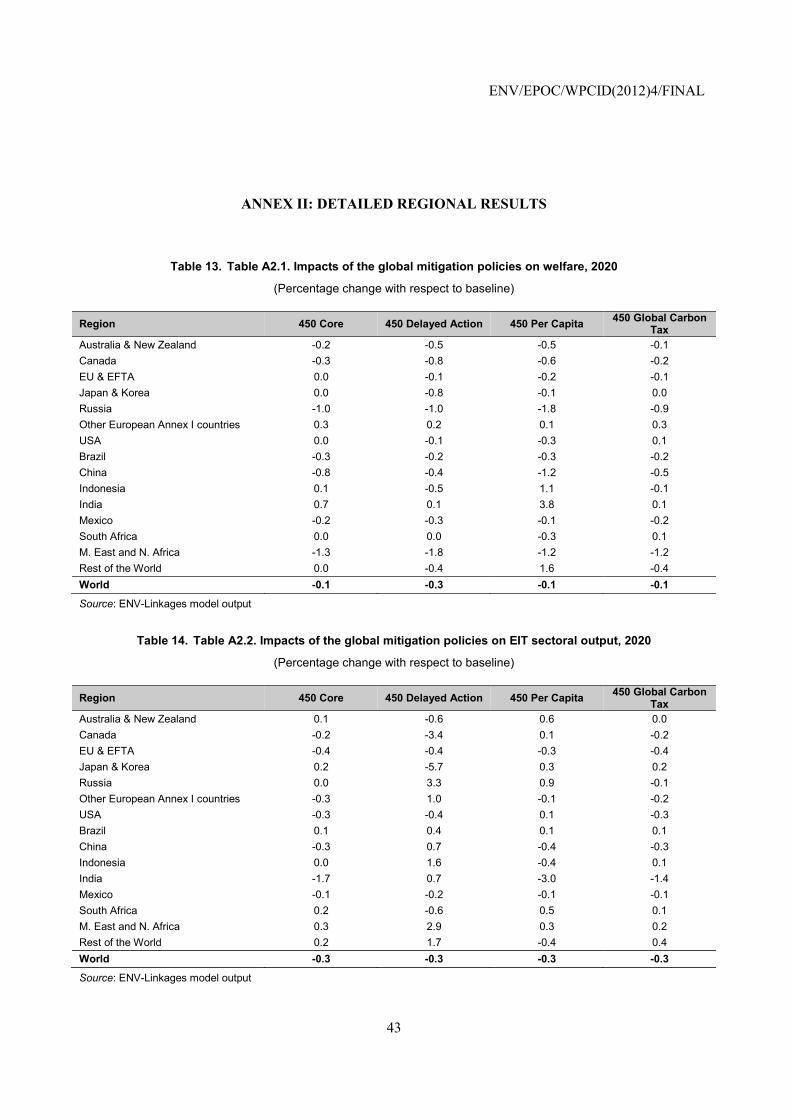
ENV/EPOC/WPCID(2012)4/FINAL
43
ANNEX II: DETAILED REGIONAL RESULTS
Table 13. Table A2.1. Impacts of the global mitigation policies on welfare, 2020
(Percentage change with respect to baseline)
Region 450 Core 450 Delayed Action 450 Per Capita 450 Global Carbon Tax
Australia & New Zealand -0.2 -0.5 -0.5 -0.1 Canada -0.3 -0.8 -0.6 -0.2 EU & EFTA 0.0 -0.1 -0.2 -0.1 Japan & Korea 0.0 -0.8 -0.1 0.0 Russia -1.0 -1.0 -1.8 -0.9 Other European Annex I countries 0.3 0.2 0.1 0.3 USA 0.0 -0.1 -0.3 0.1 Brazil -0.3 -0.2 -0.3 -0.2 China -0.8 -0.4 -1.2 -0.5 Indonesia 0.1 -0.5 1.1 -0.1 India 0.7 0.1 3.8 0.1 Mexico -0.2 -0.3 -0.1 -0.2 South Africa 0.0 0.0 -0.3 0.1 M. East and N. Africa -1.3 -1.8 -1.2 -1.2 Rest of the World 0.0 -0.4 1.6 -0.4 World -0.1 -0.3 -0.1 -0.1
Source: ENV-Linkages model output
Table 14. Table A2.2. Impacts of the global mitigation policies on EIT sectoral output, 2020
(Percentage change with respect to baseline)
Region 450 Core 450 Delayed Action 450 Per Capita 450 Global Carbon Tax
Australia & New Zealand 0.1 -0.6 0.6 0.0 Canada -0.2 -3.4 0.1 -0.2 EU & EFTA -0.4 -0.4 -0.3 -0.4 Japan & Korea 0.2 -5.7 0.3 0.2 Russia 0.0 3.3 0.9 -0.1 Other European Annex I countries -0.3 1.0 -0.1 -0.2 USA -0.3 -0.4 0.1 -0.3 Brazil 0.1 0.4 0.1 0.1 China -0.3 0.7 -0.4 -0.3 Indonesia 0.0 1.6 -0.4 0.1 India -1.7 0.7 -3.0 -1.4 Mexico -0.1 -0.2 -0.1 -0.1 South Africa 0.2 -0.6 0.5 0.1 M. East and N. Africa 0.3 2.9 0.3 0.2 Rest of the World 0.2 1.7 -0.4 0.4 World -0.3 -0.3 -0.3 -0.3
Source: ENV-Linkages model output
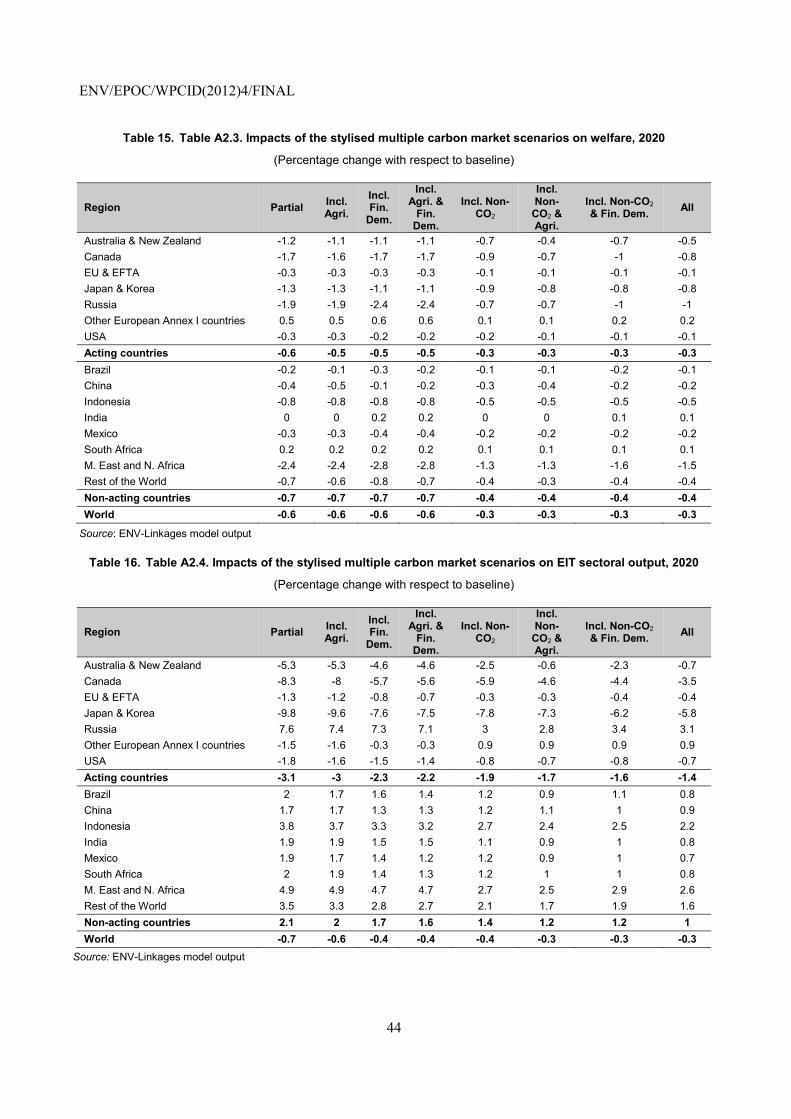
ENV/EPOC/WPCID(2012)4/FINAL
44
Table 15. Table A2.3. Impacts of the stylised multiple carbon market scenarios on welfare, 2020
(Percentage change with respect to baseline)
Region Partial Incl. Agri.
Incl. Fin.
Dem.
Incl. Agri. &
Fin. Dem.
Incl. Non-CO2
Incl. Non-
CO2 & Agri.
Incl. Non-CO2 & Fin. Dem. All
Australia & New Zealand -1.2 -1.1 -1.1 -1.1 -0.7 -0.4 -0.7 -0.5 Canada -1.7 -1.6 -1.7 -1.7 -0.9 -0.7 -1 -0.8 EU & EFTA -0.3 -0.3 -0.3 -0.3 -0.1 -0.1 -0.1 -0.1 Japan & Korea -1.3 -1.3 -1.1 -1.1 -0.9 -0.8 -0.8 -0.8 Russia -1.9 -1.9 -2.4 -2.4 -0.7 -0.7 -1 -1 Other European Annex I countries 0.5 0.5 0.6 0.6 0.1 0.1 0.2 0.2 USA -0.3 -0.3 -0.2 -0.2 -0.2 -0.1 -0.1 -0.1 Acting countries -0.6 -0.5 -0.5 -0.5 -0.3 -0.3 -0.3 -0.3 Brazil -0.2 -0.1 -0.3 -0.2 -0.1 -0.1 -0.2 -0.1 China -0.4 -0.5 -0.1 -0.2 -0.3 -0.4 -0.2 -0.2 Indonesia -0.8 -0.8 -0.8 -0.8 -0.5 -0.5 -0.5 -0.5 India 0 0 0.2 0.2 0 0 0.1 0.1 Mexico -0.3 -0.3 -0.4 -0.4 -0.2 -0.2 -0.2 -0.2 South Africa 0.2 0.2 0.2 0.2 0.1 0.1 0.1 0.1 M. East and N. Africa -2.4 -2.4 -2.8 -2.8 -1.3 -1.3 -1.6 -1.5 Rest of the World -0.7 -0.6 -0.8 -0.7 -0.4 -0.3 -0.4 -0.4 Non-acting countries -0.7 -0.7 -0.7 -0.7 -0.4 -0.4 -0.4 -0.4 World -0.6 -0.6 -0.6 -0.6 -0.3 -0.3 -0.3 -0.3
Source: ENV-Linkages model output
Table 16. Table A2.4. Impacts of the stylised multiple carbon market scenarios on EIT sectoral output, 2020
(Percentage change with respect to baseline)
Region Partial Incl. Agri.
Incl. Fin.
Dem.
Incl.Agri. &
Fin. Dem.
Incl. Non-CO2
Incl. Non-
CO2 & Agri.
Incl. Non-CO2 & Fin. Dem. All
Australia & New Zealand -5.3 -5.3 -4.6 -4.6 -2.5 -0.6 -2.3 -0.7 Canada -8.3 -8 -5.7 -5.6 -5.9 -4.6 -4.4 -3.5 EU & EFTA -1.3 -1.2 -0.8 -0.7 -0.3 -0.3 -0.4 -0.4 Japan & Korea -9.8 -9.6 -7.6 -7.5 -7.8 -7.3 -6.2 -5.8 Russia 7.6 7.4 7.3 7.1 3 2.8 3.4 3.1 Other European Annex I countries -1.5 -1.6 -0.3 -0.3 0.9 0.9 0.9 0.9 USA -1.8 -1.6 -1.5 -1.4 -0.8 -0.7 -0.8 -0.7 Acting countries -3.1 -3 -2.3 -2.2 -1.9 -1.7 -1.6 -1.4 Brazil 2 1.7 1.6 1.4 1.2 0.9 1.1 0.8 China 1.7 1.7 1.3 1.3 1.2 1.1 1 0.9 Indonesia 3.8 3.7 3.3 3.2 2.7 2.4 2.5 2.2 India 1.9 1.9 1.5 1.5 1.1 0.9 1 0.8 Mexico 1.9 1.7 1.4 1.2 1.2 0.9 1 0.7 South Africa 2 1.9 1.4 1.3 1.2 1 1 0.8 M. East and N. Africa 4.9 4.9 4.7 4.7 2.7 2.5 2.9 2.6 Rest of the World 3.5 3.3 2.8 2.7 2.1 1.7 1.9 1.6 Non-acting countries 2.1 2 1.7 1.6 1.4 1.2 1.2 1 World -0.7 -0.6 -0.4 -0.4 -0.4 -0.3 -0.3 -0.3
Source: ENV-Linkages model output
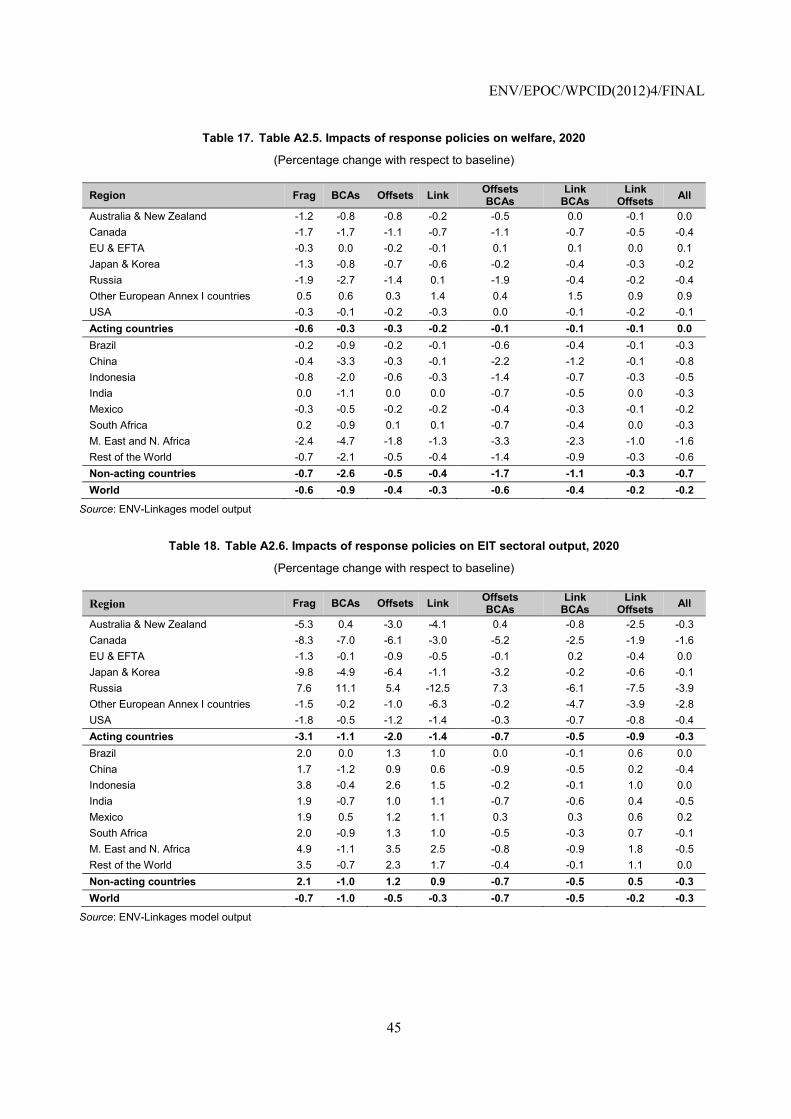
ENV/EPOC/WPCID(2012)4/FINAL
45
Table 17. Table A2.5. Impacts of response policies on welfare, 2020
(Percentage change with respect to baseline)
Region Frag BCAs Offsets Link OffsetsBCAs
Link BCAs
Link Offsets All
Australia & New Zealand -1.2 -0.8 -0.8 -0.2 -0.5 0.0 -0.1 0.0 Canada -1.7 -1.7 -1.1 -0.7 -1.1 -0.7 -0.5 -0.4 EU & EFTA -0.3 0.0 -0.2 -0.1 0.1 0.1 0.0 0.1 Japan & Korea -1.3 -0.8 -0.7 -0.6 -0.2 -0.4 -0.3 -0.2 Russia -1.9 -2.7 -1.4 0.1 -1.9 -0.4 -0.2 -0.4 Other European Annex I countries 0.5 0.6 0.3 1.4 0.4 1.5 0.9 0.9 USA -0.3 -0.1 -0.2 -0.3 0.0 -0.1 -0.2 -0.1 Acting countries -0.6 -0.3 -0.3 -0.2 -0.1 -0.1 -0.1 0.0 Brazil -0.2 -0.9 -0.2 -0.1 -0.6 -0.4 -0.1 -0.3 China -0.4 -3.3 -0.3 -0.1 -2.2 -1.2 -0.1 -0.8 Indonesia -0.8 -2.0 -0.6 -0.3 -1.4 -0.7 -0.3 -0.5 India 0.0 -1.1 0.0 0.0 -0.7 -0.5 0.0 -0.3 Mexico -0.3 -0.5 -0.2 -0.2 -0.4 -0.3 -0.1 -0.2 South Africa 0.2 -0.9 0.1 0.1 -0.7 -0.4 0.0 -0.3 M. East and N. Africa -2.4 -4.7 -1.8 -1.3 -3.3 -2.3 -1.0 -1.6 Rest of the World -0.7 -2.1 -0.5 -0.4 -1.4 -0.9 -0.3 -0.6 Non-acting countries -0.7 -2.6 -0.5 -0.4 -1.7 -1.1 -0.3 -0.7 World -0.6 -0.9 -0.4 -0.3 -0.6 -0.4 -0.2 -0.2
Source: ENV-Linkages model output
Table 18. Table A2.6. Impacts of response policies on EIT sectoral output, 2020
(Percentage change with respect to baseline)
Region Frag BCAs Offsets Link OffsetsBCAs
Link BCAs
Link Offsets All
Australia & New Zealand -5.3 0.4 -3.0 -4.1 0.4 -0.8 -2.5 -0.3 Canada -8.3 -7.0 -6.1 -3.0 -5.2 -2.5 -1.9 -1.6 EU & EFTA -1.3 -0.1 -0.9 -0.5 -0.1 0.2 -0.4 0.0 Japan & Korea -9.8 -4.9 -6.4 -1.1 -3.2 -0.2 -0.6 -0.1 Russia 7.6 11.1 5.4 -12.5 7.3 -6.1 -7.5 -3.9 Other European Annex I countries -1.5 -0.2 -1.0 -6.3 -0.2 -4.7 -3.9 -2.8 USA -1.8 -0.5 -1.2 -1.4 -0.3 -0.7 -0.8 -0.4 Acting countries -3.1 -1.1 -2.0 -1.4 -0.7 -0.5 -0.9 -0.3 Brazil 2.0 0.0 1.3 1.0 0.0 -0.1 0.6 0.0 China 1.7 -1.2 0.9 0.6 -0.9 -0.5 0.2 -0.4 Indonesia 3.8 -0.4 2.6 1.5 -0.2 -0.1 1.0 0.0 India 1.9 -0.7 1.0 1.1 -0.7 -0.6 0.4 -0.5 Mexico 1.9 0.5 1.2 1.1 0.3 0.3 0.6 0.2 South Africa 2.0 -0.9 1.3 1.0 -0.5 -0.3 0.7 -0.1 M. East and N. Africa 4.9 -1.1 3.5 2.5 -0.8 -0.9 1.8 -0.5 Rest of the World 3.5 -0.7 2.3 1.7 -0.4 -0.1 1.1 0.0 Non-acting countries 2.1 -1.0 1.2 0.9 -0.7 -0.5 0.5 -0.3 World -0.7 -1.0 -0.5 -0.3 -0.7 -0.5 -0.2 -0.3
Source: ENV-Linkages model output