Canopy Plan 2019 - 2024 - City of Belmont
29
Transcript of Canopy Plan 2019 - 2024 - City of Belmont


Page | 2
Executive Summary .................................................................................. 3
Acknowledgments .................................................................................... 4
Managing Our Urban Forest ..................................................................... 5
Urban vs. Forest ....................................................................................... 6
Canopy Cover Decline .............................................................................. 7
Growing the Canopy Plan: Engagement and Consultation ..................... 11
Goals, Targets and Reporting ................................................................. 14
Canopy Plan Strategic Objectives and Actions ....................................... 15
The Benefits of Canopy Cover ................................................................ 21
References ............................................................................................. 27

Page | 3
Canopy Plan 2019 - 2024
Executive Summary In 2014 the City of Belmont (the City) endorsed an Urban Forest Strategy (the Strategy) which identified the loss of canopy cover and raised awareness about the relationship between canopy cover and urban liveability. The Strategy provided preliminary strategic objectives for urban forestry management and recognised the importance of canopy cover and urban trees, promoted their associated values and identified the need for their retention.
There is a direct correlation between the presence and extent of urban vegetation and urban liveability indicators. Research has demonstrated that the provision of greenspace and tree canopy cover supports the health and wellbeing of those living in cities. As urban areas grow and increase in density, vegetation is commonly replaced with hard infrastructure often resulting in unintended and undesirable consequences that negatively affect the quality of life and wellbeing of those living, recreating and working in urban environments.
In 2019 Council adopted an Urban Forest Policy that formalised the City’s position on Urban Forest management. Both the Urban Forest Policy and this Canopy Plan aim to retain, increase and enhance canopy cover in recognition of the multiple urban liveability aspects that canopy supports (The Benefits of Canopy Cover).
In essence, the Policy and the Canopy Plan (the Plan) aim to reduce the loss of canopy cover in order to mitigate unfavourable urban liveability outcomes such as exacerbated heat island effect, poor air quality, loss of ecosystem services and lower levels of amenity.
This Canopy Plan outlines the City’s path forward on its urban forestry journey across the next five years. It also includes opportunities for the City’s residents, businesses and other key stakeholders in the community to participate in the delivery of the Canopy Plan Actions.
The majority of the actions are interrelated and completion of each action aims to result in increased capacity to deliver better urban forestry outcomes and therefore better urban liveability outcomes.

Page | 4
Acknowledgments The Canopy Plan has been developed with input from:
The City of Belmont Councillors who have contributed to informing the actions of the Canopy Plan for the benefit of the community
The community of the City of Belmont, including all those who contributed to the plan through participation in workshops and by visiting information stands at City events. Your input and feedback has been pivotal in the formation of actions within the Plan and helped inform the City of the communities urban forest aspirations
The staff at the City of Belmont and all those who have provided technical input during workshops.
The implementation of this Plan and achievement of greater urban forestry outcomes will help support future communities and contribute to the City of Belmont being a healthy, vibrant place to live, work and recreate. Actions implemented today are intergenerational meaning that they
will contribute to the urban liveability standards for communities for years to come.

Page | 5
Canopy Plan 2019 - 2024
Managing Our Urban Forest More focus is being put on urban greening and urban forest investment with an aim to future proof and support our communities, particularly in uncertain warming and drying climates where the associated values of green infrastructure can support and enhance various elements of urban living (Lo, Byrne, & Jim, 2017; Lin, Meyers, Beaty, & Barnett, 2016).
Green infrastructure investment is particularly important in highly urbanised environments where there is increased pressure on trees, exacerbated heat risk, poor air quality, low social cohesion, impacted community health, low sense of place, poor ecosystems services and undesirable urban liveability (Moffat, 2016; Lo, Byrne, & Jim, 2017; Rotherham, 2017; Mullaney, Lucke, & Trueman, 2015; Dobbs, Kendal, & Nitschke, 2013).
In the context of the City’s Urban Forest Strategy, and this Canopy Plan, urban forestry can be defined as the inclusive management of all trees within the urban environment. In its simplest form, urban forest practices ensure that the values associated with trees in the urban environment are recognised, promoted and maintained in an attempt to uphold and improve urban liveability across the City.
The core objectives of the City’s Urban Forest Strategy and urban forestry initiatives are to:
Retain existing canopy cover and identify existing trees as future canopy cover
Enhance existing canopy cover to support its associated values
Increase canopy cover through strategic planting and management of existing trees.
Page | 6
Canopy Plan 2018 - 2024
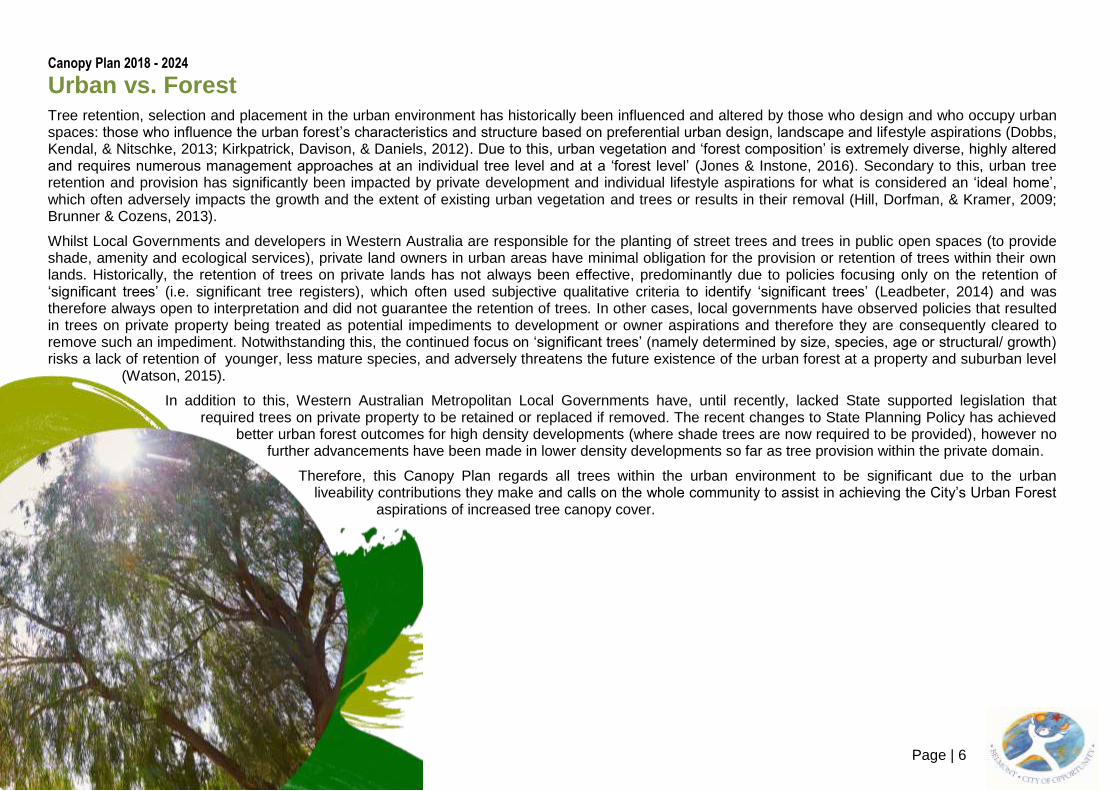
Urban vs. Forest Tree retention, selection and placement in the urban environment has historically been influenced and altered by those who design and who occupy urban spaces: those who influence the urban forest’s characteristics and structure based on preferential urban design, landscape and lifestyle aspirations (Dobbs, Kendal, & Nitschke, 2013; Kirkpatrick, Davison, & Daniels, 2012). Due to this, urban vegetation and ‘forest composition’ is extremely diverse, highly altered and requires numerous management approaches at an individual tree level and at a ‘forest level’ (Jones & Instone, 2016). Secondary to this, urban tree retention and provision has significantly been impacted by private development and individual lifestyle aspirations for what is considered an ‘ideal home’, which often adversely impacts the growth and the extent of existing urban vegetation and trees or results in their removal (Hill, Dorfman, & Kramer, 2009; Brunner & Cozens, 2013).
Whilst Local Governments and developers in Western Australia are responsible for the planting of street trees and trees in public open spaces (to provide shade, amenity and ecological services), private land owners in urban areas have minimal obligation for the provision or retention of trees within their own lands. Historically, the retention of trees on private lands has not always been effective, predominantly due to policies focusing only on the retention of ‘significant trees’ (i.e. significant tree registers), which often used subjective qualitative criteria to identify ‘significant trees’ (Leadbeter, 2014) and was therefore always open to interpretation and did not guarantee the retention of trees. In other cases, local governments have observed policies that resulted in trees on private property being treated as potential impediments to development or owner aspirations and therefore they are consequently cleared to remove such an impediment. Notwithstanding this, the continued focus on ‘significant trees’ (namely determined by size, species, age or structural/ growth) risks a lack of retention of younger, less mature species, and adversely threatens the future existence of the urban forest at a property and suburban level
(Watson, 2015).
In addition to this, Western Australian Metropolitan Local Governments have, until recently, lacked State supported legislation that required trees on private property to be retained or replaced if removed. The recent changes to State Planning Policy has achieved
better urban forest outcomes for high density developments (where shade trees are now required to be provided), however no further advancements have been made in lower density developments so far as tree provision within the private domain.
Therefore, this Canopy Plan regards all trees within the urban environment to be significant due to the urban liveability contributions they make and calls on the whole community to assist in achieving the City’s Urban Forest
aspirations of increased tree canopy cover.
Page | 7
Canopy Plan 2019 - 2024
In 2016 the City commissioned further canopy mapping utilising highly accurate aerial mounted scanning equipment (Light Detection and Ranging (LiDAR)) to map and classify the City’s tree canopy cover in 2D and 3D (Figure 2).
This identified that the City in 2016 had an average canopy cover of 15.3% exclusive of canopy cover and land area of Perth Airport and 12.5% inclusive.
This mapping also enabled the City to identify canopy coverage for each of its Local Planning Scheme zones.
Figure 2: Pseudo coloured image of LiDAR data showing 3D height of trees and canopy cover
Canopy Cover Decline
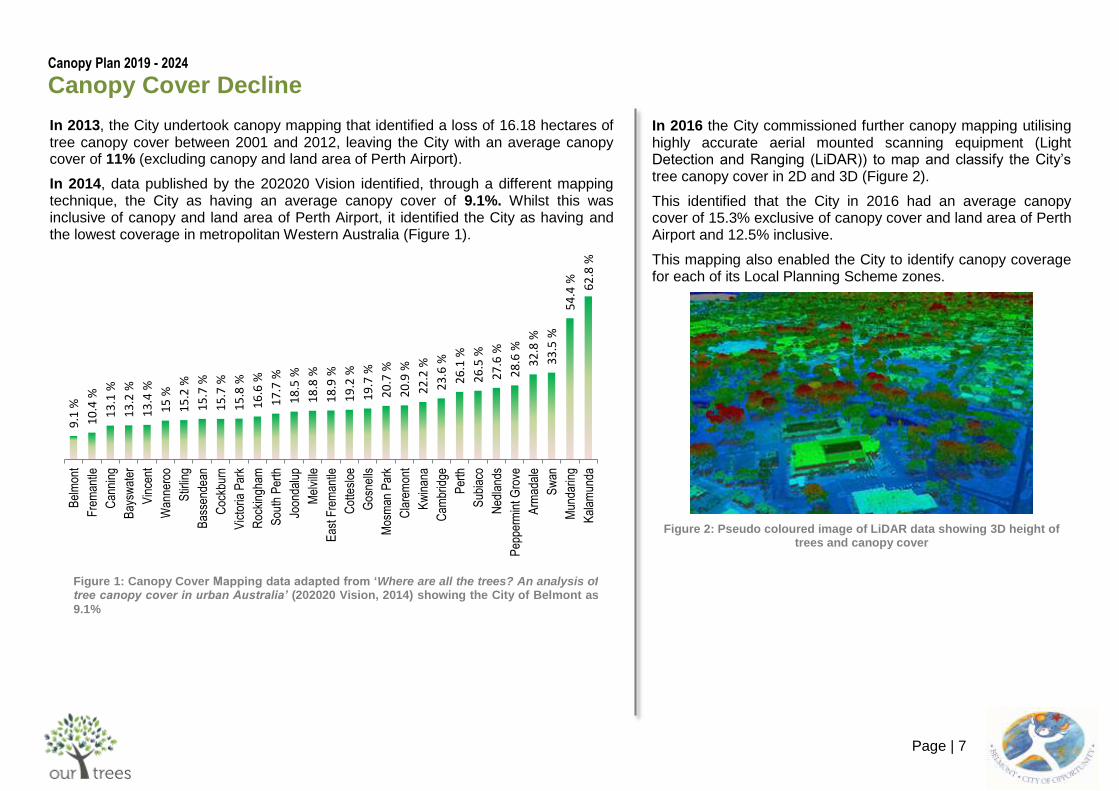
In 2013, the City undertook canopy mapping that identified a loss of 16.18 hectares of tree canopy cover between 2001 and 2012, leaving the City with an average canopy cover of 11% (excluding canopy and land area of Perth Airport).
In 2014, data published by the 202020 Vision identified, through a different mapping technique, the City as having an average canopy cover of 9.1%. Whilst this was inclusive of canopy and land area of Perth Airport, it identified the City as having and the lowest coverage in metropolitan Western Australia (Figure 1).
9.1
%
10
.4 %
13
.1 %
13
.2 %
13
.4 %
15
%
15
.2 %
15
.7 %
15
.7 %
15
.8 %
16
.6 %
17
.7 %
18
.5 %
18
.8 %
18
.9 %
19
.2 %
19
.7 %
20
.7 %
20
.9 %
22
.2 %
23
.6 %
26
.1 %
26
.5 %
27
.6 %
28
.6 %
32
.8 %
33
.5 %
54
.4 %
62
.8 %
Bel
mon
t
Fre
man
tle
Can
ning
Bay
swat
er
Vin
cent
Wan
nero
o
Stir
ling
Bas
send
ean
Coc
kbur
n
Vic
toria
Par
k
Roc
king
ham
Sou
th P
erth
Joon
dalu
p
Mel
ville
Eas
t Fre
man
tle
Cot
tesl
oe
Gos
nells
Mos
man
Par
k
Cla
rem
ont
Kw
inan
a
Cam
brid
ge
Per
th
Sub
iaco
Ned
land
s
Pep
perm
int G
rove
Arm
adal
e
Sw
an
Mun
darin
g
Kal
amun
daFigure 1: Canopy Cover Mapping data adapted from ‘Where are all the trees? An analysis of tree canopy cover in urban Australia’ (202020 Vision, 2014) showing the City of Belmont as
9.1%

Page | 8
Canopy Plan 2019 -2024
Where do Trees Grow?
Highly accurate canopy cover mapping has enabled the City to interpret canopy cover data by land area and land use, predominantly those identified within the Local Planning Scheme.
With accurate data, the City can report on tree canopy for:
The private lands that make up 44% of the City’s total land area
Parks and recreational reserves (7% of the City’s land area) and
Road reserves (15% of the City’s land area) (Figure 3)
The remaining 34% of the City’s total land area is situated within and under the management of Perth Airport.
Having this information can assist in identifying areas that require action for canopy retention and provision and gives the City a better understanding of canopy cover to inform targets.
Where are all the Trees?
Mapping has identified that:
42% of the City’s tree canopy exists within lands that are privately owned, for example, within residential, commercial or industrial properties
21% exists within parks and recreational reserves and
17% exists within road reserves meaning there is more canopy within private lands than within parks and streetscapes combined (Figure 4).
Whilst tree canopy exists within Perth Airport lands (20%), it is completely under the control of Perth Airport Pty Ltd and the majority is within airport operational areas. The City works closely with Perth Airport on local environmental issues, canopy cover being one of them. However, for reporting within this plan, the City has decided to focus on where people live – their neighbourhoods and suburbs.
Road Reserves: 17%
Private
Lands: 42%
Parks and recreational
reserves: 21%
Perth Airport Land: 20%
Private Lands: 44%
Parks and recreational reserves: 7%
Perth Airport
Land: 34%
Road Reserves: 15%
Figure 3: categorised land areas of the City of Belmont
Figure 4: Canopy cover categorised
by land area type

Page | 9
Canopy Plan 2019 -2024
How does my suburb rate?
Canopy mapping assisted the City in identifying areas of low and high canopy provision. At a suburb level, Ascot has the greatest
canopy coverage of approximately 21.5%, followed by Rivervale (18.7%), Cloverdale (17.8%), Redcliffe (17.1%),
Belmont (14%) and then Kewdale (9.8%).
Both Kewdale and Belmont are likely the lowest in canopy cover due to the presence of Kewdale Industrial
area and Belmont Business Park, which are both economic hubs and due to the nature of land uses tend to be
characterised by low tree canopy cover. These statistics are also similar to other local governments with similar
land uses.
Consistent with the breakdown of canopy provision within the different land areas identified in the
previous section (“Where are all the Trees?”), the majority of tree canopy cover within each suburb
exists within privately owned lands, excluding Ascot where the majority is within Parks and
Recreational Areas. For example, 64% of the tree canopy in the suburb of Belmont is within lands
that are privately owned (see Figure 5).
Figure 5: Canopy cover by land type per suburb

Page | 10
Canopy Plan 2019 -2024
What about where people live, work and recreate?
Whilst it is important to focus on the average canopy cover across the City and each suburb, it is more important to focus on areas where people live, work
and recreate. This is where the focus changes from canopy cover provision (e.g. hectares) to canopy coverage (%) and is categorised into the main land
uses identified within the City’s Local Planning Scheme No.15. This helps to inform and illustrate how much of the land area is under tree canopy. For
example, we know that the majority of tree canopy cover is within private lands however, the average canopy coverage for residential lands is just 17.2%
whilst parks within the City have at least 32.4% canopy coverage on average.
Table 1: Canopy Cover per land use
Land Use under LPS No.15 Ascot Belmont Cloverdale Kewdale Redcliffe Rivervale City of Belmont
Civic And Cultural - 31.3% 37.2% 52.5% - - 45.6%
Commercial - 4.8% 4.1% 3.1% - 9.7% 5.2%
Industrial - - - 2.7% 6.7% - 3.2%
Mixed Business - 5.0% - - - 4.2% 4.9%
Mixed Use 13.3% 8.3% 2.2% - 10.8% 10.9% 11.7%
MRS Parks and Recreation 42.1% 44.3% - - - 73.7% 52.3%
Parks And Recreation 36.1% 35.3% 24.6% 28.9% 32.4% 32.0% 32.4%
Place Of Public Assembly 8.0% 5.3% 16.8% 17.0% 15.0% 13.5% 9.5%
Public Purposes - 24.2% 29.8% 21.4% 14.7% 25.2% 24.1%
Public Purposes MRS - 26.8% - - - - 29.1%
Railways - - - 3.4% - - 3.4%
Residential 25.8% 17.4% 17.3% 15.4% 16.2% 17.7% 17.2%
Residential & Stables 18.0% - - - - - 18.0%
Service Station - 1.4% - 0.4% 1.4% 5.1% 1.7%
Town Centre - - 5.0% - - - 5.0%

Page | 11
Canopy Plan 2019 -2024
Growing the Canopy Plan: Engagement and Consultation To arrive at the actions within this Plan, the City undertook consultation with Council, City employees and its community as immediately effected stakeholders.
Councillor and Staff Workshops
In November 2016 the City undertook internal consultation with Council to initially gauge Urban Forest actions as suggest by the elected members. The workshop focused on 1) Planting Opportunities 2) Policy and 3) Partnerships
PLANTING OPPORTUNITIES POLICY PARTNERSHIPS
Increase planting within streetscapes, car parks and public open spaces
Identify planting opportunities on schools and other lands not owned or managed by the City
Stakeholder MoUs for canopy creation
Canopy retention or replacement requirements in Development Applications
Better street tree protection guidelines and requirements during development
Incentivising the provision of trees in developments
Better built form and planning mechanisms i.e. green plot ratios that support tree growth
The employment of a compliance officer
Engage with the community and develop partnerships
Partner with schools for tree planting within school grounds
Partner with the commercial and industrial precincts to increase canopy
Water Corporation to plant on large areas of Water Corporation land
Greater partnerships with residents and the City of Belmont Community
Partnerships with State Government to progress policy and urban canopy provision
Following the Councillor workshop, the City undertook consultation with City staff to identify potential strategic focus areas and actions based on feedback.
This identified 9 strategic objective areas to assign actions to.
1. Build internal capacity to incorporate the urban forest into City Policy, processes and procedures with a view to retain, create and enhance canopy cover across the City.
2. Develop partnerships to support canopy retention, creation and enhancement. 3. Retain, create and enhance canopy coverage in City projects and programs. 4. Develop and support innovative policy for canopy retention and creation within public open
space, residential, commercial and light industrial planning and design.
5. Support research to consider risks surrounding Urban Heat Island Effect, future climate scenarios, canopy provision and canopy loss.
6. Increase community awareness through ongoing promotion of the importance of the urban forest and the delivery of educational programs.
7. Support research to maximise canopy protection, retention and creation. 8. Support local biodiversity values through canopy management.
9. Manage, monitor, review and report on the effectiveness of this plan.

Page | 12
Canopy Plan 2019 -2024
This built sufficient information to engage the community in conversation about what could be done by the City and the community at home (Our House),
within the streetscape (Our Street) and within the neighbourhood (Our Neighbourhood) and then to see how the community valued trees (Our Trees).
These four themes were discussed during a community workshop to further identify Canopy Plan actions and to achieve improved urban forestry outcomes.
The table below summarises the feedback from the community workshop.
What did the community say? Key Question Summary of Responses
OUR TREES
What do you need to increase trees on your property? (44 Responses)
• What can the City of Belmont do? • Do you know what trees to plant? • What is stopping you from planting trees on
your property? • What kind of tree would you like to plant? • Where would you plant a tree on your
property?
More natives: nine responses related to increasing native trees with a particular focus on the Black Cockatoo
Seven responses related to needing an increase in knowledge on urban trees.
Six people were content with their own contributions and stated things like “Doubt I could do more”, “I can’t fit (plant) any more trees”, “I’ve already got mature trees”
Responses suggested incentivising trees: offering of various incentives, physical support, free trees for properties and not just street trees.
OUR STREET
How could trees on your verges and
streetscapes be improved? (46 Responses)
• What streets need more trees? • What types of trees does your street need? • How do you see the number of trees on your
street increasing?
Road reserves were identified for further planting, including Belmont Ave, Hardey Rd, Epsom Ave, Leake St, Fauntleroy Ave and more.
Native street trees were preferred and respondents wanted to see more Australian natives to support local fauna
Respondents noted that more trees were needed in general – “additional trees per house, not just one” and plant a variety of trees
Respondents asked for better streetscape design to develop tree corridors which also includes shrubs, designing houses around existing trees and changing crossover standards to prevent/ reduce tree removal
The community felt developers should be prevented from clearing the land before building and should be made accountable for clearing trees.
Respondents said the City of Belmont needed to support the community more; undergrounding power and providing garden programs to mentor residents.

Page | 13
Canopy Plan 2019 -2024
Key Question Summary of Responses
OUR NEIGHBOURHOOD
Thinking big, where can a significant number of
trees be planted? (42 Responses)
• What Public Open Space areas need more trees?
• How do you see the number of trees in your neighbourhood increasing?
• What types of trees does your neighbourhood need?
Respondents noted that trees could potentially be planted along highways, the Belmont Forum, schools, and parks
The commercial and business areas were identified as opportunities for planting based on the existing low level of trees
Respondents noted that parks, council owned land and streetscapes could include further planting to become community gardens with fruit trees and amenities
Again respondents noted that they wanted to see more native trees being planted to support the Black Cockatoo
Trees in development needed to be addressed to ensure a particular number of trees are planted when they are removed or the canopy compensated. Respondents also noted that further work was needed to get people to design around trees, incorporate better planting spaces and to underground power.
Respondents reemphasised that further incentive programs such as sponsoring a tree or programs to provide support.
OUR TREES
What do you value most about trees? (50
Responses)
• What do trees in Belmont mean to you? • What is your favourite tree or park in
Belmont? • Do you have any innovative ideas for
increasing tree canopy in residential planning and design?
• What information do you need to increase and improve trees in Belmont?
People do value trees but generally in parks such as Tomato Lake, Copley Park and areas which are already well
forested
Respondents commented that trees provide shade, clean air, beauty and support local fauna
Respondents understood that trees also contribute to health and wellbeing by cooling the environment, bringing people into the streetscape and providing shade however wanted to see more in relation to fruit trees within parks and the streetscape
Some respondents were brave enough to admit they need help by admitting that they need further education on tree
health, tree management and tree selection
Respondents represented an overwhelming cry for more trees by stating that developments should consider underground parking to allow room for landscaping and that the City should provide a free large tree for every home owner
Some respondents also noted that they were concerned about security and shade over solar systems and gardens
The City has since consolidated the information from the three different workshops into a list of actions to grow and form the Canopy Plan. Each action is an opportunity to increase urban forest management efforts, increase canopy cover, further support ecosystem services and values and assist the community in contributing to a better urban forest.

Page | 14
Canopy Plan 2019 -2024
BASE
TARGET
IMPLEMENT MONITOR
Goals, Targets and Reporting The City set an initial target in 2014 to return canopy cover to equivalent levels of 2001 (back to 11% canopy cover). This was due to the canopy mapping showing that canopy had declined and therefore the goal was to replace the lost 16 hectares. More accurate mapping in 2016 provided conflicting data that now requires revised goals and targets to be considered. To do this, the City plans on identifying more appropriate and achievable canopy cover levels, opportunities for growth and techniques or programs to increase canopy cover. The Urban Forest Policy has also committed to no net loss of canopy on City lands (streetscapes and public open spaces).
During the first year of the Canopy Plan the City will develop goals and targets that are more specific to where people live, work and recreate (Action 8.5). The objective is to ensure that goals and targets drive the growth of the urban forest to achieve outcomes appropriate for the many different land uses that make up the City.
Therefore, the implementation of the Canopy Plan will follow four main principles:
Understanding where we are at a baseline and how land use affects canopy
Converting this information into targets that are achievable and tangible
Implementing actions and programs to work towards these targets and
Monitor the changes and positive impacts we are having and report to Council and the community.
For example, during the first year the City plans to ‘identify any correlation between residential housing density and canopy cover and model future density
(minimum through to maximum development levels) and likely impact on canopy’ (Action 8.1) and ‘undertake research on future urban heat island impacts
on the City’ (Action 8.4). Using this information the City can then ‘establish precinct and City level canopy targets based on future housing density and
canopy creation/loss’ (Action 8.5), implement actions within the Canopy Plan to address this and then
‘undertake aerial mapping (i.e. LiDAR mapping) of the City’s canopy cover to monitor change’ (Action
10.1).
All actions within this Plan will be reported on in relation to their
outcomes and how they influence other actions and ultimately increase
and grow the urban forest.
Annual reporting will be through quantifying the impacts of the
Canopy Plan’s implementation and communicated to stakeholders.

Canopy Plan 2019 -2024
Page | 15
Canopy Plan Strategic Objectives and Actions
1. Build internal capacity to incorporate the urban forest into City policy, processes and procedures with a view to retain, create and enhance canopy cover across the City
# Action Measurable Indicators/ Outcomes Responsible Area Internal Partnerships/
Key Contributors
External Partnerships/ Key
Contributors
Commencement Year
Duration
201
9/2
02
0
202
0/2
02
1
202
1/2
02
2
202
2/2
02
3
202
3/2
02
4
1.1 Through the development of internal information session/events, engage staff and increase awareness, understanding and involvement in the City's urban forest.
Staff are engaged and included in the Canopy Plan's implementation and outcomes are reported.
Parks, Leisure & Environment
OLT 2019/2020 Ongoing
1.2 Attend DCG meetings to assist in the incorporation of Urban Forest and Canopy Plan strategic objectives.
DCG is attended 4 times a month at 2 hours on average including follow-up.
Parks, Leisure & Environment
DCG 2019/2020 Ongoing
1.3 As required, table of updates prepared for IF meetings and attend IF meetings to provide presentations on UFS/Canopy Plan updates.
Reports presented to required stakeholders
Parks, Leisure & Environment
OLT 2019/2020 Ongoing
1.4 Develop internal multi-disciplinary UFS team to monitor and implement Canopy Plan actions.
TOR developed and advisory group/committee formed to assist UFS implementation across the organisation, with six meetings a year.
Parks, Leisure & Environment
OLT, Infrastructure Development, Planning, Marketing, Community Placemaking, Works
2019/2020 Ongoing
2. Develop partnerships to support canopy retention, creation and enhancement
# Action Measurable Indicators/ Outcomes Responsible Area Internal Partnerships/
Key Contributors
External Partnerships/ Key
Contributors
Commencement Year
Duration
20
19
/20
20
20
20
/20
21
20
21
/20
22
20
22
/20
23
20
23
/20
24
2.1 Identify and participate in Tertiary institution, Cooperative Research Centres (CRCs), WALGA and Government lead projects/partnerships
Ongoing participation in CRCs, WALGA, HIA, Green Space Alliance or Government lead projects. Partner with the CRC for Water Sensitive Cities. Partner with the CRC for Low Carbon Living. Action includes attending forums, workshops and training opportunities.
Parks, Leisure & Environment
EMRC, WALGA, HIA, Green Space Alliance, CRC for Water Sensitive Cities, CRC for Low Carbon Living
2019/2020 Ongoing
2.2 Continue to attend a Local Government Parks Managers Forum to share information related to the urban forest.
Local Government UF Group formed (i.e. similar to Sustainability Officers Network Group, Perth Metro Parks Managers, Natural Area Management Network etc.).
Parks, Leisure & Environment
WALGA and other LGAs. Local Government 2019/2020 Ongoing
2.3 Work with the State Government and Western Power to increase the undergrounding power program
Powerlines in low canopy areas are relocated underground to enable the development of tree canopy cover. Cost estimates and business cases are developed to support the undergrounding of power
Parks, Leisure & Environment
Design and Assets, Works
Western Power 2020/2021 Ongoing
Canopy Plan 2019 -2024
Page | 16
3. Retain, create and enhance canopy coverage in City projects and programs
# Action Measurable Indicators/ Outcomes Responsible Area Internal Partnerships/
Key Contributors
External Partnerships/ Key
Contributors
Commencement Year
Duration
201
9/2
02
0
202
0/2
02
1
202
1/2
02
2
202
2/2
02
3
202
3/2
02
4
3.1 Continue to identify and implement planting opportunities to increase canopy on City managed land.
Established/identified planting locations and types (forms) e.g. roads, verges, islands, parks and develop precinct/Streetscape masterplans.
Parks, Leisure & Environment
Infrastructure Development, Planning Services, Property & Economic Development
Main Roads WA 2019/2020 Ongoing
3.2 Through best practice guidelines, embed canopy retention and enhancement into City project design and management.
Designs incorporate strategies/alternative materials and techniques to ensure success of tree planting deployed.
Parks, Leisure & Environment
Infrastructure Development, Works, Building Services
2020/2021 Year 2
3.3 Develop contractor management procedures and guidelines for the retention and protection of trees.
Contract management procedures documented.
Parks, Leisure & Environment
Infrastructure Development
2021/2022 Year 3
3.4 Develop a canopy loss compensation model to
contribute towards local canopy preservation and enhancement projects.
Canopy Compensation Model developed and is continuously reviewed and adjusted with contemporary industry practice and canopy loss projections.
Parks, Leisure & Environment
Planning Universities 2020/2021 Year 2
4. Develop and support innovative policy for canopy retention and creation within public open space, residential, commercial and light industrial planning and design
# Action Measurable Indicators/ Outcomes Responsible Area Internal Partnerships/
Key Contributors
External Partnerships/ Key
Contributors
Commencement Year
Duration
201
9/2
02
0
202
0/2
02
1
202
1/2
02
2
202
2/2
02
3
202
3/2
02
4
4.1 Identify industry best practice to support policy development.
Technical manuals and information consolidated to inform Policy development and review.
Parks, Leisure & Environment
Planning 2019/2020 Ongoing
4.2 Develop policy for retention and/or incorporation of trees during City projects.
City of Belmont Urban Forest Policy developed and endorsed. Completed with OCM endorsement of Urban Forest Policy 2019
Parks, Leisure & Environment
Works, Infrastructure Development, Building Services
Completed
4.3 Modify the existing local planning framework to include requirements for tree canopy protection and provision and to provide a head of power.
i. Prepare a scheme amendment to require canopy trees in new commercial and industrial car parks. ii. Prepare a local planning policy that stipulates minimum landscaping requirements. iii. Prepare a local planning policy that provides for the protection of street trees. iv. Review engineering policies and guidelines for crossovers and tree retention. v. Prepare a scheme amendment that uses the existing split coding provisions to incentivise the retention and provision of tree canopy. vi. Identify trees for protection through a Tree Preservation Order.
Planning Parks, Leisure & Environment
WAPC, Department of Planning, Lands and Heritage
2019/2020 Ongoing

Canopy Plan 2019 -2024
Page | 17
# Action Measurable Indicators/ Outcomes Responsible Area Internal Partnerships/
Key Contributors
External Partnerships/ Key
Contributors
Commencement Year
Duration
201
9/2
02
0
202
0/2
02
1
202
1/2
02
2
202
2/2
02
3
202
3/2
02
4
4.4 Support the City’s Environment and Sustainability Strategy to promote and contribute to verge enhancement projects that incorporate a street tree.
Verge treatment guidelines revised to include compulsory street tree planting for approved verge enhancements. Guidelines updated as per Environment and Sustainability Strategy Action 1.1. City to fund project for one year; Year 2. Water Corporation funding application in Year 3 for 50% of project funds.
Parks, Leisure & Environment
Infrastructure Development
2020/2021 2020/2021 and ongoing
4.5 Advocate for the incorporation of tree canopy protection and retention measures in State planning legislation and policy.
i. Writing to politicians and the Western Australian Planning Commission requesting action. ii. Providing submissions on the advertising of any policies. iii. being involved in any working group iv. Support research to identify and promote best-practice principles for canopy retention and provision in development (literature review, case studies).
Planning Parks, Leisure & Environment
2019/2020 Ongoing
4.6 Explore innovative opportunities to include requirements for tree canopy protection and provision within the future local planning framework.
City of Belmont Tree Canopy Planning Policy developed and endorsed.
Planning Parks, Leisure & Environment, Infrastructure Development, Building Services
(Planning to advise) 2019/2020 Ongoing
5. Support research to consider risks surrounding Urban Heat Island Effect, future climate scenarios, canopy provision and canopy loss
# Action Measurable Indicators/ Outcomes Responsible Area Internal Partnerships/ Key Contributors
External Partnerships/ Key Contributors
Commencement Year
Duration
201
9/2
02
0
202
0/2
02
1
202
1/2
02
2
202
2/2
02
3
202
3/2
02
4
5.1 Maintain a database on limb failure and actions taken.
IntraMaps Tree Inventory is maintained with limb failure information, including limbs in public open spaces.
Parks, Leisure & Environment
GIS 2020/2021 2020/2021 and ongoing
5.2 Improve the integration of tree risk management into CoB corporate risk assessment process.
Corporate Risk Assessment Process includes risks associated with trees/ reviewed.
Business Continuity & Risk
Parks, Leisure & Environment
2022/2023 Year 3 - Year 4
5.3 Support and undertake research on future urban heat island impacts on the City.
City specific information is gained on urban heat island impacts on the City's community.
Parks, Leisure & Environment
Community Place Making, Business Continuity & Risk, Property and Economic Development, Planning
Research Partners, EMRC, 'Switch Your Thinking'
2020/2021 Year 2 - Year 3

Canopy Plan 2019 -2024
Page | 18
6. Increase community awareness through ongoing promotion of the importance of the urban forest and the delivery of educational programs
# Action Measurable Indicators/ Outcomes Responsible Area Internal Partnerships/ Key Contributors
External Partnerships/ Key Contributors
Commencement Year
Duration
201
9/2
02
0
202
0/2
02
1
202
1/2
02
2
202
2/2
02
3
202
3/2
02
4
6.1 Develop Urban Forest "Toolkit" to communicate and consolidate information.
Online toolkit available where all information is stored.
Marketing Parks, Leisure & Environment
2019/2020 Ongoing
6.2 Engage the community and mitigate negative perceptions through a communication plan and circulation of information materials annually via UFS displays at City events.
Information and messaging regarding tree values is consistent and consolidated (i.e. on CoB websites). Communicate CoB’s current approach to tree management, maintenance and risk assessment/mitigation. Develop a UF information pack/series to raise awareness - Information series developed including trees in planning, values, tree retention, canopy etc. Urban Forest is incorporated into City events (Autumn River Fest (8hrs), Avon Descent Family Fun Day (8hrs), Big Light Out (projection on trees)) etc. Co-branded advertisements and information is circulated to the community demonstrating the value of the urban forest.
Marketing Parks, Leisure & Environment
2019/2020 Ongoing
6.3 Develop and refine the principle of the ‘right tree, right place, right reason’ decision making process.
Principle documented and included within a review of the Urban Forest Policy.
Parks, Leisure & Environment
2022/2023 Year 4
6.4 Document and communicate City's (Street) Tree Management.
Public version of street tree plan developed.
Parks, Leisure & Environment
2019/2020 Year 1
6.5 Engage and inform Business Community to increase awareness and involvement through attending events, forums and meetings.
Urban Forest is incorporated into Business briefings or Belmont Business Advisory Group meetings and Business Talk newsletters. Belmont and Tree specific brochures developed and printed
Parks, Leisure & Environment
Property and Economic Development.
Business Community 2022/2023 Year 3 - Year 4
6.6 Develop school education tools, involve students in school tree planting days and support schools in delivering Urban Forest focused activities
Australian Curriculum, Assessment and Reporting Authority (ACARA) based resources, School based projects and Schools for trees day project.
Parks, Leisure & Environment
EMRC CoB Schools. 2020/2021 Year 2 - Year 3
6.7 Develop landscape concepts that incorporate trees with the view to inform planting on private property.
Landscape Concepts published and guidelines updated as per Environment and Sustainability Strategy Action 1.1.
Parks, Leisure & Environment
Infrastructure Development, Marketing
2020/2021 Year 2 and ongoing

Canopy Plan 2019 -2024
Page | 19
7. Support research to maximise canopy protection, retention and creation
# Action Measurable Indicators/ Outcomes Responsible Area Internal Partnerships/ Key Contributors
External Partnerships/ Key Contributors
Commencement Year
Duration
201
9/2
02
0
202
0/2
02
1
202
1/2
02
2
202
2/2
02
3
202
3/2
02
4
7.1 Identify correlations between residential housing density, typology and canopy cover and model future density (minimum through to maximum development levels) and the likely impact on canopy.
The loss of canopy cover is forecast based on development. Informs Action 7.5
Parks, Leisure & Environment
Planning, Property and Economic Development
Research Partners 2020/2021 Year 2 - Year 3
7.2 Support the delivery/or partner to deliver pilot projects to trial canopy retention and provision practices.
City Projects identified and delivered with trial canopy retention and provision technologies.
Parks, Leisure & Environment
Property and Economic Development
Project Partner 2020/2021 Year 2 and ongoing
7.3 Undertake a Community Attitudinal survey (integrate with current CoB surveys or partner with other LGA's via WALGA/EMRC) to establish an understanding of community perception regarding trees (clarify CoB’s understanding of its community’s position).
Community perception survey implemented.
Parks, Leisure & Environment
Community Place Making Research Partners 2021/2022 Year 3
7.4 Model canopy integration within the urban environment and establish precinct and city level canopy targets.
Using information from Actions within Strategic Objective Areas 4 and 7: • canopy decline or development is modelled and targets produced • options to increase canopy cover are identified to achieve targets
Parks, Leisure & Environment
Planning Research Partners 2021/2022 2022/2023 after Action 7.1
8. Support local biodiversity values through canopy management
# Action Measurable Indicators/ Outcomes Responsible Area Internal Partnerships/ Key Contributors
External Partnerships/ Key Contributors
Commencement Year
Duration
201
9/2
02
0
202
0/2
02
1
202
1/2
02
2
202
2/2
02
3
202
3/2
02
4
8.1 Support Australian and Western Australian native trees within streetscapes and public open spaces.
Australian and WA native trees are promoted within streetscape selection tools and planted in POS.
Parks, Leisure & Environment
2019/2020 Ongoing
8.2 Review the City’s Street Tree Plan to prioritise the protection of street trees that have been identified as existing or potential foraging trees for the endangered Carnaby’s Black Cockatoo (Calyptorhynchus latirostris), Baudin’s Cockatoo (C. baudinii) and the vulnerable Red-tailed Black Cockatoo (C. banksii naso).
Street Tree Plan is reviewed to incorporate Black Cockatoo information and retention of indicator species.
Parks, Leisure & Environment
Department of Biodiversity, Conservation and Attractions
2020/2021 Year 2

Canopy Plan 2019 -2024
Page | 20
9. Manage, monitor, review and report on the effectiveness of this plan
# Action Measurable Indicators/ Outcomes Responsible Area Internal Partnerships/ Key Contributors
External Partnerships/ Key Contributors
Commencement Year
Duration
20
19
/20
20
202
0/2
02
1
202
1/2
02
2
202
2/2
02
3
202
3/2
02
4
9.1 Undertake aerial mapping (i.e. LiDAR mapping) of the City’s canopy cover to monitor change.
Ongoing mapping of canopy cover is undertaken at the end of the Plan and updated in Intramaps.
Parks, Leisure & Environment
GIS & Mapping 2023/2024 Year 5
9.2 Continue the management of trees using Intramaps and mobile technologies.
Street Trees are managed using Intramaps to inform planting plans and work plans. Street Tree management incorporates mobile technologies. Existing IntraMaps database is expanded to include risk assessment of trees in event spaces of public open spaces (i.e. Garvey Park, Tomato Lake, Faulkner Civic Precinct)
Parks, Leisure & Environment
GIS & Mapping 2019/2020 Ongoing
9.3 Quantify the impacts and outcomes of the Canopy Plan’s implementation and communicate outcomes to stakeholders, including canopy retention, increase and community engagement.
Measurable outcomes of Canopy Plan implementation are communicated back to stakeholders within the Annual Report.
Parks, Leisure & Environment
Marketing 2019/2020 Ongoing
9.4 Identify, review and revise corporate documents and policy in response to the outcomes of the Canopy Plan and incorporate Urban Forest objectives and considerations.
UFS and Canopy Plan are reviewed to incorporate outcomes from actions.
Parks, Leisure & Environment
UFS Internal Team 2019/2020 Ongoing

Canopy Plan 2019 -2024
`
Page | 21
The Benefits of Canopy Cover
Trees and vegetation in the urban environment provide more to the community than just visual amenity or places for the birds to live. The urban forest as a whole provides numerous beneficial services that are essential to enhancing our quality of life in urban environments including financial, ecological, and health and wellbeing contributions (Plant & Sipe, 2016; Rotherham, 2017; Mullaney, Lucke, & Trueman, 2015; Lo, Byrne, & Jim, 2017).
As cities grow and increase in density, vegetation is often removed and those natural factors that contribute to healthier urban lifestyles are removed with it. This is unfortunately to our detriment as areas of low vegetation cover are also associated with conditions that are detrimental to our health; poor air quality, increased heat, low social cohesion, lower levels of physical activity and therefore lower levels of reported personal health and wellbeing (de Vries, Verheij, Groenewegen, & Spreeuwenberg, 2003). This is not surprising as numerous studies have demonstrated a direct correlation between low levels of tree canopy cover and increased heat related illnesses and deaths, cardiovascular diseases, respiratory disorders, cancers, diabetes, mental health, and general lower levels of personal wellbeing (i.e. higher reports of stress, anxiety, depression) (Banzhaf & Kollai, 2015; Daily, 1997; Lowe, Boulange, & Giles-Corti, 2014). The only way to address this is to grow and retain an urban forest that contributes to the liveability of the local area, making it a healthier place to live.

Canopy Plan 2019 - 2024
`
Page | 22
Provision of Ecosystem Services
The relationship between urban forests and ecosystem services has increased substantially in the last decade, particularly in response to how urban trees and vegetation support our well-being in highly urbanised environments (Banzhaf & Kollai, 2015). The urban forest provides multiple ecosystem services, such as carbon abatement and air filtration, cooling effects, retained stormwater volumes, and improves soil quality in permeable spaces allowing the infiltration of rainwater into aquifers.
These are urban processes or services that would otherwise have to be artificially provided (i.e. mechanical filtration and remediation) at a cost. However, given that these occur naturally through the presence of trees and an urban forest, they can be provided ‘free’. The inherent nature of green infrastructure and urban forests can support and improve urban liveability, improve our wellbeing and quality of life and assist us in being adaptive communities able to response to climate change (Lo, Byrne, & Jim, 2017; Lin, Meyers, Beaty, & Barnett, 2016).
Stormwater Mitigation and Improved Quality
As rainwater falls over a tree’s canopy, the drops that fall onto leaves and other woody parts of the tree are temporarily retained, which delays the time stormwater would take to reach the ground. In areas with high canopy coverage, consisting of densely foliated trees, up to 60% of rainfall could be retained by the canopy cover, resulting in a notable delay in stormwater flows and lower risk of flooding (Kuehle, Hathaway, & Tirpak, 2017). This delay does not always reduce stormwater runoff however it can support other stormwater processes, such as slowing water conveyance (drainage), supporting infiltration time on permeable surfaces and can assist in cleaning rainwater of any particles. Even during heavy rainfall events, water can be retained by the tree’s canopy cover, allowing the underlying surfaces to cope with the rainfall event.
Research on the relationship between rainfall and the urban forest has indicated that the Narrow-leaved Black Peppermint (Eucalyptus nicholli) could retain up to 44% of the rainfall received during a moderate to heavy rainfall event (14 mm/hr) (Livesley, Baudinette, & Glover, 2014). In summary, retaining canopy cover reduces the risk of flooding, assists water in infiltrating permeable surfaces (rather than pooling and flowing off), cleanses the water of particulates and increases groundwater recharge.
Ecosystem Services
Processes whereby natural environments sustain and fulfil
human life e.g. cooling, filtering air, shade.
(Daily, 1997)

Canopy Plan 2019 - 2024
`
Page | 23
Reducing the Urban Heat Island Effect
The Urban Heat Island Effect (UHIE) is recognised globally as a significant urban environmental issue which negatively impacts living standards, infrastructure and human wellbeing and can result in deaths. Areas of high urban development and low green cover act as ‘heat islands’ that absorb heat during the day and then release this at night. Research has demonstrated that ambient air temperatures in built up areas can be 4°C to 15°C warmer than surrounding vegetated or ‘greener’ areas (Coutts, White, Tapper, Beringer, & Livesley, 2016; Mohajerani, Bakaric, & Jeffrey-Bailey, 2017; Sharifi & Lehmann, 2014). This retained heat also contributes to increases air pollution levels, energy consumption, and puts excess pressure on other services such as energy production and water supply. The most alarming thing about the UHIE is that it can even result in deaths (Chen, et al., 2015).
In Australia, between 1844 and 2010, heat waves resulted in an estimated 5,332 fatalities identifying that heat waves result in more deaths than any other natural hazard (Figure 7) (Chen, et al., 2014; PwC, 2011; Australian Government, 2013; Coates, Haynes, O’Brien, McAneney, & Oliveira, 2014; Herbst, et al., 2014). However, with strategically placed trees and vegetation, ambient urban heat at a suburb scale can be reduced by between 0.5°C to 2°C, reducing the risk to health (Coutts, White, Tapper, Beringer, & Livesley, 2016; Chen, et al., 2015). At more localised areas (i.e. street scapes or areas directly under trees) median temperatures can even be reduced by to up to 20°C just by incorporating shade and irrigated greenery (Thom, Coutts, Broadbent, & Tapper, 2016).
Figure 7: Decadal Heat Related Deaths 1844-2010 (Adapted from Coates, Haynes, O’Brien, McAneney, & Oliveira, 2014)
The human body has an internal temperature of around 37°C; prolonged exposure to temperatures around this can result in heat stress
In extreme heat events where the internal body temperature exceeds 40.5°C, organ failure occurs and can result in death
During a single heat wave event in 2009, South Australia recorded 58 heat related deaths whilst Victoria estimated 374, totalling 432 additional heat related deaths
During 2010, an extreme heat event in Russia claimed 55,000 lives
Heat is indifferent; the most vulnerable people during heatwaves are the elderly, infants, those who are unable to find refuge from the heat (e.g. lower socioeconomic groups and marginalised communities) and those with existing medical conditions making them more susceptible to heat (i.e. heart conditions, medications) (Xiao1, et al., 2017; Coates, Haynes, O’Brien, McAneney, & Oliveira, 2014).
Heat is otherwise a silent killer.
5 48 61
112 80
483 535
827
616
803
384
285 276
164
56 65
532
Figure 6: the Urban Heat Island Effect in diagrammatic
form

Canopy Plan 2019 - 2024
`
Page | 24
Positive Public Health Contributions
City lifestyles can present health risk and hazards that are directly associated with urban living, including:
Higher risk of cardiovascular and pulmonary diseases caused by transport-generated urban air pollution
More frequent heat-related illnesses, such as heat-stress and heat stroke and heat-related deaths caused by urban heat
Higher frequencies of obesity and diabetes as a result of increasingly sedentary lifestyles
Higher rates of mental health related illnesses and
Higher frequencies of traffic related mortality and morbidity.
Whilst the relationship between the urban forest and heat related illnesses in urbanised areas has been well documented (PwC, 2011; Chen, et al., 2015; Gasparrini, et al., 2015), the relationship between the urban forest and physical activity (or inactivity) and traffic injuries is less so.
Urban forest research has identified that the burden on the public health system can be reduced by beautifying and greening streetscapes to create spaces that are enjoyable to exercise in, are safe to cycle in (from both heat and traffic) and which still perform as a trafficable areas. Safer roads are streetscapes that support multiple uses through appropriate design. They support and allow physical activity by reducing the exposure to heat (namely due to having shaded walkways) and still perform as trafficable areas for vehicles and cyclists (WHO, 2019).
Streetscapes that have high levels of green coverage and trees are also ‘calmer and safer’ and therefore minimise the risk of vehicle related injury and fatality. Whilst trees are often accused as being “traffic hazards”, there is increasing research that supports the use of trees and vegetation in streetscapes as traffic calming devices and a means to increase driver awareness and road edge definition (Treese, Koeser, Fitzpatrick, Olexa, & Allen, 2018).
As trees add scale, amenity and even some uncertainty to the streetscape, drivers tend to pay more attention to what is happening on and around the road (awareness and edge definition) rather than focused
on the road alone (Naderi, Kewo, & Maghelal, 2008). This means drivers are more alert and are able to maintain speed
whilst being prepared for changes in road conditions, such as a ball bouncing out into the road, cyclists, or pedestrians. This is particularly important in suburban streets with residential frontages and where pedestrian activity is more likely.
Figure 8 - Well-placed street trees help define the road edge and therefore assist in deterring speeding traffic, making the streetscape safer
3.2 Million Global deaths
caused by inactivity and
Diabetes
1.8 Million Global deaths
caused by Traffic
Accidents
Active communities within safer
streetscapes can reduce these
statistics

Canopy Plan 2019 - 2024
`
Page | 25
Improved Air Quality
Urban areas are intrinsically prone to low levels of air quality; vehicle emissions from road networks, industrial emissions, particulates released from the combustion of fuels or from construction and more. As we inhale this daily, this inevitably results in an increased risk of cardiovascular and respiratory illnesses or diseases and therefore increased hospitalisation and poor health (Lowe, Boulange, & Giles-Corti, 2014; Dean & Green, 2018). However, research has demonstrated that increased tree density and strategically placed trees in urban areas can significantly improve air quality. Densely foliated canopy can act to reduce airborne pollutants, including gas based pollutants, such as biogenic volatile organic compounds (VOCs), nitrogen dioxide (NO2), and ozone (O3), and particulate pollutants such as dust or chemical particulates (Raoa, Georgea, Rosenstielb, Shandasc, & Dinno, 2014; EPA Victoria, 2018; Grote, et al., 2016). How does this work? Two ways: 1) trees actually breathe through their foliage and when they do it causes moisture to form on the surface of the leaf which can attract and hold dust particles (deposition) and 2) trees take in gases (stomatal uptake) in the process of photosynthesis (Grote, et al., 2016). Therefore, trees, particularly broad-leaved species, can improve air quality and therefore our respiratory health.
Sense of Place – Human and Ecological Connections and Drivers
Initially, the concept of urban forestry can be confusing; what does ‘urban forest’ mean and how does it affect me? This is a fair question and one that urban forest managers need to keep in the forefront of forestry management. However, if we define the urban forest by only considering it as the presence of trees in the urban area, we exclude a much more important component, the human connection.
The human connection relates to how people define, envisage and materialise the urban forest over time and how they identify with the urban forest to create a sense of place, community and attachment (Jones & Instone, 2016). The ecological connection is our understanding for the need of ecology in the urban environment in order to maintain our wellbeing (Wynveen, Schneider, & Arnberger, 2018). If we ignore the human and ecological connection we risk ‘disconnecting’ or losing the relationship between people and the urban forest (Endreny, et al., 2017; Moffat, 2016). Therefore urban forest managers need to engage with their communities to better understand the relationships between the urban forest and those who live in it.
Understanding the community’s cultural dynamics, expectations, relationship and values is an important factor in the decision process of urban forest management; it assists in identifying drivers to help grow an urban forest and helps to understand better the drivers of urban deforestation (Steenberg, 2018). Research on the connection between people and the urban forest has also indicated that higher levels of socioeconomics and education and lifestyle preferences were strongly correlated with the presence of greenspace and canopy cover (where the term “leafier suburb” is coined) (Lowry, Baker, & Ramsey, 2012). The relationship between the urban forest and people or trees in the urban environment therefore is multifaceted and complex, however is critical in achieving urban forest objectives.
Pollutants and
particulates
Park trees can reduce nitrogen dioxide by 1% to 21%, airborne particulates by 9% and sulfur dioxide by 2.6% (Yin, et al., 2011)
Canopy Plan 2019 - 2024
`
Page | 26
Economic Contributions
Healthy urban forests also have the potential to reduce costs, support economic income, and improve property values. In the absence of ecosystem services that naturally support urban wellbeing, economic expenditure is required. The majority of funding often being invested in public health and the prevention of pollution is generally associated with urban heat, poor air quality and low levels of public health (Banzhaf & Kollai, 2015; Endreny, et al., 2017; Cinderby & Bagwell, 2017). However, the most frequent expense borne onto the community is the purchase of electricity for the cooling of homes and workplaces.
On very hot days, people tend to utilise cooling appliances (air conditioners and fans) and for every increase of 1°C in the daily maximum temperature, peak energy demand can increase by 2-4%, placing increased pressure on infrastructure and even resulting in blackouts and load shedding. Studies have demonstrated that shade trees and irrigated vegetation in suburban areas can reduce seasonal cooling requirements by between 26% and 100%, therefore reducing energy demand and personal expenditure (Donovan & Butry, 2009; Chen, et al., 2015). However, the economic consequences of low vegetation and associated urban issues are not just isolated to individuals or households.
Heatwaves, urban heat and associated health complications also have the potential to significantly affect workforces, businesses and therefore the economy. Research has found that, on very hot days and during heatwaves, labour productivity (i.e. industrial, out-door workforces) risks being impacted, either through employees taking personal leave and claiming heat related illnesses (absenteeism), or presenting to work but with low performance/efficiency (presenteeism). The consequence of this however is an estimated loss of $8.76 billion per annum from the Australian economy (Zander, Botzen, Oppermann, Kjellstrom, & Garnett, 2015). However, business and industry can reduce these losses through appropriate inclement weather policies, providing alternative work arrangements to assist during extreme heat events, and supporting their local environment to be ‘greener and cooler’ (Zander, Mathew, & Garnett, 2018). Local governments and communities also share in the responsibility of ensuring that commercial or industrial precincts are
adequately shaded and access to greenspace is provided to
reduce the impacts of heat.
Research has demonstrated that not only are workforces healthier and happier in ‘greener environments’ due to better wellbeing (reduced downtime, sick leave and lost working hours), consumers are more likely to choose retail or service areas that are ‘greener’ or more attractive to visit. Furthermore, businesses who connect, interface or adjoin green space can reinforce their own environmental or sustainability images which may otherwise return better economic positions (Cinderby & Bagwell, 2017).
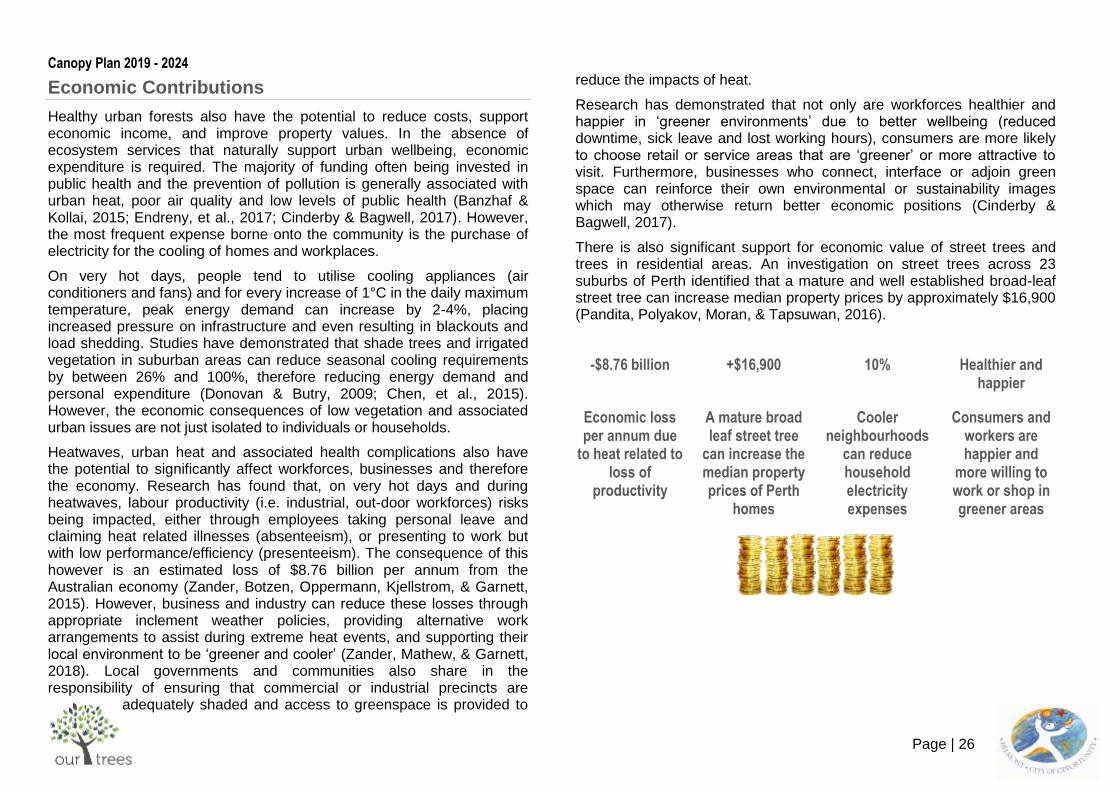
There is also significant support for economic value of street trees and trees in residential areas. An investigation on street trees across 23 suburbs of Perth identified that a mature and well established broad-leaf street tree can increase median property prices by approximately $16,900 (Pandita, Polyakov, Moran, & Tapsuwan, 2016).
-$8.76 billion +$16,900 10% Healthier and happier
Economic loss per annum due
to heat related to loss of
productivity
A mature broad leaf street tree
can increase the median property prices of Perth
homes
Cooler neighbourhoods
can reduce household electricity expenses
Consumers and workers are happier and
more willing to work or shop in greener areas

Canopy Plan 2019 - 2024
`
Page | 27
References
202020 Vision. (2014). Where are all the trees? An analysis of tree canopy cover in urban Australia. Horticulture Innovation Australia Ltd.
Arnfield, A. (2003). Two Decades of Urban Climate Research (Part 1). International Journal of Climatology, 23, 1-26.
Australian Bureau of Statistics. (2008). ABS 3222.0 Population projections, Australia 2006 to 2101. Retrieved from Australian Bureau of Statistics: http://www.abs.gov.au/Ausstats/[email protected]/Latestproducts/3222.0
Australian Government. (2013). State of Australian Cities 2013. Canberra: Major Urban Unit. Department of Infrastructure and Transport.
Banzhaf, E., & Kollai, H. (2015). Monitoring the Urban Tree Cover for Urban Ecosystem Services – The Case of Leipzig, Germany. 36th International Symposium on Remote Sensing of Environment (pp. 301-305). Berlin, Germany: Department Urban and Environmental Sociology, Working Group Geomatics.
Brunner, j., & Cozens, P. (2013). 'Where Have All the Trees Gone?' Urban Consolidation and the Demise of UrbanVegetation: A Case Study from Western Australia. Planning Practice & Research, 28(2), 231-255.
Chen, D., Thatcher, M., Wang, X., Barnett, G., Kachenko, A., & Prince, R. (2015). Summer cooling potential of urban vegetation—a modeling study for Melbourne, Australia. AIMS Environmental Science, 2(3), 648-667.
Chen, D., Wang, X., Thatcher, M., Barnett, G., Kachenko, A., & Prince, R. (2014). Urban vegetation for reducing heat related mortality. Environmental Pollution, 192, 275-284.
Cinderby, S., & Bagwell, S. (2017). Exploring the co‐benefits of urban green infrastructure improvements for businesses and workers’ wellbeing. Area (London 1969), 50(1), 126-136.
Cleugh, H. A., & Oke, T. R. (1986). ‘Suburban-rural energy balance comparisons in summer for Vancouver, B.C’. Boundary-Layer Meteorology, 36(4), 351-369.
Coates, L., Haynes, K., O’Brien, J., McAneney, J., & Oliveira, F. D. (2014). Exploring 167 years of vulnerability: An examination of extreme heat events in Australia 1844–2010. Environmental Science & Policy, 42, 33-44.
Coutts, A. M., White, E. C., Tapper, N. J., Beringer, J., & Livesley, S. J. (2016). Temperature and human thermal comfort effects of street trees across three contrasting street canyon environments. Theor Appl Climatol, 124, 55-68.
Daily, G. (1997). Nature’s Services: Societal Dependence of Natural Ecosystems. Washington, DC: Island Press.
Day, S. D., Wiseman, E. P., Dickinson, S. B., & Harris, R. J. (2010, July). Contemporary Concepts of Root System Architecture. Arboriculture & Urban Forestry, 36(4), 149-159.
de Vries, S., Verheij, R. A., Groenewegen, P. P., & Spreeuwenberg, P. (2003). Natural Environments—Healthy Environments? An Exploratory Analysis of the Relationship between Greenspace and Health. Environment and Planning A, 35(10), 1717-1731.
Dean, A., & Green, D. (2018). Climate change, air pollution and human health in Sydney, Australia: A review of the literature. Environmental Research Letters, 13(5).
Department of Infrastructure & Regional Development. (2013, July). State of Australian Cities 2013. Retrieved October 14, 2016, from Department of Infrastructure & Regional Development: https://infrastructure.gov.au/infrastructure/pab/soac/files/2013_00_INFRA1782_MCU_SOAC_FULL_WEB_FA.pdf
Department of Planning. (2015). Perth and Peel @ 3.5 million (DRAFT). Perth: Department of Planning; Western Australian Planning Commission.
Dobbs, C., Kendal, D., & Nitschke, C. (2013). The effects of land tenure and land use on the urban forest structure and composition of Melbourne. Urban Forestry & Urban Greening, 12(4).
Donovan, G. H., & Butry, D. T. (2009). The value of shade: Estimating the effect of urban trees on summertime electricity use. Energy and Buildingers, 41, 662-668.
Endreny, T., Santagata, R., Perna, A., De Stefano, C., Rallo, R., & Ulgiati, S. (2017). Implementing and managing urban forests: A much needed conservation strategy to increase ecosystem services and urban wellbeing. Ecological Modelling, 360, 328-335.
EPA Victoria. (2018, August 27). PM2.5 particles in air. Retrieved March 20, 2019, from Environment Protection Authority Victoria: https://www.epa.vic.gov.au/your-environment/air/air-pollution/pm25-particles-in-air
Gasparrini, A., Guo, Y., Hashizume, M., Kinney, P. L., Petkova, E. P., Lavigne, E., . . . Armstrong, B. G. (2015, November). Temporal Variation in Heat–Mortality Associations: A Multicountry Study. Environmental Health Perspectives, 123(11), 1200-1207. Retrieved from https://ehp.niehs.nih.gov/doi/pdf/10.1289/ehp.1409070
Grote, R., Samson, R., Alonso, R., Amorim, J. H., Cariñanos, P., Churkina, G., . . . Calfapietra, C. (2016). Functional traits of urban trees: air pollution mitigation potential. The Ecological Society of America, 14(10), 543-550.
Herbst, J., Byard, R. W., Charlwood, C., Heath, K. J., Winskog, C., & Langlois, N. E. (2014). Heat-related deaths in Adelaide, South Australia: Review of the literature and case findings - An Australian perspective. Journal of Forensic and Legal Medicine, 22, 73-78.
Hill, E., Dorfman, J., & Kramer, E. (2009). Evaluating the impact of government land use policies on tree canopycoverage. Land Use Policy, 27(2), 407-414.
Jones, R., & Instone, L. (2016). Becoming-urban, becoming-forest: a historical geography of urban forest projects in Australia. Geographical Research, 54(4), 433-445.
Killicoat, P., Puzo, E., & Stringer, R. (2002). The Economic Value of Urban Trees: Estimating the Benefits and Costs of Street Trees in Adelaide. TREENET Street Tree Symposium 2002.
Kirkpatrick, J., Davison, A., & Daniels, G. (2012). Resident attitudes towards trees influence the planting and removal of different types of trees in eastern Australian cities. Landscape and Urban Planning, 107, 147-158.

Canopy Plan 2019 - 2024
`
Page | 28
Kuehle, E., Hathaway, J., & Tirpak, A. (2017). Quantifying the benefits of urban forest systems as a component of the green infrastructure stormwater treatment network. Ecohydrology.
Leadbeter, P. (2014). Legal Protection of Urban Trees: An Essential Measure to Assist in the Reduction of the Urban Heat Island Effect. The Australasian Journal of Natural Resources Law and Policy, 17(1), 75-100.
Lin, B. B., Meyers, J., Beaty, R. M., & Barnett, G. B. (2016). Urban Green Infrastructure Impacts on Climate Regulation Services in Sydney, Australia. Sustainability, 8(8), 788-801.
Livesley, S., Baudinette, B., & Glover, D. (2014). Rainfall interception and stem flow by eucalypt street trees – The impacts of canopy density and bark type. Urban Forestry & Urban Greening, 13, 192-197.
Lo, A. Y., Byrne, A. J., & Jim, C. Y. (2017). How climate change perception is reshaping attitudes towards the functional benefits of urban trees and green space: Lessons from Hong Kong. Urban Forestry & Urban Greening, 23, 74-83.
Loughnan, M. E., Nicholls, N., & Tapper, N. (2009). Hot Spots Project: a spatial vulnerability analysis of urban populations to extreme heat events. Melbourne: Victorian Department of Health. Retrieved from http://www.health.vic.gov.au/environment/heatwave/agencies/research_pubs.htm
Lowe, M., Boulange, C., & Giles-Corti, B. (2014). Urban design and health: Progress to date and future challenges. Health Promotion Journal of Australia, 25(1), 14-18.
Lowry, J. H., Baker, M. E., & Ramsey, R. D. (2012). Determinants of urban tree canopy in residential neighborhoods: Household characteristics, urban form, and the geophysical landscape. Urban Ecosystems, 15(1), 247-266. doi:DOI 10.1007/s11252-011-0185-4
McPherson, E. (1997). ‘Cooling urban heat islands with sustainable landscapes’, in RH Platt, Rowntree, R.A. & Muick, P.C. (ed.), The ecological city: preserving and restoring urban biodiversity. Amherst: University of Masachusetts Press.
Moffat, A. J. (2016). Communicating the benefits of urban trees: A critical review. Arboricultural Journal, 38(2), 64-82.
Mohajerani, A., Bakaric, J., & Jeffrey-Bailey, T. (2017). The urban heat island effect, its causes, and mitigation, with reference to the thermal properties of asphalt concrete. Journal of Environmental Management, 197, 522-538.
Moore, G. M. (2006). Urban Trees and the Global Greenhouse. TREENET. Australia.
Mullaney, J., Lucke, T., & Trueman, S. J. (2015). A review of benefits and challenges in growing street trees in paved urban environments. Landscape and Urban Planning, 134, 157-166.
Naderi, J. R., Kewo, B. S., & Maghelal, P. (2008). The Street Tree Effect and Driver Safety. ITE Journal On The Web, 69-73.
Pandit, R., Polyakov, M., Tapsuwanc, S., & Morand, T. (2013). The effect of street trees on property value in Perth, Western Australia. Landscape and Urban Planning, 110, 134-142.
Pandita, R., Polyakov, M., Moran, T., & Tapsuwan, S. (2016). The effect of street trees on property value in Perth, Western Australia. Landscape and Urban Planning, 110, 134-142.
Retrieved from http://dx.doi.org/10.1016/j.landurbplan.2012.11.00
Perkins-Kirkpatrick, S. E., White, C. J., Alexander, L. V., Argüeso, D., Boschat, G., Cowan, T., . . . Purich, A. (2016). Natural hazards in australia: Heatwaves. Climatic Change, 139(1), 101-114. doi:doi:10.1007/s10584-016-1650-0
Plant, L., & Sipe, N. (2016). Adapting and applying evidence gathering techniques for planning and investment in street trees: A case study from Brisbane, Australia. Urban Forestry & Urban Greening, 19, 79-87.
PwC. (2011). Protecting Human Health and Safety During Severe and Extreme Heat Events. Pricewaterhouse Coopers Australia.
Raoa, M., Georgea, L. A., Rosenstielb, T. N., Shandasc, V., & Dinno, A. (2014). Assessing the relationship among urban trees, nitrogen dioxide, and respiratory health. Environmental Pollution, 194, 96-104.
Rotherham, I. D. (2017). The importance of urban trees & their care. Arboricultural Journal, 39(3), 143.
Sharifi, E., & Lehmann, S. (2014). Comparative Analysis of Surface Urban Heat Island Effect in Central Sydney. Journal of Sustainable Development, 7(3), 23-34.
Steenberg, J. W. (2018). People or place? An exploration of social and ecological drivers of urban forest species composition. Urban Ecosystems, 21(5), 887-901. Retrieved from https://doi.org/10.1007/s11252-018-0764-8
Thom, J. K., Coutts, A. M., Broadbent, A. M., & Tapper, N. J. (2016). The influence of increasing tree cover on mean radiant temperature across a mixed development suburb in Adelaide, Australia. Urban Forestry & Urban Greening, 20, 233-242.
Treese, J. V., Koeser, A. K., Fitzpatrick, G. E., Olexa, M. T., & Allen, E. J. (2018). Drivers’ risk perception of roadside trees. Arboricultural Journal, 40(3), 153-161. Retrieved from https://doi.org/10.1080/03071375.2018.1487661
Valentine, L. E., & Stock, W. (2008). Food Resources of Carnaby's Black-Cockatoo (Calyptorhynchus latrirostris) in the Gnangara Sustainability Strategy Study Area. Report to Forest Products Commission, Edith Cown University and the Department of Environment and Conservation.
Voogt, J. (2002). ‘Urban heat island’, in I Douglas (ed.), Encyclopedia of global environmental change,. New York: John Wiley and Sons.
Watson, J. (2015). Preserving Tomorrow's Urban Trees with Financial Incentives: The choice of a new (tree) generation. Alternative, 40(4), 261-265.
Western Power. (2016). Know your clearance zones. Retrieved from Wester Power: Know your clearance zones
WHO. (2019). World Health Organization. Retrieved January 4, 2019, from Health and sustainable development; Cities and Urban Health: https://www.who.int/sustainable-development/cities/health-risks/about/en/
Wynveen, C. J., Schneider, I. E., & Arnberger, A. (2018). The Context of Place: Issues Measuring Place Attachment across Urban Forest Contexts. Journal of Forestry, 116(4), 367-373.

Canopy Plan 2019 - 2024
`
Page | 29
Xiao1, J., Spicer, T., Jian, L., Yun, G. Y., Shao, C., Nairn, J., . . . Weeramanthri, T. S. (2017). Variation in Population Vulnerability to heat Wave in Western australia. Frontiers in Public Health, 5(64). doi:10.3389/fpubh.2017.00064
Yin, S., Shen, Z., Zhou, P., Zou, X., Che, S., & Wang, W. (2011). Quantifying air pollution attenuation within urban parks: An experimental approach in Shanghai, China. Environmental Pollution, 159(9), 2155-2163.
Zander, K. K., Botzen, W. J., Oppermann, E., Kjellstrom, T., & Garnett, S. T. (2015). Heat stress causes substantial labour productivity loss in Australia. Nature Climate Change, 5, 647-652. doi:10.1038/nclimate2623
Zander, K. K., Mathew, S., & Garnett, S. T. (2018). Exploring Heat Stress Relief Measures among the Australian Labour Force. International Journal of Environmental Research and Public Health, 15(401). doi:doi:10.3390/ijerph15030401