CancerLocator: non-invasive cancer diagnosis and tissue-of ...
12
METHOD Open Access CancerLocator: non-invasive cancer diagnosis and tissue-of-origin prediction using methylation profiles of cell-free DNA Shuli Kang 1 , Qingjiao Li 1 , Quan Chen 1 , Yonggang Zhou 2,3 , Stacy Park 4 , Gina Lee 5 , Brandon Grimes 4 , Kostyantyn Krysan 4 , Min Yu 6 , Wei Wang 7 , Frank Alber 1 , Fengzhu Sun 1 , Steven M. Dubinett 2,8,9,10* , Wenyuan Li 2* and Xianghong Jasmine Zhou 2,3* Abstract We propose a probabilistic method, CancerLocator, which exploits the diagnostic potential of cell-free DNA by determining not only the presence but also the location of tumors. CancerLocator simultaneously infers the proportions and the tissue-of-origin of tumor-derived cell-free DNA in a blood sample using genome-wide DNA methylation data. CancerLocator outperforms two established multi-class classification methods on simulations and real data, even with the low proportion of tumor-derived DNA in the cell-free DNA scenarios. CancerLocator also achieves promising results on patient plasma samples with low DNA methylation sequencing coverage. Keywords: Cell-free DNA, Liquid biopsy, DNA methylation, Next-generation sequencing, Cancer diagnosis Background Cancer cells often display aberrant DNA methylation pat- terns, such as hypermethylation of the promoter regions of tumor suppressor genes and pervasive hypomethylation of intergenic regions [1–5]. Therefore, DNA methylation is an ideal target for cancer diagnosis in clinical practice [6, 7]. Hyper/hypomethylated tumor DNA fragments can be released into the bloodstream via cell apoptosis or ne- crosis, where they become part of the circulating cell-free DNA (cfDNA) in plasma [8]. The non-invasive nature of cfDNA methylation profiling makes it a promising strat- egy for general cancer screening. Current research on cfDNA-based, non-invasive cancer detection approaches falls into two classes: the development of biomarkers for a single specific cancer type; and the characterization of circulating tumor DNA (ctDNA) for general cancer detection, without trying to predict specific cancer types. In recent years, several studies have reported plasma methylation biomarkers for different types of cancers [9–15]. Usually, the differentially methylated marker genes are identified by comparing methylation profile data from patients with a certain cancer type to healthy controls. However, these specific biomarkers are of lim- ited use for general cancer screening. Ideally, as a non- invasive early screening tool, a liquid biopsy test should be able to detect many types of cancers and provide tumor location information for further specific clinical investigation. Several approaches have recently been proposed for non-invasive universal cancer detection. These methods do not rely on detecting biomarkers specific to certain tumor types. Instead, they utilize properties of ctDNA that are common to various cancer types, such as copy number aberration (CNA) [16–19], pervasive hypomethylation [19], and DNA integrity [16, 20]. None of these methods can predict the tissue of origin after the detection of ctDNA. The nature of the liquid biopsy introduces a new challenge, in that the cancer type can remain unknown even when there is strong signal of tumor-derived DNA fragments in the blood. Hence, a positive result from a li- quid biopsy would call for comprehensive follow-up inves- tigations using clinical, analytical, and radiological tools to identify the tumor location. Considering that non-invasive screening is usually the first step of cancer diagnosis, and could be associated with a fair ratio of false positives, such * Correspondence: [email protected]; [email protected]; [email protected] 2 Department of Pathology and Laboratory Medicine, David Geffen School of Medicine, University of California at Los Angeles, Los Angeles, CA 90095, USA Full list of author information is available at the end of the article © The Author(s). 2017 Open Access This article is distributed under the terms of the Creative Commons Attribution 4.0 International License (http://creativecommons.org/licenses/by/4.0/), which permits unrestricted use, distribution, and reproduction in any medium, provided you give appropriate credit to the original author(s) and the source, provide a link to the Creative Commons license, and indicate if changes were made. The Creative Commons Public Domain Dedication waiver (http://creativecommons.org/publicdomain/zero/1.0/) applies to the data made available in this article, unless otherwise stated. Kang et al. Genome Biology (2017) 18:53 DOI 10.1186/s13059-017-1191-5
Transcript of CancerLocator: non-invasive cancer diagnosis and tissue-of ...

METHOD Open Access
CancerLocator: non-invasive cancerdiagnosis and tissue-of-origin predictionusing methylation profiles of cell-free DNAShuli Kang1, Qingjiao Li1, Quan Chen1, Yonggang Zhou2,3, Stacy Park4, Gina Lee5, Brandon Grimes4,Kostyantyn Krysan4, Min Yu6, Wei Wang7, Frank Alber1, Fengzhu Sun1, Steven M. Dubinett2,8,9,10*, Wenyuan Li2*
and Xianghong Jasmine Zhou2,3*
Abstract
We propose a probabilistic method, CancerLocator, which exploits the diagnostic potential of cell-free DNA bydetermining not only the presence but also the location of tumors. CancerLocator simultaneously infers theproportions and the tissue-of-origin of tumor-derived cell-free DNA in a blood sample using genome-wide DNAmethylation data. CancerLocator outperforms two established multi-class classification methods on simulations andreal data, even with the low proportion of tumor-derived DNA in the cell-free DNA scenarios. CancerLocator alsoachieves promising results on patient plasma samples with low DNA methylation sequencing coverage.
Keywords: Cell-free DNA, Liquid biopsy, DNA methylation, Next-generation sequencing, Cancer diagnosis
BackgroundCancer cells often display aberrant DNA methylation pat-terns, such as hypermethylation of the promoter regionsof tumor suppressor genes and pervasive hypomethylationof intergenic regions [1–5]. Therefore, DNA methylationis an ideal target for cancer diagnosis in clinical practice[6, 7]. Hyper/hypomethylated tumor DNA fragments canbe released into the bloodstream via cell apoptosis or ne-crosis, where they become part of the circulating cell-freeDNA (cfDNA) in plasma [8]. The non-invasive nature ofcfDNA methylation profiling makes it a promising strat-egy for general cancer screening. Current research oncfDNA-based, non-invasive cancer detection approachesfalls into two classes: the development of biomarkers for asingle specific cancer type; and the characterization ofcirculating tumor DNA (ctDNA) for general cancerdetection, without trying to predict specific cancer types.In recent years, several studies have reported plasma
methylation biomarkers for different types of cancers[9–15]. Usually, the differentially methylated marker
genes are identified by comparing methylation profiledata from patients with a certain cancer type to healthycontrols. However, these specific biomarkers are of lim-ited use for general cancer screening. Ideally, as a non-invasive early screening tool, a liquid biopsy test shouldbe able to detect many types of cancers and providetumor location information for further specific clinicalinvestigation.Several approaches have recently been proposed for
non-invasive universal cancer detection. These methodsdo not rely on detecting biomarkers specific to certaintumor types. Instead, they utilize properties of ctDNA thatare common to various cancer types, such as copy numberaberration (CNA) [16–19], pervasive hypomethylation[19], and DNA integrity [16, 20]. None of these methodscan predict the tissue of origin after the detection ofctDNA. The nature of the liquid biopsy introduces a newchallenge, in that the cancer type can remain unknowneven when there is strong signal of tumor-derived DNAfragments in the blood. Hence, a positive result from a li-quid biopsy would call for comprehensive follow-up inves-tigations using clinical, analytical, and radiological tools toidentify the tumor location. Considering that non-invasivescreening is usually the first step of cancer diagnosis, andcould be associated with a fair ratio of false positives, such
* Correspondence: [email protected];[email protected]; [email protected] of Pathology and Laboratory Medicine, David Geffen School ofMedicine, University of California at Los Angeles, Los Angeles, CA 90095, USAFull list of author information is available at the end of the article
© The Author(s). 2017 Open Access This article is distributed under the terms of the Creative Commons Attribution 4.0International License (http://creativecommons.org/licenses/by/4.0/), which permits unrestricted use, distribution, andreproduction in any medium, provided you give appropriate credit to the original author(s) and the source, provide a link tothe Creative Commons license, and indicate if changes were made. The Creative Commons Public Domain Dedication waiver(http://creativecommons.org/publicdomain/zero/1.0/) applies to the data made available in this article, unless otherwise stated.
Kang et al. Genome Biology (2017) 18:53 DOI 10.1186/s13059-017-1191-5

follow-up would be likely to increase the burden on themedical care system. A few recent studies have proposedusing cfDNA methylation [21, 22] or nucleosome foot-printing [23] to partially alleviate this problem. For ex-ample, Sun et al. [21] estimated the proportions ofcfDNAs contributed by different tissues and showed thatan abnormally high proportion of cfDNA from a specifictissue can indicate the possibility of a tumor in that tissue.Their approach, though promising, has not been devel-oped into a systematic method capable of supportingclinical diagnosis applications. Lehmann-Werman et al.[22] tested the same rationale to diagnose pancreatic can-cer, but fewer than 50% of the pancreatic cancer patientsdemonstrated a substantial excess of pancreas-originatedcfDNA fragments compared with healthy subjects.Snyder et al. [23] pioneered an approach of using nu-cleosome footprinting to predict the tissue of origin ofthe cfDNA, but its power in cancer diagnosis has notbeen demonstrated because only five plasma sampleswith high ctDNA burden were selected for testing from44 late-stage cancer patients, and less than one half hadtheir cancer types correctly predicted.In summary, no existing cfDNA-based method can
simultaneously detect cancer and predict its tissue oforigin. We are therefore proposing a novel method,CancerLocator, that simultaneously infers the proportion
and tissue of origin of ctDNA in a blood sample usinggenome-wide DNA methylation data. As shown in Fig. 1,from the vast amount of The Cancer Genome Atlas(TCGA) DNA methylation data, we first learn theinformative features of different cancer types. We thenmodel the plasma cfDNAs in cancer patients as amixture of normal cfDNAs and ctDNAs. Finally, giventhe genome-wide methylation profile derived from thecfDNA sample of an unknown patient, CancerLocatoruses the informative features to estimate the fraction ofctDNAs in the plasma and the likelihood that the de-tected ctDNAs come from each tumor type. Based onthose likelihoods, CancerLocator makes the final deci-sion on whether the patient has tumors and, if yes, thelocations of the primary tumor.We first evaluated our method on simulation data
with known ctDNA fractions. The results show thatCancerLocator can achieve a Pearson’s correlation coef-ficient (PCC) of 0.975 between the predicted and trueproportions of ctDNA, and an error rate of 0.078 forthe classification of non-cancer and tumor types. More-over, our method far outperforms two well-establishedmulti-class classification methods in both simulationsand using real data, especially when the proportion oftumor-derived DNAs in the cfDNAs is lower than 50%(which is usually the case in reality). We note that
Fig. 1 Flowchart of CancerLocator. Step 1: A set of solid tumor samples and healthy plasma samples collected from public databases and theliterature are used to select the informative features (CpG clusters) that can differentiate tumor types or healthy plasma samples. Then the betadistributions of the methylation levels of these selected features for each tumor type or healthy plasma samples are learnt. Step 2: Given aplasma sample, the methylation profile of its cfDNAs is measured by whole-genome bisulfite sequencing, which is then used as input for cancerlocation prediction by CancerLocator
Kang et al. Genome Biology (2017) 18:53 Page 2 of 12

CancerLocator achieved promising results on patientplasma samples, including around two-thirds of cancersamples collected from early-stage cancer patients.
Results and discussionCancerLocator: a probabilistic method for predictingctDNA burden and source tissueA flowchart of CancerLocator is illustrated in Fig. 1. Thefirst step is to identify the informative features of normalplasma and multiple tumor types from the massive TCGAdatabase. We chose to focus on seven cancer types fromthe five organs (breast, colon, kidney, liver, and lung) thatare generally regarded as having a high level of bloodcirculation. Given the plasma cfDNA methylation profileof a patient, the next step is to use those informativefeatures to simultaneously detect cancer and locate itstissue of origin.In the first step, we select CpG clusters (our procedure
for grouping CpG sites into CpG clusters is described inthe “Methods” section) as features if their methylationrange (MR) is sufficiently large. MR is defined as the rangeof average methylation levels observed in healthy plasmaand different solid tumor tissues. We selected K =14,429CpG clusters (features), on average1, whose MRs are noless than the cutoff 0.25. For each CpG cluster, we takeinto account its variation across individuals by modelingthe distribution of methylation levels for the same tumortype (or normal plasma) as a beta distribution, Beta(αt, βt).The index t = 0 represents normal plasma, while t = 1, …,T represents a tumor type.In the second step, we use the selected features and
their beta distributions to deconvolute a patient’s plasmacfDNA into the normal plasma cfDNA distribution and,possibly, a solid tumor DNA distribution. We have de-signed a probabilistic method that can simultaneouslyinfer the burden and the tissue of origin of the ctDNA.Intuitively, if the likelihood of presence for any tumortype is not substantially higher than the likelihood thatthe observed distribution is the normal background, thepatient is predicted to not have cancer. Otherwise, thepatient is predicted to have the tumor type that is associ-ated with the highest likelihood.Inferring the ctDNA burden θ and tumor type t can
be formulated as a maximum-likelihood estimation(MLE) problem, where the likelihood function isexpressed as the product of the likelihoods of each CpGcluster, assuming that all of the K selected CpG clustersare independent of each other. This is expressed as:
L θ; tjXð Þ ¼Y
k¼1
KL θ; tjxkð Þ
where xk denotes the methylation level of CpG site k ina cancer patient’s cfDNA. In principle, xk is a linearcombination of the DNA methylation levels in normal
plasma and solid tumor type t with fraction θ. Thenormal and tumor components of the methylation aredenoted by vk and uk, respectively (Fig. 2). That is,x = (1 − θ)v + θu (for simplicity, we remove the sub-script k from these notations). As mentioned earlier,since v and u follow the Beta distributions Beta(α0, β0) andBeta(αt, βt), respectively, x follows the distribution ψ(θ, t),which is calculated as the convolution of two Beta distri-butions Beta(α0, β0) and Beta(αt, βt).Because cfDNA has low abundance in plasma, its
methylation is usually measured by sequencing-basedmethods. Therefore, the methylation level xk of CpG clus-ter k can be derived from two numbers, nk and mk, denot-ing the total number of cytosines and the number ofmethylated cytosines mapped to CpG cluster k. We canmodel mk and nk together as a binomial distribution mk ~Binomial(nk, xk), and rewrite the likelihood function as:
L θ; tjM;Nð Þ ¼Y
k¼1
KL θ; tjmk ; nkð Þ
Detailed formulas and our optimization method aregiven in the “Methods” section.For a comprehensive performance evaluation, we com-
pare our method with two popular multi-class classification
Fig. 2 The mixture model of methylation level (x) in a patient’splasma cfDNA for different burdens of ctDNAs from the tumor typet. Note that x, u, and v are the methylation levels of a single CpGcluster k in cfDNA, solid tumor, and normal plasma, respectively
Kang et al. Genome Biology (2017) 18:53 Page 3 of 12

methods, i.e., random forest (RF) and support vector ma-chine (SVM), on two types of data: simulation data withknown ctDNA burden and real data with known clinical in-formation but unknown ctDNA burden. The evaluationson simulation data and real data are complementary inassessing the predictive power of the methods.
Prediction performance on the simulation dataThe methylation data of a simulated plasma cfDNAsample is generated by computationally mixing the en-tire methylation profiles of a normal plasma cfDNAsample and a solid tumor sample (breast, colon, kidney,liver, or lung tumors), at a variety of ctDNA burdens (θvalues). This strategy can make the simulated methyla-tion data keep the potential correlations of methylationvalues between CpG clusters in real data. In addition, tomake the simulated data more realistic, we add tumorCNA events at pre-defined probabilities (10, 30, and50% across all CpG clusters). The procedure for thesesimulations is described in the “Methods” section. Theresults described below are on the simulation datasetwith 30% CNA events—simulation data with other CNAevent rates yield similar results (Additional file 1).We first assessed CancerLocator for ctDNA burden
predictions. Overall, the predicted and true proportionsof ctDNA are highly consistent, with a Pearson’s correl-ation coefficient of 0.975 and a root mean squared errorof 0.074, respectively. As shown in Fig. 3a, the majority(87.9%) of the estimated ctDNA burdens for the normalsamples are not more than 0.02, and none of them isgreater than 0.05. Please note that whether a sample isfrom a cancer patient or not is determined by the opti-mal likelihood calculated in the prediction model, notthe predicted ctDNA burden. The prediction results forthe simulated cancer patient plasma samples are shownin Fig. 3b. We found that the variance of the predictedctDNA burdens (θ) increases with the true θ, implyingthat the burden estimation becomes less precise whenpatients are in mid- or late cancer stages. This resultcould be partially explained by the fact that tumor het-erogeneity may be higher in late stage tumor samples,which introduces the complexity of ctDNA burden pre-diction. However, this increased variance does not hurtthe performance of the cancer detection because the pre-dicted θ is still much higher than the normal background.Indeed, as demonstrated in Fig. 3b and below in the can-cer type prediction results, the tissue origin of ctDNA be-comes more distinguishable with high ctDNA burden,despite the increased variance in ctDNA prediction.We then compared the performance of CancerLocator
to that of two popular multi-class classification methods(RF and SVM; refer to Additional file 1 for details) usingthe same set of simulated samples. For a systematiccomparison, we divided the simulation data into ten
subsets for different cancer stages, each of which in-cludes 200 normal plasma samples and 200 cancerplasma samples of each tumor type. The different cancerstages (from early, mid-, to late stages) are representedby a set of ctDNA burden ranges (θ, θ + 10%], where θ =0, 10, 20, 30, 40, 50, 60, 70, 80, and 90%. For a six-classclassification problem (normal, breast, colon, kidney,liver, and lung), we adopt the error rate measure forassessing the classification performance (see “Methods”).The results are shown in Fig. 4. For early-stage cancerpatients with ctDNA burdens in the range θ ∈ (0, 10%],CancerLocator (error rate 0.240) largely outperforms RFand SVM (error rates 0.807 and 0.816, respectively),which are only slightly better than random guesses(0.833). For the second lowest ctDNA burdens θ ∈ (10%,20%], CancerLocator reaches a very high predictionperformance (error rate 0.067), while RF and SVM stillhave very poor performance (0.735 and 0.712, respect-ively). The two competing methods do not performwell until the ctDNA burdens are greater than 50%,
Fig. 3 The predicted ctDNA burden for simulated normal andcancer plasma samples. a Predicted ctDNA burdens for normalsamples whose true ctDNA burden should be zero. b Predicted andtrue ctDNA burdens for cancer samples. Each dot represents aprediction with the true (x-axis) and predicted (y-axis) ctDNAburdens. The correct and incorrect predictions are represented bycyan and red, respectively, in both a and b
Kang et al. Genome Biology (2017) 18:53 Page 4 of 12
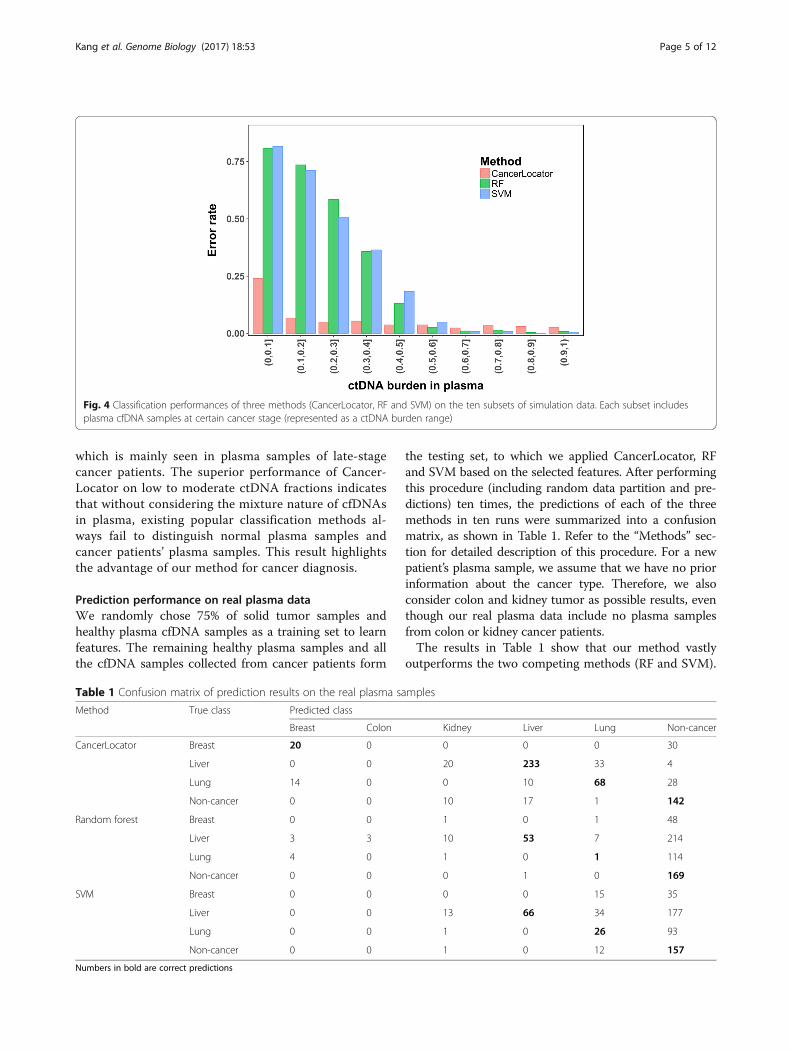
which is mainly seen in plasma samples of late-stagecancer patients. The superior performance of Cancer-Locator on low to moderate ctDNA fractions indicatesthat without considering the mixture nature of cfDNAsin plasma, existing popular classification methods al-ways fail to distinguish normal plasma samples andcancer patients’ plasma samples. This result highlightsthe advantage of our method for cancer diagnosis.
Prediction performance on real plasma dataWe randomly chose 75% of solid tumor samples andhealthy plasma cfDNA samples as a training set to learnfeatures. The remaining healthy plasma samples and allthe cfDNA samples collected from cancer patients form
the testing set, to which we applied CancerLocator, RFand SVM based on the selected features. After performingthis procedure (including random data partition and pre-dictions) ten times, the predictions of each of the threemethods in ten runs were summarized into a confusionmatrix, as shown in Table 1. Refer to the “Methods” sec-tion for detailed description of this procedure. For a newpatient’s plasma sample, we assume that we have no priorinformation about the cancer type. Therefore, we alsoconsider colon and kidney tumor as possible results, eventhough our real plasma data include no plasma samplesfrom colon or kidney cancer patients.The results in Table 1 show that our method vastly
outperforms the two competing methods (RF and SVM).
Fig. 4 Classification performances of three methods (CancerLocator, RF and SVM) on the ten subsets of simulation data. Each subset includesplasma cfDNA samples at certain cancer stage (represented as a ctDNA burden range)
Table 1 Confusion matrix of prediction results on the real plasma samples
Method True class Predicted class
Breast Colon Kidney Liver Lung Non-cancer
CancerLocator Breast 20 0 0 0 0 30
Liver 0 0 20 233 33 4
Lung 14 0 0 10 68 28
Non-cancer 0 0 10 17 1 142
Random forest Breast 0 0 1 0 1 48
Liver 3 3 10 53 7 214
Lung 4 0 1 0 1 114
Non-cancer 0 0 0 1 0 169
SVM Breast 0 0 0 0 15 35
Liver 0 0 13 66 34 177
Lung 0 0 1 0 26 93
Non-cancer 0 0 1 0 12 157
Numbers in bold are correct predictions
Kang et al. Genome Biology (2017) 18:53 Page 5 of 12

In fact, the competing methods cannot distinguish mostcancer samples from non-cancer samples. Specifically, allthe breast samples and the majority of liver and lung can-cer samples are wrongly predicted as non-cancer by bothRF and SVM. The overall error rates of RF and SVM are0.646 and 0.604, respectively. In contrast, CancerLocatorobtains a low error rate of 0.265 for the six-class predic-tion problem. These results are consistent with the simu-lation experiments for ctDNA burdens lower than 50%.To understand the relationship between estimated
ctDNA burdens and tumor types in real data, we plottedtheir relationships in Fig. 5 by summarizing predictionsfor each plasma sample in all ten runs: the average esti-mated ctDNA burden (y-axis value) and the most fre-quently predicted tumor type (dot color) among tenruns for each sample. It can be observed that the higherthe estimated ctDNA burden, the more accurate the pre-diction of tumor type. This is highly consistent with theresults from the simulation data. For the breast cancersamples, three out of five samples have ctDNA burdens≤2.2%, and they are all predicted as non-cancer. The in-ferred tumor burden of the two correctly predicted sam-ples are 5.0 and 18.0%, respectively, and the latter is ametastatic sample. For the 29 liver cancer samples, atleast 25 of them are from early-stage (Barcelona ClinicLiver Cancer stage A) patients. Most of them (80%) wereclassified as liver cancer and all of them were detectedas cancer samples. Compared to the breast cancer sam-ples, most of the liver samples, even at an early stage,can have moderate to high tumor burden (average pre-dicted tumor burden of 14.9% and the highest reaching59.0%), given that liver has generally excellent blood cir-culation, but we also correctly classified the one withonly 2.0% predicted tumor burden as liver cancer.
Among the 12 lung cancer samples (two samples did nothave cancer stage information), at least five were col-lected from early-stage patients. These early-stage sam-ples have predicted tumor burdens ranging from 2.0 to4.0%. Among these five early-stage lung cancer samples,four were correctly predicted as lung cancer, whereasthe remaining one was predicted as non-cancer.We also note that CancerLocator correctly predicted
seven out of eight chronic hepatitis B virus (HBV) sam-ples to be non-cancer samples. In addition, our methodsuccessfully predicted the only one sample with benignlung tumor as non-cancer in all ten runs, with the pre-dicted ctDNA burden always being 0.0%. These resultsdemonstrate that CancerLocator can go beyond distin-guishing healthy samples from cancer samples and handlemore sophisticated scenarios, such as differentiating HBVcarriers or benign tumor patients from cancer patients.
ConclusionsBlood-based cancer diagnosis, unlike traditional diagno-sis based on tissue biopsy, has the potential to diagnosetumors from many organs. The proposed CancerLocatoraims to exploit this potential of cfDNA by not only diag-nosing the presence of tumors, but also predicting thetissue of origin. Although three very recent studies haveinvestigated the inference of tissue of origin [21–23],these works lack either a well-developed predictionmethod [21] or systematic performance evaluations[22, 23]. Unlike these previous studies, we lay out asystematic prediction method for cfDNA-based cancertype inference, comprehensively evaluate its perform-ance on both simulated data and real data, and com-pare its performance to that of two established multi-class classification methods. We show that having a
Fig. 5 The relationship between ctDNA burden and tumor tissue prediction for each plasma sample of the real data. Each point represents a realplasma sample. This plot illustrates the average estimated tumor burden (y-axis) and the most frequently predicted tumor type (dot color) amongten runs for each plasma sample
Kang et al. Genome Biology (2017) 18:53 Page 6 of 12

mixture of plasma cfDNAs can completely defeat standardmachine learning methods for cancer type predictionswhen the proportion of tumor-derived DNA is lower than50%. In contrast, CancerLocator successfully overcomesthis obstacle. The poor performance of the standardmethods is largely caused by their treatment of the sam-ples in each tumor class as independent and identicallydistributed, following some class-specific distribution,while in our model the samples from the same class canstill be very different due to different ctDNA percentagesin the blood. In addition, our results show that ourmethod is robust to CNA events, possibly because thegenome-wide features outweigh the local aberrations.In this work, we used DNA methylation microarrays
of solid tumor tissues to train the model due to the scar-city of whole-genome bisulfite sequencing data (WGBS)in the public domain. Since DNA methylation arraysfocus only on promoter regions, they may miss import-ant signature regions of cancer. Therefore, we expectthat the growing amount of WGBS data will significantlyempower the proposed approach by revealing better andhigher resolution signatures. Owing to the limited num-ber of plasma samples, the results of this study are eval-uated only on three cancer types (breast, liver and lung).However, our new approach has the potential to performwell on all cancer types with well-circulated originatingorgans. Also, due to the limited plasma samples, the cut-off of the prediction score λ (defined in the “Methods”section and computed based on the likelihood) used todifferentiate cancer or non-cancer samples is specificallydetermined for this set of plasma samples for the bestperformance. When data on more plasma samples be-come available, this cutoff could be determined by thetraining data to be robust to most testing scenarios. Fi-nally, we note that we identified markers by comparingmethylation profiles of normal plasma cfDNAs andtumor DNAs. This procedure may introduce markersthat are tissue-specific but not tumor-specific. This ef-fect can be largely reduced by first using paired samples(tumor sample and the matched adjacent non-tumorsample) to identify tumor-specific markers, then furthernarrowing down to those markers that show differentiat-ing signals from normal plasma cfDNAs. We foresee theincreased power by such identified biomarkers when suf-ficient paired samples become available.
MethodsIn this section, we describe: 1) how the data are proc-essed (including methylation microarray and sequencingdata); 2) the implementation of CancerLocator; 3) howthe simulation data are generated while taking into ac-count copy number aberrations; 4) how the training andtesting data are split; and 5) what measures we use toevaluate performance.
Methylation data collection and processingData collectionWe collect a large set of public methylation data ofsolid tumors and plasma cfDNA samples taken fromboth healthy people and cancer patients. The majorityof tumor methylation profiles in TCGA were assayedusing the Infinium HumanMethylation450 microarray.We collect those data for solid tumors with >100samples from five different organs: 681 samples ofbreast (BRCA), 290 samples of colon (COAD), 522samples of kidney (including 300 KIRC and 156 KIRPsamples), 169 samples of liver (LIHC), and 809 sam-ples of lung (including 450 LUAD and 359 LUSCsamples) cancer.2
The public methylation data of plasma cfDNA samplesare from Chan et al. [19] and Sun et al. [21]. The twodatasets include the WGBS data of plasma samplestaken from 32 normal people, eight patients infectedwith HBV, 29 liver cancer patients, four lung cancer pa-tients, five breast cancer patients, and a number of pa-tients with tumors in organs without a large blood flow.We also generated WGBS data from plasma samplescollected from eight cancer patients (five early-stagelung cancer patients, one late-stage lung cancer patient,two lung cancer patients with unknown stage informa-tion) and one patient with a benign lung tumor. Weused only the normal, HBV, and breast/liver/lung cancerpatients in our study, for a total of 87 plasma samples.Note that these public WGBS data have very low se-quencing coverage (~4× on average), while the coverageof our newly generated data for all nine samples isaround 10×.
Human subjectsThe blood samples of eight lung cancer patients and onebenign lung tumor patient were collected. The demo-graphic and clinical features of the patients profiled arepresented in Additional file 1: Table S2.
Cell-free DNA isolation and whole-genome bisulfitesequencingBlood samples were centrifuged at 1600 × g for 10 mi-nutes and then the plasma was transferred into newmicrotubes and centrifuged at 16,000 × g for another10 minutes. The plasma was collected and stored at−80 °C. cfDNA was extracted from 5 ml plasma usingthe Qiagen QIAamp Circulating Nucleic Acids Kit andquantified using a Qubit 3.0 Fluoromter (Thermo FisherScientific). Bisulfite conversion of cfDNA was per-formed using a EZ-DNA-Methylation-GOLD kit (ZymoResearch). After that, an Accel-NGS Methy-Seq DNA li-brary kit (Swift Bioscience) was used to prepare the se-quencing libraries. The DNA libraries were thensequenced with 150-bp paired-end reads.
Kang et al. Genome Biology (2017) 18:53 Page 7 of 12

Building features (CpG clusters)The Infinium HumanMethylation450 microarray datafrom TCGA measure all solid tumor samples at~450,000 CpGs. Since our testing sample [19] comprisesWGBS data with very low sequencing coverage, wegrouped the CpG sites into CpG clusters in order to usemore mappable reads. For a CpG site covered by a probeon the microarray, we define the region 100 bp up- anddownstream as its flanking region and assume that allCpG sites located within this region have the same averagemethylation level as the CpG sites covered by probes.Two adjacent CpG sites are grouped into a CpG cluster iftheir flanking regions overlap. Finally, only those CpGclusters containing at least three CpGs covered by micro-array probes are used in this study. We choose the size ofthe flanking region and the number of CpGs in a clusteraccording to three criteria: (i) at least three CpG sites (inthe microarray data) are included to obtain a robust meas-urement of methylation values in the solid tumor samples;(ii) the cluster is reasonably sized, so that there are suffi-cient CpG sites to calculate the methylation values, evenwhen low coverage sequencing data are used; (iii) keep asmany clusters that span within a type of genomic region(either CpG islands or shores) as possible. This procedureyielded 42,374 CpG clusters, which together includeabout one-half of all the CpG sites on the InfiniumHumanMethylation450 microarray. Most of these clustersare each associated with only one gene. These CpG clus-ters are used for subsequent feature selection.
Methylation microarray data processingThe microarray data (level 3 in TCGA database) providethe methylation levels of individual CpG sites. We definethe methylation level of a CpG cluster as the averagemethylation level of all CpG sites in the cluster. A clus-ter’s methylation level is marked as “not available” (NA)if more than half of its CpG sites do not have methyla-tion measurements.
WGBS data processingBismark [24] is employed to align the reads to the refer-ence genome HG19 and call the methylated cytosines.After the removal of PCR duplications, the numbers ofmethylated and unmethylated cytosines are counted foreach CpG site. The methylation level of a CpG cluster iscalculated as the ratio between the number of methyl-ated cytosines and the total number of cytosines withinthe cluster. However, if the total number of cytosines inthe reads aligned to the CpG cluster is less than 30, themethylation level of this cluster is treated as NA.
Feature filteringFor each CpG cluster, we used the methylation range(MR) to indicate a feature’s differential power between
classes. We first obtained the average methylation levelof all samples from each class (i.e., healthy plasma oreach tumor type), then defined MR as the range of thisset of mean values (i.e., the difference between the lar-gest and smallest mean values). The higher the MR of acluster is, the more differential power it has. Finally, weselected those CpG clusters whose MRs were no lowerthan a threshold.
Statistical inference of the ctDNA burden and tissueof originA mixture model of methylation levels of plasma cfDNAsThe cfDNA in the plasma of cancer patients can beregarded as a mixture of normal background DNAand tumor-released DNA. Formally, for each CpGcluster k ∈ {1, 2, ⋯, K}, the methylation level xk ofthe plasma cfDNA from a given patient can be ap-proximated as a mixture of vk and uk, which are themethylation levels of the normal plasma sample andthe solid tumor tissue, respectively. Let θ ∈ (0, 1) de-note the proportion of tumor-derived DNAs in plasmacfDNA. Then xk can be expressed as the weightedsum of vk and uk, i.e., xk = (1 − θ)vk + θuk.We assume that an individual carries at most one type
of tumor among the T possible tumor types. Let t ∈ {0,1, 2, ⋯, T} be the variable representing either normalplasma (t = 0) or a tumor type (1 ≤ t ≤ T). For each CpGcluster k, we model its methylation level in a sample oftype t as a Beta distribution: vk ~ Beta(αk0, βk0) for nor-mal plasma samples (t =0) and uk ~ Beta(αkt, βkt) forsolid tumor samples of type t ∈ {1, ⋯, T}, where αk0 andβk0 (αkt and βkt) are the parameters of the beta model ofmethylation levels of CpG cluster k in normal plasma(solid tumor) samples. As illustrated in step 1 of Fig. 1,the parameters of these Beta distributions are estimatedby the method of moments, using the large amount ofpublic tumor data and normal plasma data.By integrating the two Beta distributions (vk and uk),
as shown in Fig. 2, xk can be modeled by a derived distri-bution with the given ctDNA burden θ and sourcetumor type t. This model is denoted as the probabilitydensity function ψ(xk|θ, t), which is calculated by theconvolution of Beta(αk0, βk0) and Beta(αkt, βkt). It is for-mally expressed as:
ψ xk jθ; tð Þ ¼Z1
0
f Betaxk−θuk1−θ
jαk0; βk0� �
f Beta uk jαkt; βkt� �
duk
ð1Þ
where fBeta is the probability mass function of the Betadistribution.
Kang et al. Genome Biology (2017) 18:53 Page 8 of 12

Modeling the methylated cytosine count of plasma cfDNAsequencing dataDue to its low abundance in plasma, the methylationprofile of cfDNA is usually measured by sequencing-based methods, and the methylation levels (xk) of aCpG cluster k can be characterized by the numbersof methylated and unmethylated cytosines in thereads. Let M = (m1, m2, ⋯, mK) and N = (n1, n2, ⋯, nK) bethe number of methylated cytosines and the total numberof cytosines mapped to all CpG sites, respectively, wherethe index runs over all K CpG clusters. For each CpGcluster k, mk can be modeled by a binomial distribution:mk ~ Binomial(nk, xk). By integrating the mixture model ofxk in Eq. 1, we have the likelihood function for each CpGcluster k which has the inputs from the model parameters(θ, t, αk0 and βk0, αkt, and βkt) and the sequence measure-ments of plasma samples (mk, nk):
f mk jθ; t; nkð Þ ¼Z1
0
f Binomial mk jnk ; xkð Þψ xk jθ; tð Þdxk
ð2Þ
where fBinomial is the probability density function of thebinomial distribution.
Maximum-likelihood estimation of blood tumor burdenand typeGiven the methylation sequencing profile of a patient’splasma cfDNA sample, the vectors M and N, we aim tofind the maximum-likelihood estimate of two model pa-rameters: a sample’s cfDNA tumor burden θ and itssource tumor type t. For integrating the mixture modelsof multiple markers into the formulation, we adopted acommonly used assumption: all features or markers areindependent of each other. This assumption has beenwidely used in a number of cell-type deconvolutionstudies [25, 26]. Under this assumption, the log-likelihood can be written as:
log L θ; tjM;Nð Þ ¼XKk¼1
log f mk jθ; t; nkð Þ ð3Þ
Since the integrals in Eqs. 1 and 2 cannot be easilysolved analytically, we use Simpson's rule to calculatethe log-likelihood. That is, a set of J predefined θ values,
Θ ¼ 0; 1J ;2J ;…; J−1J
n o, is used to conduct a grid search
for the best estimation (i.e., a global optimization solu-tion). The higher the resolution (J), the more precise the
estimation. After obtaining the solution (i.e., θ̂ and t̂ )that maximizes Eq. 3, we use the estimated parametersto calculate a simple yet effective prediction score thatanswers two questions: “Does the patient have cancer?”;
and “If the patient has cancer, which tumor type is it?”This prediction score is defined below:
λ ¼ 1K½log Lðθ ; t
���M;NÞ−log Lðθ ¼ 0���M;NÞ� ð4Þ
where the denominator K is used to normalize the log-likelihood, so that λ is comparable when using a differ-ent number of features. The variable t is not included inL(θ = 0|M, N) because θ = 0 indicates a normal plasmasample. The larger the prediction score λ, the higher thechance that the patient has a cancer tumor of type t̂ .Specifically, if λ is greater than a threshold, the patient ispredicted as having cancer with the ctDNA burden θ̂and the tumor type t̂ ; otherwise, he/she is classified asnot having cancer.
Simulation data generationWe simulate the methylation sequencing data of a pa-tient’s plasma cfDNAs using the previously describedprobabilistic models: (i) a mixture model that treats thecfDNA as a mixture of normal plasma cfDNA and DNAsreleased from primary tumor sites; and (ii) a binomialmodel for the methylated cytosine count of plasma cfDNAsequencing data. In addition, to make the simulation datamore realistic, we incorporate CNAs and read depth bias.The procedure for simulating plasma cfDNA methylationsequencing data is detailed in the following sections.
InputsInputs include: (i) the genomic regions of all K CpGclusters; (ii) the total number of cytosines (Z) on the se-quencing reads that are aligned to any CpG cluster; (iii)the range of θ : (θL, θU); (iv) the collections of normalplasma samples (denoted as POOLnormal) and solidtumor samples (denoted as POOLtumor); and (v) bk, thebackground probability for a CpG dinucleotide to bealigned to CpG cluster k, satisfying ∑k = 1
K bk = 1. The lastinput reflects the read-depth bias introduced during thesequencing process and read alignment and the densityof CpG sites in the clusters. Refer to Additional file 1 fordetails of how to obtain bk.
OutputOutput comprises a simulated methylation sequencingprofile of a plasma sample, represented by the integervectors M = (m1, m2, ⋯, mK) and N = (n1, n2, ⋯, nK).The elements mk and nk are the number of methylatedcytosines and the total number of cytosines in the readsmapped to CpG cluster k, respectively.
Procedure
1. Generate a random ctDNA fraction θ from thedistribution θ ~ Uniform(θL, θU).
^ ^
Kang et al. Genome Biology (2017) 18:53 Page 9 of 12
2. Generate a random integer copy number ck for eachCpG cluster k, from the categorical distribution ck ~Cat(6, p0, p1, p2, p3, p4, p5). Here, pc denotes theprobability of observing copy number c ∈ {0, 1, 2, 3,4, 5} in the sequencing data. The probabilities pcsatisfy three criteria: (i) their sum is equal to one,X
c¼0
5pc ¼ 1 ; (ii) the average copy number is
equal to two, ∑c = 05 c ∗ pc = 2; and (iii) extreme CNAs
are less likely to occur. In this work, we predefinep0 = 0.005, p1 = 0.16, p2 = 0.7, p3 = 0.105,p4 = 0.025, p5 = 0.005. Note that the sum of allthese probabilities except p2 (30% in this case) isthe probability of any given CpG cluster having aCNA event. We have tried other probabilityconfigurations for the simulation with more (50%)or fewer (10%) CNA events and obtained similarresults (Additional file 1). No CNA event isconsidered (i.e., ck is fixed to two) whensimulating a normal plasma sample.
3. Randomly select a normal plasma sample fromPOOLnormal whose methylation profile is denoted by(v1, v2, , vK), and randomly select a solid tumorfrom POOLtumor whose methylation level profile isdenoted by (u1, u2, , uK). Note that we alsorandomly select two normal plasma samples fromPOOLnormal in order to simulate a new normalplasma sample.
4. Calculate the methylation level xk of plasmacfDNA at CpG cluster k. This is the adjustedlinear combination of vk and uk after incorporatingthe copy number ck generated in step 2. That is,xk = (1 − θk
' )vk + θk' uk, where θk
' is the adjusted value
of θ given by θ0k ¼ θck
θckþ2 1−θð Þ. θk' describes the actual
ctDNA fraction after considering the copy number ckof the ctDNA.
5. Generate a random number nk, representing thetotal number of cytosines in CpG cluster k, fromthe Poisson distribution nk ~ Poisson(ZBk). Bk isthe adjusted CpG dinucleotide bias bk, given by
Bk ¼ bk 1−θþθck=2ð ÞXK
k¼1bk 1−θþθck=2ð Þ
, after scaling with the copy
number ck generated in step 2.6. Generate a random number mk from the binomial
distribution mk ~ Binomial(nk, xk).
Due to the limited number of normal plasma samples,we also simulated new normal plasma samples by mix-ing two normal plasma samples at different mixture ra-tios. The procedure is the same as above except thatstep 2 is ignored by fixing all copy numbers as two be-cause there are no CNA events in the normal plasmasamples.
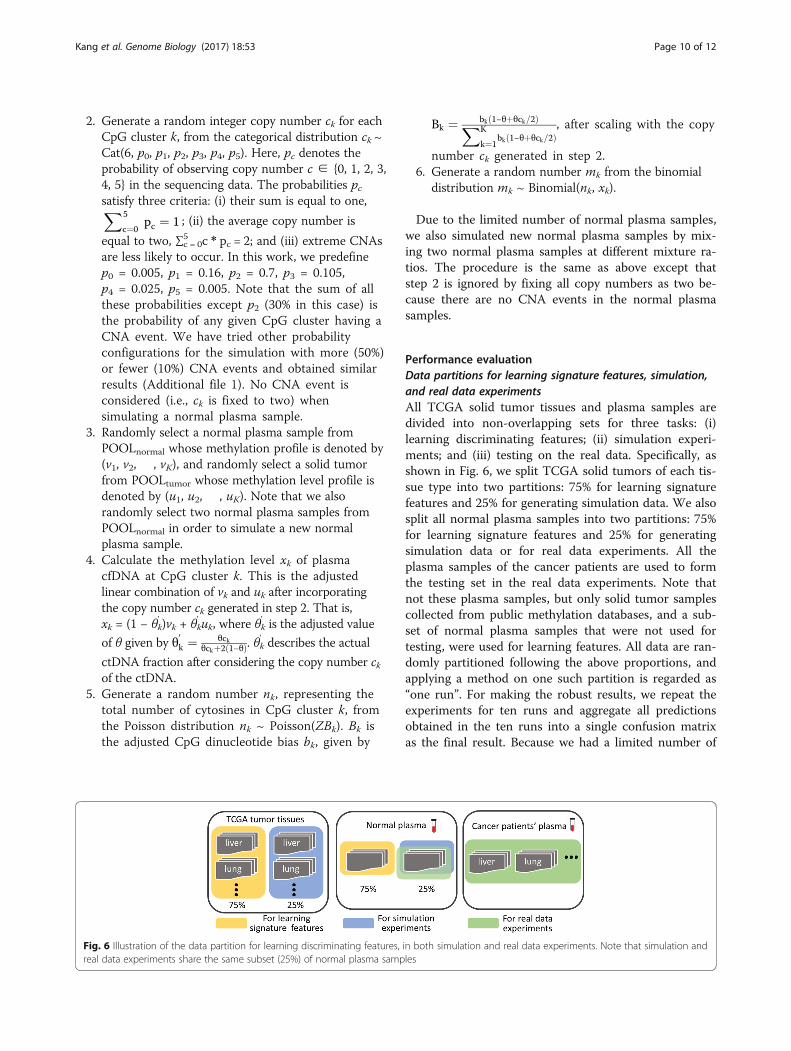
Performance evaluationData partitions for learning signature features, simulation,and real data experimentsAll TCGA solid tumor tissues and plasma samples aredivided into non-overlapping sets for three tasks: (i)learning discriminating features; (ii) simulation experi-ments; and (iii) testing on the real data. Specifically, asshown in Fig. 6, we split TCGA solid tumors of each tis-sue type into two partitions: 75% for learning signaturefeatures and 25% for generating simulation data. We alsosplit all normal plasma samples into two partitions: 75%for learning signature features and 25% for generatingsimulation data or for real data experiments. All theplasma samples of the cancer patients are used to formthe testing set in the real data experiments. Note thatnot these plasma samples, but only solid tumor samplescollected from public methylation databases, and a sub-set of normal plasma samples that were not used fortesting, were used for learning features. All data are ran-domly partitioned following the above proportions, andapplying a method on one such partition is regarded as“one run”. For making the robust results, we repeat theexperiments for ten runs and aggregate all predictionsobtained in the ten runs into a single confusion matrixas the final result. Because we had a limited number of
Fig. 6 Illustration of the data partition for learning discriminating features, in both simulation and real data experiments. Note that simulation andreal data experiments share the same subset (25%) of normal plasma samples
Kang et al. Genome Biology (2017) 18:53 Page 10 of 12
real cancer plasma samples (only 5, 12, and 29 cfDNAsamples from breast, lung, and liver cancer patients, re-spectively) for testing, it would not allow the typicalcross-validation for the method’s hyperparameter esti-mation. For fully utilizing the test samples for effectiveperformance evaluation, we report only the best predic-tion results for each of three methods (CancerLocator,RF and SVM) after examining all possible values of eachmethod’s hyperparameters. The only hyperparameter ofCancerLocator is the threshold of the prediction score λ,which is set as 0.023 to generate the predictions on thereal plasma samples. For consistency with the real dataexperiments, we apply the same strategies to simulationdata experiments and calculate the error rate averagedover ten runs.
Prediction performance measuresThe error rate and accuracy are the most popular andestablished multi-class classification performance mea-sures [27–29]. They are equivalent to each other. Thisstudy uses the error rate, which is defined as the per-centage of incorrect predictions out of all predictions.
Endnotes1We randomly select a subset of the normal plasma
and TCGA tumor samples for training and use the restto simulate samples for testing. This procedure is re-peated ten times. Different training sets may lead to dif-ferent numbers of selected CpG clusters. We thereforereport the average number of features here. Our datapartition strategy is illustrated in Fig. 6 and described inthe “Methods” section.
2BRCA, Breast invasive carcinoma; COAD, Colonadenocarcinoma; KIRC, Kidney renal clear cell carcin-oma; KIRP, Kidney renal papillary cell carcinoma; LIHC,Liver hepatocellular carcinoma; LUAD, Lung adenocar-cinoma; LUSC, Lung squamous cell carcinoma.
Additional file
Additional file 1: Supplementary information. A PDF file includingFigures S1 and S2, Tables S1 and S2, as well as the details of backgroundbias estimation of CpG read counts, the RF and SVM methods, andCancerLocator’s prediction results on simulation data with different levelsof CNA events. (PDF 558 kb)
AcknowledgementsThis work was supported by the NHLBI MAPGEN U01HL108634 grant toX.J.Z., the NIH/NCI 1U01CA214182-01 and the NIH/NCI 1U01CA196408-01 toS.M.D. Funding for open access charge: National Institutes of Health (NIH)[NHLBI MAPGEN U01HL108634 to X.J.Z.]. The authors greatly acknowledgeDr. Yuk Ming Dennis Lo and his circulating nucleic acids research group inthe Chinese University of Hong Kong for his cfDNA data [19, 21]. We alsothank Wing Hung Wong for his constructive input for the manuscript.
Availability of data and materialsCancerLocator is implemented in Java and is freely available on GitHub(https://github.com/jasminezhoulab/CancerLocator) under the MIT license.The source code is also available at Zenodo (DOI: 10.5281/zenodo.375649).The sequence data of the nine samples collected in this work have beendeposited at the European Genome-phenome Archive (EGA), which ishosted by the European Bioinformatics Institute (EBI) and the Centre forGenome Regulation (CRG), under accession number EGAS00001002211.
Authors’ contributionsSK, WL, and XJZ conceived the study. SK, WL, QC, and XJZ designed themethodological framework. SK implemented the methods and performedanalysis. QL processed the WGBS data of real samples. SP, GL, BG, KK, andSMD provided and processed lung cancer blood samples. YZ performedcfDNA extraction and library preparation. MY provided experimentalinfrastructures. WW participated in the initial attempt of blood samplecollection. SK, WL, and XJZ wrote the manuscript with input from FS, FA, QC,and QL. All authors read and approved the final manuscript.
Competing interestsUniversity of California at Los Angeles and University of Southern Californiahave a patent pending for CancerLocator. The patent, however, does notrestrict the research use of CancerLocator.
Ethics approval and consent to participateAll blood samples were collected with informed consent for research useand were approved by University of California at Los Angeles Lung CancerTranslational Research Bank Institutional Review Board (#10-001096) inaccordance with the Declaration of Helsinki. All patients were de-identifiedwith samples coded.
Publisher’s NoteSpringer Nature remains neutral with regard to jurisdictional claims inpublished maps and institutional affiliations.
Author details1Molecular and Computational Biology, University of Southern California, LosAngeles, CA 90089, USA. 2Department of Pathology and LaboratoryMedicine, David Geffen School of Medicine, University of California at LosAngeles, Los Angeles, CA 90095, USA. 3Institute for Quantitative andComputational Biosciences, University of California at Los Angeles, LosAngeles, CA 90095, USA. 4Division of Pulmonary, Critical Care Medicine,Clinical Immunology and Allergy, David Geffen School of Medicine at UCLA,Los Angeles, CA 90095, USA. 5VA Greater Los Angeles Healthcare System, LosAngeles, CA, USA. 6Department of Stem Cell Biology and RegenerativeMedicine, and Norris Comprehensive Cancer Center, University of SouthernCalifornia, Los Angeles, CA 90033, USA. 7Clinical Laboratory, ZhejiangProvince Tongde Hospital, Hangzhou, Zhejiang Province, People’s Republicof China. 8Department of Molecular and Medical Pharmacology, DavidGeffen School of Medicine, University of California, Los Angeles, CA 90095,USA. 9Department of Medicine, David Geffen School of Medicine, Universityof California, Los Angeles, CA 90095, USA. 10Jonsson Comprehensive CancerCenter, University of California, Los Angeles, CA 90095, USA.
Received: 13 January 2017 Accepted: 8 March 2017
References1. Esteller M. Molecular origins of cancer epigenetics in cancer. N Engl J Med.
2008;358:1148–59.2. Ross JP, Rand KN, Molloy PL. Hypomethylation of repeated DNA sequences
in cancer. Epigenomics. 2010;2:245–69.3. Yang Z, Jones A, Widschwendter M, Teschendorff AE. An integrative pan-
cancer-wide analysis of epigenetic enzymes reveals universal patterns ofepigenomic deregulation in cancer. Genome Biol. 2015;16:140.
4. Sahnane N, Magnoli F, Bernasconi B, Tibiletti MG, Romualdi C, Pedroni M, etal. Aberrant DNA methylation profiles of inherited and sporadic colorectalcancer. Clin Epigenetics. 2015;7:131.
5. Lee S-T, Wiemels JL. Genome-wide CpG island methylation and intergenicdemethylation propensities vary among different tumor sites. Nucleic AcidsRes. 2016;44:1105–17.
Kang et al. Genome Biology (2017) 18:53 Page 11 of 12

6. Heyn H, Esteller M. DNA methylation profiling in the clinic: applications andchallenges. Nat Rev Genet. 2012;13:679–92.
7. Schübeler D. Function and information content of DNA methylation.Nature. 2015;517:321–6.
8. Schwarzenbach H, Hoon DSB, Pantel K. Cell-free nucleic acids as biomarkersin cancer patients. Nat Rev Cancer. 2011;11:426–37.
9. Agostini M, Pucciarelli S, Enzo MV, Del Bianco P, Briarava M, Bedin C, et al.Circulating cell-free DNA: a promising marker of pathologic tumor responsein rectal cancer patients receiving preoperative chemoradiotherapy. AnnSurg Oncol. 2011;18:2461–8.
10. Liggett TE, Melnikov A, Yi Q, Replogle C, Hu W, Rotmensch J, et al.Distinctive DNA methylation patterns of cell-free plasma DNA in womenwith malignant ovarian tumors. Gynecol Oncol. 2011;120:113–20.
11. Radpour R, Barekati Z, Kohler C, Lv Q, Bürki N, Diesch C, et al. Hypermethylationof tumor suppressor genes involved in critical regulatory pathways fordeveloping a blood-based test in breast cancer. PLoS One. 2011;6:e16080.
12. Langevin SM, Koestler DC, Christensen BC, Butler RA, Wiencke JK,Nelson HH, et al. Peripheral blood DNA methylation profiles areindicative of head and neck squamous cell carcinoma: an epigenome-wide association study. Epigenetics. 2012;7:291–9.
13. Danese E, Minicozzi AM, Benati M, Montagnana M, Paviati E, Salvagno GL, etal. Epigenetic alteration: new insights moving from tissue to plasma–theexample of PCDH10 promoter methylation in colorectal cancer. Br J Cancer.2013;109:807–13.
14. Kloten V, Becker B, Winner K, Schrauder MG, Fasching PA, Anzeneder T, etal. Promoter hypermethylation of the tumor-suppressor genes ITIH5, DKK3,and RASSF1A as novel biomarkers for blood-based breast cancer screening.Breast Cancer Res. 2013;15:R4.
15. Salvianti F, Orlando C, Massi D, De Giorgi V, Grazzini M, Pazzagli M, et al.Tumor-related methylated cell-free DNA and circulating tumor cells inmelanoma. Front Mol Biosci. 2015;2:76.
16. Heitzer E, Auer M, Hoffmann EM, Pichler M, Gasch C, Ulz P, et al.Establishment of tumor-specific copy number alterations from plasma DNAof patients with cancer. Int J Cancer. 2013;133:346–56.
17. Leary RJ, Sausen M, Kinde I, Papadopoulos N, Carpten JD, Craig D, et al.Detection of chromosomal alterations in the circulation of cancer patientswith whole-genome sequencing. Sci Transl Med. 2012;4:162ra154.
18. Chan KCA, Jiang P, Zheng YWL, Liao GJW, Sun H, Wong J, et al. Cancergenome scanning in plasma: detection of tumor-associated copy numberaberrations, single-nucleotide variants, and tumoral heterogeneity bymassively parallel sequencing. Clin Chem. 2013;59:211–24.
19. Chan KCA, Jiang P, Chan CWM, Sun K, Wong J, Hui EP, et al. Noninvasivedetection of cancer-associated genome-wide hypomethylation and copynumber aberrations by plasma DNA bisulfite sequencing. Proc Natl Acad SciU S A. 2013;110:18761–8.
20. Jiang P, Chan CWM, Chan KCA, Cheng SH, Wong J, Wong VW-S, et al.Lengthening and shortening of plasma DNA in hepatocellular carcinomapatients. Proc Natl Acad Sci U S A. 2015;112:E1317–25.
21. Sun K, Jiang P, Chan KCA, Wong J, Cheng YKY, Liang RHS, et al. Plasma DNAtissue mapping by genome-wide methylation sequencing for noninvasiveprenatal, cancer, and transplantation assessments. Proc Natl Acad Sci U S A.2015;112:201508736.
22. Lehmann-Werman R, Neiman D, Zemmour H, Moss J, Magenheim J,Vaknin-Dembinsky A, et al. Identification of tissue-specific cell death usingmethylation patterns of circulating DNA. Proc Natl Acad Sci U S A.2016;113:201519286.
23. Snyder MW, Kircher M, Hill AJ, Daza RM, Shendure J. Cell-free DNAcomprises an in vivo nucleosome footprint that informs its tissues-of-origin.Cell. 2016;164:57–68.
24. Krueger F, Andrews SR. Bismark: a flexible aligner and methylation caller forBisulfite-Seq applications. Bioinformatics. 2011;27:1571–2.
25. Shen-Orr SS, Tibshirani R, Khatri P, Bodian DL, Staedtler F, Perry NM, et al.Cell type-specific gene expression differences in complex tissues. NatMethods. 2010;7:287–9.
26. Houseman EA, Accomando WP, Koestler DC, Christensen BC, Marsit CJ,Nelson HH, et al. DNA methylation arrays as surrogate measures of cellmixture distribution. BMC Bioinformatics. 2012;13:86.
27. Joshi AJ, Porikli F, Papanikolopoulos NP. Scalable active learning formulticlass image classification. IEEE Trans Pattern Anal Mach Intell.2012;34:2259–73.
28. Gupta MR, Bengio S, Weston J. Training highly multiclass classifiers. J MachLearn Res. 2014;15:1461–92.
29. Kang S, Cho S, Kang P. Constructing a multi-class classifier using one-against-one approach with different binary classifiers. Neurocomputing.2015;149:677–82.
• We accept pre-submission inquiries
• Our selector tool helps you to find the most relevant journal
• We provide round the clock customer support
• Convenient online submission
• Thorough peer review
• Inclusion in PubMed and all major indexing services
• Maximum visibility for your research
Submit your manuscript atwww.biomedcentral.com/submit
Submit your next manuscript to BioMed Central and we will help you at every step:
Kang et al. Genome Biology (2017) 18:53 Page 12 of 12