Canadian Fertilizer Institute...accurate, the Manual is provided by the Canadian Fertilizer...
76
2013 Bulk Blend Quality Control Manual Canadian Fertilizer Institute
Transcript of Canadian Fertilizer Institute...accurate, the Manual is provided by the Canadian Fertilizer...

2013
Bulk Blend Quality Control Manual
Canadian Fertilizer Institute

Disclaimer for Bulk Blend Quality Control Manual
While every effort is made to ensure that the content of this Bulk Blend Quality Control Manual (the “Manual”) is current and accurate, the Manual is provided by the Canadian Fertilizer Institute (“CFI”) “AS IS” without any warranties or conditions of any kind, including warranties and conditions of merchantability and fitness for a particular purpose. CFI does not warrant the accuracy and completeness of the Manual.
In no event will CFI be liable for any damages of any kind whatsoever arising from the use of this MANUAL, including
but not limited to direct, indirect, incidental, punitive, consequential or special damages (including, without limitation,
those resulting from loss of profit, loss of contracts, goodwill, data, information, income, anticipated savings or business
relationships), whether based on warranty, contract, tort or any other legal theory and whether or not CFI is advised of
the possibility of such damage.
By using this Manual you agree to the exclusions and limitations of liability stated above and accept them as reasonable. Do not use this Manual if you do not agree that they are reasonable.
Note: This manual is a guide to quality control practices in fertilizer blending operations. The information described herein has incorporated sections of the 2010 version of The Fertilizer Institute’s (TFI) Bulk Blend Manual where appropriate. TFI’s Bulk Blend Manual was developed through TFI’s Product Quality and Technology Council.
Cover Photo: Michelle Valberg

FOREWORD
Both producer and blender have major responsibilities in the production of bulk blended, solid fertilizers of high quality. Criteria of quality, in turn, include uniformity, nutrient content consistent with the guarantee, free-flowing characteristics, and a minimum of individual material segregation.
This manual is designed to help both the basic producer and the blender with quality control problems of blended, solid fertilizers. For the producer, the manual describes basic characteristics of materials that are essential for proper matching and compatibility. For the blender, it explains the causes of a number of everyday problems and how they may be avoided and corrected.
“Product quality” is a direct reflection of the skill and management of a blender, and even of his business integrity. A reputation for providing high-quality, blended fertilizer can be realized only with careful attention and prompt action in correcting problems that too often become part of daily operations.

4 | Bulk Blend Quality Control Manual | 2013 Canadian Fertilizer Institute
A. INTRODUCTION ............................................................................................... 6
B. SELECTING MATERIALS .................................................................................. 7
I. Chemical Analysis (Nutrient Content) ................................................................ 7
II. Particle Size .......................................................................................................... 7
a. Jar Test ..............................................................................................................................7
b. SGN & UI ...............................................................................................................................8
III. How to Use SGN and Ul -- The Empirical Approach ............................................. 8
IV. Chemical Compatibility of Blend Materials ........................................................ 9
V. Visual and Qualitative Identification of Some Materials ................................... 9
VI. Humidity Chart..................................................................................................... 10
ANNEX A: DETERMINATION OF SGN AND UI BY THE GRAPH METHOD ........................ 10
ANNEX B: DETERMINATION OF SGN AND UI BY THE MATHEMATICAL METHOD.......... 11
ANNEX C: THE SGN SCALE AND DETERMINATION OF SGN BY THE SGN SCALE
METHOD ........................................................................................................................ 12
Who can use the SGN Scale? .................................................................................................12
Procedure...............................................................................................................................13
Annex D: Jar test diagram: ......................................................................................... 14
DAP and Coarse KCl: an example of materials which will segregate severely. ..............15
DAP and Granular KCl: These materials are more compatible. ........................................16
Urea, DAP and Granular KCl: These materials are more compatible. ..............................16
ANNEX E: CHEMICAL COMPATIBILITY OF BLEND MATERIALS DIAGRAM..................... 17
C. COMPUTING FORMULAS ................................................................................ 18
I. Definition of Terms ............................................................................................. 18
II. TO CALCULATE A GRADE FORMULA .................................................................... 19
EXAMPLE 1: .............................................................................................................................19
EXAMPLE 2: .............................................................................................................................21
EXAMPLE 3: .............................................................................................................................23
EXAMPLE 4: .............................................................................................................................24
EXAMPLE 5: ............................................................................................................................25
EXAMPLE 6: .............................................................................................................................27
EXAMPLE 7: .............................................................................................................................27
EXAMPLE 8: .............................................................................................................................30
TABLE OF CONTENTS
III. TO CALCULATE A SOIL TEST FORMULA: ............................................................. 32
EXAMPLE 9: .............................................................................................................................32
D. PLANT OPERATIONS AND HOUSEKEEPING ................................................... 39
I. Receiving Materials ............................................................................................. 39
II. Material Storage and Reclaim ............................................................................ 40
III. Weighing ............................................................................................................... 40
IV. Mixing/Blending .................................................................................................... 42
V. Shipping ................................................................................................................ 42
VI. Secondary and Micro Nutrients......................................................................... 43
VII. Pesticides ............................................................................................................ 44
VIII. Batch Sheets ....................................................................................................... 45
IX. Housekeeping ....................................................................................................... 45
X. Plant Evaluation ................................................................................................. 46
QUALITY CONTROL REVIEW (Blend Plants) ................................................................ 47
E. CFI SAMPLING METHODS1 AND PHYSICAL TEST METHODS .......................... 50
I. Sampling ............................................................................................................... 50
A. Bagged Goods ....................................................................................................................50
B. Coning and Quartering .....................................................................................................67
II. ............................................................................................................................ 68
TABLE H-1 - TESTING SIEVES ..................................................................................................68
a. Bulk Density ......................................................................................................................69
BLENDER FORMULATION SHEET ............................................................................................73
Handling and Blending Coated Fertilizers ..........................................................................74
2013 | Bulk Blend Quality Control Manual | 5 Canadian Fertilizer Institute

6 | Bulk Blend Quality Control Manual | 2013
Section A
Canadian Fertilizer Institute
A. INTRODUCTION
Bulk blending of dry fertilizers has grown in Canada as the demand for small batches of specific fertilizers matched to crop needs increased. Matching bulk blends to the specific nutrient requirements of crops helps optimize the use of the applied nutrients and protects the environment through balanced nutrition.
The increase in bulk blending has resulted in the need to pay close attention to producing quality fertilizer blends. Quality bulk blends of dry fertilizers are produced when two or more dry fertilizers that are similar in particle size and having known nutrient content are mechanically mixed together.
The fertilizer manufacturer and/or seller of the materials used in the blends and the retailers share a large responsibility for producing quality blends.
• Manufacturers have responsibility for supplying properly sized fertilizer of guaranteed nutrient content.
• The retailer has the responsibility for not only having good, well maintained blending equipment, but good procedures for operating it and for determining if the fertilizer received are suitable for blending.
Retailers that practice a “total quality approach” to fertilizer blending will consider in addition to the guaranteed analysis of the blend, the effect of particle size and distribution on their ability to produce top quality blends.
The purpose of this manual is to describe:
1. Quality blends and the type of fertilizer materials needed to produce them.2. Techniques for properly computing fertilizer blend formulas.3. Procedures for determining if materials are compatible for use in blends.
The maintenance of good quality control in the bulk fertilizer blending plant deserves constant attention. The retailer is liable for what is shipped and therefore must ensure the quality of all blends that are produced.
This manual is intended to cover the important components of what it takes to produce quality blends. Paying attention to quality at the retail level will help to with customer satisfaction and better inventory control. As well, improvements in blend quality will result in better crop use of the applied nutrients which helps protect our environment.
2013 | Bulk Blend Quality Control Manual | 7 Canadian Fertilizer Institute
Section B
B. SELECTING MATERIALS
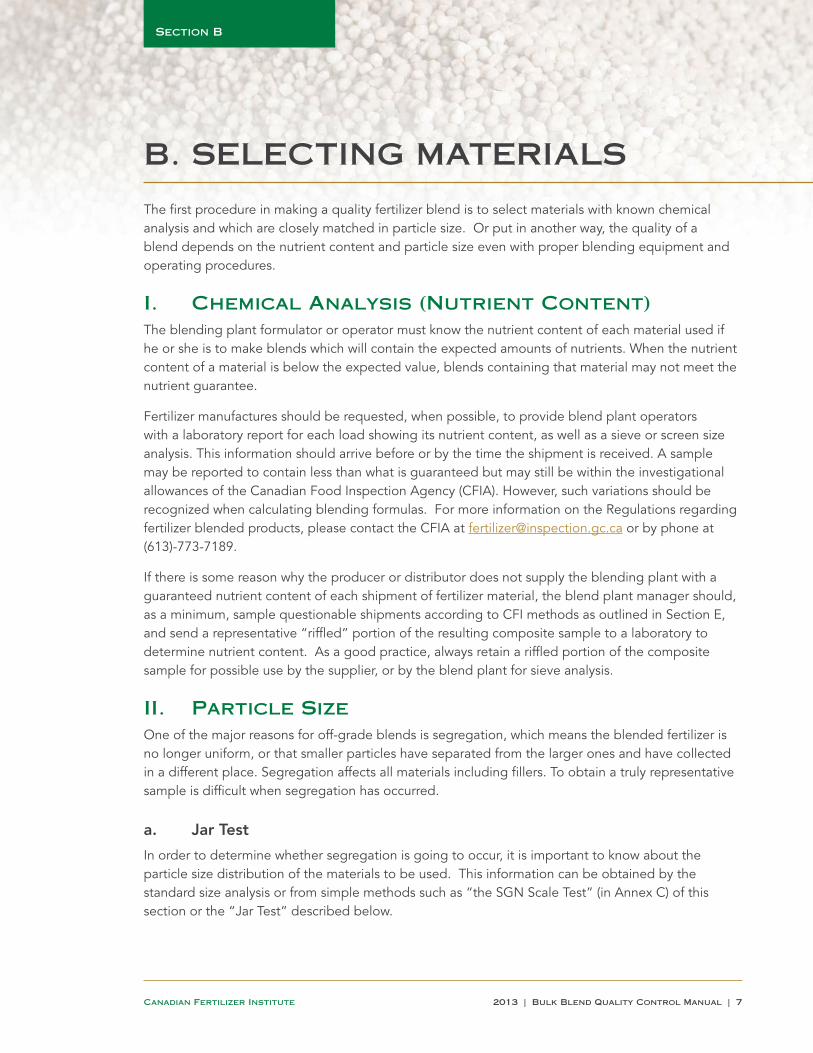
The first procedure in making a quality fertilizer blend is to select materials with known chemical analysis and which are closely matched in particle size. Or put in another way, the quality of a blend depends on the nutrient content and particle size even with proper blending equipment and operating procedures.
I. Chemical Analysis (Nutrient Content)The blending plant formulator or operator must know the nutrient content of each material used if he or she is to make blends which will contain the expected amounts of nutrients. When the nutrient content of a material is below the expected value, blends containing that material may not meet the nutrient guarantee.
Fertilizer manufactures should be requested, when possible, to provide blend plant operators with a laboratory report for each load showing its nutrient content, as well as a sieve or screen size analysis. This information should arrive before or by the time the shipment is received. A sample may be reported to contain less than what is guaranteed but may still be within the investigational allowances of the Canadian Food Inspection Agency (CFIA). However, such variations should be recognized when calculating blending formulas. For more information on the Regulations regarding fertilizer blended products, please contact the CFIA at [email protected] or by phone at (613)-773-7189.
If there is some reason why the producer or distributor does not supply the blending plant with a guaranteed nutrient content of each shipment of fertilizer material, the blend plant manager should, as a minimum, sample questionable shipments according to CFI methods as outlined in Section E, and send a representative “riffled” portion of the resulting composite sample to a laboratory to determine nutrient content. As a good practice, always retain a riffled portion of the composite sample for possible use by the supplier, or by the blend plant for sieve analysis.
II. Particle SizeOne of the major reasons for off-grade blends is segregation, which means the blended fertilizer is no longer uniform, or that smaller particles have separated from the larger ones and have collected in a different place. Segregation affects all materials including fillers. To obtain a truly representative sample is difficult when segregation has occurred.
a. Jar Test
In order to determine whether segregation is going to occur, it is important to know about the particle size distribution of the materials to be used. This information can be obtained by the standard size analysis or from simple methods such as “the SGN Scale Test” (in Annex C) of this section or the “Jar Test” described below.

8 | Bulk Blend Quality Control Manual | 2013
Section B
Canadian Fertilizer Institute
The “Jar Test” compares materials on a volume basis. The only equipment needed is some equal sized, straight-sided bottles and screens which can be stacked together. An equal volume of each material to be blended is hand-shaken through the screens. The material held on each screen and passing through the fine screen is transferred to separate bottles and then is compared visually. Materials which have similar fraction distributions will make blends with little tendency to segregate. Screens between Tyler sizes 5 and 20 are applicable and for greatest simplicity only two screens such as a 7 and 9 meshes or 8 and 10 meshes need to be used for most blend materials (Annex D). Please refer to the SGN Scale Method in (Annex C). Using several SGN scales, multiple materials can be compared.
b. SGN & UI
SGN is a totally voluntary system of materials identification developed by the Engineering and Technology Committee of the Canadian Fertilizer Institute (CFI). The SGN system is based on the concept that only two measures are needed to describe the particle size distribution of a fertilizer material. These are the Size Guide Number (SGN) and the Uniformity Index (UI).
The Size Guide Number, SGN, is the median dimension expressed in millimeters to the second decimal and then multiplied by 100. More precisely, SGN is that particle size which divides the mass of all particles in two equal halves, one having all the larger size particles and the other half having all smaller size particles. SGN can be:
1. determined by a graph method (see Annex A) or 2. calculated from size analysis data (see Annex B) or 3. estimated using the SGN Scale Method (Annex C).
The uniformity index, UI, is the ratio of particle sizes, “small” to “large” in the product, expressed as a percentage. More precisely, UI is the ratio, times 100, of the sizes corresponding to the 95% level and the 10% level in the cumulative distribution curve. UI is best determined by mathematical methods (see Annex B).
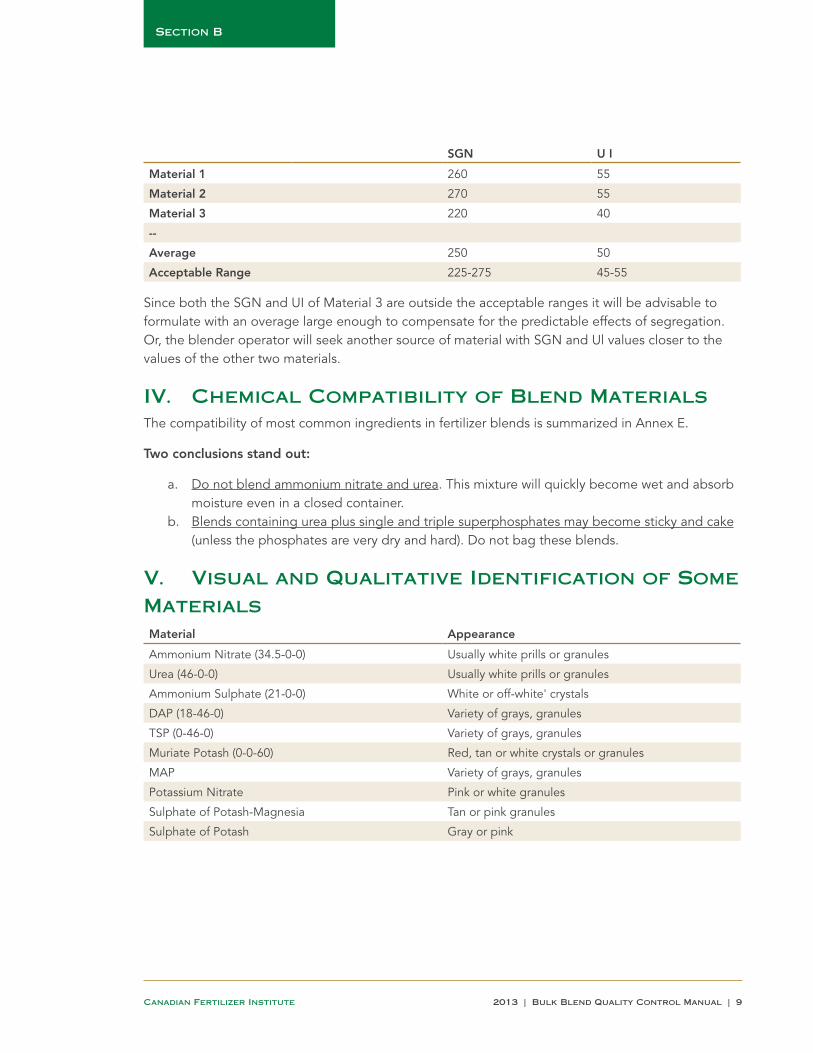
III. How to Use SGN and Ul -- The Empirical ApproachBlender operators often develop a “rule of thumb” which works well in a particular plant, but maybe not elsewhere. After some experimentation, it becomes fairly easy to set limits on the SGNs and UIs of materials mixed together. This empirical approach may take the form, for instance, of a rule “average plus or minus so much percentage.” In this case the blender operator calculates the average of the SGNs of the used materials and establishes the “acceptable” range. A similar calculation is performed for the UIs of these same materials. If all materials fall within the limits of the “acceptable” ranges, the formulation will be calculated with the standard overages. Otherwise, formulation overages will be raised to offset the risk of deficiency caused by increased segregation. Consider, for example, the case of the blender mixing together the following three materials. The averages have been calculated, as well as the “acceptable” ranges, with the rule set, in this case, at “average plus or minus 10%.”
2013 | Bulk Blend Quality Control Manual | 9 Canadian Fertilizer Institute
Section B
SGN U I
Material 1 260 55
Material 2 270 55
Material 3 220 40
--
Average 250 50
Acceptable Range 225-275 45-55
Since both the SGN and UI of Material 3 are outside the acceptable ranges it will be advisable to formulate with an overage large enough to compensate for the predictable effects of segregation. Or, the blender operator will seek another source of material with SGN and Ul values closer to the values of the other two materials.
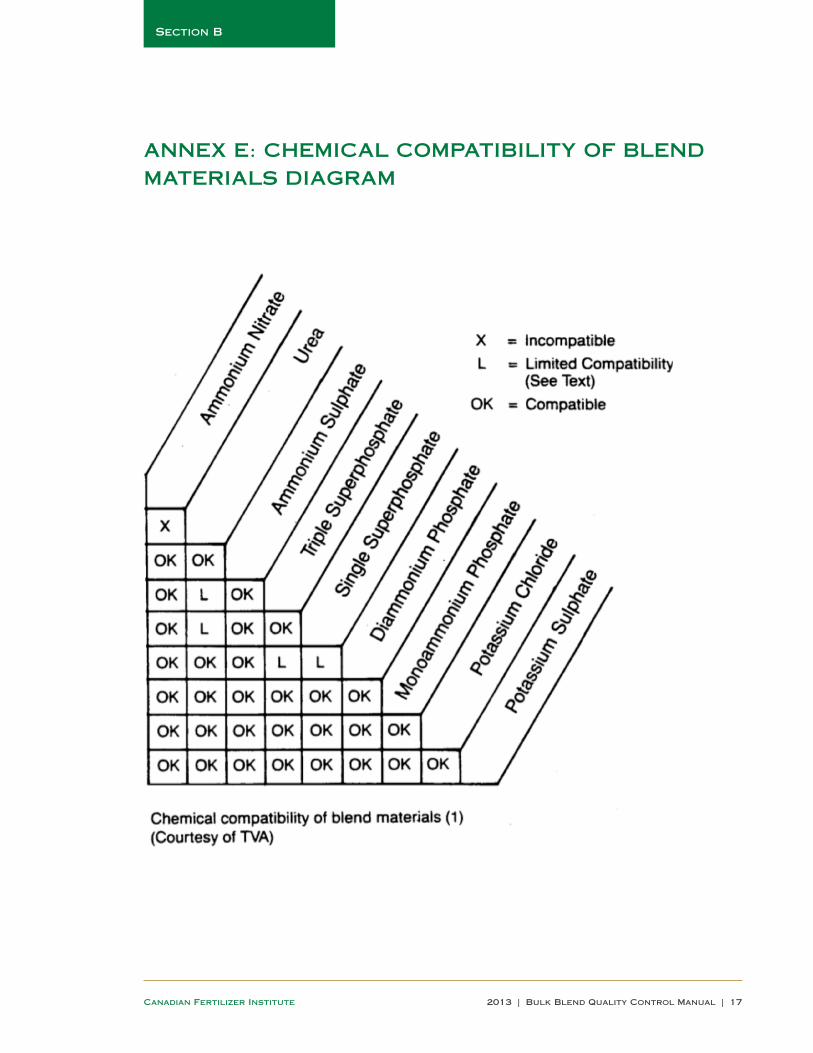
IV. Chemical Compatibility of Blend MaterialsThe compatibility of most common ingredients in fertilizer blends is summarized in Annex E.
Two conclusions stand out:
a. Do not blend ammonium nitrate and urea. This mixture will quickly become wet and absorb moisture even in a closed container.
b. Blends containing urea plus single and triple superphosphates may become sticky and cake (unless the phosphates are very dry and hard). Do not bag these blends.
V. Visual and Qualitative Identification of Some MaterialsMaterial Appearance
Ammonium Nitrate (34.5-0-0) Usually white prills or granules
Urea (46-0-0) Usually white prills or granules
Ammonium Sulphate (21-0-0) White or off-white' crystals
DAP (18-46-0) Variety of grays, granules
TSP (0-46-0) Variety of grays, granules
Muriate Potash (0-0-60) Red, tan or white crystals or granules
MAP Variety of grays, granules
Potassium Nitrate Pink or white granules
Sulphate of Potash-Magnesia Tan or pink granules
Sulphate of Potash Gray or pink

10 | Bulk Blend Quality Control Manual | 2013
Section B
Canadian Fertilizer Institute
Diammonium phosphate (DAP) and monoammonium phosphate (MAP) can be distinguished from unammoniated normal or triple superphosphates by a simple pH test and a qualitative test for ammonia (ammoniacal nitrogen).
Determining pH
Add one tablespoon of material to a cup of water, stir mixture for two minutes, then measure the pH with a pH meter.
If pH is less than 4.0, the material is probably TSP or other unammoniated material.
If pH is between 4.0 and 5.5, it is probably MAP.
If pH is above 7.0, it is probably DAP.
Ammoniacal Nitrogen
Using a dry plastic spoon, slowly add 1/2-1/3 tablespoon of caustic soda (or sodium hydroxide) to the fertilizer mixture in the beaker. Very gently stir, or swirl the mixture in the beaker for a few seconds. If ammoniacal nitrogen is present, (both DAP and MAP contain it), an ammonia odour is produced and becomes stronger as the caustic soda dissolves and heats the solution in the beaker. (Caution: Do not allow caustic soda or a solution of it to get on the skin or in the eyes.) After the reaction of caustic soda with the water in the beaker has subsided, the mixture can be poured into the sink drain. (Many commercial drain cleaners contain caustic soda and can be used for this test).
VI. Humidity ChartAnnex E gives Tennessee Valley Authority (TVA)’s critical humidity data for fertilizer salts. Stated simply, the table indicates calcium nitrate will pick up moisture above 46.7 per cent relative humidity (RH), but mixtures of calcium nitrate and ammonium nitrate will pick up moisture when the RH is above 23.5 per cent. Pure ammonium nitrate will not pick up water until the RH is at or above 59.4 per cent. As a third example, urea will not absorb moisture from the air until the RH is 75.2 per cent or above at 30°C (or 86°F) but mixtures of it and ammonium nitrate will absorb moisture when the RH is at or above 18.1 per cent.
ANNEX A: DETERMINATION OF SGN AND UI BY THE GRAPH METHODThe size distribution is plotted on graph paper, per cent cumulative (by mass) versus particle size. The normally smooth distribution curve is approximated by drawing straight line segments between adjacent data points, as shown in the graph below.
From the point where the cumulative data line crosses the 50% horizontal line, draw down a vertical line to the SGN scale for direct reading of the SGN value. SGN = 242 in this example.

2013 | Bulk Blend Quality Control Manual | 11 Canadian Fertilizer Institute
Section B
From the point where the cumulative data line crosses the 95% horizontal line, draw down a vertical line to the SGN scale for direct reading of the small Particle Dimension, S = 155 in this example.
From the point where the cumulative data line crosses the 10% horizontal line, draw down a vertical line to the SGN scale for direct reading of the large Particle Dimension, L = 310 in this example.
UI = (100 S)/L or, for the example: (100 x 155)/310 = 50
TYLER MESH NUMBER
ANNEX B: DETERMINATION OF SGN AND UI BY THE MATHEMATICAL METHODThe determination of SGN and UI would be simple if the screen tests showed exactly 10, 50 and 95% cumulatively retained on three different sieves. For example, 50% on the 2.36 mm sieve would immediately convert to SGN 236. Similarly, 10% on the 2.80 mm sieve and 95% on the 1.40 mm sieve would mean that UI = 50%, since UI = S/L x 100.
The screen test results, however, are rarely exactly 10, 50 or 95% on a particular sieve. To determine SGN, S and L, we must resort to a mathematical method called linear interpolation. The straight segments used in linear interpolation approximate the smooth S shape of the true size-distribution curve.

12 | Bulk Blend Quality Control Manual | 2013
Section B
Canadian Fertilizer Institute
If we have, for example, 46% retained on 2.80 mm and 68% retained on 2.36 mm, we know that SGN is between 280 and 236. We calculate the mathematically exact value with the interpolation formula:
[a (CRA - k)] / (CRA – CRB) + b
Where k = 50 since we are calculating SGN
a = aperture difference = 280 - 236 = 44
b = aperture of the sieve retaining a proportion greater than k = 236
CRA = Cumulative Retained Above k = 68
CRB = Cumulative Retained Below k = 46
SGN = [44(68 - 50)]/ (68-46) + 236 = 272
The same interpolation formula is used for the determination of L and S, the dimensions of the “large” and the “small’ particles, corresponding to the 10 and 95% levels of the cumulative distribution curve. The coefficient k is always 10 for L and 95 for S, while the other values depend on the screen test results. For example, 92% retained on 1.70 mm and 97% retained on 1.40 mm correspond to:
S = [30(97 - 95)] / (97 – 92) + 140 = 152
The best accuracy is obtained when consecutive standard sieves are used. Testing with every second or third sieve often affects the SGN estimate and always lowers the UI estimate. See Table H-1, for a list of standard screens.
ANNEX C: THE SGN SCALE AND DETERMINATION OF SGN BY THE SGN SCALE METHODThe Size Guide Number (SGN) Scale is an instrument designed for simple screen tests of fertilizer samples. It is a book-size acrylic box fitted with five sieves. It directly produces a size histogram of the sample tested, from which the SGN can be estimated.
The control sample of a fertilizer blend is truly representative only if the blending materials have been selected to minimize the risk of segregation in mixing and handling. Particle size is the most important factor in the selection of non-segregating materials. Particle size is commonly identified by the median dimension in millimeters times 100, or SGN. For example, if the screen test indicated that a sieve of 2.40 mm opening would retain exactly one half of the sample, the average particle size would be 2.40 mm, or SGN 240.
Who can use the SGN Scale?
• The blender manager, to select size-compatible materials.• The blender operator, to prevent segregating blends.

2013 | Bulk Blend Quality Control Manual | 13 Canadian Fertilizer Institute
Section B
• The control offi cial, to identify the increased risk of poor results.• The basic manufacturing plants for process control.• The marketing staff, for promotional activities.
Procedure
1. Transfer a representative sample of approximately 200 mL to the right end of the compartment of the SGN scale.
2. Close the SGN Scale and rotate it to bring the sample in the top position. Shake, long enough to fi nish sifting.
3. Return the box to the horizontal position, to view the label in each compartment and to estimate the SGN. Remember that SGN is the scale value which divides the sample in two equal halves. As an example, if 50% of the sample is on the left of a line halfway between 200 and 280, this gives SGN 240. If 50% of the sample is on the left of a line eight tenths of the interval 200-280, this gives SGN 264.
SGN Scale

14 | Bulk Blend Quality Control Manual | 2013
Section B
Canadian Fertilizer Institute
Annex D: Jar test diagram:

2013 | Bulk Blend Quality Control Manual | 15 Canadian Fertilizer Institute
Section B
DAP and Coarse KCl: an example of materials which will segregate severely.

16 | Bulk Blend Quality Control Manual | 2013
Section B
Canadian Fertilizer Institute
DAP and Granular KCl: These materials are more compatible.
Urea, DAP and Granular KCl: These materials are more compatible.
2013 | Bulk Blend Quality Control Manual | 17 Canadian Fertilizer Institute
Section B
ANNEX E: CHEMICAL COMPATIBILITY OF BLEND MATERIALS DIAGRAM

18 | Bulk Blend Quality Control Manual | 2013
Section C
Canadian Fertilizer Institute
C. COMPUTING FORMULAS
Calculating fertilizer blend formulas is not difficult but it is an essential part of producing quality products. If the arithmetic is not done correctly or if the proper materials are not used the product may fail to pass proper inspection or it may be difficult to apply.
Material selection has been covered in Section B. Selecting materials and the selection and handling of minor nutrients and pesticides will be covered in Section E Operations. The recommendations given in these chapters should be followed.
I. Definition of TermsThere are some specific terms used in formulation calculation. They include:
a. Grade: Means the percentage content of total nitrogen, available phosphoric acid and soluble potash stated in that sequence.
b. Guarantees: The amount of nutrients, expressed as a percentage contained in fertilizer mixtures and materials. Except for potash (K2O) and available phosphate (P2O5) they are expressed in terms of the element; for example zinc (Zn). The guarantee, except for chlorine, is for the minimum amount contained. The chlorine content is guaranteed not to exceed the amount shown.
c. N-P-K: Nitrogen-Phosphate-Potash; also the first three numbers in a fertilizer grade. For example, a 17-17-17 labeled fertilizer product would contain 17% nitrogen, 17% available phosphate and 17% soluble potash. In this section they will be referred to as nitrogen, phosphate, and potash.
d. Nutrients: The Fertilizer Act and Regulations has definitions for major plant nutrients (means nitrogen (N), phosphorus (P), or potassium (K)); and lesser plant nutrients (means any plant nutrient other than nitrogen, phosphorus and potassium)
e. Formula Weight: Formulas are calculated so that the total weight equals 2204 pounds (or 1002 kgs) when using the metric system. Both unit measurements are provided in this manual.
f. Unit: One per cent of the formula weight or 20 pounds (or 9.1 kgs). A formula containing 17% of a nutrient would contain 17 units or 374 pounds (or 170 kgs) per tonne.
Formulas can be calculated using various computer programs or they can be “hand calculated.”
This chapter will cover “hand calculating” formulas. Some type of form should be used to record the calculations and to make it easier to check the results. A sample form “Blender Formulation Sheet” is included in this manual on page 73, and can be copied.

2013 | Bulk Blend Quality Control Manual | 19 Canadian Fertilizer Institute
Section C
There are two types of formulas.
g. Grade formulas in which the nutrient guarantees are expressed as percentage of the total weight.
h. Soil test formulas in which the nutrient contents are calculated so that the blend produced will supply a certain amount of nutrients per acre when applied at a given rate. These are also called “Custom Blend” formulas.
II. TO CALCULATE A GRADE FORMULAa. Select materials. Material names and guarantees are given in Section J. Appendix 1.
b. Check material analyses Be sure that the material guarantees used in formula match the guarantees of the material in the bin. For example, is the material actually DAP (18-46-0) or is it MAP (11-52-0)?
c. Specify the grade and perform the calculations.
EXAMPLE 1:
A simple grade formula:
Calculate a 9-23-30 grade formula. The materials to be used are DAP (18-46-0) and Muriate of Potash (0-0-60).
Calculations:
1. Determine the amounts of each nutrient needed.
Method:
Pounds of a nutrient required = formula weight in pounds x nutrient guarantee (expressed as a decimal). Then, kilograms of a nutrient needed = formula weight in kilograms x nutrient guarantee (expressed as a decimal). Remember, formulas are calculated to have 2204 pounds (or 1002 kgs).
Then:
Nutrient Per cent Required Amount required in pounds
Nitrogen 9% 2204 x .09 = 198.4; round down to 198
Phosphate 23% 2204 x .23 = 506.92; round up to 507
Potash 30% 2204 x .30 = 661.2; round up to 662

20 | Bulk Blend Quality Control Manual | 2013
Section C
Canadian Fertilizer Institute
Nutrient Per cent Required Amount required in kilograms
Nitrogen 9% 1002 x .09 =90.18; round down to 90
Phosphate 23% 1002 x .23 = 230.46; round down to 230
Potash 30% 1002 x .30 = 300.6; round down to 300
2. This can also be calculated using units.
Method:
One Unit = One per cent and is based on a 2204 pounds (or 1002 kgs) formula thus it equals 22.04 pounds (rounded down to 22 pounds; or 10 kgs). Nutrient requirements expressed as a percentage equals nutrient requirements expressed as units. Thus, units multiplied by 22 equal pounds (or 10 kgs) of nutrient are needed for one tonne of product.
Example: nitrogen requirements are 9.0% or 9 units. Amount of nitrogen in lbs. required = 9 x 22.04 lbs. = 198.4 = 198 lbs. Amount of nitrogen in kgs needed = 9 x 10 kgs = 90.18 = 90 kgs.
3. Determine the amounts of each material needed to supply these amounts.
Method:
Nutrient requirement (in lbs. or kgs) divided by the nutrient content of the material (expressed as a decimal) equals the pounds (or kgs) of the material required.
Then: Nitrogen and phosphate will be obtained from the DAP.
Nitrogen: 198 lbs. (90 kgs) required / 0.18 N in DAP = 1102 pounds (501 kgs) of DAP required.
Phosphate: 507 lbs. (230 kgs) required / 0.46 P2O5 in DAP = 1102 pounds (501 kgs) of DAP required.
Potash will be obtained from the Muriate of Potash. 661 lbs. (301 kgs) required / 0.60 K2O in Muriate = 1102 pounds (501 kgs) of Muriate of Potash.
4. Checking:
Total Weight: 1102 + 1102 = 2204 pounds (1002 kgs).
Nutrients:
Nutrient Pounds needed Kilograms needed
Nitrogen 198 90
Phosphate 507 230
Potash 661 301

2013 | Bulk Blend Quality Control Manual | 21 Canadian Fertilizer Institute
Section C
5. To double check that the percentage guarantee is correct, divide the total pounds of each nutrient by 2204 and then multiply by 100 to convert to per cent.
Example: Nitrogen: 198.4 / 2204 = 0.09 x 100 = 9.0
A completed calculation sheet would look like the following table for pounds:
Weight Material N P2O5 K2O
1102 DAP (18-46-0) 198 507
1102 Muriate Potash 661
2204 Total pounds 198 507 661
(%) Per cent 9.00 23.00 30.00
To produce a tonne of this blend put 1102 pounds (or 501 kgs) of DAP and 1102 pounds (or 501 kgs) of Muriate of Potash into the blender. To make a 500 gram sample batch for use in a view box observation test weigh up 250 grams of each material.
A completed calculation sheet would like the following table for kilograms:
Weight Material N P2O5 K2O
501 DAP (18-46-0) 90 230
501 Muriate Potash 300
1102 Total kilograms 90 230 300
(%) Per cent 9.00 23.00 30.00
EXAMPLE 2:
Another grade formula but a little more complicated. Calculate a 17-17-17 blend using Ammonium Nitrate (34-0-0), DAP (18-46-0), Muriate of Potash (0-0-60), and Filler (0-0-0) if necessary. Remember the numbers in the brackets represent the Nitrogen, P2O5 and the K2O guarantees.
Calculations:
1. a. Determine the pounds of each nutrient needed:
All 3 nutrients are guaranteed at 17.0 % or 17 units. Using the unit method: 17 units x 22.04 pounds per unit = 375 lbs. each. Using the percentage method: 2204 pounds x 0.17 = 375 lbs. each.
1. b. Determine the kilograms of each nutrient needed:
All 3 nutrients are guaranteed at 17.0 % or 17 units. Using the unit method: 17 units x 10.01 kg per unit = 170.5 kgs each. Using the percentage method: 1001.8 kgs x 0.17 = 170.5 kgs each.

22 | Bulk Blend Quality Control Manual | 2013
Section C
Canadian Fertilizer Institute
2. Select the nutrient requirement to be calculated first
Please note: that the ratio of the phosphate to the nitrogen in DAP is 46 to 18 or 2.56 while the ratio in the formula is 1 to 1 or 1.0. If the P/N ratio in the formula is less than 2.56 and DAP is to be used, phosphate is the limiting factor and has to be calculated first. If it is greater, nitrogen is the limiting factor and is calculated first. The P/N ratio method can be used for any material containing nitrogen and phosphate. For example, the P/N ratio for MAP (11-52-0) is 52 to 11 or 4.73 (52/11 = 4.73).
3. Select the materials to be calculated first:
The amount of any material that supplies only one nutrient and that will not be used in combination with other materials should be calculated first. This is because often it is necessary to know the amount of room remaining in the formula before the final calculations can be made. Therefore, calculate the amount of Muriate of Potash required first, then the DAP, next the Ammonium Nitrate, and last the filler.
Then:
Potash: 375 lbs. (170.5 kgs) required / 0.60 K2O in Muriate = 625 lbs. (284.1 kgs) of Muriate Potash
Phosphate: 375 lbs. (170.5 kgs) required / 0.46 P2O5 N in DAP =815.2 lbs. DAP (round up to 816 lbs.; 370.1 kgs)
Nitrogen: Supplied from DAP: 816 lbs. (370.9 kgs) x 0.18 (N in DAP) = 147 lbs. (66.8 kgs)
Needed from Ammonium Nitrate: 375 - 147 = 228 lbs. (or 103.6 kgs)
Amount of Ammonium Nitrate required: 228 lbs. (103.6 kgs) required / 0.34 N in Ammonium Nitrate = 670.6 (Round up to 671 lbs. or 305 kgs)
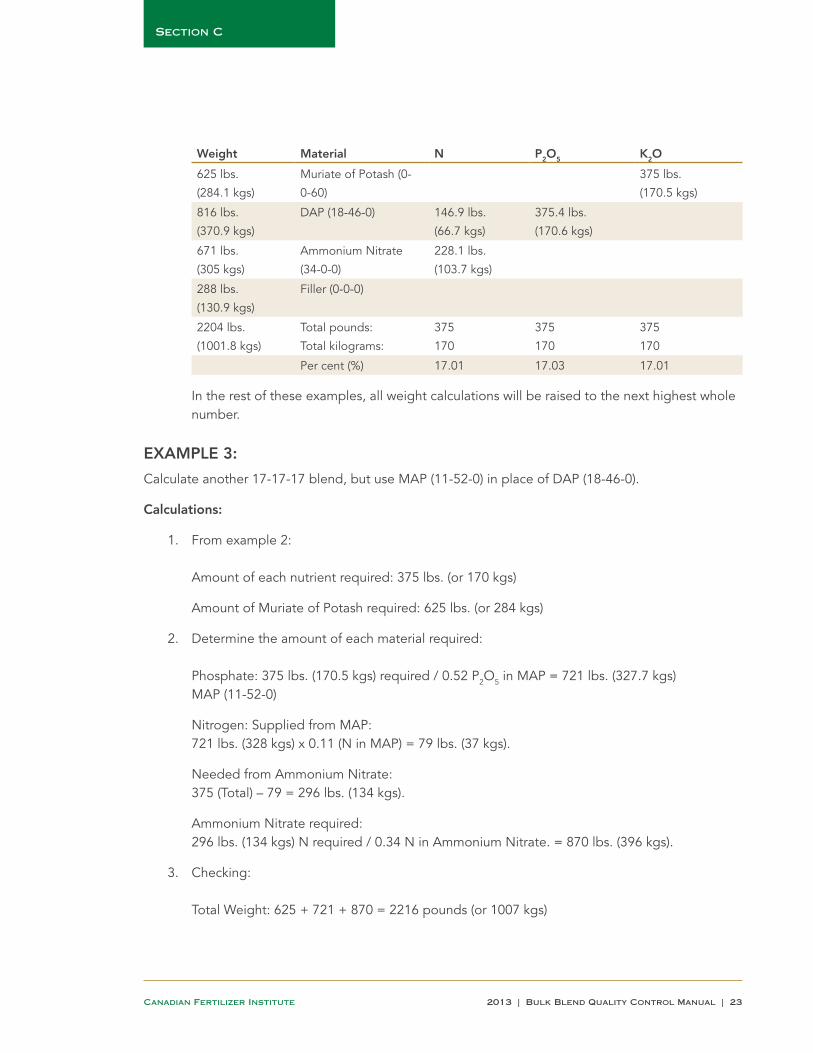
4. Determine if filler is needed and if so how much:
625 lbs. (284.1 kgs) Muriate + 816 lbs. (370.9 kgs) DAP + 228 lbs. (103.6 kgs) Ammonium Nitrate = 1669 lbs. (758.6 kgs).
2204 lbs. (1002 kgs) total formula weight - 1916 lbs. (870.9 kgs) nutrient material = 288 lbs. (130.9 kgs) of filler are needed. The completed calculation sheet would look like the following table:
2013 | Bulk Blend Quality Control Manual | 23 Canadian Fertilizer Institute
Section C
Weight Material N P2O5 K2O
625 lbs.
(284.1 kgs)
Muriate of Potash (0-
0-60)
375 lbs.
(170.5 kgs)
816 lbs.
(370.9 kgs)
DAP (18-46-0) 146.9 lbs.
(66.7 kgs)
375.4 lbs.
(170.6 kgs)
671 lbs.
(305 kgs)
Ammonium Nitrate
(34-0-0)
228.1 lbs.
(103.7 kgs)
288 lbs.
(130.9 kgs)
Filler (0-0-0)
2204 lbs.
(1001.8 kgs)
Total pounds:
Total kilograms:
375
170
375
170
375
170
Per cent (%) 17.01 17.03 17.01
In the rest of these examples, all weight calculations will be raised to the next highest whole number.
EXAMPLE 3:
Calculate another 17-17-17 blend, but use MAP (11-52-0) in place of DAP (18-46-0).
Calculations:
1. From example 2:
Amount of each nutrient required: 375 lbs. (or 170 kgs)
Amount of Muriate of Potash required: 625 lbs. (or 284 kgs)
2. Determine the amount of each material required:
Phosphate: 375 lbs. (170.5 kgs) required / 0.52 P2O5 in MAP = 721 lbs. (327.7 kgs) MAP (11-52-0)
Nitrogen: Supplied from MAP: 721 lbs. (328 kgs) x 0.11 (N in MAP) = 79 lbs. (37 kgs).
Needed from Ammonium Nitrate: 375 (Total) – 79 = 296 lbs. (134 kgs).
Ammonium Nitrate required: 296 lbs. (134 kgs) N required / 0.34 N in Ammonium Nitrate. = 870 lbs. (396 kgs).
3. Checking:
Total Weight: 625 + 721 + 870 = 2216 pounds (or 1007 kgs)

24 | Bulk Blend Quality Control Manual | 2013
Section C
Canadian Fertilizer Institute
Error: The total weight exceeds 2204 pounds (or 1002 kgs). The blend cannot be made from these materials. Either other materials will have to be used or the guarantees reduced.
If the total weight exceeds 2204 pounds (or 1002 kgs), or if any of the calculated guarantees do not equal or exceed the requested value, the formula is not correct. Also, remember, the chemical compatibility of the materials must also be considered.
Including minor elements in a formula:
The addition of secondary and minor elements to a formula is handled in the same manner as the primary materials.
EXAMPLE 4:
Calculate the formula for a 10-20-20 that will include 1 % Zn from 50% Zinc Oxide.
1. Data:
Guarantees N P2O5 K2O Zn
% Analysis Desired 10.0 20.0 20.0 1.0
# Nutrient Needed 220 441 441 22
2. Amounts of materials required:
Zinc: 22 lbs. (or 10 kgs) required / 0.50 Zn in ZnO = 44 lbs. (20 kgs). 50% Zinc Oxide
Potash: 441 lbs. (or 201 kgs) required / 0.60 K2O in Mur. Pot. = 735 lbs. (334 kgs). Muriate of Potash (0-0-60)
Phosphate: 441 lbs. (200.5 kg) required / 0.46 P2O5 in DAP = 959 lbs. (436 kgs). DAP (18-46-0)
Nitrogen: Supplied from DAP: 959 lbs. (436 kgs) x 0.18 (N in DAP) = 173 lbs. (79 kgs).
Nitrogen needed from Ammonium Nitrate: 220.00 (Total) – 172 = 47 lbs.
Ammonium Nitrate Required: 47 lbs. (22 kgs) required / 0.34 N in Ammonium Nitrate = 139 lbs. (63 kgs).
3. Checking weight: 44 + 735 + 959 + 139 = 1877 pounds (853 kgs)
Or in kilograms:
Nitrogen supplied from DAP: 436 kg x 0.18 = 79 kgs

2013 | Bulk Blend Quality Control Manual | 25 Canadian Fertilizer Institute
Section C
N needed from Ammonium Nitrate: 220 lbs. /2.2 = 100 kgs – 79 kgs = 21 kgs 21 kgs / 0.34 N = 62 kgs.
4. Filler required: 2204 - 1877 = 327 pounds (149 kgs)
The completed calculation sheet would show:
Weight Material N P2O5 K2O Zn
735 lbs.
(334 kgs)
0-0-60 441 lbs.
959 lbs.
(436 kgs)
18-46-0 173 lbs. 441 lbs.
139 lbs.
(62 kgs)
34-0-0 47 lbs.
44 lbs.
(20 kgs)
ZnO 50% Zn 22 lbs.
2204
1002
Filler
Totals 220 441 441 22
Per cent (%) 10 20 20 1
A “binder” material is sometimes added to help prevent segregation. If the formula contains filler it can be replaced by an equal amount of binder. Example: To add 20 pounds (9 kgs) of a binder to the above formula the filler weight would be reduced to 307 pounds and the total formula weight would remain at 2204 pounds (1002 kgs). If the formula did not contain filler and the grade guarantee had to be maintained a new formula would have to be calculated in order to make the necessary “room.” The calculations required to do this will be covered later.
Chlorine guarantee
The amount of chlorine in a blend is always guaranteed not to exceed the guaranteed amount. The actual amount of chlorine in the blend must not be greater than the guaranteed amount; in fact it should be less.
EXAMPLE 5:
Calculate the amount of chlorine in the 10-20-20 formula calculated in example 4.
Method:
1. Determine the amount of chlorine in each material.2. Sum these amounts to obtain the total weight.3. Convert to a percentage value.

26 | Bulk Blend Quality Control Manual | 2013
Section C
Canadian Fertilizer Institute
Calculations:
1. The standard guarantee for chlorine in Muriate of Potash is plus or minus 0.2% from the guarantee %. This is the only material in the formula which contains chlorine.
Then: The weight of the Muriate of Potash in the formula multiplied by the chlorine analyses (expressed as a decimal) equal the pounds (or kilograms) of chlorine in the blend.
2. Chlorine: 735 lbs. (or 334 kgs) Muriate Potash x 0.50 = 368 lbs. (or 167 kgs).
3. Chlorine per cent: 367.5 / 2204 x 100 = 16.67% or 167 kgs / 1002 x 100 = 16.67%
In most cases, the guaranteed amount would be raised to at least 17.00 %. Remember, the chlorine guarantee should be greater than the actual amount contained in the blend.
The completed calculation sheet would now show:
Weight Material N P2O5 K2O Zn Cl
735 lbs.
(334 kgs)
0-0-60 441 lbs.
(201 kgs)
368 lbs.
(167 kgs)
959 lbs.
(436 kgs)
18-46-0 173 lbs.
(79 kgs)
441 lbs.
(201 kgs)
139 lbs.
(62 kgs)
34-0-0 47 lbs.
(21 kgs)
44 lbs.
(20 kgs)
ZnO 50% Zn 22 lbs.
(10 kgs)
2204
1002
Filler
Totals 220 441 441 22 lbs.
(10 kgs)
368 lbs.
(167 kgs)
Per cent (%) 10 20 20 1
FORMULATION OVERAGES:
The Investigational Allowances (Tolerances) allowed by the CFIA has analytical tolerances referenced in the Regulatory Section, in tables referenced from the Fertilizer Regulations.
FORMULA COSTS:
After each formula has been calculated its cost has to be determined.
Method:
1. Determine the cost of each material in the formula.
Pounds of material used x material cost per tonne / 2204 (1002 kgs) = cost of material in formula.

2013 | Bulk Blend Quality Control Manual | 27 Canadian Fertilizer Institute
Section C
2. Add these individual material costs to obtain the total cost.
EXAMPLE 6:
Calculate the cost of the formula calculated in example 1. The completed calculation sheet for this section would be:
Material Pounds (kgs) Cost Per Tonne Formula Cost
DAP 1102 (501) $200.00 $100.00
Muriate of Potash 1102 (501) $130.00 $65.00
Sub Total $165.00
1% Shrinkage $1.65
Total Cost $166.65
ELIMINATING FILLER FROM A FORMULA:
Short cut method:
This method can be used to proportion two materials containing the same nutrient but of different analysis so that no filler is required. This method can also be used to make room in a formula so that micronutrients or pesticides can be added.
This is a simple way to solve this type of problem without having to set up two algebraic equations. It can be used with two phosphate materials, two nitrogen materials or with two potash materials, provided each contains only one nutrient.
EXAMPLE 7:
The following formula has already been calculated. The customer now wants 2% Zn from 50% Zinc Oxide added. The grade guarantee must be maintained. Recalculate the formula to meet the new guarantees without using filler.
Formula:
Weight Material N P2O5 K2O
368 lbs.
(167 kgs)
0-0-60 221 lbs.
(100 kgs)
959 lbs.
(436 kgs)
0-46-0 441 lbs.
(201 kgs)
280 lbs.
(127 kgs)
34-0-0 95 lbs.
(43 kgs)
597 lbs.
(271 kgs)
21-0-0 125 lbs.
(57 kgs)
2204 lbs.
(1002 kgs)
Totals 220 lbs.
(100 kgs)
441 lbs.
(201 kgs)
221 lbs.
(100 kgs)
Per cent (%) 10 20 10

28 | Bulk Blend Quality Control Manual | 2013
Section C
Canadian Fertilizer Institute
Calculations:
1. Material requirements:
Zinc: Amount required in formula: 2% or 2 units 2 (units) x 22 = 44 lbs. (20 kgs) of Zn
Amount of material required: 44 lbs. or 20 kgs (Zn required) divided by 0.50 (Zn analysis) = 88 lbs. (or 40 kgs) of 50% Zinc Oxide.
Since the total formula weight must remain at 2204 pounds or 1002 kgs, the amounts of Muriate of Potash and Triple Super required remains the same. The space occupied by the Ammonium Nitrate and the Ammonium Sulphate must be reduced to provide space for the 44 pounds or 20 kilograms of Zinc Oxide needed.
The formula changes to:
Weight Material N P2O5 K2O Zn
368 lbs.
(167 kgs)
0-0-60 221 lbs.
(100 kgs)
959 lbs.
(436 kgs)
0-46-0 441 lbs.
(201 kgs)
88 lbs.
(40 kgs)
50% Zn 44 lbs.
(20 kgs)
? 34-0-0
? 21-0-0
2204 lbs.
(1002 kgs)
Totals 220 lbs.
(100 kgs)
441 lbs.
(201 kgs)
221 lbs.
(100 kgs)
Per cent (%) 10 20 10 2
The problem now is to calculate how much Ammonium Nitrate and Ammonium Sulphate must be used to provide x pounds (or kilograms) of nitrogen and not to exceed a total formula weight of 2204 pounds (or 1002 kgs).
The following information can be determined:
1. Room available for nitrogen materials: 789 pounds (359 kgs). (2204 lbs. minus the weight of the other materials or 1002 kgs minus the weight of the other materials)
2. Analysis of the highest nitrogen material: Ammonium Nitrate = 0.343. Analysis of the lowest nitrogen material: Ammonium Sulphate = 0.214. Difference between the two analyses: (0.34 - 0.21) = 0.135. Amount of nitrogen required: 221 lbs. (from formula specifications) which is 100 kgs.

2013 | Bulk Blend Quality Control Manual | 29 Canadian Fertilizer Institute
Section C
Method:
1. Multiply the room in the formula by the analysis of the lowest material to obtain the maximum pounds (or kilograms) of nutrient that can be obtained from the lowest analysis material. If this is more than the pounds (or kilograms) of nutrient required, this calculation is not needed as all of the nutrient can be obtained from the lowest analysis material.
2. Subtract the pounds (or kilograms) of nutrient that can be obtained from the lowest analysis material from the amount of nutrient required to determine how many pounds (or kilograms) of the nutrient must be obtained from the high analysis material.
3. Divide the results of step 2 by the difference of the two analyses, expressed as a decimal, to obtain the pounds (or kilograms) of the highest analysis material required.
4. Subtract the pounds (or kilograms) of the highest analysis material required from the room in the formula to obtain the pounds (or kilograms) of the lowest analysis material required.
Calculations:
1. 789 lbs. (359 kgs). x 0.21 = 166 lbs. (or 75 kgs)2. 221 - 166 = 553. 55 / 0.13 = 423 lbs. (or 192 kgs) of Ammonium Nitrate required4. 789 - 423 = 366 lbs. (or 166.3 kgs) of Ammonium Sulphate required
Always round the amount of the highest analysis material required, up to the next whole number.
5. Checking: 423 x 0.34 = 144 lbs. (65 kgs) of N from Ammonium Nitrate 366 x 0.21 = 77 lbs. (35 kgs) of N from Ammonium Sulphate 789 (Room) 221 lbs. (100 kgs) of nitrogen required
The formula now becomes:
Weight Material N P2O5 K2O Zn
368 lbs.
(167 kgs)
0-0-60 221 lbs.
(100 kgs)
959 lbs.
(436 kgs)
0-46-0 441 lbs.
(201 kgs)
88 lbs.
(40 kgs)
50% Zn 44 lbs.
(20 kgs)
423 lbs.
(192 kgs)
34-0-0 144 lbs.
(65 kgs)
366 lbs.
(166 kgs)
21-0-0 77 lbs.
(35 kgs)
2204 lbs.
(1002 kgs)
Totals 221 lbs.
(100 kgs)
441 lbs.
(201 kgs)
221 lbs.
(100 kgs)
Per cent (%) 10 20 10 2

30 | Bulk Blend Quality Control Manual | 2013
Section C
Canadian Fertilizer Institute
This is a commonly used calculation and a calculation sheet can be very helpful. If used to solve example 7, it would be filled in as follows:
Data Calculation Steps Calculations
Room 789 Room x Low Analysis = 1 789 x 0.21 = 165.69
High Analysis 0.34 # Nutrient Req. - (1) = (2) 220.57 - 165.69 = 54.88
Low Analysis 0.21 (2) + Diff. = # High material req. 54.88 + 0.13 = 55.01
Difference 0.13 Room - # High material = # Low
material.
789 - 423 = 366
# Nutrient Required is 220.68
Proportioning three materials containing only two nutrients so that no filler is required.
The above short cut method cannot be used if one of the materials contains two nutrients. If they do, algebraic equations have to be set up and solved.
EXAMPLE 8:
Calculate a formula to meet the following requirements. No filler is to be used.
Weight Material N P2O5 K2O
184 lbs.
(84 kgs)
0-0-60 110 lbs.
(50 kgs)
0-46-0
21-0-0
0-46-0
2204 lbs.
(1002 kgs)
Totals 155 lbs.
(70 kgs)
705 lbs.
(320 kgs)
110 lbs.
(50 kgs)
Per cent (%) 7 32 5
Calculations:
1. Let X = Pounds of 18-46-0 (DAP) Let Y = Pounds of 21-0-0 (Ammonium Sulphate) Let Z = Pounds of 0-46-0 (Triple Super Phosphate)
2. Weight Equation: X + Y + Z + Weight of Muriate of Potash = 2204 lbs. (or 1002 kgs) X + Y + Z = 2204 -184X + Y + Z = 2020 X = 2020 - Y - Z Note: Other materials, such as minor elements, could be used in the formula as long as their weight was included in the equation.
2013 | Bulk Blend Quality Control Manual | 31 Canadian Fertilizer Institute
Section C
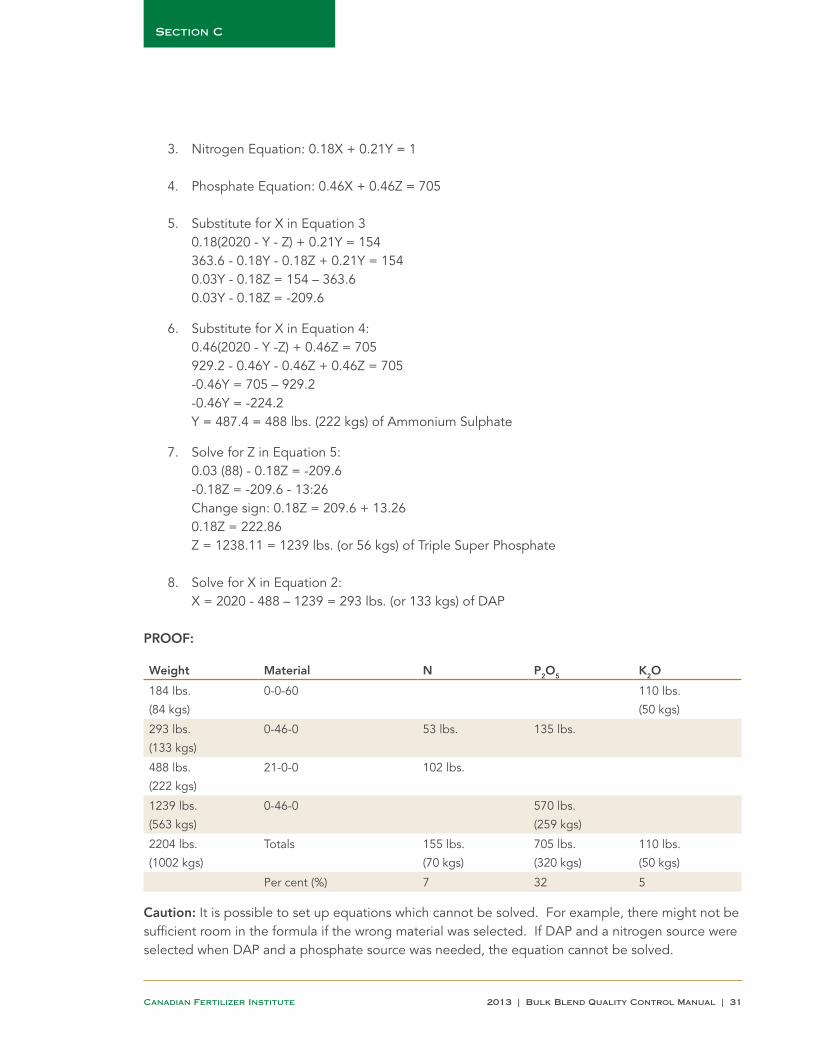
3. Nitrogen Equation: 0.18X + 0.21Y = 1
4. Phosphate Equation: 0.46X + 0.46Z = 705
5. Substitute for X in Equation 3 0.18(2020 - Y - Z) + 0.21Y = 154 363.6 - 0.18Y - 0.18Z + 0.21Y = 154 0.03Y - 0.18Z = 154 – 363.6 0.03Y - 0.18Z = -209.6
6. Substitute for X in Equation 4: 0.46(2020 - Y -Z) + 0.46Z = 705 929.2 - 0.46Y - 0.46Z + 0.46Z = 705 -0.46Y = 705 – 929.2 -0.46Y = -224.2
Y = 487.4 = 488 lbs. (222 kgs) of Ammonium Sulphate
7. Solve for Z in Equation 5: 0.03 (88) - 0.18Z = -209.6 -0.18Z = -209.6 - 13:26 Change sign: 0.18Z = 209.6 + 13.26 0.18Z = 222.86 Z = 1238.11 = 1239 lbs. (or 56 kgs) of Triple Super Phosphate
8. Solve for X in Equation 2: X = 2020 - 488 – 1239 = 293 lbs. (or 133 kgs) of DAP
PROOF:
Weight Material N P2O5 K2O
184 lbs.
(84 kgs)
0-0-60 110 lbs.
(50 kgs)
293 lbs.
(133 kgs)
0-46-0 53 lbs. 135 lbs.
488 lbs.
(222 kgs)
21-0-0 102 lbs.
1239 lbs.
(563 kgs)
0-46-0 570 lbs.
(259 kgs)
2204 lbs.
(1002 kgs)
Totals 155 lbs.
(70 kgs)
705 lbs.
(320 kgs)
110 lbs.
(50 kgs)
Per cent (%) 7 32 5
Caution: It is possible to set up equations which cannot be solved. For example, there might not be sufficient room in the formula if the wrong material was selected. If DAP and a nitrogen source were selected when DAP and a phosphate source was needed, the equation cannot be solved.

32 | Bulk Blend Quality Control Manual | 2013
Section C
Canadian Fertilizer Institute
III. TO CALCULATE A SOIL TEST FORMULA:
General:
The nutrient requirements that must be met by this type of formula are usually determined by testing the soil in which the crop is to be grown for the existing nutrient levels and then comparing these levels to those necessary to grow the crop. The additional nutrients needed are then calculated and applied as a fertilizer mixture. After the nutrients have been determined, the formula calculations are first made on the basis of one acre and then converted into a tonne basis.
EXAMPLE 9:
The customer’s soil test recommendation calls for the following application per acre: He wants 100 acres fertilized.
Nitrogen 130 pounds (59 kgs) as N Phosphate 120 pounds (55 kgs) as P2O5 Potash 180 pounds (82 kgs) as K2O Water Soluble Magnesium 20 pounds (9 kgs) as WS Mg Sulphur (Minimum) 30 pounds (14 kgs) as S Zinc 5 pounds (2 kgs) as Zn
He has decided to apply 30 pounds of nitrogen as a “side dresser” at a later date and to obtain the rest of the nutrients from one application of a fertilizer mixture.
Problem:
Calculate:
A. The materials required to fertilize one acre. B. The application rate per acre. C. Analysis of the mixture. D. The materials required to make one tonne of the fertilizer. E. Tonnes of the mixture required. F. Approximate Bulk Density.
Calculate the materials required to fertilize one acre:
1. Materials Available: DAP, Urea, Ammonium Sulphate, and Muriate of Potash, Sulphate of Potash-Magnesia (SPM) and Zinc Sulphate. The analyses of Sulphate of Potash-Magnesia are 22% K2O, 11% WS Mg and 22% S. The analysis of the Zinc Sulphate is 36% Zn. Disregard the Sulphur content.
General Calculation Method:
First, calculate the materials needed to fertilizer one acre. All other information required can be calculated from this data. Since a specific amount of SPM must be used, it will have to be calculated first. The SPM will supply all of the WS Mg required and part of the Potash and Sulphur.

2013 | Bulk Blend Quality Control Manual | 33 Canadian Fertilizer Institute
Section C
2. Materials Required:
Amount of sulphate of Potash-Magnesia needed to supply 20 lbs. (9 kgs) WS Mg:
Water Soluble Magnesium (WS Mg): 20 lbs. (9 kgs) required / 0.11 (WS Mg in SPM) = 182 lbs. (or 83 kgs) SPM
Sulphur (S) supplied: 182 lbs. (83 kgs) SPM x 0.22 S = 40 lbs. (18 kgs) S
Potash (K2O) supplied: 182 lbs. (83 kgs) SPM x 0.22 K2O = 40 lbs. (18 kgs) K2O
Note that the minimum sulphur requirement has been fulfilled.
Amount of Muriate of Potash needed to supply the additional K2O:
Potash: Total needed: 180 lbs. (82 kgs) From SPM 40 lbs. (18 kgs) Additional needed 140 lbs. (64 kgs)
Muriate of Potash required: 140 lbs. (64 kgs) K2O needed / 0.60 K in Muriate = 234 lbs. (106 kgs)
3. Determine whether to calculate the nitrogen or the phosphate requirement first: The P/N ratio of the nutrients is 120/(130-30) = 120/100 = 1.2. This is less than the DAP ratio of 2.56. Therefore, the phosphate requirement has to be calculated first.
4. DAP required to supply 120 lbs. (55 kgs) phosphate: 120 lbs. (55 kgs) / 0.46 P in DAP = 261 lbs. (119 kgs) Nitrogen supplied by the DAP: 261 lbs. (119 kgs) DAP X 0.18 (N in DAP) = 47 lbs. (21 kgs)
5. Nitrogen: Since the sulphur requirement was filled by the Sulphate of Potash-Magnesia, Urea, can be used to supply the rest of the nitrogen.
Urea required to supply the additional Nitrogen required: Total nitrogen per acre needed: 130 lbs. (59 kgs) To be obtained from “Side Dressing”: (30) lbs. (14 kgs) Nitrogen obtained from DAP: 47 lbs. (21 kgs) Balance required: 53 lbs. (24 kgs)
Amount of urea required: 53 lbs. (24 kgs) required / 0.46 N in Urea = 116 lbs. (53 kgs)
6. Pounds of Zinc Sulphate needed to supply 5 lbs. (2 kgs) of Zn. 5 lbs. (2 kgs) required / 0.36 Zn in Zinc Sulphate = 14 lbs. (6 kgs)

34 | Bulk Blend Quality Control Manual | 2013
Section C
Canadian Fertilizer Institute
The completed calculation sheet for one acre would show:
Material Weight N P2O5 K2O WS Mg S Zn
Urea 116 lbs.
(53 kgs)
53 lbs.
(24 kgs)
DAP 261 lbs.
(119 kgs)
47 lbs.
(21 kgs)
120 lbs.
(55 kgs)
Muriate of Potash 234 lbs.
(106 kgs)
140 lbs.
(64 kgs)
SPM 182 lbs.
(83 kgs)
40 lbs.
(18 kgs)
20 lbs.
(9 kgs)
40 lbs.
(18 kgs)
Zn Sulphate 14 lbs.
(6 kgs)
5 lbs.
(2 kgs)
Totals and
required:
807 lbs.
(367 kgs)
100 lbs.
(45 kgs)
120 lbs.
(55 kgs)
180 lbs.
(82 kgs)
20 lbs.
(9 kgs)
40 lbs.
(18 kgs)
5 lbs.
(2 kgs)
b. Application rate per acre:
Since the amount of each nutrient in the calculated mixture equals the amount requested, the calculated weight of 807 pounds (or 367 kgs) will have to be applied per acre.
c. Calculate the analysis of the mixture:
Method:
The pounds (or kilograms) of each nutrient in the mixture divided by the pounds (kilograms) to be applied per acre multiplied by 100 gives the per cent of each nutrient in the formula. The calculation is shown here for pounds only.
Nutrient lbs. Div. % Nutrient
N 100 807 x 100 12.39 % Nitrogen
P2O5 120 807 x 100 14.87 % Phosphate
K2O 180 807 x 100 22.30 % Potash
WS Mg 20 807 x 100 2.48 % WS Magnesium
Sulphur 40 807 x 100 4.96 % Sulphur
Zinc 5 807 x 100 0.62 % Zinc
d. Calculate the materials required per tonne of fertilizer:
Method:
For pounds, determine the conversion factor by dividing 2204 pounds (formula weight) by the pounds per acre. Then multiply the weight for each material per acre by this factor. Therefore the factor is: 2204 / 807 = 2.7311. For kilograms, the factor is 1102 kgs / 367 = 2.73.

2013 | Bulk Blend Quality Control Manual | 35 Canadian Fertilizer Institute
Section C
Amounts of each material required per tonne:
Material lbs./ac. Factor lbs./tonne kgs/tonne
Urea 116 x 2.7311 371 144
DAP 261 x 2.7311 713 324
Muriate of
Potash
234 x 2.7311 639 291
SPM 182 x 2.7311 497 226
Zn Sulphate 14 x 2.7311 38 17
Total 807 x 2.7311 2204 1002
e. Calculate the tonnes of the mixture required:
Method:
The number of acres to be fertilized multiplied by the pounds per acre to be applied divided by 2204 equals the tonnes needed.
Calculation:
(100 acres x 807 lbs. (367 kgs) per acre) / 2204 (1002 kgs) = 37 tonnes needed
f. Approximate Bulk Density:
The amount of fertilizer to be spread per acre is usually specified in pounds but a spreader truck is actually a mobile volumetric feeder and its output is measured in cubic feet. The volume spread per acre depends on the equipment setting and the speed of the truck. In order to convert the output from cubic feet to pounds the operator needs to know the bulk density of the blend.
Bulk density is determined by both chemical and physical factors and is expressed as Pounds per Cubic Foot. The true bulk density of a blend can only be determined by collecting a representative sample and then weighing one cubic foot. However, it is possible to calculate an approximate bulk density that will usually be close to the true weight. The bulk density of the same material manufactured by different companies may or may not be the same. In fact, it can vary from shipment to shipment. Always use the most accurate bulk density obtainable when making calculations for the bulk density of a blend. At first glance, it would appear that the bulk density of a blend could be calculated by using the weighted average of the bulk density of the materials in the blend. This can be done, but a more accurate method is to determine the “volume” occupied by each material and then convert this volume to weight.
Method:
1. Calculate the number of cubic feet that will be occupied by one tonne of each material used.2. Convert this to the cubic feet that will be occupied by the pounds of each material in the
blend.

36 | Bulk Blend Quality Control Manual | 2013
Section C
Canadian Fertilizer Institute
3. Sum these to determine the total volume occupied by one tonne of the blend.4. Then calculate the weight of one cubic foot of the blend.
Calculations:
1. Volume occupied by one tonne 2204 lbs. (1002 kgs) of each material: 2204 lbs./ tonne x 1 Cu. Ft. /lbs. = Cu. Feet/Tonne Example Urea: 2204 lbs. / tonne x 1 Cu. Ft. / 48 lbs. (21 kgs) = 46 Cu. Feet/Tonne
2. Volume occupied by the pounds of each material in the blend. Pounds of material x Cubic Feet / Tonne x 1 tonne / 2204 lbs. = Cubic Feet Volume occupied by the kilograms of each material in the blend: Kilograms of material x Cu. Feet / tonne x 1 tonne / 1002 kgs = Cubic Feet Example Urea: 317 lbs. (144 kgs) x 45.95 Cu. Ft. /Tonnes x 1 tonne/ 2204 lbs. (1002 kgs) = 6.61 Cubic Feet
3. Summing these calculations:
Material Weight Bulk Density Material Volume
Cu.Ft./tonne
Cubic Feet Occupied/
Material in one tonne of
blend
Urea 317 lbs.
(144 kgs)
47.96 45.95 6.61
DAP 713 lbs.
(324 kgs)
62.50 35.26 11.41
Muriate of
Potash
639 lbs.
(291 kgs)
64.90 33.96 9.85
SPM 497 lbs.
(226 kgs)
97.56 22.59 5.18
Zn Sulphate 38 lbs.
(17 kgs)
79.85 27.60 0.48
Total 2204 lbs.
(1002 kgs)
33.53

2013 | Bulk Blend Quality Control Manual | 37 Canadian Fertilizer Institute
Section C
4. Then the weight of one cubic foot of the blend can be calculated by proportion:
If: 33.53 cubic feet = 2204 lbs. (1002 kgs) Then: 1 cubic foot = X lbs. X = 2204 lbs. (1002 kgs) / 33.53 Cu. Ft. = 66 lbs. (30 kgs) per cubic foot
Formula Cost: The cost per tonne or the cost per acre can be determined by using the method explained in Section C. II.
Final Check: Calculation errors can and do occur. They can be very expensive. Careful checking is a must. Always:
1. Double check grade requirements.2. Double check material analysis.3. Double check material cost.4. Double check multiplication results.
Then double check that they add to amounts needed.
RATIO FORMULAS:
Using a computer formulation program, the maximum ratio possible from a specific mix of material can easily be calculated. If a ratio happens to fit the soil test requirements, the amount to be applied per acre can be calculated.
Example:
Customer request: Apply enough fertilizer to supply 50 pounds (23 kgs) of nitrogen, 100 pounds (46 kgs) of phosphate and 100 pounds (46 kgs) of potash per acre using Urea, DAP, and Muriate of Potash.
Calculations:
1. Ratio: (50 – 100 – 100) / 50 = 1 – 2 – 2
2. Maximum grade from table: 12.26--24.52--24.52
3. Determine pounds of blend to be applied per acre:
The pounds of a nutrient requested per acre divided by the per cent of the nutrient in the blend, expressed as a decimal, equals the pounds of the blend to be applied.
Nitrogen: 50 / 0.1226 = 408 lbs. (186 kgs)

38 | Bulk Blend Quality Control Manual | 2013
Section C
Canadian Fertilizer Institute
Checking:
Phosphate: 100 / 0.2452 = 408 lbs. (186 kgs)
Potash: 100 / 0.2452 = 408 lbs. (186 kgs)
If the application rate is too low, filler can be added to reduce the nutrient guarantee and to increase the application rate needed.

2013 | Bulk Blend Quality Control Manual | 39 Canadian Fertilizer Institute
Section D
D. PLANT OPERATIONS AND HOUSEKEEPING
This chapter will deal with the operations which take place in receiving, storing, blending and shipping dry fertilizer blends. It points out the good manufacturing practices which are necessary to produce and maintain quality uniform blends. As with the practices described elsewhere in this manual it should be emphasized that no one practice is more important than another; it is by implementing good manufacturing practices in every phase of your operation that you will be assured of producing quality products. This will enhance both your operation’s reputation and profitability.
I. Receiving MaterialsRail cars and trucks bringing materials into the plant should be inspected before unloading. Always visually compare the product with the bill of lading to make sure that you are receiving the correct product. If there is any doubt, refer to the material identification section of this manual (Section B.V.) for help or seek other advice. Never put a questionable material into a bin which already contains product. Before unloading, make sure that the equipment to be used and the storage area is clean and dry. If necessary clean and remove any material which could contaminate the new product. Never assume all is in order. Verify that all is ready for use. Check that the equipment is set to deliver to the proper bin. Make sure there is room in the receiving bin to hold all the material to be received and check during unloading to make sure there are no leaks, no spillage is occurring, and that the bin is not filling to overcapacity and running into an adjacent bin. Bins must always be properly and legibly labeled.
Occasionally sampling materials which are being received to have them checked for analysis and/or particle size is a good practice. (See Section B for “Method for SGN Determination.”) Often the best time to do this is while the product is being received. If there is a point in your system where a falling stream of product is accessible, you should take a sample there. See the sampling section of this manual for instructions. Most currently available materials are pretty uniform with regard to chemical composition but may vary throughout unloading with respect to particle size; hence it is important that a representative sample be taken, especially if you want to measure the average size of the material. Samples that are taken should be properly labeled and either sent for analysis or retained for possible future reference. If you want to retain part of a sample, follow the instructions in the sampling section of this manual for properly splitting samples. Unless you are going to immediately receive another load of the same product, you should thoroughly clean and service you’re receiving equipment as soon as you are finished with it. Sweep up any spillage and put it in the proper bin. If spilled product is left lying where it dropped it will soon be worthless. Good housekeeping is very important for quality control and minimizing losses.

40 | Bulk Blend Quality Control Manual | 2013
Section D
Canadian Fertilizer Institute
II. Material Storage and ReclaimOne of the most important things you can do while materials are being brought into your plant and moved to storage bins is to devise ways to prevent the formation of conical piles. Although most modern blend materials have a limited range of particle size there will always be enough variation to cause particle size segregation if the material is allowed to cone. Smaller granules will always remain under the drop point and larger ones will roll down to the outside of a conical pile making it difficult to reconstitute the material into its original average particle size for blending with other materials. The key to preventing coning is to cause the material to fall from more than one point, thus forming many small piles. This can be accomplished by moving the tripper on an overhead belt and/or by using baffles under the discharge point to spread the flow of material over a larger area. Often it is as simple as hanging a piece of plywood on either side of a falling stream of material so that some falls directly through the opening between the sheets and the rest is split into two streams, one falling on either side of the center. This works well in small enclosed bins. A trapezoidal shaped flow diverter with a hole in the center will help prevent coning in larger bins. This is particularly useful if the discharge chute is in the center of the bin.
When materials are put into overhead hoppers for storage or to feed a mixer or weigh hopper, the hoppers should be equipped with internal baffles as described in the plant equipment section of this manual. This system will insure that the material will discharge from the hopper in a way that will minimize segregation. When materials are removed from storage bins or piles care must be taken to reduce the effects of any segregation which is present in the pile. A front end loader operator must never repeatedly enter a pile at the same point but should work back and forth from one side to the other, even in small bins. When a high vertical face or overhang develops at the front of a pile it should be knocked down to a safe level before continuing to remove material. Never ignore good safety practices. In addition, knocking down a pile face usually causes some mixing and increases the uniformity of the material.
Many times it is desirable to screen materials to ensure that no large lumps or extraneous material gets into the finished blend. If this is the case, the material should pass through the screen before it is weighed and blended, never after, as the screening process will cause severe un-mixing to take place.
When time permits, it is good practice to sample materials to be blended and perform tests such as the volumetric screen tests with two screens and straight bottles or use the “SGN” scale as described in the materials chapter of this manual. This will tell you how well you can expect your blends to stay mixed using your current materials. It is also a good guide to compare with tests when materials were received to see how good a job you are doing to minimize segregation in your handling and storage operations.
III. WeighingGood housekeeping and routine maintenance are very important in maintaining scale accuracy. Your scales should be regularly checked. After checking that the weigh hopper, or mixer in the case of a scale mounted mixer, is clean and empty, make sure the scale reads zero. If not, adjust it. Add a set of fifty pound check weights to the scale, two to four hundred pounds is enough. The scale should

2013 | Bulk Blend Quality Control Manual | 41 Canadian Fertilizer Institute
Section D
now read exactly the total of the weight added. Bring materials into the weigh hopper to about the middle of your normal weighing range and note the exact reading. Remove the weights and verify that the scale reads exactly that amount of weight less. Next add material to near the upper range of the scale and note the exact weight. Again add the check weights and read to make sure the scale shows the correct value. This system checks the accuracy of your scale through the entire range you use. If it is not possible to make any corrections indicated, you should call a scale professional immediately. Your scale should be protected by guard rails or beams to prevent it from being bumped by front end loaders. This will help to prolong the accuracy and life of the scale.
Before every use, the zero reading should be verified. Always check that you are using the correct formula with the current material analysis before weighing. On dial scales, use dial pointers or a felt pen to indicate the cumulative scale readings, especially if a front end loader operator is adding material and reading the scale. Even a very experienced operator cannot consistently weigh correctly if he has to search the dial for the correct weight without the aid of a mark at the proper place. Trim any overweight’s if possible. If it is not possible to do this, never deduct the amount of overweight from the next material in the sequence unless the next material is filler. If it is not filler, carry the overweight from the rest of the weighing sequence to the end. If the formula contains filler, which should always come last in the weighing sequence for this reason, deduct the overweight from the filler. If no filler is present, that batch will then be over by the amount of the overweight. This will cause a slight dilution of the overall analysis but will not grossly short any nutrient. Of course if an overweight is by a gross amount, say in excess of one per cent of the batch weight, and cannot be removed, consideration should be given to reformulating the product. In some cases it is advisable to weigh materials in a given order. This is most often true if a weigh hopper is used and there are more than desirable size differences and also density differences. If you feel this is the case it is better to weigh the larger and lighter materials first. The smaller and denser materials will tend to sift through and give a better mix.
Split weighing of a raw material used at the rate of 1000 or more pounds to the tonne can improve the blending efficiency (although it may slightly increase the time required for a blend and requires an additional weighing). More efficient blending occurs when smaller amounts of material are in a blender. If the high weight material is filler, split weighing will allow compensation for other component overages at the end of the mix. When this technique is used about one-half of the material should be added at the front of the blend and the remaining material at the end.
Some types of blenders have individual small bins for each component and use augers to introduce the material into a large horizontal auger for mixing prior to discharge. These blenders have a large through- put and are very dependent on proper calibration of discharges from the smaller hoppers. These blenders are frequently computer controlled and depend on the proper ratios of raw materials to produce a quality blend. This ratio is dependent on known and accurate bulk density measurements of the raw materials blended. Bulk densities can change as new raw material shipments care received or if the bin material is not consistent in particle size. If the blender operator has any reason to suspect changes in bulk density in the raw materials used, he should recalibrate the discharge augers to correct this problem. The manufacturer’s written instructions should be used to establish calibration frequency for routine operation.

42 | Bulk Blend Quality Control Manual | 2013
Section D
Canadian Fertilizer Institute
One relatively new type blender is a declining weight volumetric blender. These blenders utilize product bins mounted on load cells and are usually computer controlled. Auto-calibration is performed as frequently as every 15 seconds for each bin as the product is blended. These units usually use automatic meter screw output to correct for changes in product densities and differences in flow.
IV. Mixing/BlendingThe function of a mixer is to produce a uniformly blended product, but it is just as important that it has the ability to discharge the mixture without causing it to un-mix. This can happen when larger granules roll over and away from smaller ones. When granular materials became available and blending started, many old concrete mixers were converted to blenders. When the rotation was reversed to empty the mixer, the discharge stream was found to be severely segregated. The Tennessee Valley Authority (TVA) discovered that two inch holes cut into the flights helped to alleviate this. Modern inclined axis, reverse discharge mixers are engineered to use granular materials and have minimized this problem. There are many types of mixers available today, but whichever type you have it is good practice to monitor the discharge stream for uniform appearance since wear and tear, build-up in the mixer, and inadequate maintenance will degrade the performance of the mixer.
It is important to know the best operating conditions of your mixer. The manufacturer will have recommendations as to mixing time and capacity, but you should also do your own evaluation to determine the best mixing time for each size batch. A good way to make the evaluation is to blend your normal batch size using two not very well matched materials for a predetermined length of time. Take several equally time spaced samples from the discharge stream. Have the samples analyzed and compare the results. This procedure can be repeated with combinations of mixing time and batch size. The combination which gives the greatest uniformity is the best operating condition for your mixer. A method to compare results is listed in the appendix of this manual.
Routine maintenance is important. Clean and service the mixer on a regular basis. Don’t let material build up on the mixing surfaces and keep corrosion under control. Make sure all parts are functioning properly; for example, check that the gate on a horizontal rotary type doesn’t leak, check that there is not excess clearance between the shell and the paddles on a paddle mixer and that the augers are moving all of the material on an auger type mixer. Each type will have its own characteristics and close observation will make the wear points and necessary maintenance obvious. As with other parts of the plant, sweep up spills as often as possible and keep the mixer area clean. Good housekeeping is a very important good manufacturing practice.
V. ShippingIn nearly all blend plants finished blends are either shipped in bulk immediately, or they are bagged. It is rare that this type of product is stored in bulk in bins because of the severe segregation which can occur unless the materials are very closely matched in size.

2013 | Bulk Blend Quality Control Manual | 43 Canadian Fertilizer Institute
Section D
It is best that the mixer and shipping operation be located in close proximity to one another. When it is necessary to transport blends a long way over some type of conveyor, vibration causes finer particles to settle to the bottom of the flowing stream. If this situation is unavoidable a mixing baffle at the discharge end is useful in recombining the blended product. There should not be a restriction in the flow which will cause the mix to cone and thereby segregate. Any discharge belts must be in good shape and have good cleats. Poor cleats may allow the material to segregate as the belt moves by allowing the smaller material to move more rapidly than the larger material. Poor cleats will cause the material not to move evenly on the belt and can actually un-mix the blend. This problem becomes more severe when the belt transfers material at an incline and is not horizontal to the floor.
If the product is discharged into a holding hopper over either a bulk load out or a bagger, the hopper should be equipped with ant segregation dividers. Construction of these is described in the equipment section of this manual. As mentioned earlier in this chapter, never screen a blended product. If screening is necessary do it before the product is mixed.
If the product is to be bagged, check the bagging equipment to be sure it has been thoroughly cleaned before using it. Verify that it is set to deliver the correct weight for the grade you will be bagging. If you are loading in bulk always check the vehicle to be sure it is empty, clean, and dry. Use some device to prevent the product from coning in the vehicle; a flexible hose moved around during loading will accomplish this and will also minimize dust.
Periodic samples should be taken of finished products with some frequency to assure you are producing a quality product. If initial samples show less than acceptable results, sampling frequency should be increased until the causes are corrected and found analyses are in line with guarantees. When this is accomplished samples can be taken less frequently to monitor performance. Whenever possible it is preferable to take stream samples. There is usually some place in the system where a falling stream can be made safely accessible to take a stream sample. The sampling section of this manual describes the proper procedure.
VI. Secondary and Micro NutrientsThe customary rule of thumb is that if a minor nutrient carrier comprises 5% or more of the formula weight (110 lbs./50 kgs per tonne), it should be used as a granular material in size comparable to that of the major nutrient materials. When the minor nutrient additive represents less than 5% of the formula weight, it is recommended that a powdered material be used. Good homogeneity can be obtained when a liquid binder is used to adhere the powdered minor ingredient additive to the surface of the major nutrient particles. Usually from one to three per cent by weight of binder fluid is required. This quantity should not cause physical condition problems. Fluids also are beneficial in controlling fugitive dust. The weight of any fluid used must be included when calculating the formula.
The fluids which are satisfactory as binding or sticking agents include oils, UAN solutions, ammonium polyphosphates, and sometime water. Generally, the heavy viscosity oils are more effective. Oils should be used sparingly, or avoided altogether, if the product will be bagged. Oils frequently bleed through paper bags and cause damage to plastic bags. Oils should not be used if ammonium

44 | Bulk Blend Quality Control Manual | 2013
Section D
Canadian Fertilizer Institute
nitrate is a constituent of the formulation. Oil sensitizes ammonium nitrate increasing the risk of fire or explosion. Excessive amounts of water should be avoided. If water is used it should be as a very fine spray and in such a quantity not to affect the flow ability of the blend.
Bagged products which contain fluid binders will cake more readily than ordinary blends, so storage time should be held to a minimum. The procedure for adhering powdered materials to the surface of granular materials is as follows.
1. Charge all of the granular fertilizer materials to the mixer and mix for one half of the recommended time.
2. Add the calculated amount of powdered minor nutrient carrier to the mixer. Spray the fluid binder onto the surface of the moving bed of materials in the mixer. A fine spray carefully positioned to impinge upon the materials and not on the shell of the mixer is best. Various nozzle manufacturers specify the flow rates, spray patterns and the corresponding pressures in their catalogs. Nozzles should be chosen that will deliver the desired amount of fluid in one minute at above 25 psi. A pressurized tank or pump will be needed to provide the required nozzle pressure.
3. Continue mixing for the remainder of the recommended mixing time after the fluid binder has been added and then discharge the mixer.
The blend made by the above described procedure should be taken to the field and applied shortly after being made. The fluid binders often are absorbed into the granules in a relatively short time, causing the surface-adhered powders to fall off.
VII. Pesticides It is strongly recommended that separate blending systems be used for pesticides. This is not always possible so it is very essential that every precaution be taken to prevent contamination from batch to batch. The manufacturers of the various crop protection chemicals provide very detailed instructions concerning the compatibility of their product with the fertilizer materials in common use. They also cover the safety requirements for their products. These instructions must be thoroughly reviewed and understood by all blending plant employees prior to their use in blends.
The term “impregnation” has been used to describe the practice of adding chemicals to fertilizers. The procedure is essentially the same as described in paragraph VI for adding fluid binders:
1. Charge all of the granular fertilizer materials to the mixer and mix for one half of the recommended time.
2. Spray the liquid pesticide onto the surface of the materials as they tumble over in the mixer. Avoid impinging the liquid on the bare surface of the equipment.
3. Select spray nozzles that will produce a satisfactory droplet pattern, and will deliver the required amount of liquid in about one minute at 20-25 psi. A pump is used to provide the necessary pressure.

2013 | Bulk Blend Quality Control Manual | 45 Canadian Fertilizer Institute
Section D
4. After the pesticide has been added, continue mixing for the remainder of the recommended time and then discharge the mixer.
CAUTION. DO NOT USE OIL BASED PESTICIDE CARRIERS OR OTHER ORGANIC SOLVENTS WHEN AMMONIUM NITRATE IS A CONSTITUENT OF THE BLEND. THESE PESTICIDE CARRIERS OR SOLVENTS ARE NON-COMPATIBLE WITH AMMONIUM NITRATE. ALWAYS CHECK WITH THE MANUFACTURER.
Sometimes fertilizer-pesticide mixtures are sticky and difficult to handle. In that event a conditioning agent such as kaolin clay, talc, powdered vermiculite, etc., may be needed. Usually only ten to twenty pounds per tonne will overcome the problem.
It is usually not recommended that granular forms of pesticides be used in blends. Particle size and density are seldom similar and segregation will result.
The mixer should always be completely cleaned after running a pesticide mix. Also, great care needs to be taken to prevent carry over of one chemical, say for broad-leaf weed control, into a product used for a crop sensitive to this particular chemical.
Very careful segregation of the weed killer products throughout their storage, handling, use in the blend and in subsequent application procedures, is essential.
Once more, read and understand the safety precautions and compatibility restraints on the chemicals that are used in your operations. Serious injury or costly crop damage could be the result of error.
VIII. Batch SheetsBatch sheets, blending formula records, tally sheets, batch tickets, or whatever they may be called locally, are essential records as to the materials used and the quantity of each material in the batch. This is often the only proof that the plant operator has as to what was supplied to the customer.
These records are valuable for inventory control, troubleshooting a complaint and verifying to a grower that he or she received the materials for which he or she was invoiced. The forms should be kept on file until it is clear that no quality problem has occurred.
IX. HousekeepingAgain it is important to emphasize good housekeeping. After all plant operations it is important to clean the equipment and sweep up spills. In plants with overhead belts, keep them very well maintained to minimize spillage into bins and driveways over which they pass. Be always on the alert for contamination, a frequent cause of off-grade blends. Don’t allow bins to leak into one another, either through openings in the walls or by product running out the open fronts of adjacent bins. If you have cluster hoppers don’t let them run over into one another at the top and make sure the gates don’t leak. Don’t allow loader operators to spill product all the way from the bin to the weigh hopper. As much as possible try to confine spillage to the area in front of the bin so that it

46 | Bulk Blend Quality Control Manual | 2013
Section D
Canadian Fertilizer Institute
can be easily scraped or swept back into the bin. Keep driveways free of fertilizer, foreign material, and moisture. Be sure that all bins are correctly labeled. Dust can be a problem but don’t let it accumulate either in the building or on the equipment. It will absorb moisture much more rapidly than the granular materials, accelerate corrosion, cause slippery conditions, and generally contribute to an overall sloppy appearance.
It is a proven fact that a clean plant is usually a well run plant. This is noticed by customers and control officials alike and makes a major contribution to establishing a reputation of which the plant owner and operators can be proud.
X. Plant EvaluationThe following form is suggested for use in evaluating a plant’s adherence to good manufacturing practices. This type of self-audit may be useful in your internal controls or in your communications with regulatory officials.

2013 | Bulk Blend Quality Control Manual | 47 Canadian Fertilizer Institute
Section D
QUALITY CONTROL REVIEW (Blend Plants)
LOCATION: ___________________________________________________ DATE: _____________________
AUDITOR: ________________________________________________________________________________
OVERALL PLANT APPEARANCE: ____________________________________________________________
__________________________________________________________________________________________
__________________________________________________________________________________________
PLANT EQUIPMENT:
A. Plant Scales:
1. Scales routinely calibrated? ________________________________
2. Date of last calibration? ________________________________
3. Condition of Scales? ________________________________
4. Date of last maintenance? ________________________________
Comments: _______________________________________________________________________________
__________________________________________________________________________________________
B. Screens
1. Are raw materials screened? ________________________________
2. Are final products screened? ________________________________
3. Condition of screens? ________________________________
4. Specified screen size in use? ________________________________
5. Grates on loading hoppers? ________________________________
Comments: _______________________________________________________________________________
__________________________________________________________________________________________
C. Raw Material Storage
1. Bin conditions? ________________________________
2. Bins marked legibly? ________________________________
3. Evidence of material contamination? ________________________________
4. Warehouse roof condition? ________________________________
5. Are deconing techniques used? ________________________________
Comments: _______________________________________________________________________________
__________________________________________________________________________________________

48 | Bulk Blend Quality Control Manual | 2013
Section D
Canadian Fertilizer Institute
D. Blenders
1. Equipment condition? _________________________
2. Excessive transfer distance before loadout? _________________________
3. Condition of scales? _________________________
4. Date of last calibration? _________________________
5. Date of last maintenance? _________________________
6. Second check of batch sheets? By whom? _________________________
7. Has a blender time test been made recently? _________________________
8. Are blender flights in good shape? _________________________
9. Does blender have a buildup of old material? _________________________
10. Does blender leak as it runs? _________________________
11. Are storage hoppers equipped with anti-segregation devices? _________________________
12. Are scales protected from damage by loaders? _________________________
Comments: _______________________________________________________________________________
__________________________________________________________________________________________
E. QC Testing
1. Are raw materials being purchased by SGN? _________________________
2. Does the plant run raw materials for SGN? _________________________
3. Has a blender test been made recently? _________________________
If so, when _________________________
4. Does plant routinely sample for analyses? _________________________
5. Does plant have analyses records? _________________________
Comments: _______________________________________________________________________________
__________________________________________________________________________________________
F. Product Evaluation
1. Are most Good (Best) Manufacturing Practices followed? _________________________
2. What GMPs (BMPs) should be used that are not? _________________________
3. Does plant have an acceptable record for returned goods? _________________________
Comments: _______________________________________________________________________________
__________________________________________________________________________________________
G. Bagging:
1. Are bags “check weighed”? How often? ________________________________
2. Check weights recorded? Verified? ________________________________
3. Are scales calibrated? ________________________________

2013 | Bulk Blend Quality Control Manual | 49 Canadian Fertilizer Institute
Section D
4. Date of last calibration? ________________________________
5. Test weights on hand and conditions? ________________________________
6. Test weights log kept? Frequency? ________________________________
7. What is the tolerance on bag weights? ________________________________
Product: ___________________ 1. _________ 4. _________ 7. _________ 10. ________ 13. _______
Weight: ___________________ 2. _________ 5. _________ 8. _________ 11. ________ 14. _______
3. _________ 6. _________ 9. _________ 12. ________ 15. _______
Comments: _______________________________________________________________________________
__________________________________________________________________________________________
H. Bulk Shipping
1. Is equipment in good condition? ________________________________
2. Is there excessive transfer distance before loadout? ________________________________
3. Are hoppers equipped with anti-segregation devices? ________________________________
4. Are trucks inspected before loading? ________________________________
5. Are procedures to prevent coning used during loadout? ________________________________
Comments: _______________________________________________________________________________
__________________________________________________________________________________________
I. Production / Quality Control:
1. Production / raw materials screen samples? ________________________________
2. Test equipment condition? ________________________________
3. Sample log? ________________________________
4. Chemical analyses? Logged? ________________________________
5. Rifflers used? Condition? ________________________________
6. Retain samples (production/raw materials)? ________________________________
7. Samples taken properly? ________________________________
8. Incoming raw materials inspected? Logged? ________________________________
9. Who is responsible for each area of QC? ________________________________
10. Who is second person responsible for QC? ________________________________
11. Sample analysis and storage area? ________________________________
Comments: _______________________________________________________________________________
__________________________________________________________________________________________
Person(s) interviewed: ____________________________________________________
General Comments: _______________________________________________________________________
__________________________________________________________________________________________

50 | Bulk Blend Quality Control Manual | 2013
Section E
Canadian Fertilizer Institute
E. CFI SAMPLING METHODS1 AND PHYSICAL TEST METHODS
I. SamplingAll samples should be taken according to the sampling procedures outlined in this section.
Concerning inbound materials, if there is any doubt about the nutrient content or particle size of a given load, contact the supplier immediately, and coordinate corrective action with him.
It is recommended that each load of material be properly sampled, and, as a minimum, checked for screen size distribution discussed in Section B. For maximum protection, a riffled portion of the composite sample should be chemically analyzed.
Concerning outbound materials, for maximum protection in case of court action, all loads or lots of material should be sampled, retaining the composite until the plant is sure the farmer is satisfied and danger of deficiency is past. Since this procedure is not feasible for all plants, it is recommended that at least one load and/or lot be sampled each producing day, and this sample be retained for possible needed analytical work.
A. Bagged Goods
Scope
A method is described for obtaining a representative sample from a given lot* of fertilizer packaged in bags greater than 10 pounds. If packaged in bags of 10 pounds or less, select one entire bag for sample.
* For purposes of obtaining an official sample, a “lot” shall be represented by an identifiable quantity of commercial fertilizer that can be sampled according to AOAC procedures, up to and including a freight car load or that amount contained in a vehicle, or that amount delivered under a single invoice.
For industry quality control purposes, a “lot” shall be represented by the quantity of a given product made during a specified time period, in storage at, or shipped from a single production point.
Apparatus
1. A slotted single or double tube trier (Figure 1) with solid core pipe constructed of stainless steel or brass. Stainless steel is required for samples on which micronutrients are to be determined. The minimum dimensions of the trier are:
1Fertilizer Sampling and Analytical Methods, TFI Fourth Edition, 1982 or AFPC Sampling Procedures, 10th Edition, 2009.

2013 | Bulk Blend Quality Control Manual | 51 Canadian Fertilizer Institute
Section E
In. Cm
Length, exclusive of handle
(approx. length of filled bag)
25 63.5
Slot length 23 58.4
Slot width 3/4 1.9
Inner diameter 7/8 2.2
2. Container for unground sample -- Capacity 1 L or as required and constructed of corrosion-resistant material with a moisture-proof barrier, or fabricated from material which will not permit moisture to enter or leave the sample.
Procedure
If a lot contains 10 bags or more, randomly select 10 bags and withdraw one core from each. If a lot contains less than 10 bags, withdraw 10 cores, with at least one core from each bag.
1. Take each bag to be sampled and roll or flip over one or more times to ensure product is free flowing. Place in a horizontal position.
2. If a valve-type bag, sample horizontally through valve. If sewn bag, make an x-cut with a knife near seam at corner.
3. With single tube trier, insert horizontally so that it extends diagonally from corner to corner (Figure 2) with slot down. Turn it one-half turn to bring the slot up, jar bag slightly to fill the trier, and remove carefully so as not to drag material out of it with the bag edges.
OR
With double tube trier, insert horizontally as above with trier closed and the slot up. Open trier to fill, jar bag slightly, close trier, and remove from bag.
4. Transfer all 10 cores to the container for unground samples or if desired, each core may be completely transferred to a narrow stainless steel U-shaped trough, slightly longer than the trier length. It is usually fitted with a handle at one end and a pouring spout at the opposite end. The trough is used to transfer sample portions to the larger container which holds the entire composite sample. This is especially helpful when using single tube triers to avoid spillage or loss.
5. Label container of the composited sample with all pertinent information.6. Forward to laboratory for preparation and analysis.
References
1. Methods of Analysis, 18th Edition, 2005. AOAC2. Inspection Manual, AAPFCO.

52 | Bulk Blend Quality Control Manual | 2013
Section E
Canadian Fertilizer Institute
FIGURE 1: Single and double tube trier

2013 | Bulk Blend Quality Control Manual | 53 Canadian Fertilizer Institute
Section E
FIGURE 2: Bag sampling technique – Single tube (bag must be fl at and horizontal)

54 | Bulk Blend Quality Control Manual | 2013
Section E
Canadian Fertilizer Institute
Bulk Goods
Scope
Methods are described for obtaining representative samples from a given lot* of fertilizer in bulk. They are applicable to material during transfer, in single or multi-compartmented trucks, in rail cars, in storage, and in front-end loaders.
* For purposes of obtaining an official sample, a “lot” shall be represented by an identifiable quantity of commercial fertilizer than can be sampled by AOAC procedures, up to and including a freight car load or 50 tons maximum, or that amount contained in a single vehicle, or that amount delivered under a single invoice.
For industry quality control purposes, a “lot” shall be represented by the quantity of a given product made during a specified time period, in storage at, or shipped from a single production point.
Apparatus
1. Stream Sampling Cup -- As shown in Figure 3, a permanent sampling system may be constructed by supporting the cup on a track of two steel rods so that the mouth of the cup is in the path of, and at right angles to the stream flow. Guides attached to the cup and handle on the side permit use of this device.
2. Double tube triers as described below:Compartment
Trier Length OR In. No. Size
Missouri
Compartmented
59 in.
(1.5 m)
1-1/8 in
(2.9 cm)
7/8 in.
(2.2 cm)
8 3 in.
(7.6 cm)
552 Grain 63 in.
(1.6 m)
1-3/8 in.
(3.5 cm)
1-1/8 in.
(2.9 cm)
11 3-1/2 in.
(8.9 cm)
Missouri "D" 49 in.
(1.3 m)
1-1 /4 in.
(3.2 cm)
1 in.
(2.5 cm)
1 43 in.
(1.1 m)
While the first two are officially recognized equipment, the difficulties in use make them rarely used. The Missouri D Tube is most commonly used in the industry today.
3. Container for Unground Sample Capacity 1 L or as required and constructed of corrosion-resistant material with a moisture proof barrier, or fabricated from material which will not permit moisture to enter or leave the sample.

2013 | Bulk Blend Quality Control Manual | 55 Canadian Fertilizer Institute
Section E
Procedure
Collect the sample according to the appropriate following techniques:
1. Transfer belt or spout
Take sample by passing the stream sampling cup (Figure 4) completely through the stream of materials as the material drops from a transfer belt or spout. The long slot in the top of the sampling cup should be at right angles to the falling stream. Pass the cup through the complete stream at a uniform speed, such that the cup will collect approximately equal amounts each pass, but will never overflow. Empty contents of the cup from each pass into a suitable container.
For sampling material with uniform stream flow of 3 minutes or more, such as transfer or shipment from bin or large hopper, or for stream sampling from a continuous production unit, a minimum of 10 equal time-spaced stream cuts must be taken during the transfer operation. Divide the total estimated discharge time by not less than 10 to obtain the time interval between stream cuts. An automatic sampler may be applicable, if it is possible to clean it thoroughly before and after sampling the particular lot or shipment. Avoid sampling a trickle of fines or dust.
For sampling -material from a blender or other batch until which has only short periods of material flow, take a minimum of 10 stream cuts from a spout or at the end of the transfer belt. Take one or more stream cuts for each batch, but vary the moment of the stream cut on consecutive batches. For example, the first batch might be sampled early in the batch discharge, the second near the middle of the discharge, the third batch near the last third of the discharge. Then repeat the collection using the same intervals, or alter to provide longer or shorter intervals.
2. Single compartment truck
Sample the load by the AOAC approved vertical probing procedure. Draw 10 vertical cores.
Insert the Missouri compartmented trier vertically while closed, normally to depth of not less than 4 feet (1.2 m). (The depth for some of the cores will be less if the side of the truck is sloped.) Open the probe until it is filled, close and withdraw. The Missouri D tube (Figure 5) is inserted to the same distance just given but in the open position, closed and withdrawn.
Note: A light Teflon spray on the clean, opposed surfaces of the two tubes will help prevent binding of the instrument.
3. Multi-compartmented truck and hopper cars
When it is necessary to sample a multi-compartment hopper car after it is loaded for shipment, or upon receipt before unloading, follow the official AOAC sampling pattern for each compartment, keeping in mind that it is rather easy to take vertical cores before shipment but extremely difficult after the car or truck is received.

56 | Bulk Blend Quality Control Manual | 2013
Section E
Canadian Fertilizer Institute
The object is to withdraw a minimum of 10 vertical cores, inserting the probe in positions which as closely as possible approximate the AOAC sampling pattern as pictured in Figure 7. Do not insert probe in the center of a cone.
4. Carloads
Preferably, stream sample (as described previously) the material while loading or unloading the car.
If it becomes necessary to sample the material in a box car, use the vertical probing technique as described for single compartment truck. If the pile of material in a box car is coned or ridged, take cores from the positions indicated. When there are two sloped piles in a box car, one at each end, then duplicate the sampling pattern described.
Use one of the double tube triers and insert it to a depth not less than 4 feet (1.2m) in each of the indicated sampling locations. The closed double-compartmented triers are inserted, opened, filled, closed and withdrawn. The Missouri “D” tube is inserted the same distance as just given but in the open position, then closed and withdrawn.
The Missouri “D” tube is the best trier for sampling a car of fertilizer at its destination because it can be driven into the settled mass of fertilizer.
5. Material in storage
The procedure described is that of AOAC which has given good results when sampling either coned, ridged, flat or one-sided piles of material. It is not possible to accurately sample very large piles with the official sampling devices.
Sampling points for vertical cores from bulk storage piles are given in Figures 7A and 7B. Level or flat piles are sampled in a fashion similar to that described for the ridged piles. Withdraw 10 cores (to the maximum possible depth of the trier) from positions indicated in the diagram in Figure 7A using the 552 grain probe, Missouri Compartmented trier or Missouri “D” tube.
The sampling devices are handled in the same fashion as described for the single compartment truck.
A one-sided or sloped pile is sampled at the points illustrated in -the diagram in Figure 7B. Withdraw one vertical core of material from locations marked x, and two cores at locations marked 2x.
These sampling patterns are designed so that cores taken from each location represent approximately equal fractions of the lot.
6. References
1. Methods of Analysis, 18th Edition, 2005. AOAC 2. Inspection Manual, AAPFCO.

2013 | Bulk Blend Quality Control Manual | 57 Canadian Fertilizer Institute
Section E
FIGURE 3: Stream sampling cup
FIGURE 4: Use of stream sampling cup for belt samples

58 | Bulk Blend Quality Control Manual | 2013
Section E
Canadian Fertilizer Institute
FIGURE 5: Missouri “D” tube

2013 | Bulk Blend Quality Control Manual | 59 Canadian Fertilizer Institute
Section E
FIGURE 6: Transfer of core sample from Missouri “D” tube into intermediate container

60 | Bulk Blend Quality Control Manual | 2013
Section E
Canadian Fertilizer Institute
FIGURE 7: Sample points for covered hopper cars and carriers

2013 | Bulk Blend Quality Control Manual | 61 Canadian Fertilizer Institute
Section E
FIGURE 7a: Sample pattern for ridged pile
FIGURE 7b: Sample pattern for one-sided pile
A total of 10 samples needed.
Will have to obtain 2 samples from some grids (randomly).

62 | Bulk Blend Quality Control Manual | 2013
Section E
Canadian Fertilizer Institute
FIGURE 8: Front-end loader sampling

2013 | Bulk Blend Quality Control Manual | 63 Canadian Fertilizer Institute
Section E
Sample Reduction
Scope
Samples received in the laboratory must be reduced in mass to 0.5-1 pound (225-500 g), and stored in airtight containers. Procedures have been developed to standardize those manipulations necessary to reduce solid fertilizer samples. It is recommended that these procedures be carried out in a laboratory environment.

64 | Bulk Blend Quality Control Manual | 2013
Section E
Canadian Fertilizer Institute
Apparatus
1. Sample Reducer or Riffle -- A riffle (Figures 9 and 10) is required of corrosion resistant material and so designed that uniform feeding of sample material, at the top of the rectangular openings, divides the samples into representative halves. The size of the riffle shall be appropriate to the quantity of sample being reduced. Receiving pans must fill riffle from end to end of partitioned section. Gated riffles such as shown in Figure 9 have been shown to do a much better job of uniformly splitting the sample.
For most unground fertilizer samples, the slot openings should be 3/8” to 1/2” (1.0 cm to 1.3 cm) wide.
2. Containers for Samples -- Plastic or glass, 500 mL capacity, wide mouth with airtight cap
3. Procedures Reduction of Unground Sample
A. Using a Riffle or Sample Splitter 1. Make sure that all equipment is clean. 2. Set riffle level, not tilted in any direction. 3. Place two empty pans in position beneath the riffle.
NOTE: When a riffle with a cut-off -gate (Figure 9) is used for splitting the sample, material may be transferred to the hopper directly from the sample collection container, irrespective of its design. The need for a third and fourth pan is eliminated. Step 4 is omitted. Specific handling requirement of Steps 5 and 6 are not necessary as sample splitting does not occur until gate is opened.
4. Transfer the collected sample to one or two of the remaining pans, as required. Each pan should not be more than two-thirds full. Level the surface of the pan before continuing.
5. Using both hands, position the pan containing the sample length-wise over the riffle as near the center as possible, at right angles to the partitions.
6. Rapidly tilt the pan to the hopper so the material will flow evenly from the pan onto the riffle. Collect the entire sample in the pans beneath the riffle.
7. When two pans are required in step 4 for the original collected sample, take the second pan through steps 5 and 6 while leaving the pans in step 6 beneath the riffle. Collect the entire sample in these two pans. Place two empty pans beneath the riffle and repeat steps 5 and 6 at least twice.
8. When required, repeat steps 5 and 7, until sample is reduced to approximately 1 lb. (.5 kg). (If desired, retain the second half as reserve, until the preparation is completed on the portion to be analyzed.)

2013 | Bulk Blend Quality Control Manual | 65 Canadian Fertilizer Institute
Section E
9. Transfer fi nal sample to moisture proof container, and mark for identifi cation.NOTE: The container must be large enough to hold the entire fi nal sample. None should be discarded.
10. When an unground portion of sample is to be supplied to another lab for check analysis, the unground portion sent should be 0.5 lb. (0.25 kg or more in accordance with AOAC Method No. 2.1.05).
11. Clean equipment before storing -or re-use.
References
1. Methods of Analysis, AOAC, 18th Edition, 2005.2. Inspection Manual, AAPFCO.
RIFFLE
FIGURE 9: Riffl e with cutoff gate and two pans

66 | Bulk Blend Quality Control Manual | 2013
Section E
Canadian Fertilizer Institute
FIGURE 10: Sample splitter or riffl e with two pans

2013 | Bulk Blend Quality Control Manual | 67 Canadian Fertilizer Institute
Section E
B. Coning and Quartering
Some locations may not be adequately equipped to riffl e materials and/or product in a proper manner. However, even in the absence of equipment, sample reduction can be done suffi ciently well to give information which will serve to support or refute theories concerning materials or product.
FIGURE 11
1. The sample should be piled in a cone, each shovelful going to the center of the cone and allowed to run down equally in all directions -- this will mix the sample.
2. Then spread out in a circle and fl atten the pile gradually widening the circle with a shovel until the material is spread out to a uniform thickness.
3. Mark the fl at pile into quarters.
4. Reject two opposite quarters.
5. Mix again by shoveling the material into a conical pile, taking alternate shovelfuls from the two quarters saved. Continue the process of piling, fl attening and rejecting two quarters until the sample is reduced to the required size.
Whatever procedure is followed, the ultimate portion to be sent to the laboratory should be at least 1/2 lb. This amount is suitable for running a chemical analysis or determining SGN. The sample must be properly identifi ed and submitted to the laboratory in a sealed container.

68 | Bulk Blend Quality Control Manual | 2013
Section E
Canadian Fertilizer Institute
II.
TABLE H-1 - TESTING SIEVES
TYLER No. USA No. OPENING mm(1) ISO SELECTION(2) LOADING
VOLUME(2)
2 1/2 5/16 8.00 8.00 500
3 0.265 6.70
3 1/2 3 1/2 5.60 5.60 400
4 4 4.75
5 5 4.00 4.00 350
6 6 3.35
7 7 2.80 2.80 240
8 8 2.36
9 10 2.00 2.00 200
10 12 1.70
12 14 1.40 1.40 160
14 16 1.18
16 18 1.00 1.00 140
20 20 0.850
24 25 0.710 0.710 120
28 30 0.600
32 35 0.500 0.500 100
35 40 0.425
42 45 0.355 0.355 80
48 50 0.300
60 60 0.250 0.250 70
65 70 0.212
80 80 0.180 0.180 60
100 100 0.150
(1) From A.S.T.M. E-11-87
(2) In “Solid Fertilizers and Soil Conditioners – Testing Sieving.”
I.S.O. 8397 - Table 1
The recommended load volume is expressed in cubic centimeters, equivalent to grams for a product of bulk density equal to 1.

2013 | Bulk Blend Quality Control Manual | 69 Canadian Fertilizer Institute
Section E
a. Bulk Density
1. Apparent
Scope
A standard method for determining apparent densities of solid fertilizer materials.
Apparatus
1. Bulk density box (Figure 12), (capacity 1 cu. ft.)2. Bulk density cup (Figure 13).3. Scale, suitable capacity with sensitivity to 0.1 lb.4. Straightedge, wood or metal and about 15 inches long and about 5 inches wide.
Procedure
Density Box
1. With filler hopper and supports removed, weigh empty box and record weight to the nearest 0.1 lb.
2. Mount filling hopper to the tared box with gate closed on hopper outlet.3. Completely fill hopper with collected sample of material. Select sample using the
previous method for sample reduction.4. Open hopper gate and allow material to flow by gravity into the box until overflowing.5. Remove hopper and supports from box.6. By means of a straightedge, remove excess material by scraping across the top edge
of box. This must be accomplished without disturbing the material in the container by jarring or shaking.
7. Weigh box and contents and record weight to the nearest 0.1 lb.
Calculation
Apparent bulk density, (lbs. /ft3) = (Wt. of box + contents) - wt. of box
Procedure
Density Cup
1. From suitable container fill cup to overflowing.2. By means of straightedge, remove excess material by scraping across the top edge of
the cup, without tamping or striking.3. Using the cup illustrated in Figure 13a. Balance the beam of the cup on a knife blade.
OR Using the cup illustrated in Figure 13b. Slide the weight across the arm to balance the cup.
4. Read lbs. /ft3 or other calibrations directly from arm of cup.

70 | Bulk Blend Quality Control Manual | 2013
Section E
Canadian Fertilizer Institute
2. Tapped
Scope
A standard method for determining bulk densities (tapped) of solid fertilizers for use in combination with apparent bulk densities for pile inventories of bulk stored materials. The average weight, in lbs. /ft3, of the Apparent Bulk Density and the Bulk Density (tapped) affords a realistic and fairly accurate weight value to use in calculating quantity of material in bulk storage inventories.
Apparatus
1. Bulk density box (Figure 12).2. Scale, suitable capacity with sensitivity to the nearest 0.1 lb.3. Straightedge, wood or metal and about 15 inches long and about 5 inches wide.
Procedure
1. With filling and hopper and supports removed, weigh empty box and record weight to the nearest 0.1 lb. Select sample using previous method for sample reduction.
2. Mount filling hopper to the tared box with the gate closed on hopper outlet.3. Completely fill hopper with collected sample of material.4. Partially open hopper gate to commence flow of material into the box and
simultaneously start tapping or rocking the container to aid in compaction during the filling of the container.
5. After the hopper is empty continue tapping or rocking the container until maximum compaction is obtained. When approaching maximum compaction, gradually decrease intensity of the rocking or tapping action incrementally to complete cessation. This minimizes refluffing of the uppermost material in the container and results in a more uniform compaction of the mass.
6. Remove hopper and supports from box.7. By means of a straightedge, remove excess material by scraping across the top edge of
the box in one stroke.8. Weigh box and contents and record weight to the nearest 0.1 lb.
Calculation
Bulk Density (tapped), lbs. /ft3 = (Wt. of box + contents) - wt. of box

2013 | Bulk Blend Quality Control Manual | 71 Canadian Fertilizer Institute
Section E
FIGURE 12: Bulk Density Box

72 | Bulk Blend Quality Control Manual | 2013
Section E
Canadian Fertilizer Institute
Figure 13: Bulk Density Cup

2013 | Bulk Blend Quality Control Manual | 73 Canadian Fertilizer Institute
Section E
BLE
ND
ER
FO
RM
ULA
TIO
N S
HE
ET
GRA
DE
____
____
____
____
____
____
____
____
____
____
____
____
____
____
____
____
____
____
____
___
DA
TE__
____
____
____
____
____
____
____
____
___
FORM
ULA
NO
. __
____
____
____
____
____
____
____
____
____
____
____
____
____
____
____
____
____
_
PLA
NT
____
____
____
____
____
____
____
____
____
____
____
____
____
____
____
____
____
____
____
___
PRE
PARE
D B
Y __
____
____
____
____
____
____
___
PO
UN
DS
TOTA
L
SETT
ING
MA
TER
IALS
MA
TER
IAL
AN
ALY
SIS
%
NP
2O5
K2O
Mg
OM
ATE
RIA
L
CO
ST P
ER
TON
MA
TER
IAL
CO
ST P
ER
PO
UN
D
PO
UN
DS
FOR
MU
LA
MA
TER
IAL
CO
ST
TOTA
L:P
LAN
T
FOO
D
UN
ITS
TOTA
L
NIT
RO
GE
N B
RE
AK
DO
WN
TOTA
L “N
”N
O3
NH
3W
SOW
ISO
MIN
OR
ELE
ME
NTS

74 | Bulk Blend Quality Control Manual | 2013
Section E
Canadian Fertilizer Institute
Handling and Blending Coated Fertilizers
The slow release properties of coated fertilizers can be degraded by ordinary fertilizer mixing and handling equipment. Damage to the thin coating of soluble materials will result in the catastrophic release of the nutrient and poor product performance. This damage can be minimized by proper equipment selection and careful handling of materials. Forces that can negatively impact the slow release properties of coated fertilizers are: high drops, drops onto hard surfaces with flat angles, fast moving elevators, blenders with fast moving internal parts, screw or drag conveyors with pinch points or bottlenecks causing pressure buildup on flights or screw surfaces.
Equipment Selection
All equipment selected for a plant where coated slow release fertilizers will be handled should be selected with gentle handling in mind. Gentle handling is accomplished by utilizing belts to move product when possible, slow equipment speeds and short drops.
Testing
Testing of the coated product as it travels through the blending process is very important to determine if and where degradation is occurring. Samples should be taken at every possible access point but certainly from the storage bin after unloading, after the blender and after the bagging process. The blending facility can work with the coated fertilizer manufacturer or with an independent lab set up to perform slow release measurements to evaluate changes to the slow release properties. Periodic testing of the slow release properties of the finished product should be done on a regular basis to confirm good handling practices and label claims.
Modifications
If a problem with a particular operation or piece of equipment is noted, steps should be taken to minimize damage to materials. These could include use of cushioning materials such as conveyor belting inside chutes, reducing the speed of falling material by decreasing the height or angles of chutes, using e-z let down chutes, decreasing blender speed, rebuilding or replacing screw conveyors or drag chains, converting elevators to continuous bucket design or similar improvements. Some elevators use plastic buckets which do not impact the coatings as severely as do metal buckets.
Warehousing and Handling Tips
When picking up coated products from a bin or storage pile with a front end loader keep the loader bucket off the floor. Sweep the material back into the pile rather than pushing with the loader bucket. Avoid running over product with loader or spinning tires to force bucket into pile. Minimize reuse of sweepings from coated product storage and take into account possible damage when formulating with previously handled materials. Many times it is possible, and more efficient to utilize bulk bags for transporting, handling and storing coated materials. If used efficiently they can minimize shrink of valuable raw materials. Do detailed bin and equipment inspections on a regular basis.

2013 | Bulk Blend Quality Control Manual | 75 Canadian Fertilizer Institute
Section E