Microbial-Based Inoculants Influence on N2O Emissions … · Microbial-Based Inoculants Influence...
38
Draft Microbial-Based Inoculants Influence on N2O Emissions from soil planted to Corn (Zea mays L.) under Greenhouse Conditions with Different Nitrogen Fertilizer Regimens Journal: Canadian Journal of Microbiology Manuscript ID cjm-2016-0122.R1 Manuscript Type: Article Date Submitted by the Author: 01-Jul-2016 Complete List of Authors: Calvo, Pamela; Auburn University, Entomology and Plant Pathology Watts, Dexter B.; United States Department of Agriculture, Agricultural Research Service, National Soil Dynamics Laboratory Kloepper, Joseph W.; Department of Plant Pathology Torbert, Henry A.; USDA Agricultural Research Services Keyword: microbial inoculants, plant growth promoting rhizobacteria, PGPR, greenhouse gas emissions, Nitrous oxide production https://mc06.manuscriptcentral.com/cjm-pubs Canadian Journal of Microbiology
Transcript of Microbial-Based Inoculants Influence on N2O Emissions … · Microbial-Based Inoculants Influence...

Draft
Microbial-Based Inoculants Influence on N2O Emissions
from soil planted to Corn (Zea mays L.) under Greenhouse Conditions with Different Nitrogen Fertilizer Regimens
Journal: Canadian Journal of Microbiology
Manuscript ID cjm-2016-0122.R1
Manuscript Type: Article
Date Submitted by the Author: 01-Jul-2016
Complete List of Authors: Calvo, Pamela; Auburn University, Entomology and Plant Pathology
Watts, Dexter B.; United States Department of Agriculture, Agricultural Research Service, National Soil Dynamics Laboratory Kloepper, Joseph W.; Department of Plant Pathology Torbert, Henry A.; USDA Agricultural Research Services
Keyword: microbial inoculants, plant growth promoting rhizobacteria, PGPR, greenhouse gas emissions, Nitrous oxide production
https://mc06.manuscriptcentral.com/cjm-pubs
Canadian Journal of Microbiology

Draft
Page 1 of 25
Microbial-Based Inoculants Influence on N2O Emissions from soil planted to Corn (Zea mays L.) 1
under Greenhouse Conditions with Different Nitrogen Fertilizer Regimens 2
3
Pamela Calvo1*, Dexter B. Watts
2, Joseph W. Kloepper
1, and H. Allen Torbert
2 4
5
6
7
8
9
1Pamela Calvo and Joseph W. Kloepper, Entomology and Plant Pathology Department, 209 Life Sciences 10
Building, Auburn University, AL 36849. 11
2Dexter B. Watts and H. Allen Torbert, USDA-ARS National Soil Dynamics Laboratory, 411 S. Donahue 12
Dr. Auburn, AL 36832. 13
14
*Corresponding author ([email protected]). 15
16
17
18
Abbreviations: DAP, days after planting; CAN-17, calcium ammonium nitrate; UAN-32, urea 19
ammonium nitrate; SB, SoilBuilder™ product; SBF, SoilBuilder™ product filtered; BM, PGPR 20
mix; PGPR, Plant growth-promoting rhizobacteria; TSA, triptic soy agar; WFPS, water-filled pore 21
space. 22
23
Mention of trade names or commercial products in this article are solely for the purpose of providing 24
specific information and do not imply recommendation or endorsement by Auburn University and the 25
U.S. Department of Agriculture. 26
Page 1 of 37
https://mc06.manuscriptcentral.com/cjm-pubs
Canadian Journal of Microbiology

Draft
Page 2 of 25
Microbial-Based Inoculants Influence on N2O Emissions from soil planted to Corn (Zea mays L.) 1
under Greenhouse Conditions with Different Nitrogen Fertilizer Regimens 2
Abstract 3
Nitrous oxide (N2O) emissions are increasing at an unprecidented rate due to increased nitrogen (N) 4
fertilizers use. Thus, new innovative management tools are needed to reduce emissions. One potential 5
approach is the use of microbial inoculants in agricultural production. In a previous incubation study, we 6
observed reductions in N2O emissions when microbial-based inoculants were added to soil (no plants 7
present) with N fertilizers under laboratory incubations. This study evaluated the effects of microbial-8
based innoculants on N2O and carbon dioxide (CO2) emissions when applied to soil planted with corn 9
(Zea mays L.) under controlled greenhouse conditions. Inoculant treatments consisted of: (1) SoilBuilder 10
(SB); (2) a metabolite extract of SoilBuilder (SBF); and (3) a mixture of four strains of plant growth-11
promoting Bacillus spp. (BM). Experiments included an unfertilized control and three nitrogen fertilizers: 12
urea, urea ammonium nitrate 32% N (UAN-32), and calcium ammonium nitrate 17% N (CAN-17). 13
Cumulative N2O fluxes from pots 41 days after planting (DAP) showed significant reductions of 15% 14
(SB), 41% (BM), and 28% (SBF) with CAN-17 fertilizer. When UAN-32 was used, reductions of 34% 15
(SB), 35% (SBF), and 49% (BM) were obtained. However, no reductions in N2O emissions occurred with 16
urea. Microbial-based innoculants did not affect total CO2 emissions from any of the fertilized treatments 17
or unfertilized control. Nitrogen uptake was increased by an average of 56% with microbial inoculants 18
compared to the control (no microbial based treatments). Significant increases in plant height, SPAD 19
chlorophyl readings, and fresh and dry shoot weight were also observed when the microbial-based 20
treatments were applied (with and without N). Overall, results demonstrate that microbial inoculants can 21
reduce N2O emissions following fertilizer application depending on the N fertilizer type used and enhance 22
N uptake and plant growth. Future studies are planned to evaluate the effectiveness of these microbial 23
inoculants in field based trials and determine the mechanisms involved in N2O reduction. 24
Page 2 of 37
https://mc06.manuscriptcentral.com/cjm-pubs
Canadian Journal of Microbiology
Draft
Page 3 of 25
Keyword: Microbial Inoculants, PGPR, SoilBuilder™, greenhous gas emissions, N2O production. 1
Introduction 2
Nitrous oxide is an atmospheric trace gas that contributes to global warming and the depletion of 3
stratospheric ozone (IPCC, 2007). Agricultural soil management is the largest contributor of nitrous oxide 4
(N2O) production in the United States, accounting for approximately 69% of the total 2011 emissions 5
(EPA, 2013). Nitrous oxide production predominantly occurs when N-rich amendments (fertilizers, 6
manure, and compost) are added to soil, increasing the supply of inorganic N. The soil inorganic N is 7
further converted to N2O by soil bacteria. Generally, N2O emissions are directly related to the type, 8
quantity, and fertilizer application method, but other factors such as organic C and oxygen as well as soil 9
type and weather patterns also influence emissions (EPA, 2013). Nitrous oxide production occurs as a 10
side product of the aerobic nitrification process or as an obligate intermediate in the anaerobic 11
denitrification pathway. Therefore, it can be emitted by both nitrifiers and denitrifiers (Conrad, 1996). 12
Microbes play an important role in the cycling of N in soil. For instance, soil microorganisms are 13
responsible for the mineralization, immobilization, nitrification, and denitrification processes. When 14
aerobic conditions are predominant in soil, nitrification is the main process responsible for N2O 15
emissions. On the other hand, under anaerobic conditions, denitrification is the major producer of N2O. 16
These two processes are not exclusive, and in some cases, both processes could occur at the same time in 17
soil (Harrison and Webb, 2001). Only 1 to 2% of the N applied from fertilizers and organic amendments 18
(manure, compost, and other organic fertilizers) are lost as N2O (IPCC, 2007). However, given that N2O 19
has a potency (global warming potoential) approximately 300 times greater than CO2 (EPA, 2013), 20
sustainable agronomic practices that decrease N2O emissions and more efficiently utilizes soil N needs 21
developing. 22
Alterations in the composition and abundance of microbial communities within soil may also 23
affect the N cycling process (Cavigelli and Robertson, 2000), which could effect N2O production. 24
Application of chemical treatments such as nitrification inhibitors which inhibit autotrophic ammonia 25
Page 3 of 37
https://mc06.manuscriptcentral.com/cjm-pubs
Canadian Journal of Microbiology

Draft
Page 4 of 25
oxidizing bacteria, has been shown to reduce nitrification rates (Singh and Verma, 2007), potentially 1
reducing N2O emissions. Furthermore, a recent soil incubation study indicated that application of 2
microbial-based inoculants could also reduce N2O emissions in the presence of some N fertilizers (Calvo, 3
et al., 2013). 4
The importance of microbial-based inoculants in agriculture has increased within the last few 5
years. Besides their recently reported potential to reduce N2O emissions from soils, they can also improve 6
plant growth (Bloemberg and Lugtenberg, 2001). It has been extensively reported that microbial-based 7
inoculants such as plant growth-promoting rhizobacteria (PGPR) have the capacity to stimulate plant 8
growth by increasing nutrient uptake (Adesemoye, et al., 2008; Canbolat, et al., 2006; Figueiredo, et al., 9
2010). These microbial based-inoculants can consist of one or more species or strains of microorganisms 10
that once inoculuated to the soil, plant, or seeds form a beneficial symbiotic relationship with roots 11
stimulating root growth and increasing nutrient uptake. Among the PGPR microorganisms, Bacillus spp. 12
are the most widely used, mainly because they can survive as spores and can potentially alter soil 13
microbial composition. Bacillus spp.have wide metabolic capabilities allowing them to play important 14
roles in soil ecosystem functions and processes. Due to their heterotrophic nature, Bacillus spp. are also 15
important in soil carbon, N, and sulfur cycling as well as the transformation of other soil nutrients 16
(Mandic-Mulec and Prosser, 2011). In the last few years, microbial-based inoculants consisting of 17
microorganisms plus their fermentation metabolites have also been commercialized. One such example 18
already on the market is SoilBuilder™, manufactured by Agricen Sciences (Pilot Point, TX, USA). This 19
product has been shown to increase root growth and nutrient uptake (Yildirim, et al., 2006). Thus, given 20
the role that PGPR may play on increaseing the productivity of future agricltural crops more research is 21
needed to determine their impact on N2O production. 22
Nitrogen-use efficiency (NUE) practices in agriculture have been proposed as effective methods 23
for reducing N2O emissions and promoting more efficient N use by plants. Nitrogen-use efficiency relies 24
on the premise of applying N fertilizer or manure to crops at the right time (period of rapid crop uptake) 25
Page 4 of 37
https://mc06.manuscriptcentral.com/cjm-pubs
Canadian Journal of Microbiology
Draft
Page 5 of 25
based on soil tests and yield goals (Synder et al, 2009) to maximize fertilizer N recovery by crops. Even 1
though NUE is increasingly being promoted, there is a lack of sustainable management practices that 2
could help accomplish the efficent use of N. In this context, microbial-based inoculants could potentially 3
be included as tools to increase NiUE. Microbial-based inoculants could help accomplish NiUE in two 4
ways: by decreasing N2O emission from N-fertilized soils (Calvo, et al., 2013) and/or increasing (directly 5
or indirectly) plant N uptake which will also reduce N losses from the system (Adesemoye, et al., 2010; 6
Bashan, 1998; Biari, et al., 2008). 7
Calvo et al. (2013) previously demonstrated the potential for microbial-based inoculants 8
containing a Bacillus PGPR mix, SoilBuilder™, and SoilBuilder™ filtered to decrease N2O emissions in 9
the presence of UAN-32 and a non fertilized control under laboratory incubations using only soil, while 10
no differences were observed with urea. This was the first study of our knowledge to observe reductions 11
in N2O production from soil with the use of microbial inoculants. These microbial-based inoculants 12
utilized by Calvo et al (2013) are PGPR strains known to promote plant growth (Yildirim et al., 2006; 13
Mandic-Mulec and Prosser, 2011). Therefore, the question remains, will these microbial innoculants also 14
reduce greenhouse gas (GHG) emissions from soil containing plants. Thus, the objective of this study was 15
to test the hypothesis that microbial-based inoculants Bacillus PGPR mix, SoilBuilder™, and 16
SoilBuilder™ filtered can reduce N2O emissions from soil planted to corn following fertilizer application 17
(UAN-32, urea, and CAN-17) in a greenhouse study and to confirm the results obtained in a previous 18
study by Calvo et al. (2013). Carbon dioxide and CH4 were also evaluated to determine the microbial-19
based inoculants’ impact on microbial respiration (CO2) and CH4 production in soil maintained under 20
aerobic conditions. In addition, we tested the hypothesis that microbial-based inoculants could increase 21
growth and N uptake of corn plants evaluated 43 days after planting. 22
23
Materials and Methods 24
Soil Characterization and Experimental Design 25
Page 5 of 37
https://mc06.manuscriptcentral.com/cjm-pubs
Canadian Journal of Microbiology

Draft
Page 6 of 25
A container-pot study was conducted at greenhouse facilities of the USDA National Soil 1
Dynamics Laboratory in Auburn, Alabama, to evaluate the impact microbial-based inoculants have on 2
GHG emissions from soil. Experimental treatments, organized in a randomized complete block design 3
(RCBD) with a 4 × 4 factorial arrangement, consisted of three microbial treatments and a control (no 4
microbes) with three N fertilizers and an unfertilized control), each replicated five times. Microbial 5
treatments evaluated were Bacillus PGPR mix, SoilBuilder™, SoilBuilder™ filtered, and water as the 6
control. Nitrogen fertilizer sources included (i) unfertilized control, (ii) urea ammonium nitrate (UAN) -7
32%, (iii) urea, and (iv) calcium ammonium nitrate (CAN)-17%. To improve water infiltration, a 8
soil:sand mixture was used as the medium in this study to promote water infiltration and minimize 9
anaerobic conditions. The soil:mixture was loamy sand (85.2 % sand, 4.8% clay, and 10% silt) texture 10
containing a pH of 6.14 with 1.13 cmol kg-1
CEC, 0.7 g kg-1
total N , 4.5 g kg-1
organic matter, 2.6 g kg-
11
1total C, 10.53 µg g
-1 NO3, 0.73 µg g
-1 NH4, 236 µg g
-1 Mg, 305 µg g
-1 Ca, 4 µg g
-1 P, and 51 µg g
-1 K. 12
Background soil analysis was performed by Auburn University Soil Testing Laboratory as described by 13
Hue and Evans (1986). 14
Experimental Setup 15
The greenhouse experiment was conducted by placing 6 kg of dry homgenized soil:sand mix into 16
6 L nursery containers (C600 Classic from Nursery Supplies Inc., Kissimmee, FL). The fertilizer source 17
for each treatment was added in liquid form to pots, followed by the appropriate microbial treatment, and 18
two hybrid corn seeds (DKC61-73; Dekalb Seed Company, Cedar, Iowa). Nitrogen fertilizer was added at 19
a rate equivalent to 168 kg ha-1
. The amount of N added was calculated based on a one hectare furrow 20
slice (topsoil 15 cm), which equals 1 980 000 kg of soil. Based on this calculation, each pot received the 21
same amount of N (0.45 g N/pot) regardless of fertilizer source. Backgrounnd analysis of the soil showed 22
that Ca concentratons were low; thus, Ca was applied as CaCl2 at a rate of 6.6 g/pot to the UAN, urea, and 23
unfertilized control, and 5.9 g/pot (CAN). Phosphorus and potassium fertilization was applied as K2HPO4 24
at a rate of 1.3 g/pot. After treatment application, the soil was adjusted to a 60% water field pore space 25
Page 6 of 37
https://mc06.manuscriptcentral.com/cjm-pubs
Canadian Journal of Microbiology

Draft
Page 7 of 25
(WFPS) and placed in the glasshouse. Temperature within the glasshouse was kept at 26°C during the day 1
and 21°C at night. Four days after germination, plants were thinned to one per pot. Plants were watered 2
each day, to maintained the appropiate soil WFPS within each pot. The soil WFPS was controlled using a 3
WaterScout SM 100 soil moisture sensor (Spectrum technology, Inc.). Also, to minimize 4
microevironmental variations among treatments during the coarse of study, pots were rotated by replicate 5
weekly. 6
Microbial Source Preparation 7
SoilBuilder™ is a commercially available microbial biofertilizer manufactured by Agricen 8
Sciences, Pilot Point, TX. SoilBuilder™ is prepared from a bioreactor system consisting of a 9
continuously maintained microbial community (patent pending). The final product contains bacteria and 10
bacterial metabolites derived from the bioreactor. According to product label, the most commonly 11
occurring bacteria within the final stabilized product are Acidovorax facilis, Bacillus licheniformis, 12
Bacillus subtilis, Bacillus oleronius, Bacillus marinus, Bacillus megaterium, and Rhodococcus 13
rhodochrous, each at 1x10³ colony-forming units (cfu) mL
-1. (Advanced Microbial Solutions, 2016). 14
SoilBuilder™ filtered (SBF) consisted of SoilBuilder™ product without microbial cells and was 15
prepared by filtering SB through a 0.45 µm filter and then through a 0.22 µm filter. The SBF contained 16
microbial metabolites derived from a bioreactor production system that, in addition to other components, 17
includes organic acids, peptides, and enzymes. 18
Strains for the PGPR mixture were obtained from culture collections in the Department of 19
Entomology and Plant Pathology at Auburn University (Auburn, AL, USA). The PGPR Bacillus mixture 20
(referred to as BM) included four Bacillus strains: Bacillus safensis T4 (previously called B. pumilus T4), 21
Bacillus pumilus INR7, Bacillus subtilis subsp. subtilis IN937a (previously called B. amyloliquefaciens 22
IN937a), and Lysinibacillus xylanilyticus SE56 (previously called Bacillus sphaericus SE56). These 23
strains have been shown to have important plant growth-promoting effects (Enebak et al., 1998; Jetiyanon 24
et al., 2003; Kokalis-Burelle et al., 2003; Kokalis-Burelle et al., 2002). 25
Page 7 of 37
https://mc06.manuscriptcentral.com/cjm-pubs
Canadian Journal of Microbiology
Draft
Page 8 of 25
Microbial treatments were applied at a rate of 375 ml per pot. For the BM treatment, the bacterial 1
mix was prepared by mixing each strain’s spore suspension, which was previously quantified by plating 2
the spore mix suspension on TSA and incubating for 48 h at 25 °C. The spore mix was then adjusted to a 3
concentration of l05cfu mL
-1. The final concentration in each pot was 6.25 x 10
3cfu·g
-1 of dry soil. The 4
SoilBuilder™ product (SB) solution was prepared according to the label instructions by mixing 16 mL of 5
SoilBuilder™ in 1.0 L of distilled water immediately before setting up the experiment. SoilBuilder™ 6
product contained 106cfu mL
-1, so the final concentration in each jar was 10
3 cfu·g of dry soil. The 7
SoilBuilder™ filtered (SBF) treatment was prepared the same way as SB, but before applying 375 mL to 8
each pot, the solution was filtered. Sterility of the filtrate was confirmed by plating onto TSA (48 h at 25 9
°C incubation) and observing no bacterial growth. Non-filtered SoilBuilder™ population concentrations 10
were also confirmed by plate count on TSA after incubation for 48 h at 25 °C. 11
Gas Flux and Soil NH4-N and NO3-N Sampling 12
Trace gases emitted from pots were sampled using the static closed chamber method (Hutchinson 13
and Davidson, 1993; Hutchinson and Mosier, 1981). Custom-made gas flux chambers were designed and 14
constructed based on criteria described in the GRACEnet protocol (Baker, et al., 2003, Parkin and Kaspar, 15
2006) to accommodate nursery containers. A structural base consisting of polyvinyl chloride (PVC) 16
cylinders [25.4 cm (10 in) inner diameter by 38.4 cm (15.1 in) height] was sealed at the bottom. During 17
gas measurements, the entire plant-pot system was placed inside the base cylinder and a vented flux 18
chamber [25.4 cm (10 in) diameter x 11.4 cm (4.5 in) height] was placed on top of the base cylinder (Fig 19
1). The flux chamber tops were constructed of PVC, covered with reflective tape, and contained a center 20
sampling port. 21
Gas sampling was performed on 1, 3, 6, 10, 15, 21, 27, 34, and 41 days after treatment application 22
at the same time of day (10:00-12:00 pm CST). Gas samples for CO2, CH4, and N2O were taken at 0, 20, 23
and 40 minute intervals following chamber closure. At each time interval, gas samples were collected by 24
inserting a 23 gauge needle attached to a gastight 10 mL polypropylene syringe through a rubber septum 25
Page 8 of 37
https://mc06.manuscriptcentral.com/cjm-pubs
Canadian Journal of Microbiology

Draft
Page 9 of 25
embedded in the chamber tops. They were then injected into evacuated 6 mL glass vials fitted with butyl 1
rubber stoppers as described by Parkin and Kaspar (2006). Samples were stored at 25 °C until analysis, 2
which was done within two weeks of collection. Gas samples were analyzed using a gas chromatograph 3
(GC) (Shimadzu GC-14B, Japan) equipped with an electron capture detector for N2O and a methanizer 4
interfaced flame ionization detector for CO2 and CH4. The gas chromatograph’s detectors were calibrated 5
by comparison to a standard curve using standards obtained from Scott Specialty Gases (Plumsteadville, 6
PA, USA). Gas fluxes were calculated from the rate of change (linear increases) in trace gas (CO2, N2O, 7
or CH4) concentrations within the chamber’s headspace at 0, 20, and 40 minute intervals during chamber 8
closure as described by Livingston and Hutchinson (1995). Calculations in this study were used to 9
express data as mg (CO2-C and CH4-C) and ug (N2O-N ) trace gas per kg of dry soil (per day). Total trace 10
gas efflux was calculated by extrapolating daily averages over the course of 41 days using linear 11
interpolation between adjacent sampling dates, similar to procedures described by Halvorson et al. (2008). 12
Total flux was then determined by summation of the daily fluxes. 13
Soil nitrate and ammonium concentrations were determined at 3, 6, 10, 15, 21, 27, 34, and 41 14
days after treatment application. It was assumed that N concentrations in the pots were uniform. Thus, 15
soil samples were collected from pots using a small soil corer and homogenized. Soil NH4-N and NO3-N 16
concentrations were determined by extracting 5 g susbsample of wet soil with 50 mL of 2M KCl for 17
determination of inorganic N content as described by Keeney and Nelson (1982). Soil extracts were 18
measured colorimetrically for NH4 and NO2 + NO3 using a Bran+Luebbe Auto Analyzer 3 19
(Bran+Luebbe, Norderstedt, Germany). 20
Plant Evaluation 21
Plants from each treatment were harvested and evaluated at the end of experiment when plants 22
reached the V6 growth stage (43 DAP). Plant parameters measured included fresh shoot and root weight, 23
dry shoot and root weight determination (70 °C oven dry), chlorophyll content (SPAD 502 meter), and 24
plant height. Plant nutrient analysis was performed on the dried shoot tissue. Ground tissue from each 25
Page 9 of 37
https://mc06.manuscriptcentral.com/cjm-pubs
Canadian Journal of Microbiology

Draft
Page 10 of 25
plant shoot was analyzed for N using the combustion method (LECO FP-528 N Analyzer). Nitrogen 1
uptake in the plant shoot was calculated using N concentrations and dry shoot weight. 2
Statistical Analysis 3
Analysis of variance (ANOVA), using a general linear model (GLM), was used first to analyze 4
the effect of microbial-based treatments, fertilizer and then the interaction of both on each parameter 5
(N2O, CO2, CH4, NO3-, NH4
+ , etc). Then the response of each variable per fertilizer type was analyzed 6
using the least significant difference (LSD) test to identify significant differences between treatments (SB, 7
SBF, BM, and control). All statistical analyses were performed using SAS 9.2 (SAS Institute, 2010) and a 8
significance level of α=0.05 was set a priori. 9
10
Results and Discussion 11
Nitrous oxide fluxes were significantly affected by fertilizer type, microorganisms and the 12
interaction of both factors (Table 1). The greatest differences (P<0.05) were observed during the first 15 13
days of evaluation. Methane production was generally low during the coarse of this experiment and only 14
significantly affected by the microorganism on day 1 and by the microorganism and the fertilizer x 15
microorganism interaction on day 21. This was not surprising given that CH4 is generally produced from 16
agricultural soils when anaerobic conditions are present (Yu et et al., 2001). In this study soil were 17
maintained at a 60% WHC to minimize anaerobic conditions from occuring. Fertilizer type only affected 18
CO2 production during the first 6 days of evaluation, while the microbial-based treatments only affected 19
CO2 flux 1 DAP. There were no interaction effects between the fertilizer and microbial-based treatments 20
on CO2 fluxes. 21
Nitrous Oxide Emissions 22
Nitrous oxide fluxes per sampling day or days after planting (DAP) generally reached it highest 23
between 1 and 6 DAP, regardless of treatment (Fig. 2). After N2O fluxes peaked, an almost constant 24
Page 10 of 37
https://mc06.manuscriptcentral.com/cjm-pubs
Canadian Journal of Microbiology

Draft
Page 11 of 25
decline was observed with the three fertilizer treatments and unfertilized control. The N2O emission peak 1
observed in this study were similar to those previously observed by Bouwman (1996) and Mosier (1994), 2
who found that fertilizer application resulted in short-term increased N2O emissions that lasted from 3
several days to a few weeks. Nitrous oxide fluxes varied among the different days of incubation for the 4
microbial based treatments (Fig. 2). In the unfertilized control, there was a high initial flux (1 DAP), 5
regardless of treatment; the flux then decreased with time until about 21 DAP, after which daily fluxes 6
became quite small. N2O production in the unfertilized control was lower for the three microbial-based 7
treatments (SB, SBF, and BM) compared to the control (no microbial based treatment) during the first 15 8
DAP (when N2O production was greatest). 9
Daily emissions from all fertilized soils (urea, CAN-17, and UAN-32) were generally higher than 10
that of the unfertilized control. In the CAN-17 fertilized soils, the control (non microbial based treatment) 11
reached its highest peak 1 DAP, with the greatest daily fluxes occuring among the microbial treatments 12
(SB, SBF, and BM) between 1 and 6 DAP. The highest N2O peak for the mirobial treatments for the 13
CAN-17 soil was reached with SB 6 DAP; emissions reached background levels at day 21. Similarly, 14
N2O fluxes from soil receiving UAN-32 reach the highest daily fluxes between 1 (control; non microbial 15
based treatment) and 6 DAP (SBF); emissions reached background levels at 27 DAP. Unlike the other 16
two fertilizers (UAN-32 and CAN-17) and unfertilized control soil, the no microbial based treatment 17
(control) with urea did not produce the highest peak 1 DAP. In this case, the BM-inoculated soils 18
generally exhited the highest peak on day 1 and lowest daily fluxes on day 3, 6, and 10 DAP; emissions 19
reach background levels at 21 DAP. 20
Total N2O production (averaged over microbial treatments) was affected by fertilizer type and 21
decreased in the order of UAN-32 ≥ CAN-17 ≥ Urea ≥ unfertilized control (Fig. 3). UAN-32 and CAN-17 22
fertilized soils released, on average, 4.5 times more total N2O (total 41 DAP) than the unfertilized 23
treatment (Fig 3). The more N that is being cycled through the system, the greater the quantity that can be 24
converted into N2O and released to the atmosphere (Firestone and Davidson, 1989). The effect of N 25
Page 11 of 37
https://mc06.manuscriptcentral.com/cjm-pubs
Canadian Journal of Microbiology

Draft
Page 12 of 25
fertilizer on N2O emissions is well known (Smith et al., 1997) and explains why the three N fertilizers 1
produced significantly more total N2O than the unfertilized control. 2
The SB, SBF, and BM treatments significantly reduced total N2O emissions from the CAN-17, 3
UAN-32, and unfertilized control containers (Fig.3), satistfying the hypothesis that microbial based 4
inoculants can reduce N2O emissions. No differences were observed with urea. With UAN-32, total N2O 5
emissions were reduced by 15%, 28%, and 41% when SB, SBF, and BM were applied, respectively. With 6
CAN-17, reductions were 34%, 35%, and 49% when SB, SBF, and BM were applied, respectively. In the 7
unfertilized control, significant reductions were also observed: SB (26%), SBF (26%), and BM (28%). 8
Among the three microbial-based treatments, BM consistently had the greatest reduction in total N2O 9
emissions. However, this reduction was significantly lower than SB and SBF only when CAN-17 was 10
applied. These results agree in part with previously reported results from soil incubations performed with 11
the same microbial-based treatments (Calvo et al., 2013). In that study, all three microbial-based 12
treatments reduced total N2O emissions; however, SBF and SB significantly reduced emissions the most 13
when CAN-17 was applied. In the present study, BM was the treatment that reduced N2O total emissions 14
the most with the same fertilizer. 15
No significant difference between SB and SBF was observed with UAN-32 and the unfertilized 16
control (Fig 3); however, with CAN-17, SBF significantly reduced N2O emissions more than SB. This 17
observation suggests that in the specific case of CAN-17, the application of only microbial metabolites 18
(SBF) could have a greater effect than the application of microbial metabolites + microorganisms (SB). 19
No significant reductions were observed when urea was applied. This observation supports results 20
previously published by Calvo et al. (2013), where the same microbial-based treatments had less effect 21
when urea was present in a soil incubation. 22
In order to explain the effect of microbial-based treatments on N2O emissions it is important to 23
consider that N2O is regulated by oxygen partial pressure and nitrification, which is also controlled by the 24
ammonia concentration and soil pH (Philippot, et al., 2009). Breitenbeck and Bremner (1986) reported 25
Page 12 of 37
https://mc06.manuscriptcentral.com/cjm-pubs
Canadian Journal of Microbiology

Draft
Page 13 of 25
that in well aerated soil conditions plots treated with nitrifiable forms of N fertilizer (ammonia or 1
ammonium) produced more N2O than plots receiving equivalent applications of N as NO3--N. It was 2
previously reported that phenolic compounds produced by some microorganisms could have inhibitory 3
effects on nitrifiers’ bacteria, which could potentially reduce N2O emissions (Bending and Lincoln, 2000). 4
Denitrification is the predominant N2O-producing process when soil water-filled pore space (WFPS) is 5
greater than 70–80% (Davidson, 1991). In the present study, WFPS was maintained at no more than 60%. 6
However, denitrification is possible in soil microsites, where this process may increase due to the 7
presence of carbon sources. Thus, it is important to take into account that the capacity of soil microbial-8
based treatments to reduce N2O emissions could be related to an effect on the denitrification process. 9
Also. N2O emission mechanisms involved when chemical N fertilizers are applied to a soil system 10
(without plants) are different from mechanisms involved when plant roots are present. It is important to 11
take into account that plants affect local conditions in the soil rhizosphere in many ways that influence 12
microbial activity, abundance, and community composition (Sørensen, 1997). These influences can 13
directly impact microbial communities emitting GHGs. The oxygen partial pressure in the rhizosphere 14
can be altered by root respiration and root-associated microorganisms, root water consumption, and root 15
penetration, which decreases soil compaction and create channels for gas transfer (Philippot, et al., 2009). 16
The complex interaction among plant roots, soil, N, and microorganisms creates difficulty in explaining 17
the capacity of the microbial-based treatments to reduce N2O by only one mechanism. Enwall et al. 18
(2007) observed that plants could stimulate nitrification due to increased organic matter that in turn 19
enhances N turnover in the soil, in combination with increased aeration. On the other hand, Herman et al. 20
(2006) reported that in some cases the activity of nitrifiers within the rhizosphere was decreased when 21
ammonium in the soil is limited due to plants or other microbes competing with autotrophic nitrifiers for 22
the ammonium in carbon rich environments. However, given that plant rooting was minimal during the 23
time when N2O production was most dominate in this study, more research is needed to evaluate the 24
mechanisms these microbial inoculant may have on N2O production in soil. However, given that plant 25
Page 13 of 37
https://mc06.manuscriptcentral.com/cjm-pubs
Canadian Journal of Microbiology

Draft
Page 14 of 25
rooting was minimal during the time when N2O production was most dominate in this study, more 1
research is needed to evaluate the mechanisms these microbial inoculants may have on N2O production in 2
soil. 3
Carbon Dioxide Emissions 4
Carbon dioxide flux curves showed a very similar pattern for all three fertilizer sources and the 5
unfertilized control (Fig 4). The fluxes followed a quadratic response pattern. For instance, CO2 fluxes 6
began high, decreased, and then increased near the end of study. 7
Carbon dioxide fluxes among the microbial-based treatments for each fertilizer source were 8
similar. During the first 15 DAP (Fig 4) the flux constantly decreased, which agrees with previous 9
observations in soil incubations (Calvo, et al., 2013). After day 15, CO2 fluxes began to increase, 10
coinciding with seedling emergence. Others have reported that, when plants are present in sampling 11
chambers, CO2 flux may be influenced by dark chamber respiration from plants, roots, and soil microbial 12
respiration (Artz, et al., 2013, Zou, et al., 2005). Therefore, after day 15 it was difficult to know what 13
specific process accounted for increased CO2. Fluxes among microbial-based treatments were 14
significantly different only with urea 1 DAP (Fig 4). On this day (1 DAP), the control (no microbial-15
based treatments) and BM CO2 fluxes were both significantly higher than SB (P=0.0252) and SBF 16
(P=0.0465) at α=0.05. 17
Total CO2 emissions after 41 days of evaluation presented no significant difference among any 18
microbial-based treatment and control (no microbial-based treatment) in presence of the three fertilizers 19
or unfertilized control (Table 2). These results differ from those observed in a previous study by Calvo et 20
al. (2013) where the same microbial-based treatments affected CO2 emissions in soil incubations; 21
however, plants in the present study most likely affected the CO2 emissions. There was slightly less total 22
CO2 produced by the unfertilized control compared to UAN-32 and CAN -17 (Table 2). This observation 23
agrees with that of Barabasz et al. (2002), who suggested that N fertilization increases microbial activity 24
Page 14 of 37
https://mc06.manuscriptcentral.com/cjm-pubs
Canadian Journal of Microbiology

Draft
Page 15 of 25
due to the addition of nutrients. The soil used in the present study was nutrient poor, so N fertilizer 1
application appears to have enhanced microbial activity. 2
Soil Nitrate and Ammonium Concentrations 3
As expected, soil NO3--N and NH4
+-N concentrations from the unfertilized treatment (Fig.5 and 4
Fig.6) were much less than in the N-fertilized treatments. The UAN-32 treatment had the highest NH4+-N 5
concentration in soil, which explains greater N2O emissions (nitrification is the dominant mechanism 6
causing N2O loss under aerobic conditions). 7
Soil NH4+-N concentrations were highest at the beginning and progressively decreased until 41 8
DAP, regardless of the fertilizer type or unfertilized control, with NH4+-N spikes occurring 15 DAP in the 9
CAN-17 and UAN-32 treatments with the uninoculated soils (Fig 5). Three DAP with CAN-17, SBF 10
treatment had significantly higher NH4+-N in soil compared to the other treatments (Table 3). Having 11
significantly more NH4+-N in the system could indicate that less NH4
+-N was converted to N2O through 12
nitrification, which could help to explain why SBF reduced N2O 3 DAP (Fig 3). However, the other two 13
microbial-based treatments also reduced N2O 3 DAP, and they did not show significantly more NH4+-N in 14
soil. The fact that SBF affected NH4+-N 3 DAP is an indication that it has little or no direct connection 15
with the reduction of N2O. At 15 DAP, the control (no microbial-based treatment) showed an NH4+-N 16
spike. This value is significantly higher compared to the other treatments. This NH4+-N spike could be the 17
result of many processes occurring at the same time. For instance, one should note that more NH4+-N 18
could have been added to the system due to the soil organic matter mineralization process. Furthermore, 19
Nguyen (2003) observed that plants also release readily available organic compounds into soil solution 20
through rhizodeposition, of which root exudation is the largest component. Thus, increases in NH4+-N 15 21
DAP could be explained by root exudates being mineralized and converted to NH4+-N. Another important 22
consideration is that adding microbes may have promoted N immobilization, thereby leaving less readily 23
available NH4+-N in soil. Immobilization could also explain how bacteria might have reduced N2O 24
Page 15 of 37
https://mc06.manuscriptcentral.com/cjm-pubs
Canadian Journal of Microbiology

Draft
Page 16 of 25
emissions. For instance, if less NH4+-N is present in soil, less nitrification could be occurring (Eichner, 1
1989). 2
In contrast with CAN-17, when UAN-32 was present, the control (no microbial-based treatment) 3
had significantly higher NH4+-N 3
DAP compared to the other two treatments (Fig.5). Interestingly, the 4
control (no microbial-based treatment) also displayed a significantly higher peak 15 DAP, similar to the 5
one observed with CAN-17; however, when UAN-32 was applied to soil, NH4+-N dynamics were 6
different than with CAN-17. The UAN-32 soil contained 16.5 % urea in its composition. This urea 7
becomes NH4+-N by action of urease enzymes. Therefore, the peak observed 15 DAP could be due to the 8
conversion of urea to NH4+-N. Nevertheless, it is important to note that for both fertilizers (CAN-17, 9
UAN-32) where all the microbial-based treatments significantly reduced N2O emissions 15 DAP, an 10
NH4+-N peak was observed. Even though these two fertilizers have different N forms and different 11
interactions, microbial-based treatments could be affecting a common soil nutrient cycling process 12
leading to N2O reductions. 13
With urea, the highest NH4 +
-N in soil was observed 3 DAP, but these concentrations were lower 14
than the other two fertilizer treatments (CAN-17, UAN-32). This was expected due to the lack of NH4 +
-N 15
in the fertilizer. As mentioned above, urea needs to go through a process to be converted to NH4 +
-N. No 16
distinct peak was observed during the 41 days of experiment, and the NH4 +
-N content throughout the 17
experiment was similar among the microbial-based treatments and control (no microbial-based 18
treatments). When no N fertilizers were applied, the microbial-based treatments displayed significantly 19
higher amounts of NH4 +
-N at days 21, 34, and 41 (Table 3). The mechanisms involved in cycling N, 20
which influences N2O production, may be different when no N fertilizer is present. 21
Soil nitrate (NO3--N) concentrations for the three fertilizer treatments and unfertilized control are 22
presented in Fig 6. With CAN-17, significantly more nitrate was observed 3 DAP when SBF was applied 23
while the control (no microbial-based treatment) showed a higher significant peak in NO3--N 15 DAP 24
(Table 3). A significant event may be occurring around 15 DAP in the control (no microbial-based 25
Page 16 of 37
https://mc06.manuscriptcentral.com/cjm-pubs
Canadian Journal of Microbiology

Draft
Page 17 of 25
treatment) that is affecting both NO3--N and NH4+-N soil concentrations. By the final day of incubation, a 1
significant increase in NO3--N was observed by the BM treatment. 2
With UAN-32, significantly more NO3--N was observed with the SBF and control (no microbial-3
based treatment) 3 DAP. These results are very similar to those observed with NH4+-N concentration, 4
where the same two treatments displayed significantly higher amounts of NH4+-N in soil. At 15 DAP, the 5
control again (no microbial-based treatment) showed significantly higher amounts of NO3--N. 6
Nevertheless, this level was not as high as that observed with CAN-17. 7
Nitrate values in the urea-treated soils were considerably lower at the beginning of the experiment 8
compared to the other two fertilizer treatments. This difference was due to the lack of a nitrate source in 9
the fertilizer. Nitrate levels tended to increase over time, with all treatments showing similar release 10
curves. At the end of the study, the BM treatment significantly produced higher amounts of NO3--N. Both, 11
the unfertilized control and urea treatment showed very low soil NO3-
-N concentrations. In fact, the 12
unfertilized control had the lowest concentration among all treatments. This was expected given that no 13
fertilizer was added and the soil had little organic N. The only differences among NO3--N values were 14
observed on the final day of the experiment where BM and SB had significantly higher amounts of NO3--15
N compared to the control (no microbial-based treatments). 16
Evaluating soil NH4 and NO3 concentrations could provide valuable information about the 17
impacts microbial-based inoculants may have on the dynamics of N availability. In many cases, variations 18
in soil NO3--N and NH4
+-N concentrations are related to N2O emissions. Thus, this relationship can help 19
with understanding the processes that could be responsible for changes in N2O emissions. This approach 20
works best when no plants are included in the system. However, the inclusion of plants in the present 21
study made it difficult to find a direct link between soil N concentration and N2O emission since the 22
microbial-based treatments were also affecting plant growth and nutrient uptake. Nevertheless, some 23
trends and differences in N concentration among the microbial-treatments and control are present. These 24
differences show that the microbial-based treatments also affected soil N dynamics that could be 25
Page 17 of 37
https://mc06.manuscriptcentral.com/cjm-pubs
Canadian Journal of Microbiology

Draft
Page 18 of 25
indirectly related to N2O reduction. Furthermore, with urea there was a negligible effect of microbial-1
based treatments on soil NO3--N and NH4
+-N. Coincidentally, urea was the only fertilizer in which 2
microbial-based treatments had no effect on reducing N2O emissions. 3
Plant Growth Promotion and Nitrogen Uptake 4
Microbial treatments had an effect on most evaluated parameters, and the effect was dependent 5
on the fertilizer type applied. Thus, the plant growth parameters were significantly affected by the 6
interaction of microbial inoculants and fertilizers. When CAN-17 was applied, differences in fresh and 7
dry shoot weights and N uptake were observed among the microbial-based treatments, with SBF 8
enhancing these parameters the most (Fig 7). The SBF increased plant N uptake by 100% over the 9
control. No effects of microbial-based treatments on root parameters, SPAD readings, or plant heights 10
were observed (Fig 8). 11
When UAN-32 was applied, plant heights, SPAD readings, shoot and root dry weights, and N 12
uptake parameters were significantly different in the presence of microbial treatments compared to the no 13
microbial treatment controls (Fig 8). For the three microbial-based treatments evaluated, SB resulted in 14
more consistent increases for these four parameters. The increased N uptake was 43% greater than the no 15
microbial-based treatment control. Significant increases were also observed when urea was applied. In 16
this case, microbial-based treatments significantly affected SPAD readings (BM), fresh and dry shoot 17
weights, and N uptake. The SB treatment again showed more consistent increases in the last three 18
parameters. Nitrogen uptake was the parameter enhanced most by SB, increasing 47% compared to 19
control. When no N was applied, microbial treatments also increased SPAD readings, plant heights, and 20
N uptake (Fig 8), with the last parameter increasing 32% over the control with SBF application. 21
When looking at all fertilizers, none of the microbial-based treatments showed an effect on fresh 22
and dry root weights in CAN-17, urea, and the unfertilized control. Significant differences in root dry 23
weight were only observed when SB was applied with UAN-32. There was not a single microbial-based 24
treatment that consistently performed better with all fertilizer. Hence, the N fertilizer affects the ability of 25
Page 18 of 37
https://mc06.manuscriptcentral.com/cjm-pubs
Canadian Journal of Microbiology

Draft
Page 19 of 25
the microbial-based treatments to enhance plant growth. Hayat et al. (2010) reported that microbial-based 1
treatments such as PGPR can enhance nutrient uptake due to increased root growth, which allows plants 2
to absorb more nutrients. However, the present study found that microbial treatments significantly 3
affected plant N uptake, but increases in root biomass was only observed with UAN-32. This agrees with 4
Bertrand et al. (2000) who reported that inoculation of PGPR Achromobacter spp. increased N uptake 5
without increasing root biomass. In light of these results, N uptake may involve other mechanisms not 6
directly related to changes in root biomass. 7
8
Conclusions 9
The results reported here support our hypothesis that microbial-based inoculants can reduce N2O 10
emissions from a soil-plant system and support previous results reported by Calvo, et al. (2013) in a soil 11
incubation study using the same microbial-based treatments and fertilizers. Similar to results observed in 12
the soil incubation study, microbial-based treatments were able to reduce N2O emissions in the 13
unfertilized control and with all fertilizers except urea. Nitrous oxide emissions were reduced more when 14
CAN-17 fertilizer was applied. Higher reductions of N2O were observed in the BM treatment. This 15
microbial treatment reduced N2O emissions by 41%, 49%, and 28% with UAN-32, CAN-17, and 16
unfertilized control, respectively. Microbial-based treatments had no effect on total CO2 emissions in any 17
of the fertilizer regime. 18
Microbial-based treatments increased plant growth and N uptake. The SB treatment increased 19
plant parameters and N uptake more with urea and UAN-32, while the SBF treatment enhanced plant 20
parameters and N uptake more with CAN-17 and the unfertilized control. The greatest increase in N 21
uptake was 100% higher than the control when SBF was applied with CAN-17. 22
How microbial-based treatments reduced N2O emissions cannot be explained by a single 23
mechanism. The presence of plants added an additional variable to the system; thereby, increasing the 24
complexity of the interactions. Some possible mechanisms involved in this reduction effect include: (i) 25
Page 19 of 37
https://mc06.manuscriptcentral.com/cjm-pubs
Canadian Journal of Microbiology
Draft
Page 20 of 25
production or presence of nitrification inhibitors, (ii) inhibition of nitrifying and/or denitrifying 1
microorganisms, (iii) competition of applied microbial treatments with native microbial nitrifiers 2
and/denitrifiers, and (iv) immobilization of N fertilizer and root exudates by microbes. 3
The results presented in this greenhouse experiment complement and confirm results obtained in 4
previous soil incubations. Microbial-based treatments demonstrated the potential to decrease N2O 5
emissions from agricultural soils when plants are present. Further research is needed validate similar 6
results in a field environment. Additional research is also needed to better understand the processes 7
involved in the dynamics among microbial-based treatments, the N cycle, plants, and N fertilizers. 8
9
Acknowledgements 10
Financial support for this project was provided by the U.S. Department of Agriculture, Alabama 11
Agricultural Experiment Station, Auburn University Department of Entomology and Plant Pathology, and 12
Agricen Sciences. We acknowledge Dr. Robert Ames for suggestions during the planning and 13
experimental stages of the study. We thank James Ashley Robinson for technical assistance and William 14
Fowler for help with editing the manuscript. 15
16
17
18
19
20
Page 20 of 37
https://mc06.manuscriptcentral.com/cjm-pubs
Canadian Journal of Microbiology

Draft
Page 21 of 25
References 1
Adesemoye, A.O., Torbert, H.A., and Kloepper, J.W. 2008. Enhanced plant nutrient use efficiency with 2
PGPR and AMF in an integrated nutrient management system. Can. J. Microb. 54: 876-886. 3
4
Adesemoye, A.O., Torbert, H.A., and J.W. Kloepper. 2010. Increased plant uptake of nitrogen from 15
N-5
depleted fertilizer using plant growth-promoting rhizobacteria. App. Soil Ecol. 46: 54-58. 6
7
Advanced Microbial Solutions. 2016. SoilBuilder™, Advanced Microbial Solutions, LLC., Pilot Point, 8
TX. USA. https://info.agricen.com/hubfs/SoilBuilder-Label-Information.pdf?t=1460038286486 9
(accessed 29 June 2016). 10
11
Artz, R.R.E., Chapman, S.J., Saunders, M., Evans, C. and Matthews, R. 2013. Comment on “Soil CO2, 12
CH4 and N2O fluxes from an afforested lowland raised peatbog in Scotland: implications for 13
drainage and restoration” by Yamulki et al. . Biogeosciences Discussion 10: 10271-10285. 14
15
Baker, J., Doyle, G., McCarthy, G., Mosier, A., Parkin, T., Reicosky, D., Smith, J., and Venterea, R. 16
2003. GRACEnet chamber-based trace gas flux measurement protocol. In: T. G.P. D. committee, 17
editor. p. 1-18. 18
19
Barabasz, W., Albinska, D., Jaskowska, M., and Lipiec, J. 2002. Biological effects of mineral nitrogen 20
fertilization on soil microorganisms. Pollut. J. Environ. 11: 193-198. 21
22
Bashan, Y. 1998. Inoculants of plant growth-promoting bacteria for use in agriculture. Biotech. Adv. 16: 23
729-770. 24
25
Bending, G.D., and Lincoln, S.D. 2000. Inhibition of soil nitrifying bacteria communities and their 26
activities by glucosinolate hydrolysis products. Soil Biol. Biochem. 32: 1261-1269. 27
28
Biari, A., Gholami, A., and H.A. Rahmani, H.A. 2008. Growth promotion and enhanced nutrient uptake 29
of maize (Zea mays L.) by application of plant growth promoting rhizobacteria in arid region of 30
iran. J, Biol. Sci. 8: 1015-1020. 31
32
Bloemberg, G.V., and Lugtenberg, B.J. 2001. Molecular basis of plant growth promotion and biocontrol 33
by rhizobacteria. Curr. Opin. in Plant Biol. 4: 343-350. 34
35
Bouwman, A.F. 1996. Direct emissions of nitrous oxide from agricultural soils. Nutr .Cycl. Agroecosyst. 36
46: 53-70. 37
38
Breitenbeck, G.A., and Bremner, J.M. 1986. Effects of various nitrogen fertilizers on emission of nitrous 39
oxide from soils. Biol. Fert. Soils 2: 195-199. 40
41
Bertrand, H., Nalin, R., Bally, R., and Cleyet-Marel, J.C. 2001. Isolation and identification of the most 42
efficient plant growth-promoting bacteria associated with canola (Brassica napus). Biol. Fert. Soils 43
33:152-156. 44
45
Calvo, P., Watts, D.B., Ames, R.N., Kloepper , J.W., and Torbert, H.A. 2013. Microbial-based inoculants 46
impact nitrous oxide emissions from an incubated soil medium containing urea fertilizers. J. 47
Environ. Qual. 42: 704-712. 48
Page 21 of 37
https://mc06.manuscriptcentral.com/cjm-pubs
Canadian Journal of Microbiology

Draft
Page 22 of 25
1
Canbolat, M., Bilen, S., Çakmakçı, R., Şahin, F., and Aydın, A. 2006. Effect of plant growth-promoting 2
bacteria and soil compaction on barley seedling growth, nutrient uptake, soil properties and 3
rhizosphere microflora. Biol. Fert. Soils 42: 350-357. 4
5
Cavigelli, M.A., and Robertson, G.P. 2000. The functional significance of denitrifier community 6
composition in a terrestrial ecosystem. Ecology 81: 1402-1414. 7
8
Conrad, R. 1996. Soil microorganisms as controllers of atmospheric trace gases (H2, CO, CH4, OCS, N2O, 9
and NO). Microbiol. Rev. 60: 609-640. 10
11
Davidson, E.A. 1991. Fluxes of nitrous oxide and nitric oxide from terrestrial ecosystems. A global 12
inventory of nitric oxide emissions from soils. In: J. Rogers and W. Whitman, editors, Microbial 13
production and consumption of greenhouse gases:methane, nitrogen oxides, and halomethanes. 14
American Society for Microbiology, Washington DC. 15
16
Eichner, M.J. 1989. Nitrous oxide emissions from fertilized soils: summary of available data. J. Environ. 17
Qual. 19: 272-280. 18
19
Enebak, S.A., Wei, G., and Kloepper, J.W. 1998. Effects of plant growth-promoting rhizobacteria on 20
loblolly and slash pine seedlings. Forest Sci. 44: 139-144. 21
22
Enwall, K., Nyberg, K., Bertilsson, S., Cederlund, H., Stenström, J., and Hallin, S. 2007. Long-term 23
impact of fertilization on activity and composition of bacterial communities and metabolic guilds in 24
agricultural soil. Soil Biol. Biochem. 39: 106-115. 25
26
USEPA Agency. 2013. Inventory of U.S. greenhouse gas emissions and sinks: 1990-2011. 27
http://epa.gov/climatechange/emissions/usinventoryreport.html (Accessed 20 July 2013). EPA, 28
Office of Atmospheric Programs (6207J), Washington, DC. 29
30
Figueiredo, M., Seldin, L., Araujo, F., and Mariano, R. 2010. Plant growth promoting rhizobacteria: 31
fundamentals and applications. In: D. K. Maheshwari, editor Plant growth and health promoting 32
bacteria. Springer Berlin Heidelberg. p. 21-43. 33
34
Firestone, M.K., and Davidson, E.A. 1989. Microbiological basis of NO and N2O production and 35
consumption in soil In: M. O. Andreae and D. S. Schimel, editors, Exchange of trace gases between 36
terrestrial ecosystems and the atmosphere. John Wiley & Sons, New York. p. 7-21. 37
38
Harrison, R., and Webb, J. 2001. A review of the effect of N fertilizer type on gaseous emissions. 39
Advances in Agronomy. Academic Press. p. 65-108. 40
41
Hayat, R., Ali, S., Amara, U., Khalid, R., and Ahmed I. 2010. Soil beneficial bacteria and their role in 42
plant growth promotion: a review. Ann. Microbiol. 60: 579-598. 43
44
Herman, D.J., Johnson, K.K., Jaeger, C.H., Schwartz, E., and Firestone, M.K. 2006. Root influence on 45
nitrogen mineralization and nitrification in Avena barbata rhizosphere soil. Soil Sci. Soc. Am. J. 46
70: 1504-1511. 47
48
Hue, N.V., and Evans, C.E. 1986. Procedures used for soil and plant analysis by the Auburn University 49
Soil Testing LaboratoryAuburn University, Auburn, AL. 50
Page 22 of 37
https://mc06.manuscriptcentral.com/cjm-pubs
Canadian Journal of Microbiology

Draft
Page 23 of 25
1
Hutchinson, G.L., and Davidson, E.A. 1993. Processes for production and comsumption of gaseous 2
nitrogen oxides in soil. In: L. A. Harper, A. R. Mosier, J. M. Duxburry and D. E. Rolston, editors, 3
Agricultural Ecosystem Effect on Trace Gases and Global Climate Change. American Society of 4
Agronomy, Madison, WI, USA. p. 79-93. 5
6
Hutchinson, G.L., and Mosier, A.R. 1981. Improved soil cover method for field measurements of nitrous 7
oxide fluxes. Soil Sci. Soc. Am. J. 45: 311-316. 8
9
IPCC. 2007. Summary for Policymakers In: S. Solomon, D. Qin, M. Manning, Z. Chen, M. Marquis, K. 10
B. Averyt, M.Tignor and H. L. Miller, editors, Climate Change 2007: The Physical Science Basis. 11
Contribution of Working Group I to the Fourth Assessment Report of the Intergovernmental Panel 12
on Climate Change. Cambridge University Press, Cambridge, United Kingdom and New York,NY, 13
USA. 14
15
Jetiyanon, K., Fowler, W.D., and Kloepper, J.W. 2003. Broad-spectrum protection against several 16
pathogens by PGPR mixtures under field conditions. Plant Dis. 87: 1390-1394. 17
18
Keeney, D.R., and Nelson, D.W. 1982. Nitrogen in organic forms In: A.L.Page, R. H. Miller and D. R. 19
Keeney, editors, Methods of soil analysis. American Society of Agronomy, Madison, WI. p. 643-20
698. 21
22
Kokalis-Burelle, N., Vavrina, C.S., Reddy, M.S., and Kloepper, J.W. 2003. Amendment of muskmelon 23
transplant media with plant growth-promoting rhizobacteria: effects on seedling quality, disease, 24
and nematode resistance. Hortechnology 13: 476-482. 25
26
Kokalis-Burelle, N., Vavrina, C.S., Rosskopf, E.N., and Shelby, R.A. 2002. Field evaluation of plant 27
growth-promoting rhizobacteria amended transplant mixes and soil solarization for tomato and 28
pepper production. Plant Soil 238: 257-266. 29
30
Mandic-Mulec, I., and Prosser, J.I. 2011. Diversity of endospore-forming bacteria in soil: characterization 31
and driving mechanisms. In: N. A. Logan and P. D. Vos, editors, Endospore-Forming Soil Bacteria. 32
Springer, London. 33
34
Mosier, A.R. 1994. Nitrous oxide summary. In: K. Minami, A. Mosier and R. Sass, editors, CH4 and N2O: 35
global emissions and controls from rice fields and other agricultural and industrial sources. 36
NAIAES Series 2,Yokendo Publishers,, Tokyo. 37
38
Nguyen, C. 2003. Rhizodeposition of organic C by plants: mechanisms and controls. Agronomie 23: 375-39
396. 40
41
Parkin, T.B., and Kaspar, T.C. 2006. Nitrous oxide emissions from corn-soybean systems in the Midwest. 42
J. Environ. Qual. 35: 1496-1506. 43
44
Parkin, T.B., and Venterea, R.T. 2010. Chamber-based trace gas flux measurements. In: R.F. Follett, 45
editor, Sampling protocols. USDA-ARS, Washington, DC. p. 3-1– 3-39. 46
www.ars.usda.gov/SP2UserFiles/Program/212/ 47
Chapter%203.%20GRACEnet%20Trace%20Gas%20Sampling%20Protocols. 48
pdf (accessed 31 Dec. 2013). 49
50
Page 23 of 37
https://mc06.manuscriptcentral.com/cjm-pubs
Canadian Journal of Microbiology
Draft
Page 24 of 25
Pathak, H., Singh, R., Bhatia, A., and Jain, N. 2006. Recycling of rice straw to improve wheat yield and 1
soil fertility and reduce atmospheric pollution. Paddy Water Environ. 4: 111-117. 2
3
Philippot, L., Hallin, S., Börjesson, G., and Baggs, E.M. 2009. Biochemical cycling in the rhizosphere 4
having an impact on global change. Plant Soil 321: 61-81. 5
6
Singh, S.N., and Verma, A. 2007. Environmetal review: The potential of nitrification inhibitors to 7
manage the pollution effect of nitrogen fertilizers in agricultural and other soils: A review. Environ. 8
Pract. 9: 266-279. 9
10
Smith, K.A., McTaggart, I.P., and Tsuruta, H. 1997. Emissions of N2O and NO associated with nitrogen 11
fertilization in intensive agriculture, and the potential for mitigation. Soil Use Manag. 13: 296-304. 12
13
Sørensen, J. 1997. The rhizosphere as a habitat for soil microorganisms. In: J. D. V. Elsas, J. T. Trevors 14
and E. M. K. Wellington, editors, Modern soil microbiology. Marcel Dekker, New York. p. 21-45. 15
16
Synder, C.S., Bruulsema, T.W., Jensen, T.L., and Fixen, P.E. 2009. Review of greenhouse gas emissions 17
from crop production systems and fertilizer management effects. Agric. Ecosyst. Environ. 133:247–18
266. 19
20
Yildirim, E., Taylor, A.G., and Spittler, T.D. 2006. Ameliorative effects of biological treatments on 21
growth of squash plants under salt stress. Anglais: 1-6. 22
23
Yu, K.Y., Wang, Z.W., Vermoesen, A.V., Patrick Jr., W.P. and Van Cleemput O.V.C. 2001. Nitrous 24
oxide and methane emissions from different soil suspensions: effect of soil redox status. Biol.Fert. 25
Soils 34: 25-30. 26
27
Zou, J., Huang, Y., Sun, W., Zheng, X., and Wang, Y. 2005. Contribution of plants to N2O emissions in 28
soil-winter wheat ecosystem:pot and field experiments. Plant Soil 269: 205-211. 29
30
31
32
33
34
35
36
37
38
39
Page 24 of 37
https://mc06.manuscriptcentral.com/cjm-pubs
Canadian Journal of Microbiology

Draft
Page 25 of 25
List of Figures 1
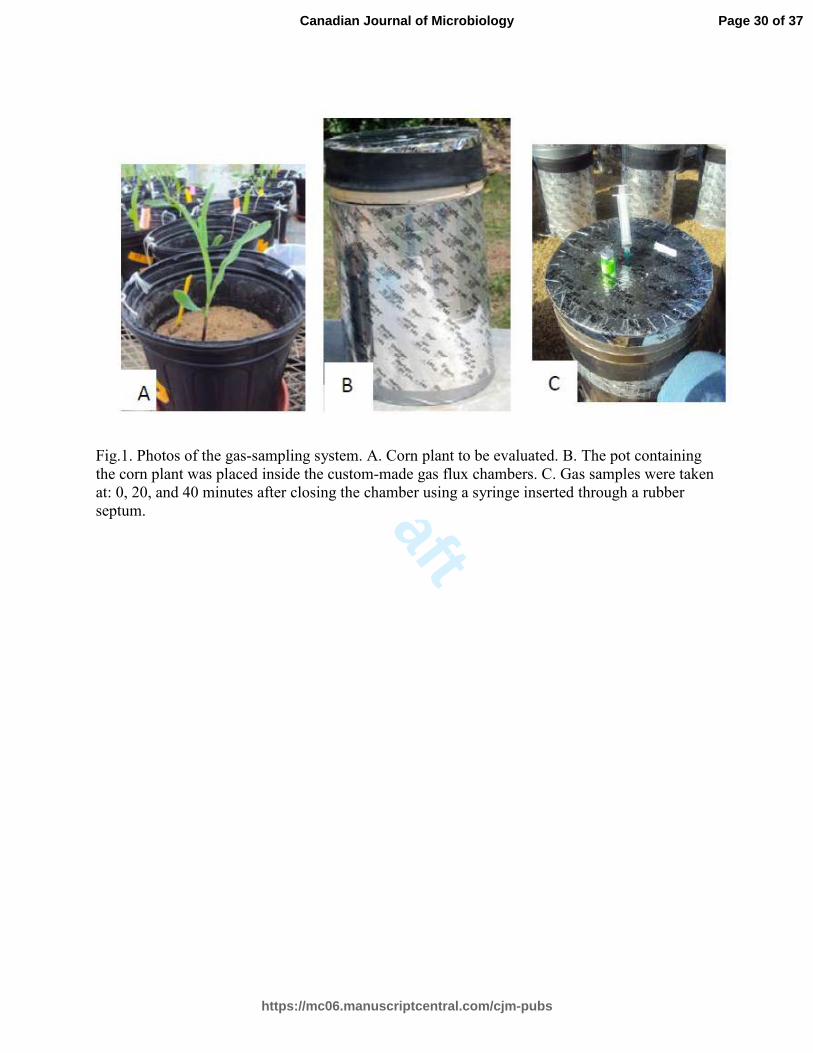
Fig. 1. Photos of the gas-sampling system. A. Corn plant to be evaluated. B. The pot containing 2
the corn plant was placed inside the custom-made gas flux chambers. C. Gas samples were taken 3
at: 0, 20, and 40 minutes after closing the chamber using a syringe inserted through a rubber 4
septum. 5
6
Fig. 2. Total N2O production from soil planted with corn after 41 days of evaluation per type of 7
N fertilization regimen. Microbial-based treatment: SB (SoilBuilder™), SBF (SoilBuilder™ 8
filtered), BM (Bacillus PGPR mix), and Control (no product applied). Bars followed by the same 9
letter are not significantly different at the 0.05 level using LSD values. 10
11
Fig. 3. N2O fluxes during 41 days of evaluation per type of N fertilization regimen: calcium 12
ammonium nitrate (CAN-17), urea ammonium nitrate (UAN-32), urea, and unfertilized control. 13
Microbial-based treatment: SB (SoilBuilder™), SBF (SoilBuilder™ filtered), BM (Bacillus 14
PGPR mix), and Control (no product applied). 15
16
Fig. 4. CO2 fluxes during 41 days of evaluation per type of N fertilization regimen: calcium 17
ammonium nitrate (CAN-17), urea ammonium nitrate (UAN-32), urea, and unfertilized control. 18
Microbial- based treatment: SB (SoilBuilder™), SBF (SoilBuilder™ filtered), BM (Bacillus 19
PGPR mix), and Control (no product applied). 20
21
Fig. 5. Ammonium (NH4+-N) soil concentration during 41 days of evaluation per type of N 22
fertilization regimen: calcium ammonium nitrate (CAN-17), urea ammonium nitrate (UAN-32), 23
urea, and unfertilized control. Microbial-based treatment: SB (SoilBuilder™), SBF 24
(SoilBuilder™ filtered), BM (Bacillus PGPR mix), and Control (no product applied). 25
Fig. 6. Nitrate (NO3-N) soil concentration during 41 days of evaluation per type of N fertilization 26
regimen: calcium ammonium nitrate (CAN-17), urea ammonium nitrate (UAN-32), urea, and 27
unfertilized control. Microbial-based treatment: SB (SoilBuilder™), SBF (SoilBuilder™ 28
filtered), BM (Bacillus PGPR mix), and Control (no product applied). 29
Fig. 7. Plant parameters evaluated at V6 stage (43 DAP). Shoot fresh weight (SFW), shoot dry 30
weight (SDW), root fresh weight (RFW), root dry weight (RDW), N uptake measured as total N 31
content in a plant shoot (N uptake). Microbial-based treatment: SB (SoilBuilder™), SBF 32
(SoilBuilder™ filtered), BM (Bacillus PGPR mix), and Control (no product applied). Bars 33
within the same plant parameter followed by the same letter are not significantly different at the 34
0.05 level using LSD values. 35
Fig. 8. Values of SPAD and plant height (cm) evaluated at V6 stage (43 DAP) per type of N 36
fertilizer. Microbial-based treatment: SB (SoilBuilder™), SBF (SoilBuilder™ filtered), BM 37
(Bacillus PGPR mix), and Control (no product applied). Bars within the same plant parameter 38
and within the same fertilizer type followed by an asterisk are significantly different from the 39
control (no microbial-based treatment) at the 0.05 level using LSD values. 40
Page 25 of 37
https://mc06.manuscriptcentral.com/cjm-pubs
Canadian Journal of Microbiology

Draft
Table 1. Analysis of variance (main effects and interactions) for the effects of fertilizer regimen and
microbial-based treatment on CO2, N2O, and CH4 fluxes over the 41 days of evaluation.
Trace gas
Emissions rates
(µg trace gas kg soil-1‡d-1) Factors†
ANOVA P > F
1d 3d 6d 10d 15d 21d 27d 34d 41d
Fertilizer (F) 0.0048 <0.0001 0.0012 0.6856 0.7914 0.6585 0.7791 0.9040 0.1807
CO2 Microbial –based treat. (M) 0.0006 0.9467 0.3286 0.0668 0.2134 0.9723 0.3209 0.6407 0.0839
M X F 0.3621 0.7730 0.6980 0.7823 0.7944 0.3986 0.1350 0.8560 0.7611
Fertilizer (F) <0.0001 <0.0001 <0.0001 <0.0001 <0.0001 <0.0001 0.0085 <0.0001 0.0147
N2O Microbial –based treat. (M) <0.0001 <0.0001 0.0023 0.0005 0.2807 0.0003 0.1924 0.0113 0.0206
M X F <0.0001 <0.0001 0.0023 0.0251 <0.0001 0.0489 0.4658 0.1105 0.0057
Fertilizer (F) 0.8012 0.2136 0.2041 0.6154 0.3657 0.3958 0.1970 0.8696 0.6512
CH4 Microbial –based treat. (M) 0.0420 0.4272 0.9740 0.0725 0.4554 0.0438 0.2138 0.4055 0.7308
M X F 0.6272 0.3288 0.4617 0.0975 0.8235 0.0129 0.4523 0.8733 0.7134
Analysis of variance, statistical significance was determined at P > 0.05.
† Fertilizer factor include UAN-32 (urea ammonium nitrate), urea, CAN-17 (calcium ammonium nitrate), and unfertilized. Microbial based
treatments factor includes SB (SoilBuilder™), SBF (SoilBuilder™ filtered), BM (Bacillus PGPR mix), and Control (no product applied). ‡Trace gases were calculated based on kg of dry soil.
Page 26 of 37
https://mc06.manuscriptcentral.com/cjm-pubs
Canadian Journal of Microbiology

Draft
Table 2. Total CO2 production influenced by microbial treatment per
fertilization regimen after 41 days of evaluation.
Microbial-based
Treatment
CO2 total production (mg C kg of dry soil -1)†
Fertilizer
CAN-17‡ UAN-32§ Urea Control
BM 158.71a 195.27 a 227.88 a 195.66 a
SB 210.48 a 246.84 a 239.8 a 193.83 a
SBF 227.34 a 212.3 a 201.15 a 203.23 a
Control 217.74 a 230.69 a 200.88 a 205.57 a
† Each value denotes means of 5 independent experimental units.Means within a
column followed by the same letter are not significantly different (two-way ANOVA) at the
0.05 level using Fisher’s protected LSD values. SB (SoilBuilder™), SBF (SoilBuilder™
filtered), BM (Bacillus PGPR mix), and Control (no product applied). ‡ Calcium ammonium nitrate, § Urea ammonium nitrate.
Page 27 of 37
https://mc06.manuscriptcentral.com/cjm-pubs
Canadian Journal of Microbiology

Draft
Table 3. Soil ammonium (NH4+-N) concentration influenced by microbial-based treatment per fertilization
regimen during the 41 days of evaluation.
Fertilizer
Treatments
Microbial-
based
Treatments
NH4+-N (mg/kg soil)
‡
Days after planting (DAP)†
3 6 10 15 21 27 34 41
BM 46.46 b 36.96 a 40.04 a 29.73 bc 17.38 b 17.75 a 7.77 a 4.48 a
CAN-17ǂ SB 36.08 b 46.79 a 27.29 b 31.76 b 11.3 bc 14.61 a 1.6 b 1.38 b
SBF 82.7 7 a 37.77 a 29.32 b 21.38 c 26.55 a 3.44 b 1.01 b 2.76 ab
Control 39.31 b 35.82 a 27.43 b 66.01 a 10.44 c 14.06 a 1.62 b 2.65 ab
BM 90.53 bc 71.89 a 69.11 ab 55.69 b 31.24 a 25.91 a 9.73 a 1.73 bc
UAN-32ǂ SB 71.51 c 52.91 b 50.57 c 62.29 b 22.42 ab 23.81 a 2.98 b 5.44 a
SBF 111.4 ab 45.62 b 78.17 a 50.32 b 29.02 a 28.37 a 8.54 a 3.21 b
Control 118.14 a 71.82 a 57.98 bc 115.37 a 16.71 b 4.31 b 1.01 b 0.84 c
BM 26.06 c 37.49 a 27.49 b 46.23 a 25.12 a 11.43 a 0.92 a 1.518 b
Urea SB 45.88 b 47.76 a 46.15 a 35.34 b 24.28 a 4.33 bc 1.36 bc 4.594 a
SBF 51.23 b 32.09 a 28.16 a 29.78 bc 26.36 a 7.64 b 2.17 b 2.48 ab
Control 69.05 a 43.24 a 37.32 ab 24.93 c 23.4 a 2.98 c 2.76 c 1.49 b
BM 5.21 a 2.06 a 0.75 a 0.49 a 0.11 b 0.58 a 0.73 a 0.76 a
Unfertilized SB 3.58 a 2.04 a 1.34 a 0.02 b 0.73 a 0.32 a 0.26 ab 0.75 a
control SBF 3.96 a 2.31 a 2.07 a 0.23 ab 0.36 c 0.16 a 0.47 ab 0.48 a
Control 3.94 a 2.17 a 0.71 a 0.26 ab 0.05 b 0.2 a 0.21 b 0.07 b
† Each value denotes means of 5 independent experimental units. Means within a column followed by the same letter are
not significantly different (two-way ANOVA) at the 0.05 level using Fisher’s protected LSD values. SB (SoilBuilder™),
SBF (SoilBuilder™ filtered), BM (Bacillus PGPR mix), and Control (no product applied).
ǂ Calcium ammonium nitrate (CAN-17) ,and urea ammonium nitrate (UAN-32). ‡ NH4
+ -N values were calculated based on kg of dry soil.
Page 28 of 37
https://mc06.manuscriptcentral.com/cjm-pubs
Canadian Journal of Microbiology

Draft
Table 4. Soil nitrate (NO3--N) concentration influenced by microbial-based treatment per fertilization regimen during the
41 days after planting.
Fertilizer Microbial-
based NO3--N (mg/kg soil)
‡
Treatments Treatments Days after planting (DAP)†
3 6 10 15 21 27 34 41
BM 66.75 b 44.74 a 71.99 a 38.99 c 55.68 a 48.82 ab 68.84 a 92.36 a
CAN-17ǂ SB 68.75 b 67.75 a 33.26 b 50.13 b 39.87 ab 57.45 a 37.19 b 53.71 b
SBF 111.03 a 43.09 a 44.45 b 39.63 bc 35.37 b 36.65 b 64.3 a 55.03 b
Control 41.32 b 74.68 a 38.99 b 133.04 a 35.84 b 55.50 a 53.91 ab 43.75 b
BM 29.47 ab 19.21 a 35.11 ab 59.39 ab 32.43 a 51.07 a 53.15 a 31.06 a
UAN-32ǂ SB 19.57 b 22.42 a 32.68 b 47.11 b 32.63 a 49.05 a 70.92 a 28.82 a
SBF 38.75 a 14.09 a 48.76 a 50.93 b 31.62 a 50.11 a 62.71 a 37.88 a
Control 45.85 a 22.84 a 35.33 ab 76.58 a 38.09 a 49.12 a 56.17 a 26.97 a
BM 1.72 a 3.92 a 9.25 c 35.37 a 39.42 b 23.47 b 57.57 a 39.61 a
Urea SB 4.81 a 5.06 a 16.63 a 23.72 a 29.71 bc 26.62 b 59.52 a 26.48 b
SBF 4.79 a 4.15 a 13.47 ab 30.66 a 51.85 a 31.91 b 41.52 a 29.91 ab
Control 3.09 a 4.54 a 11.22 bc 38.15 a 23.43 c 54.66 a 41.03 a 23.82 b
BM 2.84 a 2.95 b 6.19 a 5.49 a 5.19 a 6.16 a 1.78 ab 3.23 a
Unfertilized SB 2.22 a 2.29 b 5.55 a 6.78 a 5.91 a 6.53 a 0.89 b 3.46 a
control SBF 1.69 a 3.07 b 5.15 a 3.04 a 6.69 a 6.29 a 1.66 ab 2.31 ab
Control 3.51 a 4.05 a 5.47 a 4.99 a 5.94 a 4.14 a 4.31 a 0.87 b
†Each value denotes means of 5 independent experimental units. Means within a column followed by the same letter are not
significantly different (two-way ANOVA) at the 0.05 level using Fisher’s protected LSD values. SB (SoilBuilder™), SBF
(SoilBuilder™ filtered), BM (Bacillus PGPR mix), and Control (no product applied).
ǂ Calcium ammonium nitrate (CAN-17) ,and urea ammonium nitrate (UAN-32). ‡NO3
- -N values were calculated based on kg of dry soil.
Page 29 of 37
https://mc06.manuscriptcentral.com/cjm-pubs
Canadian Journal of Microbiology
Draft
Fig.1. Photos of the gas-sampling system. A. Corn plant to be evaluated. B. The pot containing
the corn plant was placed inside the custom-made gas flux chambers. C. Gas samples were taken
at: 0, 20, and 40 minutes after closing the chamber using a syringe inserted through a rubber
septum.
Page 30 of 37
https://mc06.manuscriptcentral.com/cjm-pubs
Canadian Journal of Microbiology

Draft
0
50
100
150
200
250
300
350
400
1 3 6 10 15 21 27 34 41
N2O flux ( ug N kg of dry soil-1 d
-1)
DAP
Urea
BM
SB
SBF
Control
0
50
100
150
200
250
300
350
400
1 3 6 10 15 21 27 34 41
N2O flux (ug N kg of dry soil -1d-1)
DAP
CAN-17
BM
SB
SBF
Control
0
20
40
60
80
100
120
1 3 6 10 15 21 27 34 41
N2O flux ( ug N kg of dry soil
-1 d
-1)
DAP
Unfertilized control
BM
SB
SBF
Control
0
50
100
150
200
250
300
350
400
1 3 6 10 15 21 27 34 41
N2O flux ( ug N kg of dry soil
-1 d
-1)
DAP
UAN-32
BM
SB
SBF
Control
Fig. 2. N2O flux influenced by microbial-based treatments per N fertilization regimen measured
during the 41 days after planting (DAP). Fertilizer treatments: calcium ammonium nitrate (CAN-
17), urea ammonium nitrate (UAN-32), urea, and unfertilized control. Microbial-based
treatments: SB (SoilBuilder™), SBF (SoilBuilder™ filtered), BM (Bacillus PGPR mix), and
Control (no product applied). Means represent values from 5 independent experimental units and
error bars denotes standard deviation. Given that most of the changes occurred within the first
three weeks, the x-axis was not set proportional to time.
Page 31 of 37
https://mc06.manuscriptcentral.com/cjm-pubs
Canadian Journal of Microbiology

Draft
a
b
c
d
0
500
1000
1500
2000
2500
Control SB SBF BM
CAN-17
Total N
2O(ug N kg of dry soil -1)
ab b b
0
500
1000
1500
2000
2500
Control SB SBF BM
Unfertilized control
a
b b
b
0
500
1000
1500
2000
2500
Control SB SBF BM
UAN -32
a
aa
a
0
500
1000
1500
2000
2500
Control SB SBF BM
Urea
Total N
2O(ug N kg of dry soil -1)
Total N
2O(ugN kg of dry soil -1)
Total N
2O(ug N kg of dry soil -1)
Fig. 3. Total N2O production influenced by microbial-based treatments per fertilization regimen
during the 41 days after planting (DAP). Fertilizer treatments: calcium ammonium nitrate (CAN-
17), urea ammonium nitrate (UAN-32), urea, and unfertilized control. Microbial-based
treatment: SB (SoilBuilder™), SBF (SoilBuilder™ filtered), BM (Bacillus PGPR mix), and
Control (no product applied). Each bar shown denotes the mean and standard deviation of 5
independent experimental units. Bars followed by the same letter are not significantly different
(two-way ANOVA) at the 0.05 level using Fisher’s protected LSD values.
Page 32 of 37
https://mc06.manuscriptcentral.com/cjm-pubs
Canadian Journal of Microbiology

Draft
0
2
4
6
8
10
12
14
16
1 3 6 10 15 21 27 34 41
CO
2 flu
x (m
g C
kg o
f dry
soil
-1d
-1)
DAP
Urea
BM SB SBF Control
0
2
4
6
8
10
12
14
16
18
1 3 6 10 15 21 27 34 41
CO
2flux (m
g C
kg o
f dry
soil
-1d
-1)
DAP
UAN-32
BM SB SBF Control
0
2
4
6
8
10
12
14
16
1 3 6 10 15 21 27 34 41
CO
2 flu
x (m
g C
kg o
f dry
soil
-1d
-1)
DAP
CAN-17
BM SB SBF Control
0
2
4
6
8
10
12
14
16
1 3 6 10 15 21 27 34 41
CO
2flux (m
g C
kg o
f dry
soil
-1d
-1)
DAP
Unfertilized control
BM SB SBF Control
Fig. 4. CO2 flux influenced by microbial treatments per N fertilization regimen measured during the 41
days after planting (DAP). Fertilizer treatments: calcium ammonium nitrate (CAN-17), urea ammonium
nitrate (UAN-32), urea, and unfertilized control. Microbial-based treatments: SB (SoilBuilder™), SBF
(SoilBuilder™ filtered), BM (Bacillus PGPR mix), and Control (no product applied). Means represent
values from 5 independent experimental units and error bars denotes standard deviation. Given
that most of the changes occurred within the first three weeks, the x-axis was not set proportional
to time.
Page 33 of 37
https://mc06.manuscriptcentral.com/cjm-pubs
Canadian Journal of Microbiology

Draft
0
20
40
60
80
100
120
3 6 10 15 21 27 34 41
NH4+-N (m
g.kg-1soil)
DAP
CAN-17
BM
SB
SBF
Control
0
2
4
6
8
10
12
14
16
18
20
3 6 10 15 21 27 34 41
NH4+-N (m
g.kg-1soil)
DAP
Unfertilized control
BM
SB
SBF
Control
0
20
40
60
80
100
120
3 6 10 15 21 27 34 41
NH4+-N (m
g.kg-1soil)
DAP
UAN-32
BM
SB
SBF
Control
0
20
40
60
80
100
120
3 6 10 15 21 27 34 41
NH4+-N (m
g.kg-1soil)
DAP
Urea
BM
SB
SBF
Control
Fig. 5. Soil ammonium (NH4+-N) concentration influenced by microbial-based treatments per N
fertilization regimen measured during the 41 days after planting (DAP). Fertilizer treatment:
calcium ammonium nitrate (CAN-17), urea ammonium nitrate (UAN-32), urea, and unfertilized
control. Microbial-based treatments: SB (SoilBuilder™), SBF (SoilBuilder™ filtered), BM
(Bacillus PGPR mix), and Control (no product applied). Means represent values from 5
independent experimental units and error bars denotes standard deviation. Error bars are the
standard deviation (n = 5). Given that most of the changes occurred within the first three weeks,
the x-axis was not set proportional to time.
Page 34 of 37
https://mc06.manuscriptcentral.com/cjm-pubs
Canadian Journal of Microbiology

Draft
0
20
40
60
80
100
120
140
160
180
3 6 10 15 21 27 34 41
NO
3--N (m
g. kg-1soil)
DAP
CAN-17
BM
SB
SBF
Control
0
20
40
60
80
100
120
140
160
180
3 6 10 15 21 27 34 41
NO
3--N (m
g. kg-1soil)
DAP
UAN-32
BM
SB
SBF
Control
0
20
40
60
80
100
120
140
160
180
3 6 10 15 21 27 34 41
NO
3--N (m
g. kg-1soil)
DAP
UreaBM
SB
SBF
Control
0
2
4
6
8
10
12
14
16
18
20
3 6 10 15 21 27 34 41
NO
3--N (m
g. kg-1soil)
DAP
Unfertilized control
BM
SB
SBF
Control
Fig. 6. Soil nitrate (NO3-N) concentration influenced by microbial based treatment per N
fertilization regimen measured during the 41 days after planting (DAP). Fertilizer treatment:
calcium ammonium nitrate (CAN-17), urea ammonium nitrate (UAN-32), urea, and unfertilized
control. Microbial-based treatment: SB (SoilBuilder™), SBF (SoilBuilder™ filtered), BM
(Bacillus PGPR mix), and Control (no product applied). Means represent values from 5
independent experimental units and error bars denotes standard deviation. Given that most of the
changes occurred within the first three weeks, the x-axis was not set proportional to time.
Page 35 of 37
https://mc06.manuscriptcentral.com/cjm-pubs
Canadian Journal of Microbiology

Draft
Fig. 7. Plant parameters evaluated at V6 stage (43 DAP). Shoot fresh weight (SFW), shoot dry weight (SDW), root fresh weight
(RFW), root dry weight (RDW), N uptake measured as total N content in a plant shoot (N uptake). Microbial-based treatment: SB
(SoilBuilder™), SBF (SoilBuilder™ filtered), BM (Bacillus PGPR mix), and Control (no product applied). Each bar shown denotes
the mean and standard deviation of 5 independent experimental units. Bars within the same plant parameter followed by the same
letter are not significantly different (two-way ANOVA) at the 0.05 level using LSD values.
Page 36 of 37
https://mc06.manuscriptcentral.com/cjm-pubs
Canadian Journal of Microbiology

Draft
1
Fig. 8. Values of SPAD and plant height (cm) evaluated at V6 stage (43 DAP) per type of N 2
fertilizer. Microbial-based treatment: SB (SoilBuilder™), SBF (SoilBuilder™ filtered), BM 3
(Bacillus PGPR mix), and Control (no product applied). Each bar shown denotes the mean and 4
standard deviation of 5 independent experimental units. Bars within the same plant parameter 5
and within the same fertilizer type followed by an asterisk are significantly different (two-way 6
ANOVA) from the control (no microbial-based treatment) at the 0.05 level using LSD values. 7
8
Page 37 of 37
https://mc06.manuscriptcentral.com/cjm-pubs
Canadian Journal of Microbiology