Cameron & LuoISCA ‘99 May 1, 1999 1Performance Evaluation Using Hardware Performance Counters Kirk...
94
May 1, 1999 1 Performance Evaluation Using Hardware Performance Counters Cameron & Luo ISCA ‘99 Performance Evaluation Using Hardware Performance Counters Kirk W. Cameron Yong Luo {kirk, yongl}@lanl.gov http://www.c3.lanl.gov/~kirk
-
Upload
miriam-pavey -
Category
Documents
-
view
225 -
download
1
Transcript of Cameron & LuoISCA ‘99 May 1, 1999 1Performance Evaluation Using Hardware Performance Counters Kirk...
May 1, 1999 1 Performance Evaluation Using Hardware Performance Counters
Cameron & LuoISCA ‘99
Performance Evaluation Using Hardware Performance Counters
Kirk W. CameronYong Luo
{kirk, yongl}@lanl.govhttp://www.c3.lanl.gov/~kirk
May 1, 1999 2 Performance Evaluation Using Hardware Performance Counters
Cameron & LuoISCA ‘99
Acknowledgements• Harvey Wasserman• Olaf Lubeck• Adolfy Hoisie• Federico Bassetti• Fabrizio Petrini• Pat Fay (Intel)• Frank Levine (IBM)• James Schwarzmeir (SGI)• Brent Henderson (HP)• Bill Freeman (Digital/Compaq)
May 1, 1999 3 Performance Evaluation Using Hardware Performance Counters
Cameron & LuoISCA ‘99
Tutorial Objectives
• Provide a systematic approach to the use of hardware counters and associated tools
• Provide examples of hardware counters over a determined problem set for various processors
• Give details of systematic approach on a subset of processors
• Provide simple derived formulas and advanced analytical formulas for performance measurement
• Provide further references for hardware counters
May 1, 1999 4 Performance Evaluation Using Hardware Performance Counters
Cameron & LuoISCA ‘99
Tutorial Overview
• Introduction– Background, motivations, trade-offs, problem set,
test beds
• Tool Discussions & Examples– Overview, specific processors, platforms, API & GUI
tools
• Interpretation, Derivations and Empirical Analysis– Non-measured inference, modeling techniques
• Advanced Topics– instruction-level workload characterization
analysis
May 1, 1999 5 Performance Evaluation Using Hardware Performance Counters
Cameron & LuoISCA ‘99
Introduction
• What is a performance counter/monitor?• Example: The Cray YMP• Performance Goals and Objectives• Hardware Counter Motivations (trade-
offs)• Performance Measurement Methodology• Problem Set• Test Beds• Problem Set vs. Test Beds
May 1, 1999 6 Performance Evaluation Using Hardware Performance Counters
Cameron & LuoISCA ‘99
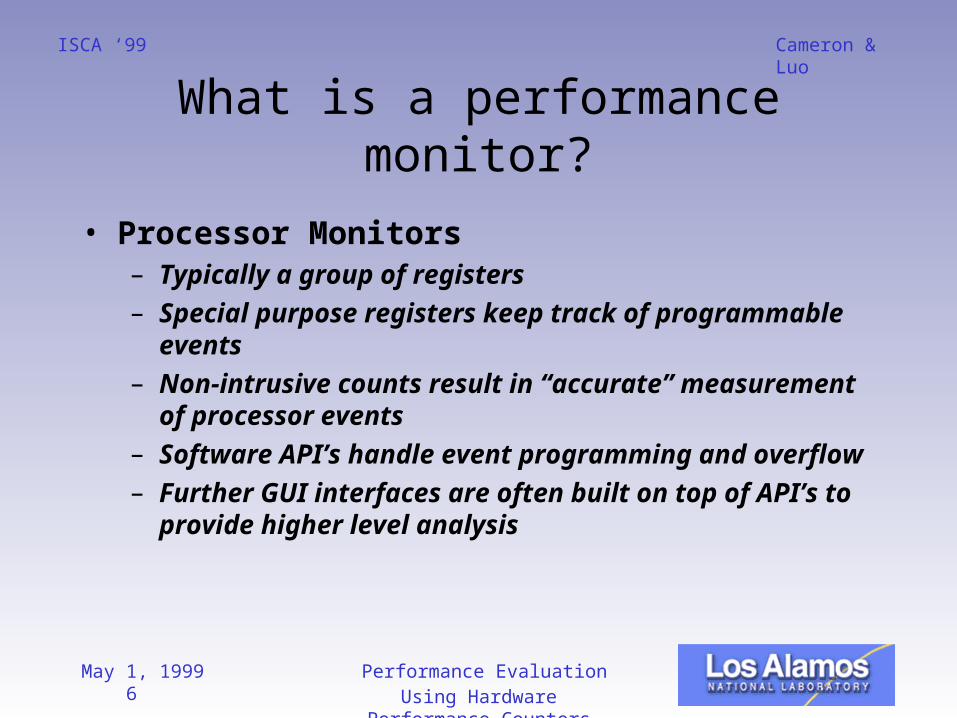
What is a performance monitor?
• Processor Monitors– Typically a group of registers– Special purpose registers keep track of
programmable events– Non-intrusive counts result in “accurate”
measurement of processor events– Software API’s handle event programming and
overflow– Further GUI interfaces are often built on top of
API’s to provide higher level analysis
May 1, 1999 7 Performance Evaluation Using Hardware Performance Counters
Cameron & LuoISCA ‘99
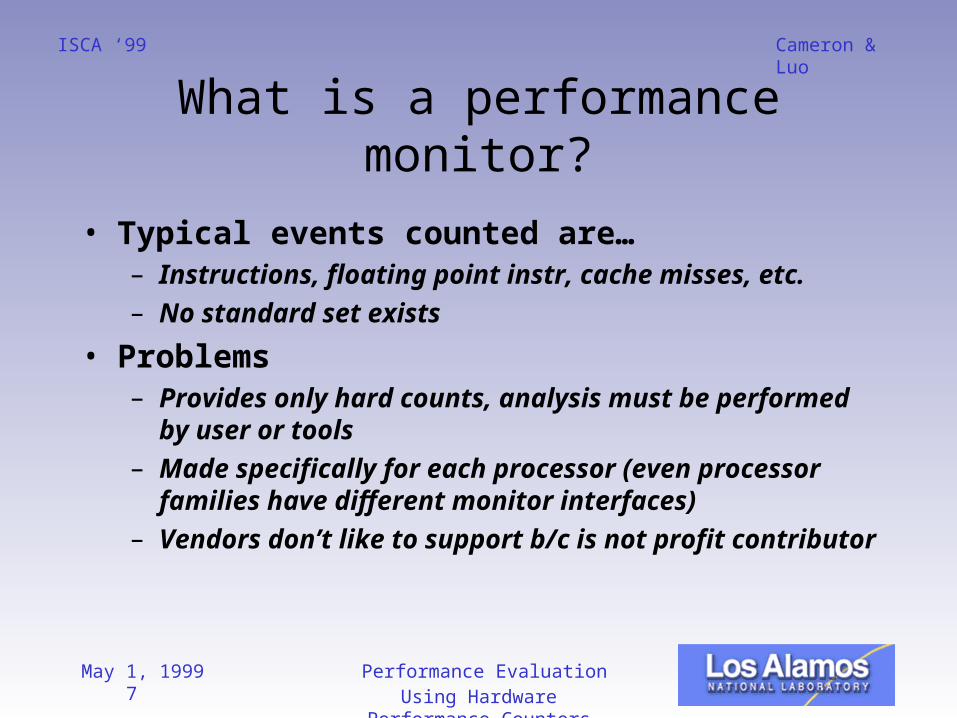
What is a performance monitor?
• Typical events counted are…– Instructions, floating point instr, cache misses,
etc.– No standard set exists
• Problems– Provides only hard counts, analysis must be
performed by user or tools– Made specifically for each processor (even
processor families have different monitor interfaces)
– Vendors don’t like to support b/c is not profit contributor
May 1, 1999 8 Performance Evaluation Using Hardware Performance Counters
Cameron & LuoISCA ‘99
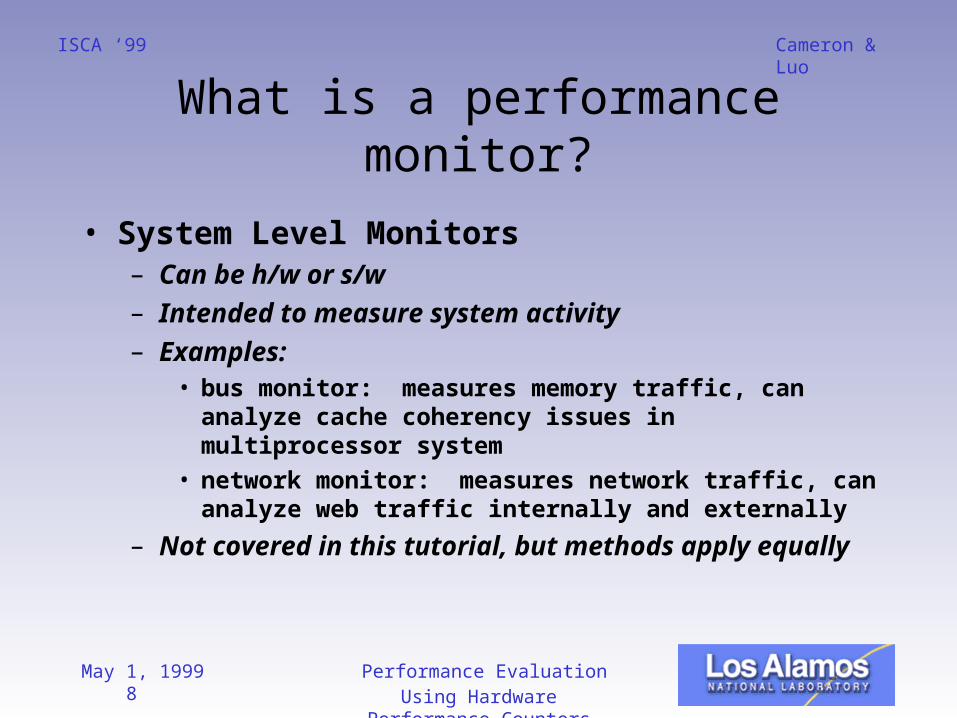
What is a performance monitor?
• System Level Monitors– Can be h/w or s/w– Intended to measure system activity– Examples:
• bus monitor: measures memory traffic, can analyze cache coherency issues in multiprocessor system
• network monitor: measures network traffic, can analyze web traffic internally and externally
– Not covered in this tutorial, but methods apply equally
May 1, 1999 9 Performance Evaluation Using Hardware Performance Counters
Cameron & LuoISCA ‘99
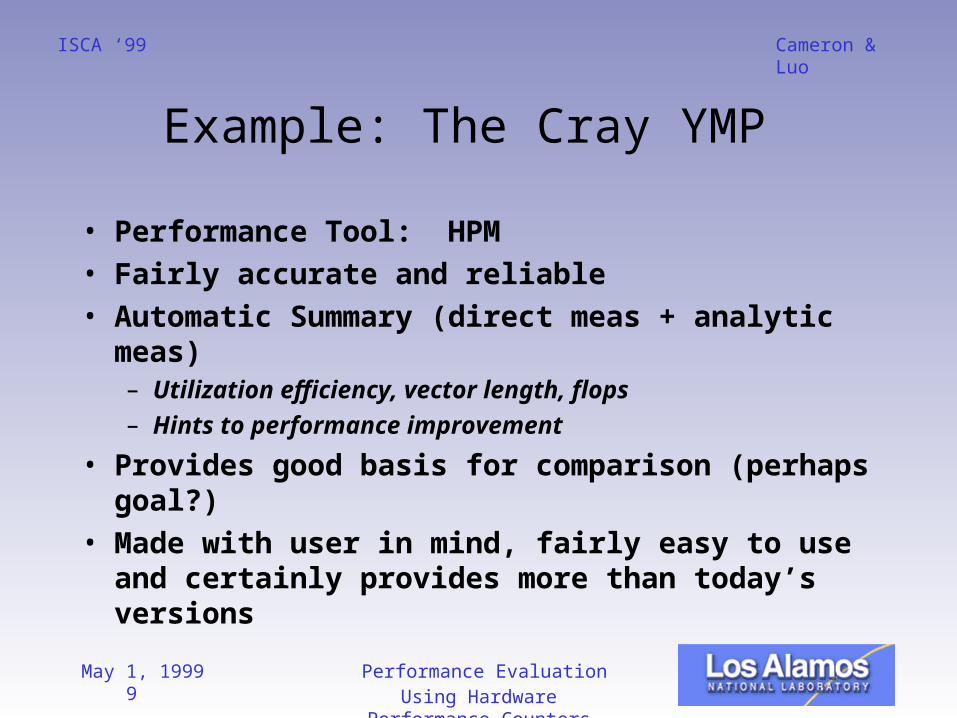
Example: The Cray YMP
• Performance Tool: HPM• Fairly accurate and reliable• Automatic Summary (direct meas +
analytic meas)– Utilization efficiency, vector length, flops– Hints to performance improvement
• Provides good basis for comparison (perhaps goal?)
• Made with user in mind, fairly easy to use and certainly provides more than today’s versions
May 1, 1999 10 Performance Evaluation Using Hardware Performance Counters
Cameron & LuoISCA ‘99
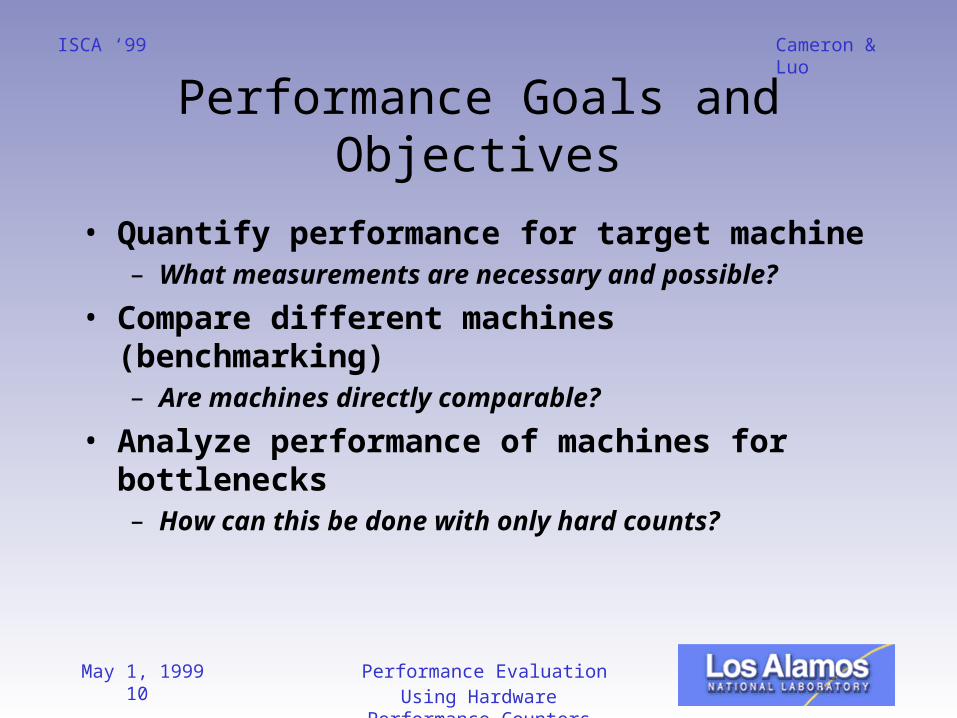
Performance Goals and Objectives
• Quantify performance for target machine– What measurements are necessary and
possible?
• Compare different machines (benchmarking)– Are machines directly comparable?
• Analyze performance of machines for bottlenecks– How can this be done with only hard counts?
May 1, 1999 11 Performance Evaluation Using Hardware Performance Counters
Cameron & LuoISCA ‘99
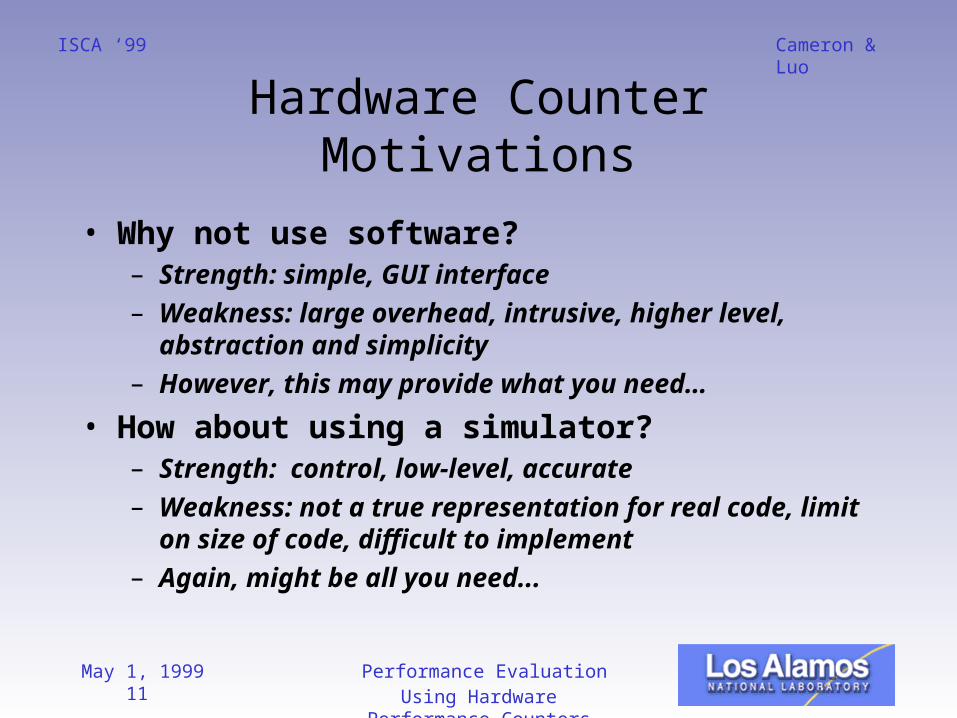
Hardware Counter Motivations
• Why not use software?– Strength: simple, GUI interface– Weakness: large overhead, intrusive, higher
level, abstraction and simplicity– However, this may provide what you need…
• How about using a simulator?– Strength: control, low-level, accurate– Weakness: not a true representation for real
code, limit on size of code, difficult to implement
– Again, might be all you need...
May 1, 1999 12 Performance Evaluation Using Hardware Performance Counters
Cameron & LuoISCA ‘99
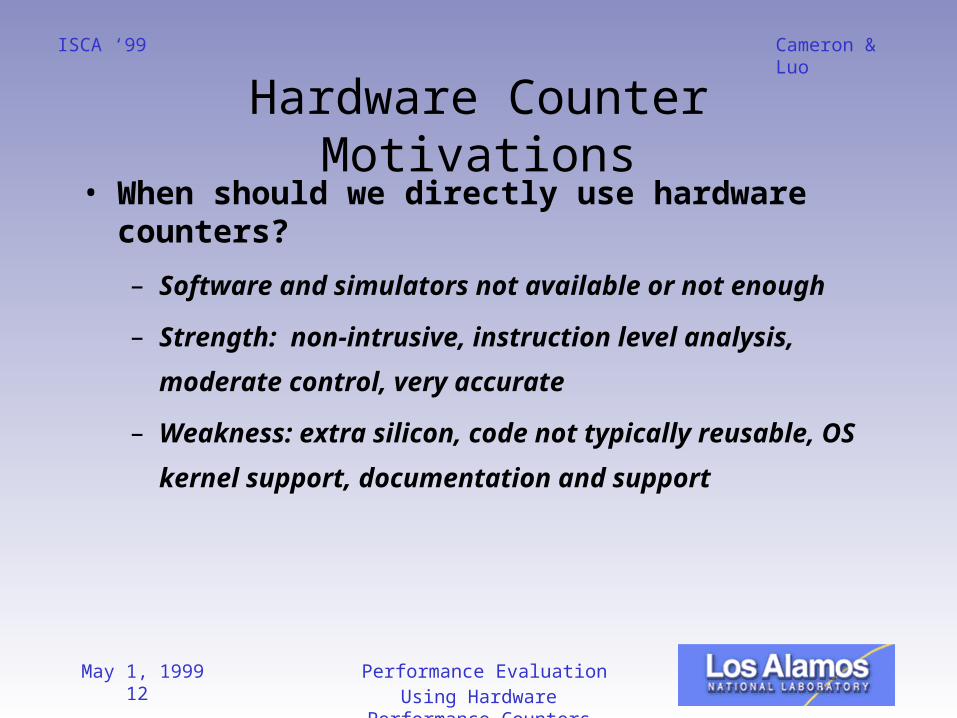
Hardware Counter Motivations• When should we directly use hardware
counters?
– Software and simulators not available or not
enough
– Strength: non-intrusive, instruction level
analysis, moderate control, very accurate
– Weakness: extra silicon, code not typically
reusable, OS kernel support, documentation
and support
May 1, 1999 13 Performance Evaluation Using Hardware Performance Counters
Cameron & LuoISCA ‘99
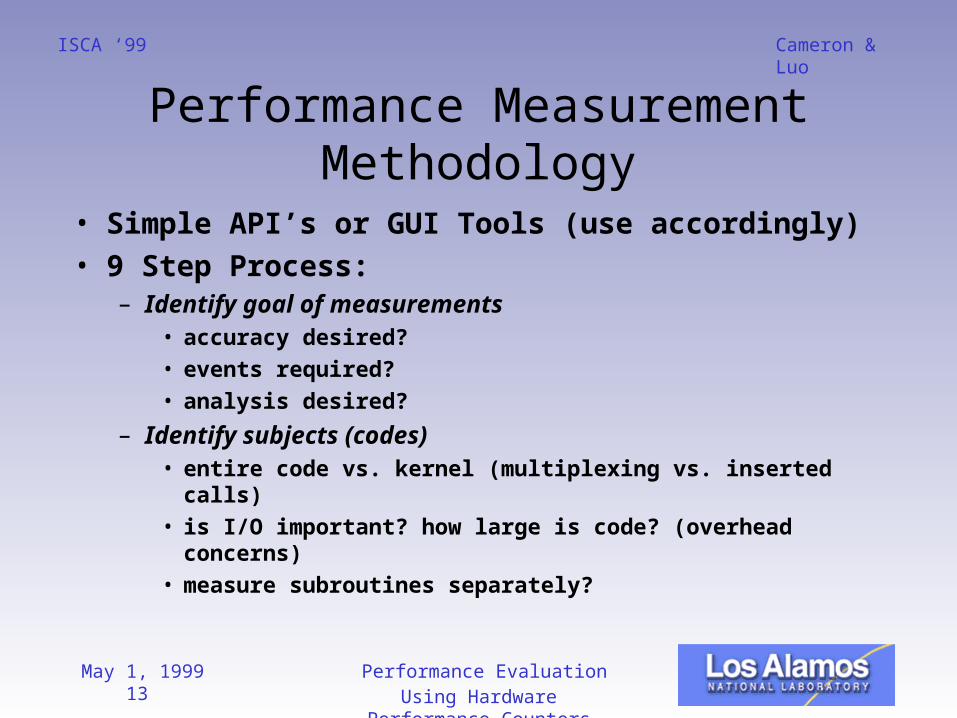
Performance Measurement Methodology
• Simple API’s or GUI Tools (use accordingly)• 9 Step Process:
– Identify goal of measurements• accuracy desired?• events required?• analysis desired?
– Identify subjects (codes)• entire code vs. kernel (multiplexing vs. inserted
calls)• is I/O important? how large is code? (overhead
concerns)• measure subroutines separately?
May 1, 1999 14 Performance Evaluation Using Hardware Performance Counters
Cameron & LuoISCA ‘99
Performance Measurement Methodology
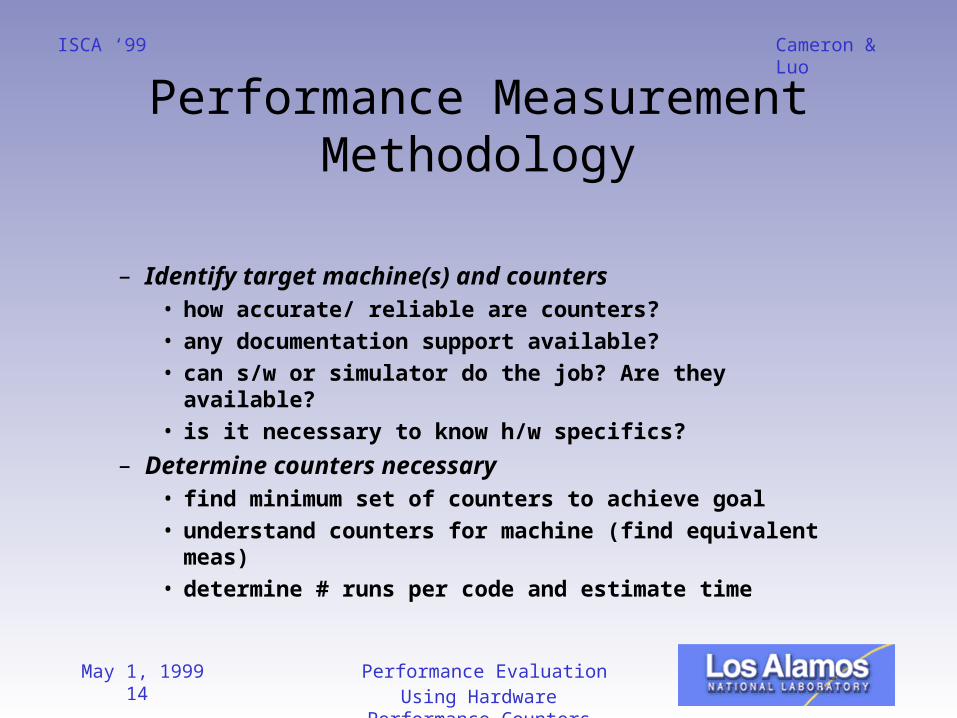
– Identify target machine(s) and counters• how accurate/ reliable are counters?• any documentation support available?• can s/w or simulator do the job? Are they available?• is it necessary to know h/w specifics?
– Determine counters necessary• find minimum set of counters to achieve goal• understand counters for machine (find equivalent
meas)• determine # runs per code and estimate time
May 1, 1999 15 Performance Evaluation Using Hardware Performance Counters
Cameron & LuoISCA ‘99
Performance Measurement Methodology
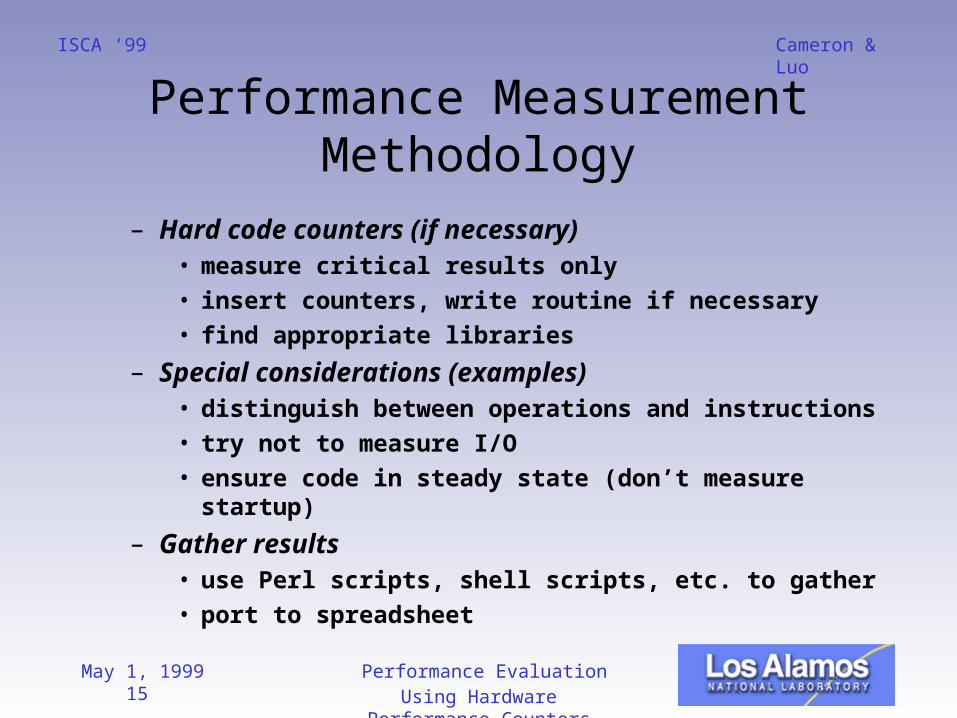
– Hard code counters (if necessary)• measure critical results only• insert counters, write routine if necessary• find appropriate libraries
– Special considerations (examples)• distinguish between operations and instructions• try not to measure I/O• ensure code in steady state (don’t measure
startup)
– Gather results• use Perl scripts, shell scripts, etc. to gather• port to spreadsheet
May 1, 1999 16 Performance Evaluation Using Hardware Performance Counters
Cameron & LuoISCA ‘99
Performance Measurement Methodology
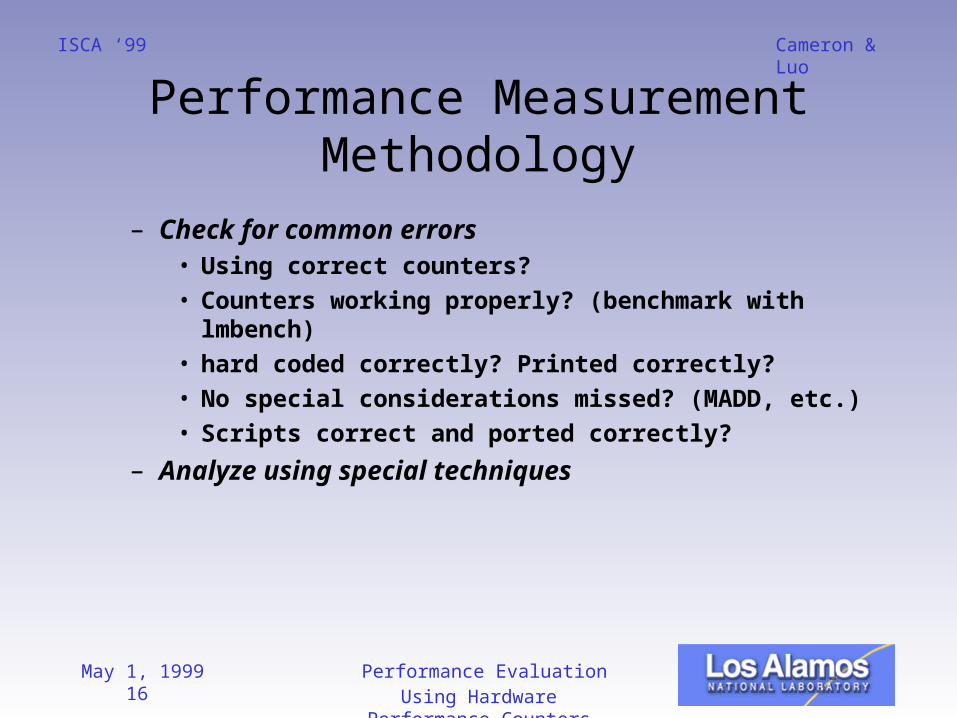
– Check for common errors• Using correct counters?• Counters working properly? (benchmark with
lmbench)• hard coded correctly? Printed correctly?• No special considerations missed? (MADD, etc.)• Scripts correct and ported correctly?
– Analyze using special techniques
May 1, 1999 17 Performance Evaluation Using Hardware Performance Counters
Cameron & LuoISCA ‘99
Problem Set
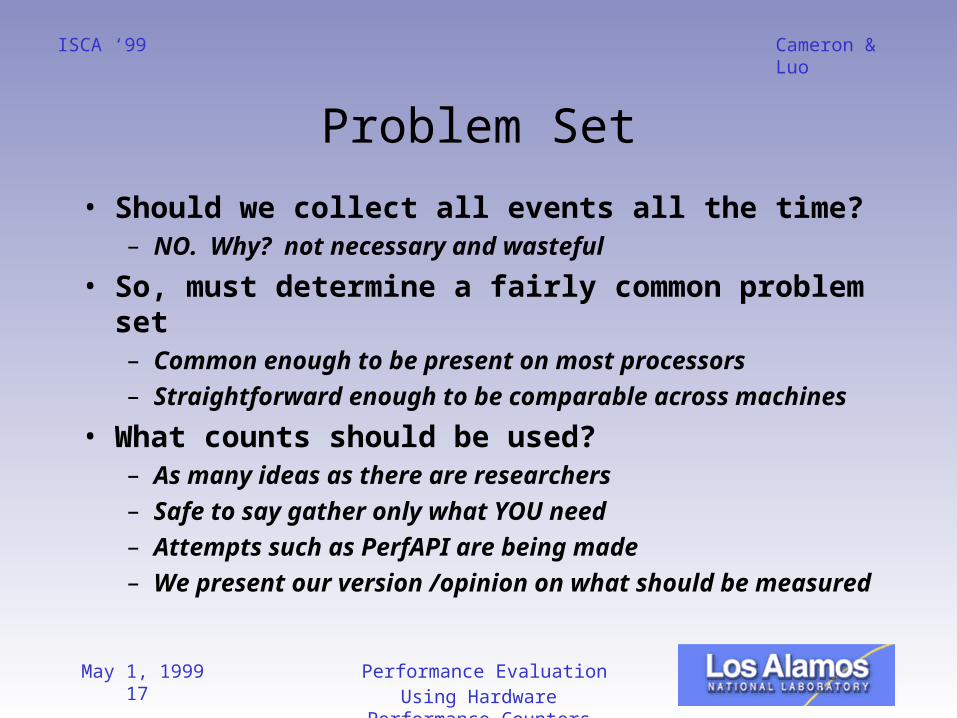
• Should we collect all events all the time? – NO. Why? not necessary and wasteful
• So, must determine a fairly common problem set– Common enough to be present on most processors– Straightforward enough to be comparable across
machines
• What counts should be used?– As many ideas as there are researchers– Safe to say gather only what YOU need– Attempts such as PerfAPI are being made– We present our version /opinion on what should be
measured
May 1, 1999 18 Performance Evaluation Using Hardware Performance Counters
Cameron & LuoISCA ‘99
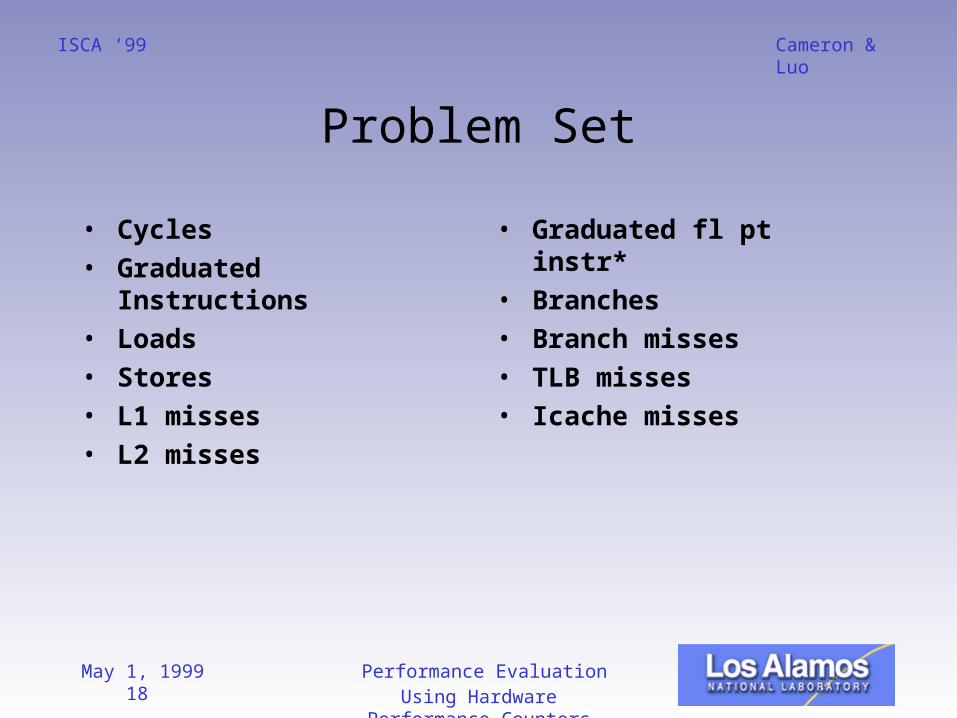
Problem Set
• Cycles• Graduated
Instructions• Loads• Stores• L1 misses• L2 misses
• Graduated fl pt instr*• Branches• Branch misses• TLB misses• Icache misses
May 1, 1999 19 Performance Evaluation Using Hardware Performance Counters
Cameron & LuoISCA ‘99
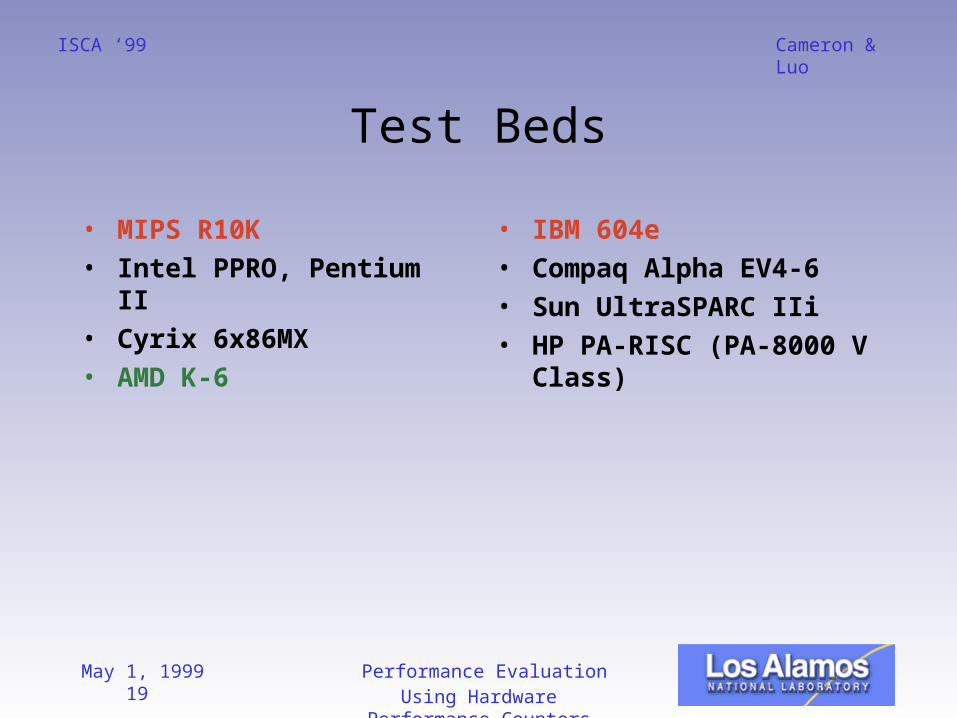
Test Beds
• MIPS R10K• Intel PPRO, Pentium II• Cyrix 6x86MX• AMD K-6
• IBM 604e• Compaq Alpha EV4-6• Sun UltraSPARC IIi• HP PA-RISC (PA-8000
V Class)
May 1, 1999 20 Performance Evaluation Using Hardware Performance Counters
Cameron & LuoISCA ‘99
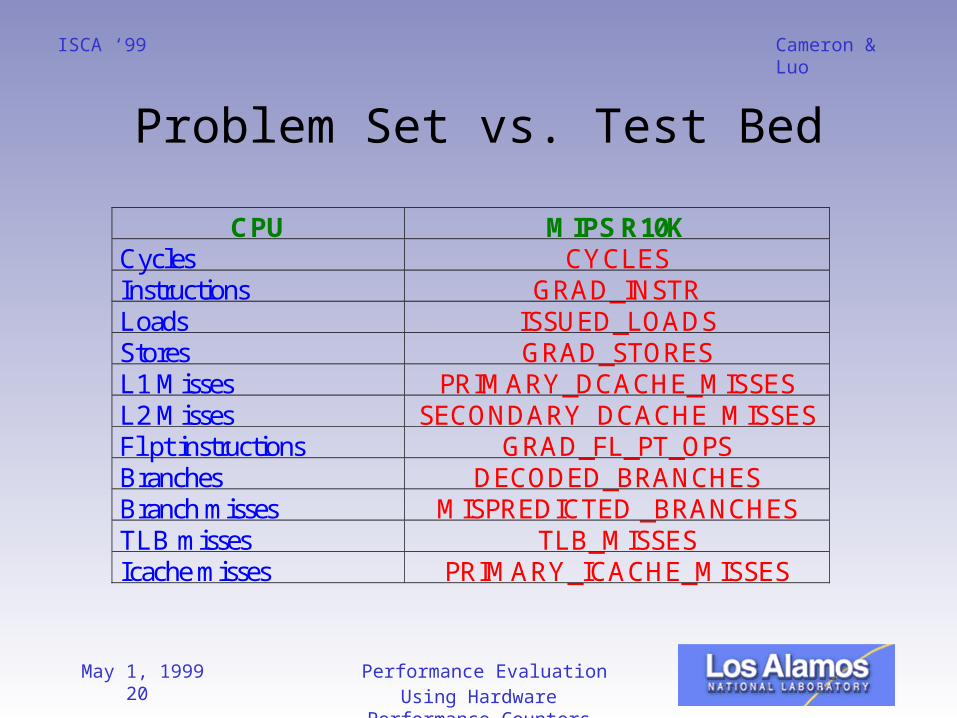
Problem Set vs. Test Bed
CPU MIPS R10KCycles CYCLESInstructions GRAD_INSTRLoads ISSUED_LOADSStores GRAD_STORESL1 Misses PRIMARY_DCACHE_MISSESL2 Misses SECONDARY_DCACHE_MISSESFl pt instructions GRAD_FL_PT_OPSBranches DECODED_BRANCHESBranch misses MISPREDICTED _BRANCHESTLB misses TLB_MISSESIcache misses PRIMARY_ICACHE_MISSES
May 1, 1999 21 Performance Evaluation Using Hardware Performance Counters
Cameron & LuoISCA ‘99
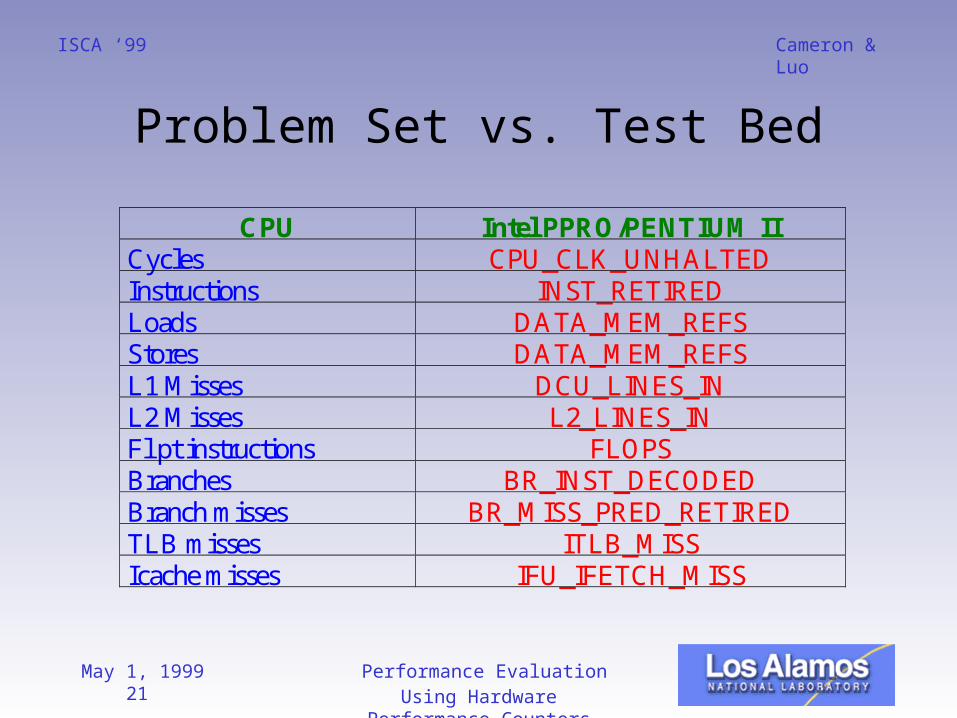
Problem Set vs. Test Bed
CPU Intel PPRO/PENTIUM IICycles CPU_CLK_UNHALTEDInstructions INST_RETIREDLoads DATA_MEM_REFSStores DATA_MEM_REFSL1 Misses DCU_LINES_INL2 Misses L2_LINES_INFl pt instructions FLOPSBranches BR_INST_DECODEDBranch misses BR_MISS_PRED_RETIREDTLB misses ITLB_MISSIcache misses IFU_IFETCH_MISS
May 1, 1999 22 Performance Evaluation Using Hardware Performance Counters
Cameron & LuoISCA ‘99
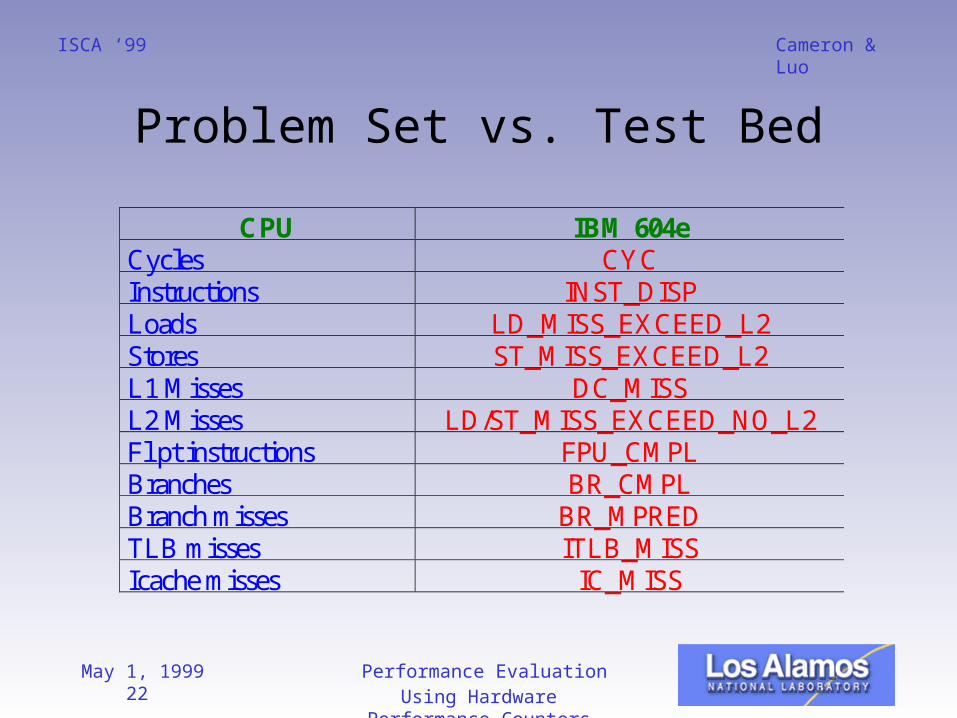
Problem Set vs. Test Bed
CPU IBM 604eCycles CYCInstructions INST_DISPLoads LD_MISS_EXCEED_L2Stores ST_MISS_EXCEED_L2L1 Misses DC_MISSL2 Misses LD/ST_MISS_EXCEED_NO_L2Fl pt instructions FPU_CMPLBranches BR_CMPLBranch misses BR_MPREDTLB misses ITLB_MISSIcache misses IC_MISS
May 1, 1999 23 Performance Evaluation Using Hardware Performance Counters
Cameron & LuoISCA ‘99
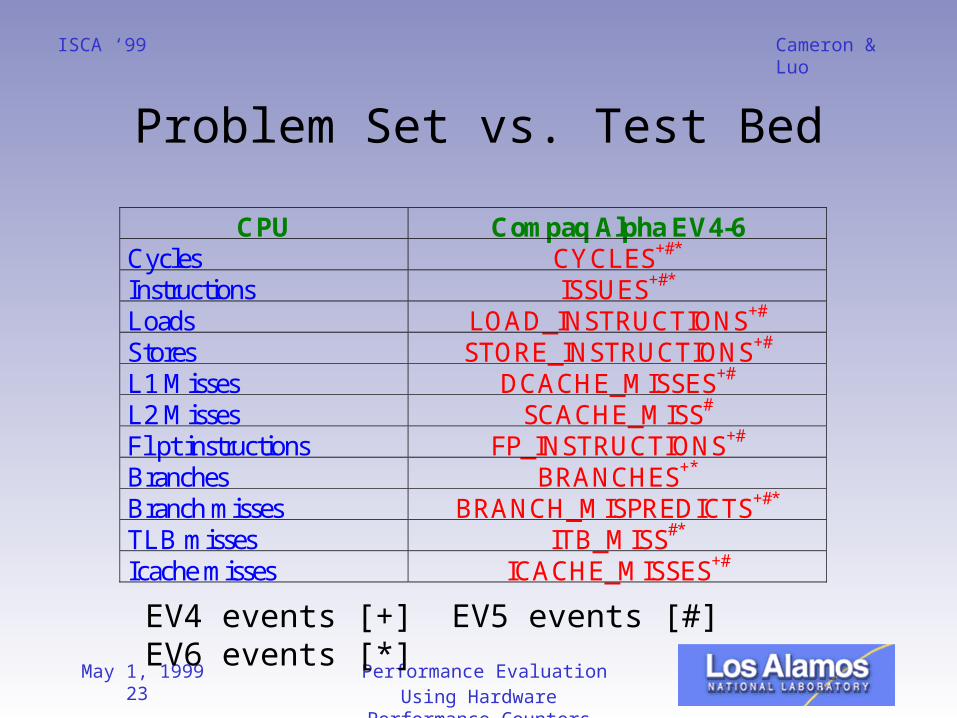
Problem Set vs. Test Bed
CPU Compaq Alpha EV4-6Cycles CYCLES+#*
Instructions ISSUES+#*
Loads LOAD_INSTRUCTIONS+#
Stores STORE_INSTRUCTIONS+#
L1 Misses DCACHE_MISSES+#
L2 Misses SCACHE_MISS#
Fl pt instructions FP_INSTRUCTIONS+#
Branches BRANCHES+*
Branch misses BRANCH_MISPREDICTS+#*
TLB misses ITB_MISS#*
Icache misses ICACHE_MISSES+#
EV4 events [+] EV5 events [#] EV6 events [*]
May 1, 1999 24 Performance Evaluation Using Hardware Performance Counters
Cameron & LuoISCA ‘99
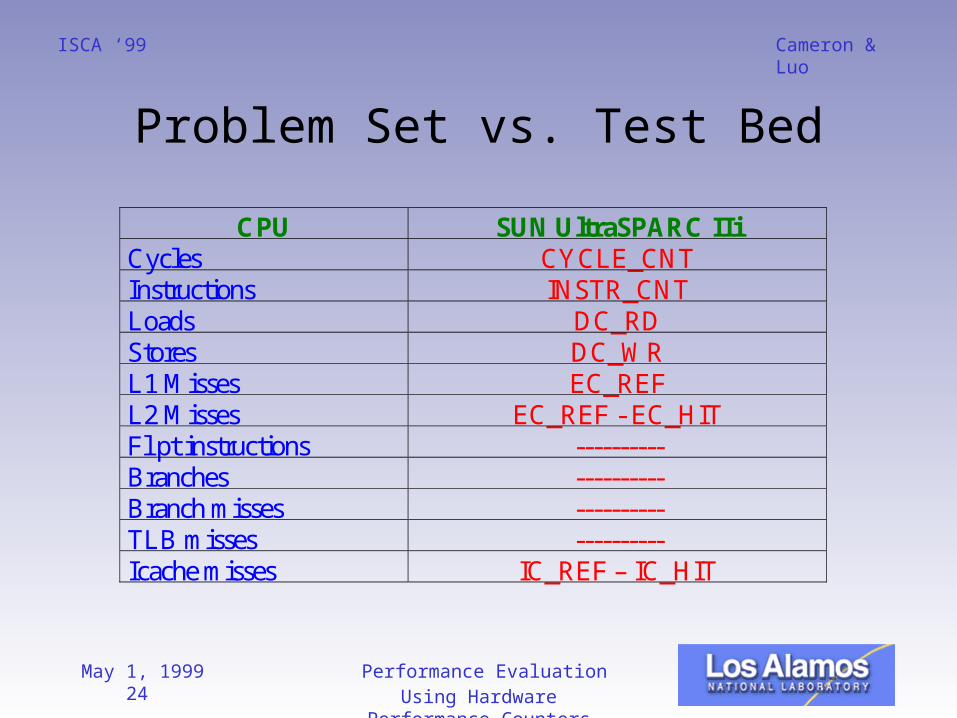
Problem Set vs. Test Bed
CPU SUN UltraSPARC IIiCycles CYCLE_CNTInstructions INSTR_CNTLoads DC_RDStores DC_WRL1 Misses EC_REFL2 Misses EC_REF - EC_HITFl pt instructions ----------Branches ----------Branch misses ----------TLB misses ----------Icache misses IC_REF – IC_HIT
May 1, 1999 25 Performance Evaluation Using Hardware Performance Counters
Cameron & LuoISCA ‘99
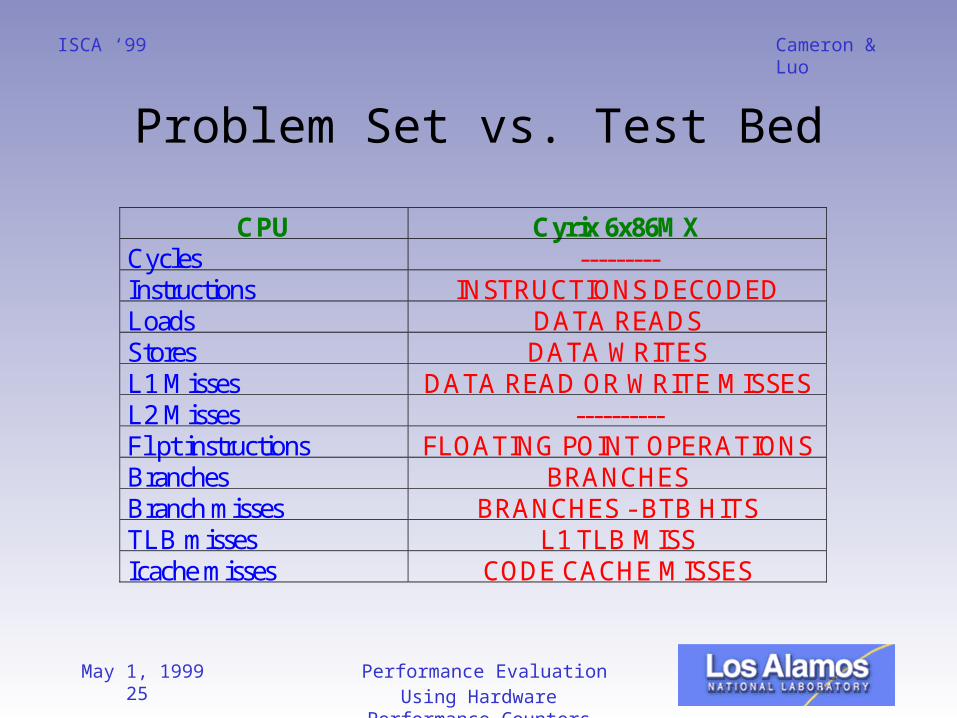
Problem Set vs. Test Bed
CPU Cyrix 6x86MXCycles ---------Instructions INSTRUCTIONS DECODEDLoads DATA READSStores DATA WRITESL1 Misses DATA READ OR WRITE MISSESL2 Misses ----------Fl pt instructions FLOATING POINT OPERATIONSBranches BRANCHESBranch misses BRANCHES - BTB HITSTLB misses L1 TLB MISSIcache misses CODE CACHE MISSES

May 1, 1999 26 Performance Evaluation Using Hardware Performance Counters
Cameron & LuoISCA ‘99
Problem Set vs. Test Bed
CPU HP PA-RISC (PA 8000 V Class)Cycles CPU TIMEInstructions INSTRUCTIONSLoads ----------Stores ----------L1 Misses CACHE MISSES?L2 Misses ----------Fl pt instructions ----------Branches ----------Branch misses ----------TLB misses TLB MISSESIcache misses ----------
May 1, 1999 27 Performance Evaluation Using Hardware Performance Counters
Cameron & LuoISCA ‘99
Tool Discussions and Examples
• Overview• Tool Techniques• Available Tools
– MIPS R10K– IBM 604e– Intel PPRO, P II, PIII– Compaq Alpha EV4-6– HP PA-RISC (PA 8000 V Class)
May 1, 1999 28 Performance Evaluation Using Hardware Performance Counters
Cameron & LuoISCA ‘99
Overview
• API Tools (low level)– Interface to counters to simplify use– Typically controls overflow of counters in software– Typically derived from performance monitor data
structures that control specifics of hardware– Some require modifying data structures others
use simple calls to functions that use underlying data structures
– Some provide command line interface– Usually created for in-house use: no help/support– Advantage: you can always create your own API– Disadvantage: can be complicated
May 1, 1999 29 Performance Evaluation Using Hardware Performance Counters
Cameron & LuoISCA ‘99
Overview
• GUI Tools (high level)– Utilize underlying hardware counters for
measurements– Often use some multiplexing of monitors
(sampling)– May provide some analytical values (MFLOPS,
cpi, etc.)– May have GUI interface for ease of use– Often help/support available– Advantage: increased speed, analysis, easier
to use– Disadvantage: decreased accuracy and control
May 1, 1999 30 Performance Evaluation Using Hardware Performance Counters
Cameron & LuoISCA ‘99
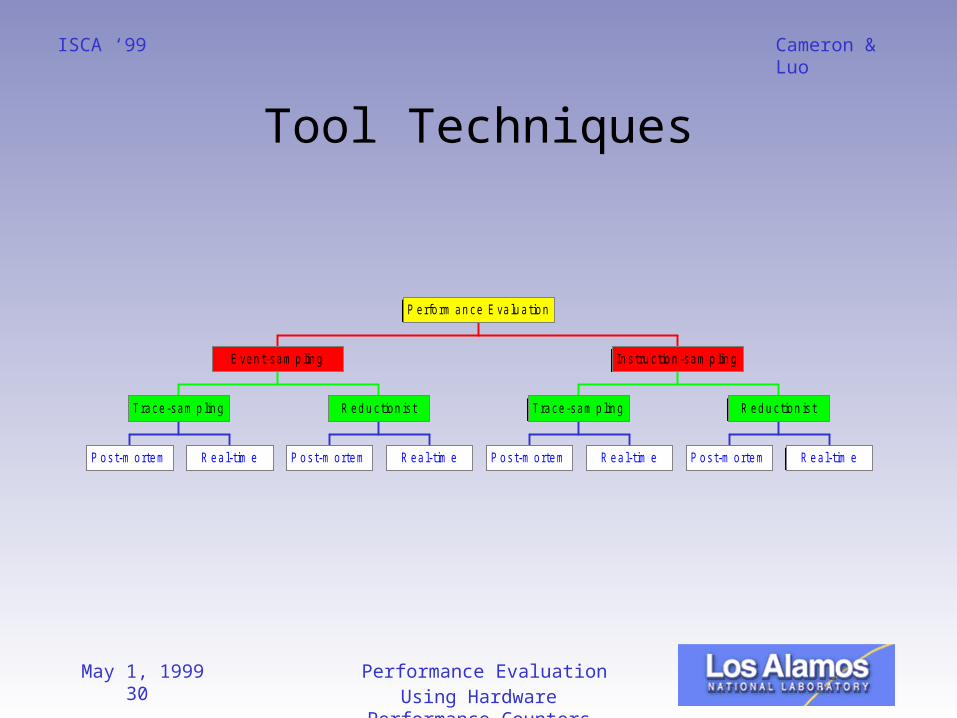
Tool Techniques
P os t-m ortem R ea l-t im e
Trace-sam p lin g
P os t-m ortem R ea l-t im e
R ed u c tion is t
E ven t-sam p lin g
P os t-m ortem R ea l-t im e
Trace-sam p lin g
P os t-m ortem R ea l-t im e
R ed u c tion is t
In s tru c tion -sam p lin g
P erfo rm an ce E va lu a tion
May 1, 1999 31 Performance Evaluation Using Hardware Performance Counters
Cameron & LuoISCA ‘99
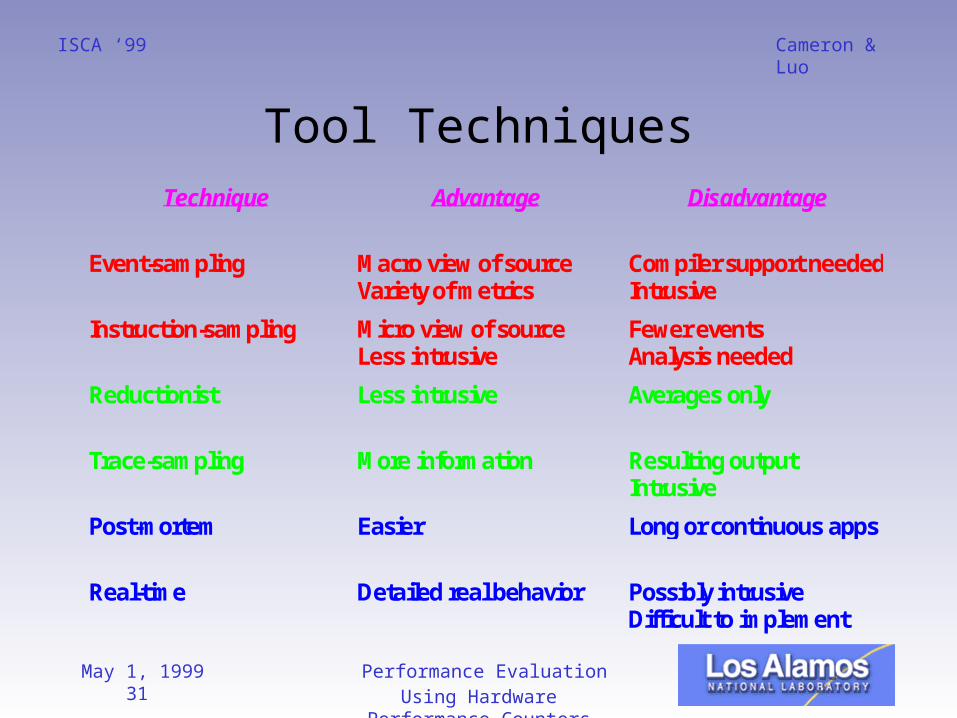
Tool TechniquesTechnique Advantage Disadvantage
Event-sampling Macro view of sourceVariety of metrics
Compiler support neededIntrusive
Instruction-sampling Micro view of sourceLess intrusive
Fewer eventsAnalysis needed
Reductionist Less intrusive Averages only
Trace-sampling More information Resulting outputIntrusive
Post-mortem Easier Long or continuous apps
Real-time Detailed real behavior Possibly intrusiveDifficult to implement
May 1, 1999 32 Performance Evaluation Using Hardware Performance Counters
Cameron & LuoISCA ‘99
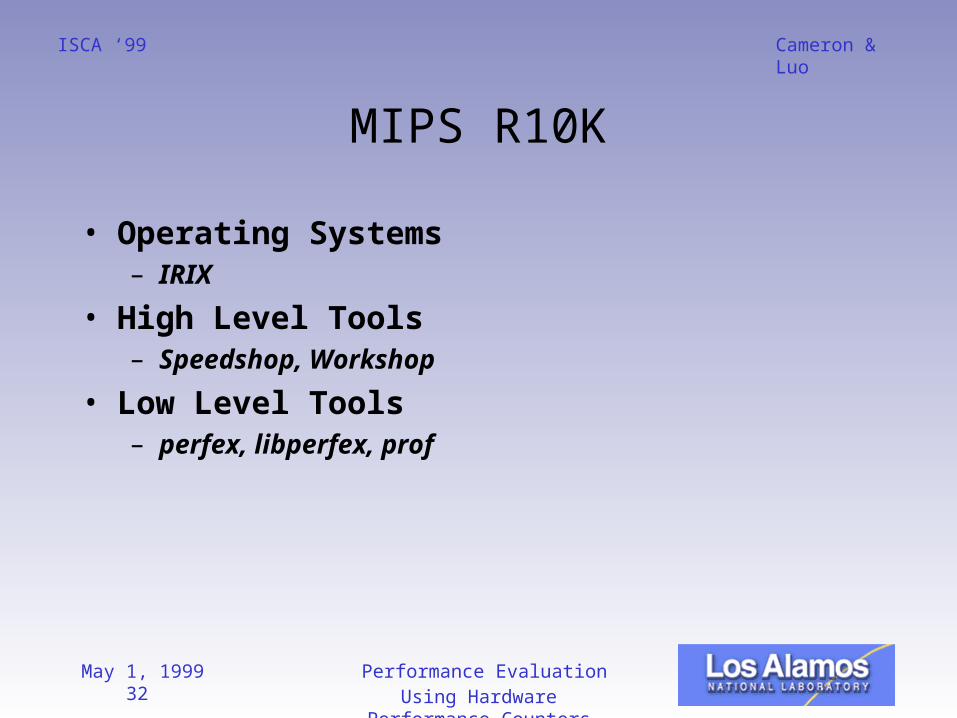
MIPS R10K
• Operating Systems– IRIX
• High Level Tools– Speedshop, Workshop
• Low Level Tools– perfex, libperfex, prof
May 1, 1999 33 Performance Evaluation Using Hardware Performance Counters
Cameron & LuoISCA ‘99
MIPS R10K
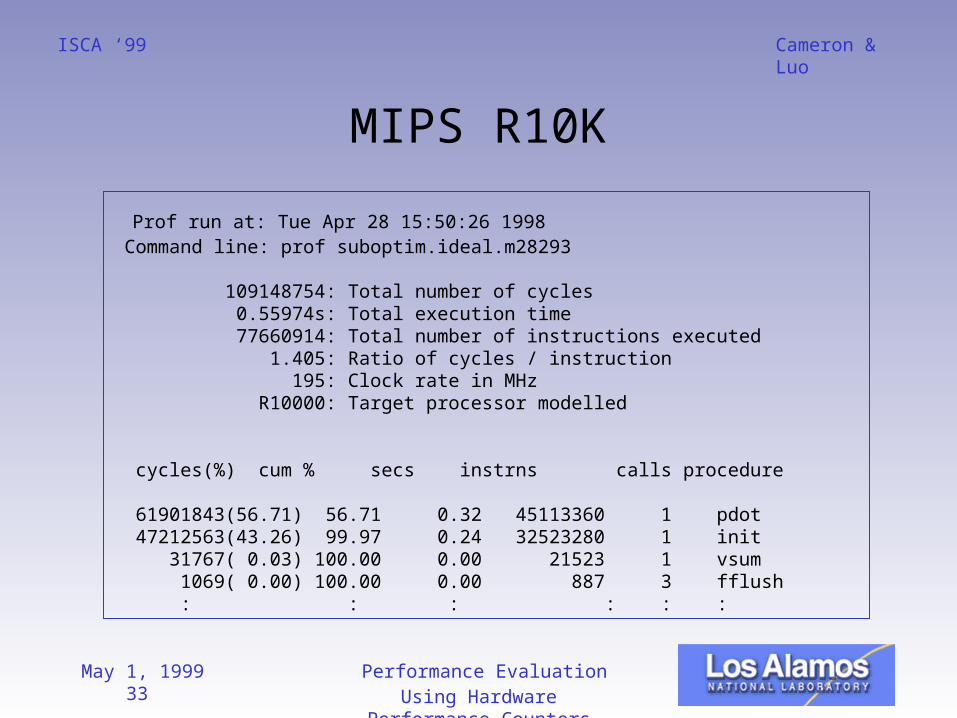
Prof run at: Tue Apr 28 15:50:26 1998 Command line: prof suboptim.ideal.m28293
109148754: Total number of cycles 0.55974s: Total execution time 77660914: Total number of instructions executed 1.405: Ratio of cycles / instruction 195: Clock rate in MHz R10000: Target processor modelled
cycles(%) cum % secs instrns calls procedure
61901843(56.71) 56.71 0.32 45113360 1 pdot 47212563(43.26) 99.97 0.24 32523280 1 init 31767( 0.03) 100.00 0.00 21523 1 vsum 1069( 0.00) 100.00 0.00 887 3 fflush : : : : : :
May 1, 1999 34 Performance Evaluation Using Hardware Performance Counters
Cameron & LuoISCA ‘99
MIPS R10K
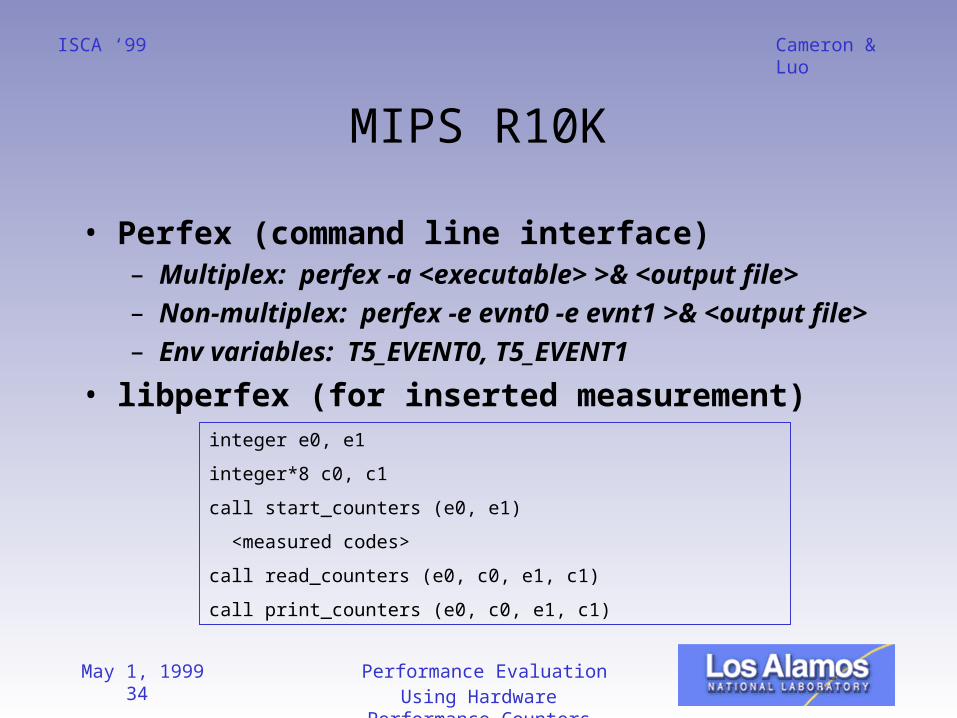
• Perfex (command line interface)– Multiplex: perfex -a <executable> >& <output
file>– Non-multiplex: perfex -e evnt0 -e evnt1 >&
<output file>– Env variables: T5_EVENT0, T5_EVENT1
• libperfex (for inserted measurement)integer e0, e1
integer*8 c0, c1
call start_counters (e0, e1)
<measured codes>
call read_counters (e0, c0, e1, c1)
call print_counters (e0, c0, e1, c1)
May 1, 1999 35 Performance Evaluation Using Hardware Performance Counters
Cameron & LuoISCA ‘99
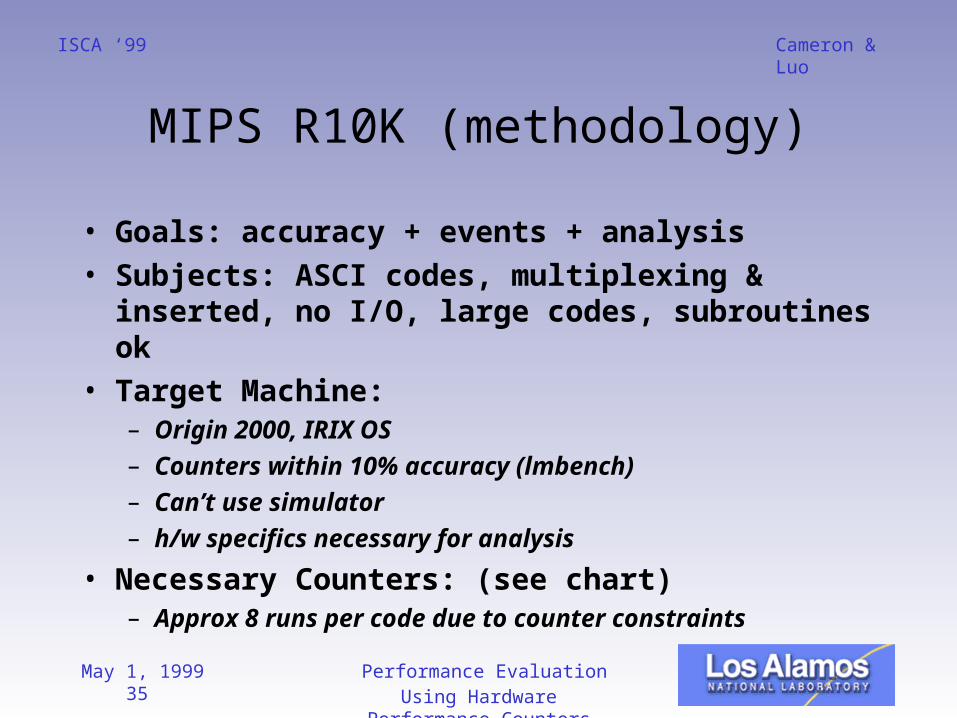
MIPS R10K (methodology)
• Goals: accuracy + events + analysis• Subjects: ASCI codes, multiplexing &
inserted, no I/O, large codes, subroutines ok• Target Machine:
– Origin 2000, IRIX OS– Counters within 10% accuracy (lmbench)– Can’t use simulator– h/w specifics necessary for analysis
• Necessary Counters: (see chart)– Approx 8 runs per code due to counter constraints
May 1, 1999 36 Performance Evaluation Using Hardware Performance Counters
Cameron & LuoISCA ‘99
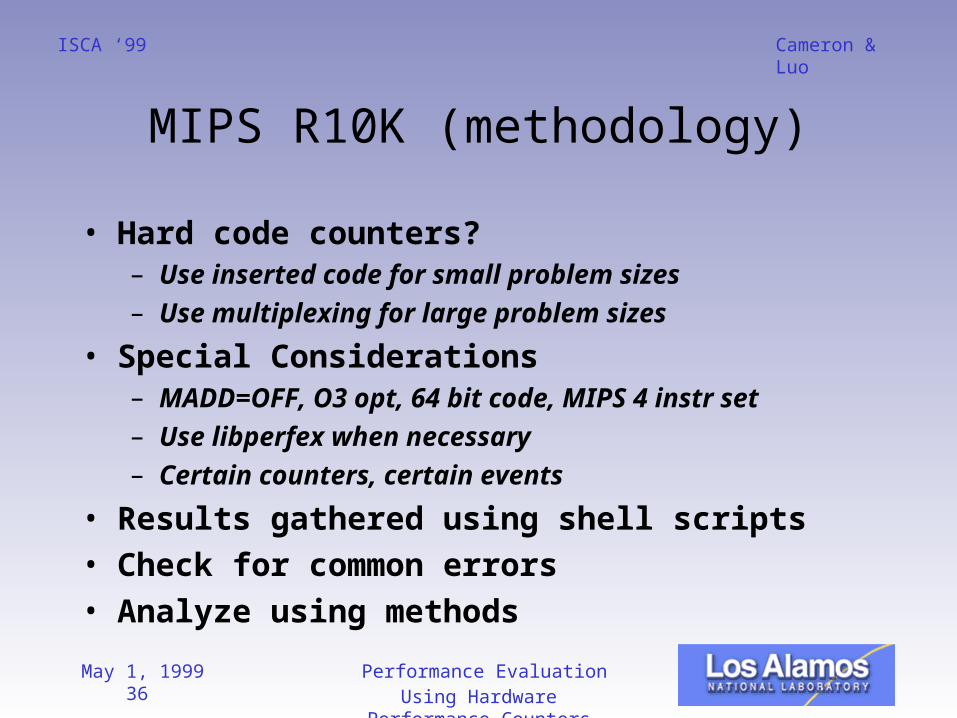
MIPS R10K (methodology)
• Hard code counters?– Use inserted code for small problem sizes– Use multiplexing for large problem sizes
• Special Considerations– MADD=OFF, O3 opt, 64 bit code, MIPS 4 instr set– Use libperfex when necessary– Certain counters, certain events
• Results gathered using shell scripts• Check for common errors• Analyze using methods
May 1, 1999 37 Performance Evaluation Using Hardware Performance Counters
Cameron & LuoISCA ‘99
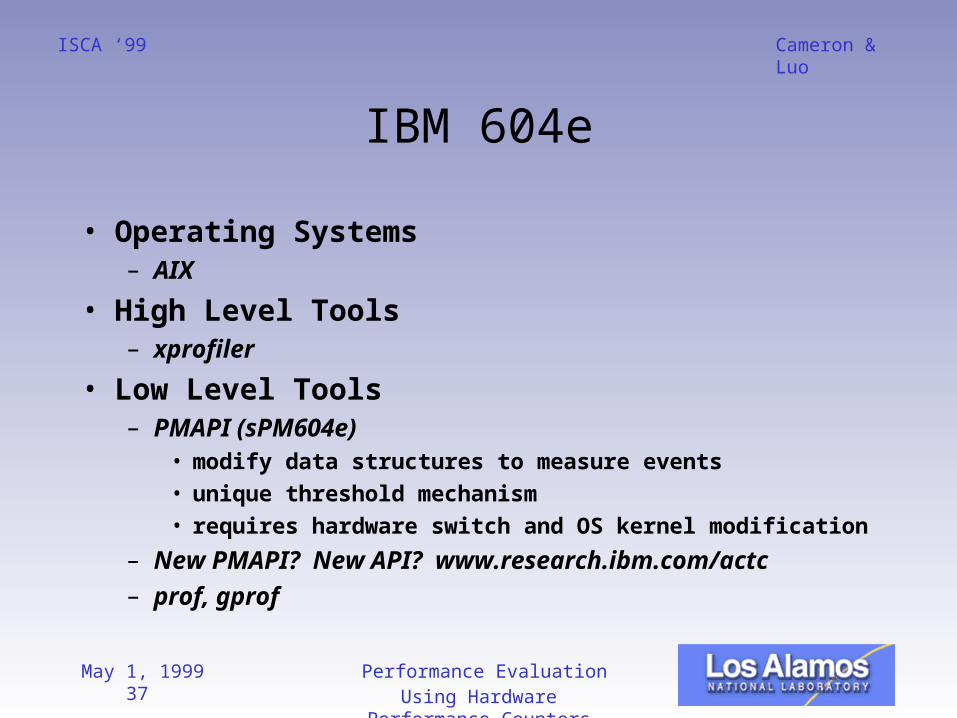
IBM 604e
• Operating Systems– AIX
• High Level Tools– xprofiler
• Low Level Tools– PMAPI (sPM604e)
• modify data structures to measure events• unique threshold mechanism• requires hardware switch and OS kernel modification
– New PMAPI? New API? www.research.ibm.com/actc
– prof, gprof
May 1, 1999 38 Performance Evaluation Using Hardware Performance Counters
Cameron & LuoISCA ‘99
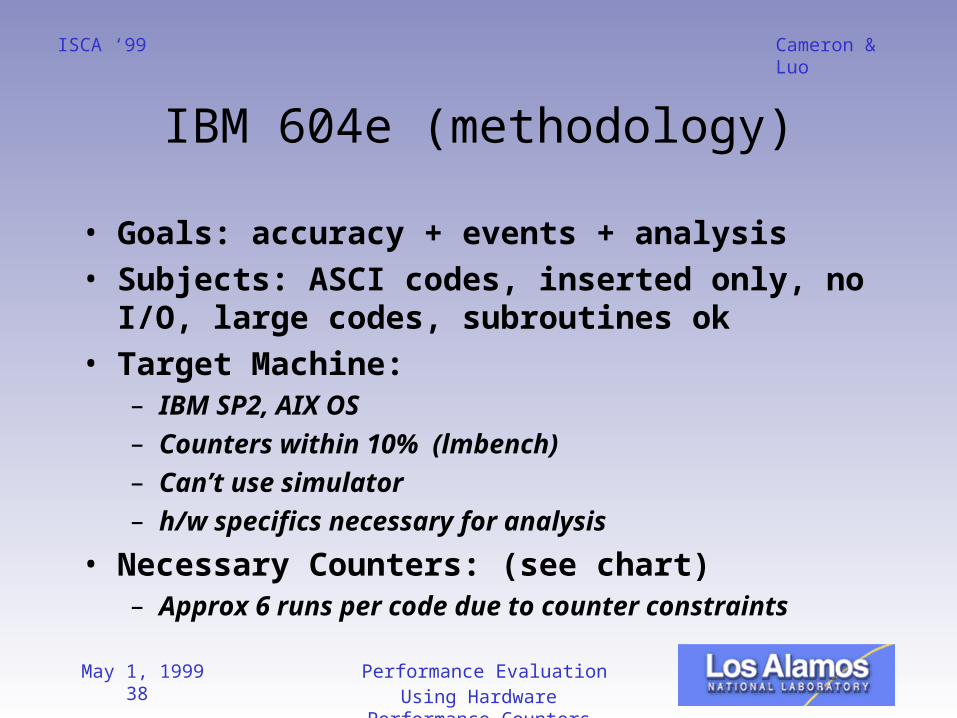
IBM 604e (methodology)
• Goals: accuracy + events + analysis• Subjects: ASCI codes, inserted only, no
I/O, large codes, subroutines ok• Target Machine:
– IBM SP2, AIX OS– Counters within 10% (lmbench)– Can’t use simulator– h/w specifics necessary for analysis
• Necessary Counters: (see chart)– Approx 6 runs per code due to counter
constraints
May 1, 1999 39 Performance Evaluation Using Hardware Performance Counters
Cameron & LuoISCA ‘99
IBM 604e (methodology)
• Hard code counters?– Use inserted code for all problem sizes
• Special Considerations– Threshold mechanism must be enabled– Certain counters, certain events
• Results gathered using shell scripts• Check for common errors• Analyze using methods
May 1, 1999 40 Performance Evaluation Using Hardware Performance Counters
Cameron & LuoISCA ‘99
Intel PPRO, Pentium II & III
• Operating Systems– Windows’, Linux, others
• High Level Tools– Vtune (Windows 95, 98, NT), etc
• Low Level Tools– pperf, mpperf, libpperf (Linux)
May 1, 1999 41 Performance Evaluation Using Hardware Performance Counters
Cameron & LuoISCA ‘99
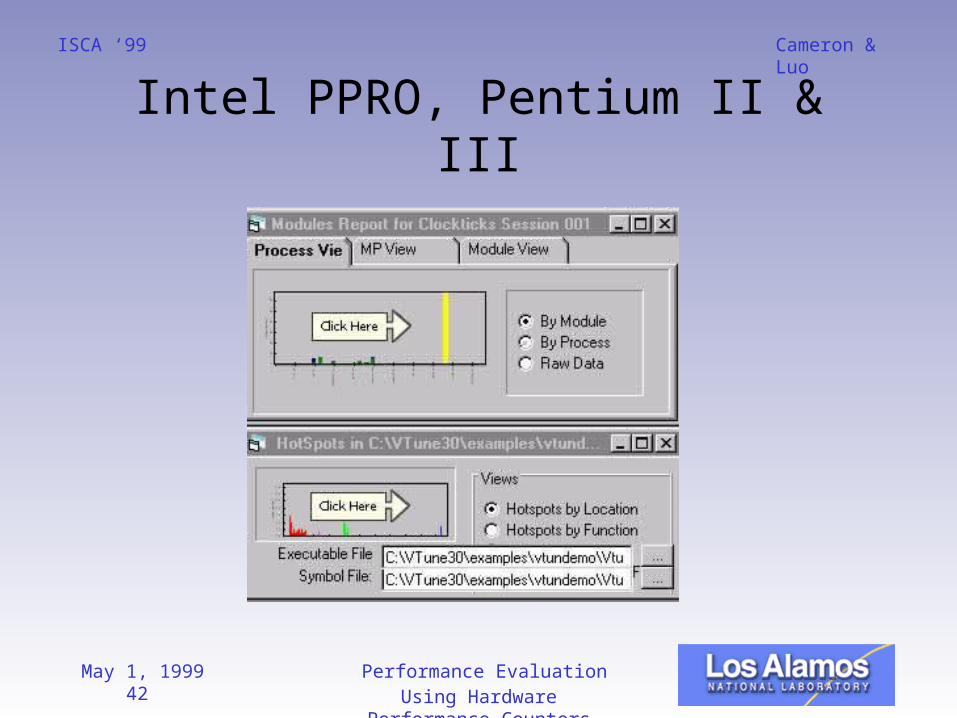
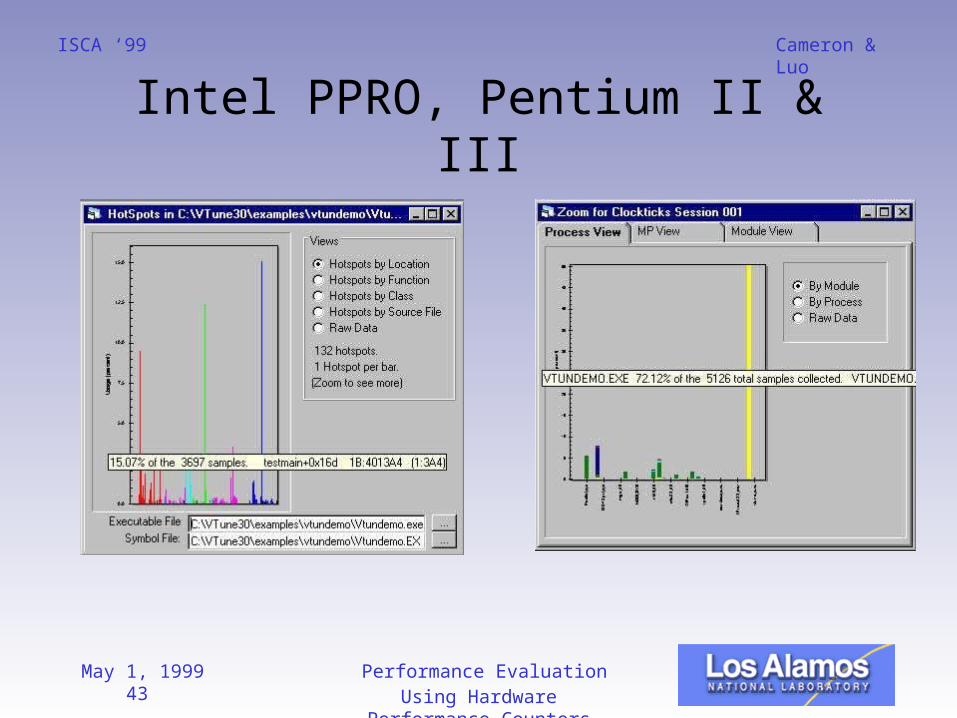
Intel PPRO, Pentium II & III
• Vtune Performance Analyzer 4.0 (event based sampling)– Graphics profiles– System-wide monitoring– Hotspot analysis– Byte code accelerator– OS chronologies– Static assembly code analysis– Online help– Of course…$$
May 1, 1999 42 Performance Evaluation Using Hardware Performance Counters
Cameron & LuoISCA ‘99
Intel PPRO, Pentium II & III
May 1, 1999 43 Performance Evaluation Using Hardware Performance Counters
Cameron & LuoISCA ‘99
Intel PPRO, Pentium II & III
May 1, 1999 44 Performance Evaluation Using Hardware Performance Counters
Cameron & LuoISCA ‘99
Intel PPRO, Pentium II & III
• pperf (command line version on Linux)– Multiplex: mpperf– Non-multiplex: pperf
• libpperf (for inserted measurement on Linux)– Similar to perfex on MIPS R10K
May 1, 1999 45 Performance Evaluation Using Hardware Performance Counters
Cameron & LuoISCA ‘99
Compaq Alpha EV4-6
• Operating Systems– DEC UNIX, Windows
• High Level Tools– DCPI, ProfileMe
• Low Level Tools– uprofile, prof*– May not be necessary
May 1, 1999 46 Performance Evaluation Using Hardware Performance Counters
Cameron & LuoISCA ‘99
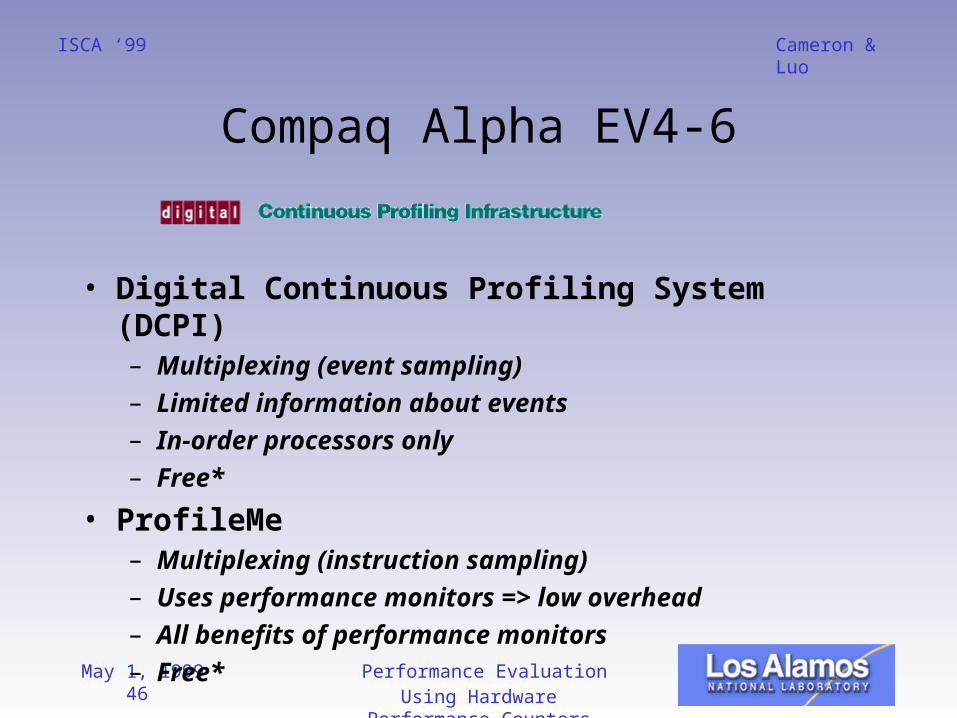
Compaq Alpha EV4-6
• Digital Continuous Profiling System (DCPI)– Multiplexing (event sampling)– Limited information about events– In-order processors only– Free*
• ProfileMe– Multiplexing (instruction sampling)– Uses performance monitors => low overhead– All benefits of performance monitors– Free*
May 1, 1999 47 Performance Evaluation Using Hardware Performance Counters
Cameron & LuoISCA ‘99
HP PA-RISC (PA 8000 V Class)
• Operating Systems– HP-UX
• High Level Tools– CXperf
• Low Level Tools– Not openly available– Require additional hardware
May 1, 1999 48 Performance Evaluation Using Hardware Performance Counters
Cameron & LuoISCA ‘99
HP PA-RISC (PA 8000 V Class)
• CXperf– Event based analysis tool– Integrated with compiler– Provides:
• wallclock, cpu time• TLB misses, context switches• instructions, cache misses, latency
– Advantage: variety of metrics– Disadvantage: more intrusive
May 1, 1999 49 Performance Evaluation Using Hardware Performance Counters
Cameron & LuoISCA ‘99
Performance Evaluation Using Hardware Performance Counters
Interpretation, derivations, and empirical analysis
May 1, 1999 50 Performance Evaluation Using Hardware Performance Counters
Cameron & LuoISCA ‘99
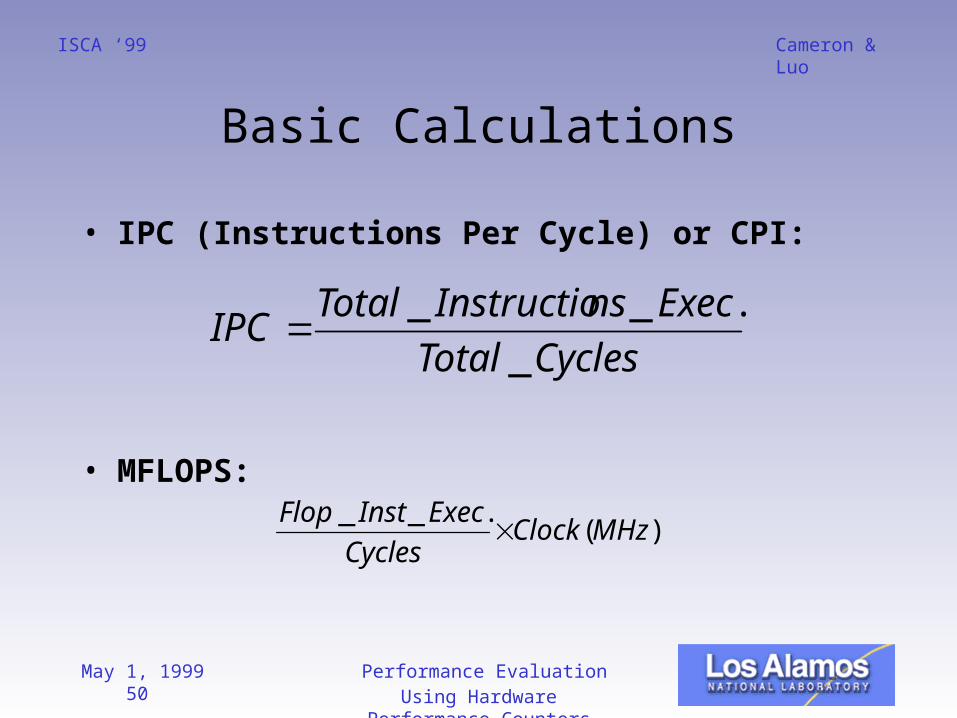
Basic Calculations
• IPC (Instructions Per Cycle) or CPI:
• MFLOPS:
CyclesTotal
ExecnsInstructioTotalIPC
_
.__
)(.__
MHzClockCycles
ExecInstFlop
May 1, 1999 51 Performance Evaluation Using Hardware Performance Counters
Cameron & LuoISCA ‘99
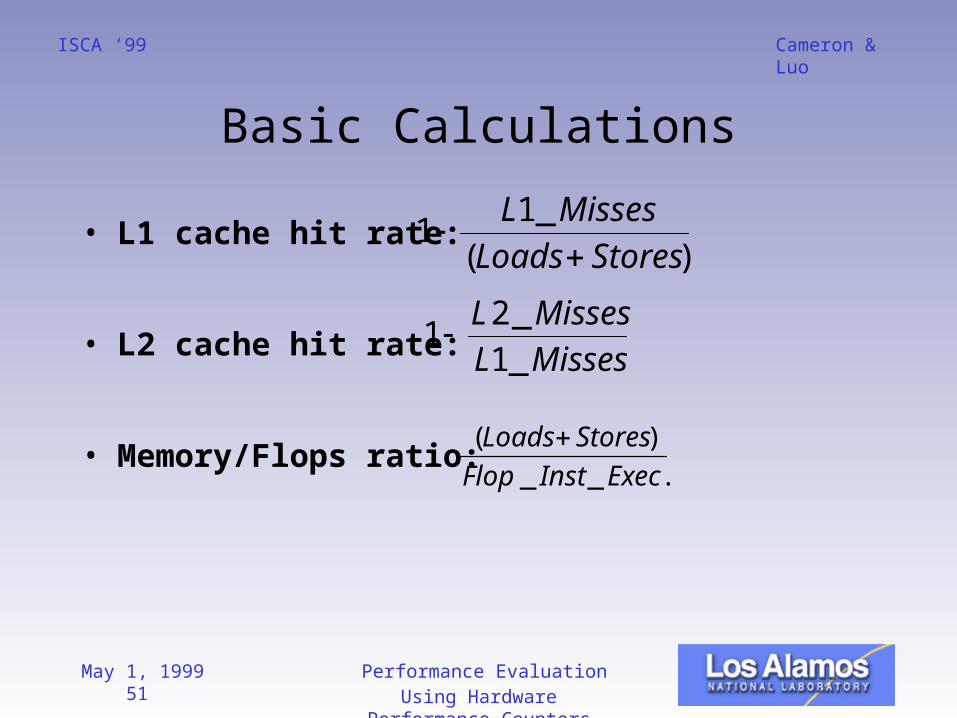
Basic Calculations
• L1 cache hit rate:
• L2 cache hit rate:
• Memory/Flops ratio:
)(
_11
StoresLoads
MissesL
MissesL
MissesL
_1
_21
.__
)(
ExecInstFlop
StoresLoads
May 1, 1999 52 Performance Evaluation Using Hardware Performance Counters
Cameron & LuoISCA ‘99
Basic Calculations
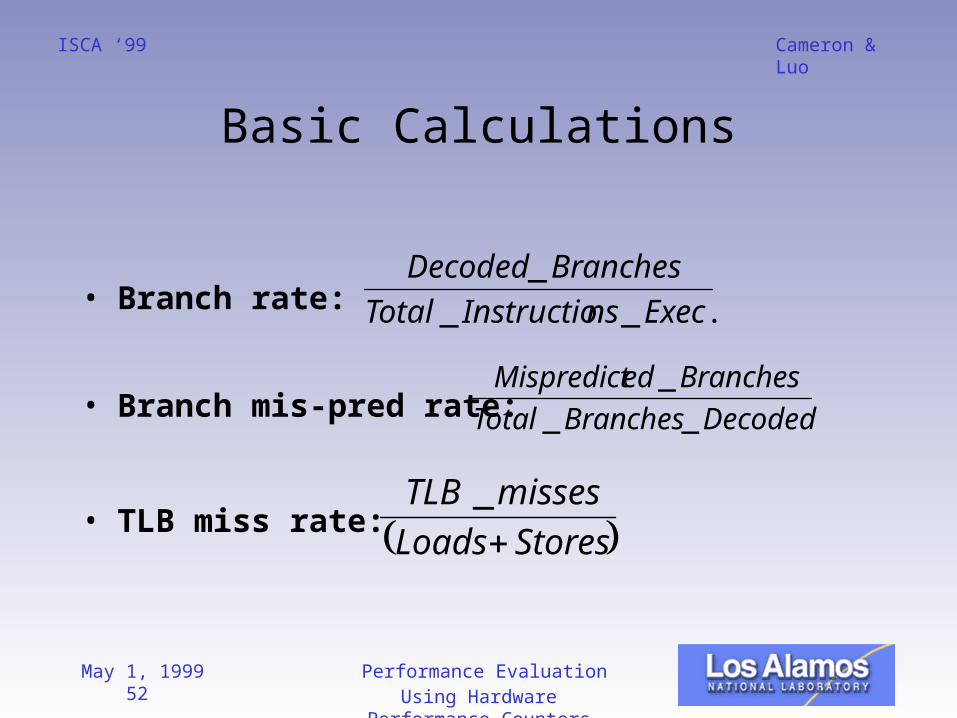
• Branch rate:
• Branch mis-pred rate:
• TLB miss rate:
DecodedBranchesTotal
BranchesedMispredict
__
_
StoresLoads
missesTLB
_
.__
_
ExecnsInstructioTotal
BranchesDecoded
May 1, 1999 53 Performance Evaluation Using Hardware Performance Counters
Cameron & LuoISCA ‘99
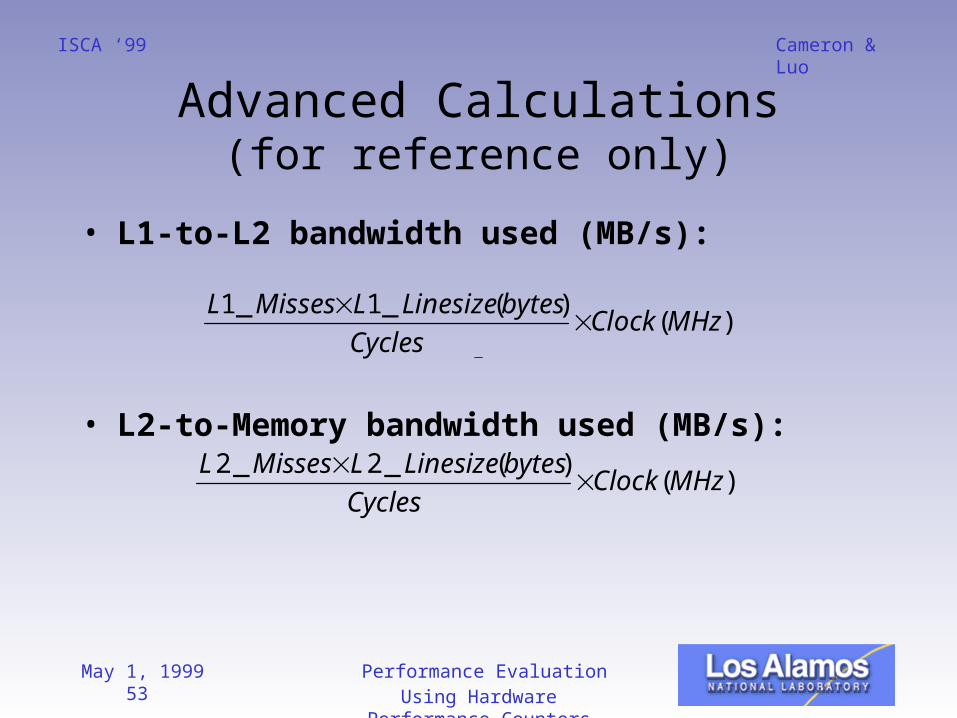
Advanced Calculations(for reference only)
• L1-to-L2 bandwidth used (MB/s):
• L2-to-Memory bandwidth used (MB/s):
)()(_1_1
MHzClockCycles
bytesLinesizeLMissesL
)()(_2_2
MHzClockCycles
bytesLinesizeLMissesL
May 1, 1999 54 Performance Evaluation Using Hardware Performance Counters
Cameron & LuoISCA ‘99
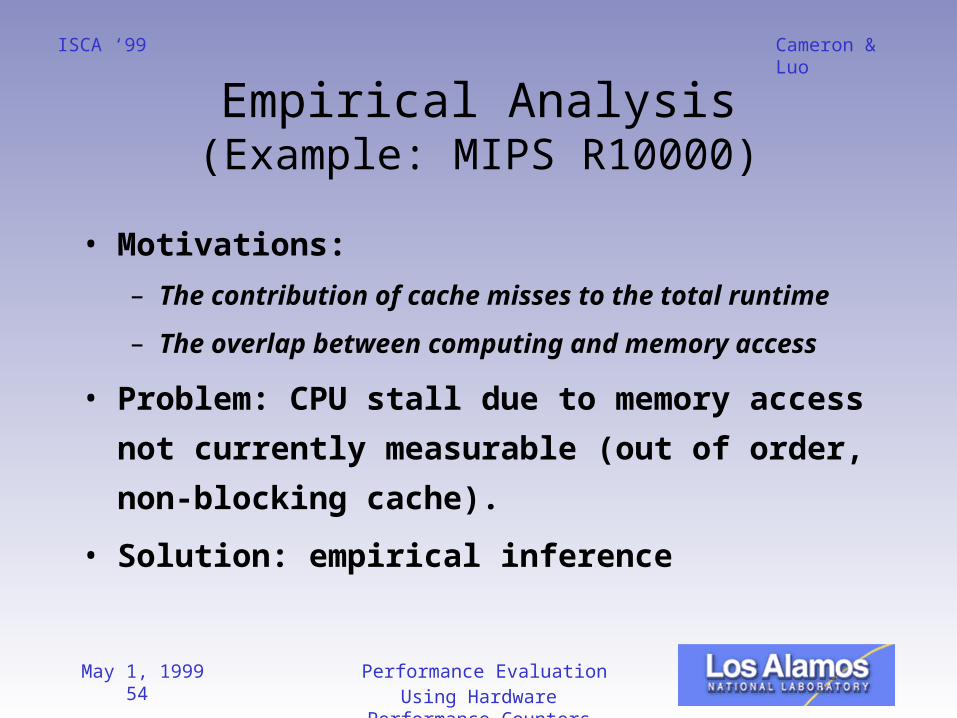
Empirical Analysis(Example: MIPS R10000)
• Motivations:
– The contribution of cache misses to the total
runtime
– The overlap between computing and memory
access
• Problem: CPU stall due to memory access
not currently measurable (out of order,
non-blocking cache).
• Solution: empirical inference
May 1, 1999 55 Performance Evaluation Using Hardware Performance Counters
Cameron & LuoISCA ‘99
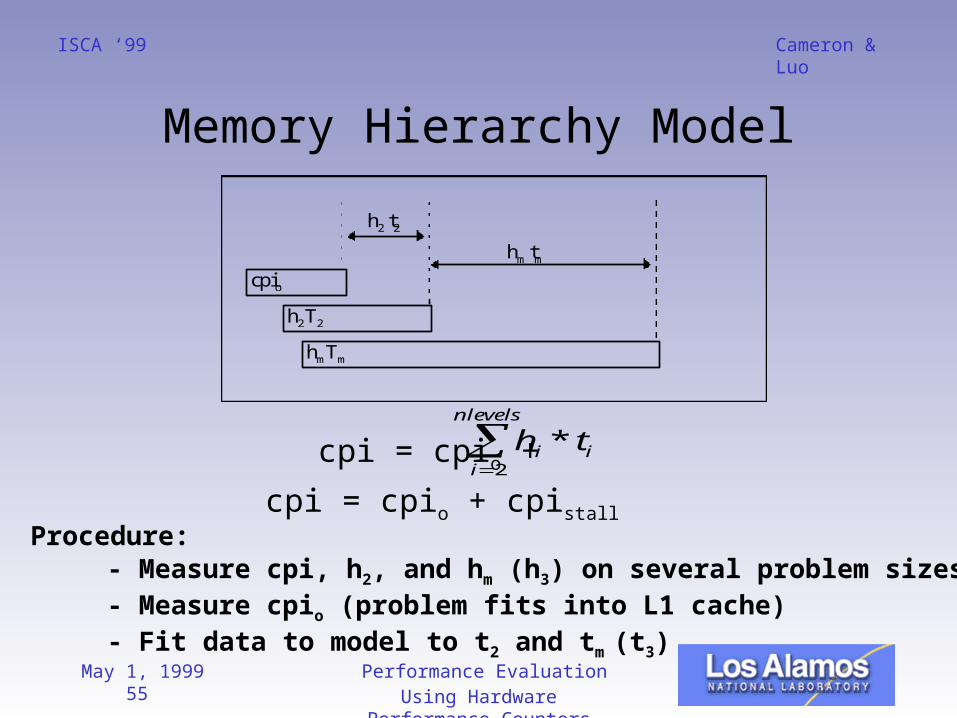
Memory Hierarchy Model
cpio
h2T2
hmTm
h2 t2
hm tm
hi * tii2
nlevels
cpi = cpio +
cpi = cpio + cpistall Procedure:
- Measure cpi, h2, and hm (h3) on several problem sizes- Measure cpio (problem fits into L1 cache)- Fit data to model to t2 and tm (t3)
May 1, 1999 56 Performance Evaluation Using Hardware Performance Counters
Cameron & LuoISCA ‘99
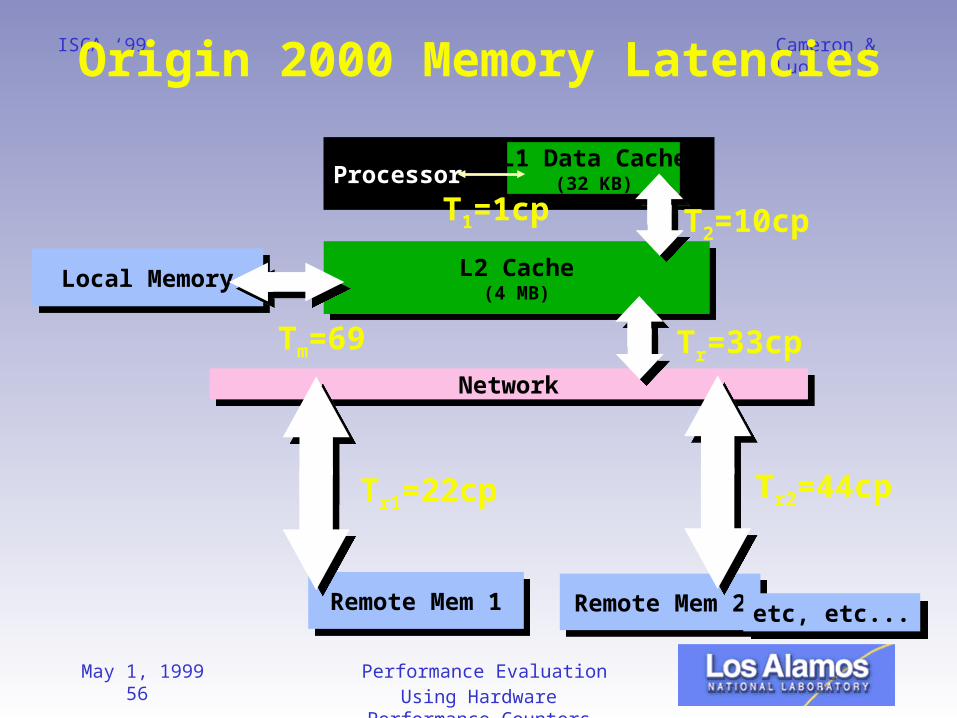
NetworkNetwork
ProcessorL1 Data Cache
(32 KB)
L2 Cache(4 MB)
L2 Cache(4 MB)Local MemoryLocal Memory
Remote Mem 1Remote Mem 1 Remote Mem 2Remote Mem 2etc, etc...etc, etc...
Tm=69
Tr1=22cp
T1=1cp T2=10cp
Tr2=44cp
Tr=33cp
Origin 2000 Memory Latencies
May 1, 1999 57 Performance Evaluation Using Hardware Performance Counters
Cameron & LuoISCA ‘99
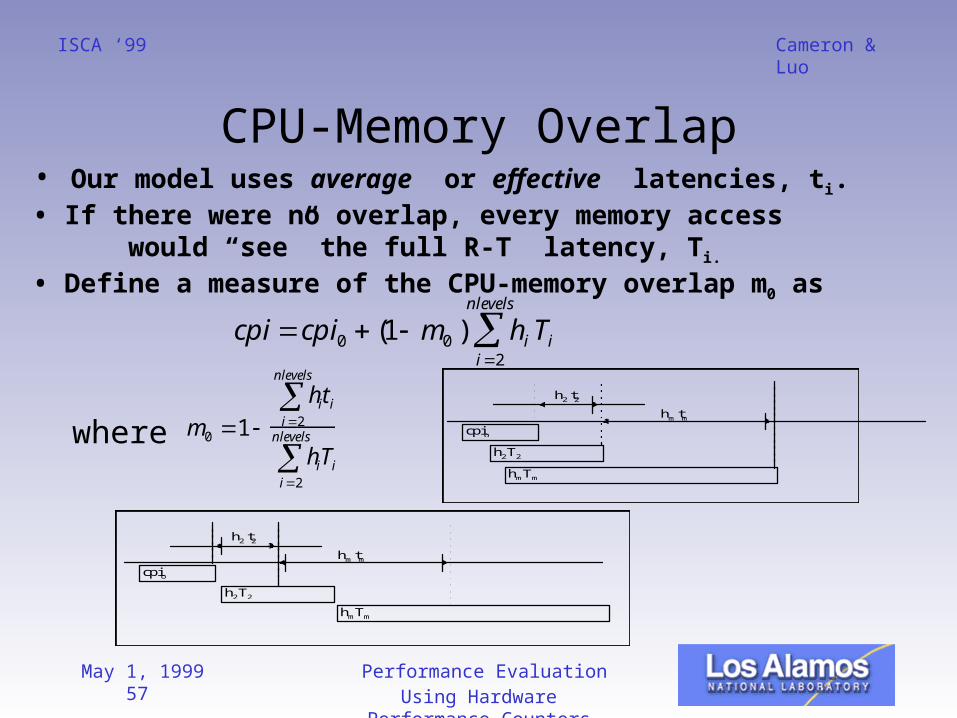
CPU-Memory Overlap
cpi cpi0 (1 m0 ) hii2
nlevels
Ti
m0 1 hit i
i2
nlevels
hiTii2
nlevels
cpio
h2T2
hmTm
h2 t2
hm tm
• Our model uses average or effective latencies, ti.• If there were no overlap, every memory access
would “see” the full R-T latency, Ti.
• Define a measure of the CPU-memory overlap m0 as
where
cpio
h2T2
hmTm
h2 t2
hm tm
May 1, 1999 58 Performance Evaluation Using Hardware Performance Counters
Cameron & LuoISCA ‘99
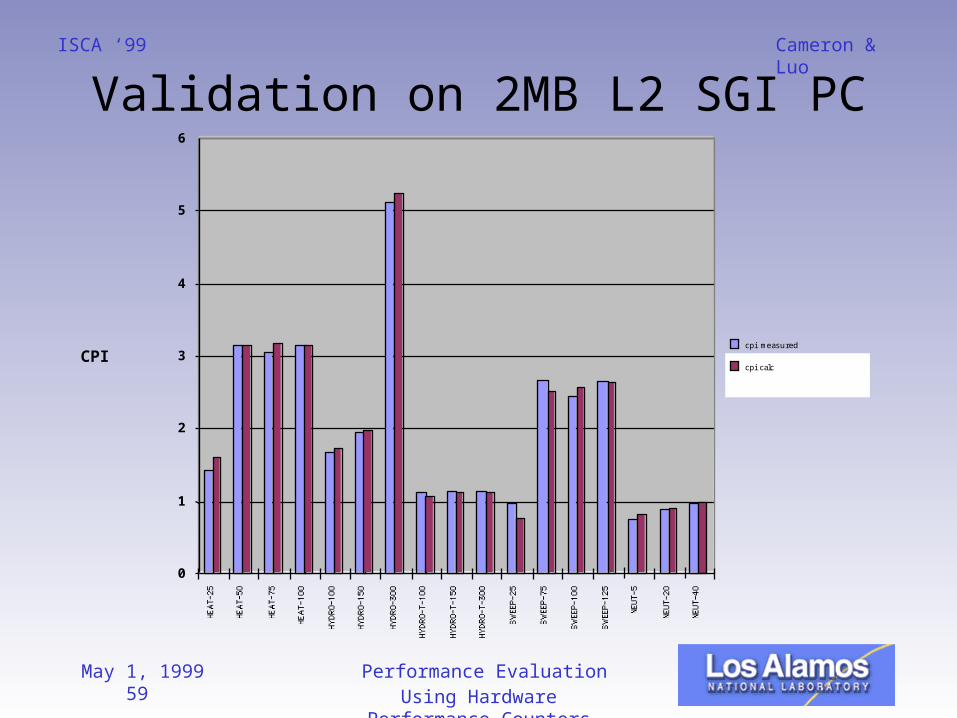
Model Validation
• Collect data & empirically fit on 1MB L2 Power Challenge (PC)
• Validate on different machines– 2MB L2 PowerChallenge
• Use SGI R10000 processor simulator
May 1, 1999 59 Performance Evaluation Using Hardware Performance Counters
Cameron & LuoISCA ‘99
Validation on 2MB L2 SGI PC
0
1
2
3
4
5
6
cp i measured
cp i calcCPI
May 1, 1999 60 Performance Evaluation Using Hardware Performance Counters
Cameron & LuoISCA ‘99
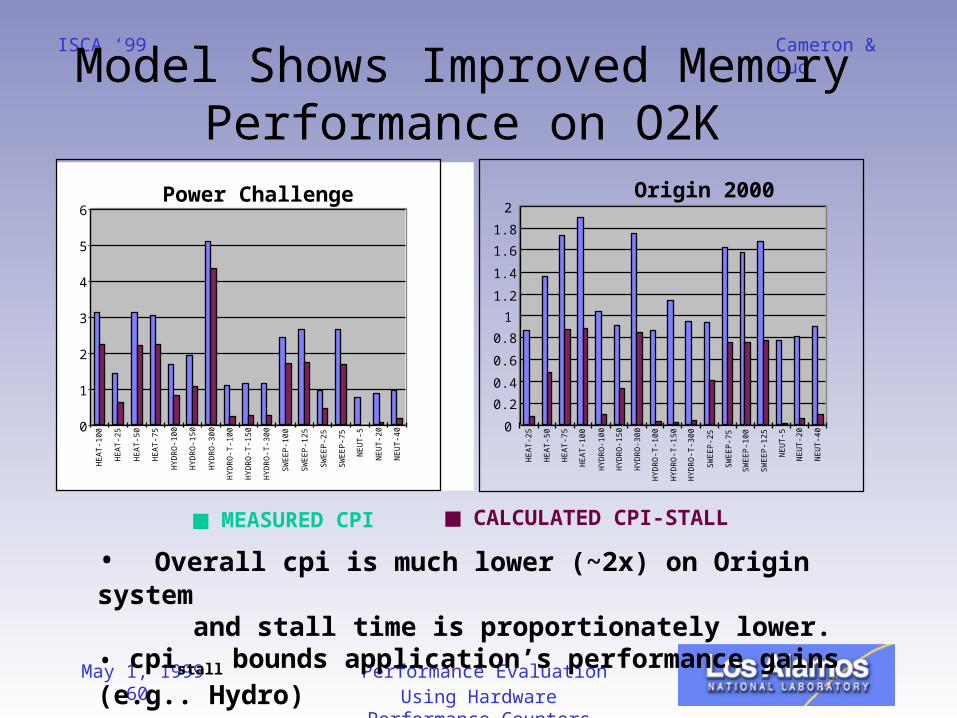
Model Shows Improved Memory Performance on O2K
• Overall cpi is much lower (~2x) on Origin system and stall time is proportionately lower.
• cpistall bounds application’s performance gains (e.g.. Hydro)
Power Challenge
0
1
2
3
4
5
6
HE
AT-1
00
HE
AT-2
5
HE
AT-5
0
HE
AT-7
5
HYD
RO
-10
0
HYD
RO
-15
0
HYD
RO
-30
0
HYD
RO
-T-1
00
HYD
RO
-T-1
50
HYD
RO
-T-3
00
SW
EE
P-1
00
SW
EE
P-1
25
SW
EE
P-2
5
SW
EE
P-7
5
NE
UT-5
NE
UT-2
0
NE
UT-4
0
Origin 2000
0
0.2
0.4
0.6
0.8
1
1.2
1.4
1.6
1.8
2
HE
AT-2
5
HE
AT-5
0
HE
AT-7
5
HE
AT-1
00
HYD
RO
-10
0
HYD
RO
-15
0
HYD
RO
-30
0
HYD
RO
-T-1
00
HYD
RO
-T-1
50
HYD
RO
-T-3
00
SW
EE
P-2
5
SW
EE
P-7
5
SW
EE
P-1
00
SW
EE
P-1
25
NE
UT-5
NE
UT-2
0
NE
UT-4
0
MEASURED CPI CALCULATED CPI-STALL
May 1, 1999 61 Performance Evaluation Using Hardware Performance Counters
Cameron & LuoISCA ‘99
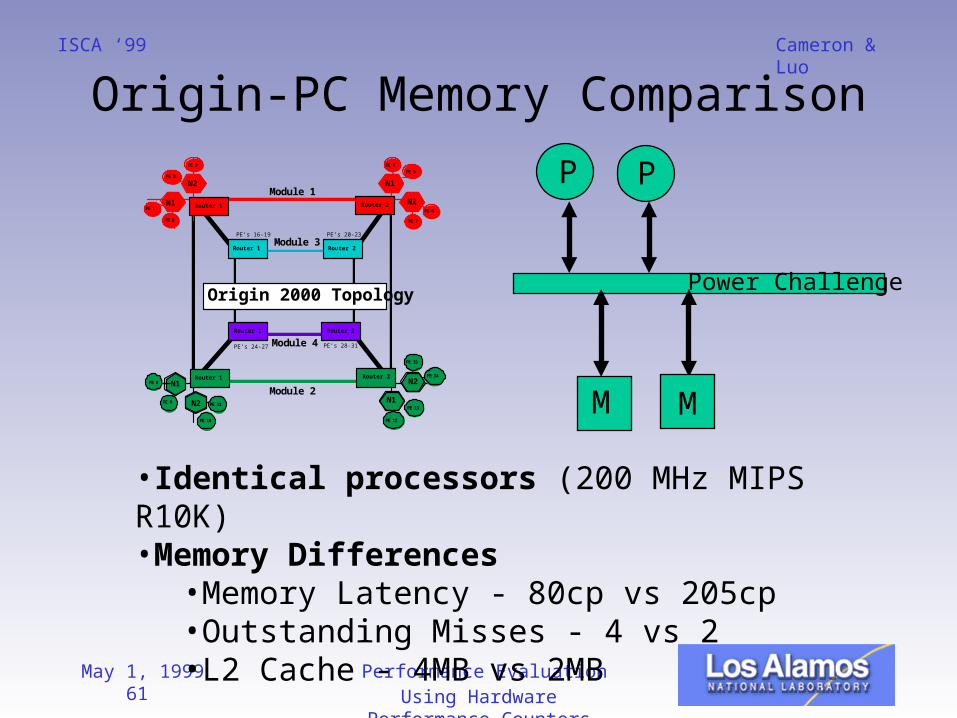
Origin-PC Memory Comparison
Module 1
Module 2
Module 3
Module 4
N1
N2N1
N2
PE 0
PE 1
PE 2
PE 3 PE 4
PE 5
PE 6
PE 7
N2
N1
PE 11
PE 10
PE 9
PE 8 N2
N1
PE 15
PE 14
PE 13
PE 12
Origin 2000 Topology
Router 1 Router 2
Router 1 Router 2
Router 2
Router 2
Router 1
Router 1
PE’s 16-19 PE’s 20-23
PE’s 24-27 PE’s 28-31
•Identical processors (200 MHz MIPS R10K)•Memory Differences
•Memory Latency - 80cp vs 205cp•Outstanding Misses - 4 vs 2•L2 Cache - 4MB vs 2MB
Power Challenge
P P
M M
May 1, 1999 62 Performance Evaluation Using Hardware Performance Counters
Cameron & LuoISCA ‘99
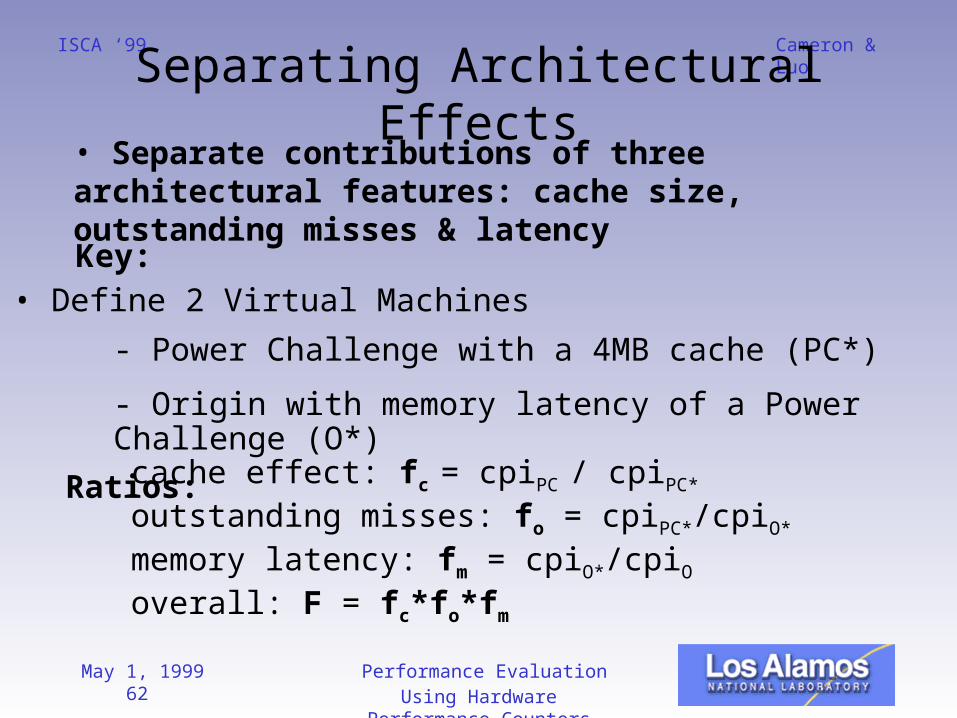
Separating Architectural Effects
• Define 2 Virtual Machines
• Separate contributions of three architectural features: cache size, outstanding misses & latency
Key:
Ratios:
- Power Challenge with a 4MB cache (PC*)
- Origin with memory latency of a Power Challenge (O*)
cache effect: fc = cpiPC / cpiPC*
outstanding misses: fo = cpiPC*/cpiO*
memory latency: fm = cpiO*/cpiOoverall: F = fc*fo*fm
May 1, 1999 63 Performance Evaluation Using Hardware Performance Counters
Cameron & LuoISCA ‘99
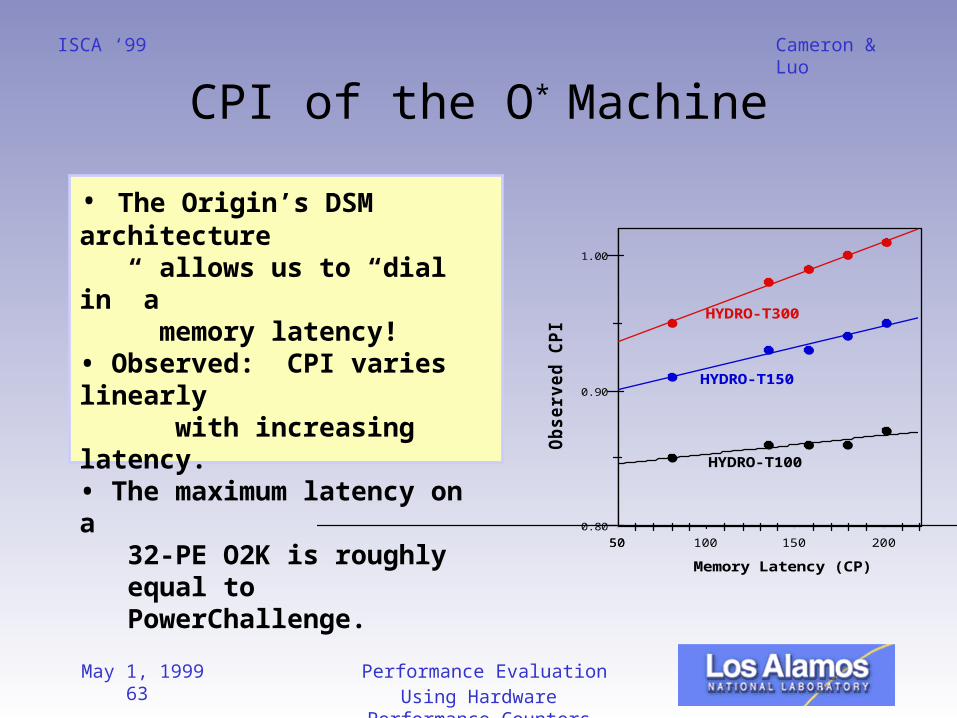
CPI of the O* Machine
• The Origin’s DSM architecture allows us to “dial in” a memory latency! • Observed: CPI varies linearly with increasing latency.• The maximum latency on a
32-PE O2K is roughly equal to PowerChallenge.
20015010050500.80
0.90
1.00
Memory Latency (CP)O
bserv
ed
CP
I HYDRO-T300
HYDRO-T150
HYDRO-T100
May 1, 1999 64 Performance Evaluation Using Hardware Performance Counters
Cameron & LuoISCA ‘99
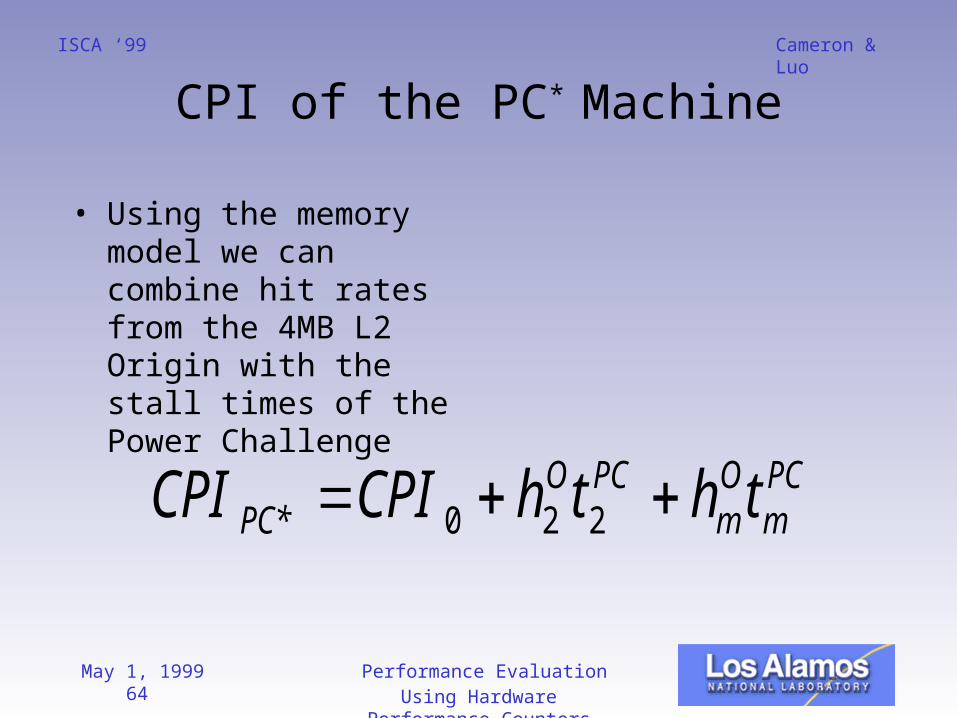
CPI of the PC* Machine
• Using the memory model we can combine hit rates from the 4MB L2 Origin with the stall times of the Power Challenge
PCm
Om
PCOPC* ththCPICPI 220
May 1, 1999 65 Performance Evaluation Using Hardware Performance Counters
Cameron & LuoISCA ‘99
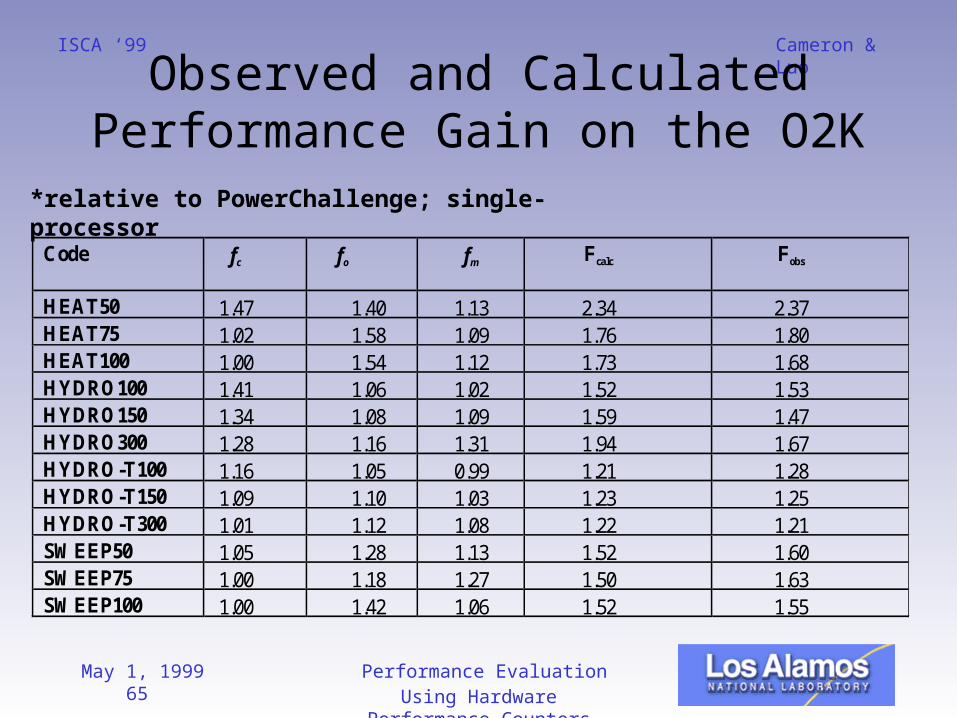
Observed and Calculated Performance Gain on the O2K
*relative to PowerChallenge; single-processor
Code fc fo fmF
calcF
obs
HEAT50 1.47 1.40 1.13 2.34 2.37HEAT75 1.02 1.58 1.09 1.76 1.80HEAT100 1.00 1.54 1.12 1.73 1.68HYDRO100 1.41 1.06 1.02 1.52 1.53HYDRO150 1.34 1.08 1.09 1.59 1.47HYDRO300 1.28 1.16 1.31 1.94 1.67HYDRO-T100 1.16 1.05 0.99 1.21 1.28HYDRO-T150 1.09 1.10 1.03 1.23 1.25HYDRO-T300 1.01 1.12 1.08 1.22 1.21SWEEP50 1.05 1.28 1.13 1.52 1.60SWEEP75 1.00 1.18 1.27 1.50 1.63SWEEP100 1.00 1.42 1.06 1.52 1.55
May 1, 1999 66 Performance Evaluation Using Hardware Performance Counters
Cameron & LuoISCA ‘99
Success and Limitations
• Success:
– Proved validity of this kind of model
– Explained improvements in Origin2000
performance
– Given performance bounds for memory
optimizations
• Limitations: this model primarily diagnostic, not predictive
May 1, 1999 67 Performance Evaluation Using Hardware Performance Counters
Cameron & LuoISCA ‘99
Performance Evaluation Using Hardware Performance Counters
Instruction-level, pipeline-based application characterization
analysis
May 1, 1999 68 Performance Evaluation Using Hardware Performance Counters
Cameron & LuoISCA ‘99
Outline
• Motivation:– Comparing performance at instruction-level
• Methodology:– Using performance counters
– Abstracting pipeline queue related parameters
• Advantages: no-overhead, pinpoint architectural bottleneck
• Summary
May 1, 1999 69 Performance Evaluation Using Hardware Performance Counters
Cameron & LuoISCA ‘99
Motivations
• Processor Utilization Efficiency
• Utilization of architectural features
• Separation and quantification of other
effects (data dependency etc)
May 1, 1999 70 Performance Evaluation Using Hardware Performance Counters
Cameron & LuoISCA ‘99
Methodology
• Counter-based average abstract
parameters related to architectural
pipeline queues
• Analysis Assumptions:
– no data dependency, uniform instruction
distribution, branches and Icache misses
negligible
• Growth-rate based bottleneck analysis
May 1, 1999 71 Performance Evaluation Using Hardware Performance Counters
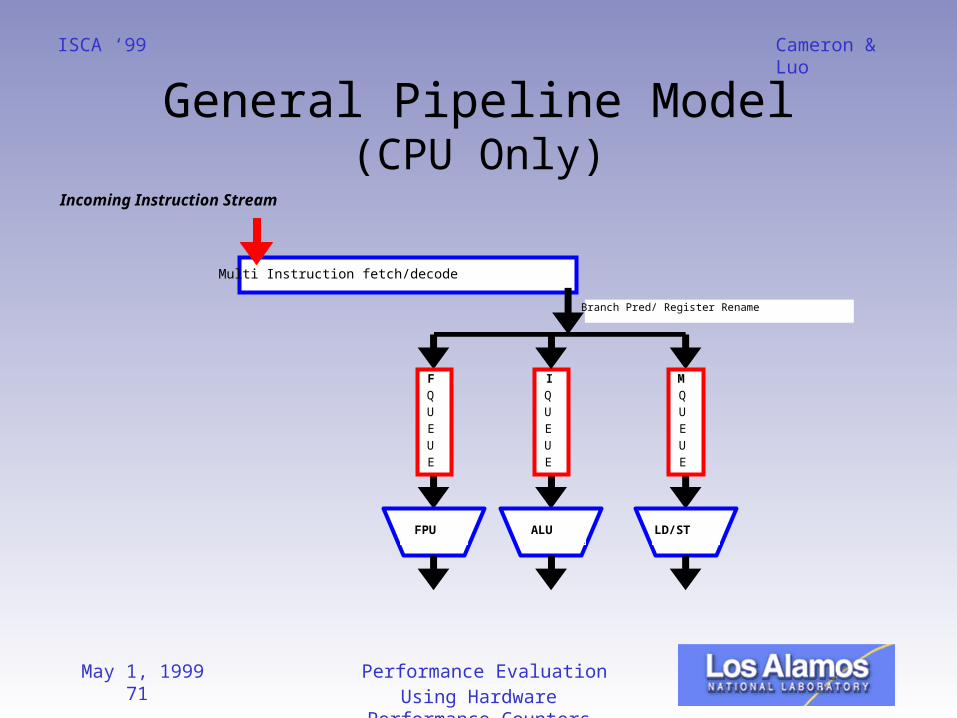
Cameron & LuoISCA ‘99
General Pipeline Model(CPU Only)
Multi Instruction fetch/decode
Branch Pred/ Register Rename
F
Q
U
E
U
E
FPU
I
Q
U
E
U
E
ALU
M
Q
U
E
U
E
LD/ST
Incoming Instruction Stream
May 1, 1999 72 Performance Evaluation Using Hardware Performance Counters
Cameron & LuoISCA ‘99
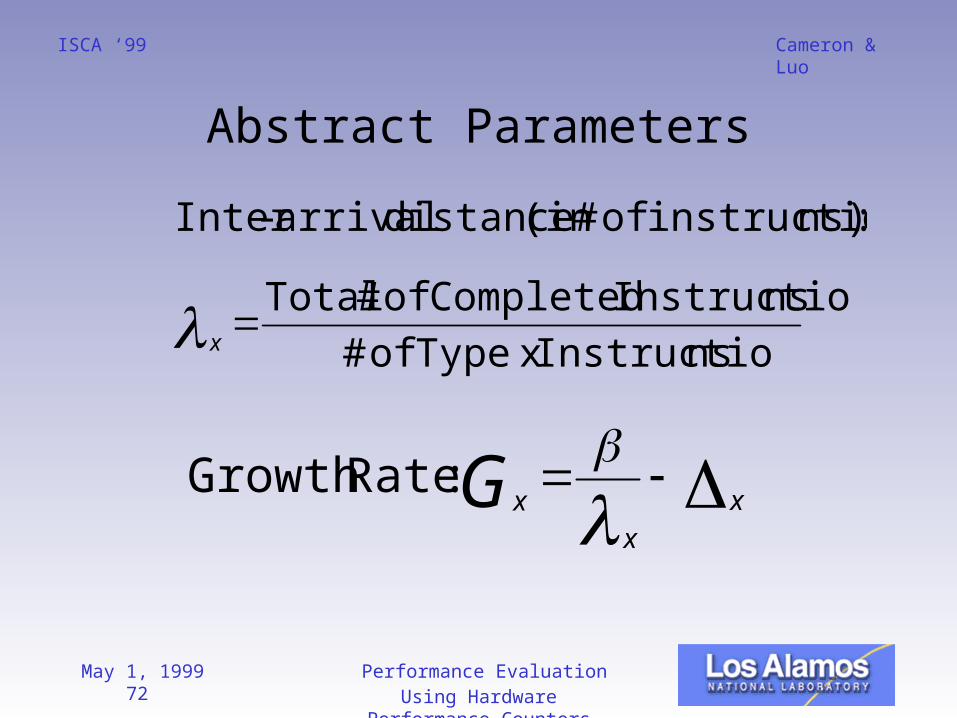
Abstract Parameters
nsInstructio x Type of #
nsInstructio Completed of # Total
:ns)instructio of #(in distance arrival-Inter
x
x
xxG
:RateGrowth
May 1, 1999 73 Performance Evaluation Using Hardware Performance Counters
Cameron & LuoISCA ‘99
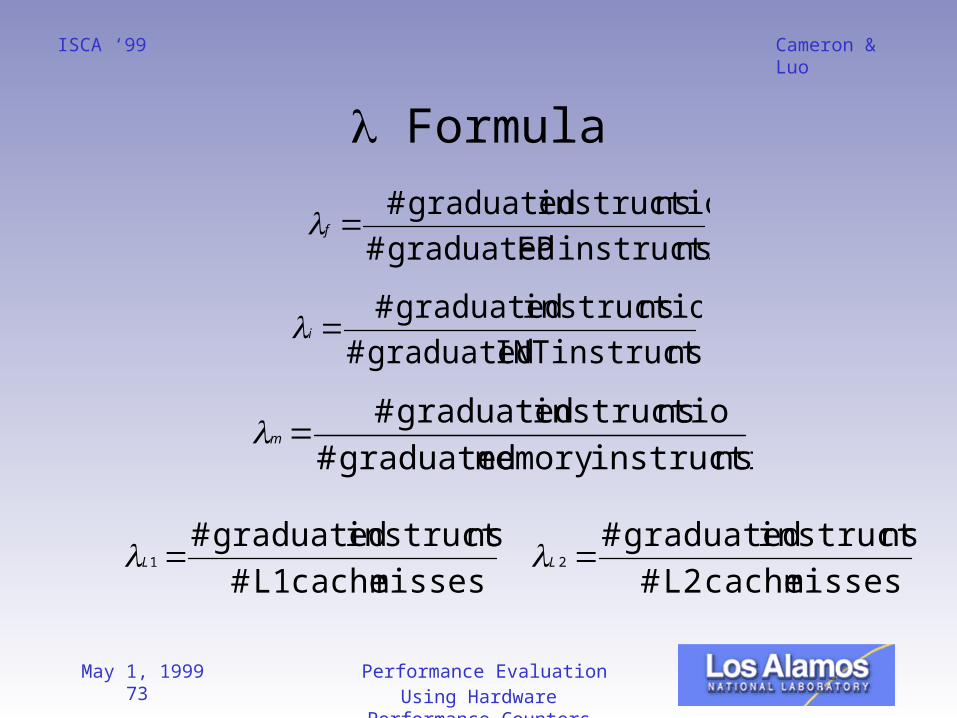
Formula
nsinstructio FP graduated #
nsinstructio graduated #f
nsinstructio INT graduated #
nsinstructio graduated #i
nsinstructiomemory graduated #
nsinstructio graduated #m
misses cache L1 #
nsinstructio graduated #1 L
misses cache L2 #
nsinstructio graduated #2 L
May 1, 1999 74 Performance Evaluation Using Hardware Performance Counters
Cameron & LuoISCA ‘99
Bottleneck Analysis
• Architectural Constraints: queue length
limit, # of functional units, graduation
rates, etc
• Positive Growth Rate: queue likely filled
to cause a stall
• Multiple Positive Growth Rates: threshold
of max. instructions in flight
May 1, 1999 75 Performance Evaluation Using Hardware Performance Counters
Cameron & LuoISCA ‘99
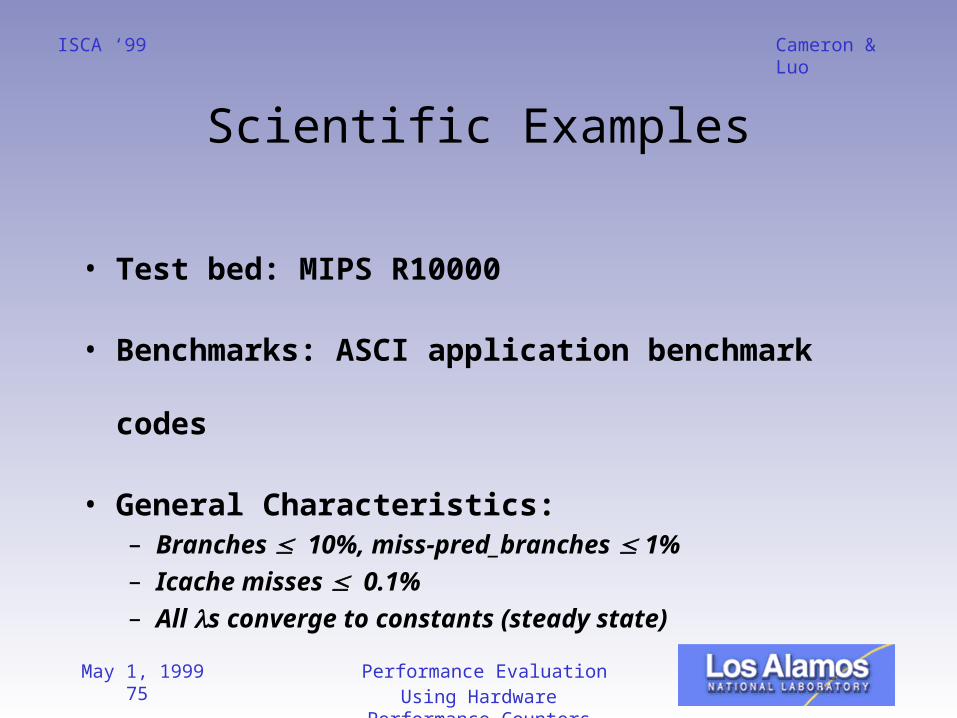
Scientific Examples
• Test bed: MIPS R10000
• Benchmarks: ASCI application benchmark
codes
• General Characteristics:– Branches 10%, miss-pred_branches 1%– Icache misses 0.1%– All s converge to constants (steady state)
May 1, 1999 76 Performance Evaluation Using Hardware Performance Counters
Cameron & LuoISCA ‘99
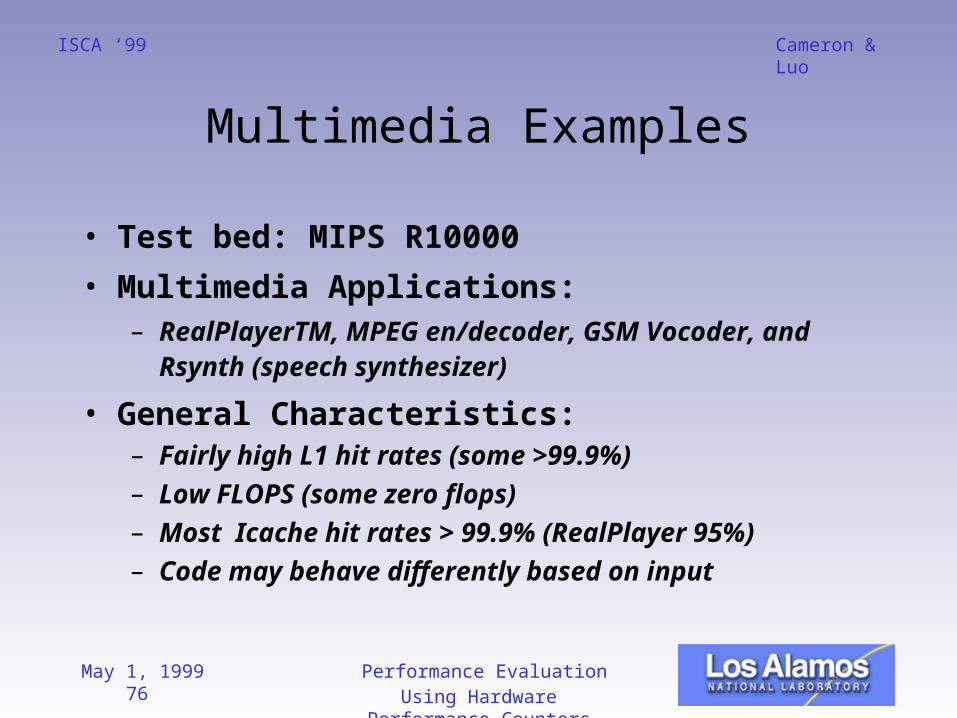
Multimedia Examples
• Test bed: MIPS R10000
• Multimedia Applications: – RealPlayerTM, MPEG en/decoder, GSM
Vocoder, and Rsynth (speech synthesizer)
• General Characteristics:– Fairly high L1 hit rates (some >99.9%)– Low FLOPS (some zero flops)– Most Icache hit rates > 99.9% (RealPlayer
95%)– Code may behave differently based on input
May 1, 1999 77 Performance Evaluation Using Hardware Performance Counters
Cameron & LuoISCA ‘99
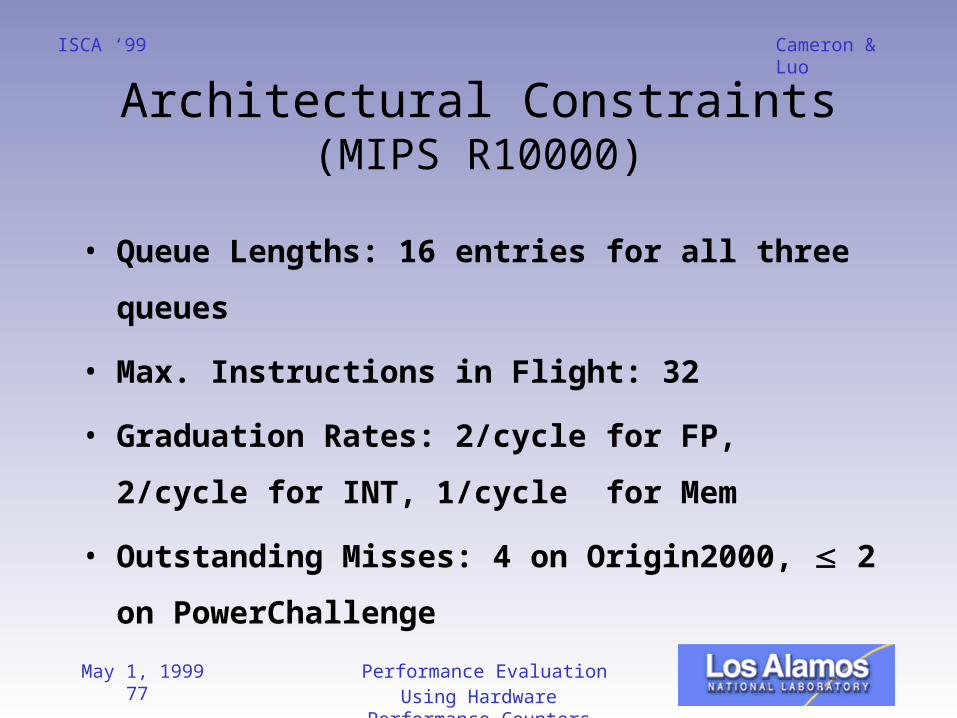
Architectural Constraints(MIPS R10000)
• Queue Lengths: 16 entries for all three
queues
• Max. Instructions in Flight: 32
• Graduation Rates: 2/cycle for FP, 2/cycle
for INT, 1/cycle for Mem
• Outstanding Misses: 4 on Origin2000, 2
on PowerChallenge
May 1, 1999 78 Performance Evaluation Using Hardware Performance Counters
Cameron & LuoISCA ‘99
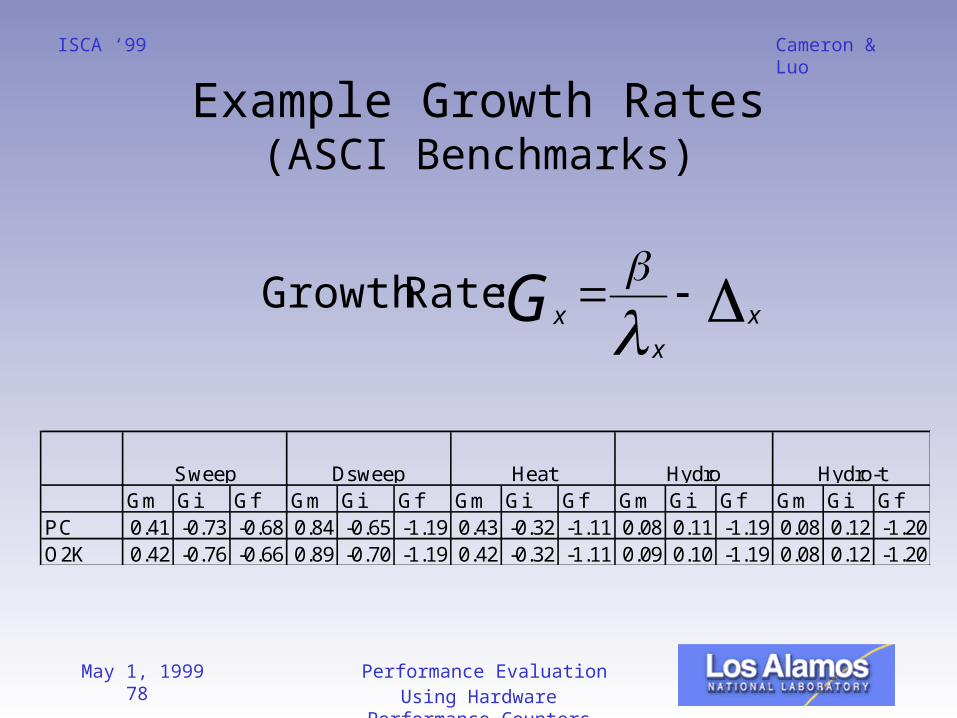
Example Growth Rates(ASCI Benchmarks)
Gm Gi Gf Gm Gi Gf Gm Gi Gf Gm Gi Gf Gm Gi GfPC 0.41 -0.73 -0.68 0.84 -0.65 -1.19 0.43 -0.32 -1.11 0.08 0.11 -1.19 0.08 0.12 -1.20O2K 0.42 -0.76 -0.66 0.89 -0.70 -1.19 0.42 -0.32 -1.11 0.09 0.10 -1.19 0.08 0.12 -1.20
Hydro-tSweep Dsweep Heat Hydro
x
xxG
:RateGrowth
May 1, 1999 79 Performance Evaluation Using Hardware Performance Counters
Cameron & LuoISCA ‘99
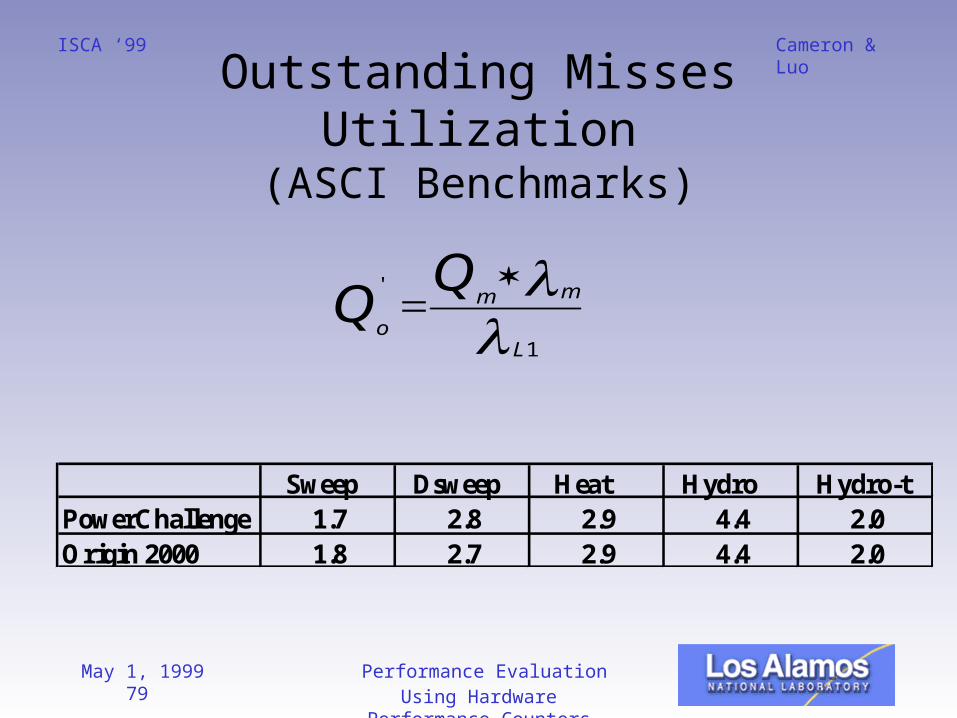
Outstanding Misses Utilization(ASCI Benchmarks)
1
'
L
mm
o
Sweep Dsweep Heat Hydro Hydro-tPowerChallenge 1.7 2.8 2.9 4.4 2.0Origin 2000 1.8 2.7 2.9 4.4 2.0
May 1, 1999 80 Performance Evaluation Using Hardware Performance Counters
Cameron & LuoISCA ‘99
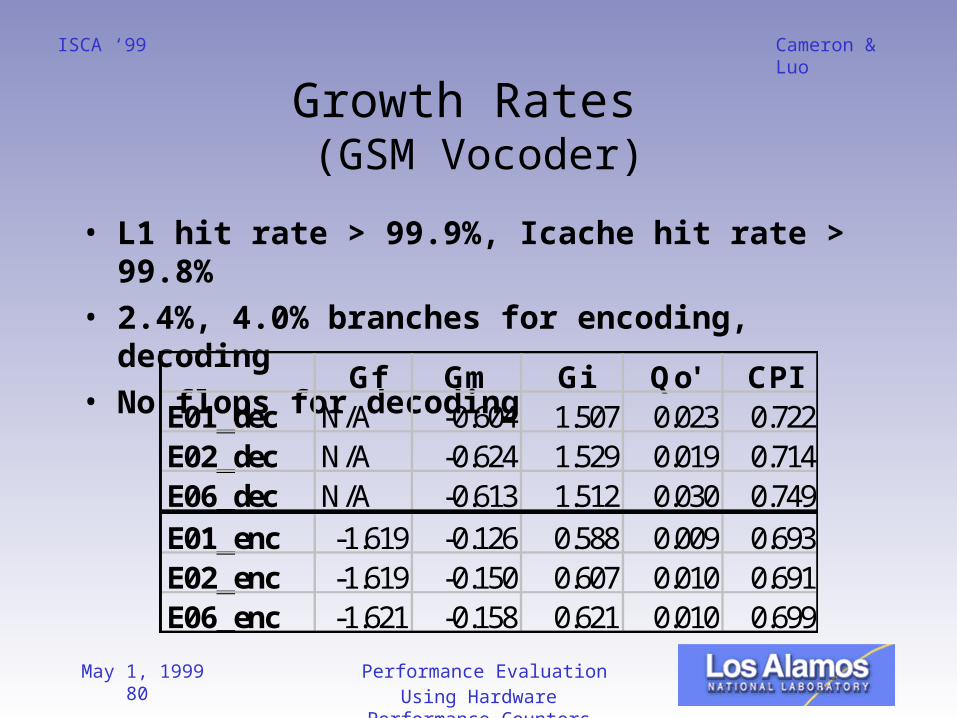
Growth Rates (GSM Vocoder)
• L1 hit rate > 99.9%, Icache hit rate > 99.8%
• 2.4%, 4.0% branches for encoding, decoding
• No flops for decodingGf Gm Gi Qo' CPI
E01_dec N/A -0.604 1.507 0.023 0.722E02_dec N/A -0.624 1.529 0.019 0.714E06_dec N/A -0.613 1.512 0.030 0.749
E01_enc -1.619 -0.126 0.588 0.009 0.693E02_enc -1.619 -0.150 0.607 0.010 0.691E06_enc -1.621 -0.158 0.621 0.010 0.699
May 1, 1999 81 Performance Evaluation Using Hardware Performance Counters
Cameron & LuoISCA ‘99
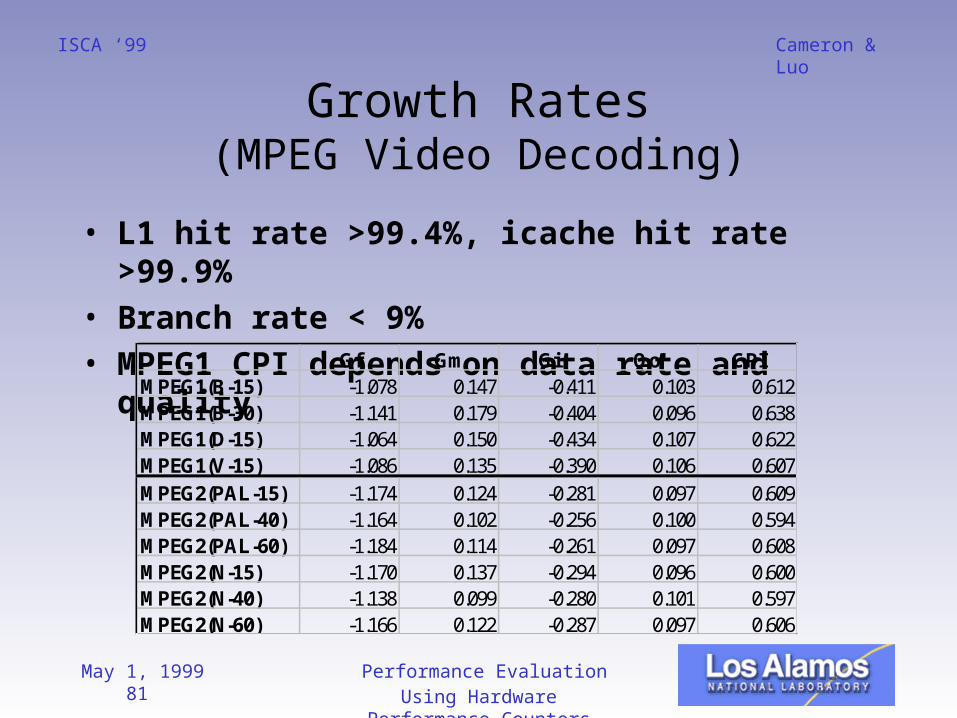
Growth Rates(MPEG Video Decoding)
• L1 hit rate >99.4%, icache hit rate >99.9%
• Branch rate < 9%• MPEG1 CPI depends on data rate and
quality
Gf Gm Gi Qo' CPIMPEG1(B-15) -1.078 0.147 -0.411 0.103 0.612MPEG1(B-30) -1.141 0.179 -0.404 0.096 0.638MPEG1(D-15) -1.064 0.150 -0.434 0.107 0.622MPEG1(V-15) -1.086 0.135 -0.390 0.106 0.607
MPEG2(PAL-15) -1.174 0.124 -0.281 0.097 0.609MPEG2(PAL-40) -1.164 0.102 -0.256 0.100 0.594MPEG2(PAL-60) -1.184 0.114 -0.261 0.097 0.608MPEG2(N-15) -1.170 0.137 -0.294 0.096 0.600MPEG2(N-40) -1.138 0.099 -0.280 0.101 0.597MPEG2(N-60) -1.166 0.122 -0.287 0.097 0.606
May 1, 1999 82 Performance Evaluation Using Hardware Performance Counters
Cameron & LuoISCA ‘99
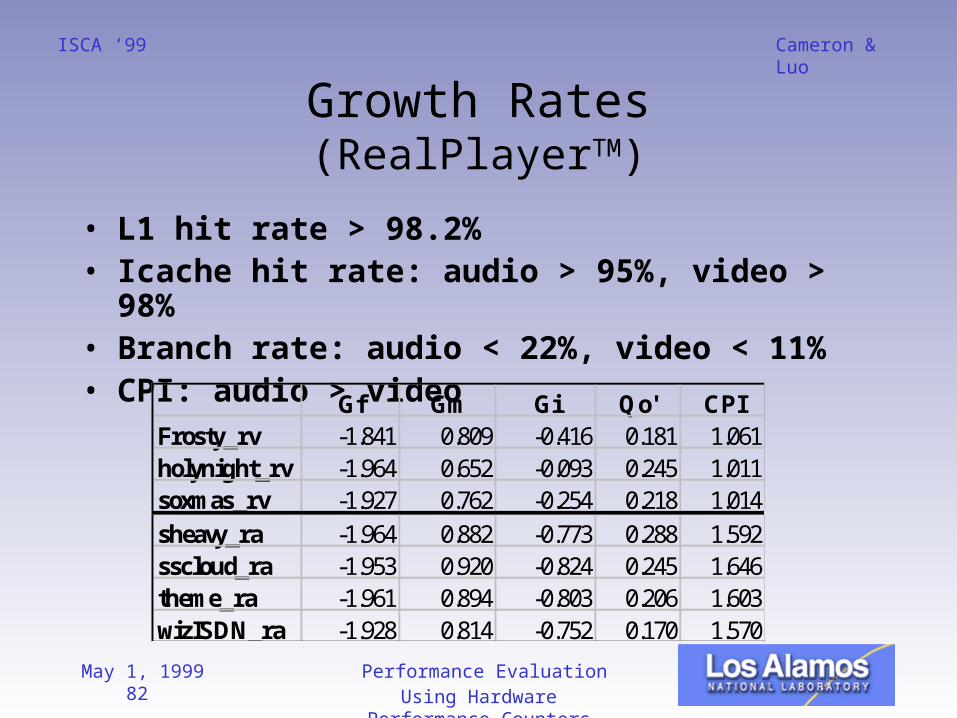
Growth Rates(RealPlayerTM)
• L1 hit rate > 98.2%• Icache hit rate: audio > 95%, video > 98%• Branch rate: audio < 22%, video < 11%• CPI: audio > video
Gf Gm Gi Qo' CPIFrosty_rv -1.841 0.809 -0.416 0.181 1.061holynight_rv -1.964 0.652 -0.093 0.245 1.011soxmas_rv -1.927 0.762 -0.254 0.218 1.014
sheavy_ra -1.964 0.882 -0.773 0.288 1.592sscloud_ra -1.953 0.920 -0.824 0.245 1.646theme_ra -1.961 0.894 -0.803 0.206 1.603wizISDN_ra -1.928 0.814 -0.752 0.170 1.570
May 1, 1999 83 Performance Evaluation Using Hardware Performance Counters
Cameron & LuoISCA ‘99
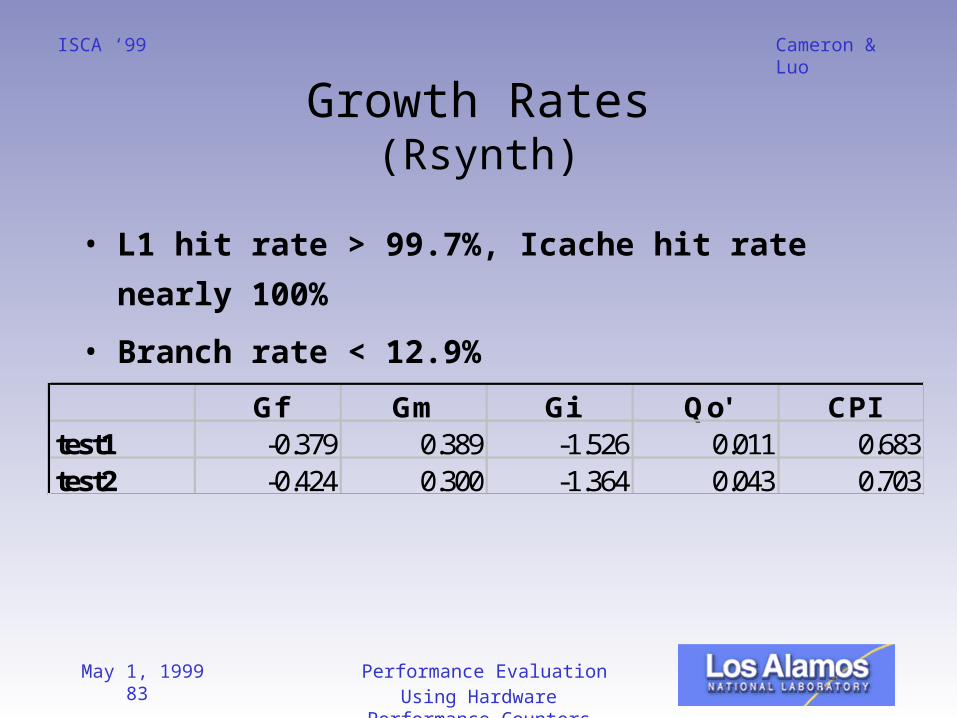
Growth Rates(Rsynth)
• L1 hit rate > 99.7%, Icache hit rate nearly
100%
• Branch rate < 12.9%
Gf Gm Gi Qo' CPItest1 -0.379 0.389 -1.526 0.011 0.683test2 -0.424 0.300 -1.364 0.043 0.703
May 1, 1999 84 Performance Evaluation Using Hardware Performance Counters
Cameron & LuoISCA ‘99
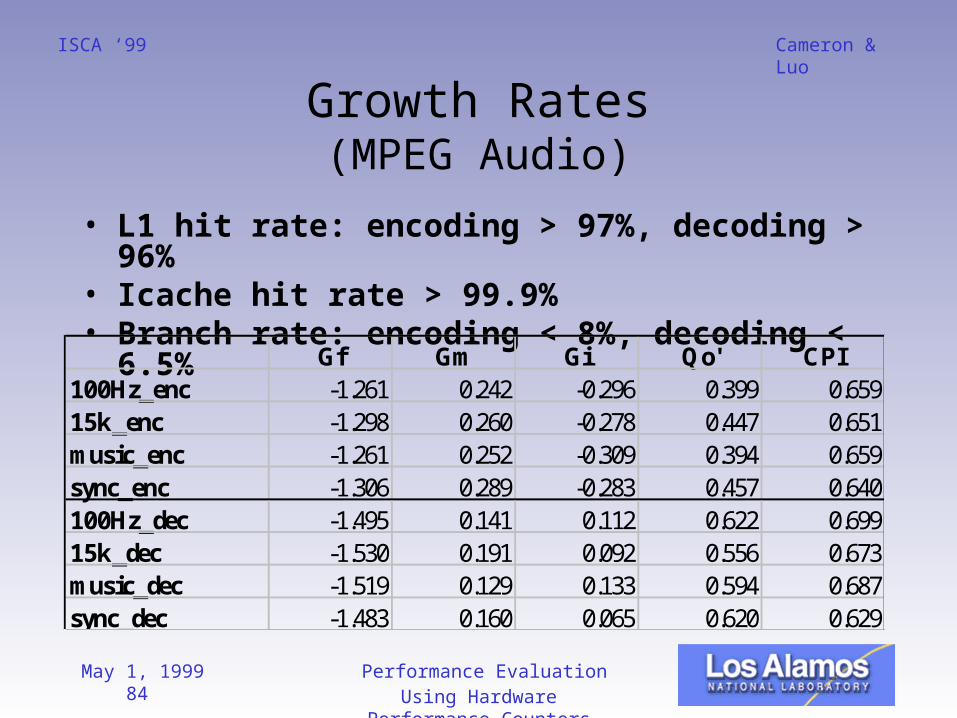
Growth Rates(MPEG Audio)
• L1 hit rate: encoding > 97%, decoding > 96%
• Icache hit rate > 99.9%• Branch rate: encoding < 8%, decoding <
6.5% Gf Gm Gi Qo' CPI100Hz_enc -1.261 0.242 -0.296 0.399 0.65915k_enc -1.298 0.260 -0.278 0.447 0.651music_enc -1.261 0.252 -0.309 0.394 0.659sync_enc -1.306 0.289 -0.283 0.457 0.640100Hz_dec -1.495 0.141 0.112 0.622 0.69915k_dec -1.530 0.191 0.092 0.556 0.673music_dec -1.519 0.129 0.133 0.594 0.687sync_dec -1.483 0.160 0.065 0.620 0.629
May 1, 1999 85 Performance Evaluation Using Hardware Performance Counters
Cameron & LuoISCA ‘99
Summary
• Using abstract parameters collected from
counter data to characterize workload
• Analyzing performance bottlenecks from
architectural constraints
• Estimating the utilization of outstanding
misses
May 1, 1999 86 Performance Evaluation Using Hardware Performance Counters
Cameron & LuoISCA ‘99
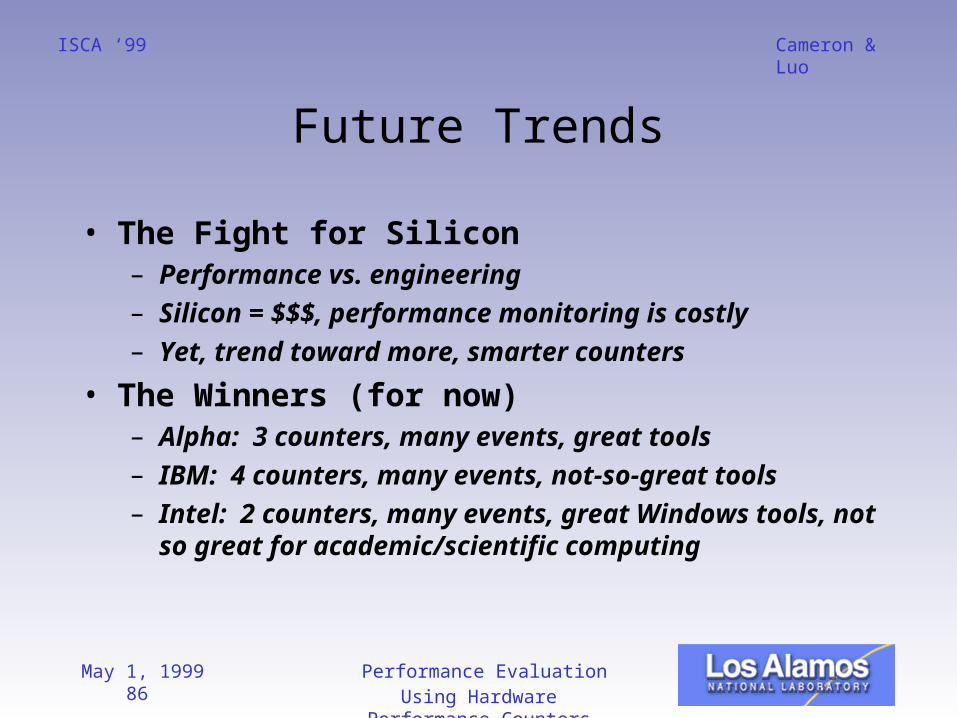
Future Trends
• The Fight for Silicon– Performance vs. engineering– Silicon = $$$, performance monitoring is costly– Yet, trend toward more, smarter counters
• The Winners (for now)– Alpha: 3 counters, many events, great tools– IBM: 4 counters, many events, not-so-great
tools– Intel: 2 counters, many events, great Windows
tools, not so great for academic/scientific computing
May 1, 1999 87 Performance Evaluation Using Hardware Performance Counters
Cameron & LuoISCA ‘99
Future Trends
• The Losers (for now)– AMD K-6 no counters at all
• Why this trend?– More complicated processors– More complicated reasons for performance
variations– Memory bottleneck still biggest problem– Latency hiding techniques complicate analysis– Low level diagnosis is becoming increasingly
important
May 1, 1999 88 Performance Evaluation Using Hardware Performance Counters
Cameron & LuoISCA ‘99
Future Trends
• What’s being done to help?– Attempts (as discussed) to provide further analysis
using counter output– Analytical & empirical models can answer
interesting questions• How effective are latency hiding techniques?• Would adding some simple events increase ability to
analyze?• Where are the bottlenecks of performance?
– Need to continue toward predictive models• How will minor architectural advances effect
performance?• Examples: latency decreases, memory size increase,
etc.
May 1, 1999 89 Performance Evaluation Using Hardware Performance Counters
Cameron & LuoISCA ‘99
Further References
• For electronic version of tutorial: www.c3.lanl.gov/~kirk
• Email tutorial questions:– Kirk W. Cameron [email protected]– Yong Luo [email protected]
• See handout for detailed overall references
May 1, 1999 90 Performance Evaluation Using Hardware Performance Counters
Cameron & LuoISCA ‘99
Review of Tutorial Objectives
• Provide a systematic approach to the use of hardware counters and associated tools
• Provide examples of hardware counters over a determined problem set for various processors
• Give details of systematic approach on a subset of processors
• Provide simple derived formulas and advanced analytical formulas for performance measurement
• Provide further references for hardware counters
Performance Evaluation Using Hardware Performance Counters
Cameron & LuoISCA ‘99
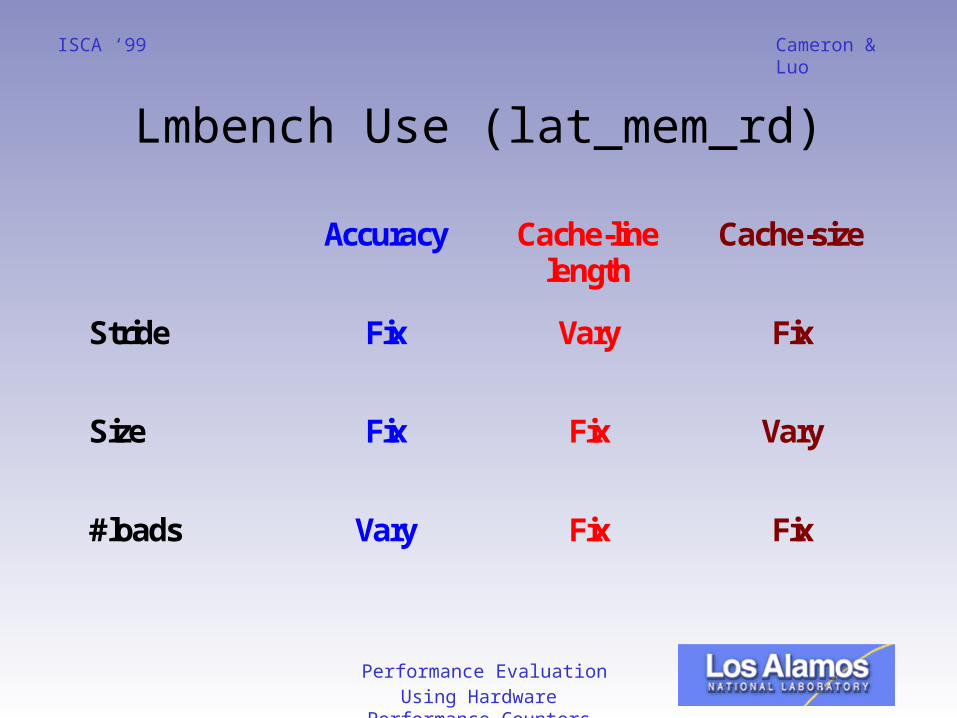
Lmbench Use (lat_mem_rd)
Accuracy Cache-linelength
Cache-size
Stride Fix Vary Fix
Size Fix Fix Vary
#loads Vary Fix Fix
Performance Evaluation Using Hardware Performance Counters
Cameron & LuoISCA ‘99
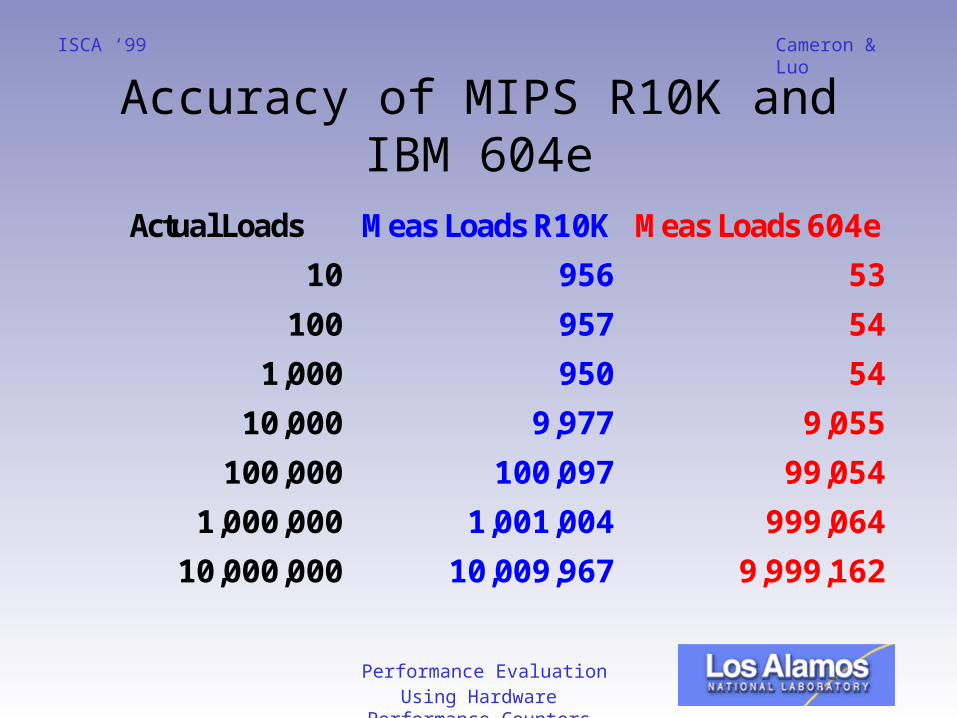
Accuracy of MIPS R10K and IBM 604e
Actual Loads Meas Loads R10K Meas Loads 604e
10 956 53
100 957 54
1,000 950 54
10,000 9,977 9,055
100,000 100,097 99,054
1,000,000 1,001,004 999,064
10,000,000 10,009,967 9,999,162
Performance Evaluation Using Hardware Performance Counters
Cameron & LuoISCA ‘99
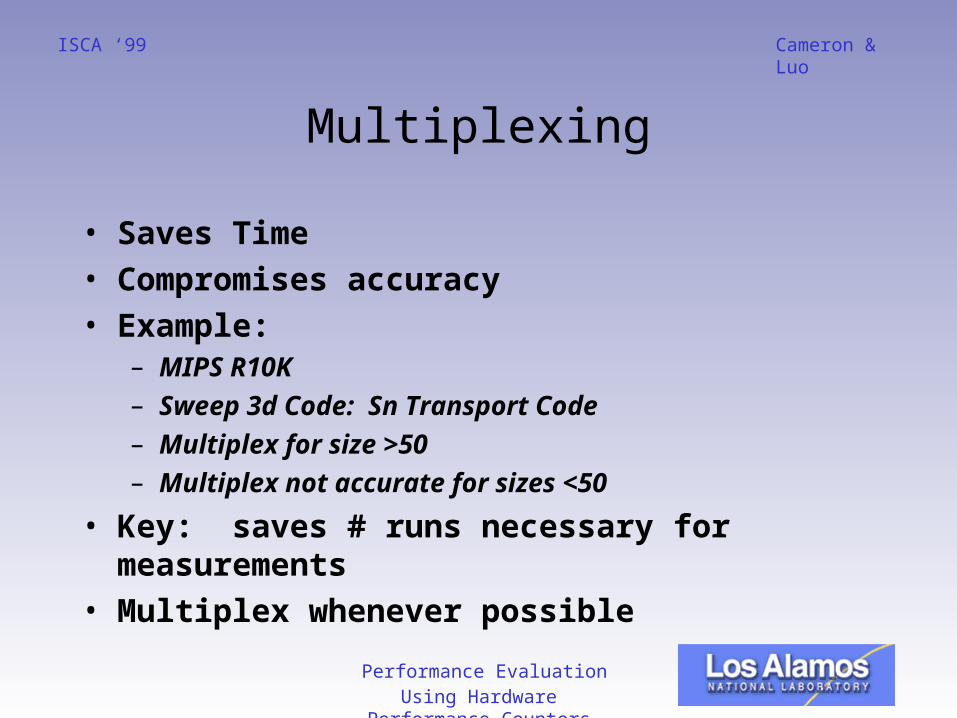
Multiplexing
• Saves Time• Compromises accuracy• Example:
– MIPS R10K– Sweep 3d Code: Sn Transport Code– Multiplex for size >50– Multiplex not accurate for sizes <50
• Key: saves # runs necessary for measurements
• Multiplex whenever possible
Performance Evaluation Using Hardware Performance Counters
Cameron & LuoISCA ‘99
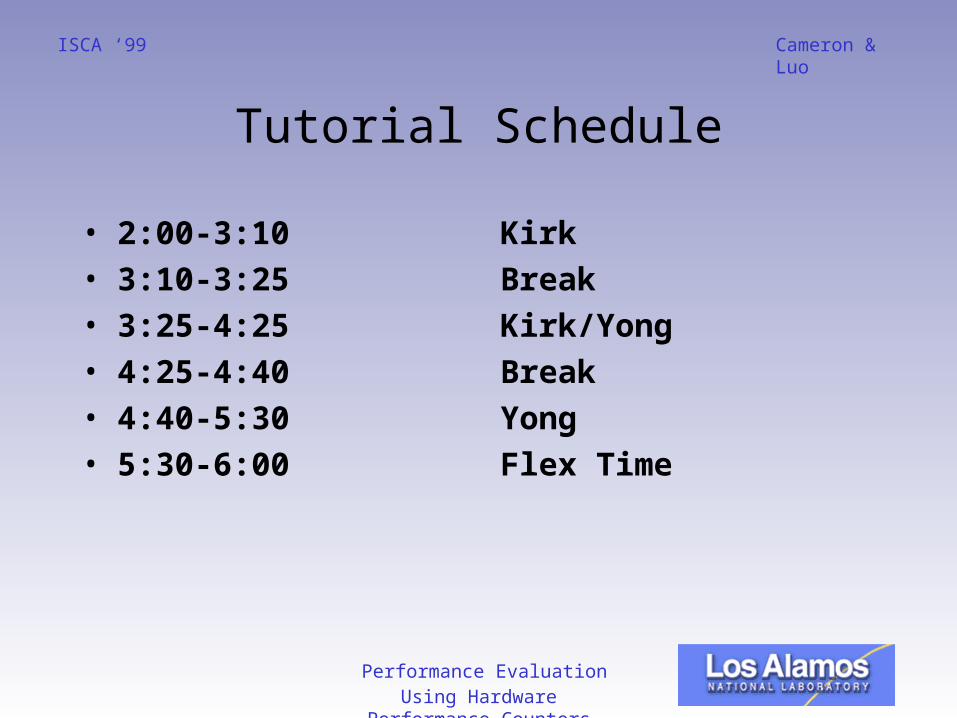
Tutorial Schedule
• 2:00-3:10 Kirk• 3:10-3:25 Break• 3:25-4:25 Kirk/Yong• 4:25-4:40 Break• 4:40-5:30 Yong• 5:30-6:00 Flex Time