California Transportation Fuel Demand and Production Outlook & Issues
24
1 California Transportation Fuel Demand and Production Outlook & Issues Pat Perez, Manager ([email protected]) Transportation Fuel Supply & Demand Office CALIFORNIA ENERGY COMMISSION 6th California State Fleet Management Conference October 31, 2001 Double Tree Hotel - Sacramento
-
Upload
cara-ramirez -
Category
Documents
-
view
36 -
download
4
description
California Transportation Fuel Demand and Production Outlook & Issues. 6th California State Fleet Management Conference October 31, 2001 Double Tree Hotel - Sacramento. Pat Perez, Manager ([email protected]) Transportation Fuel Supply & Demand Office CALIFORNIA ENERGY COMMISSION. - PowerPoint PPT Presentation
Transcript of California Transportation Fuel Demand and Production Outlook & Issues
1
California Transportation Fuel Demand and Production Outlook
& Issues
Pat Perez, Manager ([email protected])Transportation Fuel Supply & Demand Office
CALIFORNIA ENERGY COMMISSION
6th California State Fleet Management Conference
October 31, 2001
Double Tree Hotel - Sacramento
2
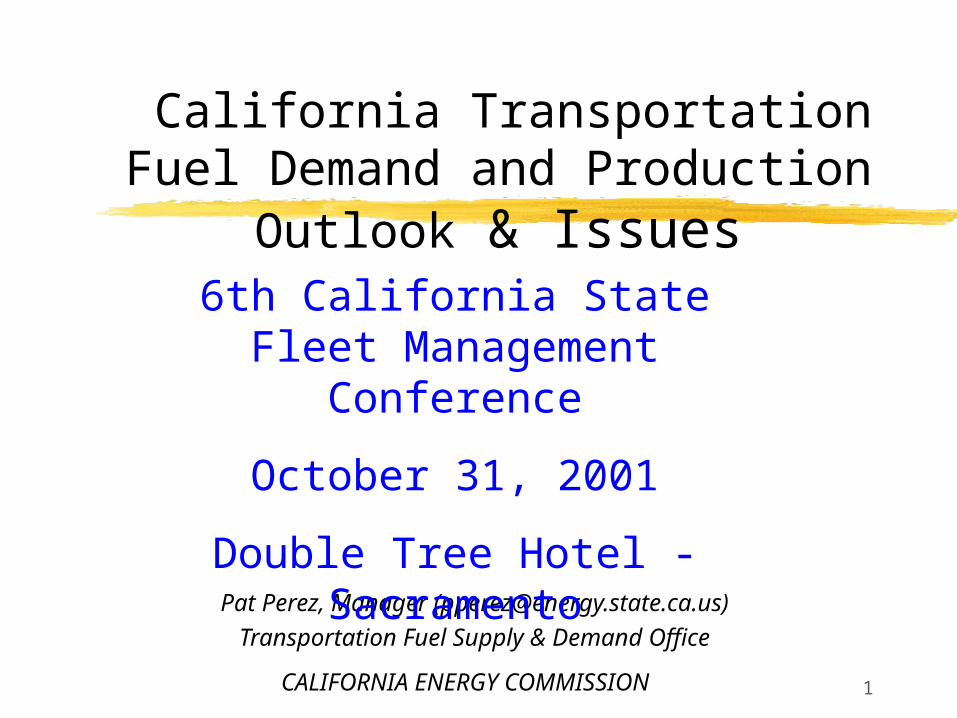
Presentation Topics
Consumption of Transportation FuelsProduction of Transportation FuelsMajor Challenges Facing the MarketState Policies and Programs

3
Use of Petroleum Fuels Continues to Grow
Annual California On-road Fuel Usage
0
2
4
6
8
10
12
14
16
1980 1981 1982 1983 1984 1985 1986 1987 1988 1989 1990 1991 1992 1993 1994 1995 1996 1997 1998 1999 2000
Year
Bill
ion
Gal
lon
s
Gasoline
Diesel
4
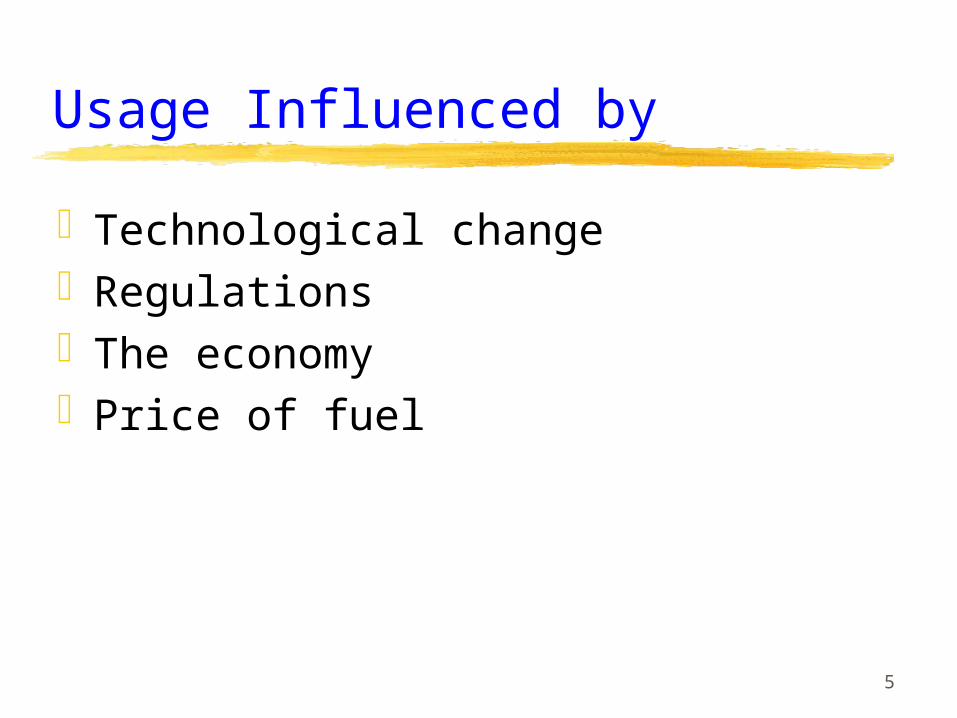
Usage Influenced by
Population growthConsumer taste Commuting patterns-- the location of
residences and work
5
Usage Influenced by
Technological change RegulationsThe economyPrice of fuel
6
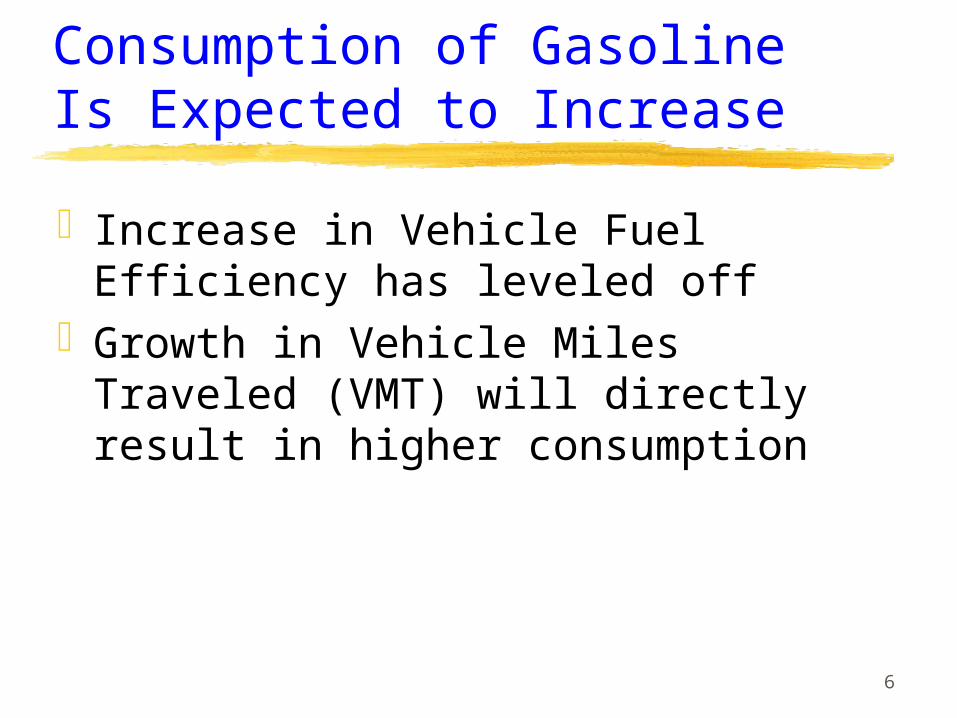
Consumption of Gasoline Is Expected to Increase
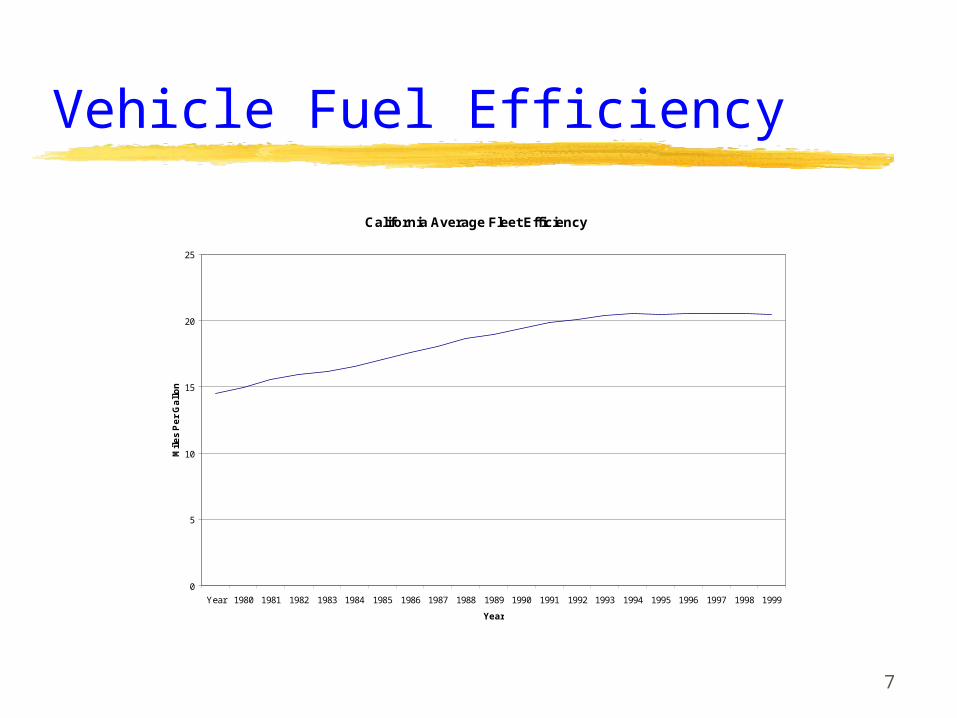
Increase in Vehicle Fuel Efficiency has leveled off
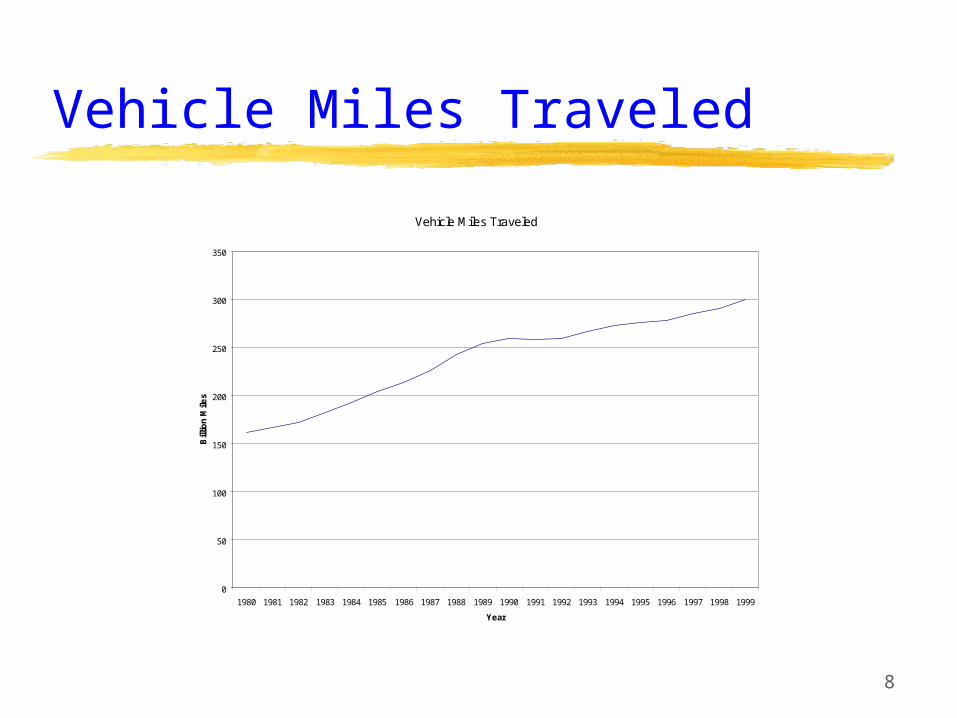
Growth in Vehicle Miles Traveled (VMT) will directly result in higher consumption
7
Vehicle Fuel Efficiency
California Average Fleet Efficiency
0
5
10
15
20
25
Year 1980 1981 1982 1983 1984 1985 1986 1987 1988 1989 1990 1991 1992 1993 1994 1995 1996 1997 1998 1999
Year
Mil
es
Pe
r G
all
on
8
Vehicle Miles Traveled
Vehicle Miles Traveled
0
50
100
150
200
250
300
350
1980 1981 1982 1983 1984 1985 1986 1987 1988 1989 1990 1991 1992 1993 1994 1995 1996 1997 1998 1999
Year
Bill
ion
Mile
s
9
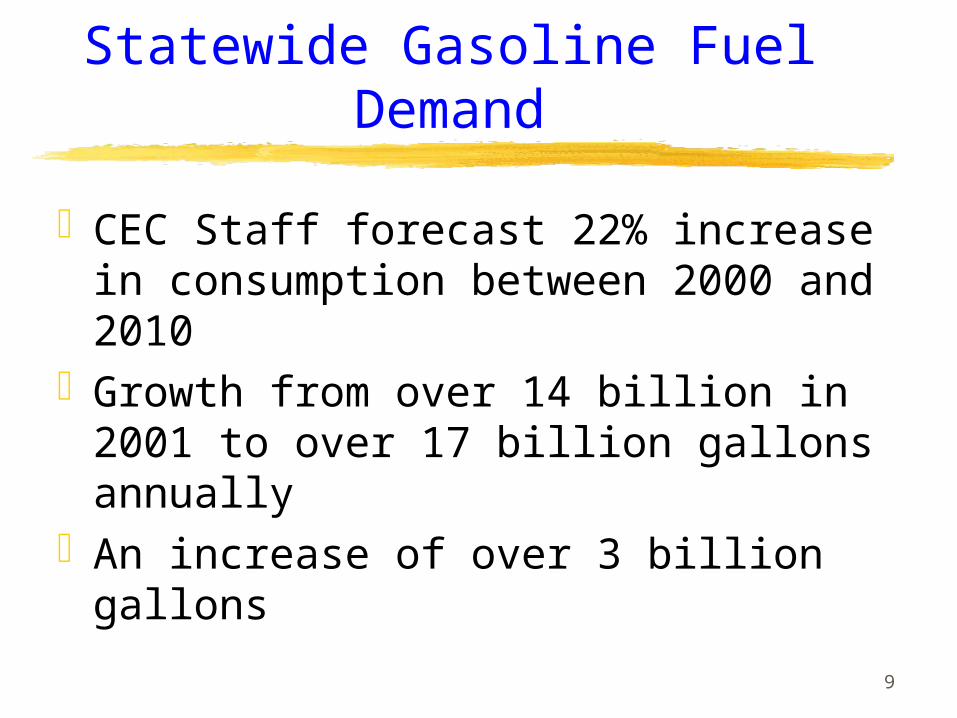
Statewide Gasoline Fuel Demand
CEC Staff forecast 22% increase in consumption between 2000 and 2010
Growth from over 14 billion in 2001 to over 17 billion gallons annually
An increase of over 3 billion gallons
10
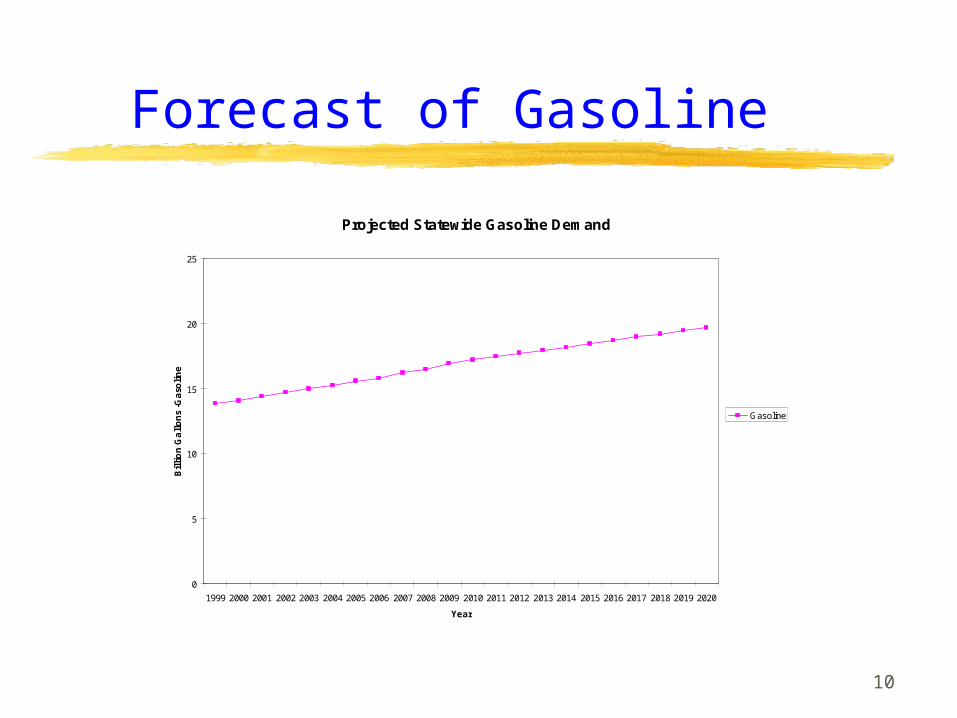
Forecast of Gasoline
Projected Statewide Gasoline Demand
0
5
10
15
20
25
1999 2000 2001 2002 2003 2004 2005 2006 2007 2008 2009 2010 2011 2012 2013 2014 2015 2016 2017 2018 2019 2020
Year
Bil
lio
n G
all
on
s -G
aso
lin
e
Gasoline
11
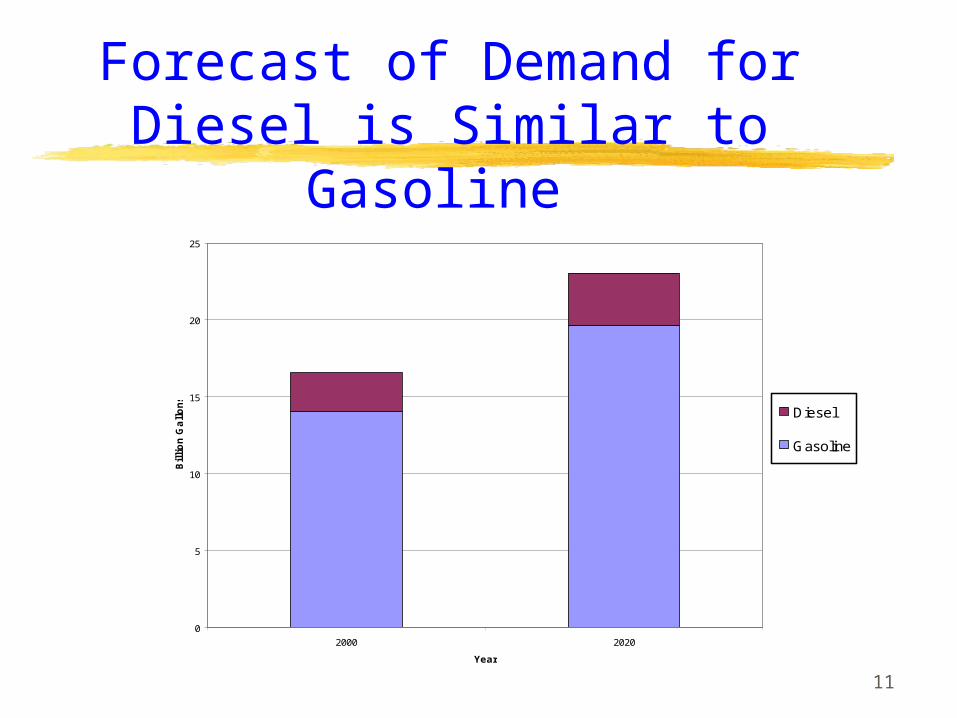
Forecast of Demand for Diesel is Similar to Gasoline
0
5
10
15
20
25
2000 2020
Year
Bil
lio
n G
all
on
s
Diesel
Gasoline
12
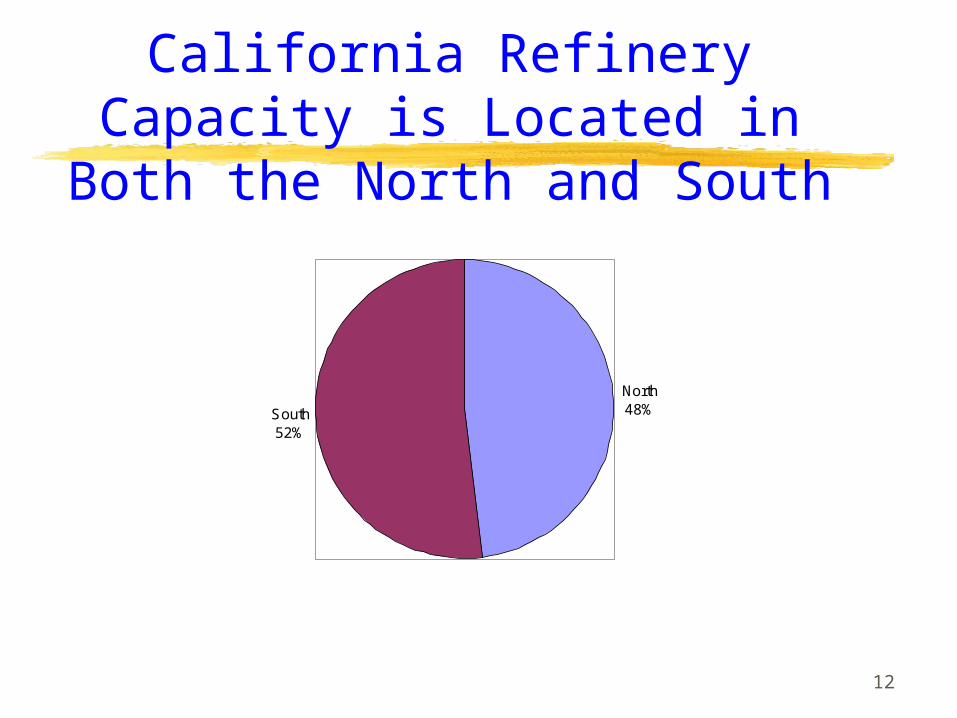
California Refinery Capacity is Located in Both the North
and South
South52%
North48%
13
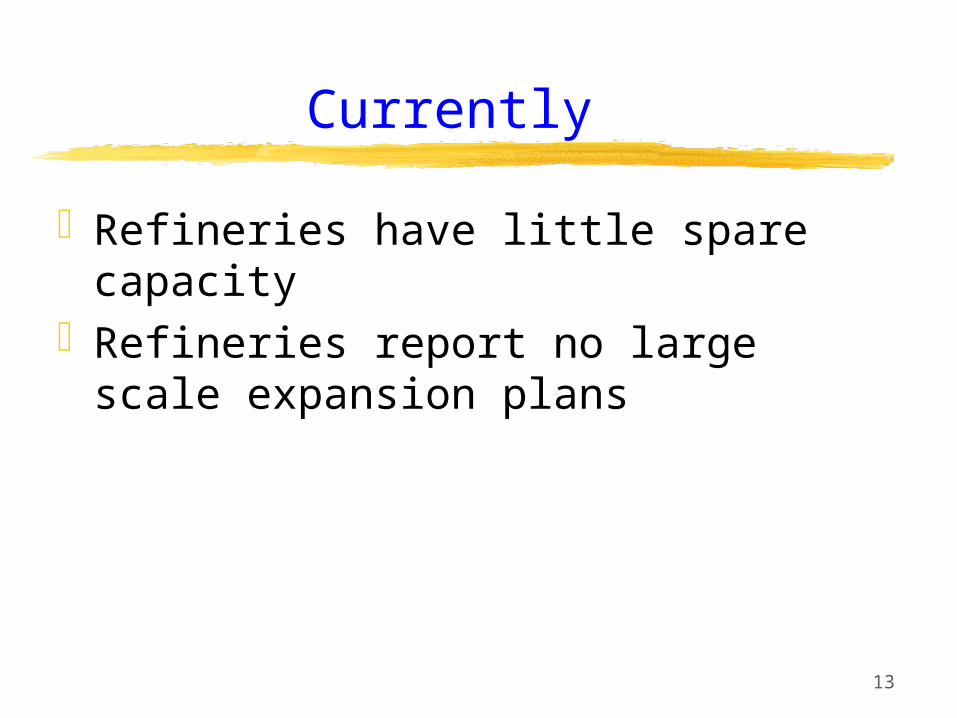
Currently
Refineries have little spare capacityRefineries report no large scale
expansion plans
14
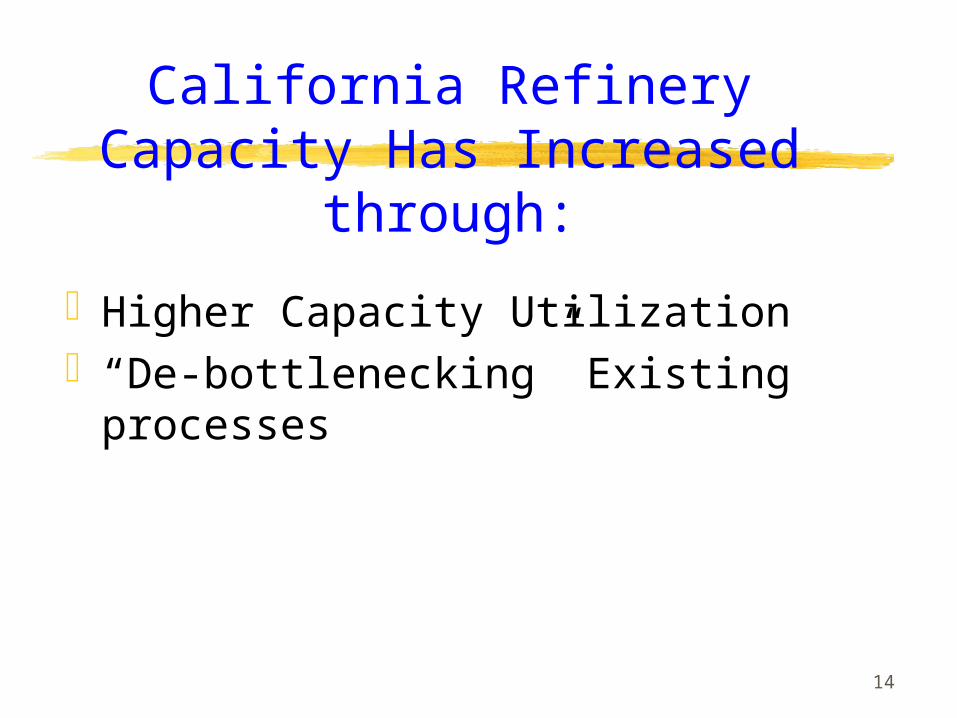
California Refinery Capacity Has Increased through:
Higher Capacity Utilization“De-bottlenecking” Existing
processes
15
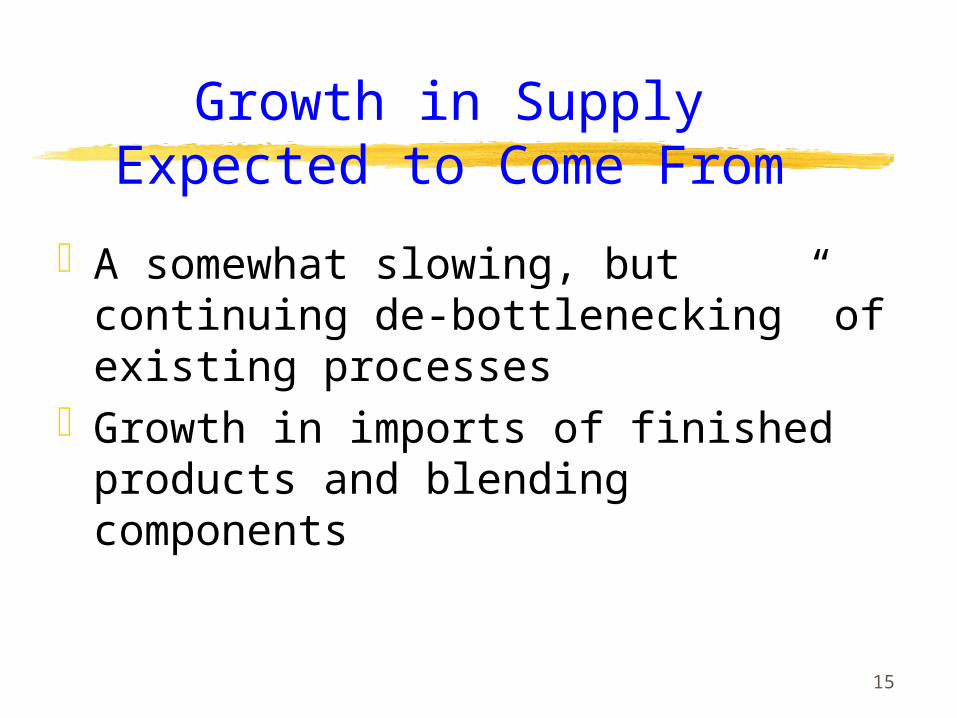
Growth in Supply Expected to Come From
A somewhat slowing, but continuing de-bottlenecking” of existing processes
Growth in imports of finished products and blending components
16
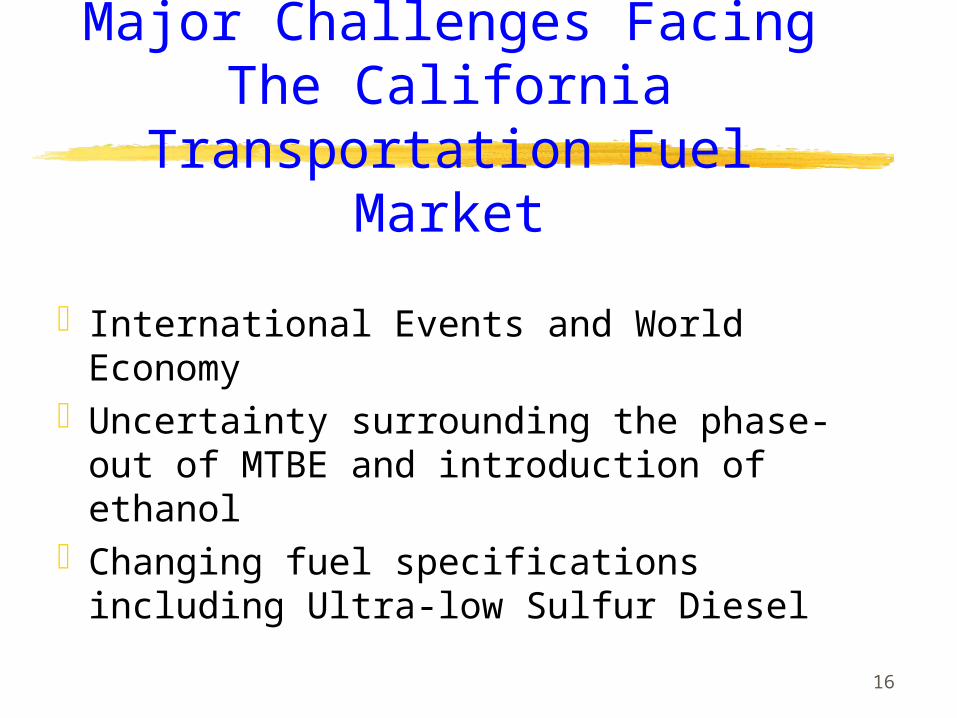
Major Challenges Facing The California Transportation Fuel
Market
International Events and World Economy
Uncertainty surrounding the phase-out of MTBE and introduction of ethanol
Changing fuel specifications including Ultra-low Sulfur Diesel
17
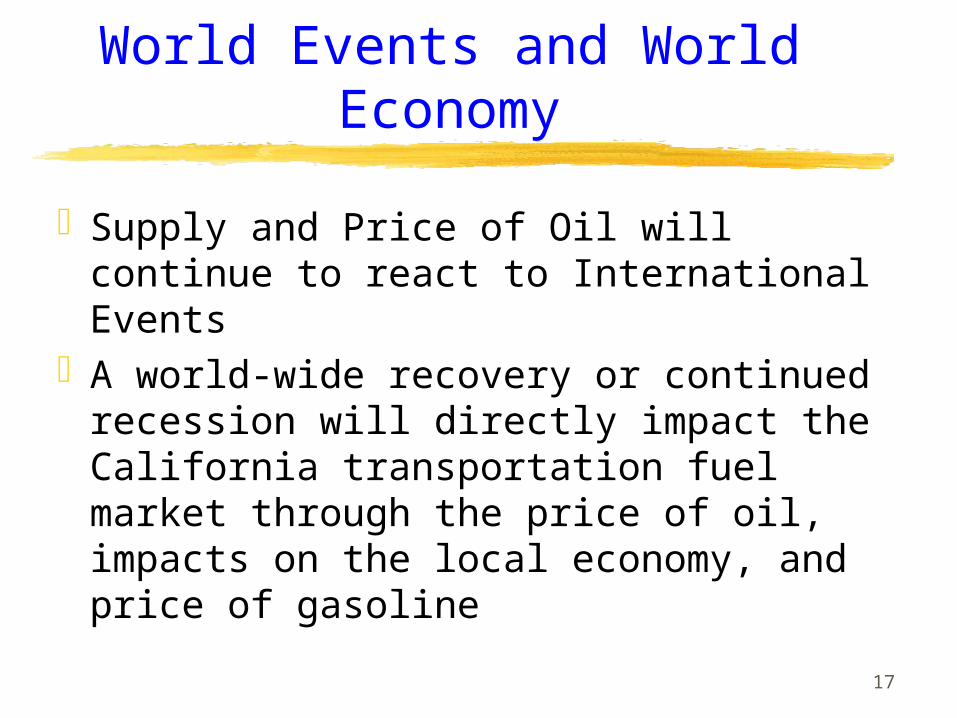
World Events and World Economy
Supply and Price of Oil will continue to react to International Events
A world-wide recovery or continued recession will directly impact the California transportation fuel market through the price of oil, impacts on the local economy, and price of gasoline

18
Gasoline Price Volatility
California Gasoline Dealer Margins
(30)
(20)
(10)
-
10
20
30
40
50
01/06/97 04/28/97 08/25/97 12/22/97 04/13/98 08/03/98 11/23/98 03/15/99 07/05/99 10/25/99 01/28/00 05/12/00 10/02/00 01/22/01 05/14/01
Ce
nts
/Ga
llon
Dealer Margin
19
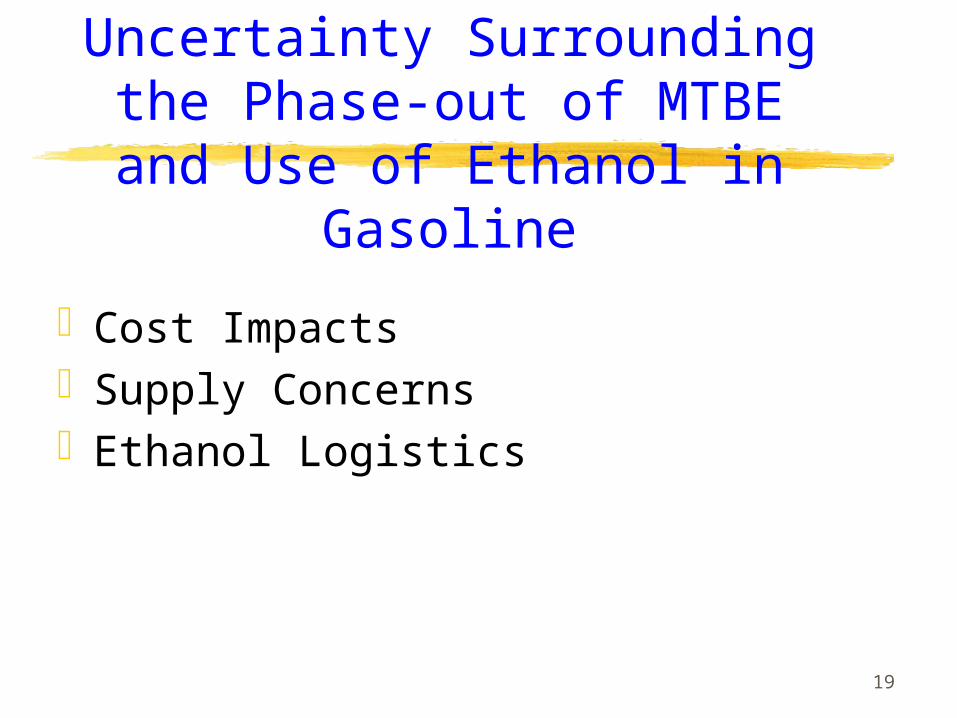
Uncertainty Surrounding the Phase-out of MTBE and Use
of Ethanol in Gasoline
Cost ImpactsSupply ConcernsEthanol Logistics
20
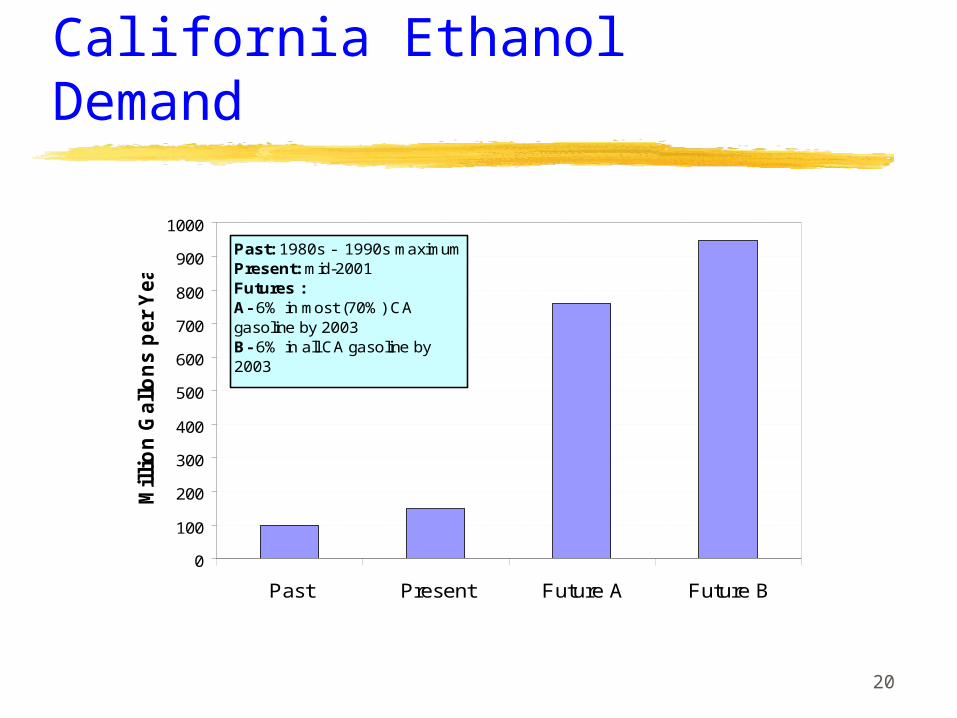
California Ethanol Demand
0
100
200
300
400
500
600
700
800
900
1000
Past Present Future A Future B
Mil
lio
n G
all
on
s p
er
Ye
ar
Past: 1980s - 1990s maximumPresent: mid-2001Futures : A- 6% in most (70%) CA gasoline by 2003B- 6% in all CA gasoline by 2003
21
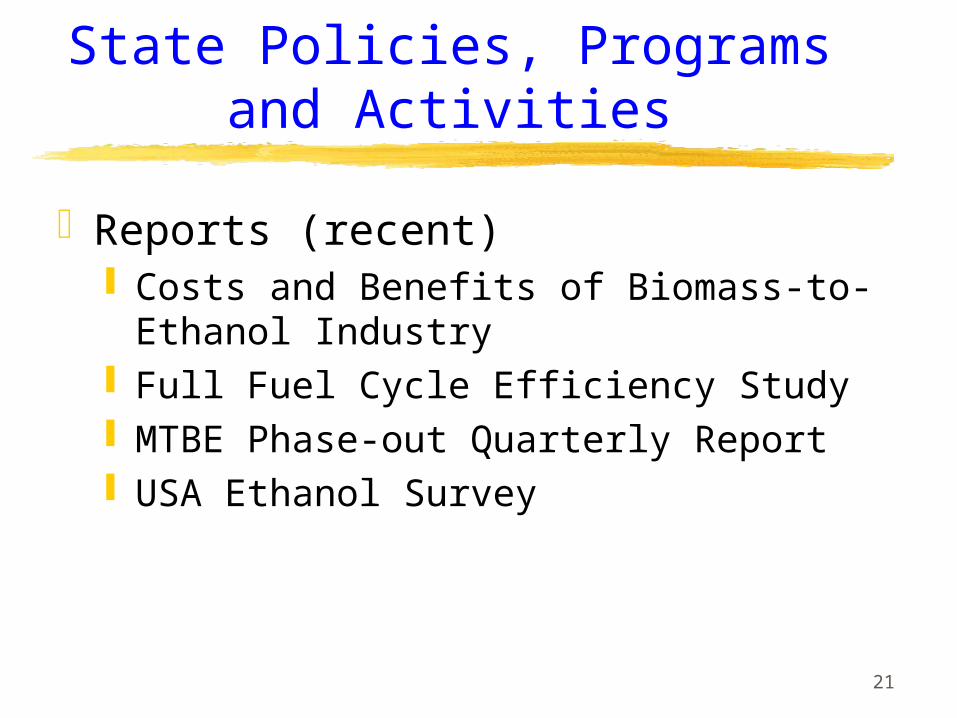
State Policies, Programs and Activities
Reports (recent) Costs and Benefits of Biomass-to-
Ethanol Industry Full Fuel Cycle Efficiency Study MTBE Phase-out Quarterly Report USA Ethanol Survey
22
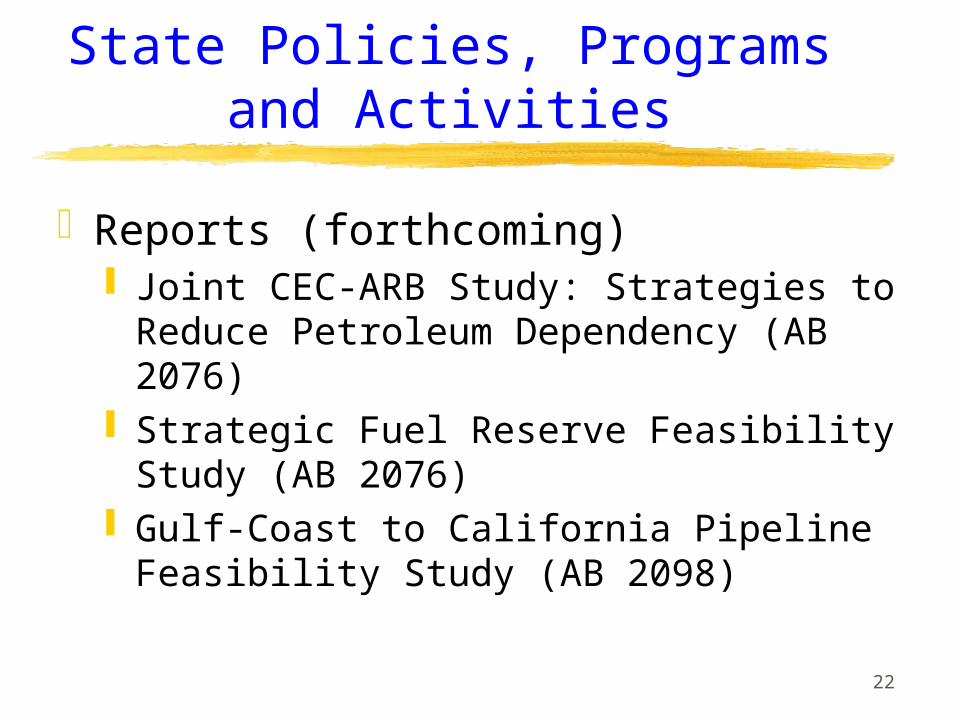
State Policies, Programs and Activities
Reports (forthcoming) Joint CEC-ARB Study: Strategies to
Reduce Petroleum Dependency (AB 2076)
Strategic Fuel Reserve Feasibility Study (AB 2076)
Gulf-Coast to California Pipeline Feasibility Study (AB 2098)
23
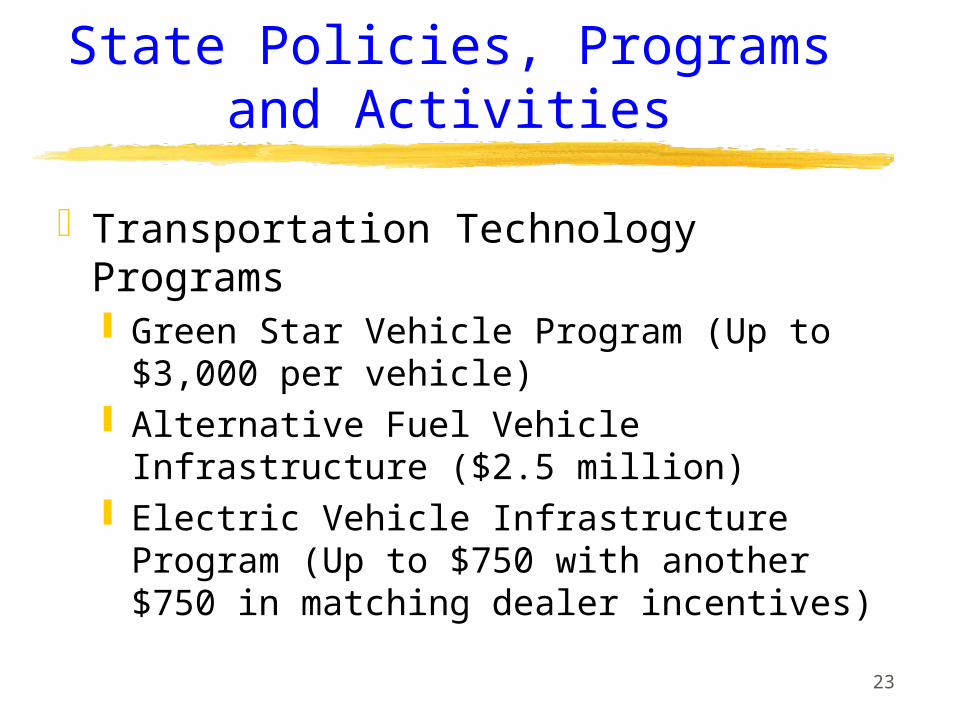
State Policies, Programs and Activities
Transportation Technology Programs Green Star Vehicle Program (Up to
$3,000 per vehicle) Alternative Fuel Vehicle Infrastructure
($2.5 million) Electric Vehicle Infrastructure Program
(Up to $750 with another $750 in matching dealer incentives)
24
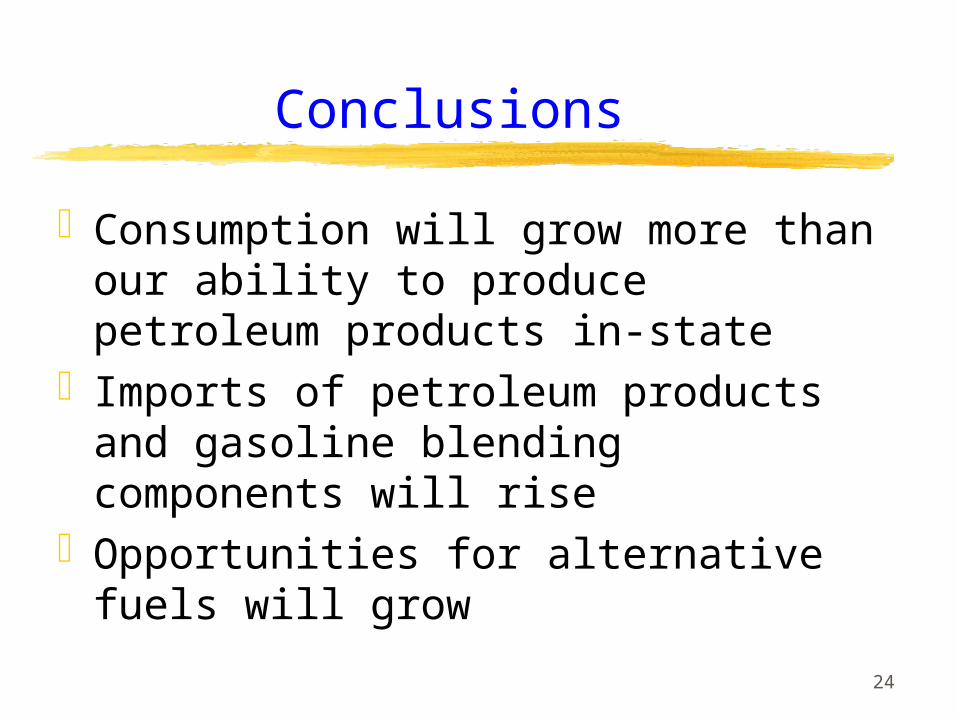
Conclusions
Consumption will grow more than our ability to produce petroleum products in-state
Imports of petroleum products and gasoline blending components will rise
Opportunities for alternative fuels will grow