California Hydrogen Infrastructure Project
56
California Hydrogen Infrastructure Project DOE Cooperative Agreement DE-FC36-05GO85026 FINAL REPORT For the period 31 August 2005 – 31 December 2012 Prime Contractor: Air Products and Chemicals, Inc. Principal Investigator: Edward C. Heydorn Subcontractors: FuelCell Energy, Inc. National Fuel Cell Research Center, University of California, Irvine Funding Agencies: California Air Resources Board South Coast Air Quality Management District Orange County Sanitation District January 2013
Transcript of California Hydrogen Infrastructure Project
California Hydrogen Infrastructure Project
DOE Cooperative Agreement DE-FC36-05GO85026
FINAL REPORT
For the period 31 August 2005 – 31 December 2012
Prime Contractor: Air Products and Chemicals, Inc.
Principal Investigator: Edward C. Heydorn
Subcontractors: FuelCell Energy, Inc.
National Fuel Cell Research Center, University of California, Irvine
Funding Agencies: California Air Resources Board
South Coast Air Quality Management District Orange County Sanitation District
January 2013

Disclaimer The statements and conclusions in this report are those of the grantee and not necessarily those of the California Air Resources Board. The mention of commercial products, their source, or their use in connection with material reported herein is not to be construed as actual or implied endorsement of such products. This report was prepared as a result of work sponsored and paid for, in whole or in part, by the South Coast Air Quality Management District (AQMD). The opinions, findings, conclusions, and recommendations are those of the author and do not necessarily represent the views of AQMD. AQMD, its officers, employees, contractors, and subcontractors make no warranty, expressed or implied, and assume no legal liability for the information. AQMD has not approved or disapproved this presentation, nor has AQMD passed upon the accuracy or adequacy of the information contained herein.
i
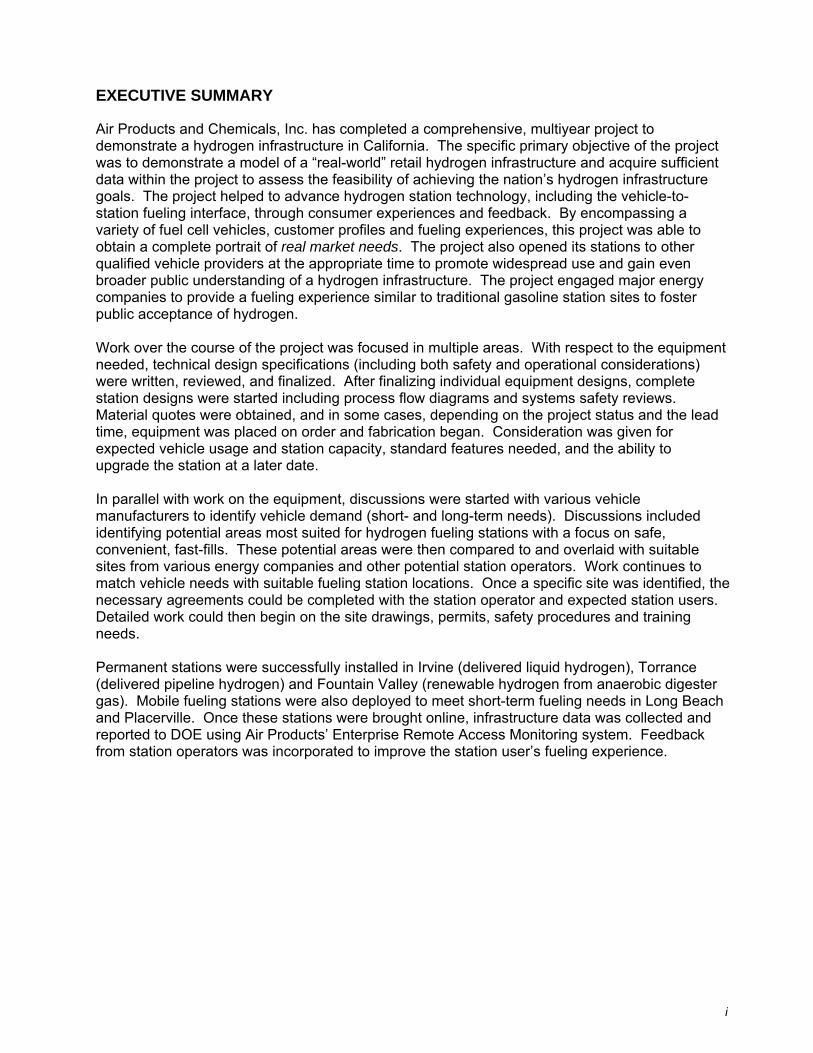
EXECUTIVE SUMMARY
Air Products and Chemicals, Inc. has completed a comprehensive, multiyear project to demonstrate a hydrogen infrastructure in California. The specific primary objective of the project was to demonstrate a model of a “real-world” retail hydrogen infrastructure and acquire sufficient data within the project to assess the feasibility of achieving the nation’s hydrogen infrastructure goals. The project helped to advance hydrogen station technology, including the vehicle-to-station fueling interface, through consumer experiences and feedback. By encompassing a variety of fuel cell vehicles, customer profiles and fueling experiences, this project was able to obtain a complete portrait of real market needs. The project also opened its stations to other qualified vehicle providers at the appropriate time to promote widespread use and gain even broader public understanding of a hydrogen infrastructure. The project engaged major energy companies to provide a fueling experience similar to traditional gasoline station sites to foster public acceptance of hydrogen. Work over the course of the project was focused in multiple areas. With respect to the equipment needed, technical design specifications (including both safety and operational considerations) were written, reviewed, and finalized. After finalizing individual equipment designs, complete station designs were started including process flow diagrams and systems safety reviews. Material quotes were obtained, and in some cases, depending on the project status and the lead time, equipment was placed on order and fabrication began. Consideration was given for expected vehicle usage and station capacity, standard features needed, and the ability to upgrade the station at a later date. In parallel with work on the equipment, discussions were started with various vehicle manufacturers to identify vehicle demand (short- and long-term needs). Discussions included identifying potential areas most suited for hydrogen fueling stations with a focus on safe, convenient, fast-fills. These potential areas were then compared to and overlaid with suitable sites from various energy companies and other potential station operators. Work continues to match vehicle needs with suitable fueling station locations. Once a specific site was identified, the necessary agreements could be completed with the station operator and expected station users. Detailed work could then begin on the site drawings, permits, safety procedures and training needs. Permanent stations were successfully installed in Irvine (delivered liquid hydrogen), Torrance (delivered pipeline hydrogen) and Fountain Valley (renewable hydrogen from anaerobic digester gas). Mobile fueling stations were also deployed to meet short-term fueling needs in Long Beach and Placerville. Once these stations were brought online, infrastructure data was collected and reported to DOE using Air Products’ Enterprise Remote Access Monitoring system. Feedback from station operators was incorporated to improve the station user’s fueling experience.
ii
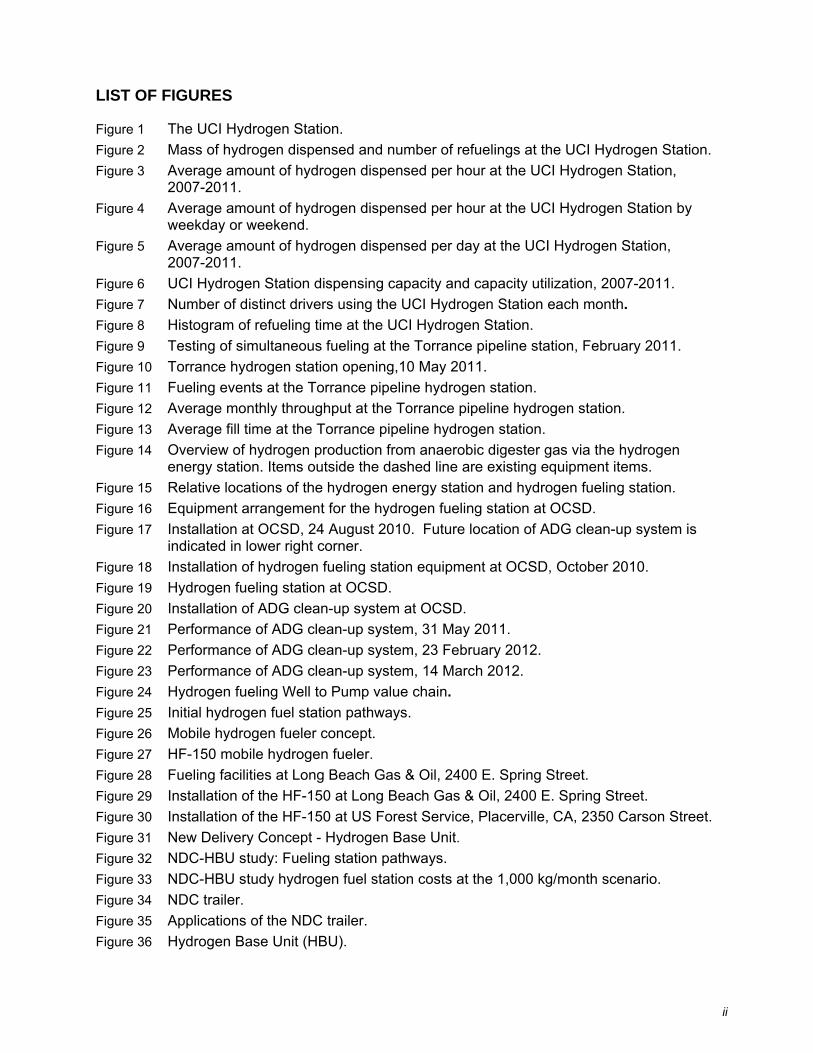
LIST OF FIGURES
Figure 1 The UCI Hydrogen Station.
Figure 2 Mass of hydrogen dispensed and number of refuelings at the UCI Hydrogen Station.
Figure 3 Average amount of hydrogen dispensed per hour at the UCI Hydrogen Station, 2007-2011.
Figure 4 Average amount of hydrogen dispensed per hour at the UCI Hydrogen Station by weekday or weekend.
Figure 5 Average amount of hydrogen dispensed per day at the UCI Hydrogen Station, 2007-2011.
Figure 6 UCI Hydrogen Station dispensing capacity and capacity utilization, 2007-2011.
Figure 7 Number of distinct drivers using the UCI Hydrogen Station each month.
Figure 8 Histogram of refueling time at the UCI Hydrogen Station.
Figure 9 Testing of simultaneous fueling at the Torrance pipeline station, February 2011.
Figure 10 Torrance hydrogen station opening,10 May 2011.
Figure 11 Fueling events at the Torrance pipeline hydrogen station.
Figure 12 Average monthly throughput at the Torrance pipeline hydrogen station.
Figure 13 Average fill time at the Torrance pipeline hydrogen station.
Figure 14 Overview of hydrogen production from anaerobic digester gas via the hydrogen energy station. Items outside the dashed line are existing equipment items.
Figure 15 Relative locations of the hydrogen energy station and hydrogen fueling station.
Figure 16 Equipment arrangement for the hydrogen fueling station at OCSD.
Figure 17 Installation at OCSD, 24 August 2010. Future location of ADG clean-up system is indicated in lower right corner.
Figure 18 Installation of hydrogen fueling station equipment at OCSD, October 2010.
Figure 19 Hydrogen fueling station at OCSD.
Figure 20 Installation of ADG clean-up system at OCSD.
Figure 21 Performance of ADG clean-up system, 31 May 2011.
Figure 22 Performance of ADG clean-up system, 23 February 2012.
Figure 23 Performance of ADG clean-up system, 14 March 2012.
Figure 24 Hydrogen fueling Well to Pump value chain.
Figure 25 Initial hydrogen fuel station pathways.
Figure 26 Mobile hydrogen fueler concept.
Figure 27 HF-150 mobile hydrogen fueler.
Figure 28 Fueling facilities at Long Beach Gas & Oil, 2400 E. Spring Street.
Figure 29 Installation of the HF-150 at Long Beach Gas & Oil, 2400 E. Spring Street.
Figure 30 Installation of the HF-150 at US Forest Service, Placerville, CA, 2350 Carson Street.
Figure 31 New Delivery Concept - Hydrogen Base Unit.
Figure 32 NDC-HBU study: Fueling station pathways.
Figure 33 NDC-HBU study hydrogen fuel station costs at the 1,000 kg/month scenario.
Figure 34 NDC trailer.
Figure 35 Applications of the NDC trailer.
Figure 36 Hydrogen Base Unit (HBU).

iii
Figure 37 Simplified schematic of the PCA model.
Figure 38 Map of hydrogen production and dispensing systems in Southern California (2060 scenario).
Figure 39 GHG emissions with the adoption of hydrogen infrastructure in Southern California.
Figure 40 Interface of PCA model with environmental database at UC Irvine.
Figure 41 Estimated change in ozone levels in the Los Angeles basin with rollout of fuel cell vehicles (2060 scenario).
Figure 42 Hydrogen fueling value chain.
Figure 43 Cryo-compressed hydrogen (CCH) forecourt delivery concepts.
Figure 44 Positioning of cryo-compressed hydrogen (CCH). Figure 45 Directed Technologies’ program objectives.
Figure 46 Novel compressor.
LIST OF TABLES
Table 1 Total and average hydrogen and filling data, 2007-2011.
Table 2 Schedule of installation at OCSD.
Table 3 Detailed characterization of supply chain technology mix for hydrogen infrastructure scenarios.
4
TABLE OF CONTENTS
EXECUTIVE SUMMARY ................................................................................................. i LIST OF FIGURES .......................................................................................................... ii LIST OF TABLES ........................................................................................................... iii
1. INTRODUCTION ..................................................................................................... 1
2. RESULTS ................................................................................................................. 4
Stationary Fueling Stations (Tasks 1, 3, and 8) ......................................... 4
UCI STATION (Task 3) ..................................................................................... 4
TORRANCE PIPELINE STATION (Tasks 1 and 3) ........................................ 11
Renewable Hydrogen Fueling Station (Tasks 8 and 2006-2.2) ............... 18
Innovative Hydrogen Supply/Distribution Stations (Tasks 2 and 4) ...... 27
BACKGROUND .................................................................................................. 27
HYDROGEN FUELERS (Task 2.1) .................................................................... 27
EVALUATION OF HYDROGEN REFUELER CAPABILITY IN NORTHERN CALIFORNIA (Task 2.2) ..................................................... 30
HYDROGEN BASE UNITS (HBU) WITH NOVEL LIQUID-GAS DELIVERY SYSTEM (Task 4) ................................................................. 31
NOVEL LIQUID-GAS DELIVERY SYSTEM (Task 4) ......................................... 34
HYDROGEN BASE UNIT (Task 4) .................................................................... 35
Life Cycle Assessment (LCA) of Hydrogen Infrastructure and Fuel Cell Vehicle Technologies (Task 5) ......................................... 37
Assessment of Technologies for Hydrogen Production from Non-Fossil Hydrogen Sources (Task 2006-2.1) ................................ 42
Cryogenically-Compressed Hydrogen (CCH) Study (Task 2006-3) ........ 43
DTI/DOE H2 Production Analysis Project Support (Task 2006-4) .......... 47
Novel Compressor Development (Task 2006-5) ....................................... 48
3. PRESENTATIONS/PUBLICATIONS/PATENTS ................................... 50

1
1. INTRODUCTION
Air Products and Chemicals, Inc. (“Air Products”), a Delaware Corporation having a principal place of business in Allentown, Pennsylvania, is a major global industrial gas and chemical company. Air Products is the world leader in merchant hydrogen production, distribution and handling for a wide variety of customers in the government, and for commercial markets including petrochemicals, refineries, electronics and food processing. Within California, Air Products owns and operates 17 miles of hydrogen pipeline in the highly-industrial, commercial districts of Torrance and Wilmington in the metropolitan Los Angeles area; operates a liquid hydrogen production facility in Sacramento and several large hydrogen production facilities in the San Francisco Bay area; and supports multiple fueling stations throughout the state. At the time of project proposal, Air Products also supported a small distributed reformer production and refueling station in Las Vegas, NV.
Of the proposed scenarios for nationwide hydrogen infrastructure development, many advocate initial bulk delivery of gas or liquid, followed by small, on-site generation that graduates to regional distribution from a pipeline as the likely pathway to a successful hydrogen economy. Air Products proposed a comprehensive, California-based, multi-year hydrogen infrastructure project to develop and demonstrate a variety of innovative hydrogen infrastructure concepts within this representative region. The final infrastructure for this multi-year project was expected to include a variety of flexible modes of supply, such as pipeline-supplied hydrogen, delivered liquid and gas, and hydrogen co-production from high-temperature fuel cells. The hydrogen infrastructure in its final form is expected to include many, if not all, of these supply modes. The primary objective was to demonstrate a model of a “real-world” retail hydrogen infrastructure and acquire data necessary to assess the feasibility of achieving the nation’s hydrogen economy infrastructure goals.
Air Products led this project and focused on supplying hydrogen infrastructure for the advancement of a national hydrogen economy. The project opened its stations to authorized users undertaking demonstration programs in conjunction with federal, state and local governments to promote widespread demonstration of the project hydrogen infrastructure. All major fuel cell vehicle OEMs utilized these stations to meet their individual fuel cell program needs. Under this project’s umbrella, each of these auto companies will be allowed to obtain access to the infrastructure for hydrogen fueling purposes subject to providing fueling data. This umbrella effort was intended to aggregate distinctly different fuel-cell vehicle platforms at common stations to simulate an infrastructure embodying “real-world” fueling – as opposed, for example, to the dedicated fueling of fleets by a single manufacturer. Encompassing a variety of vehicles, customer profiles and fueling experiences allowed this project to obtain a complete portrait of real market needs. The project’s planned infrastructure concepts were as follows:
Hydrogen fueling stations are fully-automated systems consisting of standalone compression, gaseous storage, and dispenser skids with an integrated control system. These stations have the flexibility to accept a variety of hydrogen supply options such as pipeline, on-site generation, delivered liquid, or delivered gas. Also, the modular (fully-skidded) hydrogen fueling station design facilitates future expansion without losing station availability. For example, these stations can easily be upgraded to high-pressure dispensing by adding compression modules.
Hydrogen fuelers consist of a fully-automated, integrated gaseous storage and dispensing system on a wheeled trailer. Because hydrogen fuelers are totally self-contained, DOT-compliant, and do not require any utility connections, they are portable and can easily be relocated. Hydrogen fuelers can be filled at hydrogen production sites that have high-pressure compression capabilities.

2
Hydrogen base units consist of an innovative, automated system for storing and dispensing hydrogen. Hydrogen base units are being designed for specific use in conjunction with a new liquid-gaseous hydrogen delivery concept also developed as part of this project.
The premier station of the project was a hydrogen fueling station located on Air Products’ hydrogen pipeline in Torrance in the highly-visible, urban Los Angeles area. Multiple demonstration fuel-cell vehicle customers were identified in this location, where the lowest-cost hydrogen is readily available from Air Products’ large Wilmington production facility. The team also evaluated and considered other third-party locations in the nearby vicinity based upon compliance and accessibility.
A second station was installed at the Orange County Sanitation District in Fountain Valley, CA as part of a program funded in part by the California Air Resources Board (CARB). This station was supplied by renewable hydrogen and electricity from a Hydrogen Energy Station developed and demonstrated under the Department of Energy Cooperative Agreement DE-FC36-01GO11087 entitled “Validation of an Integrated System for a Hydrogen Fueled Power Park.”
To expand the infrastructure base and thereby extend the travel reach of hydrogen vehicles to major California population centers, the project upgraded an existing hydrogen fueling station in the region, specifically the National Fuel Cell Research Center (NFCRC) station at the University of California at Irvine (UCI), for high-pressure fueling at 700 bar – the next step in extending vehicle range. In addition, an evaluation was performed to assess the feasibility of adding liquid hydrogen dispensing capability to the UCI station. In contrast to the Torrance station, the UCI station was supplied with liquid hydrogen delivered from Air Products’ Sacramento plant.
Another part of the project involved Air Products’ deployment of two hydrogen fuelers supplied with compressed hydrogen at Air Products’ Wilmington plant. These fuelers were transported and strategically placed at sites in California (Long Beach and Placerville) to serve as the basis for infrastructure expansion and to help foster public acceptance of hydrogen by providing a familiar retail fueling experience. The hydrogen fuelers were located to best accommodate specific user needs in the region based on both a logistics study and vehicle traffic pattern data gathered during the project. The growth will begin in southern California and expand to northern California, after which these two populous regions could be interconnected.
This project introduced a groundbreaking infrastructure application for supplying hydrogen fueling stations: a new liquid/gaseous hydrogen delivery concept which has the potential to greatly reduce the distribution costs of delivered hydrogen. Use of this concept was planned to be deployed in conjunction with any California hydrogen base unit. This novel delivery technology was able to demonstrate a significant increase in the amount of hydrogen that can be supplied from a single over-the-road vehicle, showed vastly improved delivery economics for an emerging hydrogen infrastructure, and introduced greater capabilities for self-contained movable fueling stations. As an additional part of this project, the NFCRC performed an infrastructure roll-out study for California which tied together fueling and distributed generation into a comprehensive plan.
This project provided a world-class demonstration and model for the future hydrogen economy through judicious implementation of different cost-effective supply modes, with a clear path to commercial sustainability. The project also provided the opportunity to advance hydrogen station technology, including the vehicle-to-station fueling interface and information acquisition. By the end of the project, Air Products was able to define and recommend statewide California hydrogen fueling needs.

3
The future infrastructure for a hydrogen economy with gasoline-competitive prices can be demonstrated only by employing real-world, economy-of-scale, large-plant assets while working toward cost-effective, smaller on-site plants. Consideration must be given to flexible modes of supply, including pipeline-supplied hydrogen, delivered liquid and gas, and hydrogen generation via co-production systems. This project demonstrated all of these modes, an approach that is essential for successfully establishing the ultimate hydrogen economy for the nation.

4
2. RESULTS
Stationary Fueling Stations (Tasks 1 and 3)
UCI STATION (Task 3)
As part of Task 3, Air Products installed a hydrogen refueling station at the National Fuel Cell Research Center (NFCRC) in Irvine, California. The facility was built, installed, and maintained by Air Products, who also supplied the hydrogen to the station in liquid form. The project was divided into three phases:
Phase I: Replacement of the existing NFCRC station (designed to supply hydrogen at 350 bar from a tube trailer) with a new fueling station and liquid hydrogen supply system. This station will be capable of 350 bar dispensing.
Phase II: Add 700 bar dispensing capabilities to the Phase I station
Phase III: Potentially add a liquid hydrogen dispenser to the Phase I-II station
Based on a 50% compressor on-stream factor, the station will have the capacity to dispense 24 kg/day, or approximately six cars per day. When starting with full storage, 4-5 cars could be filled in succession.
Phases I and II were completed during the term of the Cooperative Agreement. Phase III was also evaluated and, after consultation with the automobile manufacturers, a decision was made to not install the liquid hydrogen dispenser (additional related information is provided at the end of this section). The following equipment was provided by Air Products under Phases I and II:
Quantity Description 1 Liquid hydrogen supply system consisting of: 1500 gallon cryogenic
storage vessel, horizontal tank with side-mount vaporizers, pressure-temperature control manifold and pressure vent stack
1 Tank telemetry unit 1 Liquid hydrogen connection 1 Ambient air process vaporizer 1 Series 200 hydrogen fueling station consisting of: gaseous hydrogen compressor (17.4 scfm at 100 psig suction) system control panel, free-standing chiller unit for compressor, closed loop water/glycol 3-pack of high-pressure storage (7777 psig)
1 700 bar hydrogen compressor, design outlet pressure = 12,000 psig, design capacity = 30 kilograms per hour
1 Dual H35/H70 hydrogen dispenser 1 Refrigeration system for H70 cooling
Air Products’ responsibilities for this station are summarized below:
GENERAL
1. Conduct site evaluation. 2. Support UCI in obtaining required state and local installation and operating permits. 3. Provide the foundation design, including all underground pipes, drains, and conduits. 4. Provide site layout, design safety assessment (i.e. HAZOP), and non-proprietary process
flow diagrams. 5. Provide electrical load list and basic electrical single-line diagram.

5
6. Complete the design (including construction drawings and drawing approval) of any foundations/equipment pads/grouting, as required.
7. Complete the design (including construction drawings and drawing approval) of any new field piping, within the battery limits, as required.
8. Procure and coordinate shipment of all major equipment to the customer's installation site. 9. Provide equipment manuals and operating procedures.
10. Provide system review and safety orientation to the customer's operating personnel and local officials. Two classes on consecutive days will be provided as part of the original contract.
MECHANICAL/CIVIL
1. Schedule and coordinate a crane/rigging contractor to off load all major equipment at the customer's site.
2. Perform all possible shop prefabrication of system pipeline components and cleaning of all liquid hydrogen system components prior to arrival on-site at the customer’s facility.
3. Remove the existing station equipment and associated above-ground obstructions that interfere with siting of new fueling equipment.
4. Perform the mechanical installation of the hydrogen fueling equipment. 5. Provide any new civil/structural work required within the battery limits. 6. Provide all materials not explicitly highlighted under the customer's scope of work to
commission and start-up the fuel station and liquid hydrogen supply systems in accordance with Air Products’ specifications and standards. Conduct an Operational Readiness Inspection (ORI). Pressure/leak test field-installed piping. Cool down and perform the first fill of the cryogenic storage vessel immediately
following the installation of the supply equipment. Initiate hydrogen supply by commissioning the liquid hydrogen supply system
following the first fill of the storage vessel. ELECTRICAL
1. Complete any designs (including construction drawings and drawing approval) required to supply system utilities to the battery limits and any underground services, as required.
2. Perform the instrumentation and electrical installation of the hydrogen fueling equipment. CONSTRUCTION
1. Provide construction and safety supervisory labor to oversee installation, commissioning and start-up of the items within Air Products’ scope of supply.
2. Coordinate safety training with external Air Products contractors. Engineering began on the design of the UCI station following execution of the Cooperative Agreement. Equipment for both 350 and 700 bar fueling was ordered, and discussions with automakers were held on a regular basis to ensure that station users have a similar experience as with gasoline fueling. In parallel with the design efforts, contract discussions were held with UC Irvine (the National Fuel Cell Research Center served as operator of the fueling station), and agreements were executed in July 2006.
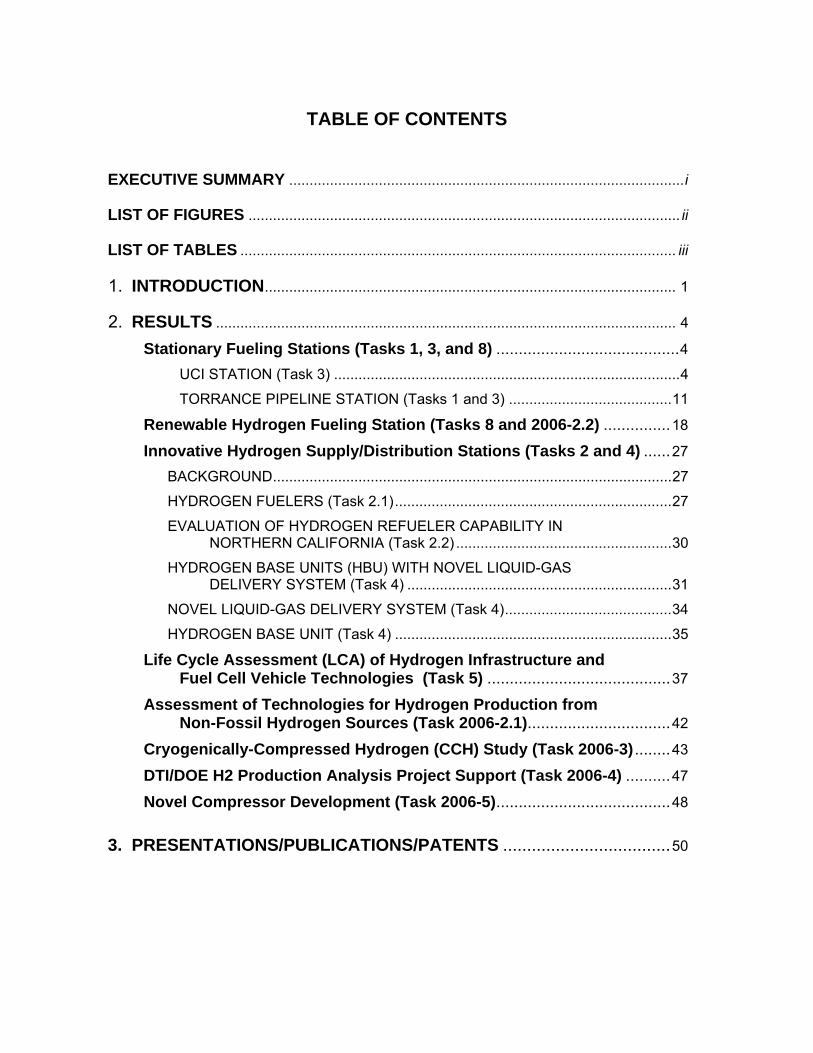
Construction at the site began with the removal of the existing hydrogen fueling station in June 2006. The equipment for 350 bar fueling was installed in July 2006, and initial operation of the Phase I station began on 21 August 2006. The 700 bar fueling equipment was installed in December 2006, and commissioning was completed in February 2007. Figure 1 shows a picture of the UCI Hydrogen Station, which officially opened on 27 February 2007.
6
Figure 1. The UCI Hydrogen Station.
As part of its research efforts regarding the operation and use of hydrogen fueling equipment, UC Irvine studied the station starting in 2007 with operation of both the 350 and 700 bar systems. Results of this research were summarized in the article “Quantitative Analysis of a Successful Public Hydrogen Station” published in the International Journal of Hydrogen Energy (T. Brown, S. Stephens-Romero, S. Samuelsen, 2012, Volume 37, Issue 17, pp 12731-12740).
The station has been and continues to be used by fuel cell vehicles from Toyota, Honda, General Motors, Hyundai, Kia, Mercedes-Benz and Mazda. Figure 2 shows the quantity of hydrogen dispensed at the UCI Hydrogen Station for each of the past five years. The usage nearly tripled from 2007 to 2008, and doubled from 2008 to 2009. However, the quantity of hydrogen dispensed increase by only 15.5% in 2009 and 18.2% in 2010 because the station had been operating above the design capacity. There has not been a single safety incident in any of the refuelings performed at the UCI station.
Interestingly, the quantity of hydrogen dispensed increased at a faster rate than did the number of filling events in 2007, 2008, and 2009. In 2007 and 2008, many users new to hydrogen fueling had difficulty successfully completing a fill on the first attempt due to safety regulations requiring personal protective equipment (PPE) such as a fire resistant jacket and eye protection. As a result, several discrete fills were often recorded for each refueling event. Upon the removal of the PPE requirement in 2008, the data show more consistency in the ratio between number of fills and mass of hydrogen dispensed.

7
Figure 2. Mass of hydrogen dispensed and number of refuelings at the UCI Hydrogen Station.
Although the station is open 24 hours a day, seven days a week, it is not surprising that most users fill their vehicles during normal, waking hours between Monday and Friday. Figure 3 shows the yearly average amount of hydrogen dispensed per hour across all weekdays for 2007-2011. The plot shows consistent usage spikes at 6 or 7 am, 9-11 am, and 2-3 pm. Figure 3 also shows that usage tapers off gradually after 4 pm, and that there is virtually no usage between midnight and 4 am.
Figure 3. Average amount of hydrogen dispensed per hour at the UCI Hydrogen Station, 2007-2011.
At the time station design parameters were established, the cooling system for 700 bar vehicle fueling was designed for individual vehicle fills followed by recovery time to reestablish temperatures associated with the heat transfer system. As a result, the UCI Hydrogen Station could not accommodate back-to-back vehicle fueling. Drivers therefore tended to refuel when they thought they would have the best chance of avoiding other drivers, as demonstrated by the 4 am spike in Figure 3.

8
Figure 4 shows hourly average fueling information for 2010 and 2011 organized by weekday and weekend. Weekday usage is higher than weekend usage, particularly in the morning and afternoon hours.
Figure 4. Average amount of hydrogen dispensed per hour at the UCI Hydrogen Station by weekday or weekend.
Figure 5 shows the weekly hydrogen dispensation trends observed for 2007-2011. For each year, usage is consistently low on Saturday and Sunday compared to other days. Year-to-year usage is relatively consistent during weekdays. 2011 shows small peaks on Monday and Friday.
Figure 5. Average amount of hydrogen dispensed per day at the UCI Hydrogen Station, 2007-2011.
Table 1 shows data for quantity of hydrogen dispensed per day and per year, as well as the number of fills per day and per year for 2007-2011. Table 1 also presents the maximum mass of hydrogen dispensed on a single day for each year.

9
Table 1. Total and average hydrogen and filling data, 2007-2011.
Year Total H2
Dispensed per Year (kg)
Average H2 Dispensed per
Day (kg)
Total Number of Fills
Average Number of
Fills per Day
Average H2 per
Fill (kg)
Maximum H2 Dispensed in One Day (kg)
2007 1,003 2.75 744 2.04 1.35 25.2 2008 3,093 8.45 1,364 3.73 2.27 32.8 2009 5,998 16.43 1,934 5.30 3.10 54.5 2010 6,928 18.98 2,295 6.29 3.02 59.9 2011 8,186 22.43 2,639 7.23 3.10 51.3
The load duration curve (Figure 6) shows the mass of hydrogen dispensed at the station each day for five years, in descending order. As shown, the station was used only 209 days in 2007 compared to 324, 353, 358, and 362 days for 2008, 2009, 2010, and 2011, respectively. It is important to note that station repair and maintenance is responsible for several days of station downtime each year. Figure 6 also displays a horizontal line indicating the 25 kg/day design point of the station based on the Series 200 compressor capacity of ~2 kg/hour with a 50% duty cycle. Roughly 50 kg/day is possible if the compressor operates continuously, and even greater quantities can be dispensed daily (as demonstrated several times in 2009, 2010, and 2011) due to the capacitive effect of the on-site storage -- but all such operation is beyond the intended design. As shown, the numbers of days above the 25 kg/day threshold were 1, 7, 80, 98, and 150 for 2007-2011, respectively.
Figure 6. UCI Hydrogen Station dispensing capacity and capacity utilization, 2007-2011.
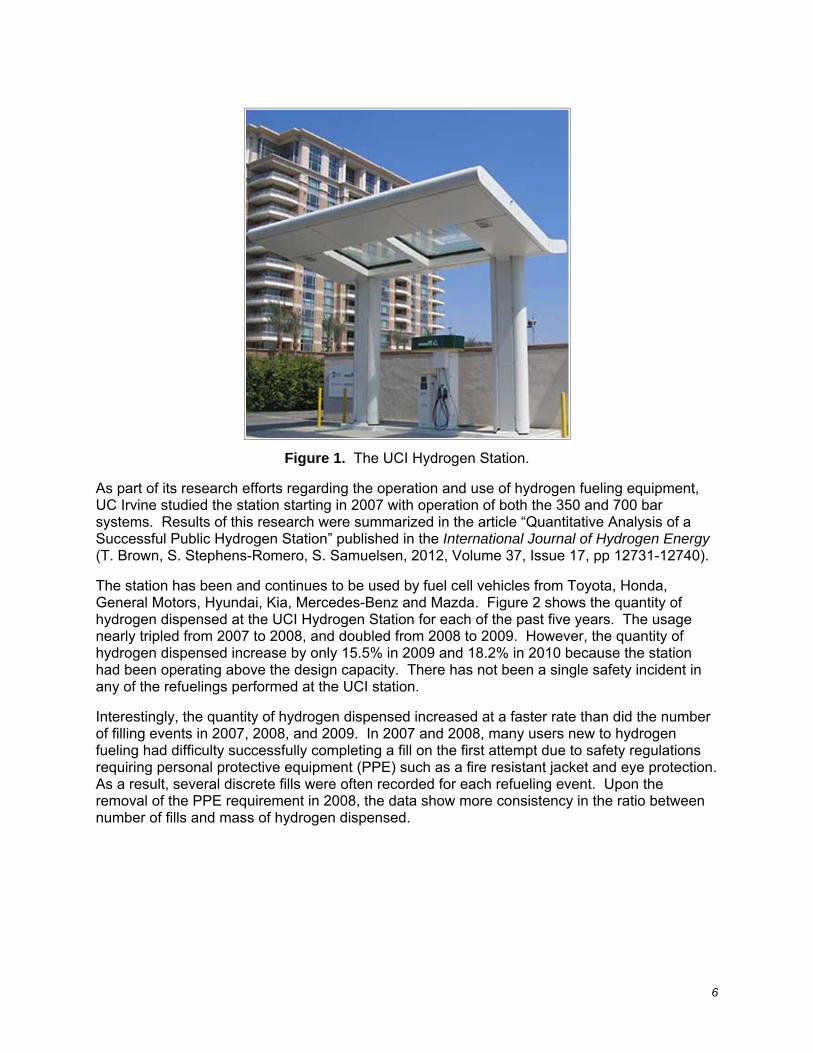
Figure 7 shows the number of distinct drivers refueling at the UCI Hydrogen Station each month. Each driver is assigned a unique PIN code to allow access only to trained users and to enable data collection. Some users share a PIN code and a vehicle (e.g. husband and wife) and some users have access to more than one vehicle (e.g. automaker employees), though these instances are rare. Assuming that each driver represents one vehicle, the fleet of vehicles supported by the UCI station averaged 30.4 per month in 2009, 31.8 per month in 2010, and 32.4 per month in 2011, equating to 0.54 kg/car/day, 0.60 kg/car/day, and 0.69 kg/car/day for 2009-2011, respectively. For the entire year of 2011, 64 different drivers filled at the UCI Hydrogen Station.
10
Figure 7. Number of distinct drivers using the UCI Hydrogen Station each month.
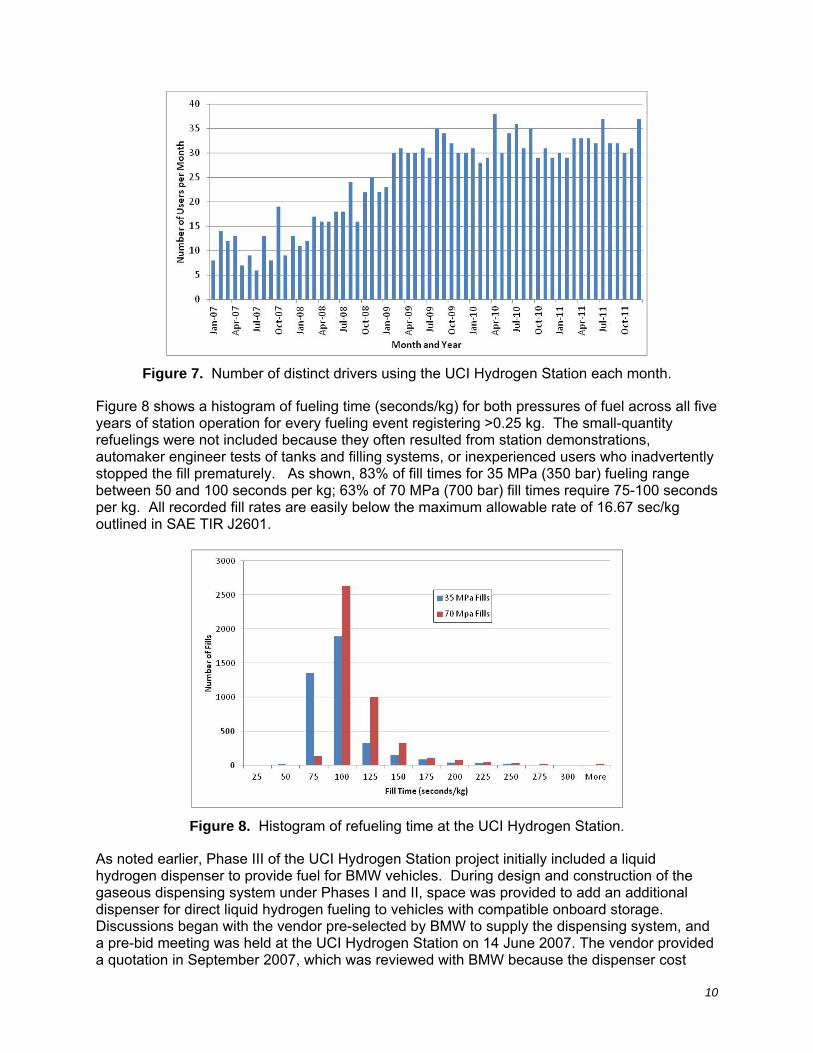
Figure 8 shows a histogram of fueling time (seconds/kg) for both pressures of fuel across all five years of station operation for every fueling event registering >0.25 kg. The small-quantity refuelings were not included because they often resulted from station demonstrations, automaker engineer tests of tanks and filling systems, or inexperienced users who inadvertently stopped the fill prematurely. As shown, 83% of fill times for 35 MPa (350 bar) fueling range between 50 and 100 seconds per kg; 63% of 70 MPa (700 bar) fill times require 75-100 seconds per kg. All recorded fill rates are easily below the maximum allowable rate of 16.67 sec/kg outlined in SAE TIR J2601.
Figure 8. Histogram of refueling time at the UCI Hydrogen Station.
As noted earlier, Phase III of the UCI Hydrogen Station project initially included a liquid hydrogen dispenser to provide fuel for BMW vehicles. During design and construction of the gaseous dispensing system under Phases I and II, space was provided to add an additional dispenser for direct liquid hydrogen fueling to vehicles with compatible onboard storage. Discussions began with the vendor pre-selected by BMW to supply the dispensing system, and a pre-bid meeting was held at the UCI Hydrogen Station on 14 June 2007. The vendor provided a quotation in September 2007, which was reviewed with BMW because the dispenser cost

11
estimate exceeded the budget allowance within the Cooperative Agreement. BMW informed Air Products that it did not want to proceed with installation of the liquid hydrogen dispenser at UC Irvine. This result was part of the rescoping of the overall project as part of Cooperative Agreement Modification M007 (30 September 2009).
TORRANCE PIPELINE STATION (Tasks 1 and 3)
Air Products owns and operates 17 miles of hydrogen pipeline in the metropolitan Los Angeles area, specifically in the highly industrial, commercial, and residential districts of Torrance and Wilmington. The excess hydrogen currently available on this pipeline can provide a reliable supply of lowest-cost hydrogen for fueling stations or fuel-cell power plants. The only one of its kind in a North American urban area, this pipeline can serve as a baseline station to fuel tens of thousands of hydrogen vehicles in and around the city and prove the economic potential for hydrogen in a congested area. The pipeline is currently fed by two large steam methane reformer plants capable of reliably delivering up to 800 psi hydrogen. In this task, Air Products designed, constructed and operated (through a third party, Shell Hydrogen) a hydrogen station providing fuel for both 350 bar (Task 1) and 700 bar (Task 3) vehicles. This station, located adjacent to the Air Products hydrogen pipeline at a site in Torrance, will continue to serve as a model baseline to 1) validate infrastructure performance, cost, reliability, maintenance, and environmental impacts, and 2) develop a better understanding of the emerging vehicle and fueling infrastructure requirements. The following equipment was provided by Air Products:
Quantity Description 1 Palladium membrane hydrogen purifier 1 Series 150 hydrogen compressor, design outlet pressure = 7,000
psig, design capacity = 4.25 kilograms per hour 2 Modular 3-packs of high-strength carbon steel 7,777 psig gaseous
hydrogen storage vessels, total capacity = 120 kilograms 1 Series 700 hydrogen compressor, design outlet pressure = 13,500
psig, design capacity = 50 kilograms per hour 1 Modular 2-pack of hoop-wrapped carbon steel 15,000 psig gaseous
hydrogen storage vessels, total capacity = 20 kilograms 2 Dual H35/H70 hydrogen dispensers, including controls for
simultaneous fueling operation 1 Refrigeration system for H70 cooling 1 Cellular telemetry remote monitoring system
Air Products’ equipment responsibility included:
1. Procuring all equipment and coordinating the shipment to the Shell Hydrogen site. 2. Conducting a site visit/evaluation with Shell Hydrogen. A technical representative of Air
Products approved the installation site. 3. Assisting Shell Hydrogen with the permitting process, including providing non-proprietary
drawings and operating experience. 4. Providing input to the emergency response plan developed by Shell Hydrogen. 5. Providing operating procedure(s) to Shell Hydrogen. 6. Providing a fueling station description, operator training, and safety orientation to Shell
Hydrogen's operating personnel.

12
7. Providing drawings required for execution of the site preparations by Shell Hydrogen and their engineering design firm. This information may have included, but was not limited to:
Equipment layout (utilized by Shell Hydrogen to develop the site layout) Non-proprietary process flow diagrams Foundation details (anchor details of equipment for foundations), as required Electrical load list and basic electrical single-line diagram
Design of the Hydrogen Purification System
Hydrogen is supplied to the fueling station from Air Products’ industrial pipeline network, which serves a number of customers in the Torrance/South Bay area. The pipeline has a maximum allowable carbon monoxide (CO) concentration of 30 parts per million by volume, while today’s requirement for fuel cell electric vehicles (per SAE J-2719) calls for a CO level of <0.2 parts per million by volume. Air Products initially investigated a pressure-swing adsorption process as the means to purify the station gas supply. However, after review of test data at Air Products’ research facilities and an operability review of the proposed system, it was recommended that a membrane-based approach be considered.
Membrane purifiers are commonly used in electronics fabrication facilities and can produce hydrogen with CO concentrations in the parts-per-trillion range. Air Products ultimately purchased a system of two 2 kg/hr palladium membrane purifiers from Power & Energy, Inc.
Station Performance Upgrade
The initial station configuration included a hydrogen fueling station designed with one set of 7,777 psig storage tubes and a single H35/H70 dispenser. Given the available space at the final station location and the higher-than-expected level of fuel throughput (based on automaker input), Shell Hydrogen agreed to include a second set of storage tubes and a second dispenser. This resulted in a total of 120 kg of hydrogen (60 kg usable) as buffer storage, which could be utilized to fill H35 cars or partially fill H70 cars if the Series 150 compressor system was offline.
Station Siting History
Air Products worked with Shell Hydrogen to develop the proposed station. Shell Hydrogen is acting as station operator and was responsible for gaining access to land, developing the detailed design package, and acquiring the necessary permits. Work under Task 1 extended beyond the original schedule due to several delays related to the development of a host site for the subject fueling station. In 2005, Air Products began negotiating the lease of equipment (sized for 24 kg/day) and sale of hydrogen to third-party station operator Shell Hydrogen. Concurrently, Shell Hydrogen began discussions within their organization to identify a host site in the vicinity of the existing Air Products pipeline. An existing Shell-branded retail gasoline station at the intersection of 190th and Normandie in Torrance, CA was selected. Although there was insufficient space for all of the hydrogen fueling equipment, Shell Hydrogen began negotiations with the owner of adjacent property to lease sufficient land to locate the compression and storage equipment. Engineering design and permitting activities were then performed in advance of execution of agreements. However, the negotiations for access to this adjacent property were unsuccessful. In addition, Shell ultimately sold the gasoline station, and the new owners were unwilling to consider the addition of hydrogen fueling capability. Activities related to the site at 190th and Normandie were terminated in mid-2007. Shortly thereafter, Shell Hydrogen began discussions to lease a greenfield property at the intersection of 190th and Gramercy in Torrance, also along the existing Air Products hydrogen pipeline. Air Products and Shell Hydrogen then resumed negotiations regarding the equipment lease and hydrogen supply agreement. A scheduled September 2007 outage of the Gramercy
13
lateral provided an opportunity to tie into the hydrogen pipeline, and Shell Hydrogen and the property owner contracted with Air Products to perform the work.
Negotiations for the equipment lease and hydrogen supply agreement were delayed in late 2007, but issues were resolved in mid-2008. Detailed design of the fueling equipment for the Gramercy location was initiated by Air Products at the direction of Shell Hydrogen, an activity which continued through the end of the period of performance. Shell Hydrogen completed negotiations on the land lease in early March 2009. Following the execution of the property lease, Air Products and Shell Hydrogen executed the equipment lease and hydrogen supply agreement on 27 March 2009.
Site Development and Permitting Activities
Shell Hydrogen was responsible for obtaining the necessary permits to construct and operation the hydrogen fueling station. Detailed design and permit activities began following the execution of the equipment lease and maintenance agreement on 27 March 2009. Due to the status of the proposed location at that time, a conditional use permit was required from the city of Torrance. Shell Hydrogen held an initial meeting with city officials on 17 June 2009, and the City of Torrance issued a conditional use permit at the Planning Commission hearing on 19 August 2009. Shell Hydrogen and their engineering design firm subsequently prepared (with input as required from Air Products) and submitted the documentation required to obtain the necessary permits.
Siting and Permitting Challenges
Several challenges surfaced during the siting and permitting process. At the Normandie location, it was difficult to find the appropriate space at a retail gasoline station due to the amount of equipment required on the site. This problem was mitigated by the approach taken by Shell Hydrogen -- negotiating with an adjacent property owner to lease property for the gas clean-up, compression and storage systems.
Upon relocation of the station to the Gramercy site, a key element of the permitting effort was the local community outreach. Air Products and several automakers supported Shell Hydrogen’s efforts to conduct outreach related to the proposed station and the benefits to the community. The key event prior to the 19 August 2009 Torrance Planning Commission hearing was an open house that was held on 6 August 2009 and attended by the mayor of Torrance, city council members, the president of a local homeowner’s association and several residents. These sorts of efforts will likely continue to be needed as part of the hydrogen station permitting process for to inform and educate key stakeholders in the various communities.
Construction and Installation
Air Products was responsible for providing construction management and procuring a contractor to install the equipment items within Air Products’ scope of supply. The construction manager was responsible for managing Air Products personnel and contractors, ensuring the installation was done safely within specification, within budget, and on schedule. Shell Hydrogen provided overall management of the construction site.
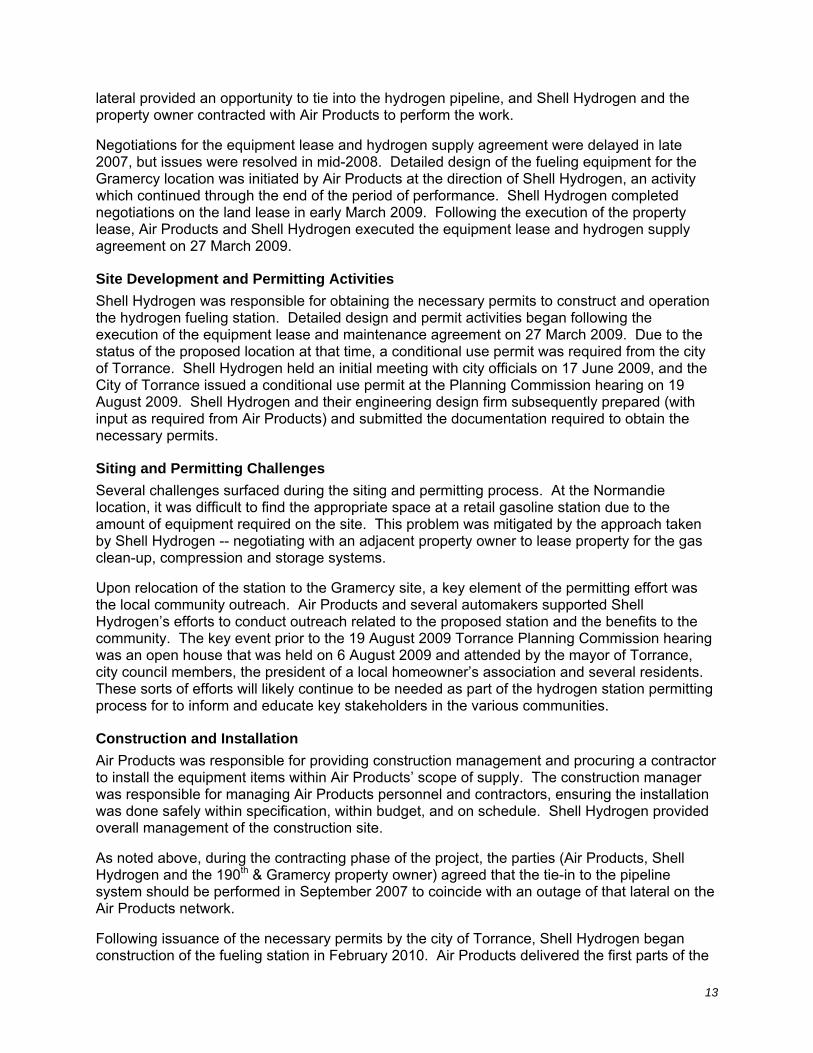
As noted above, during the contracting phase of the project, the parties (Air Products, Shell Hydrogen and the 190th & Gramercy property owner) agreed that the tie-in to the pipeline system should be performed in September 2007 to coincide with an outage of that lateral on the Air Products network.
Following issuance of the necessary permits by the city of Torrance, Shell Hydrogen began construction of the fueling station in February 2010. Air Products delivered the first parts of the

14
fueling station equipment in April 2010; the last of the equipment items (15,000 psig storage vessels) were not installed until November 2010 due to delays in fabrication. Construction of the pipeline station was completed on 12 November 2011.
Commissioning and Training
The commissioning process started during the week of 15 November 2010. A bulk hydrogen tube trailer was brought in for the initial purge and fill of the storage tubes prior to commissioning the pipeline tie-in.
As part of the pipeline supply commissioning, the gas exiting the membrane purifiers was analyzed on 24 November 2010. Carbon monoxide was detected in the parts-per-million range, which indicated a problem with the clean-up system. Further inspection revealed that the units were damaged due to improper isolation of the membranes during pressure testing of the surrounding piping. The membrane modules were removed and shipped to the manufacturer, and the repaired components were reinstalled in early January 2011. Analysis of effluent gas on 15 February 2011 showed no contaminants at the detection limit of the analytical methods, which more than met the current requirements for fuel cell electric vehicles.
As part of the station acceptance testing, Shell Hydrogen led a series of tests to include dispenser functionality, site alarm systems, and shutdown systems. Air Products participated in these tests, and also worked with Shell Hydrogen to complete the initial training on the operation of the dispenser systems.
An element that was added to the project to enhance the safety and operability of this station was the testing of a radio frequency identification (RFID) system, for which an antenna was installed on two of the dispenser nozzles (one H35, one H70) and the tags were installed on the vehicle near the receptacle. Air Products, Shell Hydrogen, Toyota, Honda and the California Fuel Cell Partnership participated in this effort, which was called the Hydrogen Vehicle Authorization System (HVAS). From an automaker perspective, the RFID system could be used to allow the dispenser to identify a specific vehicle type and utilize a fill protocol that may allow for a faster fill than a standard, default algorithm. From the station perspective, the reading from an RFID tag can provide additional confirmation (beyond measures such as PIN numbers or cards) that the vehicle is rated for the pressure at which fuel can be delivered.
Several automakers have developed specific tests of fueling station equipment, checks that are required prior to allowing their vehicles to use the station. These tests were coordinated with Shell Hydrogen and completed as part of the station commissioning and initial operating phases of the project. One of these tests demonstrated the capability of the station to simultaneously fuel four vehicles (two each at H35 and H70). Figure 9 shows a picture taken during this test in February 2011. Commissioning activities at the pipeline station were completed on 25 February 2011. As part of the equipment lease and maintenance contract and terms associated with funding from the US DOE, Air Products notified Shell Hydrogen that station operation in support of the DOE and AQMD programs would begin as of 1 March 2011.

15
Figure 9. Testing of simultaneous fueling at the Torrance pipeline station, February 2011.
Operation and Maintenance
Air Products was responsible for providing labor and material required to perform routine maintenance and repair of the Air Products-owned portions of the hydrogen supply system in accordance with the company’s standard operating procedures. In addition to preventative maintenance, Air Products also provided additional maintenance support when indicated by either system telemetry or calls from Shell Hydrogen or station users.
A station opening ceremony was held on 10 May 2011. Speakers included representatives from Air Products, Shell Hydrogen and Toyota. Representatives from AQMD were also in attendance, and AQMD was recognized by Air Products for its participation and support of the station project. A photograph from the event is provided in Figure 10.
Figure 10. Torrance hydrogen station opening,10 May 2011.

16
Following the 1 March 2011 opening of the pipeline station, Shell Hydrogen began coordinating with automakers to complete any testing and training required for customers to begin using the station. Since data within the first month included some test fills, cumulative results from the station were reported starting with data in April 2011.
Automakers in proximity to the station include Toyota and Honda (both have major facilities within 2 miles), General Motors and Daimler (both have operations nearby), and Hyundai and Mazda vehicles have fueled at the station. Use of the station by all of these automakers has increased since the station was brought online. Figure 11 shows the number of fueling events per month at the Torrance pipeline hydrogen station. A total of 2,732 fueling events (both H35 and H70) were completed during the reporting period. Demand at the station increased over time, and the total fueling activity often matched the number of fueling events at the UC Irvine station, which exhibited high usage since its start-up in 2006-2007.
Figure 11. Fueling events at the Torrance pipeline hydrogen station.
During the definition of the station equipment requirements, Shell Hydrogen decided that they did not want flow meters installed as part of the dispenser system. This was because there was not a certified flow meter capable of meeting accuracy requirements for sale of hydrogen on a unit basis (for example, $ per kilogram). To provide an indication on the rate of change of hydrogen throughput at the station, Air Products utilized a calculation (also called a “virtual flow meter”) based on the change in pressure during each fueling, the effect of temperature on the flow of the hydrogen gas, and other considerations. This calculation has been used in other projects (e.g., the Five Cities program) to indicate relative demand at fueling stations.
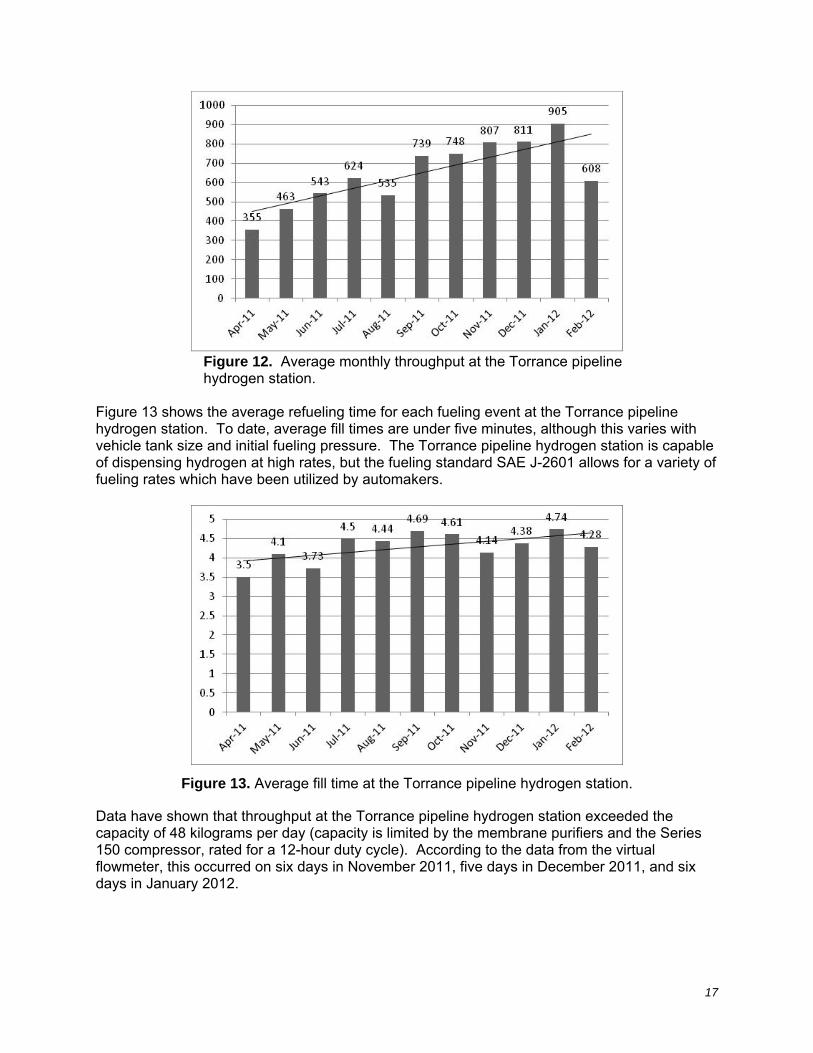
Figure 12 provides the average monthly amount of hydrogen dispensed at the Torrance pipeline station using the virtual flow meter calculation. As with the number of fueling events, relative throughput at the station increased, which is likely due to the fueling experience and high reliability of the station with multiple dispensers for each pressure level.
17
Figure 12. Average monthly throughput at the Torrance pipeline hydrogen station.
Figure 13 shows the average refueling time for each fueling event at the Torrance pipeline hydrogen station. To date, average fill times are under five minutes, although this varies with vehicle tank size and initial fueling pressure. The Torrance pipeline hydrogen station is capable of dispensing hydrogen at high rates, but the fueling standard SAE J-2601 allows for a variety of fueling rates which have been utilized by automakers.
Figure 13. Average fill time at the Torrance pipeline hydrogen station.
Data have shown that throughput at the Torrance pipeline hydrogen station exceeded the capacity of 48 kilograms per day (capacity is limited by the membrane purifiers and the Series 150 compressor, rated for a 12-hour duty cycle). According to the data from the virtual flowmeter, this occurred on six days in November 2011, five days in December 2011, and six days in January 2012.

18
Renewable Hydrogen Fueling Station (Tasks 8 and 2006-2.2) As part of Modification 007 to the Cooperative Agreement (30 September 2009), Air Products proposed the installation of a 100 kilogram per day hydrogen fueling station to be funded in part by the California Air Resources Board (CARB). This station was located at the Orange County Sanitation District in Fountain Valley, CA and was supplied by renewable hydrogen and electricity from a hydrogen energy station being developed and demonstrated under a separate project entitled “Validation of an Integrated System for a Hydrogen Fueled Power Park” (DOE Cooperative Agreement DE-FC36-01GO11087). In this task, Air Products designed, constructed and operated the hydrogen fueling station to provide hydrogen for a variety of fuel cell vehicles. This station continues to serve as a model for bringing renewable hydrogen to the light-duty fueling market.
The following equipment was provided by Air Products:
Quantity Description 1 Series 150 hydrogen compressor, design outlet pressure = 7,000
psig, design capacity = 4.25 kilograms per hour 3 Modular 3-packs of high-strength carbon steel 7,777 psig gaseous
hydrogen storage vessels, total capacity = 156 kilograms 1 Series 700 hydrogen compressor, design outlet pressure = 13,500
psig, design capacity = 50 kilograms per hour 1 Modular 2-pack of hoop-wrapped carbon steel 15,000 psig gaseous
hydrogen storage vessels, total capacity = 20 kilograms 1 Dual H35/H70 hydrogen dispensers, including controls for
simultaneous fueling operation 1 Refrigeration system for H70 cooling 1 Cellular telemetry remote monitoring system
Air Products’ responsibilities for this station are summarized below: GENERAL
1. Conduct site visit/evaluation. 2. Support UCI in obtaining required state and local installation and operating permits. 3. Provide the foundation design, including all underground pipes, drains, and conduits. 4. Provide site layout, design safety assessment (i.e., HAZOP), and non-proprietary process
flow diagrams. 5. Provide electrical load list and basic electrical single-line diagram. 6. Complete the design (including construction drawings and drawing approval) of any
foundations/equipment and pads/grouting, as required. 7. Complete the design (including construction drawings and drawing approval) of any new
field piping within the battery limits, as required. 8. Procure and coordinate shipment of all major equipment to the customer's installation site. 9. Provide equipment manual(s) and operating procedure(s).
10. Provide system review and safety orientation to the customer's operating personnel and local officials. Two classes on consecutive days will be provided as part of the original contract.

19
MECHANICAL/CIVIL 1. Schedule and coordinate a crane/rigging contractor to off load all major equipment at the
customer's site. 2. Perform all possible shop prefabrication of system pipeline components and cleaning of all
liquid hydrogen system components prior to arrival on-site at customer’s facility. 3. Remove the existing station equipment and associated above-ground obstructions that
interfere with the siting of new fueling equipment. 4. Perform the mechanical installation of the hydrogen fueling equipment. 5. Provide any new civil/structural work required within the battery limits. 6. Provide all materials not explicitly highlighted under the customer's scope of work to
commission and start up the fuel station and liquid hydrogen supply systems in accordance with Air Products’ specifications and standards. Conduct an Operational Readiness Inspection (ORI). Pressure/leak test system field-installed piping. Cool down and first fill the cryogenic storage vessel immediately following the
installation of the supply equipment. Initiate hydrogen supply by commissioning the liquid hydrogen supply system
following the first fill of the storage vessel. ELECTRICAL
1. Complete any designs (including construction drawings and drawing approval) required to supply system utilities to the battery limits and any underground services, as required.
2. Perform the instrumentation and electrical installation of the hydrogen fueling equipment. CONSTRUCTION
1. Provide construction and safety supervisory labor to oversee installation, commissioning and start-up of the items within Air Products’ scope of supply.
2. Coordinate safety training with external Air Products contractors. Construction and Installation at OCSD
As part of the evolution of the second Cooperative Agreement (DE-FC36-01GO11087), DOE requested that the objectives be modified to change the feedstock for Phase 4 operation from natural gas to a renewable feedstock. Work began in 2006 to identify a host site to meet this objective. After a detailed survey of existing hydrogen consumers and availability of feedstock for the fuel cell, Air Products began negotiations with the Orange County Sanitation District (OCSD), the municipal wastewater treatment entity that serves many of the communities in the Orange County, CA area. This site produces anaerobic digester gas (ADG), which is fed to combustion engines for power generation. Between 5% and 10% of the gas from one of CARB’s two water treatment plants would be needed to provide the required fuel for the fuel cell. However, this site had no existing use of hydrogen.
To develop a use for hydrogen, Air Products incorporated two proposals into a 2008 solicitation from CARB: 1) funding toward the installation and operation of the hydrogen energy station, and 2) installation of a hydrogen refueling station in a publicly-accessible area of the OCSD complex (in fact, the hydrogen dispenser would be co-located with an existing compressed natural gas dispenser). CARB notified Air Products of its selection for the proposed installation at OCSD in June 2008, and the agreement was executed in May 2009. As part of the agreement with CARB, an operating period of three years was required.
Figure 14 shows the integration of the hydrogen energy station into the OCSD wastewater treatment facility. Equipment associated with fuel treatment, hydrogen compression, storage and dispensing was part of the CARB program.

20
Figure 14. Overview of hydrogen production from anaerobic digester gas via the hydrogen energy station. Items outside the dashed line are existing equipment items.
The hydrogen energy station had to be integrated into the existing layout of the OCSD facility, with proximity to tie-ins for digester gas, natural gas, water and other utilities. After several iterations, Air Products and OCSD negotiated an access agreement for siting of the hydrogen energy station. As shown in Figure 15, the fueling station would be located approximately 1,100 feet from the hydrogen production area.
Figure 15. Relative locations of the hydrogen energy station and hydrogen fueling station.
The equipment arrangement for the hydrogen fueling station is provided in Figure 16.
Sludge
Storage Tank
Heat Exchanger
Sludge Digestion
Tank
AnaerobicDigestion Gas Holder
ADG
AC Power
HydrogenHydrogen Storage
HydrogenDispenser
Hot Water
Energy StationFuel Treatment
Hydrogen fueling station
Hydrogen energy station

21
Figure 16. Equipment arrangement for the hydrogen fueling station at OCSD.
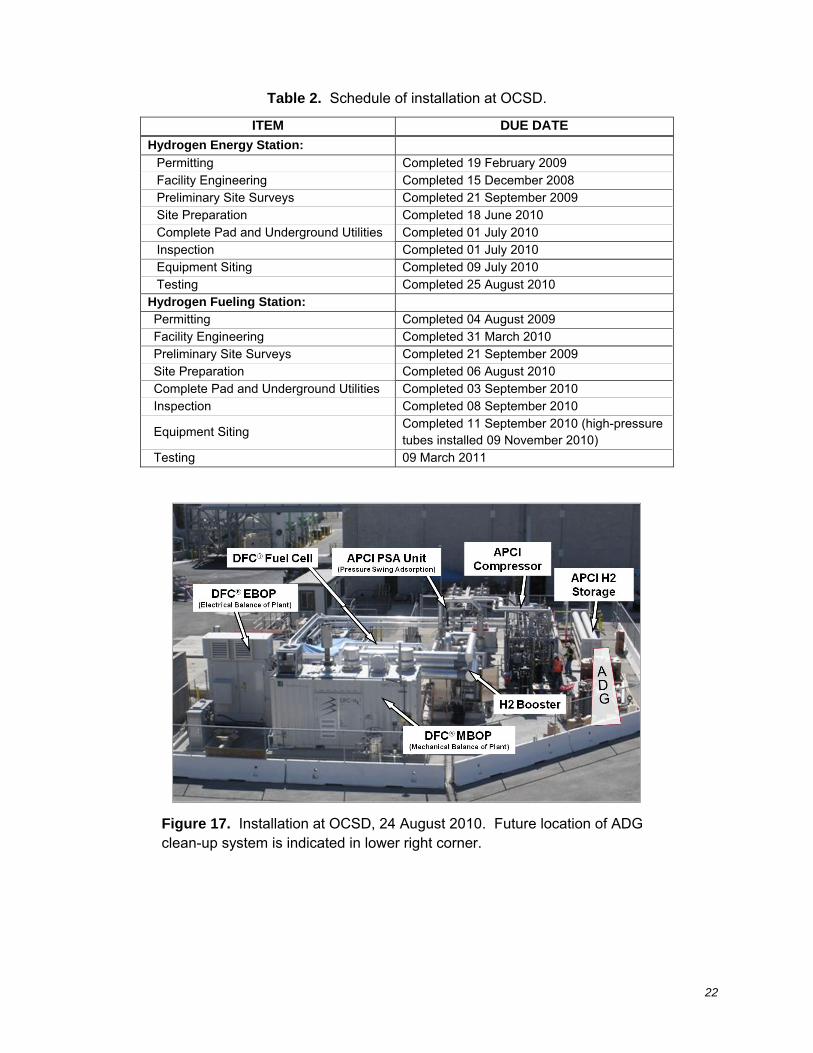
Since the hydrogen fueling station was being located in a publicly-accessible location, permits with the City of Fountain Valley were required. A meeting was held on 3 September 2009 with the staff from the Fountain Valley Planning Commission office. City officials also visited the CHIP hydrogen fueling station at UC Irvine on 16 September 2009 to gain a better understanding of the equipment within the hydrogen fueling station. A hearing regarding the conditional use permit for the fueling station was held on 14 October 2009, at which time this permit was granted. Table 2 provides a summary of the schedule for permitting, design and equipment at OCSD. Figures 17 and 18 show the installation of various elements of the hydrogen fueling station. During fueling station commissioning, which began on 29 November 2010, hydrogen was supplied via tube trailer as is the case at most locations. Figure 19 shows the completed installation of the hydrogen energy station prior to commissioning at OCSD. The ADG clean-up system was not available until May 2011, so natural gas was used to begin the operating phase of the project in September of 2010.
22
Table 2. Schedule of installation at OCSD.
ITEM DUE DATE
Hydrogen Energy Station: Permitting Completed 19 February 2009 Facility Engineering Completed 15 December 2008 Preliminary Site Surveys Completed 21 September 2009 Site Preparation Completed 18 June 2010 Complete Pad and Underground Utilities Completed 01 July 2010 Inspection Completed 01 July 2010 Equipment Siting Completed 09 July 2010 Testing Completed 25 August 2010
Hydrogen Fueling Station: Permitting Completed 04 August 2009 Facility Engineering Completed 31 March 2010 Preliminary Site Surveys Completed 21 September 2009 Site Preparation Completed 06 August 2010 Complete Pad and Underground Utilities Completed 03 September 2010 Inspection Completed 08 September 2010
Equipment Siting Completed 11 September 2010 (high-pressure tubes installed 09 November 2010)
Testing 09 March 2011
Figure 17. Installation at OCSD, 24 August 2010. Future location of ADG clean-up system is indicated in lower right corner.

23
Figure 18. Installation of hydrogen fueling station equipment at OCSD, October 2010.
Figure 19. Hydrogen fueling station at OCSD.
Wastewater treatment plants can generate anaerobic digester gas (ADG) which contains contaminants that must be removed before the ADG can be used as a fuel source for generating syngas. It is difficult to remove these contaminants, which include siloxanes, hydrogen sulfide, methanol and ammonia. Siloxanes, also known as organosilicons, are a family of chemical compounds that can seriously damage all forms of generation systems. Widely used in toiletries and cosmetics, siloxanes find their way into municipal wastewater streams and are not broken down during the anaerobic digestion process.
24
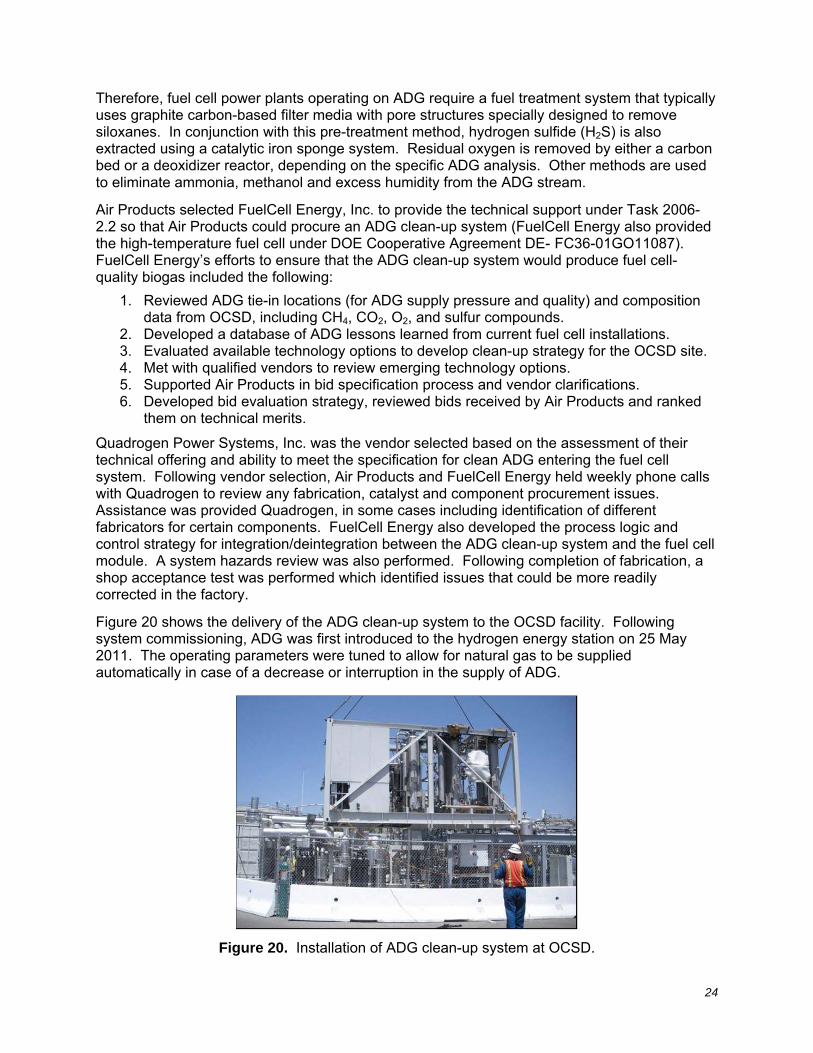
Therefore, fuel cell power plants operating on ADG require a fuel treatment system that typically uses graphite carbon-based filter media with pore structures specially designed to remove siloxanes. In conjunction with this pre-treatment method, hydrogen sulfide (H2S) is also extracted using a catalytic iron sponge system. Residual oxygen is removed by either a carbon bed or a deoxidizer reactor, depending on the specific ADG analysis. Other methods are used to eliminate ammonia, methanol and excess humidity from the ADG stream.
Air Products selected FuelCell Energy, Inc. to provide the technical support under Task 2006-2.2 so that Air Products could procure an ADG clean-up system (FuelCell Energy also provided the high-temperature fuel cell under DOE Cooperative Agreement DE- FC36-01GO11087). FuelCell Energy’s efforts to ensure that the ADG clean-up system would produce fuel cell-quality biogas included the following:
1. Reviewed ADG tie-in locations (for ADG supply pressure and quality) and composition data from OCSD, including CH4, CO2, O2, and sulfur compounds.
2. Developed a database of ADG lessons learned from current fuel cell installations. 3. Evaluated available technology options to develop clean-up strategy for the OCSD site. 4. Met with qualified vendors to review emerging technology options. 5. Supported Air Products in bid specification process and vendor clarifications. 6. Developed bid evaluation strategy, reviewed bids received by Air Products and ranked
them on technical merits.
Quadrogen Power Systems, Inc. was the vendor selected based on the assessment of their technical offering and ability to meet the specification for clean ADG entering the fuel cell system. Following vendor selection, Air Products and FuelCell Energy held weekly phone calls with Quadrogen to review any fabrication, catalyst and component procurement issues. Assistance was provided Quadrogen, in some cases including identification of different fabricators for certain components. FuelCell Energy also developed the process logic and control strategy for integration/deintegration between the ADG clean-up system and the fuel cell module. A system hazards review was also performed. Following completion of fabrication, a shop acceptance test was performed which identified issues that could be more readily corrected in the factory.
Figure 20 shows the delivery of the ADG clean-up system to the OCSD facility. Following system commissioning, ADG was first introduced to the hydrogen energy station on 25 May 2011. The operating parameters were tuned to allow for natural gas to be supplied automatically in case of a decrease or interruption in the supply of ADG.
Figure 20. Installation of ADG clean-up system at OCSD.

25
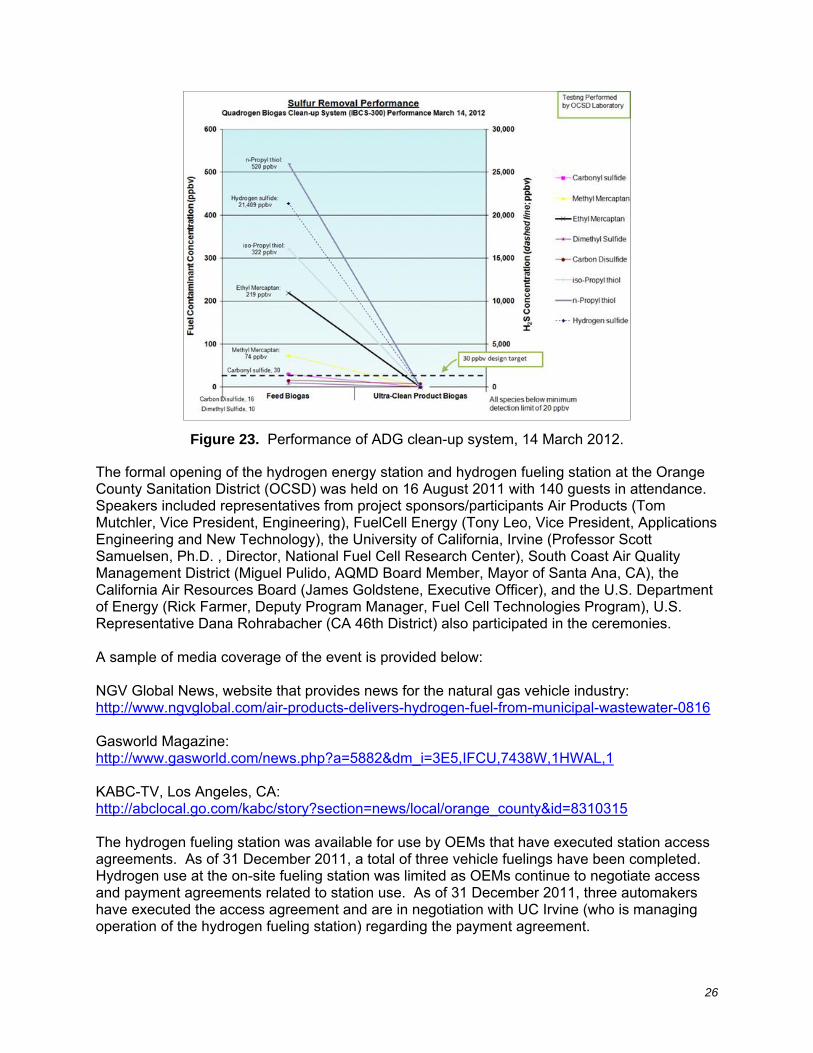
Figures 21 through 23 show analytical results for the inlet and outlet streams around the ADG clean-up system. No breakthrough of any contaminants has been detected.
Figure 21. Performance of ADG clean-up system, 31 May 2011.
Figure 22. Performance of ADG clean-up system, 23 February 2012.
26
Figure 23. Performance of ADG clean-up system, 14 March 2012.
The formal opening of the hydrogen energy station and hydrogen fueling station at the Orange County Sanitation District (OCSD) was held on 16 August 2011 with 140 guests in attendance. Speakers included representatives from project sponsors/participants Air Products (Tom Mutchler, Vice President, Engineering), FuelCell Energy (Tony Leo, Vice President, Applications Engineering and New Technology), the University of California, Irvine (Professor Scott Samuelsen, Ph.D. , Director, National Fuel Cell Research Center), South Coast Air Quality Management District (Miguel Pulido, AQMD Board Member, Mayor of Santa Ana, CA), the California Air Resources Board (James Goldstene, Executive Officer), and the U.S. Department of Energy (Rick Farmer, Deputy Program Manager, Fuel Cell Technologies Program), U.S. Representative Dana Rohrabacher (CA 46th District) also participated in the ceremonies. A sample of media coverage of the event is provided below: NGV Global News, website that provides news for the natural gas vehicle industry: http://www.ngvglobal.com/air-products-delivers-hydrogen-fuel-from-municipal-wastewater-0816 Gasworld Magazine: http://www.gasworld.com/news.php?a=5882&dm_i=3E5,IFCU,7438W,1HWAL,1 KABC-TV, Los Angeles, CA: http://abclocal.go.com/kabc/story?section=news/local/orange_county&id=8310315 The hydrogen fueling station was available for use by OEMs that have executed station access agreements. As of 31 December 2011, a total of three vehicle fuelings have been completed. Hydrogen use at the on-site fueling station was limited as OEMs continue to negotiate access and payment agreements related to station use. As of 31 December 2011, three automakers have executed the access agreement and are in negotiation with UC Irvine (who is managing operation of the hydrogen fueling station) regarding the payment agreement.

27
Innovative Hydrogen Supply/Distribution Stations (Tasks 2 and 4) BACKGROUND
The components of hydrogen infrastructure development involves the Well to Pump value chain (Figure 24) that comprises everything necessary to produce, distribute, and dispense hydrogen. For each step along the value chain, there are a number of options available for sourcing the necessary feedstock and energy to produce hydrogen, transporting hydrogen to market, storing hydrogen at the fueling site, and preparing hydrogen for dispensing into the vehicle fuel tanks.
Figure 24. Hydrogen fueling Well to Pump value chain.
The development of the Well to Pump value chain, required to transition to a hydrogen economy, is challenged by the high capital cost of infrastructure development against the uncertain penetration of hydrogen vehicles and the need for widespread access to hydrogen refueling stations. This has lead to hydrogen fueling station development that leverages both centralized hydrogen production and existing distribution infrastructure to serve industrialized markets. In this way, overall investment in hydrogen infrastructure development can be minimized. In essence, the early market strategy in California focuses investments on more hydrogen fueling station development since the investments in centralized hydrogen production and distribution tankers are already in place.
The initial pathways for supplying hydrogen to fueling stations have involved over-the-road transport of either liquid or gaseous compressed hydrogen using liquid tankers or tube trailers (Figure 25). Liquid hydrogen is delivered to a stationary customer site where it is off-loaded and stored as a liquid, then vaporized, compressed, and stored for eventual dispensing to fuel cell vehicles. With gaseous hydrogen, the tube trailer is left at the site to serve as the source of product supply. The hydrogen from the tube trailer is then compressed, stored for use, and dispensed to fuel cell vehicles.
Figure 25. Initial hydrogen fuel station pathways.
HYDROGEN FUELERS (Task 2.1)
An extension of the traditional hydrogen supply pathways to reduce hydrogen infrastructure development costs has been the HF-150 mobile fueler. The mobile fueler consists of an integrated, fully-automated gaseous hydrogen storage and dispensing system that sits on a wheeled trailer.
Feedstock
Prepare for
Transport
Transport
Site
Storage
Prepare For
Fueling
Dispense
Feedstock Transport
Produce And
Purify

28
The purpose of the mobile fueler was to provide customers with a means of fueling test automobiles and small auto fleets at any location, safely, and economically. Mobile fuelers are best positioned to take advantage of low-cost gaseous hydrogen supply available from large hydrogen production plants or networks serving industrial markets. Mobile fuelers can be filled at hydrogen production and storage sites that have high-pressure compression capabilities (Figure 26).
Figure 26. Mobile hydrogen fueler concept.
Figure 27 shows an HF-150 mobile fueler. It consists of eight high-strength, carbon steel 6,600 psig gaseous hydrogen storage vessels along with the following: an automated dispenser for H35 (350 bar) fueling; a power system utilizing a solar panel to recharge the unit’s battery; all valves and instrumentation needed for cascade vehicles fueling; and a cellular telemetry remote monitoring system.
Figure 27. HF-150 mobile hydrogen fueler.
The mobile fueler is a totally self-contained, DOT-compliant unit that does not require any utility connections at the fuel station site. Mobile fuelers provide the advantage of significantly reducing needed equipment and hydrogen fuel station site preparation (only a ground rod and location for an emergency stop button are required), as well as lowering both operating and hydrogen product costs.
The original project definition included construction of four mobile fuelers which were to be deployed to meet the fueling needs of the automakers. Fabrication of the project’s first HF-150 mobile fueler was completed in early 2006, and a second unit was completed in the second quarter of calendar year 2006. Air Products then worked with site owners at a variety of locations in northern and southern California, including a retail gasoline station in Westminster along Interstate 405 which was considered in early 2006 but ultimately not utilized due to space limitations. Air Products was able to negotiate access agreements to deploy the mobile fuelers at the two locations described below.

29
1) Long Beach, CA (Long Beach Gas & Oil, 2400 E. Spring Street)
The HF-150 mobile fueler was located at the Long Beach Gas & Oil facilities near Interstate 405. Following discussions with city officials, an access agreement was negotiated between the parties, and City Council unanimously approved the contract on 24 October 2006. Air Products then worked with the host site and city fire inspector regarding specific siting requirements to identify a suitable location adjacent to the municipal fueling facility. The fueling island is shown in Figure 28.
Figure 28. Fueling facilities at Long Beach Gas & Oil, 2400 E. Spring Street.
City officials approved installation of the mobile fueler behind the wall in a parking area used by visitors to the Long Beach Gas & Oil administration building (Figure 29). The system was installed and operational on 27 June 2007. Air Products then worked with automakers to negotiate the agreements needed to utilize the station. At the direction of host site officials, the HF-150 was removed on 13 March 2009. A total of 140 fills was performed.
Figure 29. Installation of the HF-150 at Long Beach Gas & Oil, 2400 E. Spring Street.
2) Placerville, CA (US Forest Service, 2350 Carson Road)
During the early stages of the project, Air Products was contacted by the US Forest Service (USFS) regarding their interest in gaining access to hydrogen fuel cell vehicles and refueling capability in the South Lake Tahoe, CA area. This community has a long-standing interest in demonstrating and deploying clean energy systems. Air Products began discussions with the USFS, and a potential host site was identified at the regional airport south of the city near Route 50. The USFS also contacted various automakers regarding the availability of fuel cell vehicles. Based on the challenges of low-temperature vehicle operation and fuel
30
delivery to the airport during the heavy snow season, the USFS attempted to organize a fueling and vehicle test program for the spring/summer months. However, contracts between the various parties could not be negotiated, and the project at the airport location was postponed in March 2008.
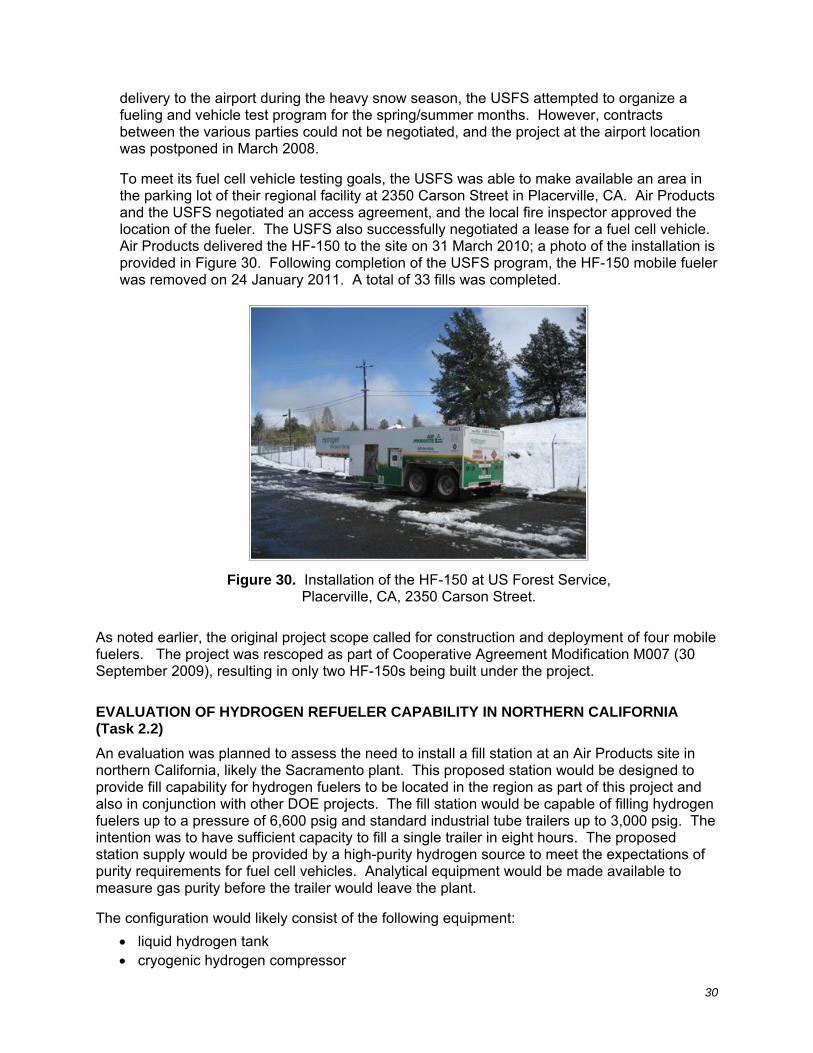
To meet its fuel cell vehicle testing goals, the USFS was able to make available an area in the parking lot of their regional facility at 2350 Carson Street in Placerville, CA. Air Products and the USFS negotiated an access agreement, and the local fire inspector approved the location of the fueler. The USFS also successfully negotiated a lease for a fuel cell vehicle. Air Products delivered the HF-150 to the site on 31 March 2010; a photo of the installation is provided in Figure 30. Following completion of the USFS program, the HF-150 mobile fueler was removed on 24 January 2011. A total of 33 fills was completed.
Figure 30. Installation of the HF-150 at US Forest Service, Placerville, CA, 2350 Carson Street.
As noted earlier, the original project scope called for construction and deployment of four mobile fuelers. The project was rescoped as part of Cooperative Agreement Modification M007 (30 September 2009), resulting in only two HF-150s being built under the project.
EVALUATION OF HYDROGEN REFUELER CAPABILITY IN NORTHERN CALIFORNIA (Task 2.2)
An evaluation was planned to assess the need to install a fill station at an Air Products site in northern California, likely the Sacramento plant. This proposed station would be designed to provide fill capability for hydrogen fuelers to be located in the region as part of this project and also in conjunction with other DOE projects. The fill station would be capable of filling hydrogen fuelers up to a pressure of 6,600 psig and standard industrial tube trailers up to 3,000 psig. The intention was to have sufficient capacity to fill a single trailer in eight hours. The proposed station supply would be provided by a high-purity hydrogen source to meet the expectations of purity requirements for fuel cell vehicles. Analytical equipment would be made available to measure gas purity before the trailer would leave the plant.
The configuration would likely consist of the following equipment:
liquid hydrogen tank cryogenic hydrogen compressor
31
control panel vaporizer one 3,000 psig fill stanchion one 6,600 psig fill stanchion
As reported to DOE in April 2006, Air Products recognized that the mobile fill system utilizing the liquid-gas delivery system (NDC trailer) being designed under Task 4 could provide a more flexible means to serve the fuel cell market. Specifically, these benefits included:
1. Increased reliability of supply to the HBU stations planned under Task 4 by having a second NDC trailer.
2. Increased reliability of supply for the existing HF filling station located in southern California (the NDC trailer could be sent to southern California and put into service if the fill station was out of service).
3. The ability to easily relocate an NDC trailer to other sites to better match market demand.
Because the project was rescoped as part of Cooperative Agreement Modification M007 (30 September 2009), no additional work was performed on this task.
HYDROGEN BASE UNITS (HBU) WITH NOVEL LIQUID-GAS DELIVERY SYSTEM (Task 4)
Overview of New Delivery Concept – Hydrogen Base Unit (NDC-HBU)
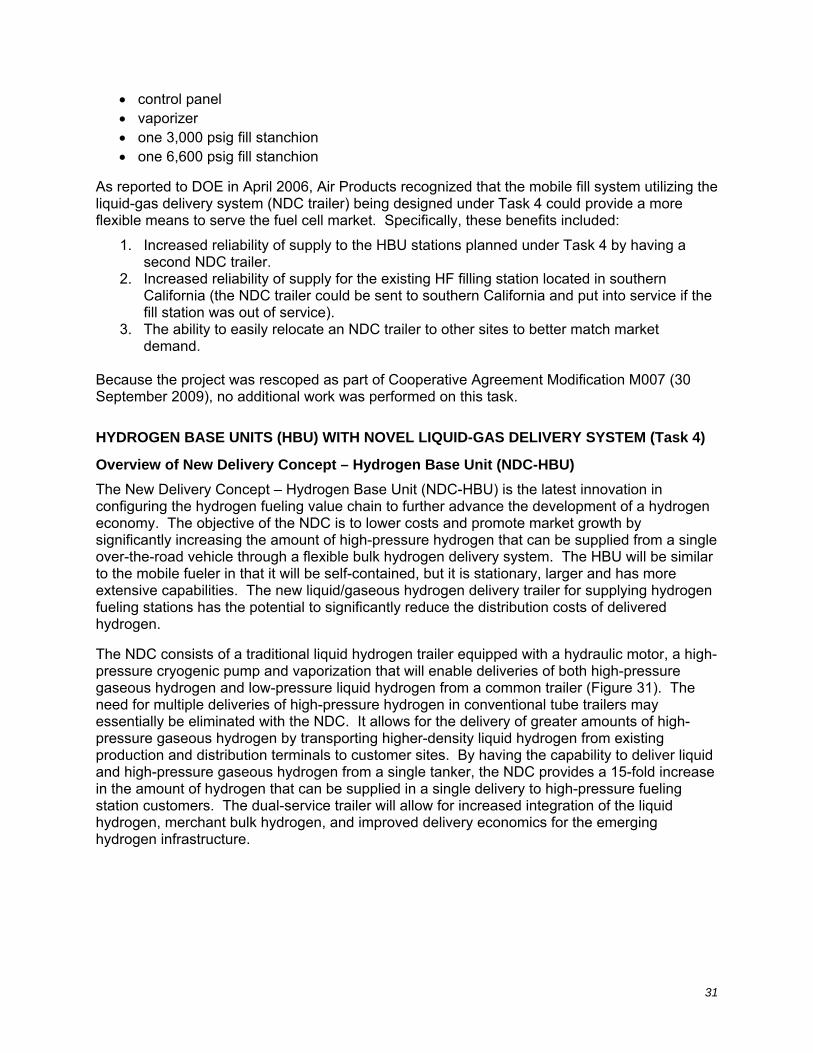
The New Delivery Concept – Hydrogen Base Unit (NDC-HBU) is the latest innovation in configuring the hydrogen fueling value chain to further advance the development of a hydrogen economy. The objective of the NDC is to lower costs and promote market growth by significantly increasing the amount of high-pressure hydrogen that can be supplied from a single over-the-road vehicle through a flexible bulk hydrogen delivery system. The HBU will be similar to the mobile fueler in that it will be self-contained, but it is stationary, larger and has more extensive capabilities. The new liquid/gaseous hydrogen delivery trailer for supplying hydrogen fueling stations has the potential to significantly reduce the distribution costs of delivered hydrogen.
The NDC consists of a traditional liquid hydrogen trailer equipped with a hydraulic motor, a high-pressure cryogenic pump and vaporization that will enable deliveries of both high-pressure gaseous hydrogen and low-pressure liquid hydrogen from a common trailer (Figure 31). The need for multiple deliveries of high-pressure hydrogen in conventional tube trailers may essentially be eliminated with the NDC. It allows for the delivery of greater amounts of high-pressure gaseous hydrogen by transporting higher-density liquid hydrogen from existing production and distribution terminals to customer sites. By having the capability to deliver liquid and high-pressure gaseous hydrogen from a single tanker, the NDC provides a 15-fold increase in the amount of hydrogen that can be supplied in a single delivery to high-pressure fueling station customers. The dual-service trailer will allow for increased integration of the liquid hydrogen, merchant bulk hydrogen, and improved delivery economics for the emerging hydrogen infrastructure.

32
Figure 31. New Delivery Concept - Hydrogen Base Unit.
The NDC works in conjunction with a HBU, which is very similar to the mobile hydrogen fueler. However, the NDC eliminates the need to pick up a trailer requiring hydrogen refueling, take it to an appropriate filling station, refill the trailer and deliver it back to the hydrogen fueling station. The HBU is a stationary storage and filling system that will be filled with the NDC and will typically be equipped with a separate Air Products hydrogen dispenser.
Air Products completed an analysis of the NDC-HBU concept in the second quarter of FY2006. The aim of this analysis was to provide guidance on the type of hydrogen fueling station that should be installed in a specific city based on the portfolio of hydrogen fueling stations commercially available to the market at that time. The analysis combined existing hydrogen supply infrastructure with hydrogen station design and cost to effectively position hydrogen fuelling stations at various locations to meet market demand at the lowest operating cost.
The overall methodology to evaluate the economics for the cases utilized a cost-to-serve model that assigned costs to each specific element of the supply chain with equal levels of return on infrastructure investment. The economic analysis combined hydrogen supply, market, and geography to determine the cost of hydrogen to support a given amount of hydrogen volume at a fueling station. The scenarios devised were intended to assess 1) the effect of the key variables that impact investment in hydrogen infrastructure development, and 2) how new innovations in the supply chain impact hydrogen fueling costs.
Based on the existing centralized hydrogen infrastructure in California, five hydrogen fueling station pathways were available and are illustrated in Figure 32. The portfolio of offerings consisted of four stationary fuelers (Series 100A air-driven, Series 100E electric-driven, Series 200L gas-supplied, Series 200 H liquid-supplied), one mobile fueler (HF-150), and the NDC-HBU. The supply scenarios incorporated centralized liquid hydrogen supply in Sacramento, compressed pipeline hydrogen in Wilmington, and compressed bulk hydrogen in both northern (Santa Clara) and southern (Los Angeles) California.

33
Figure 32. NDC-HBU study: Fueling station pathways.
Hydrogen consumption at existing fueling stations has been low in supporting early stage fuel cell development. In this analysis, two fueling station infrastructure development scenarios (100 and 1,000 kg /month) were prepared to provide a perspective on the impact fueling station volume, or market penetration, would have on hydrogen cost. Fueling stations were located from 25 to 500 miles from the centralized hydrogen supply locations.
Figure 33 illustrates the cost of hydrogen supply from the various fueling stations for a volume of 1,000 kilograms per month. From a product supply and distribution perspective, the results of the analysis clearly indicate the NDC-HBU provides the lowest evaluated cost of hydrogen. The mobile fueler was found to have the second-lowest cost, but its economic advantage is limited by the distribution distance from hydrogen supply. The mobile fueler is most cost-effective at distances no greater than 150-175 miles from the hydrogen source. Beyond this distance, the Series 100 and Series 200 stationary fuelers are more economical than the mobile fueler; however, the stationary fuelers are not lower-cost than the NDC-HBU.
Figure 33. NDC-HBU study hydrogen fuel station costs at the 1,000 kg/month scenario.

34
Conclusion
The New Delivery Concept-Hydrogen Base Unit (NDC-HBU) supply system from Air Products further advances the development of hydrogen infrastructure and will reduce the total evaluated cost of hydrogen at fueling stations. The NDC-HBU supply for hydrogen fueling infrastructure development strategically links existing hydrogen production, supply and distribution with cities and regions to improve the economics of hydrogen fueling station investment. The NDC works in conjunction with an HBU (very similar to the mobile hydrogen fueler) and provides significantly lower costs for hydrogen fuel station site preparation, equipment, and operation.
With the NDC-HBU, early-stage investment in hydrogen infrastructure development can be minimized and focused towards developing more hydrogen fueling stations. The expansion of HBU stations must be managed carefully, since on-site hydrogen production at large centralized production facilities with better proximity to a fueling station can sometimes provide a more economical solution than the NDC-HBU.
NOVEL LIQUID-GAS DELIVERY SYSTEM (Task 4)
Today, the costs to American consumers of fueling a vehicle with hydrogen or gasoline at the production source are essentially the same, but the delivery cost of hydrogen is significantly higher – making reducing delivery costs one of the hurdles to lowering hydrogen pricing. Thus, one of the most significant national highway benefits of this project was to demonstrate an innovative fuel delivery concept; to demonstrate for the first time in the U.S. that high-pressure hydrogen gas can be delivered utilizing a single delivery vehicle – a modified tanker that is self-contained to store and transport liquid hydrogen, compress the liquid hydrogen and off-load high-pressure gaseous hydrogen at the station site.
Hydrogen is currently delivered over the road in either liquid or gaseous form using “liquid tankers” or tube-cylinder trucks. Naturally, greater amounts of hydrogen can be delivered if it is in its higher-density liquid state compared to a compressed gas. When liquid hydrogen is delivered to a stationary customer site today, it is off-loaded and stored as a liquid, then vaporized and compressed for use at the site. However, as the demand for hydrogen fueling grows, there needs to be a means to deliver high-pressure gaseous hydrogen for consumer use while simultaneously leveraging the benefits of liquid transport. Air Products’ concept will allow for the delivery of liquid and high-pressure gaseous hydrogen from a single modified liquid “tanker,” resulting in a 10-fold increase in the amount of hydrogen that can be delivered in a single delivery to high-pressure gas customers. This concept will help reduce the overall cost of hydrogen to end users because numerous customers can be served from a single delivery vehicle, and the need for multiple deliveries of high-pressure gaseous hydrogen in tube trailers may essentially be eliminated.
An existing liquid hydrogen trailer in the Air Products fleet was selected in late 2005 for modification to add the cryogenic pump, vaporization and controls needed to produce high-pressure gas for delivery to storage systems such as the HBU. The design of the pump system (to achieve pressures as high as 7,000 psig) was completed in September 2006, and, following several iterations to the equipment arrangement, the fabrication of the NDC trailer was completed in January 2008. Figure 34 shows a picture of the NDC trailer.

35
Figure 34. NDC trailer.
To provide the power to operate the cryogenic pump, a tractor also had to be modified to interface with the NDC trailer. The scope of modifications for the tractor was completed in December 2007, and retrofit to an existing tractor was completed in March 2008. The completed system was then commissioned, and the NDC trailer was delivered to California in April 2008.
The NDC trailer has provided high-pressure hydrogen to a number of applications since its deployment. As shown in Figure 35, the NDC trailer can provide gaseous hydrogen to both stationary and mobile hydrogen storage applications. Offload rates of over 100 kilograms per hour have been achieved using the onboard cryogenic pump, with no requirement for any utilities from the delivery site.
Figure 35. Applications of the NDC trailer.
HYDROGEN BASE UNIT (Task 4)
One of the principal objectives of this project was to demonstrate the viability of lower-cost hydrogen and low-cost larger station deployment. A principal objective of this task was to establish at least two sites for hydrogen refueling in northern California using a new concept, the Hydrogen Base Unit (HBU), as defined earlier.
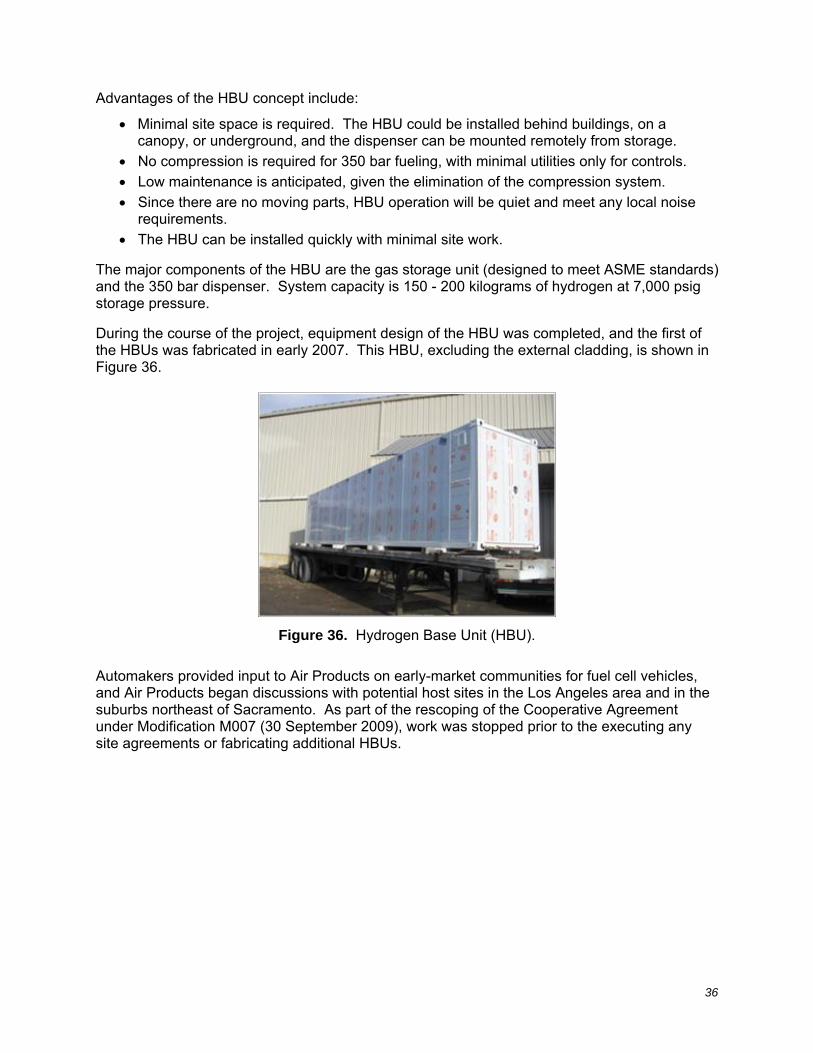
36
Advantages of the HBU concept include:
Minimal site space is required. The HBU could be installed behind buildings, on a canopy, or underground, and the dispenser can be mounted remotely from storage.
No compression is required for 350 bar fueling, with minimal utilities only for controls.
Low maintenance is anticipated, given the elimination of the compression system.
Since there are no moving parts, HBU operation will be quiet and meet any local noise requirements.
The HBU can be installed quickly with minimal site work.
The major components of the HBU are the gas storage unit (designed to meet ASME standards) and the 350 bar dispenser. System capacity is 150 - 200 kilograms of hydrogen at 7,000 psig storage pressure.
During the course of the project, equipment design of the HBU was completed, and the first of the HBUs was fabricated in early 2007. This HBU, excluding the external cladding, is shown in Figure 36.
Figure 36. Hydrogen Base Unit (HBU).
Automakers provided input to Air Products on early-market communities for fuel cell vehicles, and Air Products began discussions with potential host sites in the Los Angeles area and in the suburbs northeast of Sacramento. As part of the rescoping of the Cooperative Agreement under Modification M007 (30 September 2009), work was stopped prior to the executing any site agreements or fabricating additional HBUs.

37
Life Cycle Assessment (LCA) of Hydrogen Infrastructure and Fuel Cell Vehicle Technologies (Task 5) The evolution of a new hydrogen infrastructure and its enabling technologies allowed a special opportunity to apply a life cycle assessment (LCA) within this project. This will help guide the evolution of the hydrogen economy and avoid pathways that could lead to less than satisfactory results.
Staff from the National Fuel Cell Research Center’s (NFCRC) Advanced Power and Energy Program (APEP) at the University of California, Irvine worked with Air Products to gather and analyze infrastructure information during the project. This information was used to better understand expected siting locations, travel patterns, usage logistics, and new vehicle customer deployment. In addition, feedback on fueling station considerations, including operability requirements, desired features and general fueling concerns, was gathered to assess market criteria that will be used to develop a future hydrogen fueling station design. APEP used the relevant information to develop a detailed model that can be used to provide both economic and technical guidance for a full hydrogen infrastructure rollout, to be applied first in California and eventually to the entire nation.
Within this task, APEP applied its extensive experience to perform a systematic and systemic LCA of hydrogen infrastructure deployment, from generation to distribution to utilization. In particular, the LCA investigated technologies and technology evolution of interest to Air Products and its project collaborators. The study addressed LCA for both automobile and stationary power applications, with special emphasis on alternative options for hydrogen production and distribution. The study considered large reformers, small on-site reformers, and medium-sized generators serving a local region. The LCA considered a reasonable spectrum of energy sources, energy conversion technologies, energy carriers, and vehicle types.
The LCA was accomplished using the well-regarded SimaPro 6.0 software package that provided a professional tool to collect, analyze and monitor the environmental performance of products and services. This software package allowed simulation and analyses of complex life cycles in a systematic and transparent way following the ISO 14040 series recommendations. Many previous research groups have accomplished LCA analyses on fuel cells and hydrogen infrastructure development, and this study was built upon the results of selected relevant analyses. This effort was conducted with consideration given to existing H2A models by NREL; that is, all current work relevant to hydrogen infrastructure planning in general, and life cycle assessment in particular (e.g., NREL), was fully considered and included in this project’s study.
The result of this effort was the development of a novel tool, the preferred combination assessment (PCA) model, designed to analyze the impacts of an integrated hydrogen supply chain. The PCA model integrates the variety of hydrogen technologies and pathways into a comprehensive supply chain. The total demand for hydrogen in a region and the distances over which it must be delivered are two of the required inputs. Outputs include criteria pollutant emissions, greenhouse gas (GHG) emissions, energy consumption, and water consumption. The model is also compatible with existing cost analysis tools, providing as needed the opportunity to incorporate an economic examination. Figure 37 represents a simplified description of the model. The contribution by each technology option can be adjusted to explore how various permutations affect the outputs.
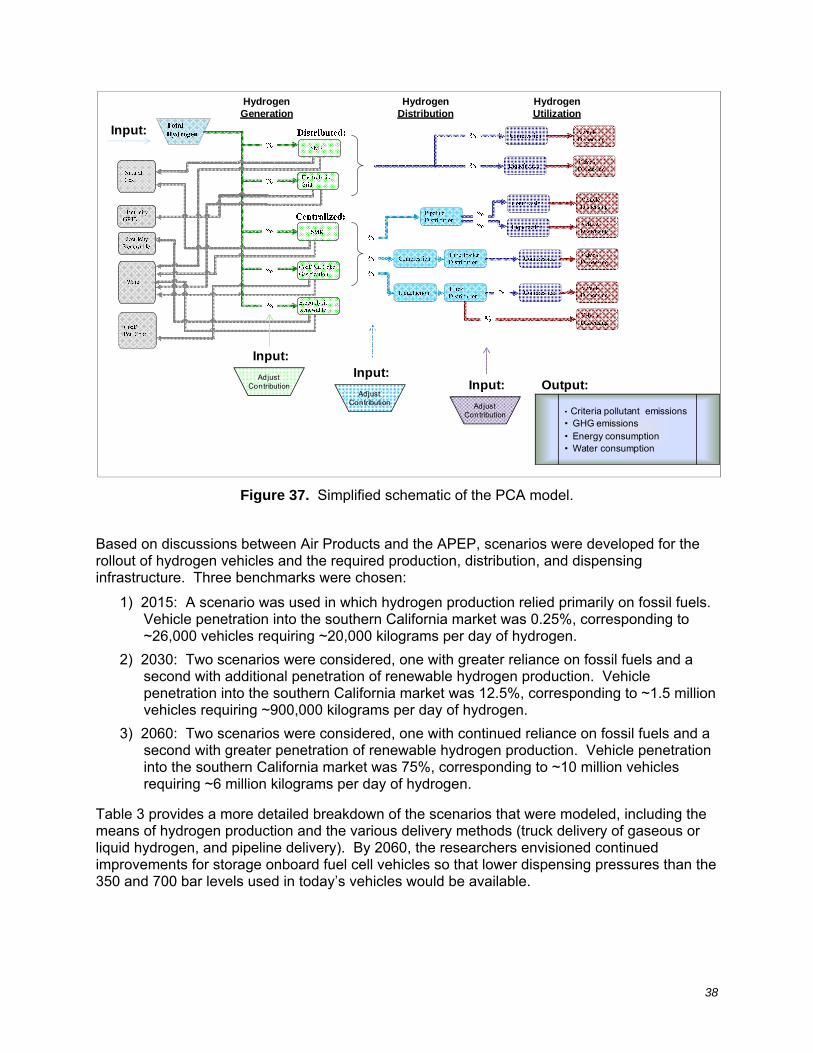
38
Figure 37. Simplified schematic of the PCA model.
Based on discussions between Air Products and the APEP, scenarios were developed for the rollout of hydrogen vehicles and the required production, distribution, and dispensing infrastructure. Three benchmarks were chosen:
1) 2015: A scenario was used in which hydrogen production relied primarily on fossil fuels. Vehicle penetration into the southern California market was 0.25%, corresponding to ~26,000 vehicles requiring ~20,000 kilograms per day of hydrogen.
2) 2030: Two scenarios were considered, one with greater reliance on fossil fuels and a second with additional penetration of renewable hydrogen production. Vehicle penetration into the southern California market was 12.5%, corresponding to ~1.5 million vehicles requiring ~900,000 kilograms per day of hydrogen.
3) 2060: Two scenarios were considered, one with continued reliance on fossil fuels and a second with greater penetration of renewable hydrogen production. Vehicle penetration into the southern California market was 75%, corresponding to ~10 million vehicles requiring ~6 million kilograms per day of hydrogen.
Table 3 provides a more detailed breakdown of the scenarios that were modeled, including the means of hydrogen production and the various delivery methods (truck delivery of gaseous or liquid hydrogen, and pipeline delivery). By 2060, the researchers envisioned continued improvements for storage onboard fuel cell vehicles so that lower dispensing pressures than the 350 and 700 bar levels used in today’s vehicles would be available.
• Criteria pollutant emissions• GHG emissions• Energy consumption• Water consumption
AdjustContribution
HydrogenGeneration
HydrogenDistribution
HydrogenUtilization
Input:
Input:
AdjustContribution
Input:
AdjustContribution
Input: Output:
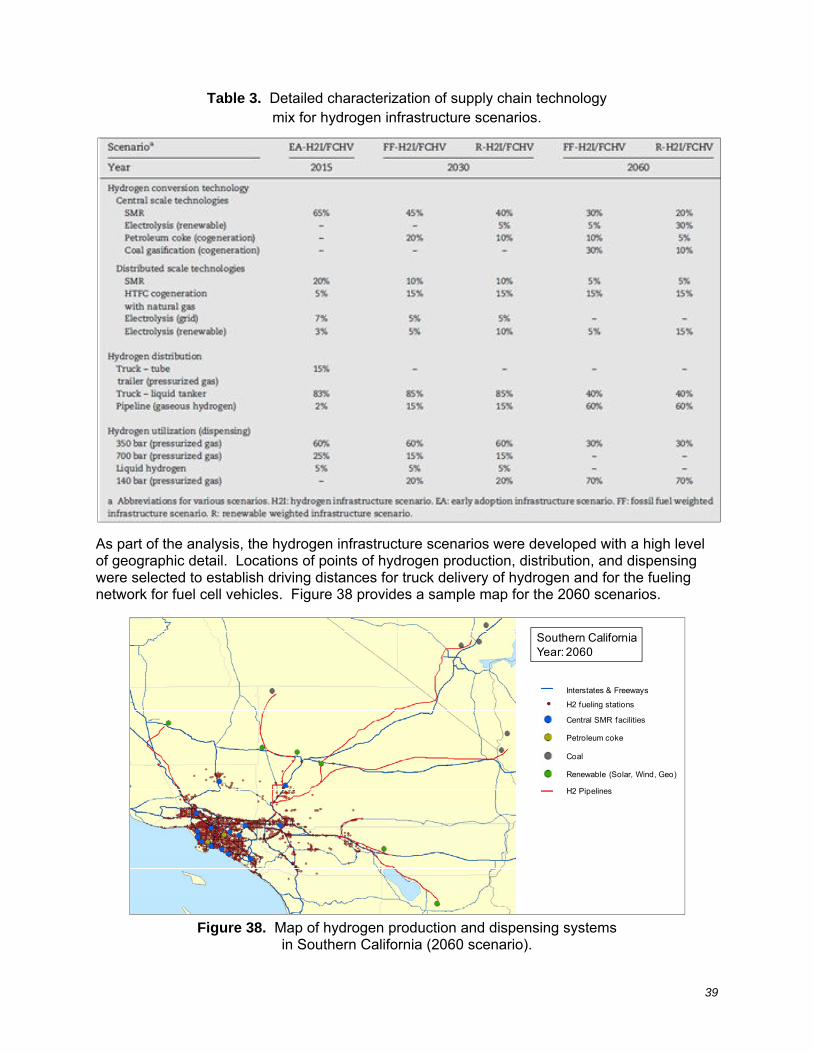
39
Table 3. Detailed characterization of supply chain technology mix for hydrogen infrastructure scenarios.
As part of the analysis, the hydrogen infrastructure scenarios were developed with a high level of geographic detail. Locations of points of hydrogen production, distribution, and dispensing were selected to establish driving distances for truck delivery of hydrogen and for the fueling network for fuel cell vehicles. Figure 38 provides a sample map for the 2060 scenarios.
Figure 38. Map of hydrogen production and dispensing systems
in Southern California (2060 scenario).
Interstates & Freeways
H2 fueling stations
Central SMR facilities
Petroleum coke
Coal
Renewable (Solar, Wind, Geo)
H2 Pipelines
Southern CaliforniaYear: 2060

40
As noted, the PCA model can provide results for a number of parameters of interest. Figure 39 shows the different levels of GHG emissions associated with different mixes of hydrogen production techniques in 2030 and 2060. Relatively small reductions in GHG levels (due to the 12.5% market penetration for hydrogen and the level of renewable hydrogen production) were calculated in 2030, and reductions in excess of 50% were determined in the 2060 time frame. Base emissions assumed continued use of gasoline fuels with expected improvements in fuel economy over the period of study.
Figure 39. GHG emissions with the adoption of hydrogen infrastructure in Southern California.
To determine changes in levels of criteria air pollutants (NOx, ozone, particulates, etc.), the APEP utilized the capabilities of the Computational Environmental Sciences Laboratory at the University of California, Irvine to simulate the air quality impacts. Figure 40 shows an overall flow chart for the interface of the PCA model with the environmental database; Figure 41 provides an estimate of the change in 2060 ozone levels with implementation of hydrogen infrastructure. Even though much of the infrastructure is located near the coast, air quality improvements are expected throughout the Los Angeles basin due to the topography and prevailing wind patterns.
0.0E+00
9.0E+04
1.8E+05
2.7E+05
3.6E+05
4.5E+05
2030 2060
Em
issio
ns in C
O2 e
quiv
ale
nts
(m
etr
ic t
ons /
day)
FF-H2IR-H2IConventional
GHG emissions
in CO2 equivalents
(metric tons per day)H2 Scenario 1 ( more fossil fuel)
H2 Scenario 2 (more renewable)
Conventional
12.5% adoption of hydrogen vehicles
75% adoption of hydrogen vehicles

41
Figure 40. Interface of PCA model with environmental database at UC Irvine.
Figure 41. Estimated change in ozone levels in the Los Angeles basin with rollout of fuel cell vehicles (2060 scenario).
Ozone: 8-hour average [ΔH2 vs. conventional]
Southern CaliforniaYear: 2060

42
Assessment of Technologies for Hydrogen Production from Non-Fossil Hydrogen Sources (Task 2006-2.1) As part of Amendment A002 to the Cooperative Agreement (26 September 2006), Air Products and DOE agreed to add project scope to evaluate emerging pathways for producing hydrogen from non-fossil hydrocarbon sources. One such pathway that was studied was the production of hydrogen via anaerobic digestion of wastewater. One such system was developed at the University of California, Davis (UC Davis) by Dr. Ruihong Zhang and her research team in the Biological and Agricultural Engineering Department. This system, called the Anaerobic Phased Solids Digester (APS-Digester) process, incorporates a new, high-rate bioconversion technology utilizing multiple reaction tanks to provide optimal conditions to convert waste materials into gaseous products. As a result, approximately 20-25% of the energy produced can be in the form of hydrogen, which can be separated from the gas stream as a high-value fuel for vehicles or power. Alternatively, co-production of hydrogen and methane yields fuels for specific uses, when produced in the right proportion or blended, to form a renewable, efficient H-CNG fuel.
Currently, commercial hydrogen production utilizes natural gas or petrochemical extracts as the energy source, releasing carbon dioxide (CO2), a greenhouse gas, in the process. However, hydrogen from biomass and waste materials would be produced with no net increase in CO2.
For Air Products, the intent of this task was to support the hydrogen production validation work for the APS commercial demonstration digester system at UC Davis. Specifically, Air Products was to provide support to develop, design and demonstrate commercial production of hydrogen from biomass and waste materials. Air Products was working with Onsite Power Systems, Inc., who had acquired the exclusive rights to the APS-Digester process from the University of California (patent # 6,342,378). Within Amendment A002, project elements were defined to include validation of process economics, laboratory assessment of biomass and waste materials, operation of a validation facility to confirm the laboratory findings, and system economic assessment and scale-up. These tasks were not undertaken, as the overall project was rescoped to support the development of a gas pretreatment skid to support the deployment of a hydrogen energy station to a wastewater treatment plant (under DOE Cooperative Agreement No. DE- FC36-01GO11087).

43
Cryogenically-Compressed Hydrogen (CCH) Study (Task 2006-3) Cryogenically-compressed hydrogen (CCH) is under development at the Lawrence Livermore National Laboratory (LLNL) and is also under evaluation as an inexpensive way to deliver compressed hydrogen. LLNL’s solution consists of advanced vessel technology that uses cryogenic-compatible pressure vessels for delivery trucks, fueling stations, and on-board vehicles. Air Products provided input to the LLNL effort under this task.
CCH lowers the energy intensity of hydrogen production by cooling hydrogen from a temperature of 300°K to only 200°K, for example. For hydrogen produced via steam methane reforming, gaseous crude hydrogen from the pressure swing adsorption (PSA) unit undergoes multiple stages of compression and cooling. Once the hydrogen is purified in the PSA, liquid nitrogen is used as a refrigerant to cool hydrogen to about -195°C (-320°F). Alternatively, a plant designed for CCH production may possibly pre-cool the feed hydrogen with carbon dioxide rather than liquid nitrogen. LLNL’s estimate of the actual work required for producing cryogenic-compressed hydrogen in this operating regime is 6 kWh/kg hydrogen3. At an average industrial electricity cost of $0.057/kWh, the energy savings in producing CCH is $0.342/kg of hydrogen.
In the area of hydrogen distribution, the objective of the LLNL program is to reduce the costs of both hydrogen delivery by truck and storage at refueling stations. LLNL’s focus has been on the thermodynamics and logistics of hydrogen storage and delivery to efficiently use capital and energy costs. LLNL’s viewpoint is that current liquid and bulk hydrogen delivery methods occupy extreme domains in hydrogen delivery strategies that impact energy and operating costs. Liquid hydrogen (LHY) is energy-intensive and bulk hydrogen (BHY) is operating-cost-intensive. In comparison to liquid and bulk hydrogen supply modes, LLNL believes that CCH is positioned as a better way to balance capital, energy, and operating costs.
LLNL also believes delivering hydrogen in a cooled state provides these additional multiple advantages:1
Colder hydrogen can reduce fast-fill onboard hydrogen vessel temperatures, improving range and/or easing vessel requirements and associated capital costs.
Colder hydrogen rises to a higher pressure when warmed, potentially reducing refueling station mechanical compression requirements.
Cooling hydrogen gas reduces its mechanical stored energy substantially, improving safety. This could potentially justify lower burst pressure ratios, with further reductions in vessel material costs and improved volumetric efficiency.
Lower temperatures substantially improve the fatigue strength of glass fibers by reducing or eliminating stress corrosion from water vapor.
Cryogenically-compressed hydrogen reduces hydrogen compression/liquefaction costs.
In the area of hydrogen distribution, the explicit benefit of CCH has been limited to liquefying and transporting hydrogen under traditional means. Air Products believes that in order to truly evaluate CCH, it is extremely important to understand the full impact of CCH on all elements of the hydrogen value chain. This includes production and purification, packaging or preparing hydrogen for transport, transport, site storage at the hydrogen forecourt, preparing hydrogen for fueling, and dispensing hydrogen into vehicles (Figure 42). To adequately compare CCH to alternative modes of hydrogen supply, the impact of CCH will be evaluated in respect to capital investment, energy costs, and operating costs across each component of the value chain.

44
Figure 42. Hydrogen fueling value chain.
As illustrated in Figure 43, the CCH product supply concept provides at least two hydrogen delivery pathways: 1) direct fueling of vehicles with CCH, and 2) fueling vehicles with compressed gaseous hydrogen. Fueling vehicles with CCH hydrogen from CCH site storage can be accomplished with direct cold gas fill capability. With the direct CCH fill method, a CCH compressor may be required with the stationary CCH storage tank to maintain tank pressure and ensure full vehicle fills. LLNL also claims that a fast-fill method for CCH at 200°K and 7,000 psi (475 bar) will result in vessel fills of 10,500 psi (715 bar) at 300°K. For the concept involving fueling vehicles with compressed hydrogen, it is envisioned that the cold CCH can be warmed to reduce fueling station mechanical compression requirements. If vehicles are filled with compressed hydrogen at 700 bar, a CCH booster compressor may be required.
Figure 43. Cryo-compressed hydrogen (CCH) forecourt delivery concepts.
The costs for preparing LHY for fueling will depend on whether hydrogen will ultimately be dispensed into the vehicles as a liquid, compressed gas, or cryo-compressed gas. Preparing either LHY or CCH for direct vehicle fill requires no special equipment and should be about equal in cost. However, if a compressor is required to maintain CCH tank pressure, LHY would have a cost advantage in direct vehicle fills.
LHY provides the advantage of offering hydrogen delivery to a vehicle across three hydrogen supply pathways: one for fueling vehicles with LHY, another for fueling with compressed hydrogen, and a third for fueling with CCH. LLNL’s claim is that a fast-fill of CCH at 200°K and 7,000 psi (and the resulting vessel fill of 10,500 psi at 300°K) can provide lower fuel preparation cost for CCH.
Comments provided by Air Products included the following:
Considering the insufficient amount of information on CCH in this area and the pathway for vehicle fueling, it difficult to determine what mode of supply is best. More work is needed to understand this area of the hydrogen fueling supply chain.

45
If the forecourt site storage of CCH is a single tank, will the system consistently dispense at 7,000 psig? Pressure will run low in the CCH storage tank and result in incomplete vehicle tank fills.
Beyond the scope of hydrogen production and purification, the CCH product would require storage at the hydrogen production facility. Materials of construction and means of fabrication (shop vs. site) for CCH storage tanks need to be developed.
Since CCH trailers will return to a production facility at higher temperatures than desired, the rejection of that heat needs to be considered. If there is gas present, there will be a heat of compression of the gas that must also be addressed. If a CCH trailer needs to be filled with LHY to address these heat balance issues, the cost savings of avoiding the LHY production step would be eliminated.
Dispensing CCH to vehicles will require an insulated and cryogenic connection rated at 7,000+ psig, which is a steep and costly challenge. The CCH fast-fill procedure calls for dispensing CCH to vehicles at 7,000 psig, and allowing pressure to build in order to achieve 10,000 psig. This requires that the on-board components be rated at temperatures of less than -100°F, but the current limit is -40°F in all specifications. As with the CCH trailer, questions must also be answered regarding the heat balance associated with the vehicle storage tank as well.
Other challenges include safety. LLNL’s advanced tank development efforts and intention to reduce the cost of hydrogen storage are expected to be derived from a change in qualification methodology applied after manufacture. LLNL believes that by replacing arbitrary safety factors with real fail statistics, it can save roughly 30% of costly structural mass. The conceptual design of the pressure vessel for its distribution trailer includes an isothermal burst pressure ratio of 1.7, comparable to a safety factor of 2.25 with allowed transient overpressures of 30% from fast-fill thermal rises1. The safety aspects of CCH storage must be thoroughly studied. Air Products’ initial concern is that the CCH vessel will not meet DOT requirements and would therefore need an exemption. A new concept like CCH faces regulatory hurdles.
Air Products’ work also included an assessment of next steps with respect to process engineering and tank development for consideration by DOE and LLNL. Air Products recommended that, as shown in Figure 44, activities should consider the application of CCH tank concept for on-board vehicle storage of CCH instead of production and transport. This is important to understand, because compared to CCH, LHY currently provides the most economical means of both hydrogen distribution and on-site storage.
Figure 44. Positioning of cryo-compressed hydrogen (CCH).
Position CCH ForwardTo Onboard Vehicle Storage
ProduceAnd
Purify
Preparefor
TransportTransport
SiteStorage
PrepareFor
FuelingDispense
Focus of LLNL’s CCH
VehicleStorage
Position CCH ForwardTo Onboard Vehicle Storage
ProduceAnd
Purify
Preparefor
TransportTransport
SiteStorage
PrepareFor
FuelingDispense
Focus of LLNL’s CCH
VehicleStorage
ProduceAnd
Purify
Preparefor
TransportTransport
SiteStorage
PrepareFor
FuelingDispense
Focus of LLNL’s CCH
VehicleStorage

46
Work on this task was suspended in late 2008 and as part of the 30 September 2009 modification to the Cooperative Agreement, no additional work was performed on this task.
References: 1. Aceves, S.M., Berry, G., and Weisberg A. V.D.1 Inexpensive Delivery of Compressed Hydrogen with Advanced Vessel
Technology, DOE Hydrogen Program, FY 2005 Progress Report. 2. An Economic Analysis of Three Hydrogen Liquefaction Systems, 1998 International Journal Hydrogen Energy, Vol. 23,
No. 7, pp 565-576. 3. DOE Delivery Tech Team Presentation, Lawrence Livermore National Laboratory, G. Berry and S. M. Aceves, February 8,
2005. 4. The Hydrogen Economy: Opportunities, Costs, Barriers, and R&D Needs, National Research Council and National
Academy for Engineering, National Academy of Sciences, 2004, pp 155-6. 5. Simbeck, D.R., Chang E., SFA Pacific, Inc. Hydrogen Supply: Cost Estimate for Hydrogen Pathways – Scoping Analysis,
NREL Report SR-540-32525, July 2002, p 19.
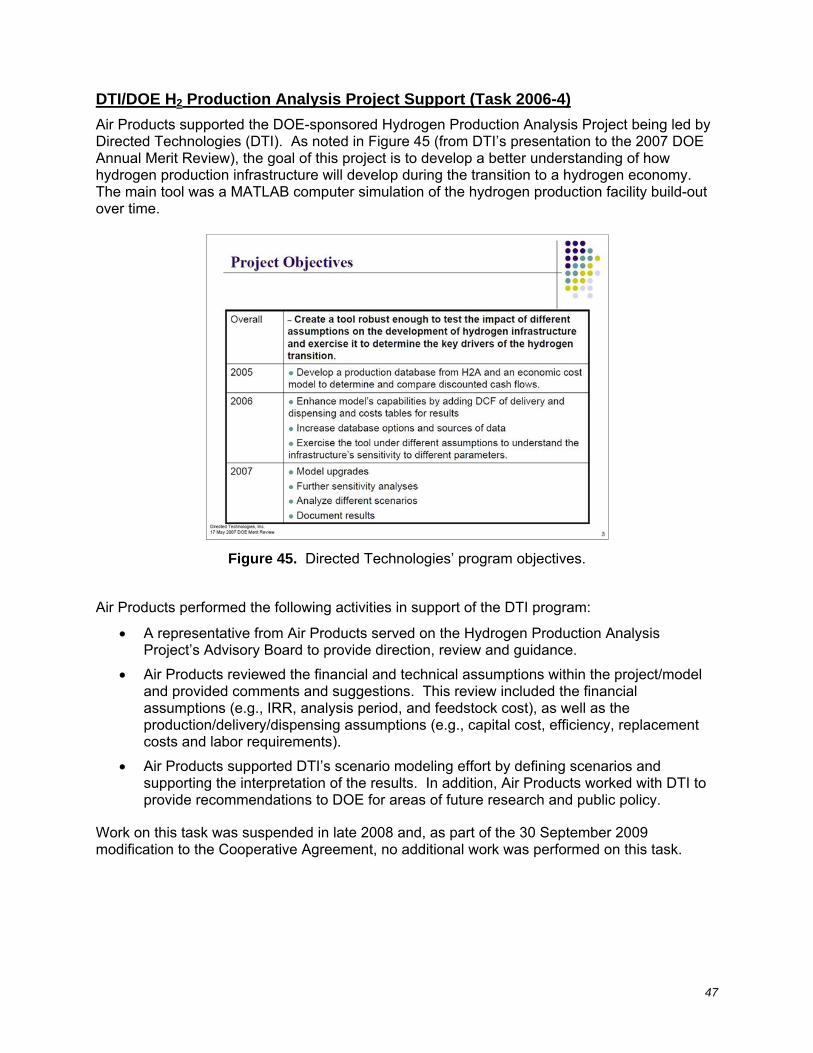
47
DTI/DOE H2 Production Analysis Project Support (Task 2006-4)
Air Products supported the DOE-sponsored Hydrogen Production Analysis Project being led by Directed Technologies (DTI). As noted in Figure 45 (from DTI’s presentation to the 2007 DOE Annual Merit Review), the goal of this project is to develop a better understanding of how hydrogen production infrastructure will develop during the transition to a hydrogen economy. The main tool was a MATLAB computer simulation of the hydrogen production facility build-out over time.
Figure 45. Directed Technologies’ program objectives.
Air Products performed the following activities in support of the DTI program:
A representative from Air Products served on the Hydrogen Production Analysis Project’s Advisory Board to provide direction, review and guidance.
Air Products reviewed the financial and technical assumptions within the project/model and provided comments and suggestions. This review included the financial assumptions (e.g., IRR, analysis period, and feedstock cost), as well as the production/delivery/dispensing assumptions (e.g., capital cost, efficiency, replacement costs and labor requirements).
Air Products supported DTI’s scenario modeling effort by defining scenarios and supporting the interpretation of the results. In addition, Air Products worked with DTI to provide recommendations to DOE for areas of future research and public policy.
Work on this task was suspended in late 2008 and, as part of the 30 September 2009 modification to the Cooperative Agreement, no additional work was performed on this task.

48
Novel Compressor Development (Task 2006-5)
As fuel cell vehicle manufacturers move toward fueling pressures approaching 700 bar (10,000 psi), a variety of ways have been investigated to achieve the required delivery pressure and flowrate. Existing gas compression technology can achieve these pressures, with cost, energy usage and footprint being key considerations.
Air Products has developed a unique compressor that utilizes a liquid medium to directly compress the gas. Benefits of this type of configuration are:
Hydrogen is cooled during the compression step, which limits the temperature rise to about 50 ºF.
With near-isothermal operation, there is no need for multiple compression stages with between-stage cooling to maintain proper operating temperatures for the compression systems. Use of a hydraulic piston permits high pressure ratios (up to 140:1, from 100 psi to 14,000 psi) to be achieved while eliminating concerns over piston-to-cylinder clearances within the compressor, as well as potential failure of materials due to exposure to high process temperatures.
No exotic materials or sophisticated machining are required.
Hydraulic pumps inherently lubricate all dynamic seals, which results in lower maintenance costs. Liquid pumps are already available to meet the pressure requirements.
No external cooling system is required, as a radiator on the hydraulic loop can maintain proper operating temperatures.
Since all dynamic gas seals are eliminated, there are no gas seals to the atmosphere, further reducing system maintenance.
Capital costs should be 50-75% less than conventional gas compression systems.
Potential issues for this type of technology include:
Fluid carryover needs to be minimized or eliminated to prevent negative impact on the fuel cell.
The potential for solubility of trace contaminants in the hydrogen stream (water, carbon dioxide, carbon monoxide) could impact operability of the system.
As with all fueling stations, availability of process vessels and instrumentation at operating pressures of 14,000 psi can be an issue.
Although the configuration should yield lower maintenance costs than gas compressor systems, long-term testing might be needed to identify other points where components could be an issue.
A prototype compressor (Figure 46) was built by Air Products under a Pennsylvania Department of Environmental Protection program with DOE. The unit has a small footprint (3’ length x 4’ width x 7’ height). The approach to Task 2006-5 was to continue this work and focus on achieving a leak-tight system with respect to both the process gas and hydraulic liquid circuits. Work began in late 2007 following execution of Modification M007 to the Cooperative Agreement.

49
During the initial phase, the system was function-tested to 4,000 psi, and, based on the observed leakage from the process, the compressor was disassembled so that component-level functional and leak testing could be performed. Due to excessive leakage rates, the compressor was disassembled, individual components were inspected and, in some cases, replaced or machined to different tolerances. This included the suction and discharge valve, piping manifold, and pump discharge connection. Based on these changes, a new safety relief valve was required.
Figure 46. Novel compressor.
With completion of these modifications, all issues of high-pressure leaks from machined components as were corrected, and the corrections have been proof-tested at the component and full-assembly levels to 20,000 psig. Upon reassembly of the compressor, it became necessary to relocate a heating element and modify a tank level indicator associated with the process fluid circuit.
To determine levels of process fluid entrainment, the compressor test discharge gas flow path was retrofitted with a fugitive oil capture system. The intent was to determine levels of fluid migration related to process conditions and optimize system operation to minimize fluid loss from the compressor. Following completion of these modifications, a hazard review was performed on the system, and other minor changes were recommended and implemented.
Work on this task was suspended in late 2008 and, as part of the 30 September 2009 modification to the Cooperative Agreement, no additional work was performed on this task.
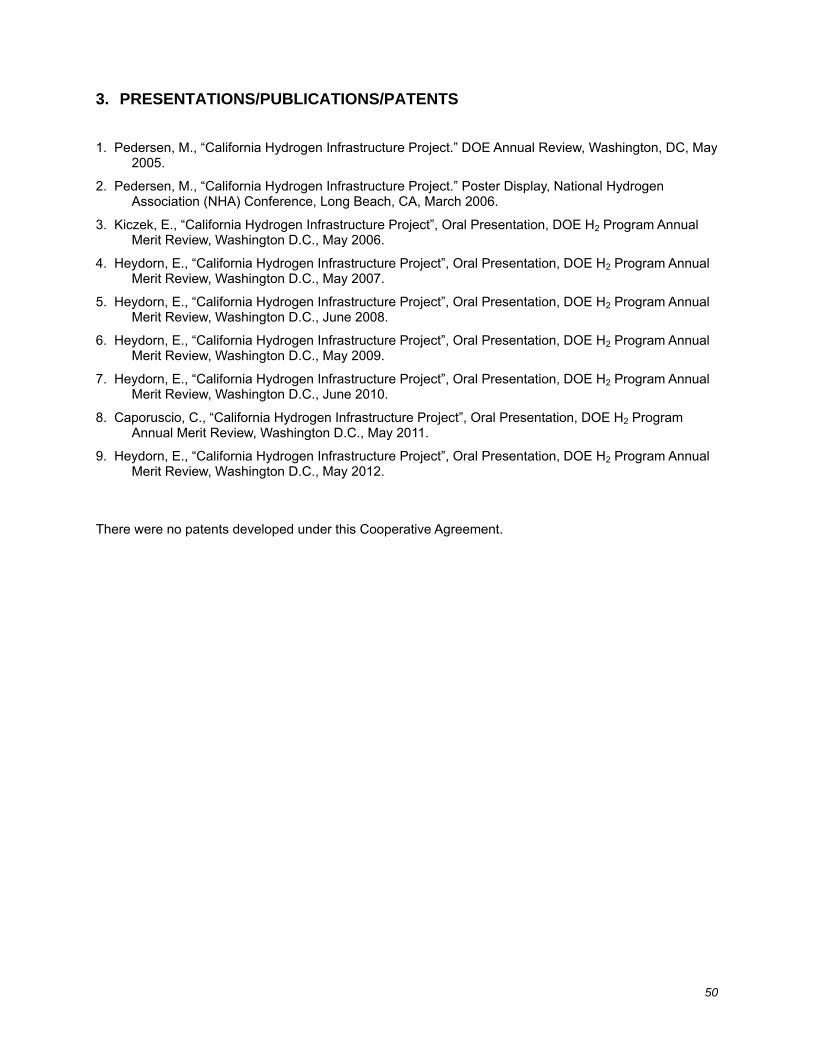
50
3. PRESENTATIONS/PUBLICATIONS/PATENTS
1. Pedersen, M., “California Hydrogen Infrastructure Project.” DOE Annual Review, Washington, DC, May 2005.
2. Pedersen, M., “California Hydrogen Infrastructure Project.” Poster Display, National Hydrogen Association (NHA) Conference, Long Beach, CA, March 2006.
3. Kiczek, E., “California Hydrogen Infrastructure Project”, Oral Presentation, DOE H2 Program Annual Merit Review, Washington D.C., May 2006.
4. Heydorn, E., “California Hydrogen Infrastructure Project”, Oral Presentation, DOE H2 Program Annual Merit Review, Washington D.C., May 2007.
5. Heydorn, E., “California Hydrogen Infrastructure Project”, Oral Presentation, DOE H2 Program Annual Merit Review, Washington D.C., June 2008.
6. Heydorn, E., “California Hydrogen Infrastructure Project”, Oral Presentation, DOE H2 Program Annual Merit Review, Washington D.C., May 2009.
7. Heydorn, E., “California Hydrogen Infrastructure Project”, Oral Presentation, DOE H2 Program Annual Merit Review, Washington D.C., June 2010.
8. Caporuscio, C., “California Hydrogen Infrastructure Project”, Oral Presentation, DOE H2 Program Annual Merit Review, Washington D.C., May 2011.
9. Heydorn, E., “California Hydrogen Infrastructure Project”, Oral Presentation, DOE H2 Program Annual Merit Review, Washington D.C., May 2012.
There were no patents developed under this Cooperative Agreement.