
Business Update August 5, 2021
20
Business Update August 5, 2021 Pinecrest Place | Miami, FL
Transcript of Business Update August 5, 2021

Business UpdateAugust 5, 2021
Pinecrest Place | Miami, FL

Safe Harbor and Non-GAAP DisclosuresForward-Looking StatementsCertain statements in this document regarding anticipated financial, business, legal or other outcomes includingbusiness and market conditions, outlook and other similar statements relating to Regency’s future events,developments, or financial or operational performance or results, are “forward-looking statements” madepursuant to the safe harbor provisions of the Private Securities Litigation Reform Act of 1995 and other federalsecurities laws. These forward-looking statements are identified by the use of words such as “may,” “will,”“should,” “expect,” “estimate,” “believe,” “intend,” “forecast,” “anticipate,” “guidance,” and other similar language.However, the absence of these or similar words or expressions does not mean a statement is not forward-looking. While we believe these forward-looking statements are reasonable when made, forward-lookingstatements are not guarantees of future performance or events and undue reliance should not be placed onthese statements. Although we believe the expectations reflected in any forward-looking statements arebased on reasonable assumptions, we can give no assurance these expectations will be attained, and it ispossible actual results may differ materially from those indicated by these forward-looking statements due to avariety of risks and uncertainties.Our operations are subject to a number of risks and uncertainties including, but not limited to, those Riskfactors described in our SEC filings. When considering an investment in our securities, you should carefullyread and consider these risks, together with all other information in our Annual Reports on Form 10-K,Quarterly Reports on Form 10-Q and our other filings and submissions to the SEC. If any of the eventsdescribed in the risk factors actually occur, our business, financial condition or operating results, as well as themarket price of our securities, could be materially adversely affected. Forward-looking statements are only asof the date they are made, and Regency undertakes no duty to update its forward-looking statements exceptas required by law. These risks and events include, without limitation:
Risks Related to the COVID-19 PandemicPandemics or other health crises, such as the COVID-19 pandemic, may adversely affect our tenants’ financialcondition, the profitability of our properties, and our access to the capital markets and could have a materialadverse effect on our business, results of operations, cash flows and financial condition.
Risk Factors Related to Operating Retail-Based Shopping CentersEconomic and market conditions may adversely affect the retail industry and consequently reduce ourrevenues and cash flow, and increase our operating expenses. Shifts in retail trends, sales, and delivery methodsbetween brick and mortar stores, e-commerce, home delivery, and curbside pick-up may adversely impact ourrevenues and cash flows. Changing economic and retail market conditions in geographic areas where ourproperties are concentrated may reduce our revenues and cash flow. Our success depends on the continuedpresence and success of our “anchor” tenants. A significant percentage of our revenues are derived fromsmaller “shop space” tenants and our net income may be adversely impacted if our smaller shop tenants arenot successful. We may be unable to collect balances due from tenants in bankruptcy. Many of our costs andexpenses associated with operating our properties may remain constant or increase, even if our lease incomedecreases. Compliance with the Americans with Disabilities Act and fire, safety and other regulations may havea negative effect on us.
Risk Factors Related to Real Estate InvestmentsOur real estate assets may decline in value and be subject to impairment losses which may reduce our net income. We face risks associated with development, redevelopment and expansion of properties. We face risks associated with the development of mixed-use commercial properties. We face risks associated with the acquisition of properties. We may be unable to sell properties when desired because of market conditions. Changes in tax laws could impact our acquisition or disposition of real estate.
Risk Factors Related to the Environment Affecting Our PropertiesClimate change may adversely impact our properties directly, and may lead to additional compliance obligations and costs as well as additional taxes and fees. Geographic concentration of our properties makes our business more vulnerable to natural disasters, severe weather conditions and climate change. Costs of environmental remediation may impact our financial performance and reduce our cash flow.
Risk Factors Related to Corporate MattersAn uninsured loss or a loss that exceeds the insurance coverage on our properties may subject us to loss of capital and revenue on those properties. Failure to attract and retain key personnel may adversely affect our business and operations. The unauthorized access, use, theft or destruction of tenant or employee personal, financial or other data or of Regency’s proprietary or confidential information stored in our information systems or by third parties on our behalf could impact our reputation and brand and expose us to potential liability and loss of revenues.
Risk Factors Related to Our Partnerships and Joint VenturesWe do not have voting control over all of the properties owned in our co-investment partnerships and joint ventures, so we are unable to ensure that our objectives will be pursued. The termination of our partnerships may adversely affect our cash flow, operating results, and our ability to make distributions to stock and unit holders.
Risk Factors Related to Funding Strategies and Capital StructureOur ability to sell properties and fund acquisitions and developments may be adversely impacted by higher market capitalization rates and lower NOI at our properties which may dilute earnings. We depend on external sources of capital, which may not be available in the future on favorable terms or at all. Our debt financing may adversely affect our business and financial condition. Covenants in our debt agreements may restrict our operating activities and adversely affect our financial condition. Increases in interest rates would cause our borrowing costs to rise and negatively impact our results of operations. Hedging activity may expose us to risks, including the risks that a counterparty will not perform and that the hedge will not yield the economic benefits we anticipate, which may adversely affect us. The interest rates on our Unsecured Credit facilities as well as on our variable rate mortgages and interest rate swaps might change based on changes to the method in which LIBOR or its replacement rate is determined.
Risk Factors Related to the Market Price for Our SecuritiesChanges in economic and market conditions may adversely affect the market price of our securities. There is no assurance that we will continue to pay dividends at historical rates.
Risk Factors Relating to the Company’s Qualification as a REITIf the Parent Company fails to qualify as a REIT for federal income tax purposes, it would be subject to federal income tax at regular corporate rates. Dividends paid by REITs generally do not qualify for reduced tax rates.Certain foreign stockholders may be subject to U.S. federal income tax on gain recognized on a disposition of our common stock if we do not qualify as a “domestically controlled” REIT. Legislative or other actions affecting REITs may have a negative effect on us. Complying with REIT requirements may limit our ability to hedge effectively and may cause us to incur tax liabilities.
Risks Related to the Company’s Common Stock Restrictions on the ownership of the Parent Company’s capital stock to preserve its REIT status may delay or prevent a change in control. The issuance of the Parent Company's capital stock may delay or prevent a change in control. Ownership in the Parent Company may be diluted in the future.
Non-GAAP disclosureWe believe these non-GAAP measures provide useful information to our Board of Directors, management and investors regarding certain trends relating to our financial condition and results of operations. Our management uses these non-GAAP measures to compare our performance to that of prior periods for trend analyses, purposes of determining management incentive compensation and budgeting, forecasting and planning purposes.
We do not consider non-GAAP measures an alternative to financial measures determined in accordance with GAAP. The principal limitation of these non-GAAP financial measures is they may exclude significant expense and income items that are required by GAAP to be recognized in our consolidated financial statements. In addition, they reflect the exercise of management’s judgment about which expense and income items are excluded or included in determining these non-GAAP financial measures. In order to compensate for these limitations, reconciliations of the non-GAAP financial measures we use to their most directly comparable GAAP measures are provided. Non-GAAP financial measures should not be relied upon in evaluating the financial condition, results of operations or future prospects of the Company.
Nareit FFO is a commonly used measure of REIT performance, which the National Association of Real Estate Investment Trusts (“Nareit”) defines as net income, computed in accordance with GAAP, excluding gains on sale and impairments of real estate, net of tax, plus depreciation and amortization, and after adjustments for unconsolidated partnerships and joint ventures. Regency computes Nareit FFO for all periods presented in accordance with Nareit's definition. Since Nareit FFO excludes depreciation and amortization and gains on sales and impairments of real estate, it provides a performance measure that, when compared year over year, reflects the impact on operations from trends in occupancy rates, rental rates, operating costs, acquisition and development activities, and financing costs. This provides a perspective of the Company’s financial performance not immediately apparent from net income determined in accordance with GAAP. Thus, Nareit FFO is a supplemental non-GAAP financial measure of the Company's operating performance, which does not represent cash generated from operating activities in accordance with GAAP; and, therefore, should not be considered a substitute measure of cash flows from operations. The Company provides a reconciliation of Net Income Attributable to Common Stockholders to Nareit FFO.
Core Operating Earnings is an additional performance measure that excludes from Nareit FFO: (i) transaction related income or expenses (ii) gains or losses from the early extinguishment of debt; (iii) certain non-cash components of earnings derived from above and below market rent amortization, straight-line rents, and amortization of mark-to- market of debt adjustments; and (iv) other amounts as they occur. The Company provides a reconciliation of Net Income to Nareit FFO to Core Operating Earnings.
2REGENCY CENTERS
BUSINESS UPDATE

Regency’s Unequaled Strategic Advantages
High Quality Open-Air Shopping Center Portfolio 80% grocery-anchored neighborhood & community centers
Necessity, service, convenience, and value retailers serving the essential needs of our communities
Well located in affluent, infill suburban trade areas
Best-In-Class Operating Platform 22 offices throughout the country working with tenants and vendors
at 400+ properties
Unparalleled team of experienced professionals with local expertise and strong tenant relationships
Intense asset management model has enabled close communication with tenants throughout the pandemic
Strong Value Creation Pipeline Deep pipeline of flexible development and redevelopment opportunities
Well-positioned to create value over the long-term
Balance Sheet and Liquidity Strength Low leverage with limited near-term maturities
Debt to EBITDAre of 5.3x
~$1.2B of liquidity comprised of full revolver availability
3REGENCY CENTERS
BUSINESS UPDATE
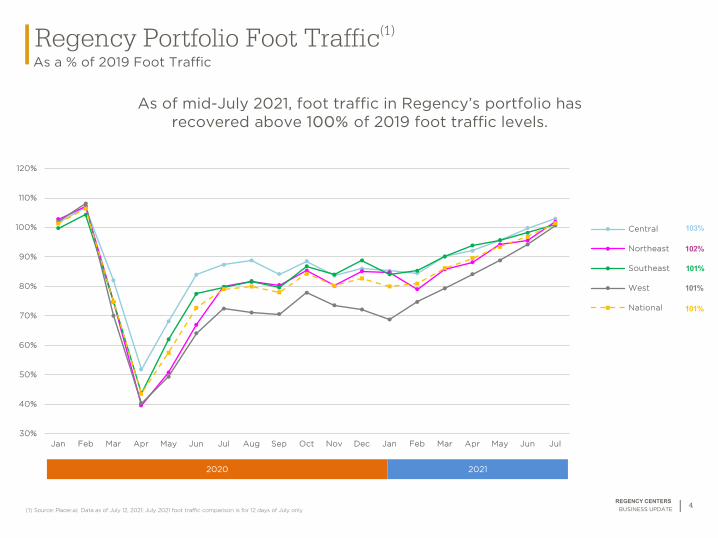
Regency Portfolio Foot Traffic(1)
As a % of 2019 Foot Traffic
(1) Source: Placer.ai; Data as of July 12, 2021; July 2021 foot traffic comparison is for 12 days of July only
As of mid-July 2021, foot traffic in Regency’s portfolio has recovered above 100% of 2019 foot traffic levels.
2020 2021
101%
103%
101%
102%
101%
30%
40%
50%
60%
70%
80%
90%
100%
110%
120%
Jan Feb Mar Apr May Jun Jul Aug Sep Oct Nov Dec Jan Feb Mar Apr May Jun Jul
Central
Northeast
Southeast
West
National
REGENCY CENTERSBUSINESS UPDATE
4

Q2 Base Rent CollectionsAs of August 2, 2021
Q2 Base Rent Collections% of Pro-Rata ABR
Q2 Base Rent Collections by Category% of Pro-Rata ABR
ESSENTIAL - RETAIL & SERVICES
(99% COLLECTED)
ESSENTIAL - RESTAURANTS
(95% COLLECTED)
OTHER - RETAIL & SERVICES
(93% COLLECTED)
REGENCY CENTERSBUSINESS UPDATE
5
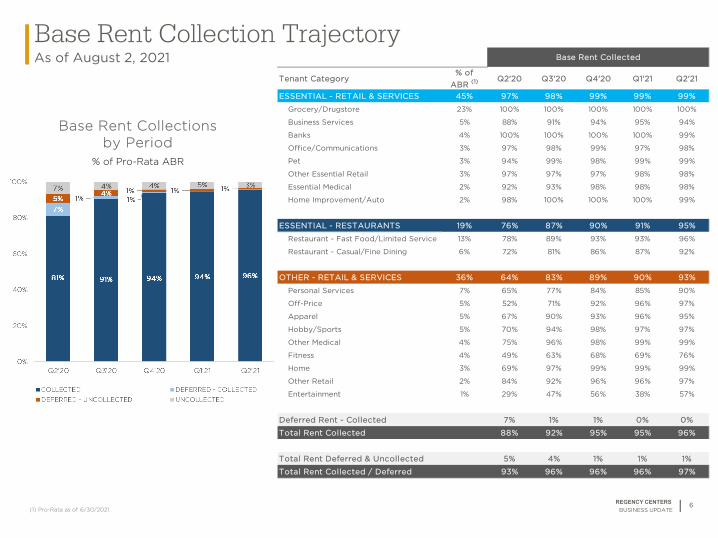
Base Rent Collection TrajectoryAs of August 2, 2021
Base Rent Collections by Period
REGENCY CENTERSBUSINESS UPDATE
6(1) Pro-Rata as of 6/30/2021
% of Pro-Rata ABR
Tenant Category% of
ABR (1) Q2'20 Q3'20 Q4'20 Q1'21 Q2'21
ESSENTIAL - RETAIL & SERVICES 45% 97% 98% 99% 99% 99%
Grocery/Drugstore 23% 100% 100% 100% 100% 100%
Business Services 5% 88% 91% 94% 95% 94%
Banks 4% 100% 100% 100% 100% 99%
Office/Communications 3% 97% 98% 99% 97% 98%
Pet 3% 94% 99% 98% 99% 99%
Other Essential Retail 3% 97% 97% 97% 98% 98%
Essential Medical 2% 92% 93% 98% 98% 98%
Home Improvement/Auto 2% 98% 100% 100% 100% 99%
ESSENTIAL - RESTAURANTS 19% 76% 87% 90% 91% 95%
Restaurant - Fast Food/Limited Service 13% 78% 89% 93% 93% 96%
Restaurant - Casual/Fine Dining 6% 72% 81% 86% 87% 92%
OTHER - RETAIL & SERVICES 36% 64% 83% 89% 90% 93%
Personal Services 7% 65% 77% 84% 85% 90%
Off-Price 5% 52% 71% 92% 96% 97%
Apparel 5% 67% 90% 93% 96% 95%
Hobby/Sports 5% 70% 94% 98% 97% 97%
Other Medical 4% 75% 96% 98% 99% 99%
Fitness 4% 49% 63% 68% 69% 76%
Home 3% 69% 97% 99% 99% 99%
Other Retail 2% 84% 92% 96% 96% 97%
Entertainment 1% 29% 47% 56% 38% 57%
Deferred Rent - Collected 7% 1% 1% 0% 0%
Total Rent Collected 88% 92% 95% 95% 96%
Total Rent Deferred & Uncollected 5% 4% 1% 1% 1%
Total Rent Collected / Deferred 93% 96% 96% 96% 97%
Base Rent Collected

Rebilled & Collected
$21,774 45%
Rebilled & Uncollected
$1,382 3%
Unbilled$25,668
52%
Total Executed Deferrals ($48.8M)(in $000s)
Deferral Agreement StatusAs of June 30, 2021
7REGENCY CENTERS
BUSINESS UPDATE
Total Executed UnbilledDeferrals Deferrals
Cash Basis Tenants $28,166 $17,493Accrual Tenants 20,657 $8,175Total $48,824 $25,668

National/Regional vs. Local Tenant Collection StatusAs of August 2, 2021
Total Portfolio Composition(1)
% of Pro-Rata ABRas of 6/30/2021
REGENCY CENTERSBUSINESS UPDATE(1) Local tenants defined as <3 locations; National/Regional tenants defined as ≥3 locations
Base Rent Collections
Composition of Unbilled Deferred Rent
($25.7M)
8

Anchor vs. Shop Tenant Collection StatusAs of August 2, 2021
REGENCY CENTERSBUSINESS UPDATE(1) Shop tenants defined as < 10K square feet, Anchor tenants defined as ≥10K square feet
Total Portfolio Composition (1)% of Pro-Rata ABR
as of 6/30/2021 Base Rent Collections
Composition of Unbilled Deferred Rent
($25.7M)
9

Regional Collection StatusAs of August 2, 2021
REGENCY CENTERSBUSINESS UPDATE
Base Rent Collections
Composition of Unbilled Deferred Rent
($25.7M)
Total Portfolio Composition% of Pro-Rata ABR
as of 6/30/2021
10
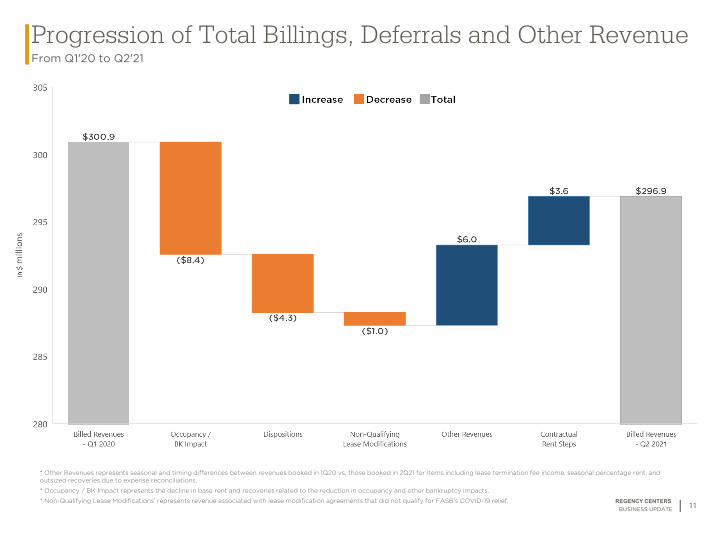
Progression of Total Billings, Deferrals and Other RevenueFrom Q1'20 to Q2'21
APPENDIX: COVID OPERATING DATA
* Other Revenues represents seasonal and timing differences between revenues booked in 1Q20 vs. those booked in 2Q21 for items including lease termination fee income, seasonal percentage rent, and outsized recoveries due to expense reconciliations.
* Occupancy / BK Impact represents the decline in base rent and recoveries related to the reduction in occupancy and other bankruptcy impacts.
* Non-Qualifying Lease Modifications’ represents revenue associated with lease modification agreements that did not qualify for FASB’s COVID-19 relief.11
REGENCY CENTERSBUSINESS UPDATE

Q2 2021 Supplemental COVID DisclosureFor the Three Months Ended June 30, 2021
12
(1) Includes pro-rata share of straight line rent on lease income, net of uncollectible amounts, and above/below market rent amortization.(2) Unbilled recoveries are included in Other Revenues, and represent unbilled amounts for quarterly, semi-annual and annual payers of property expenses. (3) Represents Base Rent and Recoveries deemed uncollectible associated only with billings during the three months ended June 30, 2021.(4) Represents Base Rent and Recoveries deemed uncollectible associated with billings during the three months ended June 30, 2021, net of the collection of $5.3 million reserved
during the three months ended March 31, 2021. (5) Represents Base Rent and Recoveries deemed uncollectible associated with billings during the six months ended June 30, 2021.(6) Represents the collection of Base Rent and Recoveries previously reserved during the year ended December 31, 2020, net of 2020 Tenant Receivables associated with tenants
converted to cash basis during the current period.(7) Contractual deferrals of rent and recoveries billed and recognized in the current period ended June 30, 2021.
(in thousands)
Composition of Current Period Billings/Deferrals and Other Revenue
Composition of Lease Income Total Pro-RataBase Rent 213,678$ Recoveries from Tenants 77,134 Percentage Rent, Termination Fees, and Other Lease Income 6,063
Current Period Billings/Deferrals & Other Revenue 296,875$ Uncollectible Lease Income, net 6,929 Non-Cash Revenues (1) 7,426
Total Lease Income (see pages 5 & 7) 311,230$
Lease Income Accrual Reconciliation Total Pro-RataCollected - Billed Base Rent/Recoveries & Other Revenue (2) 282,912$ Uncollected - Base Rent/Recoveries - Accrual Basis 3,847 Uncollected - Base Rent/Recoveries - Cash Basis (3) 10,116
Current Period Billings/Deferrals & Other Revenue 296,875$ Uncollectible Lease Income - 2021 Billings (4) (4,851) Recovery of Prior Period 2020 Reserves, net (6) 11,780 Non-Cash Revenues (1) 7,426
Total Lease Income (see pages 5 & 7) 311,230$
Composition of Uncollectible Lease Income Total Pro-RataUncollectible Lease Income - 2021 Billings (4) (4,851)$ Recovery of Prior Period 2020 Reserves, net (6) 11,780
Total Uncollectible Lease Income 6,929$
Current Period Deferred Rent Total Pro-RataDeferred Rent - Accrued 138$ Deferred Rent - Reserved 1,713
Total Deferrals (7) 1,851$
282,912
3,847 10,116
$0
$50,000
$100,000
$150,000
$200,000
$250,000
$300,000
Three Months Ended June 30, 2021
Collected & Other Accrued Reserved
Composition of 2Q21 Billings Only
Uncollected -Cash Basis:
$10,116(3%)
Total Billings & Other Revenue:
$296,875
Recognized Revenue:$286,759
(97%)
REGENCY CENTERSBUSINESS UPDATE

Q2 2021 Supplemental COVID DisclosureFor the Six Months Ended June 30, 2021
13
(1) Includes pro-rata share of straight line rent on lease income, net of uncollectible amounts, and above/below market rent amortization.(2) Unbilled recoveries are included in Other Revenues, and represent unbilled amounts for quarterly, semi-annual and annual payers of property expenses. (3) Represents Base Rent and Recoveries deemed uncollectible associated only with billings during the three months ended June 30, 2021.(4) Represents Base Rent and Recoveries deemed uncollectible associated with billings during the three months ended June 30, 2021, net of the collection of $5.3 million reserved
during the three months ended March 31, 2021. (5) Represents Base Rent and Recoveries deemed uncollectible associated with billings during the six months ended June 30, 2021.(6) Represents the collection of Base Rent and Recoveries previously reserved during the year ended December 31, 2020, net of 2020 Tenant Receivables associated with tenants
converted to cash basis during the current period.(7) Contractual deferrals of rent and recoveries billed and recognized in the current period ended June 30, 2021.
(in thousands)
Composition of Current Period Billings/Deferrals and Other Revenue
Composition of Lease Income Total Pro-RataBase Rent 426,407$ Recoveries from Tenants 147,863 Percentage Rent, Termination Fees, and Other Lease Income 13,035
Current Period Billings/Deferrals & Other Revenue 587,305$ Uncollectible Lease Income, net 9,290 Non-Cash Revenues (1) 15,095
Total Lease Income (see pages 5 & 7) 611,690$
Lease Income Accrual Reconciliation Total Pro-RataCollected - Billed Base Rent/Recoveries & Other Revenue (2) 557,034$ Uncollected - Base Rent/Recoveries - Accrual Basis 7,043 Uncollected - Base Rent/Recoveries - Cash Basis (5) 23,228
Current Period Billings/Deferrals & Other Revenue 587,305$ Uncollectible Lease Income - 2021 Billings (5) (23,228) Recovery of Prior Period 2020 Reserves, net (6) 32,518 Non-Cash Revenues (1) 15,095
Total Lease Income (see pages 5 & 7) 611,690$
Composition of Uncollectible Lease Income Total Pro-RataUncollectible Lease Income - 2021 Billings (5) (23,228)$ Recovery of Prior Period 2020 Reserves, net (6) 32,518
Total Uncollectible Lease Income 9,290$
Current Period Deferred Rent Total Pro-RataDeferred Rent - Accrued 892$ Deferred Rent - Reserved 3,749
Total Deferrals (7) 4,641$
557,034
7,043 23,228
$0
$100,000
$200,000
$300,000
$400,000
$500,000
$600,000
Six Months Ended June 30, 2021
Collected & Other Accrued Reserved
Composition of YTD 2021 Billings Only
Uncollected -Cash Basis:
$23,228(4%)
Total Billings & Other Revenue:
$587,305
Recognized Revenue:$564,077
(96%)
REGENCY CENTERSBUSINESS UPDATE

2021 Earnings Guidance Summary
REGENCY CENTERSBUSINESS UPDATE
14
Full Year 2021 GuidanceAll figures pro-rata and in thousands, except per share data
Current Previous
Net Income Attributable to Common Stockholders per diluted share $1.95 - $2.03 $1.43 - $1.53
Nareit Funds From Operations (“Nareit FFO”) per diluted share $3.74 - $3.82 $3.33 - $3.43
Core Operating Earnings per diluted share (1) $3.50 - $3.58 $3.16 - $3.26
Same Property Net Operating Income (“SPNOI”) Growth (ex. termination fees) +13.5% to +15.5% +6.0% to +8.5%Included Impact of 2020 Reserve Collection on SP NOI Range +650bps +425bps
Certain Non-Cash Items (2) +/- $28,500 +/- $30,000
Net G&A Expense $77,000 - $79,000 $77,000 - $81,000
Net Interest Expense $165,500 - $166,500 $164,000 - $165,000
Recurring Third Party Fees & Commissions $24,500 - $25,500 $23,000 - $24,000
Transaction Income (JV Promote) +/- $13,000 -
Development and Redevelopment Spend +/- $150,000 +/- $150,000
Acquisitions +/- $178,000 +/- $0Cap rate (weighted average) 5.5% 0.0%
Dispositions +/- $200,000 +/- $150,000Cap rate (weighted average) (3) 5.5% - 6.0% 5.5% - 6.0%
(1) Core Operating Earnings excludes certain non-cash items, including straight-line rents, above/below market rent amortization, and amortization of mark-to-market debt, as well as transaction related income/expenses and debt extinguishment charges.(2) Includes above and below market rent amortization, straight-line rents, and amortization of mark-to-market debt adjustments.(3) Weighted average cap rates exclude non-income producing assets (dispositions of $48 million).

Nareit FFO – ‘20 Actual to ‘21 Guidance Reconciliation
REGENCY CENTERSBUSINESS UPDATE
o Higher Same-Property NOI Forecast — We are increasing the SP NOI guidance range to +13.5 to +15.5% from +6.0 to +8.5% previously (see following page for additional detail on SP NOI drivers and reconciliation to current range)
Primary drivers include higher collection rate on 2021 billings and higher collection of 2020 reserved revenues
o Accretive Investment — $178M purchase of partner’s 80% share of USAA JV portfolio, closed on August 1, 2021
Incremental NOI partially offset by impact to interest expense, share count (see note above), and fee income
o JV Promote Income — Following the liquidation of the USAA joint venture, Regency will recognize $13M (8c per share) of promote income in the third quarter of 2021
15
Low Mid High
2020 Nareit FFO Per Diluted Share $2.95 $2.95 $2.95 Guidance
Same Property Net Operating Income (ex. Term Fees, Dispos.) 0.52 0.57 0.61+13.5% to +15.5% (2020 Reserve Collection +650bps)
Non-Same Property Net Operating Income (ex. Term Fees, Dispos.) (0.03) (0.03) (0.03) Development NOI & Non-SP Pool
NOI Impact of 2020 and 2021 Transactions (0.03) (0.03) (0.03)Dispositions +/- $200M at 5.5-6.0%Acquisitions +/- $178M at 5.5%
Lease Termination Fee Income, net (0.03) (0.03) (0.03) +/- $2,000
Non-Cash Revenues (S/L Rent, Above/Below Mkt Rent) 0.06 0.06 0.06 +/- $28,500
G&A (net of overhead capitalization) (0.03) (0.04) (0.04) $77,000 - $79,000
Net Interest Expense 0.09 0.09 0.09 $165,500 - $166,500
Third Party Management Fees 0.00 0.00 0.00 $24,500 - $25,500
Transaction Income (JV Promote) 0.08 0.08 0.08 +/- $13,000
Debt Extinguishment & Dead Deal Costs, Other Expenses 0.16 0.16 0.16 No changes to prior guidance
2021 Nareit FFO Per Diluted Share Guidance $3.74 $3.78 $3.82 Guidance of $3.74 - $3.82
Reconciliation from Nareit FFO to Core Operating Earnings
Non-Cash Revenues and Debt Mark-to-Market (0.16) (0.16) (0.16)
Transaction Income (JV Promote) (0.08) (0.08) (0.08)
2021 Core Operating Earnings Per Diluted Share Guidance $3.50 $3.54 $3.58 Guidance of $3.50 - $3.58Note: Share count impact is embedded in per share amounts. 2021 weighted average diluted share count (Nareit FFO & COE) is +/- 171,500, up from +/- 171,000 previouslyNote: All figures pro-rata and in thousands, except per share data and as otherwise noted.

SP NOI – Guidance Reconciliation
REGENCY CENTERSBUSINESS UPDATE
1) Additional Core Improvement, +500bps Increase — The assumption for additional core improvement is primarily driven by higher assumed rent collection on cash basis tenants (actual in 2Q and forecasted in 2H21), lower assumed move-out activity vs. prior expectations, and a higher recovery rate in 2Q21 (driven by expense reconciliations)
We expect continued improvement in the cash basis collection rate in 2H21 off of a higher 2Q base
2) Additional 2020 Reserve Collection, +225bps Increase — We are collecting incrementally more revenues from cash basis tenants that had been reserved during 2020
As of June 30, 2021, we’ve collected a total of ~$32M of revenues reserved in 2020 (reflected in 1H21 results)
As of July 31, 2021, we’ve collected a total of ~$35M of revenues reserved in 2020
At the midpoint, our new guidance range assumes we collect +/-$45M of revenues reserved during 2020 (up from +/-$30M previously)
16
Low Mid High Comments
Previous 2021 SP NOI % Guidance (Ex. Term Fees) 6.0% 7.25% 8.5%Previous SP NOI range of +6.0% to +8.5%
included +425bps (at the midpoint) of impact from 2020 reserve collection (+/-$30M)
Additional Core Improvement + 500bps* Higher rent collection rate on cash basis tenants
* Lower move-out activity* Higher recovery rate in 2Q
Additional 2020 Reserve Collection + 225bps * New SP NOI Midpoint: +650bps (+/-$45M)* Previous SP NOI Midpoint: +425bps (+/-$30M)
New 2021 SP NOI % Guidance (Ex. Term Fees) 13.5% 14.5% 15.5%New SP NOI range of +13.5% to +15.5%
includes +650bps (at the midpoint) of impact from 2020 reserve collection (+/-$45M)

Investments UpdateAs of June 30, 2021, Regency‘s in-process redevelopment and development projects
total $346 million at 7-8% estimated stabilized yields, and are ~50% funded. We anticipate project spend of $150 — $200 million annually over the next five years.
Status as of: 6/30/2021
Regency’s Estimated Net Project Costs $346M
% of Project Costs Incurred 50%
Remaining Project Costs $173M
In-Process Developments & Redevelopments
Total $173M
2021 $73M(i)
2022 $94M
2023+ $6M
Estimated Spend by Yearon In-Process Projects
The AbbotBoston, MA
East San MarcoJacksonville, FL
Carytown ExchangeRichmond, VA
REGENCY CENTERSBUSINESS UPDATE
17i. The $73M shown above represents Regency’s remaining estimated 2021 spend for in-process projects only. Regency’s 2021 full year development and redevelopment spend guidance of +/- $150M includes both in-process and pipeline projects.

Low Leverage and Conservative Debt Covenant Ratios
18
Regency maintains a long-standing commitment to balance sheet strength and stands today with immediate liquidity of $1.2 billion.
Unsecured Public Debt Covenants Required 6/30/21Fair Market Value Calculation Method Covenants(2)(3)
Total Consolidated Debt to Total Consolidated Assets ≤ 65% 27%Secured Consolidated Debt to Total Consolidated Assets ≤ 40% 3%Consolidated Income for Debt Service to Consolidated Debt Service ≥ 1.5x 4.6xUnencumbered Consolidated Assets to Unsecured Consolidated Debt >150% 375%
(1) Trailing 12 months.(2) For a complete listing of all Debt Covenants related to the Company's Senior Unsecured Notes, as well as definitions of the above terms, please refer to the Company's filings with the Securities and
Exchange Commission.
(3) Current period debt covenants are finalized and submitted after the Company's most recent Form 10-Q or Form 10-K filing.
Total Pro-Rata Share Leverage Ratios 6/30/21(1)
Net debt-to-Operating EBITDAre 5.3x
Fixed charge coverage 3.9x
Interest coverage 4.3x
REGENCY CENTERSBUSINESS UPDATE

Strong Balance Sheet Position
72%22%
3% 3%
Equity
Unsecured Debt - Bonds
Unconsolidated Debt - Secured
Consolidated Debt - Secured
$15.1 Billion Total
Capitalization
Capital Structure
Company Filings as of 6/30/21
Wtd Avg Interest Rate: 3.8%
Wtd Avg Yrs to Maturity: 9+ Yrs
Total Pro-Rata Debt: $4.2B
19
(% of total capitalization)Debt Maturity Profile as of June 30, 2021
Regency aims to have < 15% of total debt maturing in any given year
REGENCY CENTERSBUSINESS UPDATE

Regency’s Approach to Corporate Responsibility
Regency’s values, including the critical importance that we place on corporate responsibility, are the foundation of who we are and what we do. They drive us to implement leading environmental, social
and governance ("ESG") initiatives through our Corporate Responsibility Program.
CLICK TO VIEW REGENCY’S TCFD CLIMATE CHANGE RISK 2020 REPORT
S&P 500® ESG
CLICK TO VIEW REGENCY’S 2020 CORPORATE RESPONSIBILITY REPORT
• Top ISS Social Quality Score of 1• 85%+ employee engagement• Diversity, Equity and Inclusion program• 2020 Gender Pay Gap 1.58% - essentially no pay gap• 10,000+ hours of training provided to employees in 2020
• $1.5M in philanthropic donations in 2020• Matched employee donations and 52hrs volunteer time off
per annum• Comprehensive tenant and community engagement
strategy• Commitment to safe and welcoming shopping centers and
local value creation
• Top ISS Governance Quality Score of 1• 33% of Board seats held by female or underrepresented
minority directors• 83% of Board seats held by independent directors• Commitment to the highest ethical standards and regular
Board succession planning with a focus on diversity
• 1st U.S. REIT and 2nd U.S. corporation to issue a Green Bond• Top ISS Environmental Quality Score of 1• Exceeding annual targets to reduce GHG emissions and
energy use, and increase waste diversion• Commitment to assess and plan for climate-related risks• Leading reporting: TCFD, SASB, GRI, CDP, GRESB, UN SDGs
20REGENCY CENTERS
BUSINESS UPDATE