PPL 2nd Quarter Investor Update | August 5, 2021
32
PPL 2 nd Quarter Investor Update | August 5, 2021
Transcript of PPL 2nd Quarter Investor Update | August 5, 2021

PPL 2nd Quarter Investor Update | August 5, 2021

2PPL 2nd Quarter Investor Update – August 5, 2021
Cautionary Statements and Factors That May Affect Future Results
Statements made in this presentation about future operating results or other
future events, including the anticipated effects of the recent sale of PPL
Corporation’s U.K. business, the anticipated acquisition of The Narragansett
Electric Company (Narragansett) from National Grid, and the impact of each
transaction on PPL Corporation, are forward-looking statements under the
Safe Harbor provisions of the Private Securities Litigation Reform Act of 1995.
Actual results may differ materially from the forward-looking statements. A
discussion of some of the factors that could cause actual results or events to
vary is contained in the Appendix to this presentation and in the Company’s
SEC filings.
Management utilizes non-GAAP financial measures such as, “adjusted gross
margins” or “margins” in this presentation. For additional information on non-
GAAP financial measures and reconciliations to the appropriate GAAP
measure, refer to the Appendix of this presentation and PPL’s SEC filings.

3PPL 2nd Quarter Investor Update – August 5, 2021
Agenda
I. Strategic and Operational Updates
II. Financial Update
III. Closing Remarks
IV. Q&A
Vince Sorgi
Joe Bergstein
Vince Sorgi

4PPL 2nd Quarter Investor Update – August 5, 2021
Strategic Repositioning UpdateSale of U.K. business complete; On track in Rhode Island
➢ Completed sale of U.K. utility business on June 14th
▪ Resulted in net cash proceeds of $10.4 billion
➢ Successful execution of liability management to strengthen balance sheet
▪ $3.5 billion reduction in outstanding debt at PPL Capital Funding
➢ Board authorization for up to $3.0 billion of share repurchases
▪ Company plans to repurchase approximately $500 million by year-end
▪ Retains flexibility to assess best use of proceeds to maximize shareowner value, including a
review of capital plans for incremental investment opportunities
➢ Rhode Island utility acquisition progressing
▪ Hart-Scott-Rodino waiting period expired, received Federal Communications Commission
approval, and waiver granted by Massachusetts Department of Public Utilities
▪ Remain on track to complete transaction by March 2022
▪ Announced planned leadership team for Rhode Island upon transaction’s close
(1) Represents expected net proceeds after taxes and fees and inclusive of currency hedges.
(2) Reflects principal amount of debt retired. Does not reflect approximately $0.4 billion for tender premiums, make-whole payments, accrued interest and related fees.
(3) The actual amount of share repurchases will depend on several factors including the share price, market conditions and potential other uses of proceeds from the U.K. utility
business sale, including for incremental capital investments.
(4) Pending regulatory approval and completion of acquisition.
(1)
(4)
(2)
(3)
Highlights Since 1st Quarter Investor Update

5PPL 2nd Quarter Investor Update – August 5, 2021
Update to Carbon Reduction GoalsTargeting net-zero by 2050; Advancing interim targets
➢ Anticipate hitting current greenhouse gas reduction goals earlier than expected
▪ 70% reduction by 2035 and 80% reduction by 2040
➢ Collaboration with industry-leading, global consulting firm to further enhance PPL’s
clean energy transition strategy
➢ 2021 Climate Assessment and Kentucky Integrated Resource Plan to further inform
interim targets and projected greenhouse gas emissions
➢ Continue to explore innovative ways to support an economic and just transition for our
customers and the communities we serve
➢ Focused on R&D efforts necessary to drive economic reductions or removal for the
remaining carbon emissions
▪ Vince Sorgi chairing the EPRI Low-Carbon Resources Initiative (LCRI) Board Working Group
▪ Leveraging investments and intellectual capital in emerging technologies through Energy
Impact Partners’ purpose-driven platform
(1) Goals include CO2e emissions from owned generation and Kentucky purchased power, fleet vehicles, fugitive emissions from electric operations, and building energy use.
U.K. utility business emissions removed from 2010 baseline. See Appendix for current projected generation retirement schedule.
(1)
Clean Energy Strategy Supports Updated Targets

6PPL 2nd Quarter Investor Update – August 5, 2021
9,585
4,715
2,746
919549
2010A 2020A 2035E 2040E 2050E
Creating Our Path to Net-Zero Emissions2050 goal, while aspirational, is backed by action
62.6
25.6
18.8
12.5
0.0
2010A 2020A 2035E 2040E 2050E
Projected reductions show progress ahead of
prior goal from original 2010 baseline
Targeting
Net-Zero Emissionsby 2050
(1) 2050 goal includes CO2e emissions from owned generation and Kentucky purchased power, fleet vehicles, fugitive emissions from electric operations, and building energy
use. U.K. utility business emissions removed from 2010 baseline. See Appendix for current projected generation retirement schedule.
(2) Represents summer rating of PPL’s ownership or other interest in MW. 2020A reflects exit from competitive generation in 2015, including over 4GW of coal-fired generation.
(3) Per company’s most recent depreciation study filed in Case Nos. 2020-00349 and 2020-00350.
(4) The remaining coal capacity in 2050 relates to Trimble County Unit 2, which went into commercial operation in 2011. The unit remains economic beyond 2050 based on
current technologies, regulation, and policy.
59%
70%
80%
(Metric Tonnes, in millions)
Prior 2040
Target
Prior 2050
Target
Trajectory of Projected Coal Capacity(in MW)
2020 – 2035 Est.
Retirements:
Mill Creek (1&2): 597 MW
E.W. Brown (3): 412 MW
Ghent (1&2): 960 MW
(3)
2040 – 2050 Est.
Retirements:
Trimble County (1): 370 MW
2010 – 2020 Retirements:
Tyrone: 71 MW
Green River: 163 MW
Cane Run: 563 MW
E.W. Brown (1&2): 272 MW
2035 – 2040 Est.
Retirements:
Ghent (3&4): 959 MW
Mill Creek (3&4): 868 MW
(3)
(3)
(4)
NET
ZERO
(2)
(1)
(2)
7PPL 2nd Quarter Investor Update – August 5, 2021
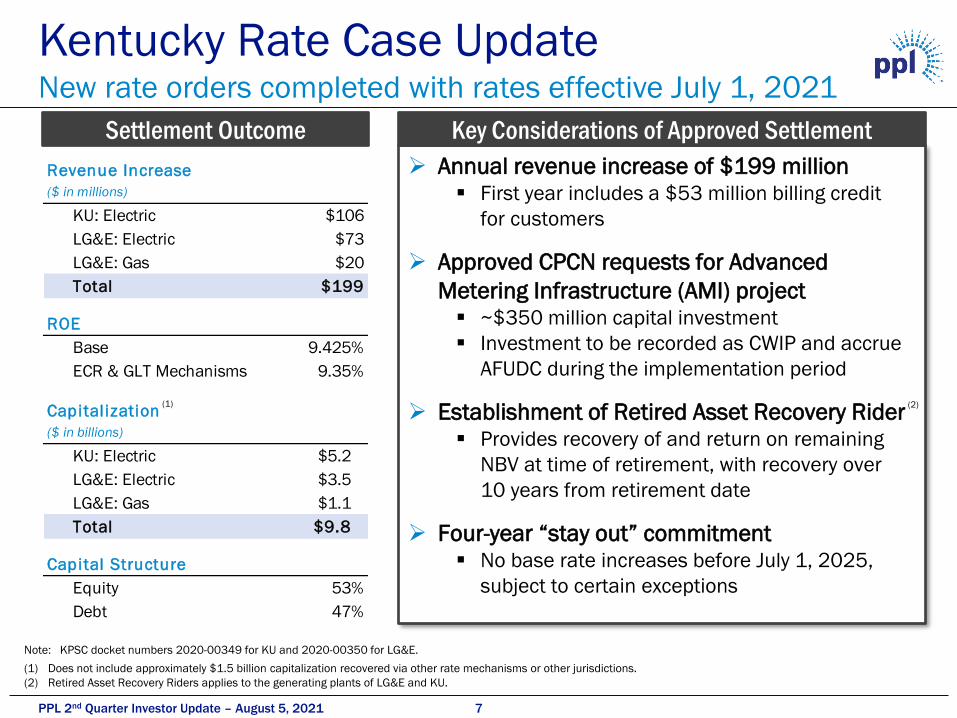
Kentucky Rate Case UpdateNew rate orders completed with rates effective July 1, 2021
Revenue Increase
($ in millions)
KU: Electric $106
LG&E: Electric $73
LG&E: Gas $20
Total $199
ROE
Base 9.425%
ECR & GLT Mechanisms 9.35%
Capitalization
($ in billions)
KU: Electric $5.2
LG&E: Electric $3.5
LG&E: Gas $1.1
Total $9.8
Capital Structure
Equity 53%
Debt 47%
Note: KPSC docket numbers 2020-00349 for KU and 2020-00350 for LG&E.
(1) Does not include approximately $1.5 billion capitalization recovered via other rate mechanisms or other jurisdictions.
(2) Retired Asset Recovery Riders applies to the generating plants of LG&E and KU.
➢ Annual revenue increase of $199 million▪ First year includes a $53 million billing credit
for customers
➢ Approved CPCN requests for Advanced
Metering Infrastructure (AMI) project▪ ~$350 million capital investment
▪ Investment to be recorded as CWIP and accrue
AFUDC during the implementation period
➢ Establishment of Retired Asset Recovery Rider▪ Provides recovery of and return on remaining
NBV at time of retirement, with recovery over
10 years from retirement date
➢ Four-year “stay out” commitment▪ No base rate increases before July 1, 2025,
subject to certain exceptions
(1) (2)
Settlement Outcome Key Considerations of Approved Settlement

8PPL 2nd Quarter Investor Update – August 5, 2021
Commitment to ExcellenceContinuously recognized industry leader
➢ Top Utility for Diversity, Equity and Inclusion – DiversityInc
➢ Top 50 Company for ESG – DiversityInc
➢ Best Place to Work for Disability Inclusion – Disability Equality Index
➢ Southeastern Electric Exchange’s Chairman’s Award for downed power line detection
innovation (PPL Electric Utilities)
Recent awards reflect commitments to diversity, equity and inclusion, innovation, and safety
✓ 4th Consecutive Year
✓ Perfect Score on Disability Equality Index

Financial Update

10PPL 2nd Quarter Investor Update – August 5, 2021
2nd Quarter Financial Results
$0.20 $0.19
2020 Q2
Ongoing
2021 Q2
Ongoing
(Earnings Per Share)
Note: See Appendix for the reconciliation of reported earnings to earnings from ongoing operations.
(1) Excludes special items. PPL sold its U.K. utility business on June 14, 2021, and its earnings were treated as a special item.
(1) (1)
$0.45
$0.03
2020 Q2
Reported
2021 Q2
Reported
(Earnings Per Share)
➢ 2nd quarter 2021 results reflect special items of ($0.16) per share, primarily items
related to the U.K. business and losses on the early extinguishment of debt
Reported Earnings Ongoing Earnings

11PPL 2nd Quarter Investor Update – August 5, 2021
2nd Quarter Segment Results
$0.15 $0.13
$0.10 $0.11
($0.05) ($0.05)
($0.02)
$0.01 $0.00
(2)(3)
Note: See Appendix for the reconciliation of reported earnings to earnings from ongoing operations.
(1) Excludes special items. PPL sold its U.K. utility business on June 14, 2021, and its earnings were treated as a special item.
(2) Q2 2020 earnings have been adjusted by ($0.02) per share for certain costs that were previously included in the U.K. Regulated segment.
(3) Corporate level financing costs are no longer allocated to the reportable segments and are being reported in Corporate and Other.
(Earnings Per Share)
(1)(1)
➢ Pennsylvania Regulated:▪ Adjusted Margins
− Lower peak transmission demand
− Increased reserve as a result of
challenge to FERC transmission
ROE
Returns on additional capital
investments in transmission
➢ Kentucky Regulated:▪ Adjusted Margins Higher commercial and industrial
demand revenue vs. prior year
▪ O&M− Primarily higher generation plant-
related costs
▪ Interest Expense Primarily due to interest costs
previously allocated to the
Kentucky Regulated segment
(these costs are now reflected in
Corp. & Other)
Weather: $0.00 Weather: $0.00
2020A Q2
Ongoing Earnings
PA
Regulated
KY
RegulatedCorp. & Other
2021A Q2
Ongoing Earnings
KY Regulated PA Regulated Corp. & Other
$0.20$0.19
Inte rest Exp. ($0.01)
Other $0.01
Adj . Margi n $0.01
O&M ($0.01)
Interest Exp. $0.01
Adj . Margi n ($0.01)
Other ($0.01)
Q2 2021 vs. Q2 2020 Key Earnings Drivers

12PPL 2nd Quarter Investor Update – August 5, 2021
(1) Excludes U.K. utility business due to the completed sale announced on June 14, 2021.
(2) Includes financing activities executed in July 2021 to reflect completed liability management.
Financing UpdateSuccessful execution of liability management
($ in billions)
($ in millions)
➢ Reduced PPL Capital Funding long-term
debt outstanding by ~$3.5 billion
▪ Successful execution of Tender Offer in June
resulting in ~$2 billion debt retirement
▪ Additional ~$1.5 billion debt reduction in July
through a series of redemptions
➢ Delisted Kentucky HoldCo (LKE) on 7/9
▪ Redeemed $250 million LKE debt in July
▪ No planned future debt issuances at LKE
➢ On track to achieve targeted credit metrics
post strategic repositioning
▪ CFO(FFO) to debt ratio of 16% - 18%
▪ Holding Company to Total debt ratio to below 25%
▪ Debt-to-Total Capitalization ratio of 45% - 55%
➢ Efficient use of transaction proceeds to
reduce outstanding short-term debt
$1,537
$3,084
$1,663
$16
$3,200 $3,100
3/31 6/30
Unused Capacity Used Capacity
(1)
(2)(1)
~40%~20%
$8.9 $9.2
$5.9$2.1
$14.8
$11.3
3/31 7/31
Operating Company Debt Holding Company Debt
Significant Reduction in HoldCo Debt
Liquidity Update
Notable Financing Highlights

Appendix

14PPL 2nd Quarter Investor Update – August 5, 2021
Narragansett Electric Acquisition UpdateRegulatory approvals on track
Acquisition of Narragansett
(expected approval within 12 months of transaction announcement) Status
Federal Approvals:
Hart-Scott-Rodino (DOJ) ✓Waiting Period Expired 6/2
Federal Communications Commission (FCC) ✓ Approval Received 7/14
Federal Energy Regulatory Commission (FERC) Pending (filing submitted 5/4)
State Approvals:
Rhode Island Division of Public Utilities and Carriers Pending (filing submitted 5/4)
Massachusetts Department of Public Utilities (waiver) ✓ Granted 7/16
(1) National Grid obligation for Massachusetts Department of Public Utilities waiver relating to its foreign utility change in control provision.
(1)
15PPL 2nd Quarter Investor Update – August 5, 2021
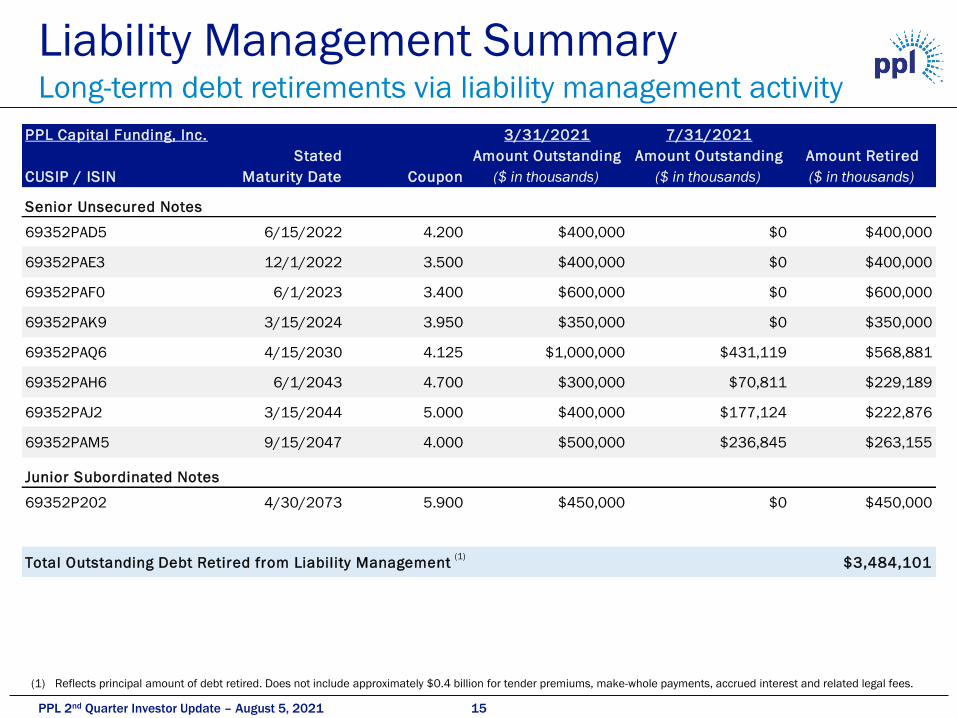
PPL Capital Funding, Inc. 3/31/2021 7/31/2021
CUSIP / ISIN
Stated
Maturity Date Coupon
Amount Outstanding
($ in thousands)
Amount Outstanding
($ in thousands)
Amount Retired
($ in thousands)
Senior Unsecured Notes
69352PAD5 6/15/2022 4.200 $400,000 $0 $400,000
69352PAE3 12/1/2022 3.500 $400,000 $0 $400,000
69352PAF0 6/1/2023 3.400 $600,000 $0 $600,000
69352PAK9 3/15/2024 3.950 $350,000 $0 $350,000
69352PAQ6 4/15/2030 4.125 $1,000,000 $431,119 $568,881
69352PAH6 6/1/2043 4.700 $300,000 $70,811 $229,189
69352PAJ2 3/15/2044 5.000 $400,000 $177,124 $222,876
69352PAM5 9/15/2047 4.000 $500,000 $236,845 $263,155
Junior Subordinated Notes
69352P202 4/30/2073 5.900 $450,000 $0 $450,000
Total Outstanding Debt Retired from Liability Management $3,484,101
Liability Management SummaryLong-term debt retirements via liability management activity
(1) Reflects principal amount of debt retired. Does not include approximately $0.4 billion for tender premiums, make-whole payments, accrued interest and related legal fees.
(1)
16PPL 2nd Quarter Investor Update – August 5, 2021
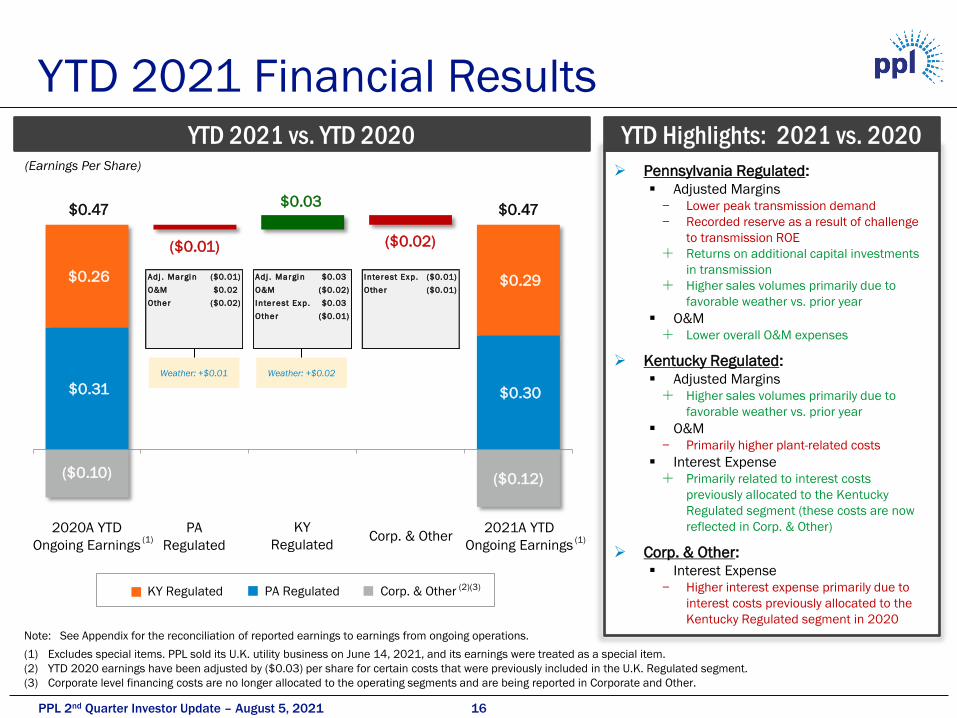
$0.31 $0.30
$0.26 $0.29
($0.10) ($0.12)
($0.01)
$0.03
($0.02)
YTD 2021 Financial Results
Note: See Appendix for the reconciliation of reported earnings to earnings from ongoing operations.
(1) Excludes special items. PPL sold its U.K. utility business on June 14, 2021, and its earnings were treated as a special item.
(2) YTD 2020 earnings have been adjusted by ($0.03) per share for certain costs that were previously included in the U.K. Regulated segment.
(3) Corporate level financing costs are no longer allocated to the operating segments and are being reported in Corporate and Other.
(Earnings Per Share)➢ Pennsylvania Regulated:
▪ Adjusted Margins
− Lower peak transmission demand
− Recorded reserve as a result of challenge
to transmission ROE
Returns on additional capital investments
in transmission
Higher sales volumes primarily due to
favorable weather vs. prior year
▪ O&M
Lower overall O&M expenses
➢ Kentucky Regulated:
▪ Adjusted Margins
Higher sales volumes primarily due to
favorable weather vs. prior year
▪ O&M
− Primarily higher plant-related costs
▪ Interest Expense
Primarily related to interest costs
previously allocated to the Kentucky
Regulated segment (these costs are now
reflected in Corp. & Other)
➢ Corp. & Other:
▪ Interest Expense
− Higher interest expense primarily due to
interest costs previously allocated to the
Kentucky Regulated segment in 2020
Weather: +$0.01 Weather: +$0.02
(2)(3)KY Regulated PA Regulated Corp. & Other
(1)(1)2020A YTD
Ongoing Earnings
PA
Regulated
KY
RegulatedCorp. & Other
2021A YTD
Ongoing Earnings
$0.47 $0.47
Adj . Margi n $0.03
O&M ($0.02)
Interest Exp. $0.03
Other ($0.01)
Interest Exp. ($0.01)
Other ($0.01)
Adj . Margi n ($0.01)
O&M $0.02
Other ($0.02)
YTD 2021 vs. YTD 2020 YTD Highlights: 2021 vs. 2020

17PPL 2nd Quarter Investor Update – August 5, 2021
5.7% 7.1% 6.9%
4.8%
0.6%
(14.4%)
(6.7%)
(3.5%) (3.6%)(2.7%)(7.7%)
(1.9%)(0.5%) (0.5%)
(1.6%)
Q2 2020 Q3 2020 Q4 2020 Q1 2021 Q2 2021
7.3% 4.9%
3.5% 2.8% 4.6%
(10.5%)
(4.0%)(2.9%) (3.1%)
(0.2%)(4.3%)
(0.5%) (0.3%) (0.7%) 1.4%
Q2 2020 Q3 2020 Q4 2020 Q1 2021 Q2 2021
Electricity Sales TrendsCOVID-19 implications continue to moderate
TotalResidential C&I (2)
Weather-Normalized Electricity Sales Volumes Compared to 2019 Sales Volumes
Pennsylvania Regulated Kentucky Regulated
(1)
Note: Excludes U.K. utility business due to the completed sale announced on June 14, 2021.
(1) 2019 weather-normalized electricity sales volumes used for comparative purposes to reflect sales trends vs. a period prior to COVID-19 impacts.
(2) Includes Residential, Commercial and Industrial customer classes as well as “Other,” which is not depicted in the charts above.
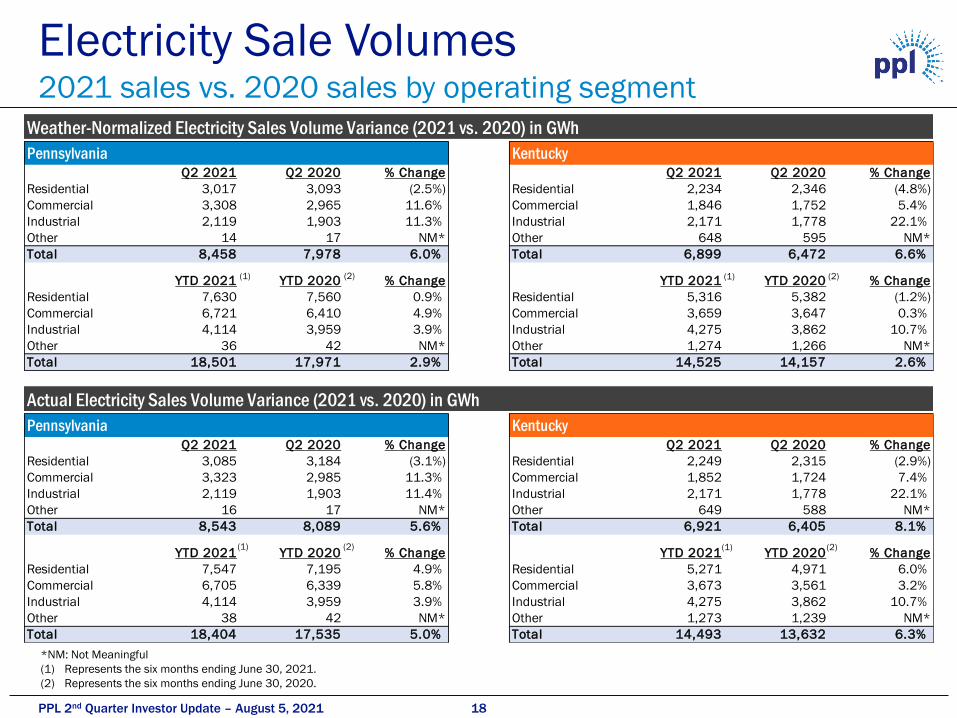
18PPL 2nd Quarter Investor Update – August 5, 2021
Weather-Normalized Electricity Sales Volume Variance (2021 vs. 2020) in GWh
Pennsylvania KentuckyQ2 2021 Q2 2020 % Change Q2 2021 Q2 2020 % Change
Residential 3,017 3,093 (2.5%) Residential 2,234 2,346 (4.8%)
Commercial 3,308 2,965 11.6% Commercial 1,846 1,752 5.4%
Industrial 2,119 1,903 11.3% Industrial 2,171 1,778 22.1%
Other 14 17 NM* Other 648 595 NM*
Total 8,458 7,978 6.0% Total 6,899 6,472 6.6%
YTD 2021 YTD 2020 % Change YTD 2021 YTD 2020 % Change
Residential 7,630 7,560 0.9% Residential 5,316 5,382 (1.2%)
Commercial 6,721 6,410 4.9% Commercial 3,659 3,647 0.3%
Industrial 4,114 3,959 3.9% Industrial 4,275 3,862 10.7%
Other 36 42 NM* Other 1,274 1,266 NM*
Total 18,501 17,971 2.9% Total 14,525 14,157 2.6%
Actual Electricity Sales Volume Variance (2021 vs. 2020) in GWh
Pennsylvania KentuckyQ2 2021 Q2 2020 % Change Q2 2021 Q2 2020 % Change
Residential 3,085 3,184 (3.1%) Residential 2,249 2,315 (2.9%)
Commercial 3,323 2,985 11.3% Commercial 1,852 1,724 7.4%
Industrial 2,119 1,903 11.4% Industrial 2,171 1,778 22.1%
Other 16 17 NM* Other 649 588 NM*
Total 8,543 8,089 5.6% Total 6,921 6,405 8.1%
YTD 2021 YTD 2020 % Change YTD 2021 YTD 2020 % Change
Residential 7,547 7,195 4.9% Residential 5,271 4,971 6.0%
Commercial 6,705 6,339 5.8% Commercial 3,673 3,561 3.2%
Industrial 4,114 3,959 3.9% Industrial 4,275 3,862 10.7%
Other 38 42 NM* Other 1,273 1,239 NM*
Total 18,404 17,535 5.0% Total 14,493 13,632 6.3%
*NM: Not Meaningful
(1) Represents the six months ending June 30, 2021.
(2) Represents the six months ending June 30, 2020.
Electricity Sale Volumes2021 sales vs. 2020 sales by operating segment
(1)
(1) (1)
(1)
(2) (2)
(2) (2)

19PPL 2nd Quarter Investor Update – August 5, 2021
Baseload Generation SummaryKey Attributes of Kentucky’s baseload generation fleet
Owned
Capacity
Power Plant Unit COD MW 2019A 2020A
Coal
Mill Creek 1 1972 300 57% 64% 2024
E.W. Brown 3 1971 412 25% 29% 2028
Mill Creek 2 1974 297 70% 35% 2028
Ghent 1 1974 475 64% 63% 2034
Ghent 2 1977 485 62% 59% 2034
Ghent 3 1981 481 56% 60% 2037
Ghent 4 1984 478 59% 53% 2037
Mill Creek 3 1978 391 53% 50% 2039
Mill Creek 4 1982 477 73% 54% 2039
Trimble County 1 1990 370 75% 81% 2045
Trimble County 2 2011 549 70% 74% 2066
Natural Gas
Cane Run (CCGT) 7 2015 662 85% 75% 2055
Total Baseload 5,377
Currently Projected
End of Economic
Useful Life
Capacity Factor
(1) Per most recent depreciation study filed in Case Nos. 2020-00349 and 2020-00350.
(1)
PPL’s Kentucky Baseload Generation Resources
20PPL 2nd Quarter Investor Update – August 5, 2021
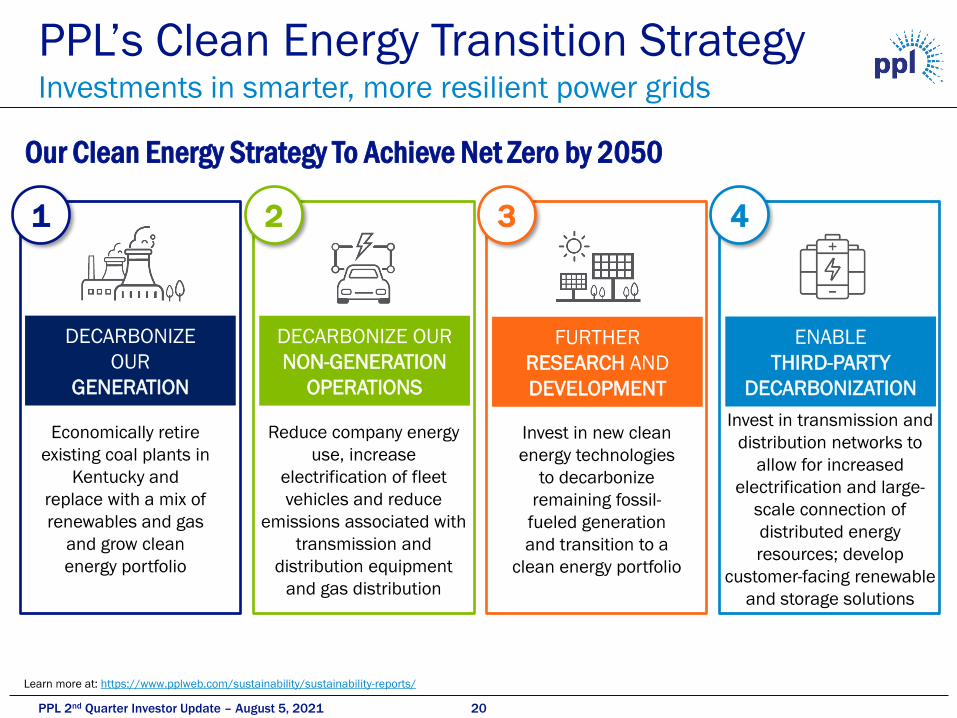
PPL’s Clean Energy Transition StrategyInvestments in smarter, more resilient power grids
DECARBONIZE
OUR
GENERATION
DECARBONIZE OUR
NON-GENERATION
OPERATIONS
ENABLE
THIRD-PARTY
DECARBONIZATION
FURTHER
RESEARCH AND
DEVELOPMENT
Economically retire
existing coal plants in
Kentucky and
replace with a mix of
renewables and gas
and grow clean
energy portfolio
Reduce company energy
use, increase
electrification of fleet
vehicles and reduce
emissions associated with
transmission and
distribution equipment
and gas distribution
Invest in transmission and
distribution networks to
allow for increased
electrification and large-
scale connection of
distributed energy
resources; develop
customer-facing renewable
and storage solutions
Invest in new clean
energy technologies
to decarbonize
remaining fossil-
fueled generation
and transition to a
clean energy portfolio
Learn more at: https://www.pplweb.com/sustainability/sustainability-reports/
Our Clean Energy Strategy To Achieve Net Zero by 2050
1 2 3 4

21PPL 2nd Quarter Investor Update – August 5, 2021
Fostering an Exceptional WorkplaceCommitted to diversity, equity, and inclusion
Learn more at: pplweb.com/diversity
➢ Implemented company-wide DE&I strategy aligned around five DEI
commitments to focus efforts and remain accountable.
➢ Expanded support for employee-led Business Resource Groups for
a total of 16 affinity groups which provide an opportunity for
employees to network, volunteer and actively address diversity
issues in the workplace.
➢ Expanded financial support for racial and social justice initiatives
through the company’s foundations and awarded STEM
scholarships.
➢ Provided greater transparency of DE&I metrics through PPL’s
Corporate Sustainability Report.
PPL’s Diversity, Equity, and Inclusion Commitments
Key Initiatives Implemented in 2021 Recognition for DE&I Efforts

22PPL 2nd Quarter Investor Update – August 5, 2021
Corporate Governance HighlightsLed by a balanced and diverse board
Independent Board Committees led
by Women
Note: As of July 31, 2021. Figures based on PPL Corporation’s 2021 Proxy Statement.
Learn more at: https://www.pplweb.com/sustainability/sustainability-reports/
✓ Adopted the “Rooney Rule” to ensure diverse candidates are considered for open
board seats
✓ Appointed independent chair of board
✓ Awarded Trendsetter ranking by CPA-Zicklin Index, demonstrating our ongoing
commitment to transparency around political spending disclosure
56%Diverse
50%
Average tenure: 8 years
3(5-10 Years)
3(11-15 years)
3(0-4 Years)
Diverse Board Members
(based on gender, race and ethnicity)
67%With 10 years
or lessWomen-ledCommittees
Independent Oversight by a Diverse Board Tenure-balanced
Corporate Governance Highlights and Achievements

23PPL 2nd Quarter Investor Update – August 5, 2021
Debt Maturities
(1) Amounts include the timing of any put option on municipal bonds that may be put by the holders before the bonds' final maturities.
(2) Does not reflect unamortized debt issuance costs, unamortized premiums (discounts), and fair market valuation adjustments. At June 30, 2021, this represented a total amount
of ($128 million).
Debt Maturities at June 30, 2021:
Debt Maturities at July 31, 2021 (reflects July financing activities):
($ in millions) 2021 2022 2023 2024 2025
2026 and
Beyond Total
PPL Capital Funding $0 $527 $389 $156 $0 $2,496 $3,568
PPL Electric Utilities(1) $400 $474 $340 $650 $0 $3,075 $4,939
LG&E and KU Energy $250 $0 $0 $0 $0 $0 $250
Louisville Gas & Electric(1) $28 $0 $0 $0 $300 $1,697 $2,024
Kentucky Utilities(1) $0 $0 $13 $0 $250 $2,379 $2,642
Total Debt Maturities (2) $678 $1,001 $742 $806 $550 $9,647 $13,423
($ in millions) 2021 2022 2023 2024 2025
2026 and
Beyond Total
PPL Capital Funding $0 $0 $0 $0 $0 $2,046 $2,046
PPL Electric Utilities(1) $0 $474 $340 $650 $0 $3,075 $4,539
Louisville Gas & Electric(1) $28 $0 $0 $0 $300 $1,697 $2,024
Kentucky Utilities(1) $0 $0 $13 $0 $250 $2,379 $2,642
Total Debt Maturities (2) $28 $474 $353 $650 $550 $9,197 $11,251

24PPL 2nd Quarter Investor Update – August 5, 2021
Entity Facility
Expiration
Date
Capacity
(Mill ions)
Borrowed
(Mill ions)
Letters of
Credit &
Commercial
Paper Issued
(Mill ions)
Unused
Capacity
(Mill ions)
PPL Capital Funding Syndicated Credit Facility Jan-2024 $1,450 $0 $0 $1,450
Bilateral Credit Facility Mar-2022 50 0 0 50
Uncommitted Credit Facility Mar-2022 50 0 15 35
$1,550 $0 $15 $1,535
PPL Electric Util ities Syndicated Credit Facility Jan-2024 $650 $0 $1 $649
Louisville Gas & Electric Syndicated Credit Facility Jan-2024 $500 $0 $0 $500
Kentucky Util ities Syndicated Credit Facility Jan-2024 $400 $0 $0 $400
Total Credit Facilities $3,100 $0 $16 $3,084
Liquidity Profile
Note: As of June 30, 2021.

25PPL 2nd Quarter Investor Update – August 5, 2021
PPL’s Credit Ratings
LKE Holding Company PPL Electric Utilities
LKE Operating Companies
Credit Rating
Secured
Unsecured
Long-term Issuer
Outlook
S&P
NR
BBB+
A-
Stable
Moody’s
NR
Baa2
NR
Positive
Credit Rating
Secured
Unsecured
Long-term Issuer
Outlook
S&P
A
NR
A-
Stable
Moody’s
A1
NR
A3
Stable
Credit Rating
Secured
Unsecured
Long-term Issuer
Outlook
S&P
NR
BBB+
A-
Stable
Moody’s
NR
Baa1
Baa1
Stable
Credit Rating
Secured
Unsecured
Long-term Issuer
Outlook
S&P
A
NR
A-
Positive
Credit Rating
Secured
Unsecured
Long-term Issuer
Outlook
S&P
NR
NR
A-
Stable
Moody’s
NR
NR
Baa2
Positive
Moody’s
A1
NR
A3
Stable
PPL Corporation
PPL Capital Funding
Note: As of June 30, 2021.

26PPL 2nd Quarter Investor Update – August 5, 2021
After-Tax (Unaudited) 2nd Quarter Year-to-Date
($ in millions) June 30, 2021 June 30, 2021
KY
Reg.
PA
Reg.
Corp. &
Other
Disc.
Ops.Total
KY
Reg.
PA
Reg.
Corp. &
Other
Disc.
Ops.Total
Reported Earnings 84$ 96$ (716)$ 555$ 19$ 230$ 209$ (772)$ (1,488)$ (1,821)$
Less: Special Items (expense) benefit:
Income (Loss) from Discontinued Operations 555 555 (1,492) (1,492)
Talen litigation costs, net of tax of $1, $2 (6) (6) (9) (9)
Strategic corporate initiatives, net of tax of $1, $1 (2) (2) (2) (2)
Valuation allowance adjustment 4 (4) 4 4
Challenge to transmission formula rate return on equity reserve, net of tax of $2, $8 (7) (7) (20) (20)
Acquisition integration, net of tax of $1, $1 (2) (2) (2) (2)
U.K. tax rate change (383) (383) (383) (383)
Solar panel impairment, net of tax of $9, $9 (28) (28) (28) (28)
Loss on early extinguishment of debt, net of tax of $67, $67 (255) (255) (255) (255)
Total Special Items - (7) (676) 555 (128) 4 (20) (683) (1,488) (2,187)
Earnings from Ongoing Operations 84$ 103$ (40)$ -$ 147$ 226$ 229$ (89)$ -$ 366$
After-Tax (Unaudited) 2nd Quarter Year-to-Date
(per share - diluted) June 30, 2021 June 30, 2021
KY
Reg.
PA
Reg.
Corp. &
Other
Disc.
Ops.Total
KY
Reg.
PA
Reg.
Corp. &
Other
Disc.
Ops.Total
Reported Earnings 0.11$ 0.12$ (0.92)$ 0.72$ 0.03$ 0.30$ 0.27$ (1.01)$ (1.93)$ (2.37)$
Less: Special Items (expense) benefit:
Income (Loss) from Discontinued Operations 0.72 0.72 (1.94) (1.94)
Talen litigation costs (0.01) (0.01)
Valuation allowance adjustment 0.01 (0.01) 0.01 0.01
Challenge to transmission formula rate return on equity reserve (0.01) (0.01) (0.03) (0.03)
U.K. tax rate change (0.50) (0.50) (0.50) (0.50)
Solar panel impairment (0.04) (0.04) (0.04) (0.04)
Loss on early extinguishment of debt (0.33) (0.33) (0.33) (0.33)
Total Special Items - (0.01) (0.87) 0.72 (0.16) 0.01 (0.03) (0.89) (1.93) (2.84)
Earnings from Ongoing Operations 0.11$ 0.13$ (0.05)$ -$ 0.19$ 0.29$ 0.30$ (0.12)$ -$ 0.47$
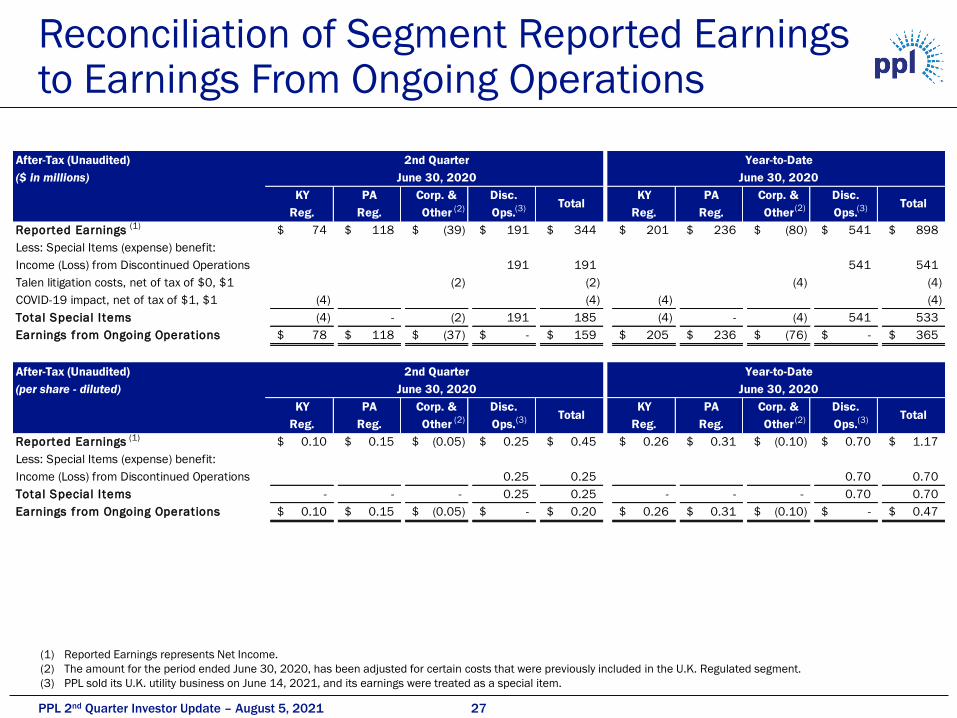
Reconciliation of Segment Reported Earnings to Earnings From Ongoing Operations
(1)
(1)
(2) (2)
(2) (2)
(1) Reported Earnings represents Net Income.
(2) PPL sold its U.K. utility business on June 14, 2021, and its earnings were treated as a special item.
(3) Reflects solar panel write-down due to extension of federal government’s solar investment tax credits, technological advances resulting in more efficient modules available on
the market, and rising commodity prices for materials used in various solar projects.
(3)
(3)
27PPL 2nd Quarter Investor Update – August 5, 2021
After-Tax (Unaudited) 2nd Quarter Year-to-Date
($ in millions) June 30, 2020 June 30, 2020
KY
Reg.
PA
Reg.
Corp. &
Other
Disc.
Ops.Total
KY
Reg.
PA
Reg.
Corp. &
Other
Disc.
Ops.Total
Reported Earnings 74$ 118$ (39)$ 191$ 344$ 201$ 236$ (80)$ 541$ 898$
Less: Special Items (expense) benefit:
Income (Loss) from Discontinued Operations 191 191 541 541
Talen litigation costs, net of tax of $0, $1 (2) (2) (4) (4)
COVID-19 impact, net of tax of $1, $1 (4) (4) (4) (4)
Total Special Items (4) - (2) 191 185 (4) - (4) 541 533
Earnings from Ongoing Operations 78$ 118$ (37)$ -$ 159$ 205$ 236$ (76)$ -$ 365$
After-Tax (Unaudited) 2nd Quarter Year-to-Date
(per share - diluted) June 30, 2020 June 30, 2020
KY
Reg.
PA
Reg.
Corp. &
Other
Disc.
Ops.Total
KY
Reg.
PA
Reg.
Corp. &
Other
Disc.
Ops.Total
Reported Earnings 0.10$ 0.15$ (0.05)$ 0.25$ 0.45$ 0.26$ 0.31$ (0.10)$ 0.70$ 1.17$
Less: Special Items (expense) benefit:
Income (Loss) from Discontinued Operations 0.25 0.25 0.70 0.70
Total Special Items - - - 0.25 0.25 - - - 0.70 0.70
Earnings from Ongoing Operations 0.10$ 0.15$ (0.05)$ -$ 0.20$ 0.26$ 0.31$ (0.10)$ -$ 0.47$
Reconciliation of Segment Reported Earnings to Earnings From Ongoing Operations
(1)
(3)
(1) Reported Earnings represents Net Income.
(2) The amount for the period ended June 30, 2020, has been adjusted for certain costs that were previously included in the U.K. Regulated segment.
(3) PPL sold its U.K. utility business on June 14, 2021, and its earnings were treated as a special item.
(2)
(1)
(2)
(3) (2)
(2) (3)
(3)

28PPL 2nd Quarter Investor Update – August 5, 2021
(Unaudited) Three Months Ended June 30,
(millions of dollars, except share data) Per Share Diluted
2021 2020 Change (after-tax)
Kentucky Adjusted Gross Margins 489$ $ 479 10$ 0.01$
Pennsylvania Adjusted Gross Margins
Distribution 211$ 218$ (7)$ (0.01)$
Transmission 159 165 (6) 0.00
Total Pennsylvania Adjusted Gross Margins 370$ 383$ (13)$ (0.01)$
(Unaudited) Six Months Ended June 30,
(millions of dollars, except share data) Per Share Diluted
2021 2020 Change (after-tax)
Kentucky Adjusted Gross Margins 1,059$ $ 1,026 33$ 0.03$
Pennsylvania Adjusted Gross Margins
Distribution 458$ 460$ (2)$ (0.00)$
Transmission 315 324 (9) (0.01)
Total Pennsylvania Adjusted Gross Margins 773$ 784$ (11)$ (0.01)$
Adjusted Gross Margins Summary(1)
(1) Excludes U.K. utility business due to the completed sale announced on June 14, 2021.

29PPL 2nd Quarter Investor Update – August 5, 2021
Reconciliation of Adjusted Gross Margins to Operating Income(1)
(1) Excludes U.K. utility business due to the completed sale announced on June 14, 2021.
Three Months Ended June 30, 2021 Six Months Ended June 30, 2021
KY PA KY PA
Adjusted Adjusted Adjusted Adjusted
Gross Gross Operating Gross Gross Operating
Margins Margins Other Income Margins Margins Other Income
741$ 545$ 2$ 1,288$ 1,626$ 1,169$ (9)$ 2,786$
159 - - 159 336 - - 336
27 110 - 137 98 259 - 357
Other operation and maintenance 24 26 354 404 49 51 671 771
41 15 213 269 81 32 423 536
1 24 24 49 3 54 44 101
Total Operating Expenses 252 175 591 1,018 567 396 1,138 2,101
489$ 370$ (589)$ 270$ 1,059$ 773$ (1,147)$ 685$
Three Months Ended June 30, 2020 Six Months Ended June 30, 2020
KY PA KY PA
Adjusted Adjusted Adjusted Adjusted
Gross Gross Operating Gross Gross Operating
Margins Margins Other Income Margins Margins Other Income
700$ 554$ 9$ 1,263$ 1,525$ 1,162$ 16$ 2,703$
138 138 301 301
22 111 133 79 255 334
Other operation and maintenance 20 23 310 353 41 46 621 708
38 13 204 255 75 25 405 505
3 24 10 37 3 52 29 84
Total Operating Expenses 221 171 524 916 499 378 1,055 1,932
479$ 383$ (515)$ 347$ 1,026$ 784$ (1,039)$ 771$
(Unaudited)
(millions of dollars)
(Unaudited)
(millions of dollars)
Taxes, other than income
Taxes, other than income
Total
Operating Revenues
Operating Expenses
Fuel
Energy purchases
Depreciation
Total
Operating Revenues
Operating Expenses
Fuel
Energy purchases
Depreciation

30PPL 2nd Quarter Investor Update – August 5, 2021
Forward-Looking Information StatementStatements contained in this presentation, including statements with respect to future earnings, cash flows, dividends,
financing, regulation and corporate strategy, including the anticipated acquisition of Narragansett from National Grid, and
its impact on PPL Corporation, are “forward-looking statements” within the meaning of the federal securities laws. Although
PPL Corporation believes that the expectations and assumptions reflected in these forward-looking statements are
reasonable, these statements are subject to a number of risks and uncertainties, and actual results may differ materially
from the results discussed in the statements. The following are among the important factors that could cause actual results
to differ materially from the forward-looking statements: asset or business acquisitions and dispositions; the COVID-19
pandemic or other pandemic health events or other catastrophic events, including severe weather, and their effect on
financial markets, economic conditions and our businesses; market demand for energy in our service territories; weather
conditions affecting customer energy usage and operating costs; the effect of any business or industry restructuring; the
profitability and liquidity of PPL Corporation and its subsidiaries; new accounting requirements or new interpretations or
applications of existing requirements; operating performance of our facilities; the length of scheduled and unscheduled
outages at our generating plants; environmental conditions and requirements, and the related costs of compliance; system
conditions and operating costs; development of new projects, markets and technologies; performance of new ventures;
receipt of necessary government permits, approvals, rate relief and regulatory cost recovery; capital market conditions,
including interest rates, and decisions regarding capital structure; the impact of state, federal or foreign investigations
applicable to PPL Corporation and its subsidiaries; the outcome of litigation involving PPL Corporation and its subsidiaries;
stock price performance; the market prices of debt and equity securities and the impact on pension income and resultant
cash funding requirements for defined benefit pension plans; the securities and credit ratings of PPL Corporation and its
subsidiaries; political, regulatory or economic conditions in states, regions or countries where PPL Corporation or its
subsidiaries conduct business, including any potential effects of threatened or actual cyberattack, terrorism, or war or other
hostilities; new state, federal or foreign legislation or regulatory developments, including new tax legislation; and the
commitments and liabilities of PPL Corporation and its subsidiaries. Any such forward-looking statements should be
considered in light of such important factors and in conjunction with factors and other matters discussed in PPL
Corporation's Form 10-K and other reports on file with the Securities and Exchange Commission.

31PPL 2nd Quarter Investor Update – August 5, 2021
Definitions of non-GAAP Financial Measures
Management utilizes "Earnings from Ongoing Operations" as a non-GAAP financial measure that should not be considered
as an alternative to reported earnings, or net income, an indicator of operating performance determined in accordance with
GAAP. PPL believes that Earnings from Ongoing Operations is useful and meaningful to investors because it provides
management's view of PPL's earnings performance as another criterion in making investment decisions. In addition, PPL's
management uses Earnings from Ongoing Operations in measuring achievement of certain corporate performance goals,
including targets for certain executive incentive compensation. Other companies may use different measures to present
financial performance.
Earnings from Ongoing Operations is adjusted for the impact of special items. Special items are presented in the financial
tables on an after-tax basis with the related income taxes on special items separately disclosed. Income taxes on special
items, when applicable, are calculated based on the statutory tax rate of the entity where the activity is recorded. Special
items may include items such as:
• Gains and losses on sales of assets not in the ordinary course of business.
• Impairment charges.
• Significant workforce reduction and other restructuring effects.
• Acquisition and divestiture-related adjustments.
• Significant losses on early extinguishment of debt.
• Other charges or credits that are, in management's view, non-recurring or otherwise not reflective of the company’s
ongoing operations.

32PPL 2nd Quarter Investor Update – August 5, 2021
Management also utilizes the following non-GAAP financial measures as indicators of performance for its businesses:
"Kentucky Adjusted Gross Margins" is a single financial performance measure of the electricity generation, transmission
and distribution operations of the Kentucky Regulated segment, as well as the Kentucky Regulated segment’s distribution
and sale of natural gas. In calculating this measure, fuel, energy purchases and certain variable costs of production
(recorded in "Other operation and maintenance" on the Statements of Income) are deducted from operating revenues. In
addition, certain other expenses, recorded in "Other operation and maintenance", "Depreciation" and "Taxes, other than
income" on the Statements of Income, associated with approved cost recovery mechanisms are offset against the recovery
of those expenses, which are included in revenues. These mechanisms allow for direct recovery of these expenses and, in
some cases, returns on capital investments and performance incentives. As a result, this measure represents the net
revenues from electricity and gas operations.
"Pennsylvania Adjusted Gross Margins" is a single financial performance measure of the electricity transmission and
distribution operations of the Pennsylvania Regulated segment. In calculating this measure, utility revenues and expenses
associated with approved recovery mechanisms, including energy provided as a PLR, are offset with minimal impact on
earnings. Costs associated with these mechanisms are recorded in "Energy purchases," "Other operation and
maintenance," (which are primarily Act 129, Storm Damage and Universal Service program costs), "Depreciation" (which is
primarily related to the Act 129 Smart Meter program) and "Taxes, other than income," (which is primarily gross receipts tax)
on the Statements of Income. This measure represents the net revenues from the Pennsylvania Regulated segment's
electricity delivery operations.
These measures are not intended to replace "Operating Income," which is determined in accordance with GAAP, as an
indicator of overall operating performance. Other companies may use different measures to analyze and report their results
of operations. Management believes these measures provide additional useful criteria to make investment decisions. These
performance measures are used, in conjunction with other information, by senior management and PPL's Board of
Directors to manage operations and analyze actual results compared with budget.
Reconciliations of adjusted gross margins for future periods are not provided as certain items excluded from Operating
Income are inherently subject to change and are not significant.
Definitions of non-GAAP Financial Measures