Business Process Analytics als Tool für Pr · PDF fileBusiness Process Analytics als Tool...
21
Business Process Analytics als Tool für Prozessverbesserung Die "Kronjuwelen" des SAP Solution Managers glitzern jetzt auch im Kristallkonzern 21.04.2015 Salzburg Frank Steinbach, IT Process Manager, D. Swarovski KG
-
Upload
nguyenngoc -
Category
Documents
-
view
219 -
download
0
Transcript of Business Process Analytics als Tool für Pr · PDF fileBusiness Process Analytics als Tool...
Business Process Analytics als Tool für
Prozessverbesserung
Die "Kronjuwelen" des SAP Solution Managers glitzern jetzt auch im
Kristallkonzern
21.04.2015 Salzburg
Frank Steinbach, IT Process Manager, D. Swarovski KG

AGENDA
2
Swarovski Company Overview
BPI@Swarovski
Context of Program
Implementation
Facts & Figures
Success factors
Q&A

3

4
COMPANY HISTORY Foundation 1895 in Wattens by Daniel Swarovski I., Tyrol Austria
5th generation family business

5
SWAROVSKI GROUP
Areas of Business
Cut Crystal Elements Swarovski Elements
Crystal Objects, Jewelry & Accessories Swarovski
Precision Optical Equipment Swarovski Optik
Bonded Grinding & Dressing Tools Tyrolit
Precision Cut Synthetic Gemstones Swarovski Gems
Road Safety Products Swareflex
Headquarters: Wattens, AUSTRIA
Group Turnover: € 2.9 billion
Group Employees: 31.460
Global distribution: 42 countries
> 120 countries (retail)
Facts & Figures

SWAROVSKI CRYSTAL & JEWELRY BUSINESS
6
CONSUMER PRODUCTS
MADE BY SWAROVSKI
B2C
MADE WITH
SWAROVSKI ELEMENTS
B2B
B2C and B2B approach
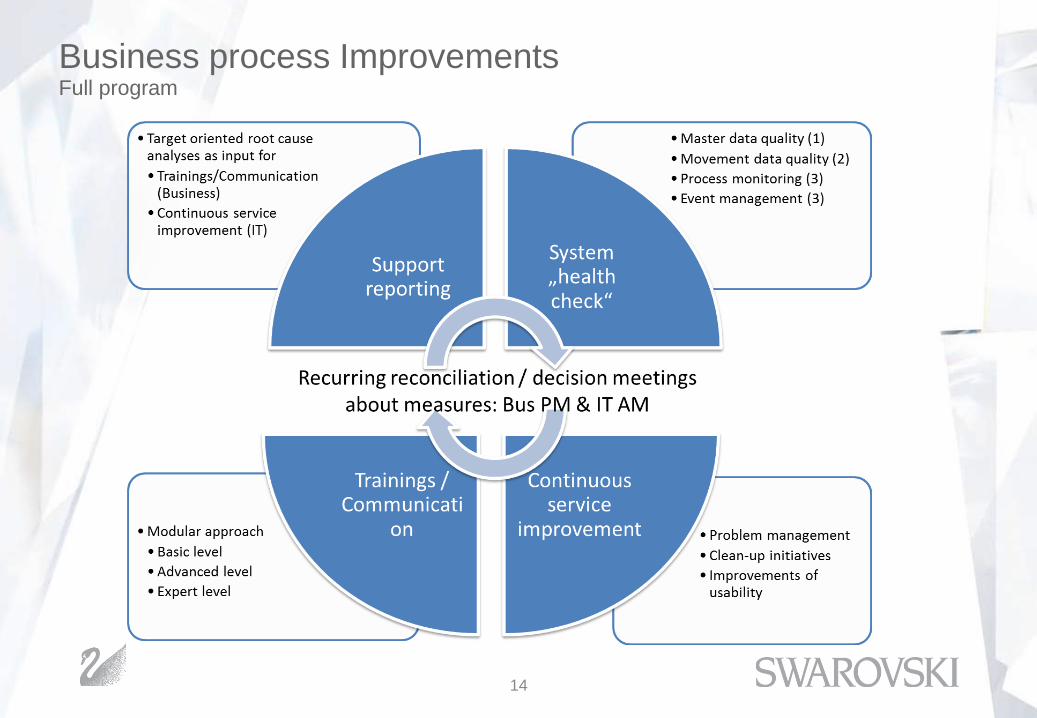
Business process improvements with
BP Analytics
14
Business process Improvements Full program
15
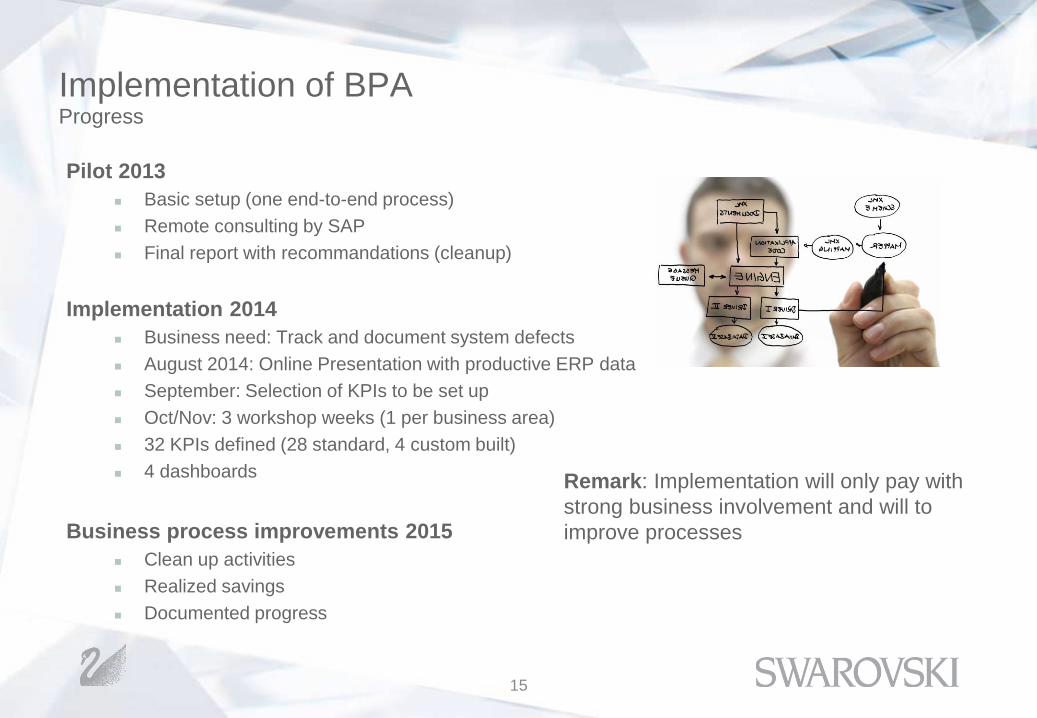
Implementation of BPA
Pilot 2013
Basic setup (one end-to-end process)
Remote consulting by SAP
Final report with recommandations (cleanup)
Implementation 2014
Business need: Track and document system defects
August 2014: Online Presentation with productive ERP data
September: Selection of KPIs to be set up
Oct/Nov: 3 workshop weeks (1 per business area)
32 KPIs defined (28 standard, 4 custom built)
4 dashboards
Business process improvements 2015
Clean up activities
Realized savings
Documented progress
Progress
Remark: Implementation will only pay with
strong business involvement and will to
improve processes
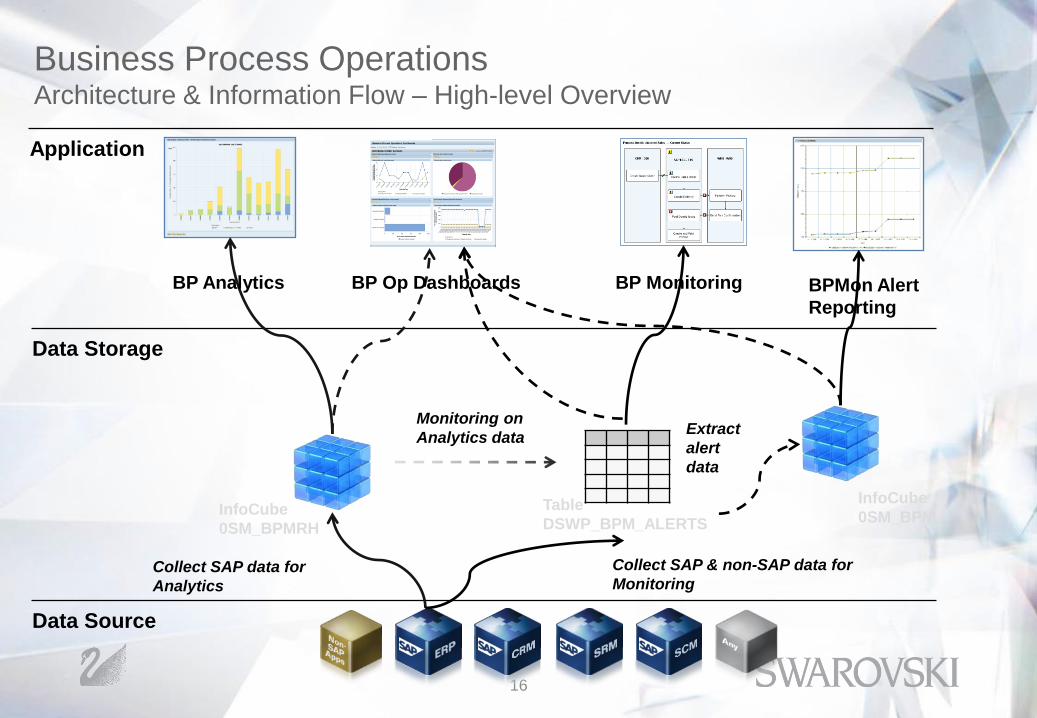
16
Data Storage
Collect SAP data for
Analytics
Data Source
Application
InfoCube
0SM_BPMRH
InfoCube
0SM_BPM Table
DSWP_BPM_ALERTS
Collect SAP & non-SAP data for
Monitoring
Extract
alert
data
Monitoring on
Analytics data
BPMon Alert
Reporting
BP Monitoring BP Analytics BP Op Dashboards
Business Process Operations Architecture & Information Flow – High-level Overview
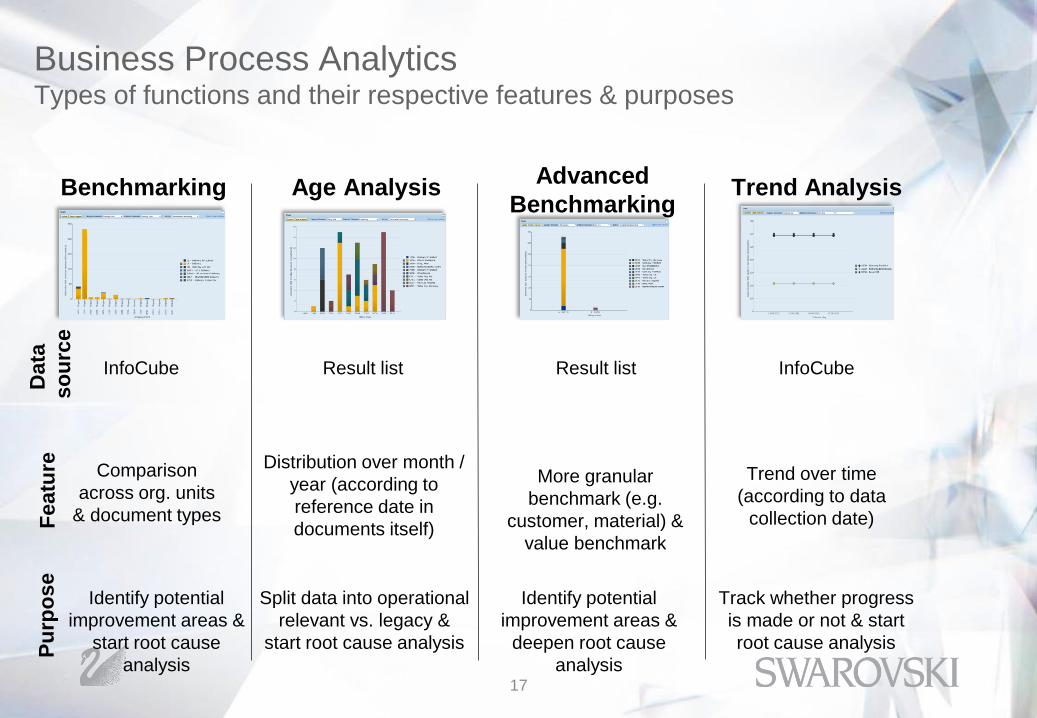
17
Business Process Analytics Types of functions and their respective features & purposes
Pu
rpo
se
F
eatu
re
Data
so
urc
e
Benchmarking
Comparison
across org. units
& document types
InfoCube
Identify potential
improvement areas &
start root cause
analysis
Trend Analysis
Trend over time
(according to data
collection date)
InfoCube
Track whether progress
is made or not & start
root cause analysis
Age Analysis
Distribution over month /
year (according to
reference date in
documents itself)
Result list
Split data into operational
relevant vs. legacy &
start root cause analysis
Advanced
Benchmarking
More granular
benchmark (e.g.
customer, material) &
value benchmark
Result list
Identify potential
improvement areas &
deepen root cause
analysis
18
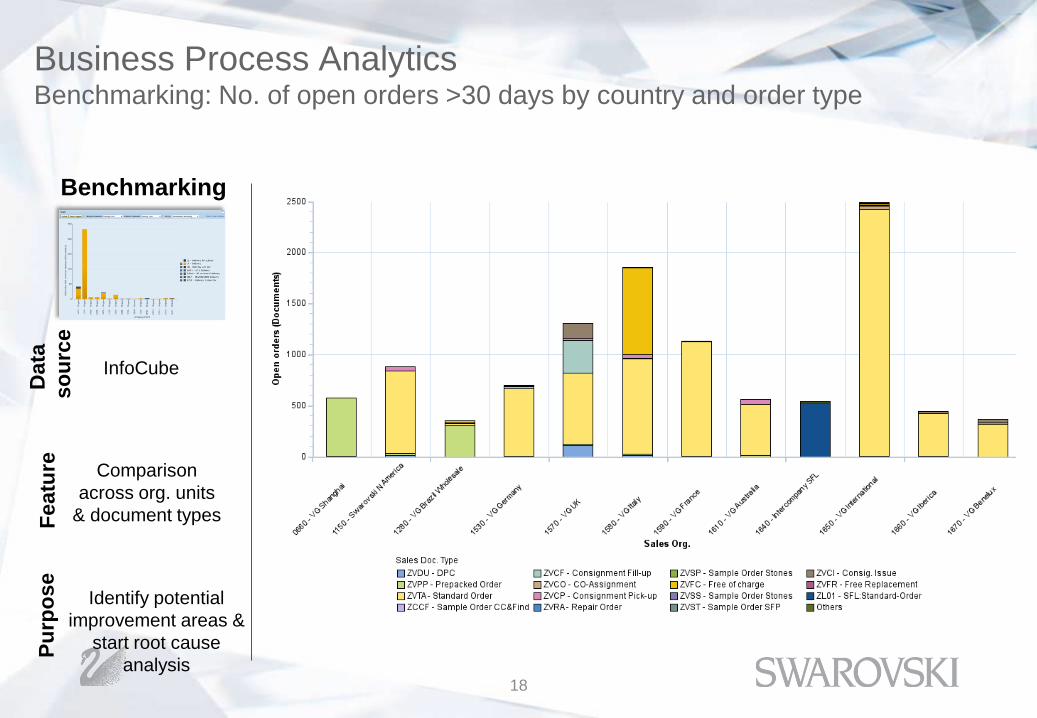
Business Process Analytics Benchmarking: No. of open orders >30 days by country and order type
Pu
rpo
se
F
eatu
re
Data
so
urc
e
Benchmarking
Comparison
across org. units
& document types
InfoCube
Identify potential
improvement areas &
start root cause
analysis

19
Business Process Analytics Age analysis: No. of FI-AR overdue external documents (clearing issues)
Pu
rpo
se
F
eatu
re
Data
so
urc
e
Age Analysis
Distribution over month /
year (according to
reference date in
documents itself)
Result list
Split data into operational
relevant vs. legacy &
start root cause analysis

20
Business Process Analytics Root cause analysis: Exceptions in payment run by company and error code
Pu
rpo
se
F
eatu
re
Data
so
urc
e
Advanced
Benchmarking
More granular
benchmark (e.g.
customer, material) &
value benchmark
Result list
Identify potential
improvement areas &
deepen root cause
analysis
21
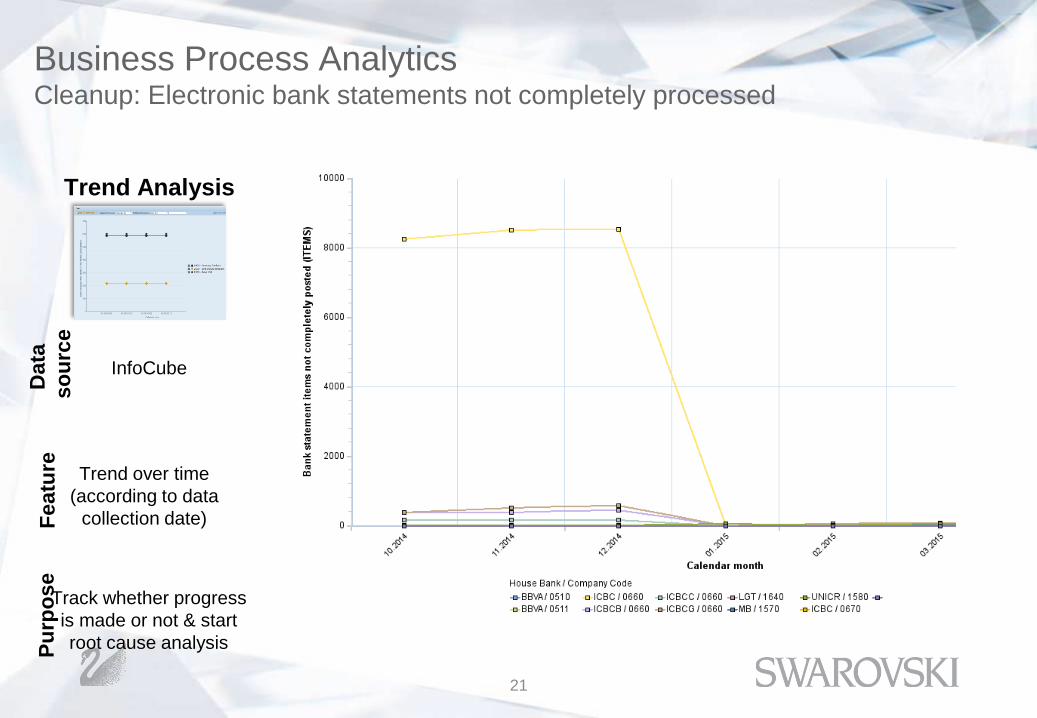
Business Process Analytics Cleanup: Electronic bank statements not completely processed
Pu
rpo
se
F
eatu
re
Data
so
urc
e
Trend Analysis
Trend over time
(according to data
collection date)
InfoCube
Track whether progress
is made or not & start
root cause analysis
22
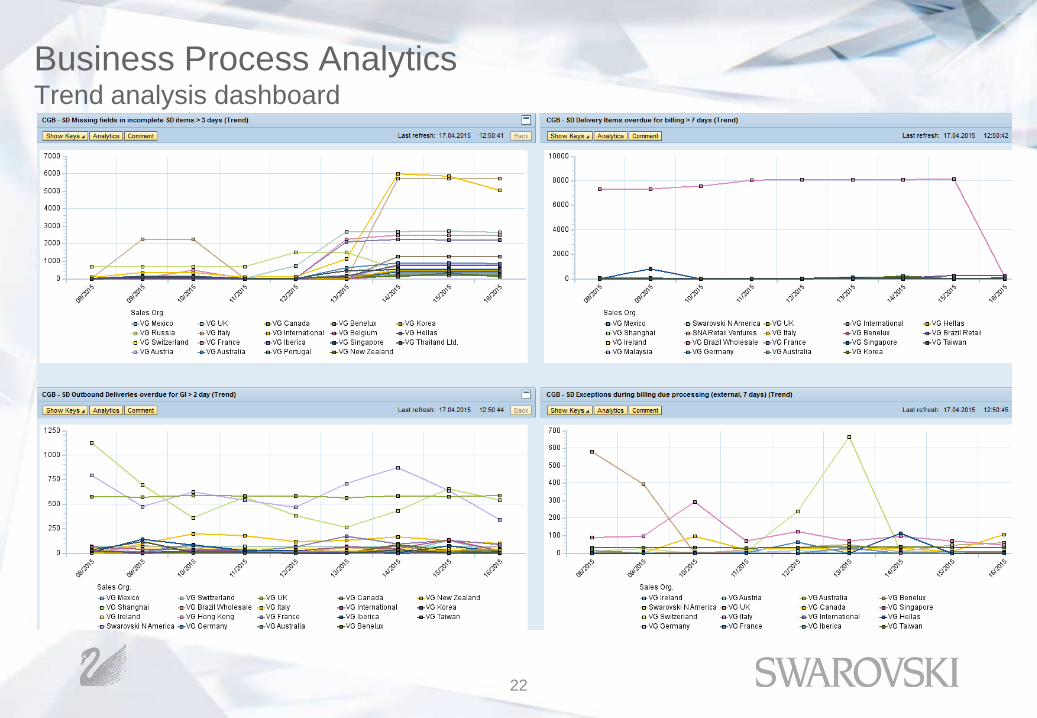
Business Process Analytics Trend analysis dashboard
23
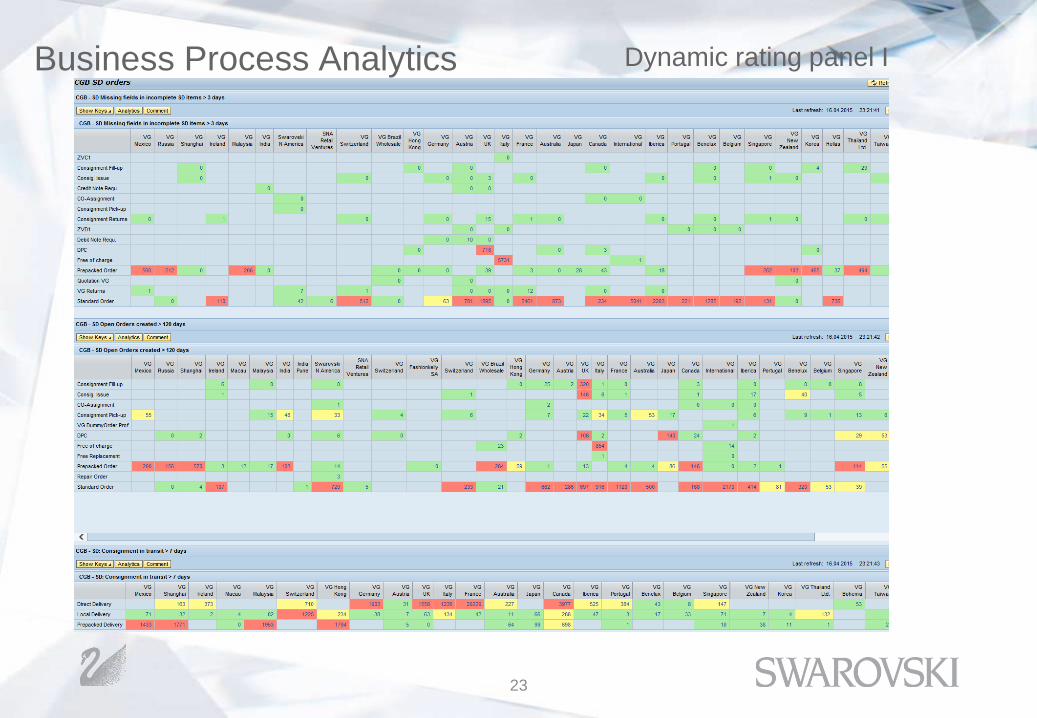
Business Process Analytics
Dynamic rating panel I
24
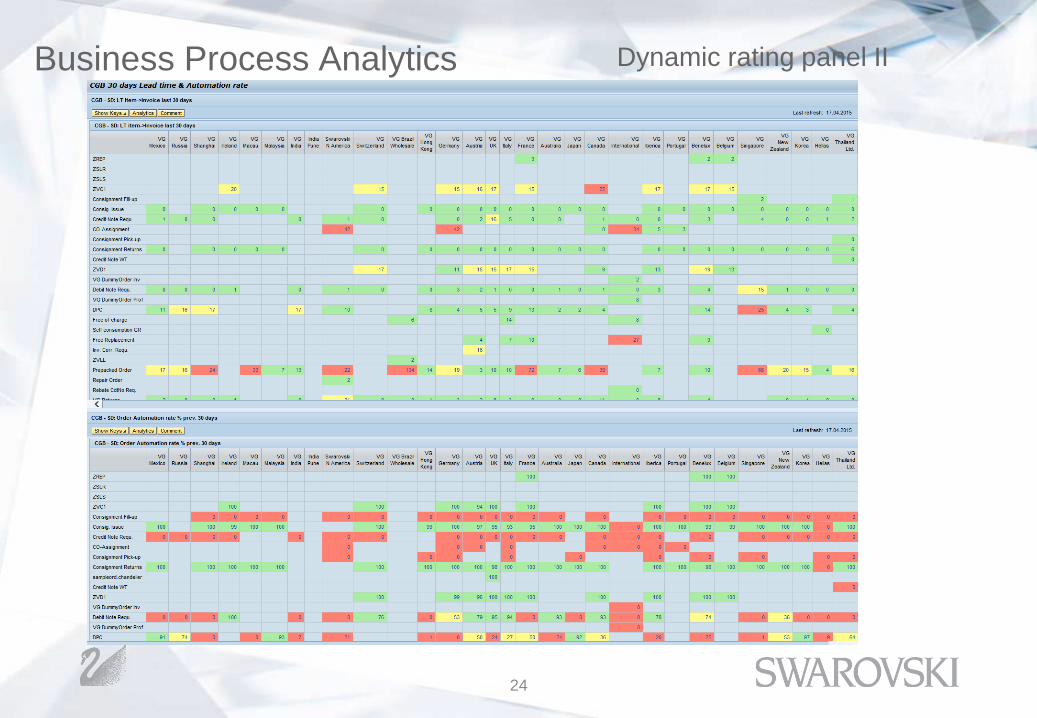
Business Process Analytics
Dynamic rating panel II
25
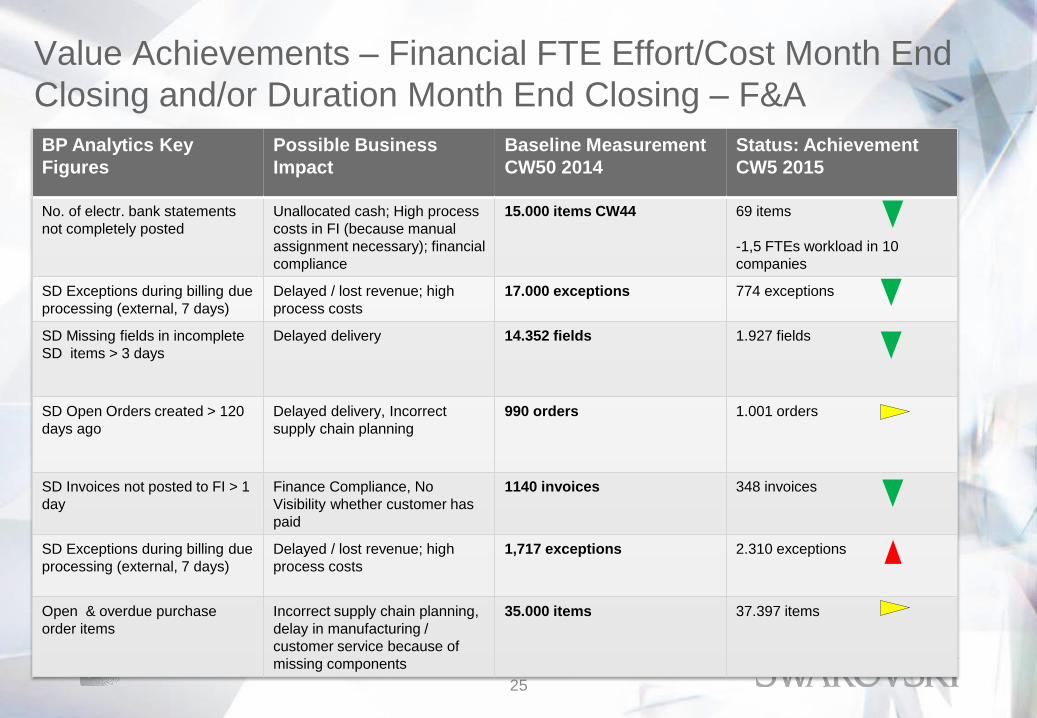
Value Achievements – Financial FTE Effort/Cost Month End
Closing and/or Duration Month End Closing – F&A
BP Analytics Key
Figures
Possible Business
Impact
Baseline Measurement
CW50 2014
Status: Achievement
CW5 2015
No. of electr. bank statements
not completely posted
Unallocated cash; High process
costs in FI (because manual
assignment necessary); financial
compliance
15.000 items CW44 69 items
-1,5 FTEs workload in 10
companies
SD Exceptions during billing due
processing (external, 7 days)
Delayed / lost revenue; high
process costs
17.000 exceptions 774 exceptions
SD Missing fields in incomplete
SD items > 3 days
Delayed delivery 14.352 fields 1.927 fields
SD Open Orders created > 120
days ago
Delayed delivery, Incorrect
supply chain planning
990 orders 1.001 orders
SD Invoices not posted to FI > 1
day
Finance Compliance, No
Visibility whether customer has
paid
1140 invoices 348 invoices
SD Exceptions during billing due
processing (external, 7 days)
Delayed / lost revenue; high
process costs
1,717 exceptions 2.310 exceptions
Open & overdue purchase
order items
Incorrect supply chain planning,
delay in manufacturing /
customer service because of
missing components
35.000 items 37.397 items

Q & A
26
Frank Steinbach
IT Process Manager
Swarovskistrasse 30, A - 6112 Wattens / Austria
Tel.: +43 (0)5224 500 1855
Mobile:+43 (0) 664 852 8689
Fax: +43 (0)5224 501 1855
mailto:[email protected]
www.swarovski.com