Bus Fuel Economy
28
description
Its all about the economic usage of fuel in buses by reducing the unwanted things related to the affecting of efficiency
Transcript of Bus Fuel Economy

What Do We Really Want? - Miles Per Gallon - Petroleum Miles Per Gallon - Miles per Dollar - Vehicle Total Costs vs Vehicle
Operating Costs

Bus Fuel Economy
For most of this presentation, let’s assume we start with an “ordinary” (non hybrid) natural gas or diesel
bus and want to maximize its MPG

Potential Ideas• Slow down, if possible• Lower HP• Look at engine BSFC curve• Better transmission/drivetrain match• Low rolling resistance tires• Wide based singles• Tire pressure • Low HP Engine Accessories• Aerodynamics• Less idling• Lower tare weight• Synthetic lubricants• Drive more gently• Hybrids• Alt fuels• Additives/ mileage enhancers• How to test for fuel economy improvement

Slow Down!
Potential Benefit: 2.2% mpg loss for every mph over 55
Problem: Transit and school buses don’t often go that fast
Lower HP Engine
Potential Benefit: - Better FE???- Lower Vehicle Cost
Potential Problems: - Driver Complaints- Longer Route Times

Look at BSFC Engine Curve
Diesel engine Brake Specific Fuel Consumption Curve from Heywood, “Internal Combustion Engine Fundamentals”
Lesson: Lower RPM = better fuel economy
100 N-m = 74 lb-ft HP= (Torque X RPM) / 5252
1 hp = 0.75 kw

Look at BSFC Engine Curve
Moral:
Lesson: Lower RPM = better fuel economy

Better transmission/drivetrain match
Potential Benefit: - Better FE – transmission should allow operation of the vehicle near “low-RPM, high MPG, sweet spot“
- Lower noise level
Potential Problems: - Driver Complaints

Lower Rolling Resistance Tires
Potential Benefit: - 2-3% Better FE- Benefits at all speeds
Potential Problems: - Are they available for transit buses?
- Initial Cost?

Wide-Base Singles in place of DualsPotential Benefit: - 2% Better FE
- Lower initial cost- Lower Weight
Potential Problems: - Are they available for transit buses?
- No reserve if tire fails

Tire Pressure
Potential Benefit: - 10 psi drop increases rolling resistance by 2% & FE by 0.5-1.0%
- Longer Tire Life
Potential Problems: It’s a hassle!
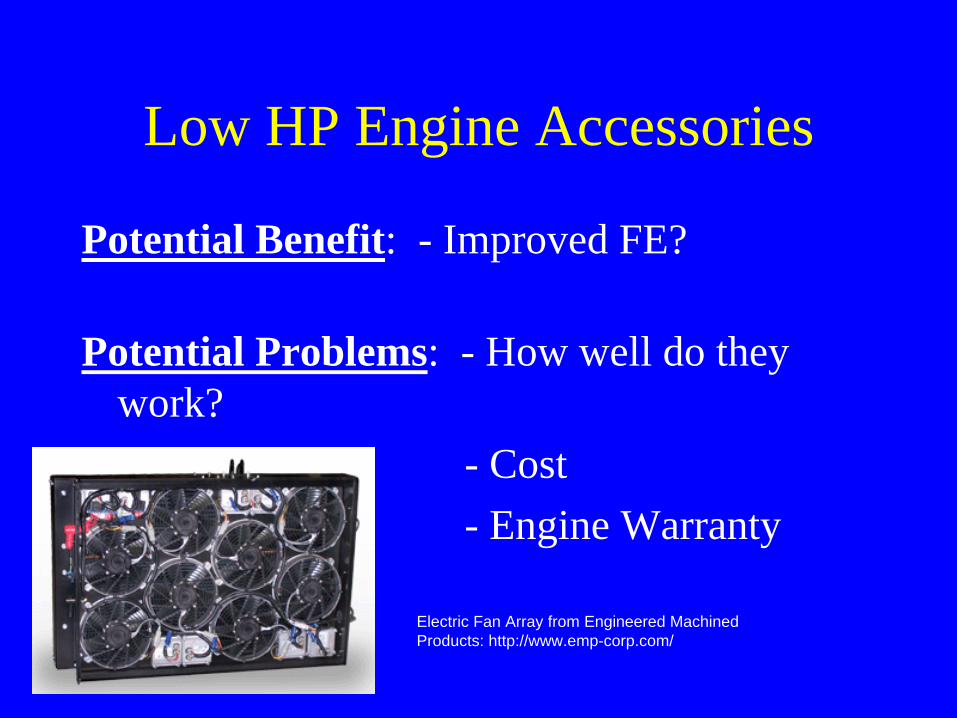
Low HP Engine Accessories
Potential Benefit: - Improved FE?
Potential Problems: - How well do they work?
- Cost- Engine Warranty
Electric Fan Array from Engineered Machined Products: http://www.emp-corp.com/

Better Aerodynamics
vs.
Potential Benefit: - Better FE- Better Image
Potential Problems: - Real benefit at higher speeds
Less Idling
Potential Benefit: - Infinite MPG!- Zero Emissions- Better Image
Potential Problems: - Driver Complaints- Engine Restarts- “We’ve always idled
buses”

Sample Idling Regulations
Locale Max Time ExemptionsCA 5 min pass onboard or 10 min < boardingAtlanta 15 (25 if <32F) NG or electric vehicles (!)DC 3 (5 if <32F) none relevantNYC 3 min bus picking up/discharging passengersMA 5 min none relevantVA 10 – diesel, 3 – others none relevant
list from American Transportation Research Institute - seehttp://www.atri-online.org/research/idling/Truck_Idling_Regulations.htm

Lower Tare WeightPotential Benefit: 10% change =
5-8% change in FE
Potential Problems: - Are low tare weight buses available?
- Initial cost penalty?- Mitigates against Natural Gas!

Synthetic LubricantsPotential Benefit: - Engine Oil 1.5%
- Axle and Transmission 1.5%- Longer change intervals- Longer component life
Potential Problems: - Increased Lubricant Cost

Driver Training – “Drive Gentle”Potential Benefit: - 5-20% FE
- Better Image- Longer Vehicle Life
Potential Problems: - Route Times- “You can’t drive a transit bus like that!”

Hybrids Natural Gas or Diesel
Potential Benefit: - 10-50% FE- Better Image- Lower Emissions
Potential Problems: - Initial Price Penalty (up to 75% increase!)- Battery Replacement

Alternative Fuels (NG)
Potential Benefit: - Up to 100% Petroleum Replacement (NG)- Government Alt Fuel Rebates- Lower Fuel Costs (at least for NG)- Improved Image
Potential Problems: - Initial Price Penalty- Fueling & Maintenance Facility Costs- Actual MPG likely poorer

Alternative Fuels (NG)• Cost (Alternative Fuels Index 11/30/07) before
tax:– Diesel - $2.72/gallon– NG - $1.64/DGE
• Cost (CVEF 8 Transit Fleet Survey 11/07)– Diesel - $2.86/gallon– NG - $1.46/DGE
Natural Gas Cost BEFOREBEFORE $0.50/GGE (=$0.56/DGE) Federal
Rebate!

Additives/Mileage Enhancers
For Instance: - Oil & Fuel Additives, - Magnetic Fuel Line Devices
Potential Benefit: - None -They don’t work!
Potential Problems: - Warranty Issues
- Cost
- Ridicule

How to Test for Fuel Economy Improvement
Uncontrolled Tests:
Controlled Tests:

Uncontrolled Tests• Same bus, different engines• Six buses with, six buses without• New “buy” of buses with new engine vs old buses
with old engineProblems:• Different drivers• Different buses• Different routes• Different seasons• Other variables• “Hawthorne effect”

Totally Controlled TestsProving Ground or Test Track with standard drive cycle
Avg
speed
6.9 mph
Avg speed
18.9 mph
Avg speed
12.3 mph

Semi-Controlled TestsSAE/TMC Tests on-road tests
Type I – two vehicles with component switched between runsType II – when it’s not possible to run two or more test
vehicles simultaneously; uses “control vehicle”Type III – components can be switched from one vehicle to
another in a short time Type IV – can use similar vehicles in revenue service
- information available from SAE or ATA’s Technology & Maintenance Council

Call for HelpHank SeiffDirector of TechnologyClean Vehicle Education [email protected]