BT500 India’s Most ValuablePrivate Sector Companiesmedia2.intoday.in/btmt/images/Private...
22
RANK 2008 2007 COMPANY AVERAGE MARKET CAPITALISATION (Rs cr) Apr-Oct 2008 Apr-Oct 2007 2007-08 2006-07 ⌧ 18 months ended Sept. 30, 2007 # 15 months ended Dec. 31, 2007 15 months ended Mar. 31, 2008 ● 12 months ended Dec. 31, 2006 ▲ 12 months ended March 31, 2007 ▼ 12 months ended Sept.30, 2007 ◆ 12 months ended Nov. 30, 2007 ❚ 12 months ended Dec. 31, 2007 ❏ 12 months ended Jun. 30, 2008 ◗ 12 months ended Sept. 30, 2008 9 months ended Dec. 31, 2007 ✪ 9 months ended Mar. 31, 2008 ❍ 6 months ended Mar. 31, 2008 ✛ 3 months ended Aug. 31, 2008 Figures for companies are standalone unless otherwise mentioned; + Consolidated results Source: CMIE Prowess, BSE and company websites TOTAL ASSETS (Rs cr) 2007-08 Rank BT 500 India’s Most Valuable Private Sector Companies 1 1 Reliance Industries 307,206.9 274,812.8 314,124.1 160,393.4 150,149.4 2 2 2 Bharti Airtel 148,728.1 167,959.1 166,592.7 97,891.1 41,171.0 8 3 6 Infosys Technologies 94,931.0 109,796.9 102,416.9 104,531.8 17,221.0 31 4 4 Reliance Communications 88,940.2 114,720.6 121,362.4 61,149.9 56,364.6 6 5 3 DLF 79,307.1 117,894.5 136,959.4 NL 23,441.9 18 6 5 Tata Consultancy Services 78,780.0 109,997.1 103,535.1 103,974.4 14,736.1 38 7 9 Larsen & Toubro 73,240.7 70,335.5 84,889.8 36,884.5 27,067.2 15 8 7 ICICI Bank 73,213.4 100,587.0 109,586.1 63,486.1 400,417.1 1 9 10 ITC 71,945.9 63,104.9 67,223.0 66,904.2 17,549.2 29 10 11 Reliance Petroleum 70,910.9 55,536.3 66,724.4 29,535.3 27,381.1 14 11 12 Housing Development Finance Corpn. 63,225.1 54,475.3 62,671.9 35,065.1 84,474.2 5 12 8 Wipro 60,941.8 72,621.2 70,712.2 77,668.9 20,191.6 24 13 14 Hindustan Unilever ❚ 51,243.5 44,884.3 45,547.7 51,052.0 6,830.1 67 14 17 HDFC Bank 48,827.6 41,290.6 46,296.0 28,658.2 133,251.0 3 15 NL Reliance Power 45,421.5 NL 83,685.8 NL 0.3 992 16 16 Tata Steel 45,293.8 41,884.8 47,868.2 28,370.6 55,160.8 7 17 23 Cairn India ❚ + 44,889.2 27,710.9 31,894.1 23,568.0 29,421.3 12 18 15 Sterlite Industries (India) 43,828.7 43,741.4 50,425.9 25,849.9 18,548.1 27 19 18 Suzlon Energy 31,675.7 40,462.9 44,068.0 33,968.4 12,915.1 45 20 36 Sun Pharmaceutical Inds. 29,082.8 19,628.8 21,097.6 17,026.0 5,465.3 84 21 22 Reliance Capital 28,031.9 30,427.5 37,723.3 12,539.0 16,495.6 35 22 21 Satyam Computer Services 27,457.6 30,777.2 29,675.9 27,130.8 8,828.1 52 23 13 Unitech 27,308.0 45,332.3 51,648.0 24,320.9 17,326.7 30 24 50 Jindal Steel & Power 27,172.8 13,562.4 23,228.8 5,759.1 9,789.7 49 25 32 Axis Bank 25,306.8 21,052.5 25,964.2 11,073.0 109,625.7 4 26 19 Idea Cellular 24,320.0 32,746.8 31,880.0 24,223.4 12,912.6 46 27 43 Tata Power Co. 23,801.3 15,203.4 20,184.7 10,586.6 13,075.7 44 28 90 Essar Oil 23,086.9 6,149.6 14,337.2 5,777.9 21,411.8 20 29 NL Mundra Port & Special Economic Zone 22,780.3 NL 34,981.0 NL 5,728.3 82 30 20 Hindustan Zinc 22,333.0 31,124.6 30,189.3 29,677.1 13,209.9 42 31 37 Reliance Infrastructure 21,904.3 19,436.8 28,382.1 10,839.2 20,374.7 23 32 28 Kotak Mahindra Bank 19,796.5 23,811.9 27,694.2 11,270.3 28,315.3 13 33 26 Maruti Suzuki India 19,494.1 25,132.0 25,435.8 25,078.5 13,151.0 43 34 38 Jaiprakash Associates 19,088.3 19,054.4 26,243.0 10,976.0 17,129.9 32 35 35 Hindalco Industries 18,351.2 19,860.9 20,986.9 20,022.2 30,963.5 11 36 30 ABB ❚ 18,298.4 23,654.5 25,278.5 13,170.0 4,665.1 92 37 27 GMR Infrastructure 18,177.4 23,995.1 27,699.5 10,838.2 6,105.1 76 38 24 Tata Motors 18,133.8 27,631.7 27,620.5 32,303.8 26,151.5 16 39 25 Grasim Industries 17,428.8 26,973.0 27,631.3 21,525.6 14,141.6 40 40 44 Cipla 16,765.6 15,072.6 15,399.6 19,072.6 5,733.2 81 41 45 Ranbaxy Laboratories ❚ 16,639.1 14,430.4 14,654.9 14,873.1 7,964.1 56 42 31 Siemens ▼ 16,270.7 22,691.2 25,021.2 18,098.3 5,800.3 77 43 56 Nestle India ❚ 16,028.9 11,648.0 12,271.6 10,246.2 1,448.6 284 44 33 HCL Technologies ❏ 15,831.9 21,051.0 20,155.4 18,889.6 5,792.6 78 45 47 Hero Honda Motors 15,683.7 13,787.8 13,822.3 14,926.9 5,073.6 89 46 65 Adani Enterprises 15,387.1 9,371.3 13,612.4 3,728.9 6,698.4 68 47 68 Glenmark Pharmaceuticals 15,024.1 8,757.5 10,194.4 5,308.8 1,935.4 218 48 59 JSW Steel 14,113.1 11,323.2 13,685.8 5,231.4 20,731.4 22 49 74 Reliance Natural Resources 13,766.4 7,786.9 14,505.8 3,176.9 2,980.6 146 50 40 Mahindra & Mahindra 13,453.6 18,058.2 17,895.2 17,470.3 10,380.7 48
Transcript of BT500 India’s Most ValuablePrivate Sector Companiesmedia2.intoday.in/btmt/images/Private...

RANK2008 2007
COMPANY AVERAGE MARKET CAPITALISATION (Rs cr)Apr-Oct 2008 Apr-Oct 2007 2007-08 2006-07
⌧ 18 months ended Sept. 30, 2007# 15 months ended Dec. 31, 2007� 15 months ended Mar. 31, 2008
● 12 months ended Dec. 31, 2006▲ 12 months ended March 31, 2007▼ 12 months ended Sept.30, 2007
◆ 12 months ended Nov. 30, 2007❚ 12 months ended Dec. 31, 2007❏ 12 months ended Jun. 30, 2008
◗ 12 months ended Sept. 30, 2008�9 months ended Dec. 31, 2007✪ 9 months ended Mar. 31, 2008
❍ 6 months ended Mar. 31, 2008✛ 3 months ended Aug. 31, 2008
Figures for companies are standalone unless otherwise mentioned; + Consolidated results Source: CMIE Prowess, BSE and company websites
TOTAL ASSETS (Rs cr)2007-08 Rank
BT 500 India’s Most Valuable Private Sector Companies
1 1 Reliance Industries 307,206.9 274,812.8 314,124.1 160,393.4 150,149.4 2
2 2 Bharti Airtel 148,728.1 167,959.1 166,592.7 97,891.1 41,171.0 8
3 6 Infosys Technologies 94,931.0 109,796.9 102,416.9 104,531.8 17,221.0 31
4 4 Reliance Communications 88,940.2 114,720.6 121,362.4 61,149.9 56,364.6 6
5 3 DLF 79,307.1 117,894.5 136,959.4 NL 23,441.9 18
6 5 Tata Consultancy Services 78,780.0 109,997.1 103,535.1 103,974.4 14,736.1 38
7 9 Larsen & Toubro 73,240.7 70,335.5 84,889.8 36,884.5 27,067.2 15
8 7 ICICI Bank 73,213.4 100,587.0 109,586.1 63,486.1 400,417.1 1
9 10 ITC 71,945.9 63,104.9 67,223.0 66,904.2 17,549.2 29
10 11 Reliance Petroleum 70,910.9 55,536.3 66,724.4 29,535.3 27,381.1 14
11 12 Housing Development Finance Corpn. 63,225.1 54,475.3 62,671.9 35,065.1 84,474.2 5
12 8 Wipro 60,941.8 72,621.2 70,712.2 77,668.9 20,191.6 24
13 14 Hindustan Unilever ❚ 51,243.5 44,884.3 45,547.7 51,052.0 6,830.1 67
14 17 HDFC Bank 48,827.6 41,290.6 46,296.0 28,658.2 133,251.0 3
15 NL Reliance Power 45,421.5 NL 83,685.8 NL 0.3 992
16 16 Tata Steel 45,293.8 41,884.8 47,868.2 28,370.6 55,160.8 7
17 23 Cairn India ❚ + 44,889.2 27,710.9 31,894.1 23,568.0 29,421.3 12
18 15 Sterlite Industries (India) 43,828.7 43,741.4 50,425.9 25,849.9 18,548.1 27
19 18 Suzlon Energy 31,675.7 40,462.9 44,068.0 33,968.4 12,915.1 45
20 36 Sun Pharmaceutical Inds. 29,082.8 19,628.8 21,097.6 17,026.0 5,465.3 84
21 22 Reliance Capital 28,031.9 30,427.5 37,723.3 12,539.0 16,495.6 35
22 21 Satyam Computer Services 27,457.6 30,777.2 29,675.9 27,130.8 8,828.1 52
23 13 Unitech 27,308.0 45,332.3 51,648.0 24,320.9 17,326.7 30
24 50 Jindal Steel & Power 27,172.8 13,562.4 23,228.8 5,759.1 9,789.7 49
25 32 Axis Bank 25,306.8 21,052.5 25,964.2 11,073.0 109,625.7 4
26 19 Idea Cellular 24,320.0 32,746.8 31,880.0 24,223.4 12,912.6 46
27 43 Tata Power Co. 23,801.3 15,203.4 20,184.7 10,586.6 13,075.7 44
28 90 Essar Oil 23,086.9 6,149.6 14,337.2 5,777.9 21,411.8 20
29 NL Mundra Port & Special Economic Zone 22,780.3 NL 34,981.0 NL 5,728.3 82
30 20 Hindustan Zinc 22,333.0 31,124.6 30,189.3 29,677.1 13,209.9 42
31 37 Reliance Infrastructure 21,904.3 19,436.8 28,382.1 10,839.2 20,374.7 23
32 28 Kotak Mahindra Bank 19,796.5 23,811.9 27,694.2 11,270.3 28,315.3 13
33 26 Maruti Suzuki India 19,494.1 25,132.0 25,435.8 25,078.5 13,151.0 43
34 38 Jaiprakash Associates 19,088.3 19,054.4 26,243.0 10,976.0 17,129.9 32
35 35 Hindalco Industries 18,351.2 19,860.9 20,986.9 20,022.2 30,963.5 11
36 30 ABB ❚ 18,298.4 23,654.5 25,278.5 13,170.0 4,665.1 92
37 27 GMR Infrastructure 18,177.4 23,995.1 27,699.5 10,838.2 6,105.1 76
38 24 Tata Motors 18,133.8 27,631.7 27,620.5 32,303.8 26,151.5 16
39 25 Grasim Industries 17,428.8 26,973.0 27,631.3 21,525.6 14,141.6 40
40 44 Cipla 16,765.6 15,072.6 15,399.6 19,072.6 5,733.2 81
41 45 Ranbaxy Laboratories ❚ 16,639.1 14,430.4 14,654.9 14,873.1 7,964.1 56
42 31 Siemens ▼ 16,270.7 22,691.2 25,021.2 18,098.3 5,800.3 77
43 56 Nestle India ❚ 16,028.9 11,648.0 12,271.6 10,246.2 1,448.6 284
44 33 HCL Technologies ❏ 15,831.9 21,051.0 20,155.4 18,889.6 5,792.6 78
45 47 Hero Honda Motors 15,683.7 13,787.8 13,822.3 14,926.9 5,073.6 89
46 65 Adani Enterprises 15,387.1 9,371.3 13,612.4 3,728.9 6,698.4 68
47 68 Glenmark Pharmaceuticals 15,024.1 8,757.5 10,194.4 5,308.8 1,935.4 218
48 59 JSW Steel 14,113.1 11,323.2 13,685.8 5,231.4 20,731.4 22
49 74 Reliance Natural Resources 13,766.4 7,786.9 14,505.8 3,176.9 2,980.6 146
50 40 Mahindra & Mahindra 13,453.6 18,058.2 17,895.2 17,470.3 10,380.7 48
SALES (Rs cr)2007-08 2006-07 Q-2 2008-09 Rank
NET PROFIT (Rs cr)2007-08 2006-07 Q-2 2008-09 Rank
PROFIT AS %OF SALES
RONW (%) ROCE (%) EPS (Rs)
NL=Not listedNA=Not applicable or not available
RONW= Return on networthROCE=Return on capital employedEPS=Earning per share
Numbers in brackets indicate negative figure
1-50Private Sector
2007-08
145,933.2 118,832.5 44,938.0 1 19,506.4 11,943.9 4,122.0 1 13.4 27.1 20.5 101.3
26,087.6 17,967.1 8,302.8 4 6,244.2 4,033.2 1,604.8 2 23.9 39.7 38.3 32.9
16,692.0 13,655.0 5,253.0 12 4,470.0 3,782.0 1,390.0 5 26.8 33.3 33.3 76.0
15,312.6 13,017.1 3,547.2 14 2,586.5 2,408.9 468.7 11 16.9 11.4 7.0 12.5
6,062.0 1,430.7 1,362.9 45 2,574.6 406.9 639.0 12 42.5 43.2 23.1 15.2
19,371.6 15,161.2 5,809.7 10 4,508.8 3,757.3 1,173.0 4 23.3 43.2 43.2 42.5
26,050.3 18,576.2 7,842.3 5 2,173.3 1,402.2 460.3 15 8.3 26.6 21.1 74.4
40,564.8 29,957.2 9,712.3 2 4,157.7 3,110.2 1,014.2 7 10.2 11.2 3.6 37.4
22,131.9 20,007.4 3,973.1 7 3,120.1 2,700.0 802.7 8 14.1 26.7 26.6 8.3
NA NA NA NA NA NA NA NA NA NA NA NA
8,903.6 5,914.9 2,620.6 30 2,436.3 1,570.4 534.2 13 27.4 27.8 3.6 85.8
18,087.7 14,047.2 5,551.6 11 3,063.3 2,842.1 852.5 9 16.9 29.3 27.4 21.0
15,465.6 13,946.1 4,289.5 13 1,925.5 1,855.4 546.6 17 12.5 82.4 82.3 8.2
12,686.5 8,483.6 4,634.3 19 1,590.2 1,141.5 528.0 22 12.5 17.7 10.6 44.9
132.9 NA 64.1 820 85.4 NA 47.2 299 64.3 NA NA 0.2
23,184.3 20,344.1 7,089.0 6 4,687.0 4,222.2 1,787.8 3 20.2 22.6 13.7 66.2
1,144.7 NA 526.1 267 (24.5) NA 293.3 959 (2.1) (0.3) (0.3) (0.5)
14,310.5 12,704.2 3,940.4 15 951.6 784.0 462.9 40 6.6 10.0 7.6 14.2
7,151.4 5,529.4 2,264.7 39 1,265.7 1,061.1 17.0 28 17.7 25.3 19.7 10.2
3,343.4 2,472.4 970.4 81 1,014.0 628.9 303.1 36 30.3 30.5 26.0 49.0
2,086.7 895.9 678.1 137 1,022.0 646.2 195.3 35 49.0 18.6 16.8 41.8
8,415.2 6,410.1 2,784.0 33 1,715.7 1,423.2 597.4 21 20.4 26.1 26.1 25.6
2,969.7 2,600.1 906.3 90 1,030.3 984.0 415.6 34 34.7 62.4 16.0 6.4
6,256.2 3,981.1 2,231.1 44 1,237.0 703.0 450.0 29 19.8 39.9 20.3 80.3
8,816.1 5,474.7 3,239.5 31 1,071.0 659.0 402.9 32 12.1 17.1 7.1 29.9
6,961.6 4,412.5 2,300.6 40 1,044.4 502.1 150.4 33 15.0 34.5 13.1 4.0
6,501.1 5,283.3 2,147.3 41 869.9 696.8 261.9 44 13.4 11.6 8.1 39.4
579.2 484.4 13,740.0 464 (41.2) (67.5) 26.0 966 (7.1) (1.5) (0.4) (0.4)
891.7 602.0 303.8 341 213.4 187.4 112.3 140 23.9 11.7 6.2 5.1
9,668.8 9,477.3 1,971.2 27 4,396.1 4,441.8 959.5 6 45.5 42.8 42.8 101.0
7,382.4 6,685.7 2,633.3 38 1,084.6 801.5 289.0 31 14.7 7.7 5.6 42.1
3,178.2 1,714.8 806.8 87 293.9 141.4 47.9 102 9.2 11.1 4.4 8.5
22,001.8 17,922.0 5,089.7 9 1,730.8 1,562.0 296.1 19 7.9 21.7 20.2 60.2
4,615.7 3,830.8 1,286.6 55 609.7 414.9 203.1 51 13.2 17.7 6.6 5.2
22,096.6 20,262.9 5,860.0 8 2,860.9 2,564.3 720.0 10 12.9 15.2 10.6 18.9
6,454.3 4,683.0 1,559.0 42 490.4 340.3 104.8 55 7.6 34.8 35.2 24.7
112.2 34.1 54.8 845 62.7 2.9 24.2 374 55.9 1.7 1.6 0.3
33,862.5 32,189.1 7,508.1 3 2,028.9 1,913.5 347.0 16 6.0 26.9 19.1 52.6
12,173.5 9,903.5 2,784.9 21 2,232.6 1,535.8 419.5 14 18.3 30.3 22.2 238.0
4,428.9 3,763.7 1,371.6 57 701.4 668.0 151.4 47 15.8 20.0 20.0 9.0
4,406.2 3,743.7 1,329.9 58 617.7 395.1 (352.9) 50 14.0 18.3 9.5 13.3
8,380.3 4,978.6 NA 34 596.5 360.1 NA 53 7.1 39.6 39.6 11.1
3,672.6 3,001.4 1,115.8 74 413.8 315.1 131.8 63 11.3 103.0 103.0 49.4
4,785.8 3,116.3 1,225.7 52 780.6 638.3 253.8 45 16.3 23.6 23.3 17.8
12,761.6 11,965.8 3,264.3 18 967.9 857.9 306.3 38 7.6 35.6 33.8 48.5
11,882.4 10,393.5 3,125.4 22 312.1 150.7 66.8 95 2.6 22.5 9.9 12.6
1,462.1 877.9 251.4 210 389.0 134.8 66.9 71 26.6 48.0 32.7 14.2
12,940.5 9,465.9 4,311.8 17 1,728.2 1,292.0 317.5 20 13.4 26.3 14.4 92.4
368.3 252.5 82.5 594 68.6 29.9 20.1 344 18.6 4.5 2.5 0.4
13,504.8 11,783.4 3,321.3 16 1,103.4 1,068.4 226.8 30 8.2 23.0 15.3 37.9
RELIANCE INDUSTRIES maintained its top slot forthe sixth year in a row. ICICI BANK is #1 in assets.

RANK2008 2007
COMPANY AVERAGE MARKET CAPITALISATION (Rs cr)Apr-Oct 2008 Apr-Oct 2007 2007-08 2006-07
⌧ 18 months ended Sept. 30, 2007# 15 months ended Dec. 31, 2007� 15 months ended Mar. 31, 2008
● 12 months ended Dec. 31, 2006▲ 12 months ended March 31, 2007▼ 12 months ended Sept.30, 2007
◆ 12 months ended Nov. 30, 2007❚ 12 months ended Dec. 31, 2007❏ 12 months ended Jun. 30, 2008
◗ 12 months ended Sept. 30, 2008�9 months ended Dec. 31, 2007✪ 9 months ended Mar. 31, 2008
❍ 6 months ended Mar. 31, 2008✛ 3 months ended Aug. 31, 2008
Figures for companies are standalone unless otherwise mentioned Source: CMIE Prowess, BSE and company websites
TOTAL ASSETS (Rs cr)2007-08 Rank
BT 500 India’s Most Valuable Private Sector Companies
51 48 United Spirits 12,720.5 13,684.3 14,912.5 5,512.8 3,414.8 128
52 34 Ambuja Cements ❚ 12,574.9 19,902.0 19,843.5 16,557.5 6,566.9 69
53 53 Tata Communications 12,504.8 12,990.5 14,221.7 11,830.1 9,776.6 50
54 49 Bosch ❚ 12,222.8 13,634.4 13,548.3 10,163.5 3,906.9 103
55 72 Sesa Goa 12,073.1 8,085.6 10,126.3 5,055.7 3,188.5 138
56 52 Aditya Birla Nuvo 11,195.9 13,179.0 14,218.7 7,957.3 7,692.6 58
57 70 Asian Paints 11,126.0 8,608.4 9,279.4 6,368.0 2,023.2 209
58 39 ACC ❚ 11,085.4 18,888.3 17,781.9 17,287.4 7,116.7 64
59 46 Sun TV Network 10,321.9 14,164.1 13,985.4 9,064.4 1,712.6 244
60 61 Dr. Reddy’s Laboratories 10,075.1 10,861.1 10,722.4 11,496.7 6,511.8 72
61 58 Aban Offshore 9,838.0 11,355.0 13,088.1 4,717.2 2,709.4 162
62 84 Centurion Bank Of Punjab ▲ 9,825.6 6,674.6 7,816.8 4,070.9 18,791.1 26
63 41 Oracle Financial Services Software 9,687.9 17,817.2 14,980.5 12,116.4 3,284.0 134
64 54 Housing Development & Infrastructure 9,523.8 12,769.7 16,190.5 NL 7,602.9 59
65 64 GlaxoSmithKline Pharmaceuticals ❚ 9,474.7 10,053.3 9,388.3 9,951.6 3,516.3 124
66 75 Divi’s Laboratories 8,931.7 7,698.9 8,364.3 2,914.4 1,196.8 328
67 51 Zee Entertainment Enterprises 8,896.5 13,473.6 12,812.1 11,680.2 2,889.2 151
68 42 Tech Mahindra 8,630.1 16,714.9 14,424.4 13,917.4 2,241.7 190
69 63 Crompton Greaves 8,618.9 10,467.7 11,248.7 6,182.6 2,380.6 180
70 76 Punj Lloyd 8,046.0 7,610.0 9,744.6 4,544.5 5,322.9 86
71 62 Indiabulls Real Estate 7,833.9 10,550.6 12,012.6 5,478.5 3,394.1 129
72 67 Dabur India 7,803.0 8,815.3 8,923.6 8,152.2 1,155.6 331
73 NL Bajaj Auto ❖❖ 7,797.0 NL NL NL 4,941.2 90
74 57 Ultratech Cement 7,077.8 11,468.0 11,298.7 10,378.7 6,272.0 74
75 92 Lanco Infratech 7,001.9 5,941.1 8,200.1 4,906.7 4,517.7 93
76 95 Tata Chemicals 6,922.3 5,645.1 6,351.8 4,816.7 7,542.7 61
77 88 Jai Corp 6,852.1 6,316.6 10,339.4 878.2 2,699.3 163
78 86 Areva T&D India ❚ 6,821.8 6,633.3 8,024.0 3,183.4 1,721.6 242
79 55 Indiabulls Financial Services 6,790.2 12,600.1 14,189.7 6,031.7 15,476.3 37
80 93 Piramal Healthcare 6,652.6 5,778.8 6,045.2 4,761.2 2,176.5 196
81 91 United Phosphorus 6,640.4 6,143.4 6,550.6 5,118.1 4,209.8 98
82 NL Bajaj Finserv 6,547.0 NL NL NL 1,567.7 266
83 60 Financial Technologies (India) 6,504.6 11,139.9 10,495.0 7,247.1 1,999.7 213
84 286 Rei Agro 6,435.6 1,518.3 2,834.5 601.9 3,082.4 142
85 NL KSK Energy Ventures 6,336.5 NL NL NL 314.2 729
86 73 BF Utilities ▼ 6,317.0 7,948.6 7,445.5 7,840.3 376.8 672
87 137 Jaybharat Textiles & Real Estate 6,234.7 3,877.6 4,261.0 914.4 362.6 689
88 69 Videocon Industries ◗ 6,159.4 8,703.4 9,631.9 9,646.5 12,554.5 47
89 161 Shriram Transport Finance Co. 6,148.0 3,243.5 4,752.9 1,864.3 18,277.6 28
90 71 Indian Hotels Co. 6,147.2 8,328.3 8,444.4 7,887.0 3,797.0 107
91 102 Lupin 5,710.3 5,294.5 4,984.4 4,245.1 2,958.2 148
92 109 Great Eastern Shipping Co. 5,701.6 5,024.7 5,645.7 4,301.4 7,116.4 65
93 77 Pantaloon Retail (India) ❏ 5,581.3 7,282.2 8,002.1 5,071.7 2,809.2 154
94 101 Godrej Industries 5,574.3 5,318.6 7,145.6 3,691.5 1,873.4 225
95 128 Educomp Solutions 5,556.2 4,109.8 4,998.2 981.3 747.3 445
96 146 Welspun-Gujarat Stahl Rohren 5,527.7 3,661.8 4,975.2 1,089.4 5,300.3 87
97 78 Cummins India 5,507.5 7,256.9 7,077.3 4,618.5 1,798.1 234
98 143 Akruti City 5,438.9 3,691.9 5,072.1 2,853.1 1,578.8 262
99 104 Colgate-Palmolive (India) 5,398.8 5,204.6 5,259.1 5,079.0 716.4 461
100 129 Exide Industries 5,356.1 4,099.2 4,732.4 2,646.6 2,008.9 212

SALES (Rs crore)2007-08 2006-07 Q-2 2008-09 Rank
NET PROFIT (Rs crore)2007-08 2006-07 Q-2 2008-09 Rank
PROFIT AS %OF SALES
RONW (%) ROCE (%) EPS (Rs)
NL=Not listedNA=Not applicable or not available
❖❖ After a demerger on March 31,2007, BHIL was renamed Bajaj Autoand Bajaj Auto was renamed BHIL
RONW= Return on networthROCE=Return on capital employedEPS=Earning per share
Numbers in brackets indicate negative figure
Private Sector
2007-08
TCS is the highest net exporter with foreignexchange earnings of almost Rs 10,000 crore.
3,207.0 3,041.5 914.5 84 321.0 494.0 93.9 89 10.0 16.8 8.1 32.1
7,486.7 7,272.2 1,443.2 37 1,769.1 1,503.3 250.1 18 23.6 40.2 35.1 8.1
3,465.3 3,975.9 1,028.1 79 304.5 468.6 32.6 98 8.8 4.2 4.2 11.1
5,159.1 4,581.6 1,339.5 48 609.2 548.0 158.2 52 11.8 20.0 18.3 177.2
3,708.3 2,096.0 803.8 72 1,492.0 606.4 306.1 23 40.2 69.4 69.4 379.1
4,260.0 3,693.1 1,343.6 60 243.1 225.0 65.3 118 5.7 4.5 3.0 21.7
4,145.3 3,423.6 1,187.7 62 375.2 272.1 121.7 77 9.1 45.1 42.0 39.4
8,308.8 6,779.0 1,870.7 35 1,438.6 1,231.8 283.4 24 17.3 32.7 28.7 64.7
926.0 726.4 275.0 326 367.0 268.8 108.3 80 39.6 26.8 27.1 9.3
3,797.6 4,375.3 955.2 66 475.2 1,176.9 91.0 56 12.5 10.3 9.6 29.1
731.8 564.6 290.2 391 159.1 99.6 81.3 185 21.7 19.1 8.4 42.1
1,710.7 1,710.7 NA 172 121.4 121.4 NA 229 7.1 10.2 7.6 0.8
1,879.7 1,589.4 597.3 151 410.9 354.7 111.3 64 21.9 14.4 14.5 50.5
2,459.2 1,228.1 503.0 113 1,410.5 541.8 265.7 25 57.4 64.6 40.5 65.8
2,059.8 1,980.8 489.1 139 537.7 545.5 132.0 54 26.1 30.5 30.4 48.4
1,074.6 743.9 338.0 279 353.6 191.8 137.7 83 32.9 47.4 42.7 51.8
1,143.9 930.8 324.4 268 295.1 166.2 57.9 100 25.8 14.6 13.9 6.9
3,724.3 2,826.9 1,142.0 71 342.2 99.1 296.0 87 9.2 72.0 68.6 63.1
4,481.2 3,730.6 1,096.4 56 313.9 192.4 92.5 93 7.0 38.4 33.0 8.6
4,623.6 2,359.6 1,583.9 54 221.4 61.6 88.1 131 4.8 11.8 7.8 7.3
648.9 27.1 49.6 424 467.7 13.1 6.9 58 72.1 27.6 27.6 19.4
2,147.8 1,661.7 594.1 130 315.9 252.0 107.0 91 14.7 68.3 70.2 3.7
10,199.2 NA 2,570.5 24 755.8 NA 184.9 46 7.4 NA NA 54.2
6,386.1 5,545.5 1,424.0 43 1,007.6 782.3 164.2 37 15.8 45.2 27.1 80.9
1,603.6 553.4 642.9 188 200.2 73.1 39.9 153 12.5 13.4 11.2 9.0
4,885.0 4,310.5 3,644.7 51 949.2 444.2 215.8 41 19.4 31.1 20.9 40.6
464.9 354.2 134.2 529 128.1 71.6 18.8 221 27.6 8.3 7.9 6.8
2,238.1 1,789.3 588.5 125 216.3 137.0 52.3 138 9.7 45.7 45.8 46.6
1,327.9 353.8 475.4 236 382.0 153.1 44.8 74 28.8 17.1 7.5 15.1
2,095.2 1,781.9 636.9 134 301.5 188.3 69.4 99 14.4 27.5 27.2 14.4
1,838.0 1,672.3 692.9 155 91.9 107.0 68.8 284 5.0 4.4 2.1 4.3
106.4 NA 31.9 854 44.0 NA 14.2 473 41.3 NA NA 3.1
1,355.1 183.9 146.5 228 961.3 100.6 77.1 39 70.9 115.3 76.8 209.5
1,857.5 1,085.9 434.4 154 109.1 91.1 18.1 249 5.9 21.0 9.9 21.4
246.0 NA 88.9 710 108.7 NA 45.2 253 44.2 NA NA 5.2
32.6 19.2 NA 949 12.5 1.5 NA 789 38.3 5.7 3.8 1.0
424.4 249.9 124.7 546 32.6 31.8 8.3 562 7.7 41.7 12.4 1.3
10,187.9 8,876.6 2,631.1 25 931.3 858.8 175.5 42 9.1 15.8 9.4 38.3
2,501.9 1,425.8 905.8 111 389.8 190.4 165.6 70 15.6 26.6 3.4 30.6
1,837.3 1,653.3 399.4 156 377.5 322.4 50.7 76 20.5 20.1 13.7 5.2
2,807.3 2,215.5 772.4 96 443.4 298.0 131.9 60 15.8 30.1 17.7 54.0
3,206.0 2,256.5 992.5 85 1,356.8 883.3 506.2 27 42.3 29.1 17.7 60.5
5,052.7 3,328.8 1,512.4 50 126.0 120.0 36.2 224 2.5 14.7 8.2 7.9
920.2 853.0 258.5 329 108.8 78.1 9.1 251 11.8 13.4 10.6 3.6
276.9 112.2 103.7 674 70.1 28.6 25.4 336 25.3 35.1 16.2 40.6
4,233.4 2,901.9 1,496.7 61 351.2 142.6 65.3 84 8.3 33.4 13.3 19.8
2,753.5 2,157.8 824.2 97 280.7 242.1 93.9 105 10.2 27.6 27.5 14.2
516.7 188.3 267.0 499 294.7 75.9 192.2 101 57.0 39.9 25.6 44.2
1,638.0 1,452.4 439.5 182 231.7 160.2 63.5 126 14.1 101.1 99.1 17.0
3,658.2 2,405.2 900.8 75 250.3 155.2 77.8 115 6.8 28.6 22.7 3.1
51-100

RANK2008 2007
COMPANY AVERAGE MARKET CAPITALISATION (Rs cr)Apr-Oct 2008 Apr-Oct 2007 2007-08 2006-07
⌧ 18 months ended Sept. 30, 2007# 15 months ended Dec. 31, 2007� 15 months ended Mar. 31, 2008
● 12 months ended Dec. 31, 2006▲ 12 months ended March 31, 2007▼ 12 months ended Sept.30, 2007
◆ 12 months ended Nov. 30, 2007❚ 12 months ended Dec. 31, 2007❏ 12 months ended Jun. 30, 2008
◗ 12 months ended Sept. 30, 2008�9 months ended Dec. 31, 2007✪ 9 months ended Mar. 31, 2008
❍ 6 months ended Mar. 31, 2008✛ 3 months ended Aug. 31, 2008
Figures for companies are standalone unless otherwise mentioned; + Consolidated results Source: CMIE Prowess, BSE and company websites
TOTAL ASSETS (Rs cr)2007-08 Rank
BT 500 India’s Most Valuable Private Sector Companies
101 332 Sterling International Enterprises ❏ 5,312.2 1,221.0 1,633.6 1,038.6 62.4 963
102 85 Bharat Forge 5,261.4 6,659.5 6,866.8 7,748.4 3,985.0 102
103 148 GVK Power & Infrastructure 5,052.4 3,573.2 5,642.9 570.3 1,720.3 243
104 NL IRB Infrastructure Developers 5,046.1 NL 6,188.0 NL 1,383.8 300
105 123 EIH 5,040.2 4,283.3 5,130.9 3,728.1 2,527.0 168
106 79 Thermax 5,008.1 7,230.0 7,679.5 3,953.7 2,445.0 176
107 97 Titan Industries 4,932.7 5,631.5 5,623.6 3,377.2 1,610.6 255
108 94 Tata Teleservices (Maharashtra) 4,915.9 5,754.2 6,709.9 3,370.9 3,443.9 127
109 131 Torrent Power 4,864.6 4,069.8 5,531.3 3,377.5 7,334.0 63
110 29 Bajaj Holdings & Invst. (BHIL) ❖❖ 4,791.1 23,658.2 23,386.2 27,770.3 5,757.7 80
111 124 Jubilant Organosys 4,679.7 4,209.4 4,401.8 3,337.2 3,719.8 115
112 81 Century Textiles & Inds. 4,608.3 6,913.8 7,664.7 4,860.0 3,857.0 104
113 113 Tata Tea 4,560.7 4,952.5 4,923.3 4,237.4 3,104.8 141
114 100 MphasiS 4,472.0 5,507.8 5,382.8 3,534.1 1,489.9 274
115 135 CESC 4,425.8 3,945.4 5,056.1 2,559.7 8,587.0 54
116 155 Sintex Industries 4,396.1 3,387.9 4,276.8 2,061.8 3,753.9 112
117 140 Sterling Biotech ❚ 4,385.8 3,779.2 3,719.2 3,043.4 3,550.6 122
118 99 Anant Raj Inds. 4,356.0 5,592.6 6,689.4 2,962.0 3,142.6 140
119 142 Spice Communications ❚ 4,302.8 3,730.8 3,318.7 NL 2,777.9 156
120 260 Essar Shipping Ports & Logistics 4,285.3 1,659.4 3,541.7 1,353.8 3,626.0 118
121 NL Edelweiss Capital 4,232.9 NL 8,257.0 NL 2,562.4 166
122 136 Rolta India ❏ 4,199.7 3,939.1 3,978.5 1,901.0 1,925.3 220
123 120 Voltas 4,140.0 4,382.9 5,354.0 3,148.0 2,039.8 207
124 107 Ashok Leyland 4,067.8 5,061.0 5,240.0 5,459.7 5,592.5 83
125 110 IVRCL Infrastructures & Projects 4,019.4 5,002.5 5,399.4 3,389.6 3,747.3 113
126 134 JM Financial 3,966.3 3,945.7 5,250.2 2,130.2 1,863.8 227
127 66 Puravankara Projects 3,955.1 9,102.9 8,269.4 NL 2,219.1 192
128 98 India Cements 3,928.1 5,606.7 5,914.8 4,198.2 6,341.9 73
129 116 Biocon 3,891.1 4,643.3 4,824.3 3,929.0 1,749.5 239
130 126 Cadila Healthcare 3,881.1 4,151.6 3,879.7 4,041.4 2,312.5 183
131 80 Jet Airways (India) 3,849.0 6,972.9 6,848.3 5,836.2 20,928.5 21
132 108 YES Bank 3,806.2 5,043.6 5,645.0 2,982.8 16,983.2 34
133 82 United Breweries 3,758.3 6,775.2 6,495.2 3,578.3 1,389.6 299
134 115 Max India 3,748.3 4,880.1 4,778.8 3,031.9 2,459.7 174
135 158 Castrol India ❚ 3,633.7 3,321.3 3,323.4 2,614.5 965.6 369
136 NL Cals Refineries 3,571.0 NL 1,753.7 1.0 809.4 424
137 150 Marico 3,556.4 3,542.7 3,752.1 3,049.8 834.9 411
138 141 India Infoline 3,520.1 3,742.8 4,849.9 1,016.9 1,851.8 230
139 236 Gujarat N R E Coke 3,492.5 1,882.3 2,804.4 789.6 2,310.9 184
140 175 Federal Bank 3,455.3 2,783.2 3,646.7 1,757.8 32,608.5 10
141 186 Blue Star 3,454.0 2,497.7 3,109.8 1,438.0 1,181.5 329
142 163 Jain Irrigation Systems 3,445.4 3,212.7 3,597.1 1,795.1 2,519.9 169
143 151 Pidilite Industries 3,403.3 3,527.1 3,849.9 2,693.3 1,421.8 291
144 562 Shree Global Tradefin 3,381.4 442.5 700.0 NL 835.6 410
145 160 Bhushan Steel 3,356.5 3,265.7 3,887.1 1,253.4 8,805.6 53
146 144 Britannia Industries 3,252.7 3,683.3 3,536.3 2,995.5 1,232.2 325
147 169 Godrej Consumer Products 3,221.0 3,072.3 3,042.8 3,691.3 570.4 540
148 119 Nagarjuna Construction Co. 3,092.1 4,441.4 5,255.4 3,536.7 4,252.0 96
149 224 GTL Infrastructure 3,090.1 2,053.9 2,864.8 1,255.0 3,712.2 116
150 83 Patni Computer Systems ❚ 3,051.1 6,697.7 5,490.0 5,304.1 3,153.3 139

SALES (Rs cr)2007-08 2006-07 Q-2 2008-09 Rank
NET PROFIT (Rs cr)2007-08 2006-07 Q-2 2008-09 Rank
PROFIT AS %OF SALES
RONW (%) ROCE (%) EPS (Rs)
NL=Not listedNA=Not applicable or not available
❖❖ After a demerger on March 31,2007, BHIL was renamed Bajaj Autoand Bajaj Auto was renamed BHIL
RONW= Return on networthROCE=Return on capital employedEPS=Earning per share
Numbers in brackets indicate negative figure
Private Sector
2007-8
DLF lost Rs 38,587 crore worth of its marketvalue in the last 7 months over last year.
20.2 20.6 1.0 969 5.5 4.5 0.1 863 27.1 14.6 14.6 0.3
2,491.5 2,110.5 685.8 112 273.6 245.1 11.3 108 11.0 19.5 11.5 12.3
119.3 42.9 10.3 837 90.9 14.9 4.8 286 76.1 8.5 7.4 0.7
41.3 11.4 6.4 931 5.9 6.8 4.1 861 14.3 0.7 0.6 0.2
1,165.6 1,042.4 251.8 264 217.2 200.4 31.3 136 18.6 17.0 12.4 5.6
3,367.6 2,308.0 812.0 80 280.8 187.8 57.0 104 8.3 42.4 42.4 23.4
3,182.9 2,191.0 1,089.8 86 150.3 94.1 87.1 192 4.7 21.1 15.3 35.7
1,804.6 1,435.8 518.2 163 (125.7) (310.6) (47.4) 979 (7.0) 54.0 (9.9) (0.7)
3,733.4 1,451.9 1,157.7 70 211.2 71.8 107.5 143 5.7 8.1 4.7 5.0
355.7 10,118.7 160.3 605 307.0 1,249.9 151.3 96 86.3 7.1 6.0 30.3
2,349.3 1,930.6 685.3 118 392.3 231.5 24.4 69 16.7 33.4 14.4 26.8
4,004.2 3,635.8 905.2 63 279.4 272.8 28.6 107 7.0 26.1 16.3 33.0
1,452.9 1,295.5 375.9 212 312.9 306.6 43.8 94 21.5 8.7 7.7 25.3
1,726.1 1,104.9 654.7 170 220.8 131.5 112.7 132 12.8 22.5 22.4 10.6
3,037.2 2,649.9 786.0 89 355.4 300.7 124.0 82 11.7 7.6 7.8 26.3
1,834.9 1,239.5 463.6 159 216.3 130.6 68.2 137 11.8 20.2 10.7 15.9
920.8 610.9 303.7 328 183.7 133.5 61.3 163 20.0 17.0 7.4 7.1
587.7 176.2 168.3 457 451.7 100.7 126.4 59 76.8 13.7 12.6 15.3
1,486.4 408.4 322.7 207 380.1 (38.7) (81.0) 75 25.6 (27.0) (5.7) (1.0)
851.2 1,036.7 441.2 356 241.7 134.0 60.8 121 28.4 5.2 3.8 1.1
197.0 84.9 54.6 764 28.8 27.1 4.7 593 14.6 3.2 2.2 3.8
893.1 607.7 266.0 340 262.9 182.3 44.6 112 29.4 16.9 13.2 16.3
3,167.6 2,626.2 944.4 88 208.4 186.1 62.2 147 6.6 38.6 36.6 5.4
9,279.4 8,625.9 1,894.9 29 469.3 363.5 67.2 57 5.1 23.2 20.1 3.5
3,771.3 2,379.1 1,153.8 69 210.5 141.5 57.1 145 5.6 14.9 13.4 15.8
1,772.6 39.4 5.8 167 1,360.2 35.3 2.9 26 76.7 133.4 133.4 453.4
591.3 420.3 NA 456 211.0 115.2 NA 144 35.7 28.8 16.5 9.9
3,680.6 2,623.0 954.6 73 637.5 478.8 134.3 49 17.3 22.2 16.4 24.3
1,301.2 917.8 268.3 239 434.9 158.4 33.5 61 33.4 17.1 15.7 43.5
1,885.5 1,614.1 NA 150 236.2 204.7 NA 125 12.5 23.9 15.6 19.2
9,574.9 7,469.7 3,452.0 28 (253.1) 27.9 (384.5) 987 (2.6) (17.6) (5.8) (84.3)
1,671.7 788.3 569.9 176 200.0 94.4 63.6 154 12.0 19.0 8.7 6.8
2,006.1 1,511.3 372.1 144 62.5 65.1 5.2 376 3.1 10.3 7.6 2.9
414.6 220.7 122.0 558 61.9 14.2 11.7 381 14.9 4.1 3.9 2.8
2,334.5 2,131.6 565.1 119 218.4 154.5 59.6 134 9.4 51.0 50.6 20.2
1.1 NA NA 987 0.7 NA NA 915 64.5 NA NA 0.0
1,608.5 1,407.6 491.3 187 143.4 116.2 45.1 205 8.9 53.5 43.3 2.3
672.5 286.7 164.0 409 128.7 52.1 32.2 219 19.1 24.8 23.9 27.6
918.9 533.6 498.7 330 172.9 55.7 102.8 170 18.8 20.9 12.0 5.1
2,926.1 2,119.9 932.3 91 368.1 292.7 114.3 79 12.6 9.9 6.8 21.5
2,270.1 1,607.4 647.7 122 174.1 71.2 45.0 169 7.7 73.2 66.7 15.4
1,814.0 1,312.9 476.0 161 145.5 92.5 24.5 200 8.0 16.6 9.8 20.4
1,734.1 1,309.4 485.3 169 188.4 119.9 33.2 159 10.9 32.0 23.3 7.4
259.8 77.8 NA 690 NA NA NA NA NA NA NA NA
4,748.4 4,291.3 1,519.0 53 423.7 313.3 143.0 62 8.9 28.3 7.2 94.9
2,734.2 2,421.1 855.3 99 191.0 107.7 53.3 158 7.0 24.9 25.8 79.0
928.3 819.9 269.7 324 148.1 132.2 32.3 197 16.0 113.4 61.5 5.7
3,518.1 2,913.8 1,056.8 76 162.0 115.7 42.3 179 4.6 12.6 11.3 7.1
173.1 59.7 64.3 783 (59.5) (23.2) 14.5 972 (34.4) (11.3) (3.0) (0.8)
1,369.8 1,046.2 486.2 225 387.5 205.8 153.0 72 28.3 15.1 15.1 23.7
101-150

RANK2008 2007
COMPANY AVERAGE MARKET CAPITALISATION (Rs cr)Apr-Oct 2008 Apr-Oct 2007 2007-08 2006-07
⌧ 18 months ended Sept. 30, 2007# 15 months ended Dec. 31, 2007� 15 months ended Mar. 31, 2008
● 12 months ended Dec. 31, 2006▲ 12 months ended March 31, 2007▼ 12 months ended Sept.30, 2007
◆ 12 months ended Nov. 30, 2007❚ 12 months ended Dec. 31, 2007❏ 12 months ended Jun. 30, 2008
◗ 12 months ended Sept. 30, 2008�9 months ended Dec. 31, 2007✪ 9 months ended Mar. 31, 2008
❍ 6 months ended Mar. 31, 2008✛ 3 months ended Aug. 31, 2008
Figures for companies are standalone unless otherwise mentioned; + Consolidated results Source: CMIE Prowess, BSE and company websites
TOTAL ASSETS (Rs cr)2007-08 Rank
BT 500 India’s Most Valuable Private Sector Companies
151 132 Praj Industries 2,995.0 3,959.7 3,740.8 1,760.7 691.1 475
152 127 Madras Cements 2,973.3 4,121.9 4,341.9 3,539.0 3,359.0 130
153 NL Onmobile Global 2,971.3 NL 3,119.3 NL 869.5 405
154 201 Ispat Industries 2,956.0 2,286.6 3,818.3 1,613.1 14,137.8 41
155 291 Shree Renuka Sugars ▼ 2,924.2 1,468.5 1,858.9 1,659.0 1,144.7 334
156 105 Amtek Auto ❏ 2,896.0 5,130.5 5,094.9 4,016.9 3,221.5 136
157 NL Religare Enterprises 2,890.6 NL 3,826.1 NL 568.2 542
158 218 Everest Kanto Cylinder 2,865.0 2,122.8 2,515.7 968.7 746.1 447
159 165 Motherson Sumi Systems 2,846.6 3,131.7 3,231.8 2,279.8 1,352.8 306
160 254 Chambal Fertilisers & Chemicals 2,836.9 1,707.3 2,060.3 1,488.9 3,658.3 117
161 139 Maytas Infra 2,805.4 3,784.5 4,534.5 NL 2,263.9 187
162 185 Apollo Hospitals Enterprise 2,788.0 2,544.2 2,690.7 2,293.5 1,883.4 223
163 112 Alstom Projects India 2,775.9 4,973.3 5,077.3 2,387.4 2,022.4 210
164 171 Jindal Saw # 2,762.5 3,035.2 3,582.1 1,787.5 4,243.5 97
165 176 Opto Circuits (India) 2,752.8 2,763.7 3,237.5 1,537.1 493.3 580
166 173 Gillette India ❏ 2,744.0 2,912.1 3,000.6 2,726.3 1,142.5 335
167 149 Phoenix Mills 2,739.2 3,569.0 4,366.8 1,171.3 1,736.1 241
168 187 GlaxoSmithKline Consumer Healthcare ❚ 2,733.2 2,471.1 2,529.9 2,308.3 1,480.2 278
169 114 Television Eighteen India 2,708.3 4,885.5 4,924.9 1,848.5 1,424.5 289
170 193 Tulip Telecom 2,665.7 2,346.3 2,498.6 1,126.9 1,411.0 294
171 103 Deccan Chronicle Holdings 2,658.1 5,214.3 4,948.7 2,545.8 2,098.4 200
172 106 HT Media 2,654.3 5,124.5 4,936.6 3,009.6 1,441.4 286
173 178 AIA Engineering 2,581.7 2,735.6 2,781.4 1,667.1 706.2 466
174 156 Jammu & Kashmir Bank 2,557.9 3,354.4 3,476.0 2,395.1 32,756.0 9
175 337 UTV Software Communications 2,551.9 1,207.8 1,446.2 478.3 592.6 522
176 184 Crisil ❚ 2,473.9 2,563.3 2,455.9 1,333.3 373.1 679
177 195 Jaiprakash Hydro Power 2,459.2 2,313.1 3,190.8 1,457.0 2,053.1 206
178 225 Mahindra & Mahindra Financial Services 2,427.9 2,048.4 2,238.3 1,990.4 7,029.7 66
179 189 Procter & Gamble Hygiene & Health Care ❏ 2,422.7 2,460.3 2,432.0 2,842.9 735.7 453
180 89 Parsvnath Developers 2,411.2 6,201.5 6,074.8 6,870.1 4,885.7 91
181 157 Hindustan Construction Co. 2,398.1 3,321.7 3,845.6 3,302.1 4,190.6 99
182 96 Omaxe 2,395.3 5,640.6 6,017.9 NL 3,559.0 121
183 121 United Breweries (Holdings) 2,387.7 4,371.6 4,892.6 1,891.6 1,665.3 250
184 203 ING Vysya Bank 2,384.4 2,272.7 2,578.9 1,313.7 25,539.9 17
185 331 Shiv-Vani Oil & Gas Exploration Services � 2,347.7 1,228.9 1,597.3 768.5 1,543.9 268
186 209 Dishman Pharmaceuticals & Chemicals 2,320.7 2,207.8 2,220.5 1,414.4 825.2 418
187 177 Patel Engineering 2,301.7 2,760.0 3,461.0 2,256.2 2,150.7 197
188 235 Triveni Engineering & Inds. ⌧ 2,300.1 1,887.0 2,555.5 1,830.9 2,332.4 182
189 347 Monnet Ispat & Energy 2,284.7 1,134.7 1,507.9 684.7 2,477.8 173
190 NL Future Capital Holdings 2,284.6 NL 4,633.4 NL 932.8 381
191 145 Matrix Laboratories 2,267.8 3,662.9 3,353.6 3,781.4 1,561.9 267
192 122 Wockhardt ❚ 2,262.2 4,361.1 4,243.1 4,200.9 2,281.0 185
193 221 Koutons Retail India 2,261.0 2,068.7 2,592.8 NL 929.2 384
194 197 Bombay Dyeing & Mfg. Co. 2,260.4 2,308.6 2,489.2 2,541.6 2,240.5 191
195 130 Kalpataru Power Transmission 2,249.8 4,092.2 4,086.7 2,192.6 1,704.6 246
196 188 Info Edge (India) 2,235.7 2,468.4 2,713.2 1,769.5 415.2 640
197 220 Redington (India) 2,229.8 2,082.4 2,303.2 1,119.8 1,334.4 307
198 159 HCL Infosystems ❏ 2,216.9 3,299.4 3,408.4 2,576.9 3,511.1 126
199 204 Bajaj Hindusthan ▼ 2,201.1 2,263.1 2,743.0 4,420.1 5,441.6 85
200 245 IndusInd Bank 2,192.5 1,827.8 2,435.0 1,311.0 23,319.3 19

SALES (Rs cr)2007-08 2006-07 Q-2 2008-09 Rank
NET PROFIT (Rs cr)2007-08 2006-07 Q-2 2008-09 Rank
NL=Not listedNA=Not applicable or not available
RONW= Return on networthROCE=Return on capital employedEPS=Earning per share
Numbers in brackets indicate negative figure
Private Sector THE MARKET CAP of the Mukesh Ambani group’s listed companies is 1.9 times that of Anil Ambani’s listed companies.
778.0 654.5 205.7 370 153.5 86.5 30.2 190 19.7 60.8 60.8 8.5
2,320.3 1,806.8 669.9 120 408.3 308.0 113.6 66 17.6 50.3 21.6 343.0
237.6 134.6 84.3 718 47.6 33.0 17.4 451 20.0 12.1 11.7 8.4
10,097.7 8,578.7 3,223.8 26 34.8 (9.5) (26.7) 546 0.3 (11.1) (3.6) 0.3
776.4 839.7 NA 371 54.4 55.6 NA 414 7.0 19.7 8.5 27.2
1,202.5 1,195.7 315.5 252 263.1 235.8 48.0 111 21.9 15.5 7.9 18.7
36.8 16.1 NA 942 23.5 11.2 NA 648 63.7 6.1 5.5 3.1
393.3 376.5 111.3 574 47.3 47.1 21.2 453 12.0 15.1 12.0 4.7
1,573.1 1,276.3 358.6 192 128.2 114.2 29.2 220 8.1 28.6 15.6 3.6
2,827.0 2,636.2 1,745.1 95 203.8 151.1 47.6 151 7.2 15.7 6.8 4.3
1,670.2 613.7 367.3 177 99.6 53.1 16.9 272 6.0 21.7 12.3 17.0
1,150.8 932.8 370.3 266 101.8 100.1 30.1 264 8.8 10.5 8.6 17.6
1,650.3 1,326.9 595.4 179 73.3 109.4 59.0 326 4.4 18.2 18.5 10.1
7,726.0 4,136.0 1,488.7 36 876.4 176.2 100.1 43 11.3 27.4 16.8 70.5
351.7 204.3 109.2 609 118.8 72.2 38.6 237 33.8 40.9 37.5 12.6
643.4 716.5 148.7 428 117.4 99.9 20.0 238 18.2 26.3 26.3 27.1
223.9 224.4 55.6 727 168.7 164.2 38.7 173 75.3 20.5 15.8 12.4
1,464.4 1,268.4 449.0 209 162.7 126.9 53.0 178 11.1 25.9 25.9 42.1
327.0 201.8 93.0 632 30.5 17.5 1.2 580 9.3 8.0 5.2 3.0
1,239.5 847.1 384.7 243 187.1 99.7 50.2 160 15.1 51.7 24.6 64.6
820.3 585.2 241.9 361 271.9 161.4 45.3 109 33.2 28.8 17.4 11.1
1,231.3 1,084.1 339.3 245 144.6 115.1 16.3 202 11.7 16.4 13.7 6.2
667.2 437.1 250.0 412 108.3 66.9 25.8 254 16.2 22.8 22.8 57.6
2,697.6 2,082.1 788.8 101 360.0 274.5 115.9 81 13.3 17.6 13.4 74.3
297.6 188.8 82.5 659 4.5 36.6 4.1 874 1.5 1.5 1.0 1.5
275.1 156.9 108.2 677 70.7 37.4 45.1 334 25.7 30.8 30.8 127.8
417.8 412.4 115.6 554 213.4 199.5 66.9 141 51.1 15.0 7.5 3.1
1,226.8 844.6 330.9 247 177.0 132.9 35.2 166 14.4 16.3 3.0 17.6
694.5 697.7 194.9 401 131.4 139.5 49.2 216 18.9 41.3 41.3 37.2
1,792.5 1,261.0 222.3 166 408.7 271.8 22.9 65 22.8 23.9 14.9 22.1
2,694.2 1,886.1 702.0 102 108.8 36.8 19.9 252 4.0 11.7 4.5 4.2
1,835.5 947.6 237.1 158 398.8 124.8 58.5 67 21.7 49.9 18.8 21.8
419.1 276.7 120.9 552 64.0 27.4 15.4 368 15.3 1.8 0.9 9.6
2,119.2 1,560.0 655.2 132 156.9 88.9 47.0 188 7.4 11.8 5.6 13.3
418.4 213.3 155.9 553 54.1 25.7 29.9 416 12.9 12.9 5.5 11.2
381.1 297.8 95.6 582 59.6 60.9 16.1 394 15.6 14.2 9.0 7.7
1,035.5 1,051.8 315.5 289 147.6 110.1 33.5 198 14.3 17.6 14.5 24.7
2,145.7 NA NA 131 75.4 NA NA 320 3.5 0.8 0.5 1.2
1,374.4 789.3 401.9 223 166.2 134.8 62.0 176 12.1 20.4 9.7 34.8
81.4 9.3 36.7 883 8.9 0.2 3.6 833 10.9 (4.9) (4.7) 1.4
1,021.4 822.7 341.0 293 (298.4) 99.6 49.7 988 (29.2) (38.1) (36.7) (19.3)
1,340.4 1,246.7 419.7 233 213.9 213.6 13.4 139 16.0 21.6 12.9 17.4
797.7 405.0 283.2 366 68.2 34.0 19.5 345 8.5 27.0 21.0 22.8
1,033.5 540.3 257.5 290 16.7 35.9 104.0 971 1.6 NA NA 4.3
1,792.6 1,581.7 439.7 165 149.9 158.1 22.3 193 8.4 19.9 17.9 54.2
265.8 165.1 72.3 684 55.5 27.1 15.7 410 20.9 22.4 22.4 20.3
5,782.0 4,719.6 1,654.5 47 67.1 42.4 17.6 353 1.2 11.8 11.8 8.6
12,617.7 2,416.5 3,079.8 20 304.8 113.2 67.4 97 2.4 31.3 26.6 18.9
2,038.3 1,646.8 NA 142 51.0 191.4 NA 433 2.5 2.9 1.2 6.3
2,218.5 1,816.0 638.8 126 75.1 67.2 33.7 322 3.4 2.8 1.2 2.1
PROFIT AS % RONW (%) ROCE (%) EPS (Rs)OF SALES
2007-08
151-200

RANK2008 2007
COMPANY AVERAGE MARKET CAPITALISATION (Rs cr)Apr-Oct 2008 Apr-Oct 2007 2007-08 2006-07
⌧ 18 months ended Sept. 30, 2007# 15 months ended Dec. 31, 2007� 15 months ended Mar. 31, 2008
● 12 months ended Dec. 31, 2006▲ 12 months ended March 31, 2007▼ 12 months ended Sept.30, 2007
◆ 12 months ended Nov. 30, 2007❚ 12 months ended Dec. 31, 2007❏ 12 months ended Jun. 30, 2008
◗ 12 months ended Sept. 30, 2008�9 months ended Dec. 31, 2007✪ 9 months ended Mar. 31, 2008
❍ 6 months ended Mar. 31, 2008✛ 3 months ended Aug. 31, 2008
Figures for companies are standalone unless otherwise mentioned; + Consolidated results Source: CMIE Prowess, BSE and company websites
TOTAL ASSETS (Rs cr)2007-08 Rank
BT 500 India’s Most Valuable Private Sector Companies
201 87 Sobha Developers 2,191.7 6,365.1 6,191.6 6,569.5 3,319.3 131
202 262 Simplex Infrastructures 2,179.9 1,647.2 2,154.7 1,514.9 2,816.9 153
203 217 Adlabs Films ✪ 2,171.8 2,144.7 3,099.1 1,412.7 1,879.1 224
204 117 Shree Cement 2,169.0 4,514.5 4,416.6 3,826.5 2,499.7 171
205 295 Bombay Rayon Fashions 2,167.1 1,428.5 1,623.9 969.9 1,446.9 285
206 180 Nirma 2,155.6 2,687.6 2,876.9 3,114.1 3,769.4 110
207 138 Gammon India 2,152.5 3,785.0 4,099.7 3,458.5 2,728.4 160
208 166 Jagran Prakashan 2,100.9 3,113.0 3,336.9 1,600.8 875.7 400
209 NL BGR Energy Systems 2,099.8 NL 4,174.7 NL 1,539.4 269
210 179 Havells India 2,090.6 2,714.2 2,966.5 1,805.3 1,197.5 327
211 191 Tanla Solutions 2,083.8 2,369.8 2,705.9 1,778.8 619.7 506
212 250 Balrampur Chini Mills ▼ 2,073.4 1,732.6 1,993.7 2,602.1 2,771.4 157
213 111 Moser Baer India 2,068.6 4,981.3 4,433.2 2,726.1 5,197.6 88
214 192 New Delhi Television 2,063.7 2,362.5 2,395.7 1,430.5 442.9 617
215 147 Gujarat Fluorochemicals 2,062.6 3,657.5 3,531.4 3,197.4 1,838.0 232
216 241 BL Kashyap & Sons 2,044.8 1,862.5 2,503.2 1,211.0 1,035.9 355
217 301 KS Oils 2,030.3 1,392.5 1,861.0 341.0 1,364.4 303
218 211 KEC International 2,017.7 2,181.4 2,565.9 1,355.5 2,452.3 175
219 125 Maharashtra Seamless 2,011.5 4,171.1 3,735.6 2,513.6 1,430.0 288
220 353 Coromandel Fertilisers 2,002.9 1,096.9 1,273.9 969.9 2,727.4 161
221 181 Panacea Biotec 2,002.2 2,662.5 2,538.0 2,274.4 1,413.0 293
222 279 Gitanjali Gems 1,993.3 1,562.4 1,988.2 1,144.9 3,760.3 111
223 379 PVP Ventures ❍ 1,993.3 990.9 955.0 699.4 1,468.9 280
224 174 Consolidated Construction Consortium 1,980.8 2,889.7 3,368.0 NL 1,044.2 352
225 206 GTL 1,944.6 2,254.0 2,275.1 1,304.0 2,585.4 165
226 213 Atlas Copco (India) ❚ 1,936.8 2,177.6 2,394.8 1,573.0 781.0 435
227 208 JSL 1,934.1 2,209.6 2,382.3 1,455.7 9,476.9 51
228 344 Mercator Lines 1,932.9 1,157.8 1,735.2 732.0 2,111.4 199
229 329 Provogue (India) 1,928.6 1,232.8 1,575.2 566.1 545.3 556
230 219 ICI India 1,907.5 2,088.5 2,049.6 1,490.2 1,149.7 333
231 182 ABG Shipyard 1,888.9 2,642.5 3,148.1 1,499.7 3,033.2 144
232 170 Great Offshore 1,888.7 3,055.9 3,092.4 2,574.9 2,053.4 205
233 314 Nava Bharat Ventures 1,849.7 1,308.1 1,506.2 732.7 1,456.0 283
234 304 Usha Martin 1,849.7 1,366.9 1,860.5 795.3 2,899.4 150
235 202 Mahindra Lifespace Developers 1,846.5 2,274.5 2,426.8 2,464.0 1,000.8 365
236 255 Apollo Tyres 1,811.2 1,706.8 1,862.0 1,276.5 2,841.2 152
237 228 Gujarat Narmada Valley Fertilizers Co. 1,791.7 1,969.7 2,263.6 1,521.5 3,776.7 108
238 118 Kirloskar Brothers 1,789.7 4,495.2 4,253.5 4,159.9 1,660.9 251
239 397 Prakash Industries 1,779.5 917.6 1,696.6 412.1 1,408.8 295
240 223 3M India ❚ 1,779.2 2,058.4 2,112.9 1,550.9 399.8 652
241 172 Aventis Pharma ❚ 1,779.0 2,921.1 2,624.8 3,516.8 929.6 383
242 341 EID-Parry (India) 1,775.7 1,171.1 1,314.9 1,615.0 1,498.7 273
243 NL Indiabulls Securities 1,774.7 NL NL NL 1,655.0 252
244 198 Karnataka Bank 1,768.9 2,305.8 2,505.7 1,473.6 19,355.2 25
245 200 Peninsula Land 1,761.2 2,296.6 2,522.1 2,070.0 1,400.3 297
246 252 Karur Vysya Bank 1,740.7 1,720.6 1,882.6 1,164.8 14,583.0 39
247 274 Dalmia Cement (Bharat) 1,740.6 1,582.5 2,046.8 1,510.3 3,559.1 120
248 194 Ballarpur Industries ❏ 1,731.7 2,325.2 2,489.9 1,912.4 4,041.1 100
249 361 Core Projects & Technologies 1,715.7 1,065.2 1,490.9 387.5 570.7 539
250 205 Pfizer ◆ 1,710.0 2,261.9 2,184.5 2,480.4 1,471.1 279

SALES (Rs cr)2007-08 2006-07 Q-2 2008-09 Rank
NET PROFIT (Rs cr)2007-08 2006-07 Q-2 2008-09 Rank
NL=Not listedNA=Not applicable or not available
RONW= Return on networthROCE=Return on capital employedEPS=Earning per share
Numbers in brackets indicate negative figure
Private Sector RELIANCE POWER is the only company among thetop 100 companies without any operational income.
1,450.1 1,200.6 302.1 213 228.3 161.5 49.0 127 15.7 25.3 12.5 31.3
2,845.6 1,725.7 1,009.0 94 90.1 53.7 28.1 287 3.2 17.6 8.3 18.2
355.0 385.3 210.8 606 45.9 85.3 19.0 460 12.9 6.1 3.1 14.9
2,508.7 1,648.6 662.8 110 260.4 177.0 107.5 113 10.4 45.7 16.8 85.9
944.8 497.0 NA 320 121.1 54.4 NA 232 12.8 22.6 14.7 19.2
2,750.9 2,709.2 714.1 98 217.6 219.8 1.7 135 7.9 6.5 6.1 9.6
2,391.8 1,914.3 522.8 116 86.1 44.5 10.3 296 3.6 7.4 7.7 9.9
774.0 631.5 214.1 373 98.1 76.2 22.7 274 12.7 17.6 16.9 3.3
1,514.0 785.6 433.0 200 84.4 39.2 23.7 300 5.6 30.1 28.1 11.7
2,245.7 1,686.5 587.9 124 143.5 102.2 44.3 204 6.4 31.0 28.8 24.8
152.0 91.1 53.2 801 87.4 57.6 30.0 294 57.5 16.2 16.7 17.5
1,495.3 1,997.0 NA 206 (41.6) 291.8 NA 967 (2.8) (5.4) (3.1) (0.9)
2,090.5 2,155.6 645.0 135 (78.9) 109.8 (41.8) 974 (3.8) (5.0) (2.8) (5.9)
375.4 283.7 76.2 590 4.3 6.9 13.0 880 1.1 1.4 1.3 0.7
864.5 638.3 314.7 352 320.5 241.9 119.3 90 37.1 37.6 24.1 27.7
1,564.6 816.1 NA 193 115.4 55.5 NA 240 7.4 33.1 32.2 56.2
2,058.0 1,072.0 736.5 140 120.7 57.3 42.2 233 5.9 29.7 26.6 3.6
2,868.8 2,081.8 806.5 93 172.2 104.6 17.8 171 6.0 45.3 20.2 34.9
1,684.1 1,551.1 618.3 174 195.2 233.9 63.9 157 11.6 19.4 17.6 27.7
3,882.6 2,153.7 3,417.2 64 209.8 100.7 182.4 146 5.4 31.9 16.8 15.0
889.3 879.1 153.2 342 133.2 146.8 (44.1) 213 15.0 18.9 12.9 19.9
2,657.7 2,228.1 728.3 105 138.2 81.9 35.2 209 5.2 10.7 8.2 16.2
53.2 17.8 0.2 916 (2.4) 8.1 (9.9) 936 (4.5) (0.5) (0.3) (0.3)
384.9 184.6 468.9 579 87.1 46.3 19.1 295 22.6 27.4 27.1 23.6
1,540.3 736.0 378.6 197 121.3 40.0 35.6 231 7.9 10.9 6.3 11.3
1,070.9 804.9 357.1 280 81.0 72.0 22.1 310 7.6 23.9 18.5 34.6
5,819.2 5,381.8 1,105.1 46 241.2 353.0 68.6 123 4.1 16.9 5.9 17.3
880.8 815.8 NA 345 166.2 71.2 NA 175 18.9 19.0 7.4 5.9
346.0 240.6 114.5 613 25.8 19.6 7.8 619 7.5 9.3 8.3 13.0
1,198.1 1,607.5 263.5 255 60.2 448.4 26.9 391 5.0 9.6 9.6 20.6
994.2 734.8 280.5 303 160.7 116.3 26.1 182 16.2 23.0 21.9 31.1
750.3 544.7 180.3 385 203.2 141.4 16.9 152 27.1 23.8 11.3 48.6
969.9 630.3 401.4 310 315.4 140.6 118.6 92 32.5 51.6 31.2 40.4
1,897.7 1,598.0 621.9 149 144.8 101.5 41.9 201 7.6 17.3 9.3 5.8
220.0 163.3 41.7 730 65.4 14.2 11.2 360 29.7 8.4 8.4 16.8
4,275.6 3,808.0 982.2 59 219.3 113.4 7.8 133 5.1 20.0 16.7 4.5
3,792.1 3,004.1 872.2 67 372.9 326.5 79.0 78 9.8 15.9 15.8 24.0
1,631.7 1,626.1 439.0 183 110.1 336.5 23.4 248 6.8 15.7 14.2 10.4
1,465.7 1,092.3 NA 208 198.7 132.8 NA 155 13.6 23.5 19.6 16.1
655.0 545.6 195.6 420 67.7 50.4 12.9 349 10.3 25.7 25.7 61.9
1,031.4 1,008.6 273.2 291 144.4 169.3 44.6 203 14.0 21.1 21.6 58.9
748.4 757.7 1,066.3 388 (16.6) 127.4 611.9 955 (2.2) (4.0) (2.7) (1.9)
628.7 446.6 119.2 437 248.7 137.4 37.6 116 39.6 72.8 46.8 9.5
1,814.2 1,441.5 515.6 160 241.7 177.0 73.6 120 13.3 18.5 14.5 19.9
404.3 339.3 120.8 568 129.8 132.0 54.6 217 32.1 16.8 12.2 4.7
1,320.2 1,013.6 393.3 238 208.3 160.0 62.2 148 15.8 18.5 15.5 38.5
1,900.6 1,295.1 454.9 148 347.2 228.9 40.2 85 18.3 36.4 18.6 42.9
945.0 2,173.5 247.9 319 129.5 250.8 28.4 218 13.7 13.7 8.7 2.3
205.8 70.2 89.6 750 44.6 11.7 16.8 469 21.7 21.4 15.3 5.3
1,115.7 825.4 187.7✛ 274 338.9 105.7 38.1✛ 88 30.4 11.6 11.8 6.3
PROFIT AS % RONW (%) ROCE (%) EPS (Rs)OF SALES
2007-08
201-250

RANK2008 2007
COMPANY AVERAGE MARKET CAPITALISATION (Rs cr)Apr-Oct 2008 Apr-Oct 2007 2007-08 2006-07
⌧ 18 months ended Sept. 30, 2007# 15 months ended Dec. 31, 2007� 15 months ended Mar. 31, 2008
● 12 months ended Dec. 31, 2006▲ 12 months ended March 31, 2007▼ 12 months ended Sept.30, 2007
◆ 12 months ended Nov. 30, 2007❚ 12 months ended Dec. 31, 2007❏ 12 months ended Jun. 30, 2008
◗ 12 months ended Sept. 30, 2008�9 months ended Dec. 31, 2007✪ 9 months ended Mar. 31, 2008
❍ 6 months ended Mar. 31, 2008✛ 3 months ended Aug. 31, 2008
Figures for companies are standalone unless otherwise mentioned; + Consolidated results Source: CMIE Prowess, BSE and company websites
TOTAL ASSETS (Rs cr)2007-8 Rank
BT 500 India’s Most Valuable Private Sector Companies
251 240 KSL & Industries 1,692.6 1,864.3 1,978.1 1,356.0 1,317.2 311
252 265 Sun Pharma Advanced Research Co. 1,690.1 1,633.6 1,936.3 NL 62.1 964
253 232 Allcargo Global Logistics ❚ 1,671.2 1,933.2 1,872.4 1,814.3 492.7 582
254 303 Emami 1,654.8 1,371.6 1,518.8 1,533.5 452.9 609
255 387 Shriram City Union Finance 1,652.1 959.1 1,098.9 423.3 3,797.0 106
256 168 Kirloskar Oil Engines 1,648.6 3,082.1 2,879.4 2,373.4 2,201.4 193
257 233 Kansai Nerolac Paints 1,624.9 1,931.0 1,955.8 2,060.6 944.9 376
258 167 Motilal Oswal Financial Services 1,616.5 3,087.4 3,657.7 NL 422.1 633
259 133 Dish TV India 1,614.6 3,959.0 3,616.4 NL 1,334.2 308
260 226 S Kumars Nationwide 1,593.3 2,027.7 2,352.8 1,116.2 2,200.7 194
261 264 Tata Investment Corpn. 1,582.3 1,646.2 1,822.0 1,331.6 911.6 388
262 237 Gujarat Gas Co. ❚ 1,580.7 1,881.0 1,947.9 1,515.8 1,306.4 313
263 NL Gammon Infrastructure Projects 1,568.9 NL NL NL 531.9 563
264 249 Kingfisher Airlines ✪ 1,566.9 1,752.9 2,087.1 1,076.2 1,757.5 238
265 412 Hindustan Oil Exploration Co. 1,562.7 864.1 1,121.4 766.4 1,382.7 301
266 432 Jindal Drilling & Inds. 1,561.2 792.6 1,003.8 363.3 416.2 639
267 229 Fortis Healthcare 1,559.0 1,964.8 1,927.9 NL 1,109.6 343
268 294 Nagarjuna Fertilizers & Chemicals 1,548.7 1,436.3 1,829.0 568.5 3,745.0 114
269 283 Orchid Chemicals & Pharmaceuticals 1,544.2 1,535.8 1,575.0 1,495.0 3,542.4 123
270 152 Aurobindo Pharma 1,534.4 3,523.3 3,010.3 3,384.8 3,514.0 125
271 349 Lakshmi Energy & Foods 1,531.8 1,123.7 1,228.2 985.6 672.3 482
272 323 Sundaram Finance 1,531.4 1,258.8 1,511.0 1,146.6 8,024.5 55
273 246 Geodesic 1,530.6 1,826.2 1,770.4 1,136.1 1,006.7 363
274 293 Blue Dart Express ❚ 1,508.0 1,443.0 1,419.3 1,237.0 432.0 623
275 154 Firstsource Solutions 1,496.1 3,391.1 3,030.4 3,075.7 2,145.1 198
276 215 Entertainment Network (India) 1,493.9 2,163.3 2,197.0 1,158.4 579.3 533
277 335 Madras Aluminium Co. 1,481.1 1,212.8 1,385.6 875.2 736.3 451
278 297 Ruchi Soya Inds. 1,480.3 1,413.1 1,685.4 986.1 5,779.7 79
279 251 MRF ▼ 1,450.7 1,726.2 2,017.8 1,537.8 2,534.7 167
280 231 Alfa Laval (India) ❚ 1,442.8 1,934.8 1,842.1 1,603.6 543.2 558
281 NL Brigade Enterprises 1,440.8 NL 3,089.6 NL 1,598.1 257
282 320 Time Technoplast 1,440.4 1,270.2 1,492.9 NL 603.5 519
283 326 Chettinad Cement Corpn. 1,422.7 1,248.8 1,266.3 1,384.5 1,252.1 321
284 292 Godfrey Phillips India 1,412.3 1,462.1 1,453.4 1,301.6 846.9 408
285 190 MindTree 1,412.1 2,444.2 2,129.4 3,090.0 759.5 439
286 153 Lakshmi Machine Works 1,411.3 3,515.6 3,440.9 3,278.6 1,823.8 233
287 244 Torrent Pharmaceuticals 1,410.5 1,828.7 1,653.7 1,712.0 1,242.7 324
288 199 Rajesh Exports 1,405.9 2,302.7 2,474.9 1,004.2 6,184.3 75
289 358 ICSA (India) 1,399.6 1,076.6 1,356.2 527.3 729.4 457
290 552 Rain Commodities � 1,389.6 458.9 744.5 374.9 893.1 395
291 460 BOC India � 1,383.4 677.6 834.9 843.6 827.4 416
292 257 Ipca Laboratories 1,381.4 1,685.0 1,632.0 1,071.3 1,278.5 315
293 212 NIIT 1,378.0 2,180.0 2,060.2 811.2 657.9 488
294 196 Ibn18 Broadcast 1,367.9 2,311.6 2,332.0 1,496.5 276.5 763
295 299 Asian Star Co. 1,356.0 1,399.7 1,372.2 1,291.0 1,017.1 360
296 287 Astrazeneca Pharma India ❚ 1,338.1 1,516.7 1,471.2 1,731.2 249.4 785
297 316 Reliance Industrial Infrastructure 1,328.9 1,300.2 1,826.0 778.2 269.8 766
298 328 Monsanto India 1,325.6 1,245.5 1,331.7 1,310.4 623.7 503
299 307 Cranes Software Intl. 1,323.2 1,335.8 1,387.1 1,163.4 1,155.3 332
300 322 Shaw Wallace & Co. 1,322.7 1,265.4 1,415.7 716.1 382.1 665
SALES (Rs cr)2007-08 2006-07 Q-2 2008-09 Rank
NET PROFIT (Rs cr)2007-08 2006-07 Q-2 2008-09 Rank
PROFIT AS %OF SALES
RONW (%) ROCE (%) EPS (Rs)
NL=Not listedNA=Not applicable or not available
RONW= Return on networthROCE=Return on capital employedEPS=Earning per share
Numbers in brackets indicate negative figure
Private Sector
2007-08
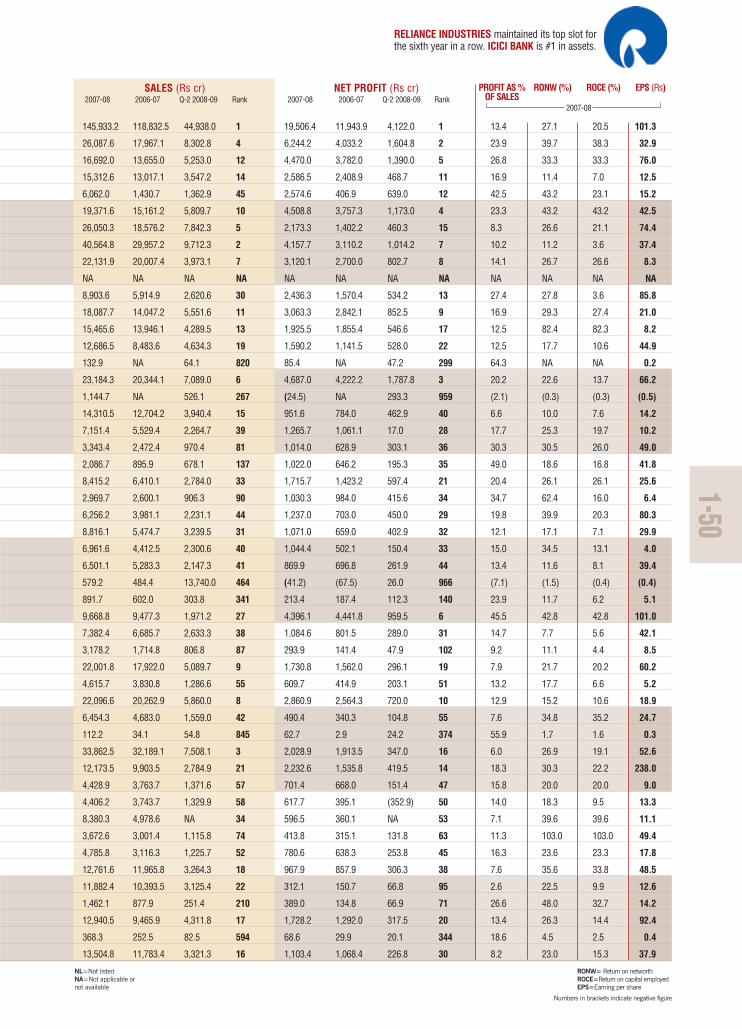
REAL ESTATE was the biggest loser inmarket cap compared to last year.
648.3 517.2 222.2 426 44.8 36.8 10.1 467 6.9 8.4 5.4 4.5
37.5 NA 1.0 939 (4.9) NA (14.7) 942 (13.0) (10.3) (10.3) (0.2)
371.3 233.6 144.7 593 59.8 43.0 26.0 393 16.1 15.2 14.7 25.5
607.5 537.0 124.7 452 92.8 65.9 12.1 282 15.3 35.5 32.7 14.9
624.0 349.0 230.9 443 87.6 51.6 30.9 292 14.0 21.4 3.9 21.3
2,443.8 2,200.3 627.6 114 119.0 177.8 27.4 235 4.9 12.6 10.3 6.1
1,640.1 1,513.7 394.6 181 119.8 107.7 27.1 234 7.3 21.6 18.3 44.5
35.7 11.0 19.2 944 17.3 1.0 9.7 721 48.5 6.1 6.1 6.1
424.0 200.1 176.2 547 (413.2) (251.9) (154.1) 989 (97.5) (167.4) (672.3) (9.7)
1,615.5 1,239.8 NA 186 178.1 123.5 NA 165 11.0 23.9 12.4 9.0
210.1 204.3 89.2 744 185.9 181.7 81.8 161 88.5 24.0 24.0 53.9
1,227.0 852.5 331.4 246 158.6 88.9 38.7 186 12.9 31.9 32.0 24.8
27.5 23.7 10.7 957 7.0 6.9 4.7 850 25.4 1.9 1.8 0.5
1,441.4 2,142.3 1,357.7 214 (188.1) (419.6) (483.3) 986 (13.1) (237.4) (110.3) (24.4)
137.1 167.8 42.5 813 24.1 2.5 12.9 641 17.6 3.5 2.9 3.1
416.6 306.8 123.3 556 18.4 18.0 6.6 711 4.4 11.1 9.4 16.0
191.9 134.0 NA 767 2.6 48.7 NA 901 1.4 0.4 0.3 0.1
2,216.2 1,844.7 NA 127 22.5 31.7 NA 659 1.0 1.3 1.1 0.6
1,323.1 964.1 353.8 237 184.5 96.6 40.7 162 13.9 31.1 10.0 17.2
2,512.1 2,109.3 642.1 109 290.8 229.1 38.5 103 11.6 26.5 12.3 54.1
956.9 265.2 253.4 316 82.1 60.3 26.5 307 8.6 29.2 25.0 16.8
1,040.8 691.8 272.5 286 212.5 100.5 32.4 142 20.4 22.1 4.0 76.5
269.4 172.9 130.8 680 110.4 94.3 49.0 246 41.0 28.9 18.0 12.0
811.9 670.0 266.9 364 69.9 50.2 13.6 337 8.6 25.0 24.6 35.5
516.4 446.0 NA 500 57.6 74.3 NA 405 11.2 8.1 4.4 1.4
241.5 173.4 61.8 716 16.2 29.1 3.3 738 6.7 4.4 3.4 3.1
586.0 489.5 141.3 459 65.3 135.4 2.8 361 11.1 23.1 22.0 40.5
11,190.3 8,732.9 2,566.6 23 159.2 100.7 34.3 184 1.4 11.0 7.3 9.2
5,066.1 4,315.6 NA 49 171.8 79.9 NA 172 3.4 19.0 14.3 529.2
756.2 644.3 205.4 381 91.5 69.6 21.4 285 12.1 35.2 33.6 49.0
494.2 403.9 132.8 515 103.0 74.7 38.7 262 20.8 19.3 13.1 9.2
548.9 407.4 NA 480 63.3 39.2 NA 372 11.5 17.1 13.8 24.0
1,109.9 847.6 284.5 275 163.8 114.7 34.2 177 14.8 49.4 25.3 55.5
1,876.3 1,632.8 287.7 152 112.2 88.1 34.0 244 6.0 24.6 22.4 107.9
762.7 597.7 256.1 377 104.2 90.1 36.7 261 13.7 21.3 19.3 27.5
2,684.0 2,236.3 NA 103 242.3 206.2 NA 119 9.0 35.8 35.8 196.1
1,026.0 918.4 289.2 292 155.5 113.0 44.3 189 15.2 26.9 17.5 18.4
8,667.1 6,893.4 2,472.4 32 206.6 101.3 26.5 149 2.4 37.6 19.2 9.3
678.6 333.3 279.6 405 108.9 58.5 48.0 250 16.1 47.1 36.3 25.3
529.9 1.7 223.5 491 25.3 0.6 20.1 626 4.8 36.2 21.9 18.2
391.5 535.8 153.9 576 61.7 44.6 21.9 384 15.7 (0.2) (0.2) 1.9
1,169.3 1,003.2 348.1 263 141.1 122.2 36.5 207 12.1 25.8 19.8 56.3
504.2 407.9 170.4 508 32.8 32.9 21.3 560 6.5 9.2 7.3 1.9
135.1 80.9 30.9 817 (6.9) (32.0) (10.8) 948 (5.1) (5.7) (4.3) (0.5)
1,328.6 1,170.7 378.9 235 40.4 27.6 10.6 503 3.0 12.5 12.2 37.8
339.8 301.2 93.1 621 61.5 48.7 18.5 385 18.1 40.4 40.4 25.1
80.1 75.7 19.3 886 21.8 19.1 5.3 669 27.2 15.1 10.4 14.4
453.3 361.4 81.4 533 100.2 70.5 15.7 270 22.1 16.4 16.4 61.9
312.3 259.9 NA 643 94.9 92.9 NA 280 30.4 19.3 12.3 8.3
215.4 230.0 57.0 739 46.0 69.8 1.8 459 21.4 63.4 31.2 6.1
251-300

RANK2008 2007
COMPANY AVERAGE MARKET CAPITALISATION (Rs cr)Apr-Oct 2008 Apr-Oct 2007 2007-08 2006-07
⌧ 18 months ended Sept. 30, 2007# 15 months ended Dec. 31, 2007� 15 months ended Mar. 31, 2008
● 12 months ended Dec. 31, 2006▲ 12 months ended March 31, 2007▼ 12 months ended Sept.30, 2007
◆ 12 months ended Nov. 30, 2007❚ 12 months ended Dec. 31, 2007❏ 12 months ended Jun. 30, 2008
◗ 12 months ended Sept. 30, 2008�9 months ended Dec. 31, 2007✪ 9 months ended Mar. 31, 2008
❍ 6 months ended Mar. 31, 2008✛ 3 months ended Aug. 31, 2008
Figures for companies are standalone unless otherwise mentioned; + Consolidated results Source: CMIE Prowess, BSE and company websites
TOTAL ASSETS (Rs cr)2007-08 Rank
BT 500 India’s Most Valuable Private Sector Companies
301 377 Thomas Cook (India) ❚ 1,319.6 1,002.7 1,120.9 790.5 619.5 507
302 486 Allied Digital Services 1,310.1 602.9 965.1 NL 253.1 781
303 243 Hotel LeelaVenture 1,296.8 1,847.9 1,962.5 2,317.1 3,268.9 135
304 242 3I Infotech 1,296.7 1,861.4 1,747.5 1,027.6 2,086.4 201
305 352 Texmaco 1,296.3 1,119.4 1,300.8 864.4 654.2 490
306 275 Advanta India ❚ 1,284.5 1,578.7 1,680.4 NL 581.8 530
307 330 PSL 1,279.7 1,231.8 1,428.5 694.0 1,988.4 215
308 315 Plethico Pharmaceuticals # 1,256.1 1,307.1 1,346.1 1,126.1 1,018.3 359
309 162 Ajmera Realty & Infra India 1,247.0 3,236.8 3,401.8 2,434.2 1,785.6 235
310 214 Birla Corporation 1,245.3 2,177.5 2,097.8 2,290.9 2,021.0 211
311 210 Kesoram Industries 1,220.9 2,194.1 2,181.7 1,785.3 2,978.8 147
312 NL Titagarh Wagons 1,217.5 NL NL NL 561.8 544
313 441 Century Plyboards (India) 1,213.4 751.8 974.7 238.0 414.0 642
314 281 Berger Paints India 1,211.5 1,541.2 1,496.6 1,532.6 736.2 452
315 366 SREI Infrastructure Finance 1,205.3 1,052.6 1,433.6 537.9 1,680.4 248
316 355 Era Infra Engg. 1,201.8 1,083.1 1,232.4 686.9 2,343.8 181
317 285 Sanghi Industries 1,198.5 1,520.4 1,552.2 1,355.5 1,845.8 231
318 239 Raymond 1,189.0 1,872.2 2,040.9 2,610.6 2,746.0 159
319 411 MIC Electronics ❏ 1,185.4 866.4 1,167.5 NL 266.6 770
320 302 IL&FS Investsmart 1,183.6 1,381.3 1,361.1 1,202.1 711.5 464
321 216 SKF India ❚ 1,177.2 2,157.2 2,079.8 1,568.7 873.9 401
322 266 Gujarat State Fertilizers & Chemicals 1,171.4 1,632.6 1,790.7 1,479.0 3,043.4 143
323 282 Bilcare 1,170.1 1,540.6 1,618.4 702.9 783.0 433
324 389 Bosch Chassis Systems India ❚ 1,146.6 939.7 956.7 955.8 375.8 675
325 270 Punjab Tractors 1,143.6 1,608.9 1,586.0 1,512.8 1,040.0 354
326 646 Zandu Pharmaceutical Works 1,141.6 317.3 410.6 254.1 106.2 939
327 269 Infotech Enterprises 1,140.0 1,614.5 1,528.3 1,150.6 743.8 448
328 937 Shristi Infrastructure Devp. Corpn. 1,136.6 42.2 697.5 16.3 116.6 925
329 164 Ansal Properties & Infrastructure 1,123.5 3,177.8 3,092.9 2,976.3 2,780.4 155
330 273 Carborundum Universal 1,119.7 1,592.4 1,496.9 1,478.2 956.5 372
331 403 Madhucon Projects 1,115.1 886.3 1,326.9 1,015.6 1,256.3 319
332 363 Gujarat Alkalies & Chemicals 1,108.2 1,062.2 1,193.3 1,182.5 2,062.2 203
333 298 Sterlite Technologies 1,104.5 1,412.7 1,495.0 1,007.6 1,587.7 260
334 501 Jai Balaji Inds. 1,103.5 555.8 1,040.6 131.7 2,192.7 195
335 312 Zee News 1,093.6 1,324.7 1,369.3 866.8 362.9 687
336 342 Bank of Rajasthan 1,092.1 1,168.1 1,484.1 408.3 15,813.8 36
337 278 Honeywell Automation India ❚ 1,091.3 1,565.7 1,615.3 1,356.2 561.1 545
338 277 Binani Cement 1,078.8 1,569.1 1,771.1 NL 1,768.6 236
339 230 Shoppers’ Stop 1,067.5 1,938.5 1,840.4 2,017.4 686.1 477
340 300 Orbit Corporation 1,063.3 1,395.6 1,854.6 NL 868.6 406
341 276 Balaji Telefilms 1,061.1 1,570.9 1,615.8 875.5 438.1 621
342 183 IVR Prime Urban Developers 1,058.4 2,598.4 2,291.2 NL 1,862.9 229
343 288 Ashapura Minechem 1,058.2 1,509.8 1,850.9 786.0 939.4 378
344 354 Himadri Chemicals & Inds. 1,057.7 1,089.9 1,394.2 619.4 614.6 512
345 261 Asian Hotels 1,053.5 1,658.1 1,580.4 1,504.4 1,932.7 219
346 359 Bayer Cropscience 1,043.2 1,076.3 1,170.2 775.0 1,138.1 336
347 547 Satra Properties (India) 1,041.2 462.6 827.2 108.5 480.0 591
348 369 South Indian Bank 1,036.2 1,043.3 1,279.3 520.6 17,089.9 33
349 419 HEG 1,032.2 844.4 1,163.7 623.6 1,512.6 272
350 268 Gateway Distriparks 1,025.8 1,616.8 1,550.2 1,722.9 724.6 459
SALES (Rs cr)2007-08 2006-07 Q-2 2008-09 Rank
NET PROFIT (Rs cr)2007-08 2006-07 Q-2 2008-09 Rank
PROFIT AS %OF SALES
RONW (%) ROCE (%) EPS (Rs)
NL=Not listedNA=Not applicable or not available
RONW= Return on networthROCE=Return on capital employedEPS=Earning per share
Numbers in brackets indicate negative figure
Private Sector
2007-08
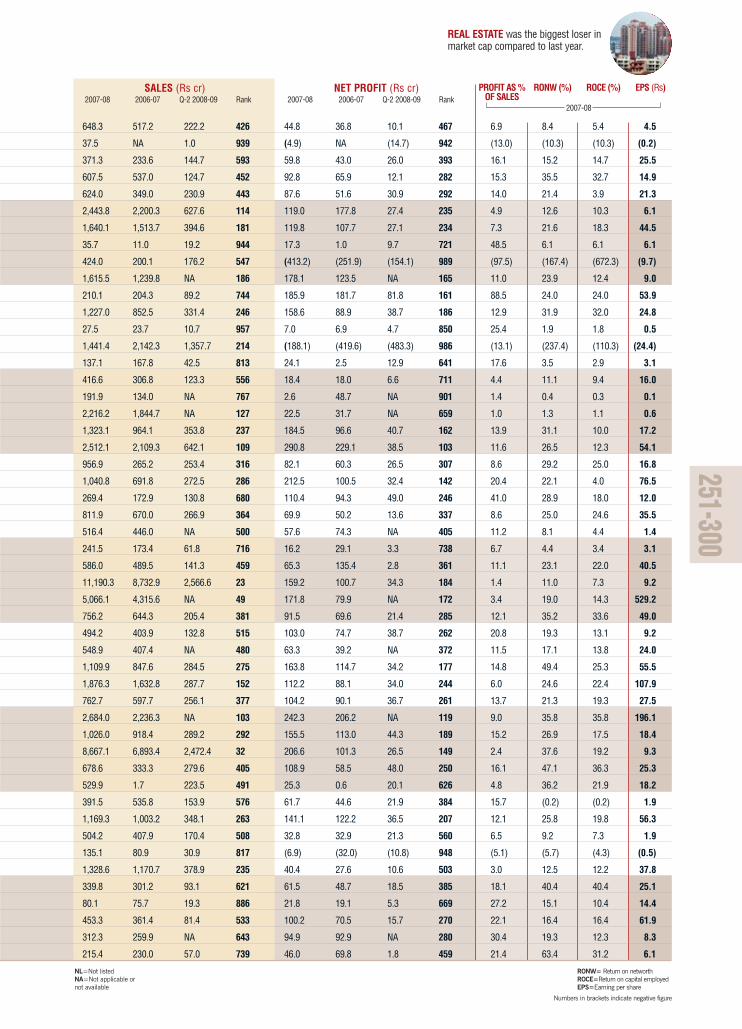
58 NEW COMPANIES made to theBT 500 list this year.
253.6 243.8 64.6 697 33.4 38.5 9.4 554 13.2 15.3 14.6 1.8
301.2 156.2 106.0 653 43.6 22.9 21.5 476 14.5 36.3 36.0 25.2
616.7 475.6 125.7 447 148.6 126.2 24.1 196 24.1 16.4 7.0 3.9
570.3 523.1 172.7 471 100.5 64.3 55.8 268 17.6 16.3 6.3 7.7
950.2 481.0 207.3 318 69.1 28.5 20.2 342 7.3 34.0 31.4 66.9
130.2 99.5 NA 826 12.2 30.0 NA 797 9.4 4.8 4.0 0.6
2,267.8 1,622.5 661.3 123 82.2 61.4 21.6 306 3.6 18.8 12.6 19.9
574.8 329.7 154.1 468 158.3 86.0 35.0 187 27.5 27.2 19.8 37.7
2,088.4 1,820.3 561.6 136 245.5 210.3 10.0 117 11.8 47.5 25.1 20.8
2,023.5 1,808.1 383.9 143 393.6 326.2 59.7 68 19.5 46.6 41.2 51.1
3,483.2 2,569.9 942.5 78 383.4 265.7 62.5 73 11.0 46.8 26.5 83.8
655.2 323.4 198.2 419 60.6 29.2 17.8 389 9.2 29.3 34.1 40.5
641.6 452.6 NA 431 44.6 20.4 NA 468 7.0 32.0 24.1 22.7
1,543.6 1,341.1 431.6 195 92.1 83.1 29.1 283 6.0 29.3 28.4 2.9
527.5 400.1 NA 493 108.3 79.3 NA 255 20.5 7.9 1.8 9.3
1,499.3 776.3 NA 205 121.4 79.1 NA 230 8.1 33.4 11.6 52.5
953.3 866.4 172.4 317 106.4 142.8 4.1 257 11.2 16.8 6.6 4.8
1,543.4 1,527.8 447.3 196 72.4 202.1 24.3 330 4.7 3.7 2.5 10.8
315.3 239.7 76.2 639 65.8 32.2 23.4 358 20.9 29.9 28.5 6.5
42.6 130.8 9.0 929 15.6 38.5 4.2 744 36.6 2.2 2.1 2.2
1,752.5 1,511.2 437.3 168 160.7 102.0 37.0 181 9.2 32.5 32.5 30.7
3,810.2 3,647.6 1,764.1 65 238.5 266.9 158.9 124 6.3 16.2 13.7 29.9
422.1 341.4 118.6 549 61.7 57.2 11.3 383 14.6 22.0 10.2 37.5
640.8 433.2 147.5 432 41.6 26.4 3.7 492 6.5 23.5 18.8 18.8
1,006.4 997.2 320.9 300 65.2 78.0 27.3 363 6.5 9.9 9.8 10.7
159.0 151.9 45.5 797 16.4 14.6 7.8 732 10.3 20.9 20.9 203.5
455.1 355.0 169.1 531 58.6 65.1 34.1 399 12.9 12.8 12.2 11.2
86.7 81.7 NA 877 6.4 1.8 NA 857 7.3 12.5 3.4 3.8
875.8 771.4 NA 347 161.6 131.9 NA 180 18.4 15.3 10.6 14.2
745.7 548.5 182.5 390 97.2 58.7 13.4 277 13.0 12.3 7.4 10.4
750.6 531.8 245.4 384 47.3 41.6 12.8 454 6.3 10.1 7.1 12.8
1,393.3 1,256.0 399.5 220 224.1 186.6 83.8 129 16.1 22.4 20.4 30.4
1,796.7 1,315.2 666.1 164 100.7 50.9 6.1 267 5.6 17.9 14.4 13.5
1,548.1 1,148.5 459.8 194 118.9 62.2 12.9 236 7.7 37.4 10.9 23.0
359.6 248.8 123.8 602 37.3 9.9 11.4 529 10.4 19.1 18.9 1.6
1,201.5 894.1 365.4 253 115.2 110.6 34.6 241 9.6 15.4 13.9 8.6
901.0 668.4 238.3 336 65.1 58.0 29.0 364 7.2 31.2 29.5 68.1
1,201.0 782.7 311.1 254 175.8 95.6 26.8 167 14.6 37.1 12.5 6.5
1,215.8 912.8 340.6 250 7.0 26.2 (11.0) 851 0.6 2.8 2.8 2.0
422.2 32.3 29.5 548 166.6 7.8 5.8 174 39.5 47.6 35.2 45.9
346.3 327.2 109.8 612 87.4 79.7 18.1 293 25.2 26.0 26.0 13.5
614.3 147.8 38.6 449 175.8 20.7 6.9 168 28.6 33.3 21.6 27.4
1,507.1 911.9 133.9 204 135.6 108.3 (18.9) 210 9.0 31.8 23.8 17.4
435.5 393.9 114.3 540 82.9 61.6 23.0 302 19.0 30.0 23.4 26.3
534.6 415.4 112.4 487 132.0 91.5 17.3 215 24.7 8.8 17.5 58.1
1,369.0 883.5 443.0 226 49.1 56.9 51.1 441 3.6 NA NA 17.3
207.7 66.5 21.8 748 37.7 6.2 2.3 523 18.2 66.5 18.4 2.4
1,459.8 1,098.2 440.1 211 151.6 104.1 51.7 191 10.4 15.6 13.2 17.1
1,012.8 896.4 297.9 298 146.4 73.8 31.5 199 14.5 29.9 16.7 30.6
176.4 160.5 56.9 780 75.2 77.3 26.2 321 42.6 11.7 11.7 6.5
301-350

RANK2008 2007
COMPANY AVERAGE MARKET CAPITALISATION (Rs cr)Apr-Oct 2008 Apr-Oct 2007 2007-08 2006-07
⌧ 18 months ended Sept. 30, 2007# 15 months ended Dec. 31, 2007� 15 months ended Mar. 31, 2008
● 12 months ended Dec. 31, 2006▲ 12 months ended March 31, 2007▼ 12 months ended Sept.30, 2007
◆ 12 months ended Nov. 30, 2007❚ 12 months ended Dec. 31, 2007❏ 12 months ended Jun. 30, 2008
◗ 12 months ended Sept. 30, 2008�9 months ended Dec. 31, 2007✪ 9 months ended Mar. 31, 2008
❍ 6 months ended Mar. 31, 2008✛ 3 months ended Aug. 31, 2008
Figures for companies are standalone unless otherwise mentioned; + Consolidated results Source: CMIE Prowess, BSE and company websites
TOTAL ASSETS(Rs cr)2007-08 Rank
BT 500 India’s Most Valuable Private Sector Companies
351 280 Vishal Retail 1,023.8 1,555.0 1,663.9 NL 964.3 370
352 345 Dabur Pharma 1,014.8 1,151.8 1,111.8 1,041.1 803.1 426
353 375 Ingersoll-Rand (India) 1,010.4 1,017.5 1,005.1 986.1 831.6 412
354 462 Adhunik Metaliks 1,007.7 675.5 1,046.6 311.0 1,617.0 254
355 393 Varun Shipping Co. 992.9 926.1 1,021.6 881.6 3,293.4 132
356 222 Northgate Technologies 991.5 2,064.6 1,900.8 1,102.1 408.9 644
357 430 Arshiya International 988.4 796.3 1,069.7 251.8 480.6 590
358 340 Wyeth 982.6 1,184.0 1,131.8 1,222.6 395.8 658
359 289 Prism Cement ❏ 980.6 1,501.3 1,520.5 1,052.7 828.7 415
360 436 Sadbhav Engineering 976.1 762.6 1,035.1 454.0 699.1 469
361 348 Bata India ❚ 968.1 1,125.7 1,194.9 1,307.7 535.2 561
362 390 Electrosteel Castings 960.0 931.2 1,248.0 810.5 2,259.0 188
363 207 Network 18 Media & Invst. 957.0 2,251.4 2,113.2 1,773.8 810.9 423
364 310 Ess Dee Aluminium 953.0 1,331.5 1,447.1 721.2 466.7 603
365 263 Development Credit Bank 951.8 1,646.4 1,777.7 931.6 7,592.3 60
366 247 Elecon Engineering Co. 951.0 1,798.9 2,007.2 887.8 1,014.7 361
367 272 Amtek India ❏ 944.7 1,598.7 1,589.5 958.7 1,480.7 277
368 395 Walchandnagar Industries ▼ 944.2 919.7 1,435.1 257.6 557.3 547
369 418 Mastek ❏ 939.4 845.3 842.7 984.3 428.3 627
370 325 Trent 925.9 1,248.9 1,191.6 1,195.8 816.9 420
371 258 Jyoti Structures 917.8 1,679.6 1,795.3 903.4 904.9 391
372 456 Bannari Amman Sugars 916.3 698.1 824.7 935.2 1,061.0 347
373 324 DCM Shriram Consolidated 912.7 1,252.0 1,247.7 1,590.0 3,603.8 119
374 367 Novartis India 900.6 1,051.9 1,060.8 1,359.4 584.2 528
375 296 Aptech ❚ 894.7 1,425.1 1,367.4 540.7 230.4 800
376 635 Centrum Capital ❏ 894.4 337.5 446.3 163.0 61.1 965
377 466 Sarda Energy & Minerals 891.5 657.2 1,002.3 147.7 868.5 407
378 463 Mahindra Forgings 887.6 674.9 792.7 675.8 1,035.6 356
379 NL Shriram EPC 879.6 NL 1,059.8 NL 798.8 428
380 473 McLeod Russel India 877.0 644.7 698.1 897.1 1,863.1 228
381 450 Sanghvi Movers 871.5 712.8 854.1 533.9 776.1 436
382 874 Modern India 870.4 134.8 377.3 92.7 137.2 904
383 NL Austral Coke & Projects 866.7 NL NL NL NA NA
384 410 Geojit Financial Services 865.5 869.2 1,085.3 417.1 500.5 575
385 472 Hindusthan National Glass & Inds. 865.5 646.0 877.8 589.4 1,516.9 271
386 346 JK Cement 859.6 1,140.3 1,201.6 1,199.8 1,920.1 221
387 422 Graphite India 859.0 829.9 905.8 796.7 1,529.5 270
388 267 Greaves Cotton ❏ 856.0 1,619.1 1,589.8 1,651.9 725.9 458
389 351 Balkrishna Industries 853.6 1,119.5 1,181.8 1,114.0 1,271.9 316
390 334 Bharati Shipyard 852.2 1,214.3 1,402.3 811.0 1,745.0 240
391 830 Sandur Manganese & Iron Ores 844.8 165.4 276.5 32.5 148.4 892
392 259 CMC 843.6 1,660.6 1,593.1 1,018.9 818.5 419
393 309 Polaris Software Lab 841.2 1,332.4 1,235.8 1,295.1 749.9 442
394 357 Alok Industries 840.2 1,082.2 1,189.5 1,140.6 7,892.4 57
395 253 Asahi India Glass 838.4 1,711.0 1,680.8 1,742.9 1,993.0 214
396 271 Radico Khaitan 837.6 1,608.0 1,481.1 1,481.9 951.3 375
397 396 HFCL Infotel 833.6 919.3 1,299.4 970.6 942.8 377
398 NL Jyothy Laboratories ❏ 825.4 NL 1,437.2 NL 397.4 656
399 549 Jindal South West Holdings 820.7 461.2 968.5 194.9 586.4 526
400 317 Bharat Bijlee 820.5 1,299.6 1,441.5 657.4 440.5 618

SALES (Rs cr)2007-08 2006-07 Q-2 2008-09 Rank
NET PROFIT (Rs cr)2007-08 2006-07 Q-2 2008-09 Rank
PROFIT AS %OF SALES
RONW (%) ROCE (%) EPS (Rs)
NL=Not listedNA=Not applicable or not available
RONW= Return on networthROCE=Return on capital employedEPS=Earning per share
Numbers in brackets indicate negative figure
Private Sector
2007-08
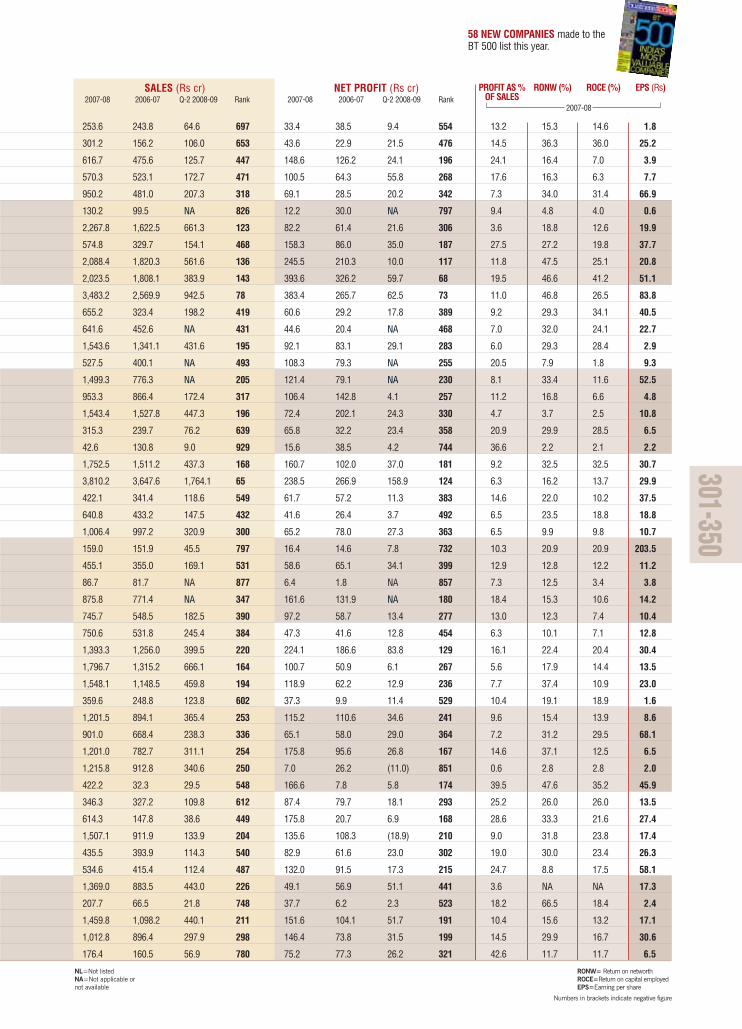
MODERN INDIA’S market cap has shot up by over six times in the past one year.
1,013.1 608.2 360.8 297 40.6 25.1 4.1 499 4.0 20.4 10.3 18.1
431.9 319.0 66.2 543 149.3 25.3 (33.7) 194 34.6 5.6 5.0 1.5
869.5 681.2 111.8 350 280.5 46.5 20.0 106 32.3 12.4 12.4 22.8
1,156.5 871.3 378.0 265 80.5 77.5 23.8 312 7.0 27.5 10.3 8.8
999.7 724.0 257.2 301 225.8 141.4 44.3 128 22.6 28.9 8.4 15.8
69.9 81.7 NA 898 41.3 50.9 NA 493 59.2 10.8 10.7 10.5
208.1 95.1 78.0 747 12.4 4.0 5.6 794 5.9 4.8 4.7 2.2
380.9 333.9 110.8 583 81.5 92.4 33.8 309 21.4 31.5 31.2 35.9
1,035.7 680.5 167.4 288 241.6 62.1 15.0 122 23.3 47.0 47.0 8.2
882.3 492.7 124.6 344 52.4 26.4 5.1 426 5.9 22.0 18.0 37.6
904.8 822.4 228.8 334 47.4 40.2 12.4 452 5.2 18.1 21.0 8.0
1,538.7 1,269.8 590.4 198 52.0 106.2 42.1 429 3.4 2.5 1.6 3.7
143.4 16.2 52.8 807 44.3 6.1 13.1 471 30.9 12.0 7.4 8.6
314.8 156.1 NA 640 61.7 27.6 NA 382 19.6 22.5 20.6 22.2
758.3 467.2 201.5 379 38.3 7.4 1.0 520 5.1 5.8 3.4 2.2
960.2 847.7 254.9 314 67.2 54.9 16.0 352 7.0 30.2 21.0 7.2
987.1 773.4 234.1 308 346.8 120.7 22.2 86 35.1 21.9 11.2 30.9
672.9 384.4 NA 408 35.6 13.3 NA 542 5.3 16.9 29.0 13.0
608.2 401.4 162.6 451 99.2 49.3 26.2 273 16.3 30.8 30.7 27.7
546.7 473.3 141.2 481 32.9 32.4 3.5 557 6.0 6.6 5.8 16.7
1,400.7 1,025.8 421.2 219 67.9 54.5 20.1 348 4.8 23.5 22.5 8.9
577.2 693.3 208.0 466 42.3 90.3 30.1 486 7.3 8.5 5.7 33.2
3,500.0 2,916.1 970.3 77 671.0 45.8 7.1 48 19.2 (13.1) (6.1) (0.2)
627.8 618.0 173.1 439 97.2 88.6 29.2 276 15.5 22.3 22.2 30.4
99.5 84.4 34.3 861 2.5 (6.9) 2.3 902 2.5 (9.1) (7.5) 0.5
53.0 29.0 7.3 917 20.1 10.8 0.5 695 38.0 39.4 35.1 38.1
710.9 428.8 NA 399 121.4 42.6 NA 228 17.1 39.6 23.1 35.7
257.2 251.5 78.1 693 (14.2) (12.5) (7.6) 953 (5.5) (3.9) (3.0) 0.5
649.2 300.9 170.7 423 35.4 13.1 7.0 543 5.5 13.8 11.5 8.3
727.8 651.2 285.2 394 50.1 47.5 121.7 437 6.9 1.2 1.7 4.4
257.0 206.0 96.0 695 72.8 64.3 28.8 328 28.3 27.8 12.5 16.8
171.4 63.2 41.8 787 5.4 4.3 2.6 865 3.2 15.7 7.2 1.4
NA NA NA NA NA NA NA NA NA NA NA NA
208.8 110.6 46.6 746 48.2 21.1 7.9 445 23.1 23.0 23.0 2.1
1,188.1 602.3 307.5 258 160.3 34.2 27.7 183 13.5 24.1 20.1 109.6
1,836.1 1,558.5 361.6 157 265.2 178.6 17.8 110 14.4 28.4 24.5 37.9
1,197.1 1,037.3 386.1 256 133.7 193.9 47.7 211 11.2 21.6 13.7 9.4
1,374.3 969.1 351.2 224 110.2 85.1 20.6 247 8.0 17.9 16.0 21.0
1,021.2 911.9 321.4 294 105.6 83.1 17.1 260 10.3 27.7 18.6 53.7
484.2 458.2 235.5 519 107.5 73.2 33.2 256 22.2 25.9 13.8 38.6
273.8 132.0 143.9 678 57.8 19.9 68.3 404 21.1 335.0 335.0 62.8
989.8 994.7 184.5 306 88.2 64.0 25.9 291 8.9 29.6 28.1 58.2
962.4 909.3 320.1 312 52.6 79.6 30.0 422 5.5 8.7 8.6 5.4
2,536.0 2,006.5 698.6 108 198.7 164.8 42.2 156 7.8 16.8 3.8 8.7
1,178.0 914.9 344.6 260 13.3 42.1 18.7 776 1.1 3.2 0.8 0.7
1,254.7 996.6 175.1 242 26.5 25.9 6.0 612 2.1 10.8 5.0 3.2
258.4 277.8 NA 692 (142.5) (116.3) NA 982 (55.2) (95.0) (29.5) (2.6)
420.1 378.3 89.0 551 52.4 40.0 5.1 425 12.5 15.0 15.0 21.6
5.8 43.2 2.8 983 3.3 39.4 1.7 890 57.6 0.6 0.6 3.0
645.2 544.4 151.3 427 72.5 55.1 12.5 329 11.2 51.1 45.7 128.3
351-400

RANK2008 2007
COMPANY AVERAGE MARKET CAPITALISATION (Rs cr)Apr-Oct 2008 Apr-Oct 2007 2007-08 2006-07
⌧ 18 months ended Sept. 30, 2007# 15 months ended Dec. 31, 2007� 15 months ended Mar. 31, 2008
● 12 months ended Dec. 31, 2006▲ 12 months ended March 31, 2007▼ 12 months ended Sept.30, 2007
◆ 12 months ended Nov. 30, 2007❚ 12 months ended Dec. 31, 2007❏ 12 months ended Jun. 30, 2008
◗ 12 months ended Sept. 30, 2008�9 months ended Dec. 31, 2007✪ 9 months ended Mar. 31, 2008
❍ 6 months ended Mar. 31, 2008✛ 3 months ended Aug. 31, 2008
Figures for companies are standalone unless otherwise mentioned; + Consolidated results Source: CMIE Prowess, BSE and company websites
TOTAL ASSETS (Rs cr)2007-08 Rank
BT 500 India’s Most Valuable Private Sector Companies
401 499 City Union Bank 812.5 559.1 771.9 309.5 7,349.0 62
402 NL Responsive Industries 811.8 18.8 105.5 1.9 215.1 821
403 338 Tube Investments Of India 804.6 1,206.4 1,226.8 1,492.0 1,604.4 256
404 599 Suashish Diamonds � 802.5 388.8 438.1 292.7 1,597.9 258
405 381 Voltamp Transformers 801.1 985.2 1,193.0 592.8 255.4 780
406 319 Finolex Cables 799.3 1,270.4 1,336.8 1,202.1 1,438.8 287
407 374 SRF 795.8 1,020.3 991.6 1,416.8 1,950.1 217
408 405 Deepak Fertilisers & Petrochemicals Corpn. 787.9 879.1 994.5 756.8 1,366.1 302
409 482 Techno Electric & Engg. Co. 780.6 611.7 909.7 429.8 281.5 754
410 290 TVS Motor Co. 780.3 1,495.9 1,398.8 2,429.1 2,274.6 186
411 467 Amara Raja Batteries 771.9 655.5 823.6 381.1 873.0 402
412 248 Kalyani Steels 761.4 1,757.2 1,738.4 1,512.1 1,125.1 339
413 437 Abbott India ◆ 755.2 760.2 766.0 827.7 331.6 709
414 691 Sanwaria Agro Oils 753.5 278.4 383.0 139.1 195.7 840
415 364 Arvind 748.9 1,062.2 1,150.8 1,328.9 3,773.3 109
416 407 Uflex 745.5 874.8 927.2 504.6 2,501.8 170
417 371 Eicher Motors 743.7 1,035.2 988.4 859.5 1,255.5 320
418 478 Zuari Industries 739.6 625.0 745.0 560.5 2,244.9 189
419 550 Assam Co. ❚ 735.8 460.7 683.8 494.2 879.7 398
420 420 Ahluwalia Contracts (India) 734.1 838.6 1,175.6 578.6 362.5 690
421 445 BASF India 727.4 737.0 707.6 616.9 530.0 564
422 416 Everonn Systems India 726.2 849.8 955.8 NL 165.4 871
423 378 EMCO 723.8 991.5 1,157.4 577.0 1,059.5 348
424 515 Karuturi Global 722.7 522.8 622.4 141.6 659.2 487
425 523 Bajaj Electricals 720.4 511.3 624.9 407.6 830.4 413
426 817 Sunteck Realty 713.3 174.7 284.8 72.0 12.9 989
427 399 Ganesh Housing Corpn. 712.4 900.7 1,119.6 329.9 580.9 532
428 NL Trinethra Infra Ventures ▲ 710.6 NL NL NL 2.9 991
429 498 Noida Toll Bridge Co. 705.8 562.6 733.6 702.5 739.8 450
430 458 Hikal 687.9 690.9 657.6 614.9 668.7 484
431 234 Hexaware Technologies ❚ 687.5 1,889.1 1,600.6 2,082.7 890.0 396
432 318 Take Solutions 685.8 1,281.7 1,261.7 NL 279.4 759
433 543 Magma Fincorp 685.5 471.6 570.6 274.7 3,284.6 133
434 385 Finolex Industries 684.3 961.8 995.5 1,043.4 1,759.5 237
435 652 Solar Explosives 681.4 312.4 476.2 266.0 251.4 783
436 NL Mavens Biotech 679.5 NL NL NL 15.1 987
437 694 Temptation Foods 675.8 275.2 359.7 4.1 238.6 793
438 227 NIIT Technologies 674.1 1,995.0 1,596.5 995.4 555.7 548
439 376 Himachal Futuristic Communications 673.3 1,009.3 1,157.3 1,088.0 1,918.9 222
440 313 GHCL 668.8 1,317.7 1,386.4 1,562.2 2,026.4 208
441 479 Navneet Publications (India) 668.5 621.3 799.8 557.9 347.2 705
442 413 Escorts ▼ 667.4 863.2 934.2 745.0 2,636.0 164
443 417 Subhash Projects & Mktg. 667.0 848.4 1,077.6 587.1 703.5 467
444 409 Orient Paper & Inds. 659.9 872.9 970.6 712.1 904.7 392
445 311 SpiceJet 656.7 1,330.7 1,390.7 980.6 1,307.7 312
446 368 Strides Arcolab ❚ 653.6 1,045.2 943.7 1,096.4 1,596.5 259
447 792 Alchemist Realty 650.7 193.8 324.0 39.1 24.6 981
448 408 Nesco 649.6 874.7 1,012.0 658.4 177.8 857
449 454 HBL Power Systems 636.6 700.4 778.0 579.1 881.0 397
450 360 FAG Bearings India ❚ 635.5 1,069.8 1,017.8 1,002.4 445.6 615

SALES (Rs cr)2007-08 2006-07 Q-2 2008-09 Rank
NET PROFIT (Rs cr)2007-08 2006-07 Q-2 2008-09 Rank
PROFIT AS %OF SALES
RONW (%) ROCE (%) EPS (Rs)
NL=Not listedNA=Not applicable or not available
RONW= Return on networthROCE=Return on capital employedEPS=Earning per share
Numbers in brackets indicate negative figure
Private Sector
2007-08
SUN PHARMACEUTICAL’S market cap increasedby over Rs 9,000 crore this year over last year.
691.4 460.1 218.3 402 101.7 71.8 37.7 265 14.7 21.8 21.3 3.2
378.6 225.2 96.5 587 37.9 24.9 6.9 522 10.0 55.4 54.2 28.0
2,047.4 1,945.4 662.0 141 56.5 155.8 42.1 407 2.8 7.6 6.2 2.8
1,340.6 1,033.1 296.7 232 82.5 55.3 29.3 304 6.2 13.8 7.7 38.6
669.9 490.3 174.0 411 79.9 39.6 27.3 314 11.9 60.5 60.5 79.0
1,627.0 1,205.5 387.7 185 88.9 69.0 1.8 290 5.5 14.1 10.8 6.7
1,805.5 1,976.9 512.3 162 138.7 289.1 58.9 208 7.7 14.6 10.3 20.4
1,177.4 942.7 379.8 261 100.3 92.9 41.8 269 8.5 15.4 11.1 11.6
441.3 358.0 137.1 536 49.1 28.0 18.2 442 11.1 34.2 34.2 8.6
3,784.9 4,551.5 1,035.1 68 31.8 66.3 10.4 569 0.8 1.6 1.0 1.8
1,376.0 754.9 346.4 222 94.4 47.0 18.8 281 6.9 32.3 19.6 16.0
1,237.0 1,138.4 382.0 244 79.3 89.8 11.0 317 6.4 16.3 12.4 18.2
662.5 561.1 183.3✛ 414 67.9 59.9 17.6✛ 347 10.2 27.7 27.5 48.2
943.1 445.6 312.5 321 43.3 16.0 22.1 482 4.6 14.8 27.8 5.0
2,351.5 2,006.5 NA 117 27.4 119.6 NA 606 1.2 1.1 0.6 1.1
1,534.9 1,436.3 NA 199 60.5 42.2 NA 390 3.9 12.2 4.6 9.6
2,559.5 2,260.7 NA 106 63.1 61.3 NA 373 2.5 12.7 10.3 22.4
2,682.0 2,841.2 2,122.1 104 73.4 393.6 50.4 325 2.7 9.0 5.1 24.9
182.2 156.6 71.6 773 8.6 7.5 24.7 835 4.7 (0.4) (0.2) 0.4
887.1 674.7 303.5 343 51.6 31.2 14.5 431 5.8 44.3 28.5 8.2
1,035.7 879.6 324.7 287 59.4 50.1 26.1 396 5.7 18.4 18.4 21.1
93.5 43.3 35.8 869 13.8 4.1 8.0 768 14.7 19.8 14.6 10.0
1,047.0 738.1 230.7 283 64.5 40.6 11.3 366 6.2 19.4 14.5 11.0
39.1 36.3 NA 934 12.0 13.1 NA 798 30.8 9.2 3.9 3.7
1,414.0 1,121.1 380.1 218 73.1 38.5 12.2 327 5.2 48.7 30.3 42.3
6.0 0.8 2.6 981 2.8 0.3 1.9 900 46.3 8.8 8.1 5.7
140.1 67.8 21.0 812 106.1 32.2 12.0 259 75.7 28.8 27.5 32.5
NA NA NA NA NA NA NA NA NA NA NA NA
71.9 49.1 20.0 897 28.0 11.1 7.5 603 38.9 5.4 4.3 1.5
341.9 250.3 109.8 619 49.6 33.8 17.2 439 14.5 22.6 12.5 29.0
524.3 492.5 NA 497 (11.2) 118.7 NA 950 (2.1) 13.2 13.2 (1.5)
88.3 57.4 NA 876 20.7 10.3 NA 687 23.4 13.3 10.9 17.0
471.8 278.4 153.7 526 50.5 31.4 11.3 435 10.7 13.8 4.0 23.2
1,678.0 1,252.7 294.4 175 71.2 69.9 21.8 333 4.2 12.8 9.9 4.1
201.4 145.9 101.8 756 18.0 10.4 5.1 715 8.9 12.7 10.6 10.4
20.9 18.9 NA 968 0.5 0.9 NA 918 2.6 3.8 3.8 0.5
329.7 39.7 215.5 627 23.8 5.8 13.1 644 7.2 22.3 24.1 9.5
505.5 312.1 143.1 507 143.1 110.7 29.4 206 28.3 39.2 36.8 22.8
364.6 1,152.6 NA 597 (150.5) 121.0 NA 983 (41.3) (27.1) (11.4) (3.2)
1,216.3 1,200.1 336.8 249 101.6 147.3 26.1 266 8.4 17.5 5.9 9.4
405.5 328.3 92.5 567 53.8 42.6 6.3 417 13.3 24.7 19.4 5.7
2,155.6 1,928.9 NA 129 (6.4) 19.0 NA 947 (0.3) (1.0) (1.2) (1.7)
1,174.5 812.8 255.3 262 58.2 43.6 12.5 401 5.0 50.1 42.0 15.9
1,513.6 1,297.5 356.0 201 204.5 130.7 45.2 150 13.5 60.8 39.7 10.9
1,438.6 748.3 NA 216 (133.5) (70.7) NA 981 (9.3) (151.6) (26.6) (5.7)
417.1 462.9 NA 555 (115.4) (36.2) NA 977 (27.7) (37.5) (13.5) (15.8)
79.0 0.7 5.7 890 3.2 0.3 0.1 892 4.0 2.1 2.3 2.3
109.2 74.9 31.7 849 36.7 18.2 14.5 533 33.6 59.6 70.7 54.4
1,138.7 592.3 NA 269 67.1 32.1 NA 354 5.9 25.2 16.3 28.1
729.4 624.5 220.1 393 79.3 73.7 31.1 316 10.9 27.1 27.3 49.7
401-450

RANK2008 2007
COMPANY AVERAGE MARKET CAPITALISATION (Rs cr)Apr-Oct 2008 Apr-Oct 2007 2007-08 2006-07
TOTAL ASSETS (Rs cr)2007-08 Rank
BT 500 India’s Most Valuable Private Sector Companies
451 406 Ratnamani Metals & Tubes 634.2 876.9 901.9 394.2 632.3 499
452 384 Taj GVK Hotels & Resorts 629.9 969.8 962.1 1,364.5 383.7 663
453 712 Lloyds Metals & Engineers 629.3 257.9 540.5 56.0 307.3 731
454 373 Alembic 628.0 1,026.1 1,015.0 905.2 1,021.7 357
455 803 SEL Manufacturing Co. 626.4 187.7 244.8 NL 638.0 493
456 514 India Glycols 625.7 524.2 713.5 379.0 1,329.4 310
457 444 Gati ❏ 623.9 741.3 831.1 645.2 621.9 505
458 440 Elder Pharmaceuticals 620.5 754.0 749.2 618.8 825.8 417
459 517 Jindal Poly Films 613.9 520.0 578.8 499.0 1,392.8 298
460 256 Gulf Oil Corpn. 613.5 1,692.7 1,690.1 1,756.9 2,479.7 172
461 530 Country Club (India) 612.6 496.2 673.5 183.2 302.4 736
462 556 Graviss Hospitality 612.5 453.2 471.6 122.2 314.7 727
463 386 ICRA 610.8 961.3 911.2 NL 204.0 831
464 424 Champagne Indage 608.7 827.3 875.2 481.0 550.8 550
465 415 Unichem Laboratories 607.7 851.2 768.4 916.8 602.1 520
466 429 Gokaldas Exports 602.6 800.9 803.7 1,039.2 913.4 387
467 327 Cambridge Solutions 602.5 1,245.7 1,066.1 1,047.0 408.4 645
468 308 ISMT 602.4 1,333.5 1,286.8 1,179.5 1,864.6 226
469 588 Dewan Housing Finance Corpn. 599.9 405.8 670.1 356.3 4,494.9 94
470 539 Whirlpool of India 595.8 481.3 511.3 379.1 1,088.5 344
471 457 Esab India ❚ 594.0 692.5 683.6 570.1 166.0 870
472 306 Nucleus Software Exports 591.9 1,352.3 1,213.6 850.5 250.4 784
473 NL Gokul Refoils & Solvent 588.8 NL NL NL 786.0 431
474 743 Marksans Pharma 587.4 236.1 462.0 444.2 503.9 573
475 433 Grindwell Norton ❚ 579.5 780.4 782.9 736.7 587.0 525
ADD
⌧ 18 months ended Sept. 30, 2007# 15 months ended Dec. 31, 2007� 15 months ended Mar. 31, 2008
● 12 months ended Dec. 31, 2006▲ 12 months ended March 31, 2007▼ 12 months ended Sept.30, 2007
◆ 12 months ended Nov. 30, 2007❚ 12 months ended Dec. 31, 2007❏ 12 months ended Jun. 30, 2008
◗ 12 months ended Sept. 30, 2008�9 months ended Dec. 31, 2007✪ 9 months ended Mar. 31, 2008
❍ 6 months ended Mar. 31, 2008✛ 3 months ended Aug. 31, 2008
NL=Not listed
Figures for companies are standalone unless otherwise mentioned; + Consolidated results Source: CMIE Prowess, BSE and company websites

SALES (Rs cr)2007-08 2006-07 Q-2 2008-09 Rank
NET PROFIT (Rs cr)2007-08 2006-07 Q-2 2008-09 Rank
PROFIT AS %OF SALES
RONW (%) ROCE (%) EPS (Rs)
Private Sector
2007-08
UTV SOFTWARE is the only media company whosemarket cap has increased this year over last year.
893.9 620.6 255.0 339 90.0 64.2 23.4 288 10.1 48.1 27.3 100.0
259.1 244.2 61.8 691 70.4 64.3 16.3 335 27.2 33.4 25.8 11.2
420.3 338.4 174.8 550 22.4 (30.0) 17.9 661 5.3 26.5 (5.0) (0.6)
1,065.1 747.4 350.6 281 112.2 70.7 15.0 245 10.5 24.2 17.5 6.4
392.7 203.6 NA 575 44.9 23.6 NA 466 11.4 25.9 14.1 29.5
1,583.3 1,107.3 349.4 190 178.5 41.1 (10.5) 164 11.3 44.3 22.7 64.3
577.6 458.6 158.4 465 23.8 20.1 0.4 645 4.1 2.3 1.5 3.8
576.1 471.2 152.9 467 69.7 49.2 15.1 339 12.1 19.3 14.5 36.5
1,439.6 1,141.9 364.7 215 132.6 64.8 15.3 214 9.2 15.6 13.3 47.7
875.6 711.4 238.3 348 25.1 23.0 1.8 631 2.9 1.2 3.9 3.4
314.2 153.9 NA 641 65.3 35.1 NA 362 20.8 29.1 18.6 42.2
72.4 53.3 15.7 894 13.0 7.3 0.1 783 18.0 5.2 4.5 7.5
68.7 46.8 23.3 900 26.7 16.1 8.7 610 38.8 17.8 17.8 26.6
199.1 131.4 43.3 761 39.8 22.0 7.1 512 20.0 18.9 14.5 27.4
601.7 575.1 179.5 453 77.7 90.1 35.1 318 12.9 18.5 17.5 21.4
1,096.0 1,041.8 323.0 277 47.6 70.3 3.1 450 4.3 11.1 9.2 16.3
198.9 176.2 74.0 762 4.3 (11.1) 11.0 879 2.2 (7.7) (5.1) NA
1,381.1 1,367.9 410.8 221 100.0 130.1 20.2 271 7.2 17.0 6.6 6.8
524.1 335.0 160.8 498 82.6 48.4 22.1 303 15.8 20.4 2.1 13.6
2,004.7 1,664.1 410.5 145 32.3 (5.3) 1.7 566 1.6 13.6 11.9 2.6
399.8 336.0 118.7 570 53.4 42.7 18.1 420 13.4 57.0 57.0 36.7
219.4 151.2 55.5 732 60.8 42.9 7.2 386 27.7 33.8 33.9 18.8
2,070.4 1,576.6 NA 138 55.0 26.7 NA 412 2.7 29.5 21.6 32.5
253.2 254.8 68.7 698 14.9 6.9 6.9 753 5.9 11.4 3.9 0.5
618.1 434.4 142.8 446 133.5 46.0 15.4 212 21.6 23.5 23.7 9.9
NA=Not applicable or not available
RONW= Return on networthROCE=Return on capital employedEPS=Earning per share
Numbers in brackets indicate negative figure
451-475

RANK2008 2007
COMPANY AVERAGE MARKET CAPITALISATION (Rs cr)Apr-Oct 2008 Apr-Oct 2007 2007-08 2006-07
⌧ 18 months ended Sept. 30, 2007# 15 months ended Dec. 31, 2007� 15 months ended Mar. 31, 2008
● 12 months ended Dec. 31, 2006▲ 12 months ended March 31, 2007▼ 12 months ended Sept.30, 2007
◆ 12 months ended Nov. 30, 2007❚ 12 months ended Dec. 31, 2007❏ 12 months ended Jun. 30, 2008
◗ 12 months ended Sept. 30, 2008�9 months ended Dec. 31, 2007✪ 9 months ended Mar. 31, 2008
❍ 6 months ended Mar. 31, 2008✛ 3 months ended Aug. 31, 2008
Figures for companies are standalone unless otherwise mentioned; + Consolidated results Source: CMIE Prowess, BSE and company websites
TOTAL ASSETS (Rs cr)2007-08 Rank
BT 500 India’s Most Valuable Private Sector Companies
476 434 Clariant Chemicals (India) ❚ 572.4 779.1 760.3 790.1 546.1 555
477 536 IL&FS Investment Managers 569.5 483.8 602.2 334.9 97.7 945
478 421 Timken India ❚ 565.0 835.3 804.5 900.9 306.1 735
479 305 Bajaj Auto Finance 564.8 1,353.0 1,378.7 1,028.8 3,845.9 105
480 449 Cholamandalam DBS Finance 563.3 716.4 903.9 562.8 6,524.4 71
481 426 JBF Industries 562.4 823.4 859.2 503.5 1,112.5 342
482 488 FDC 562.1 599.6 626.1 772.8 499.0 576
483 495 Dynamatic Technologies 560.8 575.9 570.2 492.3 297.4 743
484 509 Action Construction Equipment 560.0 537.9 654.6 463.5 244.3 788
485 447 Transport Corporation Of India 558.2 720.3 770.3 408.6 570.1 541
486 339 Sundram Fasteners 557.7 1,199.6 1,118.5 1,503.9 1,244.3 323
487 476 Forbes & Co. 557.3 631.6 668.4 616.7 493.2 581
488 365 Prime Focus 554.7 1,058.6 1,135.1 439.9 285.5 751
489 455 OCL India 551.8 699.5 885.6 689.9 1,352.8 305
490 459 Merck ❚ 548.9 677.7 663.3 833.5 490.6 583
491 391 HTMT Global Solutions 546.7 930.4 896.5 NL 717.3 460
492 781 Glodyne Technoserve 545.7 203.2 264.4 81.3 108.7 936
493 585 Mascon Global 543.8 407.0 481.9 297.2 1,130.0 337
494 563 Gujarat Ambuja Exports 540.5 441.0 619.6 338.1 1,053.2 349
495 435 Unity Infraprojects 539.3 763.2 846.1 666.9 985.9 367
496 372 Micro Inks ❚ 539.0 1,034.2 948.2 852.0 1,355.5 304
497 394 Vardhman Textiles 536.6 924.5 889.4 1,665.2 4,266.1 95
498 321 Wire & Wireless (India) 535.9 1,267.4 1,330.7 2,314.9 402.4 648
499 595 Jaypee Hotels 535.4 393.6 654.7 411.7 366.5 686
500 400 Pyramid Saimira Theatres 533.7 899.5 947.3 818.5 786.0 430
ADD

SALES (Rs cr)2007-08 2006-07 Q-2 2008-09 Rank
NET PROFIT (Rs cr)2007-08 2006-07 Q-2 2008-09 Rank
PROFIT AS %OF SALES
RONW (%) ROCE (%) EPS (Rs)
NL=Not listedNA=Not applicable or not available
RONW= Return on networthROCE=Return on capital employedEPS=Earning per share
Numbers in brackets indicate negative figure
Private Sector
2007-08
987.3 785.4 260.9 307 30.4 32.9 25.2 582 3.1 9.2 9.1 14.3
82.6 50.3 24.2 881 28.0 17.3 8.6 601 34.0 56.5 56.5 10.6
390.6 369.8 114.5 577 37.4 38.1 14.8 527 9.6 16.3 16.3 6.1
503.2 402.2 137.4 510 20.6 47.6 4.6 689 4.1 1.0 0.6 5.5
903.5 418.2 287.8 335 59.4 31.0 (10.5) 397 6.6 12.4 1.7 12.3
2,110.9 1,492.1 591.6 133 126.8 80.8 17.8 223 6.0 23.2 10.4 20.4
544.5 482.7 160.2 483 65.8 64.3 26.3 359 12.1 18.3 17.9 3.4
332.9 133.2 91.0 625 18.6 10.0 2.5 710 5.6 37.8 18.3 39.2
439.2 269.7 NA 538 36.3 19.9 NA 537 8.3 29.0 29.3 4.0
1,206.7 1,089.9 339.1 251 28.4 30.6 5.6 598 2.4 11.5 8.2 3.9
1,356.7 1,345.5 388.5 227 69.5 71.9 9.2 341 5.1 17.0 11.8 3.2
300.7 675.7 61.7 655 2.4 9.1 (1.0) 903 0.8 (1.5) (0.9) 2.2
89.9 63.2 25.7 874 26.2 20.1 5.8 615 29.2 13.1 10.6 20.8
906.8 923.8 246.4 333 116.2 77.5 22.1 239 12.8 24.2 14.0 20.0
384.3 458.1 118.7 580 68.8 133.4 17.6 343 17.9 16.7 16.7 41.0
374.8 155.4 112.3 592 58.8 20.1 8.8 398 15.7 9.7 9.1 25.3
273.8 133.4 113.7 679 33.7 14.6 17.7 552 12.3 57.2 56.4 30.9
285.2 144.9 NA 667 53.6 22.8 NA 419 18.8 8.6 6.8 1.5
1,861.6 1,421.0 331.2 153 71.3 46.8 13.0 331 3.8 21.5 20.0 5.2
862.5 553.6 231.9 355 60.1 (38.3) 15.4 392 7.0 18.2 12.5 44.9
1,265.1 785.0 384.5 241 68.1 38.0 27.0 346 5.4 9.2 7.8 33.7
2,415.6 2,189.5 674.7 115 122.5 171.7 19.4 227 5.1 8.9 3.4 21.2
235.3 192.7 61.5 720 (158.0) (111.1) (25.8) 984 (67.1) 551.4 (62.1) (3.7)
172.9 130.8 41.2 784 17.5 13.6 2.9 718 10.1 12.5 10.5 3.2
749.3 164.8 252.3 386 57.9 13.4 8.7 403 7.7 36.5 17.6 20.5
JET AIRWAYS & KINGFISHER AIRLINES’ net losses in Sept 2008 quarter werealmost double of their losses in full last financial year ended March 2008.
476-500