ASSESSING INDIA’S PROGRESS IN ACHIEVING THE MILLENNIUM DEVELOPMENT GOALS… · ·...
47
ASSESSING INDIA’S PROGRESS IN ACHIEVING THE MILLENNIUM DEVELOPMENT GOALS: KEY DRIVERS OF INTER-STATE VARIATIONS Shiladitya Chatterjee, Matthew Hammill, Nagesh Kumar and Swayamsiddha Panda September 2015 DEVELOPMENT PAPERS 1502 ESCAP SOUTH AND SOUTH-WEST ASIA OFFICE
Transcript of ASSESSING INDIA’S PROGRESS IN ACHIEVING THE MILLENNIUM DEVELOPMENT GOALS… · ·...

ASSESSING INDIA’S PROGRESS IN ACHIEVING THE MILLENNIUM DEVELOPMENT GOALS:KEY DRIVERS OF INTER-STATE VARIATIONS
Shiladitya Chatterjee, Matthew Hammill, Nagesh Kumar and Swayamsiddha Panda
September 2015
DEVELO
PMEN
T PAPERS 1502
ESCAP
SOUTH AND SOUTH-WEST ASIA
OFFICE

South and South-West Asia Development Papers 1502
September 2015
2
Disclaimer: The views expressed in this Development Paper are those of the author(s) and
should not necessarily be considered as reflecting the views or carrying the endorsement of
the United Nations. Development Papers describe research in progress by the author(s) and
are published to elicit comments and to further debate. This publication has been issued
without formal editing.
For any further details, please contact:
Dr. Nagesh Kumar, Head
South and South-West Asia Office (SSWA)
Economic and Social Commission for Asia and the Pacific (ESCAP)
C-2 Qutab Institutional Area, New Delhi-110016, India
Email: [email protected]

Assessing India’s Progress in Achieving the Millennium Development Goals
September 2015
3
Contents
Foreword .................................................................................................................................... 5
Abstract ...................................................................................................................................... 6
1. Introduction ........................................................................................................................... 7
2. India’s overall performance ................................................................................................. 8
3. Performance of States on the MDGs .................................................................................. 15
4. Key drivers of the MDGs Achievement ............................................................................. 24
i) Broad-based and employment-creating economic growth ....................................... 25
ii) Prioritization of resources for human development ................................................. 27
iii) Effective delivery of public services ............................................................................ 29
iv) Basic infrastructure development ............................................................................... 32
v) Gender equality and empowerment of women .......................................................... 35
5. Concluding remarks ............................................................................................................ 37
References ................................................................................................................................ 39
Statistical Annex: .................................................................................................................... 43
Data and methodology......................................................................................................... 43

South and South-West Asia Development Papers 1502
September 2015
4
List of Boxes
Box 1: Recent data on nutritional status of children in India ...................................................................... 14
List of Tables
Table 1: State ranks on MDG Composite Index for each Goal, (Latest Year) ........................................... 20
List of Figures
Figure 1: India’s progress on the MDGs ....................................................................................................... 9
Figure 2: Current state-wise progress on selected MDG indicators ........................................................... 16
Figure 3: Ranking of states by MDG Composite Performance Index latest year ....................................... 19
Figure 4: MDG Composite Performance Indexes of states baseline and latest years ................................. 21
Figure 5: Change in states' ranks in MDG performance using MDG Composite Indexes, latest year
compared to baseline year ........................................................................................................................... 22
Figure 6: Selected MDG indicator values for India and Bihar, earliest and latest years ............................ 24
Figure 7: Regression of growth on MDG Performance Index (Latest Year) of Indian states .................... 25
Figure 8: Relationship between health outcomes and public health infrastructure ..................................... 29
Figure 9: Off-take of food-grains from PDS per poor person – major states, 2013-14 .............................. 31
Figure 10: Relationship between access to roads and proportion of births attended by skilled health
personnel ..................................................................................................................................................... 33
Figure 11: Relationship between electricity access and literacy, 2011 ....................................................... 34
List of Annex Tables
Annex Table 1: Target, Cut-offs and Transformation ................................................................................ 46
Annex Table 2: Performance of states on MGNREGA 2012-13 and the MDG Performance Index ......... 47

Assessing India’s Progress in Achieving the Millennium Development Goals
September 2015
5
Foreword
The Development Papers Series of the ESCAP South and South-West Asia Office (ESCAP-
SSWA) promotes and disseminates policy-relevant research on the development challenges
facing South and South-West Asia. It features policy research conducted at ESCAP-SSWA as
well as by outside experts from within the region and beyond. The objective is to foster an
informed debate on development policy challenges facing the sub-region and sharing of
development experiences and best practices.
This paper examines the key drivers of India’s MDG performance, assessing progress at the
national and state levels and finds that even though India has made considerable progress
towards reaching the MDGs, the achievements across the Goals and among states have been
uneven. Taking stock of the progress accomplished over the last 14 years since the adoption of
the MDGs, the paper argues that the MDGs still remain an unfinished agenda for India and
greater efforts are urgently required to bring the states lagging on the achievement of the MDGs
on par with the better performing states, given that the overall Indian MDG performance depends
critically on performance by individual states. It draws policy lessons for accelerating progress
for closing the gaps and carrying the momentum forwards post-2015, with the SDGs, to end
poverty and deprivations in all forms and accelerate economic and social prosperity in ways
which are sustainable.
We hope that insights and policy lessons drawn in this paper will be useful for designing a
strategy for implementation by India of the 2030 Agenda for Sustainable Development adopted
by the world leaders on 25 September 2015 that carries forward the unfinished tasks of MDGs.
Nagesh Kumar
Head, ESCAP South and South-West Asia Office

South and South-West Asia Development Papers 1502
September 2015
6
Assessing India’s Progress in Achieving the Millennium Development
Goals:
Key Drivers of Inter-State Variations
Shiladitya Chatterjee, Matthew Hammill, Nagesh Kumar and Swayamsiddha Panda1
Abstract
Assessment of India’s progress towards the MDGs shows a notable but uneven achievement across goals,
targets and states. India has achieved the target for halving poverty and is likely to attain gender parity in
primary, secondary and tertiary school enrolment by the end of 2015. It has reversed the spread of
communicable diseases such as AIDS, malaria, tuberculosis and met the target on access to clean drinking
water. Based on revised WHO estimates, India is on track to achieve the target on maternal mortality ratio
by end-2015. India will miss the target on reducing by half of the proportion of underweight children
since 1990 by a small margin. It is lagging behind on targets for primary school enrolment and
completion and universal youth literacy; empowering women through wage employment and political
participation; reducing child and infant mortality and improving access to sanitation facilities.
A disaggregated analysis of the performance of individual states on the MDGs shows that states like
Kerala, Tamil Nadu, Goa, Sikkim and Delhi seem to be doing better while Bihar, Jharkhand, Uttar
Pradesh, Madhya Pradesh and Assam are lagging behind. Further investigation reveals all states,
including Bihar, have made significant improvements in the absolute MDG scores from their baseline
values; it is just that some states made more rapid improvements than the others. The key “drivers”
explaining the inter-state variation include accelerated broad-based and employment creating economic
growth; extent of allocation of resources to basic services such as education and health; effective delivery
of public services; availability of basic infrastructure such as roads and electricity; and promotion of
gender equality and empowerment of women were critical in achieving the MDGs.
JEL Code(s): I15, I25, I31, I38
Key words: Millennium Development Goals (MDGs), India, States, Broad-based growth, Basic services,
Infrastructure, Sustainable development.
1 Shiladitya Chatterjee is an Adviser, Nagesh Kumar and Matthew Hammill are staff members and Swayamsiddha Panda, a
consultant, of the UNESCAP South and South-West Asia Office, New Delhi.
This paper partly draws upon earlier work done at UNESCAP-SSWA as a part of assessment of India’s progress in achieving
MDGs undertaken on behalf of the United Nations Country Team in India and reported in UNESCAP (2015). The authors
benefitted from inputs provided by UN agencies in India including UNICEF, UNESCO, UN Women, ILO, and WHO among
others. They benefitted from incisive comments and suggestions of N.C. Saxena, A. K. Shiva Kumar, Ram Aggarwala and
Gyanendra Badgaiyan on earlier versions. Chris Garroway’s contribution in the early stage of the work and that of Ivana Brnovic
in later stages is gratefully acknowledged as well as the research assistance provided by a number of UNESCAP-SSWA interns,
including Alessandro Amaro, Sadhika Bagga, Simon Coates, Sebastjan Wassermeyer, Istvan David Toth, and Xin Liu.

Assessing India’s Progress in Achieving the Millennium Development Goals
September 2015
7
1. Introduction
The adoption of the Millennium Development Goals (MDGs) at the turn of the century
represented a culmination of the people-centred development discourse that started with the
launch of the United Nations Development Programme’s (UNDP’s) Human Development
Reports in 1990 and many high-level dialogues and forums held at the United Nations focusing
on different dimensions of human development through the 1990s including the World Children
Summit 1990, the Rio Summit on Sustainable Development 1992, the World Conference on
Human Rights 1993, the World Summit on Social Development 1995, World Conference on
Women 1995, and the World Food Summit 1996.
The MDGs placed poverty reduction and freedom from other deprivations at the top of
the global development agenda and helped invigorate Governments, the domestic and
international development community and other stakeholders towards their fulfilment. Extensive
policy advocacy by the United Nations agencies and the peer pressure led the governments at
national and sub-national levels to integrate inclusive policies and programmes into their
planning processes to meet their overarching objectives. The Tenth Five Year Plan (2002-07) of
India, for instance, included more ambitious accomplishments on a number of MDG priorities,
such as poverty reduction, provision of gainful and high quality employment, universal primary
education, reduction in gender gaps in literacy and wage rates by at least 50%, drastically
reducing infant and maternal mortality rates, among others, to be achieved by 2007. The
Eleventh Five Year Plan (2007-12) recognized the need for better implementation of schemes
towards achieving the MDG targets and announced various flagship programmes for expanding
health (National Rural Health Mission), sanitation coverage (Total Sanitation Campaign),
meeting the MDGs on gender equality and empowerment and targeted schemes for children. The
Twelfth Five Year Plan (2012-17) noted that paucity of end-line data on many health indicators
constrained review of health outcomes and emphasized improving the outcome indicators for
health in terms of significant reduction in infant mortality rates (IMR), maternal mortality ratios
(MMR), reduction of under-nutrition in children under-3 years, among other targets.
As the MDGs reach their deadline at the end of 2015, a universal and transformative
development agenda to succeed the MDGs beyond 2015 has already been developed through an
extensive process of consultation at national, regional and global levels comprising a set of 17
Sustainable Development Goals (SDGs) which has been adopted by the world leaders at the
United Nations Summit in September, 2015.2 It is therefore timely to assess India’s progress
towards achievement of MDGs.
A recent assessment of India’s progress towards the MDGs showed a notable but uneven
achievement across goals, targets and states (see UNESCAP 2015). In this paper, we analyse
2 United Nations General Assembly resolution 70/1.

South and South-West Asia Development Papers 1502
September 2015
8
India’s performance on the MDGs in greater depth, focusing particularly on assessing the
performance of individual Indian states. The paper is organized as follows. Section 2 presents a
brief assessment of India’s overall performance on the MDGs at the aggregate all-India level.
Section 3 analyses performance of the states. Section 4 analyses some key drivers or cross-
cutting factors explaining the variations in performance of states on the MDGs. Section 5
presents conclusions with some lessons for the SDGs.
2. India’s overall performance
The overall all-India performance on the MDGs is summarized in Figure 1, following the
methodology discussed in Annex 1. The figure shows the distance covered by India in each of
the selected indicators from 1990 for which specific targets exist (in terms of the percentage of
the target achieved from the 1990 baseline) till the latest count, and the additional distance likely
to be traversed till the end of 2015. This involves 16 of the 20 indicators studied. In case of 4
indicators, performance is judged by directional change. This summary shows that India has
either already achieved, or is likely to achieve by end 2015 targets relating to 10 of the 20 crucial
indicators being studied. These are:
Extreme poverty (Goal 1). Goal 1 of the MDGs contains two important sub-goals:
reduction of poverty and reduction of hunger. The poverty target is to reduce the incidence of
extreme poverty by half from the 1990 baseline figure. India has already achieved its poverty
reduction target under this MDG, as measured by the national poverty line recommended by the
Tendulkar Committee. In 2011-12 the poverty headcount ratio (HCR) measured by this national
poverty line had declined to 21.9%, which is already less than half its 1990 level. The
Rangarajan Committee appointed to provide more accurate estimates of poverty assessed the
headcount ratio of poverty for 2011-12 as being much higher (29.5%) than the Tendulkar
Committee estimates. However, it found the rate of decline in poverty to be similar to that of the
Tendulkar Committee, suggesting that the MDG target is likely to be met by end 2015. The data
indicates that the rate of poverty reduction in India has accelerated since about 2004. According
to national estimates, using the Tendulkar poverty lines, while poverty declined on average by
0.74 percentage points between 1993-94 and 2004-05, the decrease sharply accelerated to 2.2
percentage points annually between 2004-05 and 2011-12. This sharp reduction is also reported
by the Rangarajan Committee according to which the reduction was by 2.4 percentage points.
The decline is sharper since 2009-10: as much as 4.4 percentage points annually (Rangarajan)
and 4.0 percentage points (Tendulkar). Even assuming the slower rate of decline on average
since 2004-05 continues in the future, the poverty HCR in the MDG terminal year (2014-15) will
be 22.3%, which is less than half of even the 2004-05 HCR assessed by the Rangarajan
Committee of 46.2%, implying that India will achieve the MDG of reducing poverty by half,

Assessing India’s Progress in Achieving the Millennium Development Goals
September 2015
9
when using the national poverty lines employed by the Rangarajan Committee also (India,
Planning Commission, 2014).
Figure 1: India’s progress on the MDGs
Source: UNESCAP (2015).
Note: The yellow portion of the indicator bars show progress made (in percentage) from 1990 till the latest year of
data available of the total distance to be covered. The extended red portion of the bar shows where the indicator
value is likely to be by end 2015 given current trends. If the portion of the bar shaded yellow has already crossed the
vertical line placed at the 100% mark it indicates that the target for this has already been achieved. If the total bar
length including the additional improvement likely till end 2015 crosses the vertical line then it indicates that that
indicator will reach the target by end 2015. If the extended bar does not reach the target, India is off track in that
indicator and the distance from the vertical line shows the extent of the gap that will remain.
Gender parity in primary, secondary and tertiary education (Goal 3). India has already
achieved the overall MDG target of eliminating gender disparity in primary education and is on
track to achieve parity in secondary and tertiary education as well. The Gender Parity Index
(GPI) rose from 0.76 in 1990-91 and crossed parity (1.01) in primary education in 2011-12 (an
increase of 33%); it increased from 0.60 to 0.93 (55%) in secondary education; and from 0.54 to
0.88 (63%) in higher education in the same period. The more rapid increase in parity in
secondary and tertiary education leads to the forecasted values exceeding parity by 2015.

South and South-West Asia Development Papers 1502
September 2015
10
Maternal mortality (Goal 5). The main indicator under this Goal is reduction of maternal
mortality. The target is to reduce maternal mortality ratio by three quarters from the 1990 level.
The latest (2011-13) estimate of the maternal mortality ratio (MMR) is 167 compared to 212 in
2007-09, a fall of 21%. India is likely to reach an MMR of 140 per 100,000 live births by end-
2015. A doubling of the rate of decline has been noticed in the recent years 2003-09 compared to
the 8% achieved in 2001-03. As the UN has revised its estimates of India’s MMR in 1990, the
new 2015 target is 140, and India is expected to reach this revised target (WHO, 2014). 3
HIV/AIDS, tuberculosis and malaria (Goal 6). The MDG indicators under this Goal
require a halt or reversal of these deadly diseases. Since 2005 India has reduced the prevalence,
i.e. the total number, of adult HIV cases and the proportion of adults (15-49 years) with HIV has
fallen between 2008 and 2011. The incidence of malaria was also on the decline in the period
2006-2014. Similarly, TB prevalence rate is seen to have declined over the period 2004-2010 for
which data has been released (India, Ministry of Statistics and Programme Implementation,
2014a).
Forest cover, area protected for bio-diversity; access to water (Goal 7). The main MDG
indicators under this Goal are to halt or reverse the loss of forest cover, and area protected for
biodiversity; expand access to clean water supply and improved sanitation; and reduce carbon
dioxide emissions and consumption of ozone depleting CFCs.
Forest cover as a percentage of the total geographical area in the country increased from
19.32% in 1997 to 21.23% in 2013 (India, Ministry of Statistics and Programme Implementation,
2015). India’s total protected area under biodiversity conservation has been growing also and it
now has a protected area network of national parks, wild life sanctuaries and conservation
reserves that covers about 4.8% of its total geographical area (ENVIS Centre on Wildlife and
Protected Areas, 2015).
India has already met and exceeded, the drinking water target of MDG 7 (which was that
85% of the population have access to improved water source while 88% have already obtained
such access) (India, Ministry of Statistics and Programme Implementation, 2015).
In addition, to the above indicators targets for which are either already achieved or will
be by 2015 end, India will miss only by a small margin (less than 5% of the target) the targets on
the following indicators:
3 As the WHO has revised its estimates of India’s MMR in 1990 to 560 maternal deaths per 100,000 live births, the
revised target for 2015 is 140 (Figure 1). India is expected to reach this revised higher target, but will likely fall
short of the lower nationally estimated target of 109 (India, Ministry of Statistics and Programme Implementation,
2015). This is because the MOSPI uses the 1990 estimate of 437 maternal deaths per 100,000 live births based on
the National Family Health Survey -1 (IIPS, 1995).

Assessing India’s Progress in Achieving the Millennium Development Goals
September 2015
11
Underweight children (Goal 1). This is the major hunger related target in Goal 1 and
requires reducing by half of the proportion of underweight children from the 1990 baseline.
Against a target of 26% by 2015, the proportion of underweight children in India stood at over
40% in 2005-06. However, recent preliminary data from the Ministry of Women and Child
Development shows that this proportion has declined significantly to 27% in 2014 (see Box 1).
This progress would leave India less than 4% short of achieving Goal 1’s hunger target (India,
Ministry of Women and Child Development, 2015).4
Apparent survival rate in primary schooling (Goal 2). This is measured by the
proportion of Grade V to Grade I students and is targeted to reach 100% by 2015. The latest
figure considered here for this indicator is 93% based on DISE 2013-14 data; and while it is
projected to remain the same by 2015 end it is already close to the cut-off of 95% set for this
target.
On the other hand, India will fail to reach targets leaving large gaps in projected
achievements in 2015 compared to targets in the following indicators:
Primary school enrolment (Goal 2). The target is to achieve 100% net enrolment rate
(NER) by 2015. Although previous data indicated otherwise, recent data suggests that India has
made slower progress in primary enrolment in recent years than was thought earlier, thus will be
missing the MDG target of universal enrolment by end 2015 by a wide margin. The NER at the
primary level (6-10 years) rose to only 88.1% in 2013-14 from 84.5% in 2005-06. Due to slow
progress, the target of universal primary enrolment by end-2015 is unlikely to be achieved and it
is estimated that India will achieve only an NER of 90.7% by end 2015.5 This finding is
consistent with data on out-of-school children, which indicates that a significant proportion of
children are still not in school. A recent study conducted by UNICEF and UNESCO Institute for
Statistics (UIS) (2014) showed, for example, that 10.8% of children between 6 to 10 years were
not in school in 2009-10.
4 The results of the current round of the National Family Health Survey-4 (NFHS-4) are expected to be released
soon. For Figure 1, therefore, the updated national figure based on the Rapid Survey on Children, 2013-14, has been
used for underweight children below 3 years of age. For the states, however, which are discussed later, data for
2005-06 based on NFHS-3 have been used as robust and comparable state-level data would only be available when
the NFHS-4 data are released.
5 India, Ministry of Statistics and Programme Implementation (2014a) reported, based on DISE Flash Statistics
2011-12, that the All States NER at primary level reached 99.89% in 2011-12. However, the DISE Flash Statistics
for 2012-13 and 2013-14 indicate that the NER fell to 90.8 and 88.1 respectively. The Figure on NER is based on
the 2005-06 and 2013-14 DISE Flash Statistics as end points. The sharp drop in the NER in the last two years could
be attributed partly to the use of population projections based on the 2001 Census which may have underestimated
the population of primary school age children. Given that this was a possible cause of the overestimates of the NER
particularly for 2010-11 and data for years near to this year, projections made for 2015 in this paper have omitted
some of these years to get a more reliable estimate.

South and South-West Asia Development Papers 1502
September 2015
12
Youth literacy rate (Goal 2). The target is to achieve universal youth (15-24 years)
literacy by 2015. The latest value recorded (in 2011) is 86% which is projected to increase to
88.9% only by 2015.
Participation of women in non-agricultural wage employment (Goal 3). This is an
important proxy for women’s empowerment. No target has been specified for this indicator in
the MDGs. But to make an assessment, a notional target of 50% can be considered, assuming
parity with men by 2015. However, compared to this, India only reached 19.3% in 2011-12
(India, Ministry of Statistics and Programme Implementation, 2015) and is projected to rise only
to 19.4% by end 2015, which is far below this notional target.
Child (under 5) mortality rate (Goal 4). India has made substantial progress in reducing
the child mortality rate from 125 per 1000 live births to 49 in 2013. Yet this is far short of the
target of reducing child mortality by two-thirds which requires the mortality rate to be cut to 42
by 2015 while projections indicate that a reduction to only 48 will be achieved which is still
quite wide of the target.
Infant mortality rate (Goal 4). India is making even slower progress in reducing infant
mortality with the current rate at 40 per 1000 live births being only half of the 1990 baseline
figure of 80 in 2013 whereas the MDG target requires a two-thirds reduction to 27 by 2015.
Projections indicate that at best a reduction to 37 only is likely to be achieved, which is further
off-track than in case of child mortality.
Measles immunization (Goal 4). On immunizations of children too, India has made only
slow progress. While in 1990 the proportion of one-year olds vaccinated against measles was
only 42%, the latest assessment made in 2009 indicates that this figure had improved to 74%
only. As the MDG target is universal immunization, and the projection of the proportion of
vaccinations by end-2015 is only likely to reach 80%, India will be severely underperforming on
this child health indicator too.
Proportion of births attended by skilled health professionals (Goal 5). This MDG
indicator provides an indication of the skilled health resources available to assist deliveries in
India. While all births should be so assisted, in 2009 only 76.2% of such births were and
projections do not indicate any progress till 2015 either.6
Access to sanitation (Goal 7). The target is to reduce by half the proportion of households
without improved sanitation compared to 1990. The 1990 baseline is estimated at 72.9% of
households without access, and cutting this by half sets a target of 36.45%. The latest data
6 See India, Ministry of Statistics and Programme Implementation (2015) for the latest estimate. Projections made
using the methodology presented earlier suggest that the figure will in fact fall to 74.6% by 2015.

Assessing India’s Progress in Achieving the Millennium Development Goals
September 2015
13
(2011-12) indicates that 45.4% still do not have access (India, Ministry of Statistics and
Programme Implementation, 2015), but projections suggest that this figure will fall to 39.3% by
end 2015. Thus a significant gap of nearly 8% of the target will still remain.
It may be noted that as far as greenhouse gas emissions are concerned, it is difficult to
categorize India’s performance. India’s performance can be considered satisfactory, if the
carbon intensity of GDP is used as an indicator; but not if CO2 emissions per head is considered.
India’s CO2 intensity has fallen from 0.59 kg of CO2 per $PPP in 1995 to 0.33 kg by 2012 (Hirst
and others, 2012). On the other hand, India’s per capita CO2 emissions increased from 0.8 tonnes
in 1990 to 1.7 tonnes in 2010 (World Bank, 2014b).
An overall assessment of progress Goal-wise can be summarized therefore as follows:
Goal 1: On-track, since the poverty target has been achieved and the hunger target likely
to be achieved just after 2015
Goal 2: Off-track, as all three indicators are off track and two of three likely to lie
substantially below target
Goal 3: Mixed performance, as while India has done well on the education gender parity
indicators which are either achieved or likely to be achieved; it has made slow
progress on the proxy gender economic empowerment measure of participation of
women in non-agricultural wage employment.
Goal 4. Off-track as the child health indicators are all unlikely to be achieved.
Goal 5. On track as the target on the main outcome indicator of maternal mortality will be
reached.
Goal 6. On track as it has had success in controlling all three deadly diseases (HIV/AIDS,
malaria and TB) being tracked.
Goal 7. Mixed performance as India has achieved the targets on forest cover, area
protected for biodiversity, and access to clean water. However, it is failing to
achieve the sanitation target, and it is difficult to categorize India’s progress on the
greenhouse gas emissions.

South and South-West Asia Development Papers 1502
September 2015
14
Box 1: Recent data on nutritional status of children in India
With respect to the MDG target on hunger (MDG 1.C), the Government of India was monitoring
till recently, the indicator on ‘prevalence of underweight children below 3 years of age’, instead
of the official MDG indicator pertaining to children less than 5 years of age, given the
comparative data availability in the national context (India, Ministry of Statistics and Programme
Implementation, 2015). The National Family Health Survey (NFHS) collected data on
underweight children between 0-35 months and 0-47 months of age in 1992-93 (NFHS-1),
between 0-35 months in 1998-99 (NFHS-2) and between 0-35 months as well as 0-59 months in
2005-06 (NFHS-3), making the results comparable only for children belonging to the age group
0-35 months in India (less than 3 years of age). However, preliminary results from the recent
survey based on the Rapid Survey on Children, 2013-14,conducted by the government, with
support from UNICEF, reports data on prevalence of underweight children below 5 years of age,
in line with the WHO recommended growth standards (India, Ministry of Women and Child
Development, 2015).
According to this recent data, 29.4% of children under 5 years of age were underweight in India
in 2014 compared to about 43% in 2005-06, suggesting a decline of 32% over a span of 8 years.
During 2013-14, the proportion of underweight children (less than 5 years of age) ranged from
14.1% in Manipur to 42.1 in Jharkhand. Mizoram had 14.8% of underweight children below 5
years, followed by Jammu and Kashmir (15.6%), Sikkim (15.8%), Punjab (16.1%), Goa
(16.2%), Kerala (18.5%) and Delhi (19.4%). States like Jharkhand (42.1%), Bihar (37.1%),
Madhya Pradesh (36.1%), Uttar Pradesh (34.5%) and Odisha (34.4%) were among the states
with highest underweight prevalence among children under age 5. While there seems to have
been a significant decline in prevalence of underweight children below 5 years of age, both at the
all India level and among states, between 2005-06 (NFHS-3) and 2013-14 (Preliminary results of
the Rapid Survey on Children), conclusive analysis would be possible once final data become
available. Comprehensive state-level analysis on underweight children below 5 years of age
could become possible when results from the NFHS-4 (currently underway) get released,
ensuring availability of comparable data over a longer time frame.
Source: UNESCAP based on national sources.
India’s successes on the MDG Goals 1, 5 and 6 owe much to an intensification of poverty
reduction and social development efforts in the 2000s. These were possible both due to the better
economic growth India has enjoyed since 2000 which enabled greater allocations towards public
social inclusion efforts as well as specific inclusive anti-poverty and social development
programs it introduced towards that end. Programs such as the Mahatma Gandhi National Rural
Employment Guarantee Act (MNREGA) (which assisted in lowering poverty); the
intensification of the Integrated Child Development Services (ICDS) Scheme (which helped in

Assessing India’s Progress in Achieving the Millennium Development Goals
September 2015
15
reducing child malnutrition); and the adoption of the National Rural Health Mission (NRHM)
(which assisted in reducing maternal mortality), all have played a role. While there are
innumerable evaluation studies both by the erstwhile Planning Commission as well as
independent agencies which indicate that implementation performance on these programs could
have been better (see India, Planning Commission , 2011a and 2011b), that these did play an
important role in India’s eventual performance, even with their failings, is perhaps not in doubt.
On the other hand, failures also stand out starkly. The most disappointing are the failures
to reach the primary education (Goal 2) and the child health (Goal 4) targets, which deny
millions of children their rights to education and enjoyment of good health. These in turn lower
the productivity of future workers and threaten India’s growth. The earlier national programs
supporting them such as the Sarva Siksha Abhiyaan, the Integrated Child Development Services
(ICDS) scheme, and child components in the National Health Mission (NHM) clearly did not
perform well enough and will therefore need to be substantially revamped. On gender (Goal 3)
India has a long way still to go and although gender parity in education is being achieved, it is
only an initial step in a giant battle to change social attitudes and mores necessary to bring in
genuine equality and empowerment of women. Finally, the major failure as far as Goal 7 is
concerned is on sanitation, which too involves changes in attitudes of communities and
households as much as physical construction of toilets, which the new Swachh Bharat Abhiyan
campaign must address.
3. Performance of States on the MDGs
The aggregate national performance presented above is not the result of the Central
Government’s efforts alone but that of the Centre along with the states, which have joint
responsibility in achieving the MDGs. The performance of individual states is summarized in
Figure 2. The figure uses the ‘traffic light’ approach, pioneered by Asia-Pacific MDG Reports
issued by UNESCAP, ADB and UNDP,7 categorizing performance of each indicator in each
state under four categories enumerated previously: the best (the state is an ‘early achiever’ on the
indicator having reached the target already) is shown with blue dots; satisfactory performance
(the state is ‘on track’ on the indicator and will achieve the target by 2015) is shown with a blue
arrow pointing forward; unsatisfactory performance (progress is too slow to reach the target) is
shown with brown squares; and highly unsatisfactory performance (the state is regressing on the
indicator or making no progress) is shown by a red arrow pointing backward.
In making the categorization, the method adopted for the indicators at the all-India level
is replicated for each individual state, including the forecasting to 2015 and the back-casting to
7 See the latest in the series UNESCAP, ADB and UNDP (2015).

South and South-West Asia Development Papers 1502
September 2015
16
1990 where necessary to set up a baseline. However, data for this exercise is available for only
nineteen crucial indicators which are presented in Figure 2.
Figure 2: Current state-wise progress on selected MDG indicators
Source: Authors’ estimates based on national sources.
Note: Maternal mortality ratio (MMR) for India based on the revised baseline estimates
from the WHO (2014). MMR values combined for Bihar/Jharkhand, Uttar
Pradesh/Uttarakhand and Madhya Pradesh/Chattisgarh.
The performance of the states on these selected indicators has been on the whole in line
with the all-India picture. Mirroring the overall all-India picture, most states are either early
achievers or on track to achieve the MDG targets of reducing extreme poverty and gender
imbalance in primary, secondary and tertiary school enrolment; combating HIV/AIDS, TB and

Assessing India’s Progress in Achieving the Millennium Development Goals
September 2015
17
malaria; improving forest cover and improving access to clean water. In the case of access to
improved sanitation, while the majority of small states are either early achievers or on track;
India as a whole is off-track as a result of the poor performance of almost all the larger states.
Similar to the national picture most states are off-track on child hunger reduction,8 universal
primary school enrolment; and child health. On maternal mortality aggregative data indicates
that India is likely to achieve the target using the revised UN target value. The state data is
scant: projections are available only for 15 states which are shown as mostly missing the target.
The 4-way categorization of performance on each of the indicators in Figure 2 allows
only a comparison across states per indicator but does not, however, enable a good comparison
between the states on their overall progress on the MDGs given the large number of indicators
involved. A non-rigorous rudimentary assessment can be made, however, by looking at the
proportion of indicators that each state is “on track” in. Both the central Indian states of Madhya
Pradesh and Chhattisgarh have a large proportion of indicators they are “off-track” in. This is
also true of the eastern Indian states of Bihar, Jharkhand and Odisha. Only West Bengal is the
exception in this group. The states shown in the north India category generally show better
performance, except for Uttar Pradesh and Rajasthan. The north-eastern states are all shown as
performing poorly except for Sikkim and to a lesser extent Tripura and Manipur. In the western
India group, Goa stands out as an excellent performer with 16 of 18 indicators “on–track” while
the other two are average performers. In the south India group, Kerala and Tamil Nadu stand out
but the others are average performers.
It should be noted, however, that this categorization is based on performance towards
MDG indicator targets many of which differ between states as many MDG indicators have
targets as a proportion of their baseline scores (such as halving poverty incidence or reducing
maternal mortality rate by three quarters from the 1990 level). This manner of rating progress –
intended primarily by the UN for international comparison between countries but can be equally
applied at the sub-national levels – is based on the principle that improvement efforts should be
proportionate to initial levels which vary between countries or states to be fair to all. States
which had already achieved higher baseline values to begin with, however, are given a stiffer
task to achieve their targets and in some cases may not be able to reach them. They may
therefore be categorized as having underperformed although already having achieved high
absolute scores compared to others that have lower absolute scores but are categorized as “on-
track.”
To rectify this problem a comparison using absolute levels of attainment is therefore also
necessary. Also, since the MDGs involve several indicators, making rigorous comparisons
8 Although recently released national data for 2013-14 on child hunger suggests marked progress and on the basis of
this updated data India is likely to reach the target on underweight children just after 2015. State level performance
on reducing underweight children in this table reflects state level data which are available only till 2005-06.

South and South-West Asia Development Papers 1502
September 2015
18
between the states is difficult unless composite indices are developed. To address these two
issues, composite indicators using absolute indicator values attained can be used. Such composite
indicators can be prepared both to (i) compare the final attainments of the states on the MDGs at
the latest date for which data is available; as well as (ii) compare their initial performance. Both
(i) and (ii) taken together provide a better picture of performance and progress than either alone
as it is interesting to see both where the states have finally reached relative to each other as well
as gauge the relative improvements made by the states. For both (i) and (ii) therefore, we begin
by constructing such indexes.
For preparing such performance indexes both for the final and the initial years, we adapt
the method used by Hailu and Tsukada (2012). A composite index is built for each state by
aggregating each state’s performance across the indicators and the goals, assessing each indicator
on the progress made. Construction of this index involves a three step process.
First, performance on each individual indicator in the final year (and later the exercise
repeated for the baseline year) is given a score which shows how far states differ in their
achievement of the MDG indicator. The score index (Sindicator) is given by:
Sindicator = 1 – ((max – I)/( max- min))
Where “max” is the maximum value of a given indicator across all states in the sample
set; “min” is the minimum value of that indicator in the set of states, and ‘I’ is the actual
achievement of an individual state on that indicator. A score of zero implies that a state’s
indicator is at the minimum level of achievement in the sample; while a score of one indicates
that the state’s indicator is at the maximum level achieved in the sample.
Next, a Goal score is arrived at for each Goal by averaging across the indicator scores
under that Goal. If a Goal has several outcomes some with several indicators (e.g. the outcome of
controlling HIV/AIDS under Goal 6 has three indicators) then these are averaged into a single
sub-goal outcome score first so as to provide equal weight to all intended sub-outcomes within
the Goal. Finally averaging all the seven Goal scores is done to arrive at the composite index.9
The comparative picture from this for the latest year is presented in Figure 3.
9 As more data is available for the final year than for the baseline year, it was possible to include 25 indicators for
preparing this composite index compared to only 19 for which the traffic light categorization (which requires data
availability in both baseline and latest years) was possible. This therefore provides a more accurate estimate of the
final achievements.

Assessing India’s Progress in Achieving the Millennium Development Goals
September 2015
19
Figure 3: Ranking of states by MDG Composite Performance Index latest year
Source: Authors’ estimates based on official data
Among the larger states, Kerala and Tamil Nadu top the list followed by Maharashtra,
Andhra Pradesh and Punjab. When all states are included, Goa tops in performance, and the
smaller states of Sikkim, Delhi and Tripura are also among the better performers. The five large
states that are seen to be doing least well are Bihar, Jharkhand, Uttar Pradesh, Madhya Pradesh
and Assam. Other large states below the mean score of 0.51 are Chhattisgarh, Rajasthan and
Odisha. It is in these states together with the other lagging performers (namely the North-eastern
states of Nagaland and Arunachal Pradesh) that comprise the ten states falling below the mean
score where most attention will need to be focused.
It may be interesting to observe also the rankings of the states for each of the Goals
separately. This is summarized in Table 1. The states are also categorized roughly into those in
the top third (ranks 1-10 shown in green), the middle third (ranks 11-19 shown in white); and the
bottom third (ranks 20-29 shown in red) in each of the Goals.
As expected, those states that are in the top 10 positions (or the top third in the rankings),
also have more individual Goals in the top third rankings. Thus Goa, which has the top
composite rank, has all its individual Goal rankings within the top third of all the states.
Similarly, Kerala and Tamil Nadu have also performed comparatively well on most Goals except
that both have performed poorly on the environment Goal 7. Bihar on the other hand, which lags
all states in the composite rankings, has all but one Goal in the bottom third rankings. This is
true also of Uttar Pradesh and Jharkhand, for example, which also are at the bottom of the
composite rankings. Similarly, the poorly performing North-eastern states of Arunachal Pradesh,
0.813 0.790
0.736 0.719 0.694
0.659 0.658 0.650 0.627 0.626 0.616 0.609 0.603 0.592 0.585 0.584 0.577 0.565
0.530 0.506
0.466 0.464 0.452 0.451 0.426
0.398 0.396
0.342 0.313
0.0
0.1
0.2
0.3
0.4
0.5
0.6
0.7
0.8
0.9
Go
a
Ker
ala
Tam
il N
adu
Sikk
im
Del
hi
Trip
ura
Mah
aras
htr
a
Him
ach
al P
rad
esh
An
dh
ra P
rad
esh
Pu
nja
b
Man
ipu
r
Kar
nat
aka
Jam
mu
& K
ash
mir
Miz
ora
m
Gu
jara
t
Wes
t B
en
gal
Har
yan
a
Utt
arak
han
d
Meg
hal
aya
Nag
alan
d
Ch
hat
tisg
arh
Raj
asth
an
Od
ish
a
Ass
am
Mad
hya
Pra
des
h
Utt
ar P
rad
esh
Aru
nac
hal
Pra
des
h
Jhar
khan
d
Bih
ar

South and South-West Asia Development Papers 1502
September 2015
20
Assam and Nagaland have most Goals in the bottom third of the rankings. Interestingly, all the
North-eastern states (except Manipur) and the hill states of Himachal Pradesh and Uttarakhand
have performed well relatively on the environment Goal 7.
As discussed earlier, it is also interesting to try and gauge the extent to which states have
improved comparative to other states or fared worse compared to the baseline year. This will
provide an idea of relative improvements made by states in the period between the original and
final situations. To make this comparison, we prepare in a similar fashion as before the MDG
Table 1. State ranks on MDG Composite Index for each Goal, (Latest Year)
States MDG1 MDG2 MDG3 MDG4 MDG5 MDG6 MDG7 Composite
Andhra Pradesh 14 16 10 11 2 24 19 9
Arunachal Pradesh 25 29 28 29 23 18 4 27
Assam 24 22 14 25 21 19 10 24
Bihar 26 28 29 24 28 8 28 29
Chhattisgarh 27 14 8 21 22 23 16 21
Delhi 6 5 15 5 9 7 13 5
Goa 2 4 6 1 1 4 7 1
Gujarat 19 10 26 14 7 11 14 15
Haryana 13 9 12 16 18 10 21 17
Himachal Pradesh 9 2 13 9 24 2 8 8
Jammu & Kashmir 5 25 18 13 6 1 23 13
Jharkhand 28 26 27 19 27 21 29 28
Karnataka 18 12 16 8 5 27 20 12
Kerala 3 1 3 2 4 6 22 2
Madhya Pradesh 29 18 25 27 16 16 17 25
Maharashtra 15 8 17 4 8 20 11 7
Manipur 21 23 1 10 10 25 12 11
Meghalaya 17 24 2 23 19 28 9 19
Mizoram 7 21 9 15 12 29 1 14
Nagaland 11 13 24 20 29 15 3 20
Odisha 23 15 20 26 13 26 26 23
Punjab 4 11 21 6 17 5 18 10
Rajasthan 16 27 19 22 20 14 25 22
Sikkim 1 6 7 7 14 13 6 4
Tamil Nadu 8 3 4 3 3 17 24 3
Tripura 12 7 5 18 11 22 5 6
Uttar Pradesh 22 20 22 28 26 3 27 26
Uttarakhand 10 17 23 17 25 12 2 18
West Bengal 20 19 11 12 15 9 15 16
Source: Authors' estimates from official data
Legend Top rankers (1-10) Middle rankers (11-19) Bottom rankers (20-29)

Assessing India’s Progress in Achieving the Millennium Development Goals
September 2015
21
composite performance index for the baseline year.10
Next we plot the composite indices for the
baseline and final years in a scatter diagram which is shown in Figure 4. The states further to the
right on the horizontal axis were doing better in the baseline year than those to the left. Similarly
the vertical axis measures the final performance given by the composite performance index for
the final year. A regression line is fitted which provides a locus of reference to show where the
predicted value of a state in the final year is given the initial value. A vertical value higher than
the regression line would indicate that the state has improved more than expected; a value below
would indicate that it has regressed compared to where its position was predicted to be by the
regression line.
Figure 4: MDG Composite Performance Indexes of states baseline and latest years
Source: Authors’ estimates
10
As data was scantier in the baseline years for Goals 4 and 7, the number of indicators for which the composite
index was prepared in the baseline year was 22.
Andhra Pradesh
Arunachal Pradesh
Assam
Bihar
Chhattisgarh
Delhi
Goa
Gujarat
Haryana
Himachal Pradesh
Jammu & Kashmir
Jharkhand
Karnataka
Kerala
Madhya Pradesh
Maharashtra
Manipur
Meghalaya
Mizoram
Nagaland
Odisha
Punjab
Rajasthan
Sikkim
Tamil Nadu
Tripura
Uttar Pradesh
Uttarakhand
West Bengal
y = 0.82x + 0.15
R² = 0.85
0.2
0.3
0.4
0.5
0.6
0.7
0.8
0.9
0.2 0.3 0.4 0.5 0.6 0.7 0.8
MD
G C
om
posi
te P
erfo
rmn
ace
In
dex
(la
test
yea
r)
MDG Composite Performance Index (baseline year)

South and South-West Asia Development Papers 1502
September 2015
22
Figure 5: Change in states' ranks in MDG performance using MDG Composite Indexes, latest year compared to baseline year
Source: Authors’ estimates
Generally, states that are located above the regression line have, as expected, also
improved their rankings as compared to their original rankings in the baseline year. The change
in rankings between the initial and final years is shown in Figure 5. The state that has improved
its ranking the most is Tripura, by 9 ranks. Andhra Pradesh and Jammu and Kashmir have
improved by 5 ranks; and Gujarat and West Bengal by 4 ranks. Sikkim which was already high
in the initial standing has improved further by 3 positions. Some relatively lagging states finding
positions above the line have also improved their positions such as Rajasthan and Odisha by 3
positions while Uttar Pradesh has also improved by one position.
-15 -10 -5 0 5 10
Tripura
Andhra Pradesh
Jammu & Kashmir
Gujarat
West Bengal
Odisha
Rajasthan
Sikkim
Chhattisgarh
Tamil Nadu
Goa
Himachal Pradesh
Maharashtra
Manipur
Uttar Pradesh
Bihar
Jharkhand
Delhi
Haryana
Karnataka
Kerala
Madhya Pradesh
Uttarakhand
Assam
Punjab
Arunachal Pradesh
Meghalaya
Nagaland
Mizoram

Assessing India’s Progress in Achieving the Millennium Development Goals
September 2015
23
On the other hand, states falling below the line have generally performed poorly in
comparison to the other states. Those that have fallen behind significantly in the rankings are
Mizoram (falling by 11 positions), Nagaland (falling 9 positions), Meghalaya and Arunachal
Pradesh (by 6 positions) and Punjab (by 4 positions). The historically poor performers of
Jharkhand and Bihar remain below the regression line and at the bottom of the state rankings in
the final year too, not having changed their rankings.
It may be of interest to look more closely at the cases of Andhra Pradesh and Punjab –
both large states, the former having improved its overall rank by 5 positions, while the latter has
fallen by 4 positions – to see what may have caused such a discrepancy in relative improvement.
Andhra Pradesh did much better than Punjab in reducing poverty between the baseline and final
years (cutting incidence of poverty by 81.5% compared to Punjab’s 63.8%). It improved adult
literacy rate by 17.6% as compared to Punjab’s improvement of 8.2%. Its improvement in gender
parity in literacy was far higher (16.5% compared to 3.2% for Punjab). Punjab did particularly
poorly in gender parity in all levels of education, bucking the national trend by regressing in all
three levels of education while Andhra Pradesh made significant improvements particularly in
secondary and tertiary levels. Other notable areas where Andhra Pradesh’s improvement was far
better than Punjab’s are child immunization against measles (68.3% improvement compared to
34.7% for Punjab); and attendance by skilled personnel at birth (95.5% to Punjab’s 41.0%). The
fall in Punjab’s ranking was not because it did not improve, but that it improved much less than
some other states and thus fell behind from its original rank of 6th
to the latest ranking of 10th
.
This brings us to an important observation that needs to be highlighted: all states did
generally make significant improvements in the absolute scores of the MDG indicators from the
baseline year. The discussion above had focused more on changes in inter-se rankings of states
and did not therefore highlight this aspect. While some states did better in making more rapid
improvements than others, all did generally improve on their absolute levels of achievement.
This is best illustrated by looking at what is considered the most poorly performing state
on the MDGs – Bihar. The state ranked at the bottom in the baseline year as well as in the latest
standings. This does not mean however that it has not made improvements – only that other
states have improved more.
Figure 6 illustrates this point. It shows the earliest and latest indicator values for selected
MDG indicators for both India as a whole and for Bihar. Starting at much below the average
India values of most of these indicators, Bihar has shown considerable improvement. The
proportion of population out of poverty has for example risen from 37.7% to 66.3% between
1990 and 2011. In case of primary student survival rate, Bihar has matched the all India value
starting at about half the initial level of India’s on this indicator. In case of access to drinking
water it has exceeded India’s figure. In case of skilled birth attendance and access to sanitation

South and South-West Asia Development Papers 1502
September 2015
24
Bihar has more than doubled its achievement score between 1997-98 and 2009 in the former case
and between 1992-93 and 2010-11 in the latter case. Youth literacy has increased by a third
between 2001 and 2011; while the proportion children immunized against measles more than
tripled between 1997-98 and 2009.
Figure 6: Selected MDG indicator values for India and Bihar, earliest and latest years
Source: Authors based on India, MOSPI (various years).
4. Key drivers of the MDGs Achievement
While factors specific to each of the MDGs are important for achievement of the targets,
there are several key ‘drivers’ that affect the performance of all the MDGs. Some of these cross-
cutting generic factors were not explicitly factored into the MDG goals and indicator structure
but their roles are now being recognized as crucial to the success of the MDGs. In what follows,
five of these key drivers that influence performance and attainment of MDGs are discussed.
These are broad-based and employment-creating economic growth; adequate allocation of
resources towards the social sectors and basic services; strong design and effective
implementation of MDG related programmes; creating basic infrastructure for better access and
delivery of MDG related services; and women’s empowerment.
52.2
63.2
76.0
50.7 42.4
71.5
27.1
78.1
93
86.1
74.1 76.2
87.8
54.6 37.7
33.7
57.0 16.2 24.8 67.6
15.2
66.3 92
72.3
58.2 53.2
97.8
31.7
Population above poverty (%)
Primary survival Grade V:I (%)
Youth literacy rate (%)
Measles immunization rate (%)Skilled Birth attendance (%)
Water access (%)
Sanitation access (%)
India Earliest India Latest Bihar earliest Bihar latest

Assessing India’s Progress in Achieving the Millennium Development Goals
September 2015
25
i) Broad-based and employment-creating economic growth
Rapid economic growth, particularly if it is broad based, i.e. widely participated in by all
segments of the population, generates employment and improves the livelihood of the poor, is
essential for the achievement of all the MDGs. Its importance in the Indian context is
demonstrated by the fact that the index of MDG performance (for the latest year) by states
prepared for this paper is closely associated with their per capita growth rates.11
The positive
relationship between per capita National State Domestic Product (NSDP) and MDG performance
for the latest year is shown in the scatter diagram in Figure 7.
Figure 7: Regression of growth on MDG Performance Index (Latest Year) of Indian states
Source: Authors’ calculations based on data from RBI (2013) and national sources.
Note: Data on average annual growth rates of per capita NSDP at constant prices, 1993-94 to 2012-13.
Rapid growth can favourably impact on the MDGs in many ways. It can act indirectly to
help MDG achievement by potentially improving resources with Governments at the Centre and
the states, if such resources can be well garnered by effective taxation, and if such resources can
be spent wisely on remedying gaps in basic services such as education, health, water and
sanitation. In India, growth over the MDG period has helped bolster revenues with the Central
Government, for example, and despite Central Government revenues remaining around 10% of
GDP in this period (considered low compared to developing countries in Asia-Pacific and other
regions), the rapid growth that occurred particularly after mid-2000s, helped increase revenues
11
The MDG performance index (latest year) measures the final attainments of the states on the MDGs at the latest
date. A strong positive correlation of 0.54, significant at the 1% level was found with this index and the states’ per
capita GDPs. The regression also shows a close fit with significant regression coefficient.
AP
BR
CG
GA
GJ HR
JH
KA
KL
MP
MH
OR
PB
RJ
TN
UP
WB
AR
AS
HP
JK MN
ML NL
SK
TR
UK
y = 0.046x + 0.34 R² = 0.29
0.0
0.1
0.2
0.3
0.4
0.5
0.6
0.7
0.8
0.9
0.0 2.0 4.0 6.0 8.0 10.0
MD
G P
erf
orm
ance
Ind
ex
Per Capita NSDP Average Growth Rate

South and South-West Asia Development Papers 1502
September 2015
26
substantially on a per capita basis. Growth is considered a ‘necessary’ - although not a
‘sufficient’ condition - for assisting MDG achievement, as without growth, taking effective
public action in support of MDG achievement would not be possible.
Growth can impact more directly on reducing poverty if it generates large scale
employment of poor households or adds substantially to incomes from their existing work. The
latter is what is likely to have happened in India in the period 2004 to 2011, when faster growth
led to an acceleration in poverty reduction. The poverty headcount measure - given both by the
national poverty line as well as the international $1.25 (PPP) a day measure – declined sharply
(from 45.3% to 21.9% between 1993 to 2011-12 by national estimates and from 41.6% to 32.7%
in the shorter 2004-05 to 2009-10 period by international estimates). This was partly attributable
to a sharp increase in growth, which exceeded 8.0% on average in the period 2004-2011
compared to just 5.7% on average in the earlier period 1999-2003. Faster growth appears to have
had a two - fold impact on poverty. First, there is likely to have been an increase in incomes of
poor households in agriculture, as a result of agricultural growth of 3.5% on average for the
period 2004-05 to 2011-12 as well as due to the impact of the MGNREGA rural employment
generation scheme (the outlays for which were made possible by enlarged revenues due to
growth) and which provided jobs to a large number of poor households at minimum wages
(about 50 million households are estimated to have benefited in 2011-12) (see India, Ministry of
Rural Development, 2012) as well as bolstered real wages in the rural sector in general.
Secondly, although overall employment generation was weak due to a drop of 20 million in the
number of women employed during 2004-05 to 2011-12 (World Bank, 2014a), a sharp increase
in employment in the construction sector and some increase in the services sector occurred,
absorbing surplus male labour from agriculture in better paying jobs. However, if growth had
generated greater overall employment for women too, the reduction in poverty is likely to have
been even sharper.
The relationship between economic growth and poverty reduction has been well
documented not only in India but across the world and generally a strong association has been
found between growth and the reduction in the poverty head count measure (beginning with
Dollar and Kray, 1991). The growth elasticity of poverty given by the national estimates (i.e. the
percentage reduction brought about in the head count ratio by a one percentage increase in GDP
per capita) was about a 0.8 in the period 2004-05 to 2011-12. This favourable impact of growth
is likely to have been greater and the incidence of poverty fallen even more sharply had not
inequality increased in this period as well, rendering growth less broad-based across income
classes (Kapoor, 2013).12
12
For evidence on impact of inequality on growth-poverty reduction rates in a cross country context, see
UNESCAP (2010).

Assessing India’s Progress in Achieving the Millennium Development Goals
September 2015
27
Factors that have reduced the impact of growth as an instrument for poverty reduction
also include the structural transformation of the Indian economy from agriculture to the services
sector, bypassing industry. As a result, while the share of agriculture has come down in GDP to
about 15 percent, it continues to sustain nearly half of the workforce. The service-oriented
structural transformation has given to the country good growth but has not been able to generate
enough jobs to move workers from low productivity work in agriculture to more productive jobs
(see UNESCAP, 2012 and Aggarwal and Kumar, 2012). For example, in the period 2004-05 to
2011-12 while India experienced fairly rapid GDP growth of 8.5% on average per annum, the
growth of employment overall was only 0.4% per annum on average. This was mainly due to
insufficient job creation in the industry and services sectors, and due to the decline female labour
force participation between 2004-05 and 2011-12 in rural areas.
In this context, the new Government’s emphasis on development of the manufacturing
sector to create jobs is both appropriate and timely. There are opportunities to leverage the large
domestic market demand that has developed over the years, as reflected in sizeable imports of
many manufactured goods and to build industrial capacities that can help generate millions of
better jobs; while accelerating growth and improving the balance of payments (Kumar, 2013).
Despite poor job creation, growth still has had a large impact on poverty. Findings also
suggest that the impact of growth on the other MDGs is also favourable, although each percent
of economic growth has a smaller but still important positive impact, or the elasticity for the non-
poverty MDG indicators such as for health, nutrition and education indicators is lower.13
This is
because the MDG indicators other than poverty depend more heavily on the availability of public
services and on public action – such as on construction and staffing of schools and health
centres, providing nutritional support to mothers and children, etc. – which are not
automatically brought about by growth but have to be provided by mainly the government, out of
the augmented revenues that growth makes possible.
ii) Prioritization of resources for human development
The manner in which Governments at both the Centre and in the states use their
augmented revenues brought about by growth is critical for achieving the MDGs. Developing
countries have many needs but the need to invest in human development – such as education,
health, livelihood promotion and other basic services, which the MDGs represent – must be at
the top of the development agenda. This is both because of the obvious intrinsic benefits that
good education and good health, for example, provide to individual wellbeing, as also the
13
For evidence relating to developing Asia-Pacific for all MDGs, see UNESCAP, ADB and UNDP (2008), which
found in a cross section study of Asian developing countries, evidence of growth impacting favourably on the MDG
indicators but at lower elasticities for the non-income MDGs compared to poverty. Several studies exist on the
importance of growth for individual non-income MDGs in the Indian context. An example of the relationship
between growth and child mortality for India, for example, can be seen from Bhalotra (2006), which found a growth
elasticity of under-5 child mortality reduction of 0.7.

South and South-West Asia Development Papers 1502
September 2015
28
importance of improving the productivity of human resources for the future growth and
development of countries.
However, India has not been spending enough on human development, resulting in
generally poorer outcomes in such areas as health, nutrition, quality of education (including
skills development), and sanitation and hygiene, compared to developing Asia as a whole and
particularly East Asia, which has surged far ahead. In health, for example, where India is
particularly underperforming, it spends 4% of its GDP (in 2013), compared to 6 % to 12% in
upper middle and high income countries, respectively. Only a third of India’s health spending
comes from public funds (1.3% of GDP) and the gap is funded by households, out of their
pockets. It has been estimated that 6.2% of households in India fall below the poverty line, due to
health spending that they cannot afford (Mahal and others, 2010). In education too, India’s
performance is less than satisfactory, with public expenditure on education at 3.8% of GDP
against the UNESCO norm of 6% of GDP.14
Apart from insufficient spending overall, there is wide variation among states in the
investment made on human development. Many poorer states have much lower per capita
investment expenditure on human development than the prosperous states, owing to insufficient
revenue collection and inadequate devolutions from the Centre to cover their funding gaps.15
Those that have invested adequately have reaped benefits. In health, the number of persons in the
state served by a government hospital bed serves as a proxy for public resources devoted to
developing physical health infrastructure. As can be seen from Figure 8, the greater the scarcity
of hospital beds – which implies also the poorer the resources devoted to building up health
infrastructure - the lower the overall health outcome. Similarly, in education, there has been
wide disparity in resources provided by the states over the years with consequential variation in
education outcomes. There is a strong positive correlation, for instance, between literacy levels
in states and their current public spending on primary schooling.16
Not surprisingly, Kerala
which leads among the states in education outcome indicators, such as primary enrolment rate,
reduction in dropout rates, youth literacy levels and ASER competency tests in primary
schooling, has the highest per capita expenditure on primary schooling among all the larger
states and the figure is 3.5 times the all-state average.
14
India’s public spending on education was 3.8% of GDP in 2012 according to the UNESCO Institute of Statistics
(http://data.uis.unesco.org/?queryid=181).The international norm of 6% of GDP was suggested in the Oslo
Declaration in December 2008 (http://www.unesco.org/education/Oslo_Declaration_final_17dec08.pdf).
15
Devolutions from the Finance and Planning Commissions, are based on 1971 population and therefore, don’t
reflect state differences in population growth. States with low population growth will benefit more than states with
high population growth rates since 1971. States like Bihar, UP, and Rajasthan which have not been able to control
population growth suffer a great deal when compared with Kerala and Tamil Nadu. For instance, Kerala’s share in
India’s population is now 2.8%, but for the purpose of central devolution of funds the share is calculated at 4%,
which was the position in 1971.
16
The correlation coefficient is 0.52 and is significant at the 1% level.

Assessing India’s Progress in Achieving the Millennium Development Goals
September 2015
29
Figure 8: Relationship between health outcomes and public health infrastructure
Source: Based on Central Bureau of Health Intelligence, DGHS; WHO India for health outcome index.
In order to rectify the imbalances in outcomes due to insufficient state spending, Central
assistance to states commensurate with the development challenges they face is crucial. A look
at the devolution of Central funds to the states shows that some of the richer states may be
getting a disproportionate share of resources (per poor person). In this context, the Raghuram
Rajan Committee which had been asked to address this issue, proposed a new composite
underdevelopment index for allocating Central assistance based on human development
outcomes such as per capita consumption, infant mortality, female literacy, poverty, share of
SC/ST population, rate of urbanization, level of education, a household amenity index, and
connectivity (India, Ministry of Finance, 2013). Such needs based allocation will help in the
future provided both the Centre and the states keep a close watch on the results of their spending
and tailor their allocations and efforts accordingly. In addition to needs, allocations should also
be made on the basis of performance, so that continually poor performers are not provided
resources they do not use effectively. Unless proper use is made of scarce public resources, little
impact on the MDGs can result. Attention to effectiveness of spending is therefore crucial for
success.
iii) Effective delivery of public services
Effective delivery of public services is most critical from the point of view of MDG
performance. This is an area in which India can make significant improvements, as higher
delivery standards have already been achieved within the country among the better performing
states. It has been estimated, for example, that bringing the entire nation up to the standards
already achieved in best performing states for health and education services and food and fuel
KL KA
MH TN HP AP JK
PB GJ OR HR
AS CG WB
RJ MP
JH
BR UP
y = -0.01x + 64.86 R² = 0.51
0
10
20
30
40
50
60
70
80
90
0 1000 2000 3000 4000 5000 6000 7000 8000 9000
He
alth
Ou
tco
me
Ind
ex
Persons per government hospital bed
South and South-West Asia Development Papers 1502
September 2015
30
subsidy distribution would result in a 50% increase in effectiveness of national social spending,
in terms of reaching intended beneficiaries (McKinsey Global Institute, 2014).
A good example of the variability in standards of public services is in the utilization of
the employment generation funds under MGNREGA by different states. MGNREGA has been
helping rural households avoid poverty directly by providing employment at minimum wages to
around 50 million households annually, and by raising rural wages in general indirectly helping a
larger number of rural workers. However, the implementation of this major programme has
varied considerably across states, thereby affecting its impact significantly. Annex Table 2 shows
the 2012-13 implementation performance in the states. Many states did not fully utilize the funds
allocated and failed to provide sufficient employment to rural households. Since the MGNREGA
is an anti-poverty measure, the better measure of effectiveness is the proportion of rural poor
households that have been assisted. It is also a good proxy of the efficiency of public services
delivery. An index for this (proportion of rural households assisted as a proportion of the
incidence of rural poor households) is provided in the last column of the Table. Several high
poverty states such as Bihar, Odisha, Uttar Pradesh, Madhya Pradesh, Jharkhand and Assam
appear not to have covered all the rural poor households in their states under the scheme. On the
other hand, many states covered more than the proportion of poor rural households in the state.
This index also shows a very close positive association with progress on the MDGs given by the
MDG performance index based on the latest year.
Another good proxy of the efficiency of public services is the off-take of food grains
from the PDS per poor person in a state – a well-managed state should be able to get more food
for its poor than others. Figure 9 shows that Goa, the southern states as well as Jammu and
Kashmir and Uttarakhand have done well on this indicator, while some states with high poverty
have performed poorly. There is also a positive and very strong correlation of this index with the
MDG performance indicator for the latest year.17
17
The correlation coefficient is 0.69; and it is significant at the 1% level.

Assessing India’s Progress in Achieving the Millennium Development Goals
September 2015
31
Figure 9: Off-take of food-grains from PDS per poor person – major states, 2013-14
Source: Based on Food Grain Bulletin, Department of Food & Public Distribution; India,
Planning Commission (2013).
Note: Off-take of food grains refers to off-take of rice and wheat for BPL and AAY categories.
For improving the delivery of public services one would need to address several
important issues critical for their effectiveness. These include effective participation of
beneficiaries in design, implementation and monitoring of such services; smooth flow of funds,
credible reporting, objective and timely evaluation of outcomes, linking a part of devolution
with performance, properly targeting the services; making information available about service
entitlements and standards; ensuring services are performed in time and in required quantity and
quality; establishing effective grievance redressal mechanisms; professionalizing administration
through fair and transparent recruitment, stable tenure, and enabling citizens to demand
accountability from service providers (Bhargava, 2013). Effectiveness of public services in India
would improve substantially if these features are incorporated within their design and
implementation structure.
In most government programmes, the focus tends to be on collecting data on inputs, such
as expenditure, staffing, training, infrastructure and equipment. What this information does not
reveal, however, is what these investments yield in terms of the quality and quantity of services
delivered, and the effect of service delivery on programme outcomes. Consequently, programme
managers do not have the information that they need to assess whether the programme is
reaching its objectives and whether corrective action needs to be taken. An outcomes-oriented
0
50
100
150
200
250
300
350
400
Him
ach
al P
rad
esh
Ke
rala
Tam
ilNad
u
Jam
mu
& K
ash
mir
Utt
arak
han
d
Raj
asth
an
An
dh
ra P
rad
esh
Go
a
Pu
nja
b
Mah
aras
htr
a
Har
yan
a
Kar
nat
aka
Od
ish
a
We
stB
en
gal
Gu
jara
t
Aru
nac
hal
Pra
de
sh
Ch
hat
tisg
arh
Mad
hya
Pra
des
h
Jhar
khan
d
Ass
am
Utt
arP
rad
esh
Bih
ar
Off
take
pe
r p
oo
r (k
ilogr
ams)

South and South-West Asia Development Papers 1502
September 2015
32
approach demands that there be a shift from an emphasis on measuring inputs and outputs
(‘traditional M&E’) to measuring outcomes. Government should therefore promote an outcomes-
oriented approach that shifts the focus from inputs to outputs and outcomes, focusing not only on
expenditures but also on what is achieved with those expenditures. This outcome-based approach
would also possibly lead to rebalancing the ratio in favour of professional staff who deliver the
services such as nurses and doctors vis-à-vis administrative and peripheral staff.
Effectiveness of the delivery of public services is also affected by other factors, two of
which are especially important: corruption and capacity of public officials. The former has
become a matter of increasing public concern and will require major institutional changes and
reforms in monitoring and audit of public programmes and schemes. Capacity, especially of
many state and local governments in implementing public programmes is weak and mechanisms
for cross-learning across states need strengthening. A wealth of information on best practices
already exists and where these have not been adequately documented, they need to be prepared
and disseminated. While training schemes for development staff abound, real hands on capacity
development is not sufficiently undertaken. Officials who develop capacities by designing and
implementing various development schemes are rarely loaned between states and local bodies.
Greater emphasis should be provided to cross-learning and capacity development, particularly of
state and local officials who actually implement MDG schemes. Given the enormity of the
problem India faces, consideration may be also given to the suggestion to set up high level all-
India specialist cadres on health and education, as already exist for general administration,
policing and forests. Such personnel should be used to disseminate knowledge and good
practices across the country.
iv) Basic infrastructure development The expansion of basic services and their impact depends critically on the availability of
basic infrastructure such as all-weather roads, transportation, electricity and telecommunications,
for both rural and urban areas. Given rapid urbanization, basic urban infrastructure services are
also needed, including urban housing and shelter for the poor, mass transport systems, water,
drainage and sewerage - all crucial for making cities and urban areas liveable. Much of the
achievement of the MDGs depend on availability of infrastructure support; as without roads and
public transport children cannot go to school and expecting mothers cannot reach the health
centres; and learning at home and in school, health services at health centres are all hampered
without electricity. Better rural infrastructure – such as farm to market roads, storage facilities,
market infrastructure, and irrigation - also increases rural productivity and incomes and thereby
assists in reducing rural poverty. Although the importance of infrastructure in delivery of basic
services and poverty reduction is well-known and well documented, except in the case of water
and sanitation and telecommunications, the MDGs did not explicitly emphasize this aspect,
within their indicator structure.

Assessing India’s Progress in Achieving the Millennium Development Goals
September 2015
33
An example from the Indian context is illustrated in Figure 10. It shows the strong
positive relationship between access to all-weather (surfaced) roads and proportion of births
attended by health personnel.
Figure 10: Relationship between access to roads and proportion of births attended by skilled health personnel
Source: Authors’ calculations based on India, MOSPI, Statistical Yearbook 2014, and CES 2009.
The indicator for access to roads is a good proxy for provision of basic infrastructure in
general, in a state. It shows a good association with the latest year MDG performance indicator
for states,18
pointing to the importance of basic infrastructure for overall achievement of the
MDGs. Another good proxy for infrastructure provisioning is the proportion of households with
access to electricity. The relationship between access to households’ access to electricity and
literacy levels is illustrated in Figure 11.19
It shows once again the importance of basic
infrastructure for delivery of basic services such as education.
18
The correlation coefficient between kilometers of roads per 10,000 population and the latest year MDG
performance index has a positive correlation of 0.72 which is significant at the 1% level, for the set of the all states
(excluding the north eastern states of Sikkim, Arunachal Pradesh, Nagaland, and Mizoram).
19
A correlation of 0.52, significant at the 1% level is found between the literacy figures of states and percent of
households electrified till 2011 from India, Census 2011. The slope of the regression line is also significant.
AP
AS
BR CG
GJ
HR JK
JH
KA
KL
MP
MH
OR
PB
RJ
TN
UP
WB
y = 1.51x + 41.40 R² = 0.58
0
20
40
60
80
100
120
0 5 10 15 20 25 30 35
Proportion of births attended by skilled health
personnel
Kilometres of roads per 10,000 population

South and South-West Asia Development Papers 1502
September 2015
34
Figure 11: Relationship between electricity access and literacy, 2011
Source: Authors’ calculations based on India, Census, 2011 data.
India faces a serious deficiency of basic infrastructure. For example, currently about 25%
of all households in India have no access to electricity, while in other BRICS countries about
15% on average have no access, and in China virtually no households are without access. In
India, road infrastructure remains poor and of the existing roads only about half are paved, while
this is more than 60% for all other developing countries in Asia, as a whole.
Inter-state differences in MDG outcomes are also affected by variation in basic
infrastructure development, particularly those that directly impact on the MDGs. There is
considerable variation in the availability of basic infrastructure within the country. As Figure 10
illustrates, availability of surfaced roads is around 33 kilometres per 10,000 population in Kerala,
whereas for Jharkhand the figure is less than 5 kilometres. As far as access to electricity is
concerned, there is large variation in access to electricity as well, as shown in Figure 11. While
more than 90% households have access in all the four southern states and in Punjab, Haryana and
Gujarat, about half or less than half of the population has such access in West Bengal, Jharkhand,
Odisha, Assam, UP and Bihar – in the last two states the proportion is as little as about a third or
less (India, Census, 2011a).20
It is thus clear that non-availability of basic infrastructure, such as
surfaced roads and electricity in some areas is slowing down the achievement of MDG targets.
20
Access of households to electricity is deemed equivalent to households who use electricity for lighting, which is
measured in the Census (India, Census, 2011a).
AP AS
BR
CG
GJ HR
JK JH KA
KL
MP
MH
OR PB
RJ
TN
UP
WB
AR
GA HP
MN ML
MZ
NL SK TR
UK
y = 0.20x + 62.18 R² = 0.31
0
10
20
30
40
50
60
70
80
90
100
0 20 40 60 80 100
Lite
racy
leve
ls
Proportion of households electrified

Assessing India’s Progress in Achieving the Millennium Development Goals
September 2015
35
This is an issue that needs to be urgently addressed by the Government, both at the Centre and at
the state level.
v) Gender equality and empowerment of women
Gender equality has been adopted as an important Goal (MDG 3) mainly in recognition
of the need to uplift women who comprise half the population of countries but continue to suffer
deprivations resulting from social and economic discrimination. Achieving gender equality and
empowerment helps achieve the other MDGs i.e. apart from its intrinsic merits, gender equality
has instrumental value by spurring development in general. This opposite direction of causality
results from the large development impact, particularly the social development impact that
women’s development brings about. The correlation between the Gender Empowerment
Measure 2006 (see India, Ministry of Women and Child Development, 2009) 21
for the various
states of India and the MDG performance index prepared for this report shows a significant
positive relationship,22
suggesting the important role women’s development plays in advancing
the MDGs.
Promoting gender equality helps in reducing fertility and population growth, impacts
child mortality; improves the nutrition, hygiene and health of households, children’s
performance in schools, helps correct the allocation of household resources, and aids economic
growth in general. Estimates have shown, for example, that the costs to countries of not having
gender parity in primary and secondary education are high: significant increases are found in
child mortality and incidence of underweight children as a result (Abu-Ghaida and Klasen,
2004). The FAO has pointed out that women in India own less than 10% of agricultural land and
even when they are owners they do not have effective control in terms of right to sell or rent,
etc.23
Lack of land ownership is a severe impediment to efficiency for women cultivators
because in the absence of the title to land, women cannot get credit or be entitled to irrigation
and other inputs, especially technology. Estimates by FAO show that more equal access to
productive resources for female farmers could increase agricultural output in developing
countries by 2.5% to 4% and contribute to reducing global hunger by 12% to 17% (FAO, 2011).
21
The GEM measure for India was prepared for 2006 by the Ministry of Women and Child Development and is
based on three sub-indexes (i) political participation and decision-making power, which relied participation of
women in national and state legislatures, panchayats, political parties and voting in elections; (ii) economic
participation and decision-making power, which relied on participation on women in civil services, and enrolment in
medical and engineering colleges; and (iii) power over economic resources; which was based on indicators relating
to women’s share in land holdings, bank accounts, and ratio of estimated shares of females to males per capita
incomes.
22
The association between the 2006 GEM and the latest year MDG performance index has a correlation coefficient
of 0.47 which is significant at the 1% level.
23
Gender and Land Rights database, the Food and Agriculture Organization (FAO). See more at:
http://www.hindustantimes.com/world-news/sexist-land-ownership-causing-gender-inequality-in-india-un/article1-
510337.aspx#sthash.0umkTfho.dpuf

South and South-West Asia Development Papers 1502
September 2015
36
A study also shows that South Asia’s larger gender gaps in education and labour force
participation, compared to East Asia, have resulted in a 1.4% lower economic growth compared
to East Asia (Klasen and Lamanna, 2009).
Women in India remain severely deprived, compared to other developing countries
including several of India’s neighbours, and this is one of the crucial constraints to India’s future
development. For example, the 2014 Human Development Report places India’s Gender
Inequality Index (GII) at an unacceptably high level of 0.563 (UNDP, 2014). India is ranked
135th
in the world and India’s index is almost twice the gender inequality index (0.333) of East
Asia and the Pacific (EAP). India fares far worse than EAP in all gender inequality sub-
indicators. For example, while the proportion of females aged 25 or older with at least secondary
education was nearly 54.6% for EAP, it was just 26.6% for India, which was lower than in some
other South Asian countries like Bhutan (34%) and Bangladesh (30.8%). In Sri Lanka, it was as
high as 72.6%. While less than 30% of women above 15 years participated in the labour force in
India – and evidence points to stagnation or even a decline in such participation, the participation
rate was more than double in EAP (66.4%) and was again higher in several South Asian
countries such as Nepal (79.9%), Bhutan (66.4%), Bangladesh (57.3%) and Sri Lanka (35.0%).
Perhaps the most fundamental expression of gender inequality in India is the preference for sons
over daughters. The Child Sex Ratio (CSR) in the age group 0-6 years has declined from 962 in
1981 to 927 (India Census, 2001) to 919 in 2011 (India, Census, 2011), owing to both the
widespread use of sex determination tests, sex selective foeticide and the continued
discrimination against girls after birth.
In some states, the condition of women is far worse than the national average and in
many states the performance differs between the particular gender dimension that is being
measured. Generally among the larger states, those with high aggregate Gender Empowerment
Measure (GEM) scores24
include the four southern states (Kerala, Karnataka, Tamil Nadu and
Andhra Pradesh), Maharashtra, and the northern states of Punjab, Haryana and Himachal
Pradesh. However, two of the more developed states, Haryana and Punjab with high aggregate
GEM scores, are ranked among the bottom five states based on their extremely unnatural child
sex ratios, with 834 and 846 girls born for every 1,000 boys respectively (India, Census, 2011b).
Such paradoxes are not uncommon in India. Deeper analysis is therefore required to
assess the overall progress on gender issues in a particular state. States that have fallen behind
have much catching up to do, in order to improve both the condition and status of women and
thereby contribute to their overall social and economic development. While improvements in
gender equality and women’s empowerment are taking place, these need to be speeded up. For
example, many more girls, are in education and in jobs and women are participating in larger
24
Note that the GEM is measured by the Government of India is similar to the United Nations GEM measure which
has now been replaced by the Gender Inequality Index in Human Development Reports.
Assessing India’s Progress in Achieving the Millennium Development Goals
September 2015
37
numbers in local government bodies and in gram panchayats; women’s self-help groups have
made major contributions to reducing poverty. However, much greater and more sustained effort
will be necessary to eliminate gender inequality from India’s society, economy and polity. In that
context, the Government’s Beti Bachao-Beti Padhao campaign is a timely initiative to save and
educate and empower girls.
5. Concluding remarks
This paper has attempted to make an assessment of India’s performance and that of the
states on the MDGs based on the latest available data released so far. An objective methodology
has been used for this purpose. The paper has shown that taking India as a whole, while
significant progress has been made in many critical areas of development; major weaknesses
have remained in vital areas such as primary education, child health, sanitation and gender
empowerment. MDGs therefore remain an unfinished agenda for India.
The paper also attempted to analyse the performance of the individual states. While
improvements have been made by all, the pace of progress has in several cases been insufficient
if the MDG targeting norms are employed. Also, that some states were able to make much more
progress than others indicates the gaps in performance that lagging states may have to fill. As
the overall Indian MDG performance will depend critically on efforts by individual states, much
more effort is still needed in the lagging states for the overall objective of inclusiveness in
India’s development to be achieved. In particular, more focus is needed on the 10 states
identified as lagging with particular focus on the Goals they are lagging. India can improve
performance by helping the weaker states emulate the good performers.While factors specific to
each of the MDGs are important for achievement of the targets, the paper has identified five key
“drivers” explaining the performance of States that may help closing the gaps include accelerated
broad-based and employment creating economic growth, higher resources channeled into basic
services such as education and health, effective delivery of public services, extended basic
infrastructure networks such as roads and electricity for better access to basic services by rural
folks, and promotion of gender equality and empowerment of women that affect the outcomes of
other goals.
As the MDGs reach their December 2015 deadline, a new set of transformative and
universal Sustainable Development Goals (SDGs) have been adopted by the world leaders at the
United Nations Summit in September 2015, as a culmination of an extensive process of
consultation at different levels. The new SDGs seek to ensure that the momentum generated by
the MDGs is carried forward beyond 2015 to provide a life of dignity to all. Building on the
MDGs, the SDGs propose to end poverty and deprivation in all forms, leaving no one behind,
while making development economically, socially and environmentally sustainable.
South and South-West Asia Development Papers 1502
September 2015
38
The proposed SDGs cover 17 goals and 169 targets to be achieved by 2030. These
include the unfinished MDG agenda covering poverty, hunger, education, health, and other basic
needs, gender equality, along with some of the cross-cutting issues or “drivers” such as inclusive
growth, industrialization, and employment creation, recognizing their critical role. They also
include some goals to enhance the ecological sustainability of development and resilience to
natural disasters. Finally they include a reinvigorated and strengthened global partnership for
development.
At this time of transition from MDGs to SDGs, the responsibility of steering development
in India has been passed on to the new Government. There is now a remarkable convergence of
vision underlying the SDG priorities and those of the Government which has adopted the
principle of Sabka Sath, Sabka Vikas (“Together with all, development for All”), and has stated
that the “first claim on development belongs to the poor.” More than ever before, the
Government is calling for improved sanitation (through its Swachh Bharat Abhiyan), health,
education, financial inclusion (Pradhan Mantri Jan Dhan Yojana), security and dignity of all,
especially women (Beti Bachao-Beti Padhao). It is seeking to create decent jobs through Skill-
India and Make-in-India missions while strengthening key existing anti-poverty programmes
such as MGNREGA. The Government is simultaneously prioritizing improving environmental
development by treating the challenge of climate change as an opportunity rather than a problem
and has quintupled the target for solar power to 100 GW by 2022.
Besides building a national consensus to pursue SDGs to provide a life of dignity to all its
people, India could also assist fellow developing countries in the neighbourhood and beyond in
achieving SDGs through regional and South-South Cooperation as a part of the global
partnership. India has been an early pioneer of South-South Cooperation and has shared its
valuable development experiences with other countries for decades. The new Government has
shown its resolve to take this engagement to a new higher level to develop mutually beneficial
partnerships.
Given India’s sheer size and huge share in the world’s population, it assumes a critical
role in reducing the global burden of poverty, hunger, malnourishment, illiteracy, disease and
gender discrimination, among other core development challenges. For 2015 and beyond, the
world will be watching how India will implement its new strategic direction and the concrete
actions and achievements it can make to provide a sustainable future for all as it emerges as one
of the largest and the most dynamic economies of the world and an anchor of the Asian Century.

Assessing India’s Progress in Achieving the Millennium Development Goals
September 2015
39
References
Abu-Ghaida, D. and S. Klasen (2004).The costs of missing the Millennium Development Goal
on gender equity. World Development, vol. 32, No. 7, pp. 1075-1107.
Aggarwal, A. and N. Kumar (2012). Structural Change, Industrialization and Poverty Reduction:
The case of India. Development Papers 1206. UNESCAP South and South-West Asia Office.
New Delhi. Available from
www.unescap.org/sites/default/files/SSWA_Development_Paper_1206_Nov2012.pdf
Bhalotra, S. (2006). Childhood Mortality and Economic Growth.Research Paper No.2006/79.
UNU-WIDER. July 2006. Available from
http://citeseerx.ist.psu.edu/viewdoc/download?doi=10.1.1.294.3402&rep=rep1&type=pdf
Bhargava, V. (2013). Enhancing Governance of Public Services Delivery. in S. Chatterjee (ed),
Ending Asian Deprivations: Compulsions for a Fair, Prosperous and Equitable Asia. Singapore:
ADB, National University of Singapore and Routledge.
Dollar, D. and A. Kray (1991). Growth is good for the poor, Development Research
Group.World Bank.
ENVIS Centre on Wildlife and Protected Areas (2015). Protected Areas in India, Wildlife
Institute of India. Dehradun. Available from
http://wiienvis.nic.in/Database/Protected_Area_854.aspx
Food and Agriculture Organization of the United Nations (FAO) (2011). The State of Food and
Agriculture 2010-11. Rome.
Hailu, D. and R. Tsukada (2012). Is the Distribution of Foreign Aid MDG-Sensitive? DESA
Working Paper No. 111, ST/ESA/2012/DWP/111. Available from
www.un.org/esa/desa/papers/2012/wp111_2012.pdf.
Hirst, N. and others (2012). An Assessment of India’s 2020 Carbon Intensity Target. Grantham
Institute for Climate Change. Report No GR4, April 2012. Imperial College. London. Available
from
https://workspace.imperial.ac.uk/climatechange/Public/pdfs/Grantham%20Report/India_2020_G
rantham%20Report%20GR4.pdf

South and South-West Asia Development Papers 1502
September 2015
40
India, Census (2011a). Houses, Household Amenities and Assets- Source of lighting. Office of
the Registrar General and Census Commissioner.New Delhi.
India, Census (2011b). Sex Ratio in India. Available from
http://www.census2011.co.in/sexratio.php
India, Central Bureau of Health Intelligence. (2014).National Health Profile (NHP) of India –
2013.Government of India. New Delhi.
India, Department of Food and Public Distribution (2014). Food Grain Bulletin. May 2014.
Government of India. New Delhi.
India, Ministry of Finance (2013). Report of the Committee for Evolving a Composite
Development Index of States. Government of India. New Delhi.
India, Ministry of Rural Development (2012). MGNREGA Sameeksha. An Anthology of
Research Studies on the Mahatma Gandhi National Rural Employment Guarantee Act, 2005.
Government of India. New Delhi.
India, Ministry of Statistics and Programme Implementation (2014 a). Millennium Development
Goals India Country Report 2014. Government of India. New Delhi.
India, Ministry of Statistics and Programme Implementation (2014b). Statistical Yearbook
2014.Government of India. New Delhi.
India, Ministry of Statistics and Programme Implementation (2015). Millennium Development
Goals India Country Report 2015. Government of India. New Delhi.
India, Ministry of Women and Child Development, (2009). Gendering Human Development
Indices: Recasting the Gender Development Index and the Gender Empowerment Measure for
India. Summary Report. Government of India. Available from
http://wcd.nic.in/publication/gdigemSummary%20Report/GDIGEMSummary.pdf.
India, Ministry of Women and Child Development (2015 ). Rapid Survey on Children, 2013-
2014. Government of India, New Delhi (with support of UNICEF, India).
India, Planning Commission (2011a). An Evaluation Study of Integrated Child Evaluation
Schemes. . Government of India, New Delhi.

Assessing India’s Progress in Achieving the Millennium Development Goals
September 2015
41
India, Planning Commission (2011 b). Evaluation Study of National Rural Health Mission
(NRHM) In 7 States. Government of India. New Delhi.
India, Planning Commission (2013). Press Notes on Poverty Estimates, 2011-12. Government of
India. New Delhi. Available from http://planningcommission.nic.in/news/pre_pov2307.pdf
India, Planning Commission (2014 ). Report of the Expert Group to Review the Methodology for
Measurement of Poverty. Government of India, New Delhi.
International Institute for Population Sciences (IIPS). (1995). National Family Health Survey,
India 1992-93. Bombay:IIPS.
International Institute for Population Sciences (IIPS). (2009). National Family Health Survey
(NFHS-3) India 2005-06. Mumbai: IIPS.
Kapoor, R. (2013). Inequality Matters. Economic and Political Weekly, vol. XLVIII, No.
02.January 12,2013. Available from http://www.epw.in/special-articles/inequality-matters.html
Klasen, S. and F. Lamanna (2009). The Impact of Gender Inequality in Education and
Employment on Economic Growth: New Evidence for a Panel of Countries. Feminist
Economics, vol.15, No.3, pp. 91-132.
Kumar, N. (2013). Trade, Capital Flows and Balance of Payments: Trends, Challenges and
Policy Options for India. Development Papers 1303. UNESCAP South and South-West Asia
Office. New Delhi. Available from
www.unescap.org/sites/default/files/SSWA_Development_Papers_1303_March2013_2.pdf
Mahal, A. and others (2010). Economic Implications of Noncommunicable Diseases for India.
Washington D.C: World Bank.
McKinsey Global Institute (2014). From Poverty to Empowerment: India’s Imperative for Jobs,
Growth, and Effective Basic Services. McKinsey & Company.
National University of Educational Planning and Administration (2014). Elementary Education
in India Progress Towards UEE, Flash Statistics DISE 2013-14. New Delhi. Available from
www.dise.in/Downloads/Publications/Publication2013-14/FlashBook2013-14.pdf
RBI (2013), Handbook of Statistics on the Indian Economy, 2013, Mumbai: Reserve Bank of
India

South and South-West Asia Development Papers 1502
September 2015
42
UNDP (2014). Human Development Report 2014. Sustaining Human Progress: Reducing
Vulnerabilities and Building Resilience. New York.
UNESCAP (2015). India and the MDGS: Towards a Sustainable Future for All. United Nations
Country Team-India. New Delhi. Available at http://www.unescap.org/resources/india-and-
mdgs-towards-sustainable-future-all
UNESCAP (2010). Financing an Inclusive and Green Future. Bangkok: United Nations.
ST/ESCAP/2575.Available from www.unescap.org/sites/default/files/themestudy2010-
overview-booklet.pdf
UNESCAP (2012). Regional Cooperation for Inclusive and Sustainable Development. South and
South- West Asia Development Report 2012-13. South and South-West Asia Office.New Delhi:
Routledge.
UNESCAP, ADB and UNDP (2008). A Future Within Reach 2008. Asia-Pacific MDG Study
Series. Available from www.unescap.org/sites/default/files/MDGReport2008.pdf
UNESCAP, ADB and UNDP (2015). Making it Happen.Technology, Finance and Statistics for
Sustainable Development in Asia and the Pacific. Asia-Pacific Regional MDGs Report 2014/15.
Bangkok.
UNICEF and India, Ministry of Health and Family Welfare.(2010). Coverage Evaluation Survey
2009. New Delhi. Available from
http://files.givewell.org/files/DWDA%202009/GAIN/UNICEF%20India%20Coverage%20Evalu
ation%20Survey%20(2009).pdf.
UNICEF and UNESCO Institute of Statistics (2014). All Children in School by 2015. Global
Initiative on Out of School Children. South Asia Regional Study covering Bangladesh, India,
Pakistan and Sri Lanka.
World Bank (2014a). India-Women, Work and Employment. Report No: ACS7935, Vol.1.
World Bank (2014b). World Development Indicators online database. Available from
http://data.worldbank.org/data-catalog/world-development-indicators
WHO (2014). Trends in Maternal Mortality: 1990 to 2013, Estimates by WHO, UNICEF,
UNFPA, The World Bank, and the United Nations Population Division. (available from
http://www.who.int/reproductivehealth/publications/monitoring/maternal-mortality-2013/en/)
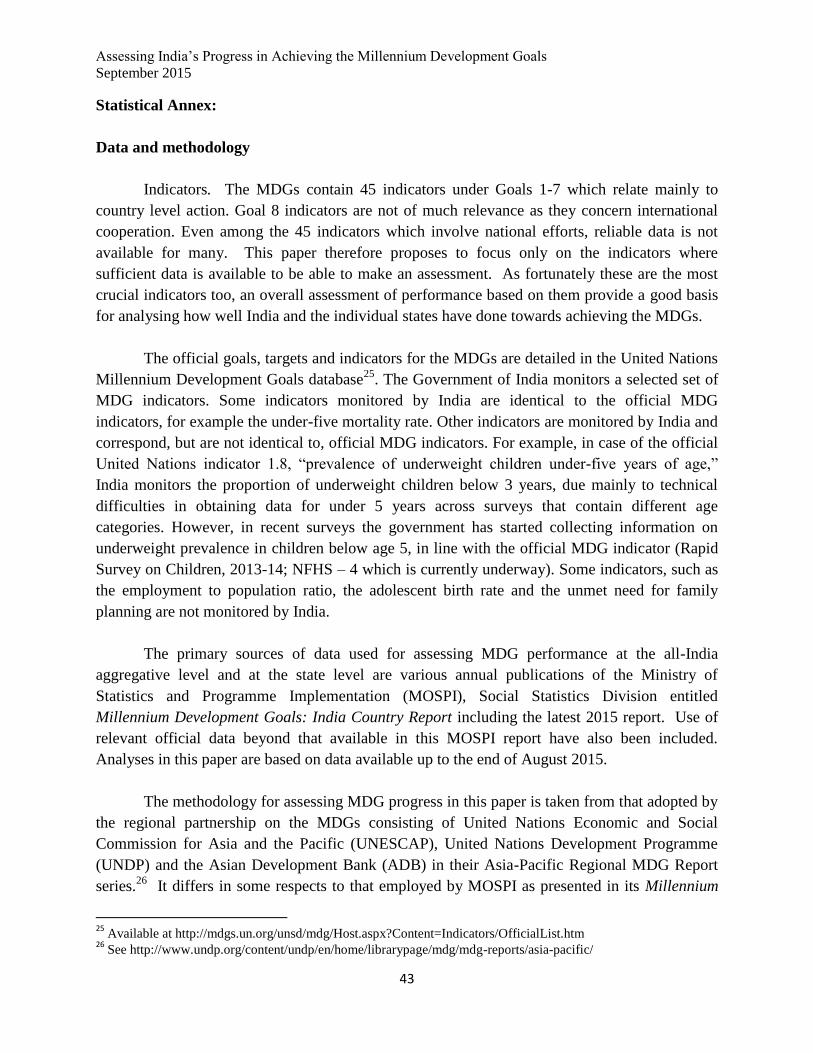
Assessing India’s Progress in Achieving the Millennium Development Goals
September 2015
43
Statistical Annex:
Data and methodology
Indicators. The MDGs contain 45 indicators under Goals 1-7 which relate mainly to
country level action. Goal 8 indicators are not of much relevance as they concern international
cooperation. Even among the 45 indicators which involve national efforts, reliable data is not
available for many. This paper therefore proposes to focus only on the indicators where
sufficient data is available to be able to make an assessment. As fortunately these are the most
crucial indicators too, an overall assessment of performance based on them provide a good basis
for analysing how well India and the individual states have done towards achieving the MDGs.
The official goals, targets and indicators for the MDGs are detailed in the United Nations
Millennium Development Goals database25
. The Government of India monitors a selected set of
MDG indicators. Some indicators monitored by India are identical to the official MDG
indicators, for example the under-five mortality rate. Other indicators are monitored by India and
correspond, but are not identical to, official MDG indicators. For example, in case of the official
United Nations indicator 1.8, “prevalence of underweight children under-five years of age,”
India monitors the proportion of underweight children below 3 years, due mainly to technical
difficulties in obtaining data for under 5 years across surveys that contain different age
categories. However, in recent surveys the government has started collecting information on
underweight prevalence in children below age 5, in line with the official MDG indicator (Rapid
Survey on Children, 2013-14; NFHS – 4 which is currently underway). Some indicators, such as
the employment to population ratio, the adolescent birth rate and the unmet need for family
planning are not monitored by India.
The primary sources of data used for assessing MDG performance at the all-India
aggregative level and at the state level are various annual publications of the Ministry of
Statistics and Programme Implementation (MOSPI), Social Statistics Division entitled
Millennium Development Goals: India Country Report including the latest 2015 report. Use of
relevant official data beyond that available in this MOSPI report have also been included.
Analyses in this paper are based on data available up to the end of August 2015.
The methodology for assessing MDG progress in this paper is taken from that adopted by
the regional partnership on the MDGs consisting of United Nations Economic and Social
Commission for Asia and the Pacific (UNESCAP), United Nations Development Programme
(UNDP) and the Asian Development Bank (ADB) in their Asia-Pacific Regional MDG Report
series.26
It differs in some respects to that employed by MOSPI as presented in its Millennium
25
Available at http://mdgs.un.org/unsd/mdg/Host.aspx?Content=Indicators/OfficialList.htm 26
See http://www.undp.org/content/undp/en/home/librarypage/mdg/mdg-reports/asia-pacific/

South and South-West Asia Development Papers 1502
September 2015
44
Development Goals, India Country Report 2015(see India, Ministry of Statistics and Programme
Implementation, 2015, pp.164-167). Below is a summary of our methodology as adapted for
assessing performance of India and the states; details are available in the regional MDG report
series referred to.
Categorization of MDG progress. One way of measuring progress in each indicator for India as
well as for each state is to use a “traffic light” approach where progress is categorized in one of
four ways:
1. Early achiever : Already achieved the 2015 target value
2. On track : Expected to meet the target by 2015, following the same path
3. Off track, slow : Expected to meet the target, but after 2015
4. Off track, regressing/no progress : Slipping backwards or stagnating
Some MDG targets are explicit (such as reducing the incidence of poverty by half from
the 1990 value by 2015; or reducing maternal mortality rate by three quarters). To categorize
performance, a likely estimated value for the indicator in 2015, based on the trend rate of the
observations is calculated and then compared to the target value.
On the other hand, some MDG indicators have no explicit target value, but call for only
halting and reversing course: such as prevalence of diseases like HIV/AIDS where a halting or
decrease is necessary (to reduce negative effects); or halting and increase is stipulated, such as
for halting the loss of forest cover, (to increase positive effects.) In these cases only three
categories of progress apply: Early achiever, On track and Off track, regressing.
Cut-off values. It is not always possible to fully achieve a target owing to the functional
forms of the trend lines fitted to approximate progress on an indicator (such as for trend lines
which are assumed to take logarithmic or logistic form). For some indicators the target is
approached asymptotically (e.g. enrolment rate of 100%). In other indicators, the precision for
trend and value of the measurement of the indicator declines when the value is very small, thus
making measurement of progress difficult. These require the setting of cut-off values. For
example, the cut-off value for the reduction in poverty is 2% as that is usually the lowest level
reported on this indicator; while in the case of primary school enrolment the cut-off value is 95%
instead of 100%. For categorizing progress in these cases, the indicator is assumed to reach the
target if the cut-off value is achieved. The cut-offs employed in this paper are listed in Annex
Table 1.
Addressing data gaps. The calculation of the trend growth rates and estimates requires for each
indicator at both national and state levels, at least two data points, a minimum of three years
apart. If these are not available that particular indicator is not assessed. The baseline value for

Assessing India’s Progress in Achieving the Millennium Development Goals
September 2015
45
each MDG indicator is the observation for 1990 where data is available. If no observation exists
for 1990, the observation for the nearest year is used if data exists for any period between 1991
and 1994. For indicators that have a specific target value, (e.g. poverty reduction), and where no
observation exists before 1995, a trend growth rate of the existing data is used to back-cast and
estimate a value for 1990. This value then becomes the basis for the determination of the 2015
target for cases where explicit target values are specified.
In some cases the number of sample observations for back-casting differs across different states
due to dissimilar data availability across states. In such cases, estimates for 1990 or 2015 may be
based on differing sample sizes. For example, for the infant mortality indicator, states including
Chhattisgarh and Jharkhand the 1990 likely and target estimates are derived from available data
between only 2006 and 2013; but for all other states reported, observations include values
between 1990 and 2013.
Performing appropriate transformations to derive a trend growth rate and forecasting.
The MDG indicators can be divided into three types: (i) indicators that are proportions or
probabilities such as the proportion of the population below the poverty line; (ii) indicators that
are odds ratios such as gender parity in education at primary, secondary and tertiary level; and
(iii) indicators such as CO2 emissions that are neither probabilities nor odds ratios. For (i) a
logistic transformation is used; and for (ii) a logarithmic transformation is used. No
transformation is used for type (iii) indicators. Thereafter a linear regression is used on the
transformed variables for forecasting and back-casting. Once the estimated values are
determined for likely 2015 achievement, and if necessary for 1990 back-casting, a reverse
transformation is applied to the estimate.
States studied: The paper includes estimates of 29 Indian States, including the National
Capital Region of Delhi, for each of the indicators where data is available. The state of
Telengana was officially created on 2 June 2014 and for the purposes of this paper, data is
combined with the state of Andhra Pradesh. Union Territories and Islands are not included in this
report due to low reporting and data availability. However, the India (Total) figures for each
indicator include data on all available states and territories for each particular indicator.

South and South-West Asia Development Papers 1502
September 2015
46
Annex Table 1: Target, Cut-offs and Transformation
Indicator
Target Cut-
off
Transformation
Poverty Headcount Half 1990 value 2 Logit
Underweight children Half 1990 value None Logit
Primary enrolment 100 95 Logit
Survival rate 100 95 Logit
Youth literacy 100 95 Logit
Gender parity in primary
education
1 0.95 Log
Gender parity in secondary
education
1 0.95 Log
Gender parity in tertiary
education
1 0.95 Log
Under 5 mortality Reduce to ⅓ of 1990 value None Logit
Infant mortality Reduce to ⅓ of 1990 value None Logit
Maternal mortality Reduce 1990 mortality rate
by ¾
None Logit
Skilled birth attendance Reduce 1990 unattended
birth- rate by ¾
None Logit
Adult HIV prevalence Reverse the trend None Logit
Malaria incidence Reverse the trend None Logit
Tuberculosis prevalence Reverse the trend None Logit
Improved drinking water Half 1990 value (of those
without access)
None Logit
Improved sanitation Half 1990 value (of those
without)
None Logit
Forest cover Reverse the trend None Logit
Source: Based on UNESCAP, ADB and UNDP (2015). Technical Note 1.

Assessing India’s Progress in Achieving the Millennium Development Goals
September 2015
47
Annex Table 2: Performance of states on MGNREGA 2012-13 and the MDG Performance Index
States
MDG
Performance
Index
Percentage
of funds
utilised
(%)
Proportion of
rural
households
provided
work (%)
Incidence
of rural
poverty
(%)
Proportion of
rural
households
provided
work as
proportion of
rural poor
households
(%)
Goa 0.78 28 4.1 6.8 60.2
Kerala 0.75 99 37.8 9.1 413.9
Tamil Nadu 0.72 89 74.1 15.8 467.9
Himachal
Pradesh 0.66 88 38.7 8.5 456.1
Andhra Pradesh 0.65 99 41.6 11 379.5
Punjab 0.64 91 7.1 7.7 92.7
Maharashtra 0.64 91 10.5 24.2 43.2
Jammu and
Kashmir 0.63 95 44 11.5 381.6
Gujarat 0.60 70 9.7 21.5 45.2
Karnataka 0.60 82 16.5 24.5 67.4
Haryana 0.59 94 9.6 11.6 82.1
Uttarakhand 0.58 96 31.7 11.6 273
West Bengal 0.58 94 42.6 22.5 189
Assam 0.48 96 22.6 33.9 66.6
Chhattisgarh 0.48 82 61.1 44.6 137
Rajasthan 0.47 82 44.6 16.1 278
Orissa 0.47 83 19.9 35.7 55.6
Madhya Pradesh 0.45 86 32.3 35.7 90.3
Arunachal
Pradesh 0.44 50 57.4 38.9 147.5
Uttar Pradesh 0.37 80 19.3 30.4 63.6
Jharkhand 0.34 79 30.2 40.8 73.9
Bihar 0.30 74 12.4 34.1 36.4
Source: MGNREGA data from official website (http://nrega.nic.in/Netnrega/stHome.aspx); rural poverty data from
India, Planning Commission (2013). .
Note: It is being assumed that the incidence for households in poverty in rural areas can be approximated by these
estimates of headcount ratio.