Broadband coverage in Europe in 2012 - Point...
212
Broadband coverage in Europe in 2012 Mapping progress towards the coverage objectives of the Digital Agenda RESEARCH REPORT A study prepared for the European Commission DG Communications Networks, Content & Technology Digital Agenda for Europe
Transcript of Broadband coverage in Europe in 2012 - Point...
Broadband Coverage in Europe in 2012
Broadband coverage in Europe in 2012
Mapping progress towards the coverage objectives of the Digital Agenda
RESEARCH REPORT
A study prepared for the European Commission DG Communications Networks, Content & Technology
Digital Agenda for Europe
Broadband Coverage in Europe 2012
Page 2 of 212
This study was carried out for the European Commission by:
Point Topic 73 Farringdon Road London EC1M 3JQ United Kingdom www.point-topic.com
Internal identifications Contract number: SMART 2012-0035 Version 1.01
LEGAL NOTICE By the European Commission, Communications Networks, Content & Technology Directorate-General. Neither the European Commission nor any person acting on its behalf is responsible for the use which might be made of the information contained in the present publication. The European Commission is not responsible for the external web sites referred to in the present publication. The views expressed in this publication are those of the authors and do not necessarily reflect the official European Commission’s view on the subject. The Publications Office of the European Union. © European Union, 2013 Reproduction is authorised provided the source is acknowledged.

Broadband Coverage in Europe 2012
Page 3 of 212
Broadband coverage in Europe in 2012
Research Report
for the SMART 2012/0035 Project
TABLE OF CONTENTS
EXECUTIVE SUMMARY ................................................................................................................. 6
1 INTRODUCTION ....................................................................................................................... 13
1.1 Project outline .................................................................................................................................... 13
1.2 Project methodology .......................................................................................................................... 15
1.3 Project deliverables ............................................................................................................................ 19 1.3.1 Summary of deliverablees ....................................................................................................................... 19 1.3.2 Research Report ...................................................................................................................................... 19
2 EUROPEAN OVERVIEW ............................................................................................................ 21
2.1 Europe-wide coverage ............................................................................................................................. 21 2.1.1 Coverage by technology combinations .................................................................................................... 21 2.1.2 Total coverage by technology .................................................................................................................. 22 2.1.3 Rural coverage by technology ................................................................................................................. 24 2.1.4.Coverage by NUTS 3 areas ....................................................................................................................... 25
2.2 Country comparisons of total coverage .................................................................................................... 32 2.2.1 Standard technologies ............................................................................................................................. 32 2.2.2 NGA technologies .................................................................................................................................... 35 2.2.3 Mobile broadband technologies .............................................................................................................. 38 2.2.4 Satellite .................................................................................................................................................... 39
2.3 Country comparisons of rural coverage .................................................................................................... 41 2.3.1 Standard technologies ............................................................................................................................. 41 2.3.2 NGA technologies .................................................................................................................................... 44 2.3.3 Mobile broadband technologies .............................................................................................................. 46
2.4 European data tables ............................................................................................................................... 52
Broadband Coverage in Europe 2012
Page 4 of 212
3 COVERAGE BY COUNTRY ......................................................................................................... 55
3.01 Austria ................................................................................................................................................... 55
3.02 Belgium .................................................................................................................................................. 59
3.03 Bulgaria .................................................................................................................................................. 63
3.04 Croatia ................................................................................................................................................... 68
3.05 Cyprus .................................................................................................................................................... 72
3.06 Czech Republic ....................................................................................................................................... 76
3.07 Denmark ................................................................................................................................................ 80
3.08 Estonia ................................................................................................................................................... 84
3.09 Finland ................................................................................................................................................... 89
3.10 France .................................................................................................................................................... 94
3.11 Germany .............................................................................................................................................. 100
3.12 Greece .................................................................................................................................................. 105
3.13 Hungary ............................................................................................................................................... 110
3.14 Iceland ................................................................................................................................................. 114
3.15 Ireland ................................................................................................................................................. 118
3.16 Italy ...................................................................................................................................................... 122
3.17 Latvia ................................................................................................................................................... 127
3.18 Lithuania .............................................................................................................................................. 131
3.19 Luxembourg ......................................................................................................................................... 135
3.20 Malta ................................................................................................................................................... 139
3.21 Netherlands ......................................................................................................................................... 143
3.22 Norway ................................................................................................................................................ 148
3.23 Poland .................................................................................................................................................. 153
3.24 Portugal ............................................................................................................................................... 158
3.25 Romania ............................................................................................................................................... 163
3.26 Slovakia ................................................................................................................................................ 167
3.27 Slovenia ............................................................................................................................................... 172
Broadband Coverage in Europe 2012
Page 5 of 212
3.28 Spain .................................................................................................................................................... 176
3.29 Sweden ................................................................................................................................................ 181
3.30 Switzerland .......................................................................................................................................... 186
3.31 United Kingdom ................................................................................................................................... 190
APPENDICES ............................................................................................................................ 195
A1 Categories for definition ......................................................................................................................... 195
A2 Technology definitions ........................................................................................................................... 196
A3 Coverage definitions ............................................................................................................................... 197

Broadband Coverage in Europe 2012
Page 6 of 212
Executive Summary
Motivation
The purpose of the Broadband Coverage in Europe in 2012 (BCE 2012) project was to support the
objectives of the European Union’s Digital Agenda. Two of the Agenda’s key objectives are to
provide:
All European Union citizens with basic broadband coverage by 2013; and
Broadband speeds of at least 30 megabits per second for all by 2020.
BCE 2012 was designed to measure progress towards this objective and identify where action would
be needed to achieve it.
The project was commissioned by the Directorate General for Communications Networks, Content
and Technology, DG Connect. Neelie Kroes, the Vice President of the European Commission
responsible for the Digital Agenda for Europe, has pointed out that “accurate data is critical for
delivering policy and regulation that enables broadband internet for all Europeans.”
Methodology
With this need in view, DG Connect requested a study to be based on a survey of broadband
network operators and National Regulatory Agencies (NRAs). The study was to cover all twenty-
seven countries of the EU and also Norway, Iceland, Croatia and Switzerland1. The main objective
was to research the coverage of each of the nine main broadband technologies – meaning what
proportion of households have access to services using each technology. The nine main broadband
technologies were: DSL, VDSL, FTTP, standard cable, Docsis 3 cable, WiMAX, HSPA, LTE and satellite.
The study was also to estimate the overall coverage of “combinations” of technologies. Since the
coverage areas of the different technologies would often overlap, this meant looking at the number
of households passed by each different technology capable of delivering a chosen level of
performance and estimating the total number of households being served by at least one of the
technologies.
The three technology combinations chosen were:
Standard broadband
Including the main technologies capable of providing basic broadband of at least
144kbps download speed for end-users, but excluding satellite broadband
Combining DSL (including VDSL), FTTP, WiMAX, standard cable (including Docsis 3
cable), HSPA and LTE, but excluding satellite broadband.
Standard fixed broadband
Including the main fixed-line technologies capable of providing basic broadband
of at least 144kbps download speed for end-users.
1 Glasfasernetz Schweiz in Switzerland provided additional funding to include Switzerland within the study.
Broadband Coverage in Europe 2012
Page 7 of 212
Combining DSL (including VDSL), FTTP, WiMax and standard cable (including
Docsis 3 cable).
Next Generation Access (NGA) broadband
Including the technologies which are needed to meet the Digital Agenda’s
30Mbps objective.
Combining VDSL, FTTP and Docsis 3 cable.
To achieve an accurate estimate of technologies and combinations, Point Topic successfully
proposed a study which would map technology coverage at the level of sub-national regions. The
regions used follow the EU-sponsored scheme for “Nomenclature of Units for Territorial Statistics”
(NUTS) and specifically the NUTS 3 level, which mostly corresponds to familiar administrative
divisions such as counties, départements, or provinces. Working at regional level allows a far more
reliable assessment of total coverage and the split between the more urban and the rural sectors in
each country. The study also introduced a more sophisticated approach to defining rural households,
which assessed the population density in every square kilometre across Europe.
NRAs and operator respondents were asked to provide data at country level and at NUTS 3 level
where possible. Thanks not least to the very valuable support of DG Connect, a high proportion did.
Point Topic would like to take this opportunity to thank DG Connect and all survey respondents for
their support. Particular thanks are due to IDATE who, with the approval of the FTTH Council, also
helped by providing their current country-level data on FTTP coverage.
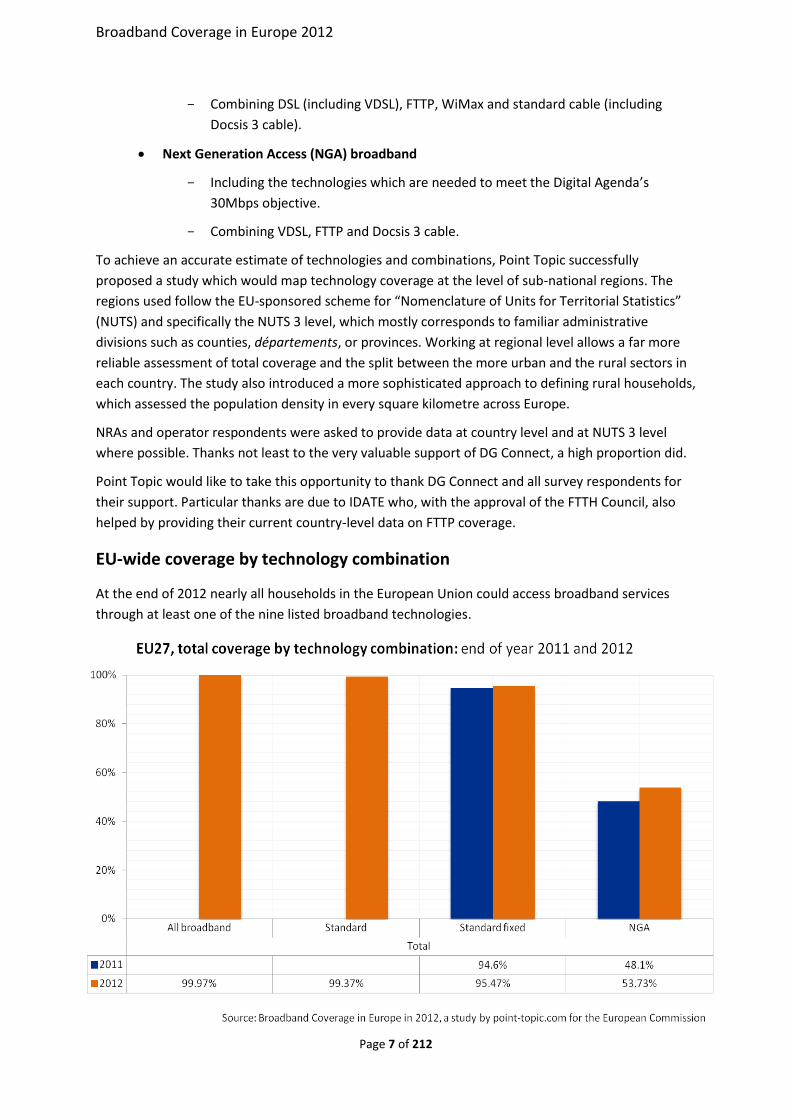
EU-wide coverage by technology combination
At the end of 2012 nearly all households in the European Union could access broadband services
through at least one of the nine listed broadband technologies.
Broadband Coverage in Europe 2012
Page 8 of 212
The few sets of households not served by broadband services were located in Iceland, Lithuania,
Latvia and Estonia, where satellite broadband services were not available.
More than 99% of households could access standard broadband services through fixed or mobile
services (HSPA or LTE), with over 95% able to access at least one fixed service.
At the end of 2012 the European Union was more than half-way towards its target of 30Mbps access
for all by 2020. 54% of EU households, or 113 million, were already covered by NGA services at the
end of 2012.
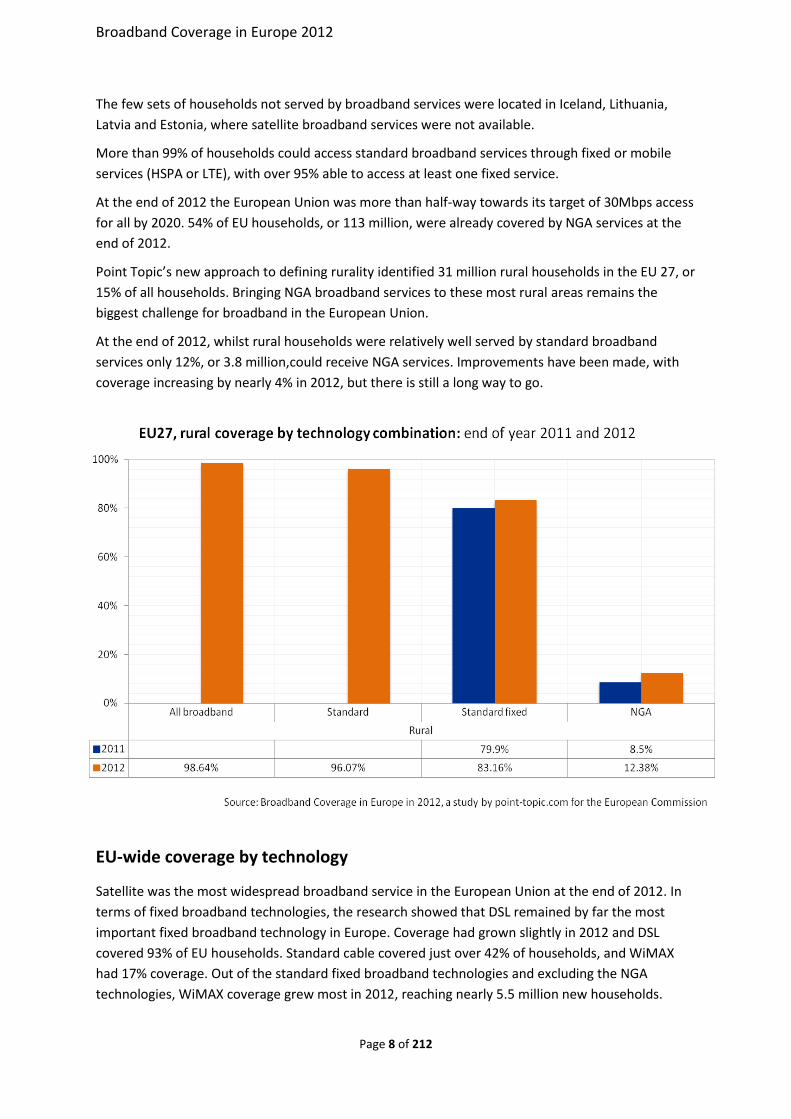
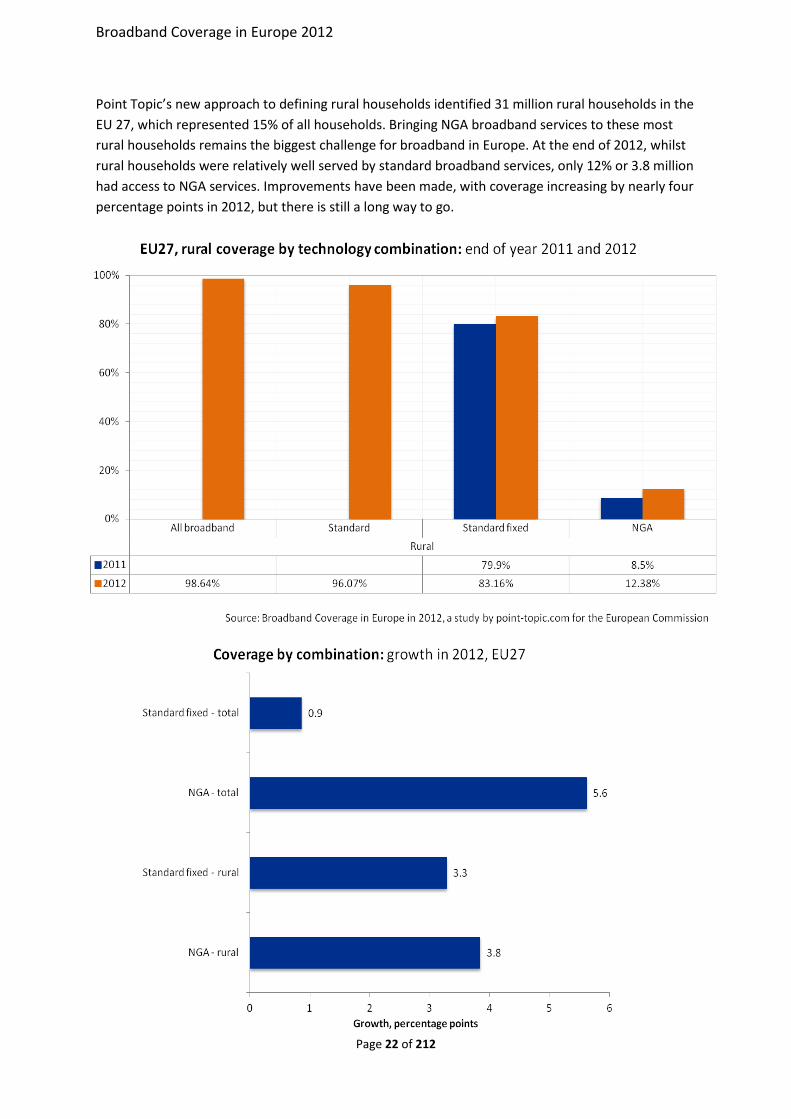
Point Topic’s new approach to defining rurality identified 31 million rural households in the EU 27, or
15% of all households. Bringing NGA broadband services to these most rural areas remains the
biggest challenge for broadband in the European Union.
At the end of 2012, whilst rural households were relatively well served by standard broadband
services only 12%, or 3.8 million,could receive NGA services. Improvements have been made, with
coverage increasing by nearly 4% in 2012, but there is still a long way to go.
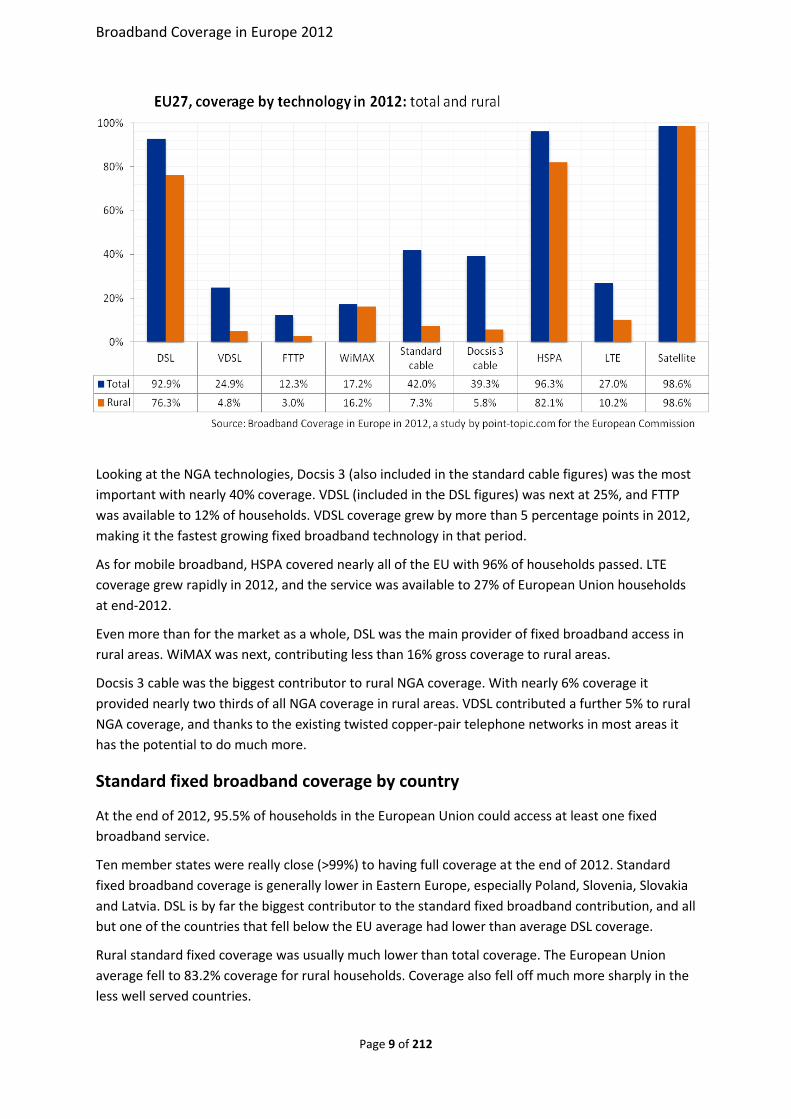
EU-wide coverage by technology
Satellite was the most widespread broadband service in the European Union at the end of 2012. In
terms of fixed broadband technologies, the research showed that DSL remained by far the most
important fixed broadband technology in Europe. Coverage had grown slightly in 2012 and DSL
covered 93% of EU households. Standard cable covered just over 42% of households, and WiMAX
had 17% coverage. Out of the standard fixed broadband technologies and excluding the NGA
technologies, WiMAX coverage grew most in 2012, reaching nearly 5.5 million new households.
Broadband Coverage in Europe 2012
Page 9 of 212
Looking at the NGA technologies, Docsis 3 (also included in the standard cable figures) was the most
important with nearly 40% coverage. VDSL (included in the DSL figures) was next at 25%, and FTTP
was available to 12% of households. VDSL coverage grew by more than 5 percentage points in 2012,
making it the fastest growing fixed broadband technology in that period.
As for mobile broadband, HSPA covered nearly all of the EU with 96% of households passed. LTE
coverage grew rapidly in 2012, and the service was available to 27% of European Union households
at end-2012.
Even more than for the market as a whole, DSL was the main provider of fixed broadband access in
rural areas. WiMAX was next, contributing less than 16% gross coverage to rural areas.
Docsis 3 cable was the biggest contributor to rural NGA coverage. With nearly 6% coverage it
provided nearly two thirds of all NGA coverage in rural areas. VDSL contributed a further 5% to rural
NGA coverage, and thanks to the existing twisted copper-pair telephone networks in most areas it
has the potential to do much more.
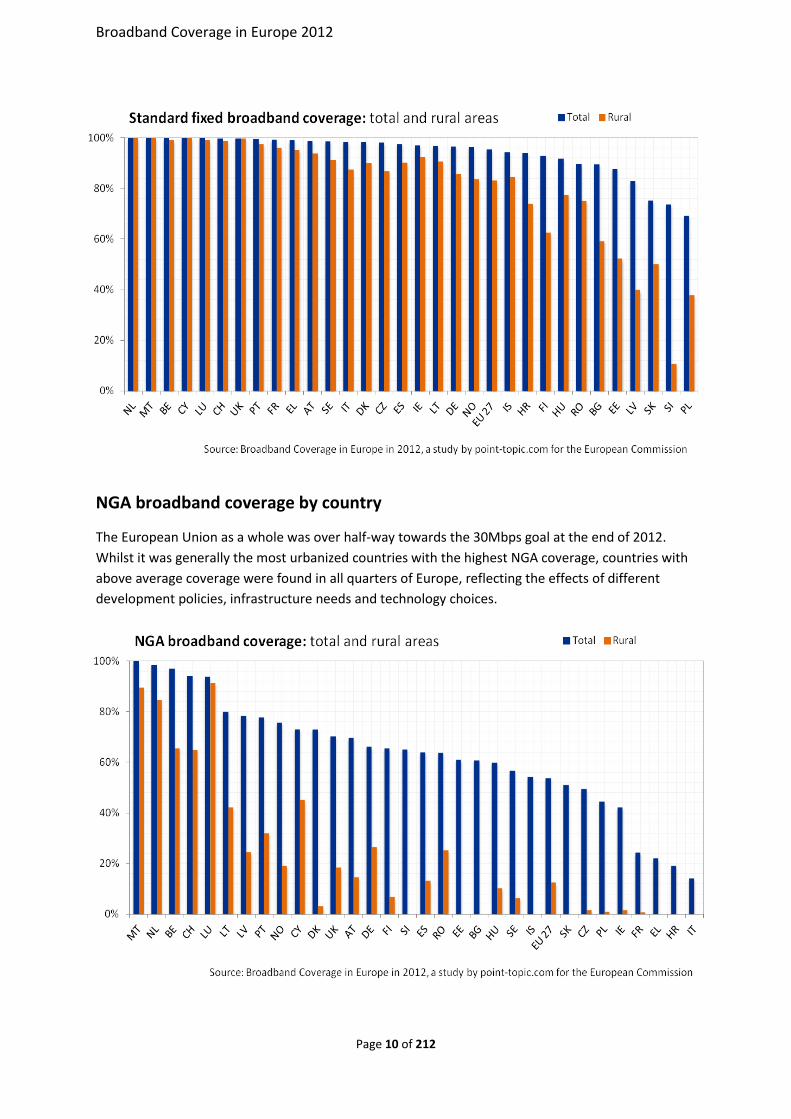
Standard fixed broadband coverage by country
At the end of 2012, 95.5% of households in the European Union could access at least one fixed
broadband service.
Ten member states were really close (>99%) to having full coverage at the end of 2012. Standard
fixed broadband coverage is generally lower in Eastern Europe, especially Poland, Slovenia, Slovakia
and Latvia. DSL is by far the biggest contributor to the standard fixed broadband contribution, and all
but one of the countries that fell below the EU average had lower than average DSL coverage.
Rural standard fixed coverage was usually much lower than total coverage. The European Union
average fell to 83.2% coverage for rural households. Coverage also fell off much more sharply in the
less well served countries.
Broadband Coverage in Europe 2012
Page 10 of 212
NGA broadband coverage by country
The European Union as a whole was over half-way towards the 30Mbps goal at the end of 2012.
Whilst it was generally the most urbanized countries with the highest NGA coverage, countries with
above average coverage were found in all quarters of Europe, reflecting the effects of different
development policies, infrastructure needs and technology choices.
Broadband Coverage in Europe 2012
Page 11 of 212
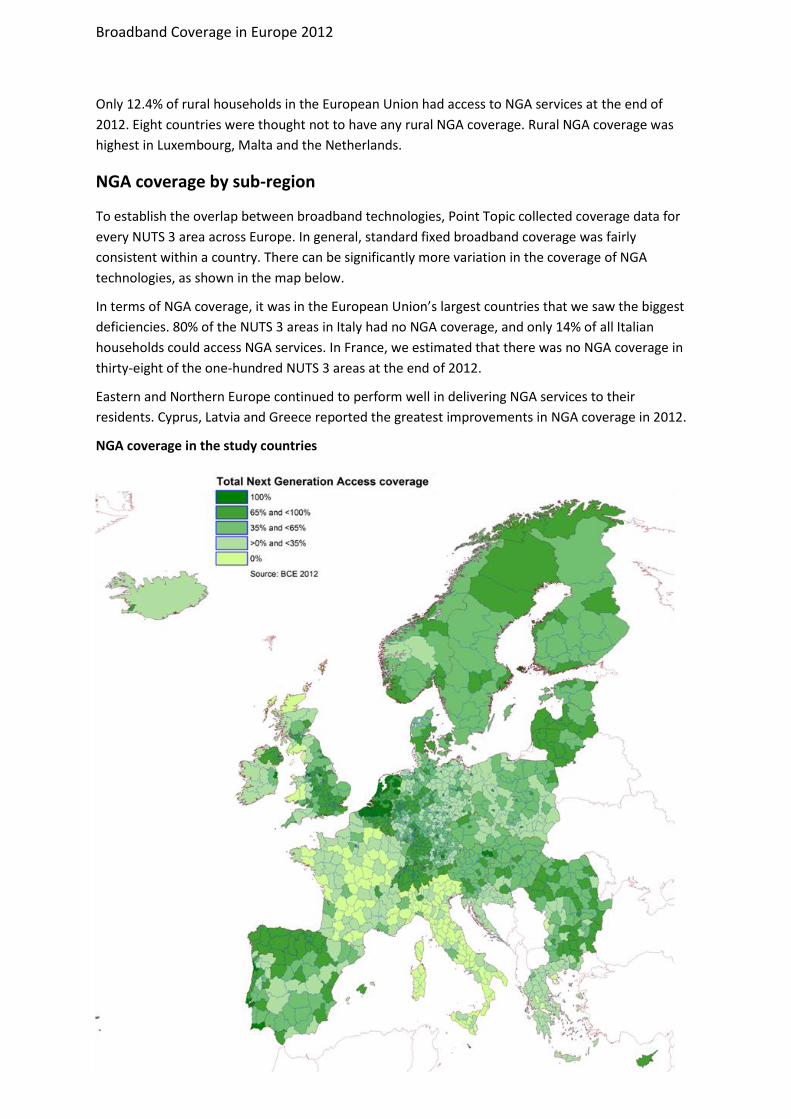
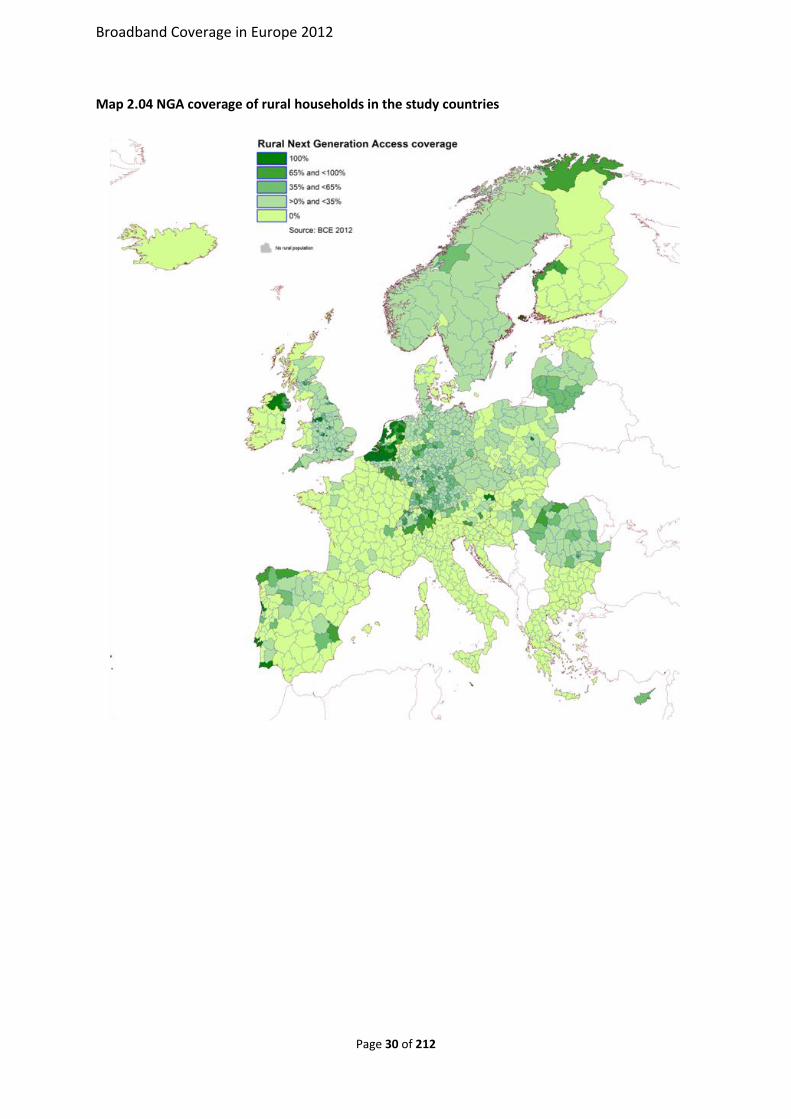
Only 12.4% of rural households in the European Union had access to NGA services at the end of
2012. Eight countries were thought not to have any rural NGA coverage. Rural NGA coverage was
highest in Luxembourg, Malta and the Netherlands.
NGA coverage by sub-region
To establish the overlap between broadband technologies, Point Topic collected coverage data for
every NUTS 3 area across Europe. In general, standard fixed broadband coverage was fairly
consistent within a country. There can be significantly more variation in the coverage of NGA
technologies, as shown in the map below.
In terms of NGA coverage, it was in the European Union’s largest countries that we saw the biggest
deficiencies. 80% of the NUTS 3 areas in Italy had no NGA coverage, and only 14% of all Italian
households could access NGA services. In France, we estimated that there was no NGA coverage in
thirty-eight of the one-hundred NUTS 3 areas at the end of 2012.
Eastern and Northern Europe continued to perform well in delivering NGA services to their
residents. Cyprus, Latvia and Greece reported the greatest improvements in NGA coverage in 2012.
NGA coverage in the study countries
Broadband Coverage in Europe 2012
Page 12 of 212
Conclusions
At the end of 2012, nearly all EU households had access to a standard broadband service. The
European Commission can be pleased to be so close to meeting its target of delivering standard
broadband to all by the end of 2013.
The challenge remains in delivering NGA broadband to all households by 2020, and particularly to
rural households. Whilst results show an overall coverage increase of almost four percentage points
in 2012, there is still a long way to go, particularly in some of the European Union’s largest countries.

Broadband Coverage in Europe 2012
Page 13 of 212
1. Introduction
1.1 Project Outline
Supporting the Digital Agenda
The purpose of the Broadband Coverage in Europe in 2012 (BCE 2012) project was to support the
objectives of the European Union’s Digital Agenda. Two of the Agenda’s key objectives are to
provide:
All European Union citizens with basic broadband coverage by 2013; and
Broadband speeds of at least 30 megabits per second by 2020.
BCE 2012 was designed to measure progress towards that objective and identify where action would
be needed to achieve it.
With this aim in view DG Connect, the European Commission Directorate General for
Communications Networks, Content and Technology, invited consultants to tender for a project to
survey the coverage of all the main broadband technologies in September 2012.
The nine technologies for which coverage data was required were DSL, VDSL, FTTP, WiMAX,
Standard Cable, Docsis 3 Cable, HSPA, LTE and satellite. Definitions for these technologies and other
concepts used by the project are provided in the Appendices. The data required was for the period
ending December 2012 and included all twenty-seven European Union countries plus Norway,
Iceland, Croatia and Switzerland, the thirty-one “study countries”. Note that Glasfasernetz Schweiz
in Switzerland provided additional funding to include Switzerland within the study. Rural and
national coverage of each technology was to be reported for each study country.
In addition DG Connect requested similar data for three “technology combinations”, taking into
account the overlaps of different technologies providing comparable performance for end-users. The
combinations which are provided by the project are:
Standard broadband
Including the main technologies capable of providing basic broadband of at least
144kbps download speed for end-users, but excluding satellite broadband
Combining DSL (including VDSL), FTTP, WiMax, standard cable (including Docsis 3
cable), HSPA and LTE, but excluding satellite broadband.
Standard fixed broadband
Including the main fixed-line technologies capable of providing basic broadband
of at least 144kbps download speed for end-users.
Combining DSL (including VDSL), FTTP, WiMax and standard cable (including
Docsis 3 cable).
Next Generation Access (NGA) broadband
Including the technologies which are needed to meet the Digital Agenda 30Mbps
objective.

Broadband Coverage in Europe 2012
Page 14 of 212
Combining VDSL, FTTP and Docsis 3 cable.
Overlapping coverage
The combination measures were vital for the purposes of the project because they showed how far
the EU, and associated countries, had progressed towards the objectives of universal coverage of
basic broadband by 2013 and 30Mbps broadband by 2020. But their reliability depends on the use of
a statistically sound means of measuring the overlap of different services.
Clearly, simply adding the coverage percentages of different technologies to reach a total coverage
figure was not sufficient. Competing operators using different technologies will all tend to build their
networks to serve the same or similar areas; in particular, they generally choose to invest in the
more densely populated towns and suburbs rather than rolling out in country areas.
Rather, the only way to identify and measure overlapping and complementary coverage was to
segment a country area by area and see which networks were present in each case. Point Topic was
able to propose such a solution thanks to a previous experience, dating back to 2005. This included
detailed mapping of broadband coverage firstly in the UK, and more recently in the whole EU 27 plus
a number of associated countries. Point Topic then used the same approach to successfully map
broadband coverage in Europe for the European Commission in its earlier study Broadband Coverage
in Europe in 2011.
Mapping by sub-national regions
Point Topic’s specific proposal was to collect coverage data for sub-national regions, more
specifically those known as “NUTS 3” areas. NUTS stands for “National Units for Territorial Statistics”
and provides an internationally comparable set of regions across the EU and associated countries.
Thus the NUTS scheme supports the most consistent view available of Europe-wide issues such as
broadband coverage with a ready-made statistical framework. NUTS 3 level areas in particular are
mainly of 150,000 to 800,000 population, with 1,362 of them in all the thirty-one study countries.
The study used the updated NUTS 3 areas defined in 2010.
In this way, Point Topic took the project a major step beyond DG Connect’s original specification. As
a result it provided a more accurate assessment of coverage at country level and a graphic picture of
regional broadband coverage across the whole EU and other study countries. We hope that the
broadband maps we have created will make an important contribution towards the successful
development of policy in this area and the achievement of the Digital Agenda objectives.
Acknowledgements
Point Topic believes the project was successful, and if so, thanks are due to many groups and
individuals who made that possible.
The general support of DG Connect, and of the project team in particular, was invaluable. They used
and shared their Europe-wide contacts to ensure a good response to the survey of coverage, which
was at the core of the project. Not least, Neelie Kroes, the Vice President of the European
Commission responsible for the Digital Agenda, validated the project by pointing out that “accurate
data is critical for delivering policy and regulation that enables broadband internet for all
Europeans.”
Broadband Coverage in Europe 2012
Page 15 of 212
Respondents to the Survey also deserve our grateful thanks. Both operators and regulators tackled a
demanding request for information with enthusiasm and care. We learnt a lot from our discussions
with them and hope the results do justice to their contribution. The figures in our deliverables are
not always exactly those our respondents provided due to several intricate factors, such as issues
arising out of different definitions and statistical bases, for example. However, we always aimed to
give priority to what respondents told us and to reflect this as faithfully as possible within the
project’s requirements for consistency and the overall framework.
Point Topic also wish to thank IDATE for generously providing access to key results from their
research on FTTx coverage on behalf of the FTTH Council for Europe. IDATE’s expertise is widely
reflected in our results for FTTP.
1.2 Project methodology
Structure
The structure of the BCE 2012 project was simple and very similar to the earlier study, BCE 2011,
also completed by Point Topic. DG Connect’s specification for the project required that data
collection should be based on a survey of NRAs and broadband network operators in the study
countries. The project effectively began in November 2012 with a consultation period involving the
regulators in each of the study countries. During this time we also developed the Survey
Questionnaire and the supporting definitions and categories required for the project. In January
2013, once all these had been approved, the Survey was launched.
Point Topic also chose to complement the Survey with a parallel research programme designed to
assess the validity of the survey results and fill any potential gaps. The final phase of the project
involved integrating, checking and testing the results to produce the required unified picture of
broadband coverage in Europe.
Project Survey
The Survey Questionnaire aimed to gather data on one basic question – “How many households
have access to broadband?”, applied across three dimensions:
Technology – for each of the broadband technologies surveyed
Geography – for each country as a whole and each region within the country
Rurality – for the rural areas in each country and each region compared with the
corresponding country or region as a whole.
The coverage of satellite broadband in Europe was established separately through consultation with
the major providers in Europe. For satellite broadband, we considered not only whether services
were available, but also whether active distribution points existed within the country for consumers
to purchase services.
The key definitions for technologies and their coverage are provided in the Appendices to this
report.
Broadband Coverage in Europe 2012
Page 16 of 212
In addition, the Survey included supplementary questions to establish the context of the data
supplied in circumstances where the respondents were working with a wide range of definitions,
reference dates and confidentiality issues.
In a few cases, more granular geographical coverage data was provided and aggregated by Point
Topic to fit into the Survey structure.
Confidentiality
Confidentiality was an important issue for many respondents to the Survey. In many cases, the data
provided, particularly at NUTS 3 level, was regarded as commercially sensitive.
To meet respondents’ need for confidentiality the publication of the project’s results is limited to
country-level figures for single technologies, and technology combinations for NUTS 3 areas. The
technology combinations (standard fixed coverage and NGA coverage) combine the coverage of
multiple technologies so that the coverage of any one technology is usually obscured.
A further layer of data, coverage by NUTS 3 area for each technology surveyed, was provided to DG
Connect who are holding it as commercially confidential.
Point Topic also asked all survey respondents to state the level of confidentiality they wished be
applied to the data they provided. These ranged from allowing full use of the data to restricting its
employment to the sole purposes of the survey and requiring its deletion upon the project’s
completion. Point Topic were pleased to meet respondents’ confidentiality concerns and are
grateful for the confidence placed in the company.
Parallel research
The parallel research programme was organised mainly on a country-by-country basis, but with
overview tasks to bring together and support the country-level work where needed.
The programme relied on conventional techniques and published sources, including publications by
NRAs and operators included in the survey. The members of the research team for BCE 2012 also
produce Point Topic’s Broadband Operators and Tariffs and Global Broadband Statistics services and
are familiar with the type of data used for this project as well as the sources from which it is derived.
Besides NRA and operator data the research drew on existing published research for the Digital
Agenda programme and Point Topic’s own research services and projects, in particular the
Broadband Coverage in Europe in 2011 study for DG Connect.
IDATE also generously provided access to key results from their research on FTTx coverage on behalf
of the FTTH Council for Europe, specifically its table of country-level FTTx coverage and subscription
numbers at year-end 2012. While they were sometimes superseded by some later data, such as
survey responses from the NRAs, the IDATE figures were an essential input to the project’s coverage
estimates.
The key deliverable from the parallel research was initial estimates for the coverage of every
technology in each of the study countries as a whole. This was backed up by extensive data and
mapping from the major operators in each country, plus NRA reports and details of broadband
strategies and plans.
Broadband Coverage in Europe 2012
Page 17 of 212
Defining rural areas
For BCE 2012, Point Topic developed a new approach to classifying and defining rural areas. Using
the Corine land cover database, Point Topic has created a database of the population and land type
in every square kilometre across Europe. This database will be referred to as the European Kilometre
Grid or EKG. Households in square kilometres with a population less than one hundred were
classified as rural. Using this approach, Point Topic estimates that 15% of households in the study
countries are rural.
This approach to defining rural areas presented many advantages for this study. Firstly, it provided a
consistent definition for all thirty-one study countries. The public datasets which give estimates of
the number of rural households in Europe do not cover all of the study countries, which would make
comparisons between countries difficult.
More importantly, it offered a better model for identifying areas which are unlikely to receive
broadband investment on a commercial basis. Using the EKG, Point Topic was able to identify high
population density centres within otherwise rural areas. Considering the area as a whole, the
average population density might suggest that a particular area is rural. However, those areas with a
high population density are still likely to be good prospects for commercial investment in broadband
infrastructure. The EKG was able to isolate and correctly identify these high-density areas, allowing
Point Topic to focus only on the most rural households outside of those areas.
Data integration and modelling
The final major task of the study was to merge the data from both the survey and the parallel
research to produce the actual coverage estimate outputs from the project.
This work was done for every technology individually, in each country. In the best cases respondents
provided figures for total and rural coverage in each NUTS 3 area. At the other extreme, data was
supplied for total coverage by technology at national level only. The parallel research programme
was tasked to provide a best efforts estimate of total coverage as a minimum. Even in these cases
the coverage totals were often supported by “presence” data, showing in which NUTS 3 areas the
technology was available. In many cases where detailed survey data was not available, results from
the earlier study BCE 2011 were used as a basis for estimating regional coverage.
Where necessary the total and rural coverage for each NUTS 3 area was estimated from national
coverage and presence data using simple models. The models relied on simple assumptions, for
example that investment in technologies like VDSL, cable and FTTP would strongly favour urban over
rural areas.
Most cases were in-between those two extremes. For example, data on NUTS 3 rural coverage was
often unavailable when total coverage data was provided. Here modeling assumptions were used to
estimate rural coverage. Another difficulty was posed by the varying definitions of rurality used by
different respondents and aligning the data supplied into a single consistent dataset for the whole of
Europe.
Taking account of all the above, the project succeeded in providing a complete set of estimates for
the total and rural coverage of all nine technologies considered and for all 1,362 NUTS 3 areas in the
thirty-one study countries.
Broadband Coverage in Europe 2012
Page 18 of 212
Estimating coverage for technology combinations
The individual technology estimates were used to produce estimates of the total coverage provided
in combination by technologies with similar performance characteristics. The particular examples
chosen were standard broadband coverage (combining DSL, FTTP, WiMAX, Standard Cable, HSPA
and LTE), standard fixed broadband coverage (combining DSL, FTTP, WiMAX and Standard Cable),
and Next Generation Access coverage (combining VDSL, FTTP and Docsis 3 Cable).
The project used a standardised approach to make these combination estimates. This was required
both to produce the technology combinations and where we had data from multiple operators
providing the same technology in an area.
The default formula to estimate combination coverage was to combine the averages of:
The minimum possible coverage; equal to the coverage of the most widespread
technology or operator in the area
The maximum possible coverage; equal to the sum of the coverage of all the technologies
or operators being considered, or to 100%, whichever was the greater.
The default formula was applied in the great majority of cases but altered in a few countries where
some technologies were judged to complement each other, rather than overlapping. In these cases
the minimum coverage was taken as equal to the sum of the complementary technologies, if this
was greater than the most widely available single technology.
Note that the estimates for combination coverage at national level were obtained by summing the
estimates for the NUTS 3 areas in the country and not by applying this formula only at country level.
This provides a more accurate view at a higher confidence degree than simply using the country-
level average.
Three countries were able to provide their own estimates for the overlap of different technology
combinations using their own, more granular geographical databases of broadband coverage. This
data was used where it was available.
Restating the data for year-end 2011
In some cases, new data was supplied that provided a more accurate assessment of coverage at the
end of 2011. If new and reliable data was provided, this was used to update the figures published in
the project Broadband Coverage in Europe in 2011.
A full list of all restatements made to the 2011 dataset is provided within the appendices.
Finalisation
Once the NUTS 3 and country-level datasets had been completed they were passed on to DG
Connect for review and, where necessary, amended over several cycles. The final draft datasets
were then sent to the NRAs of all the countries involved for their comments, leading to the final
changes before publication.
Finally, the finished datasets were published within the Digital Agenda’s Scoreboard and used to
prepare this research report.
Broadband Coverage in Europe 2012
Page 19 of 212
1.3 Project deliverables
1.3.1 Summary of deliverables
The deliverables provided by the BCE 2012 project were as follows.
Published deliverables:
Research Report (this document)
Country-level dataset: coverage by technology
NUTS 3-level dataset: coverage by technology combination and HSPA
Additional deliverables for internal use by DG Connect:
Methodology Report
NUTS 3-level dataset: coverage by technology
1.3.2 Research Report
Introduction
This provides an overview of the objectives, methodology and deliverables of the Broadband
Coverage in Europe in 2012 (BCE 2012) project.
The Project Outline explains DG Connect’s objectives in commissioning the project as a contribution
towards achieving the targets of the Digital Agenda programme, and Point Topic’s proposed
approach. It summarises the project plan and the invaluable support provided by the NRAs and
broadband operators of all types in the study countries.
The Methodology section describes the overall structure of the project and the key issues involved.
It covers the Survey, which was the main basis of the project, Point Topic’s approach to
confidentiality, the Parallel Research programme, and the techniques used to integrate data from
different sources and provide the complete set of research results required.
Finally this section provides a guide to the content and availability of the deliverables.
Europe Overview
This reviews the EU 27 and the study country results as a whole. The first part is concerned with
Europe-wide coverage as shown by the technology combinations and the total and rural coverage of
individual technologies. It also shows how these results map onto the NUTS 3 geography of Europe
for both Standard Fixed and NGA Coverage in all households and in rural households.
The second part compares the country-level figures for the standard, NGA and mobile technologies
and for the total and rural estimates. It includes a series of bar charts showing the country coverage
values for each technology and combination in rank order. The bar charts include values for both the
EU 27 and for the study countries as a whole. The final section provides a set of data tables for all
the coverage values and Europe-wide demographics.
Country Profiles
This section comprises results profiles for each of the thirty-one study countries. Each profile
includes bar charts of the technology combination, total and rural coverage for each technology;

Broadband Coverage in Europe 2012
Page 20 of 212
maps showing standard fixed and NGA coverage for each NUTS 3 area; demographic and coverage
data tables and brief discussion of the data results and mapping.
Country-level dataset
This dataset comprises basic demographics and coverage values for all nine technologies and
combinations, both total and rural, for all thirty-one study countries plus the EU 27 and all countries
as a whole.
NUTS 3-level dataset
This dataset provides figures for each NUTS 3 area in all the the estimated total andrural coverage
for the standard, standard fixed and NGA combinations.
Broadband Coverage in Europe 2012
Page 21 of 212
2 European overview
2.1 Europe-wide coverage
2.1.1 Coverage by technology combinations
The central task of the Broadband Coverage in Europe in 2012 (BCE 2012) project was to estimate
the availability of broadband services across all the countries of the European Union and Norway,
Iceland, Croatia and Switzerland. The study looked at the coverage of the nine main broadband
technologies and the coverage of different technology combinations, capable of delivering standard
or high-speed services.
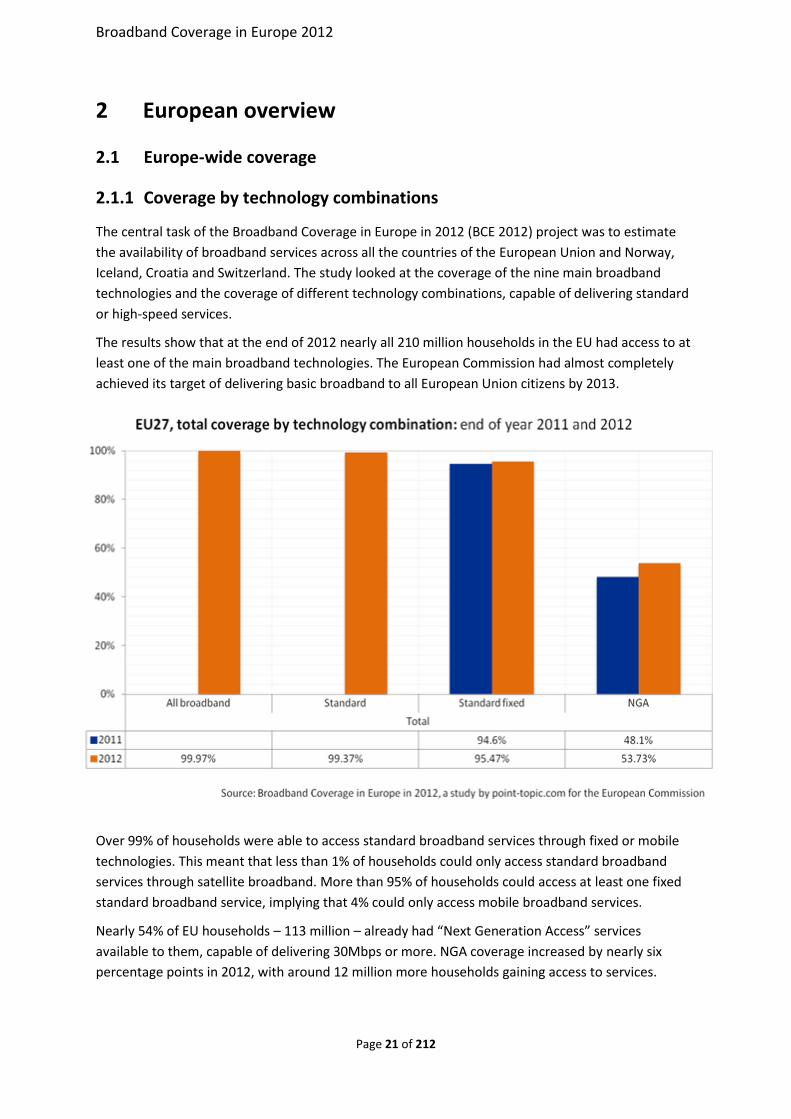
The results show that at the end of 2012 nearly all 210 million households in the EU had access to at
least one of the main broadband technologies. The European Commission had almost completely
achieved its target of delivering basic broadband to all European Union citizens by 2013.
Over 99% of households were able to access standard broadband services through fixed or mobile
technologies. This meant that less than 1% of households could only access standard broadband
services through satellite broadband. More than 95% of households could access at least one fixed
standard broadband service, implying that 4% could only access mobile broadband services.
Nearly 54% of EU households – 113 million – already had “Next Generation Access” services
available to them, capable of delivering 30Mbps or more. NGA coverage increased by nearly six
percentage points in 2012, with around 12 million more households gaining access to services.
Broadband Coverage in Europe 2012
Page 22 of 212
Point Topic’s new approach to defining rural households identified 31 million rural households in the
EU 27, which represented 15% of all households. Bringing NGA broadband services to these most
rural households remains the biggest challenge for broadband in Europe. At the end of 2012, whilst
rural households were relatively well served by standard broadband services, only 12% or 3.8 million
had access to NGA services. Improvements have been made, with coverage increasing by nearly four
percentage points in 2012, but there is still a long way to go.
Broadband Coverage in Europe 2012
Page 23 of 212
2.1.2 Total coverage by technology
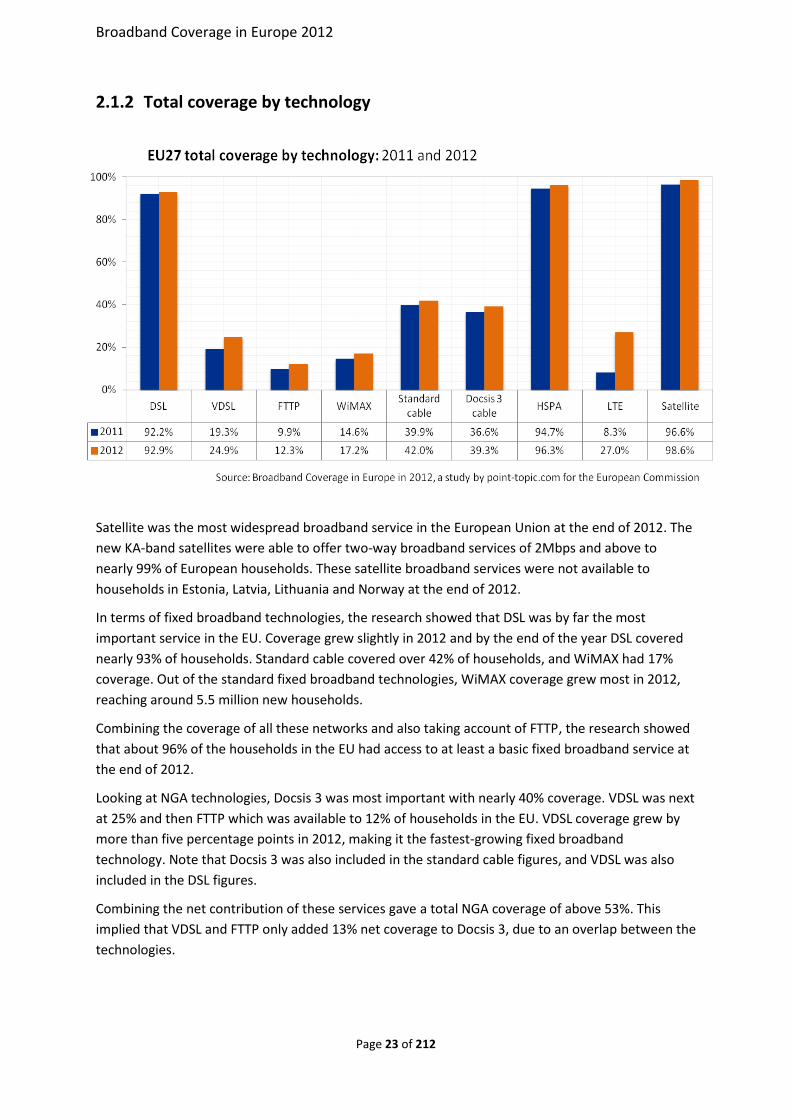
Satellite was the most widespread broadband service in the European Union at the end of 2012. The
new KA-band satellites were able to offer two-way broadband services of 2Mbps and above to
nearly 99% of European households. These satellite broadband services were not available to
households in Estonia, Latvia, Lithuania and Norway at the end of 2012.
In terms of fixed broadband technologies, the research showed that DSL was by far the most
important service in the EU. Coverage grew slightly in 2012 and by the end of the year DSL covered
nearly 93% of households. Standard cable covered over 42% of households, and WiMAX had 17%
coverage. Out of the standard fixed broadband technologies, WiMAX coverage grew most in 2012,
reaching around 5.5 million new households.
Combining the coverage of all these networks and also taking account of FTTP, the research showed
that about 96% of the households in the EU had access to at least a basic fixed broadband service at
the end of 2012.
Looking at NGA technologies, Docsis 3 was most important with nearly 40% coverage. VDSL was next
at 25% and then FTTP which was available to 12% of households in the EU. VDSL coverage grew by
more than five percentage points in 2012, making it the fastest-growing fixed broadband
technology. Note that Docsis 3 was also included in the standard cable figures, and VDSL was also
included in the DSL figures.
Combining the net contribution of these services gave a total NGA coverage of above 53%. This
implied that VDSL and FTTP only added 13% net coverage to Docsis 3, due to an overlap between the
technologies.
Broadband Coverage in Europe 2012
Page 24 of 212
As for mobile broadband, HSPA covered nearly all of the European Union or more than 96% of
households. LTE coverage grew rapidly in 2012, and the service is now available to 27% of EU
households.
2.1.3 Rural coverage by technology
Besides researching the total coverage of broadband technologies the BCE 2012 project was also
tasked to provide data on the coverage of rural areas in the European Union. Using its European
Kilometre Grid, Point Topic estimated that 15% of households within the study countries are rural.
Because of the financial barriers to supplying broadband in areas of low population density, the rural
parts of Europe are expected to present the most difficulty for achieving both the basic broadband
and the 30Mbps Digital Agenda objective.
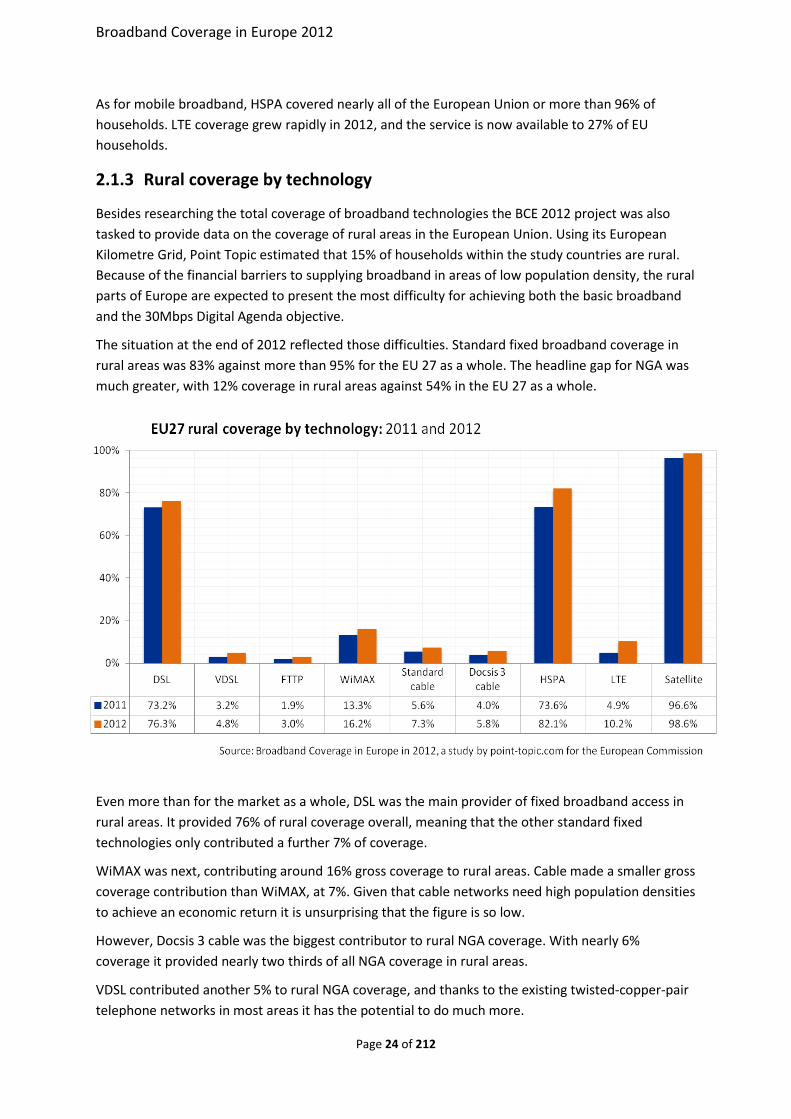
The situation at the end of 2012 reflected those difficulties. Standard fixed broadband coverage in
rural areas was 83% against more than 95% for the EU 27 as a whole. The headline gap for NGA was
much greater, with 12% coverage in rural areas against 54% in the EU 27 as a whole.
Even more than for the market as a whole, DSL was the main provider of fixed broadband access in
rural areas. It provided 76% of rural coverage overall, meaning that the other standard fixed
technologies only contributed a further 7% of coverage.
WiMAX was next, contributing around 16% gross coverage to rural areas. Cable made a smaller gross
coverage contribution than WiMAX, at 7%. Given that cable networks need high population densities
to achieve an economic return it is unsurprising that the figure is so low.
However, Docsis 3 cable was the biggest contributor to rural NGA coverage. With nearly 6%
coverage it provided nearly two thirds of all NGA coverage in rural areas.
VDSL contributed another 5% to rural NGA coverage, and thanks to the existing twisted-copper-pair
telephone networks in most areas it has the potential to do much more.
Broadband Coverage in Europe 2012
Page 25 of 212
FTTP made the smallest contribution to rural NGA with 3% coverage, as would be expected from its
economics. This total may be understated slightly because of the incidence of very small FTTP
projects which fell below the size required for inclusion in the BCE 2012 research.
One positive factor for NGA coverage in rural areas was that where networks did exist they were
much more likely to be complementary than in the market as a whole. Rural VDSL, FTTP and Docsis 3
together had a gross coverage of 14.6% and Point Topic estimated their net coverage at 13.3%,
which was 91% efficient in terms of avoiding overlaps.
HSPA covered nearly as many rural households as all standard fixed broadband services, with 82%
coverage compared with 83% for the standard fixed combination. Combined, the rural coverage of
fixed-line and mobile services was 91%, implying that HSPA was the only service available to 9% of
rural households at the end of 2012.
LTE covered over 10% of rural households. Sweden provided the highest rural LTE coverage in the
European Union, followed by Germany. In Portugal and Estonia LTE also covered more than 30% of
rural households. Across the rest of Europe, LTE was still to make any real impact on coverage in
rural areas.
Satellite achieved the same percentage coverage in rural areas as for whole countries; its capabilities
are better suited to rural demand.
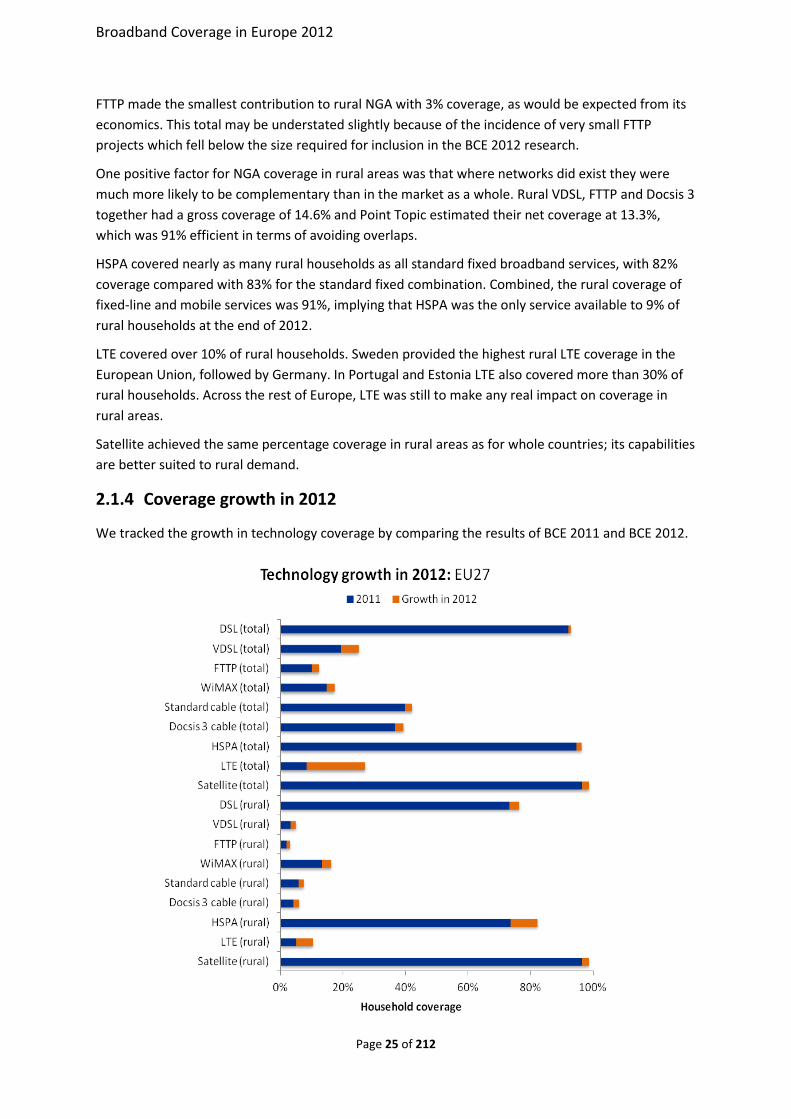
2.1.4 Coverage growth in 2012
We tracked the growth in technology coverage by comparing the results of BCE 2011 and BCE 2012.
Broadband Coverage in Europe 2012
Page 26 of 212
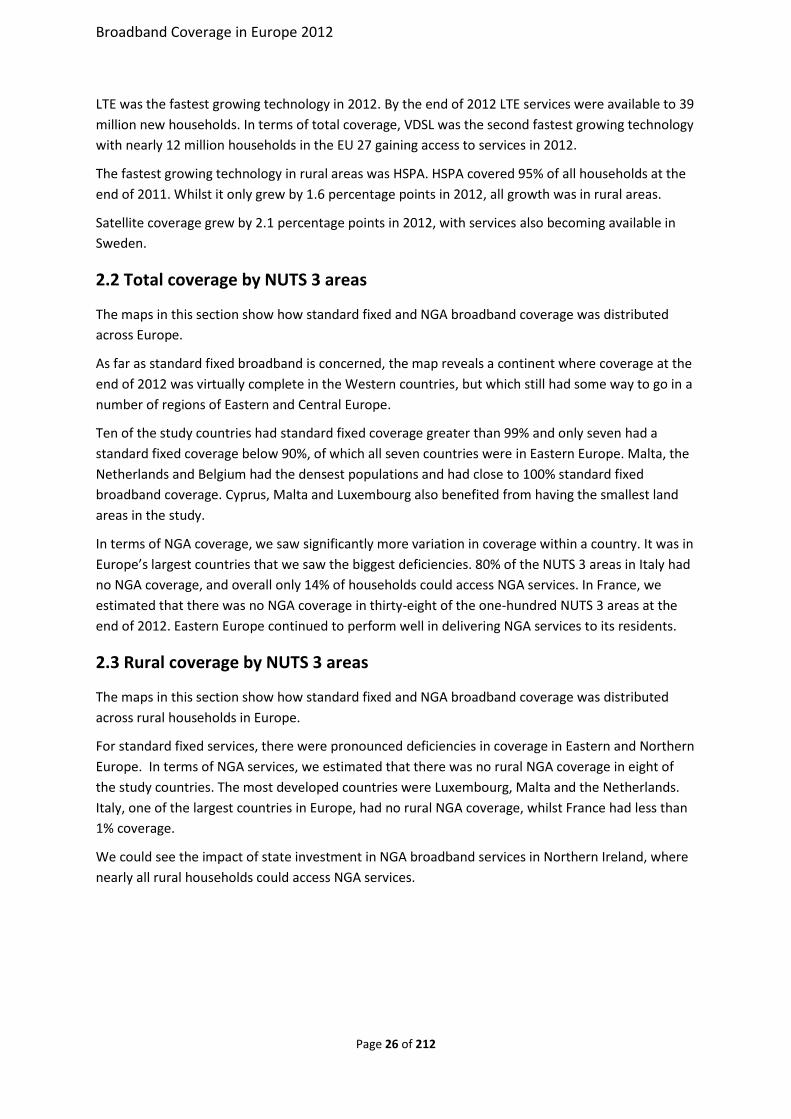
LTE was the fastest growing technology in 2012. By the end of 2012 LTE services were available to 39
million new households. In terms of total coverage, VDSL was the second fastest growing technology
with nearly 12 million households in the EU 27 gaining access to services in 2012.
The fastest growing technology in rural areas was HSPA. HSPA covered 95% of all households at the
end of 2011. Whilst it only grew by 1.6 percentage points in 2012, all growth was in rural areas.
Satellite coverage grew by 2.1 percentage points in 2012, with services also becoming available in
Sweden.
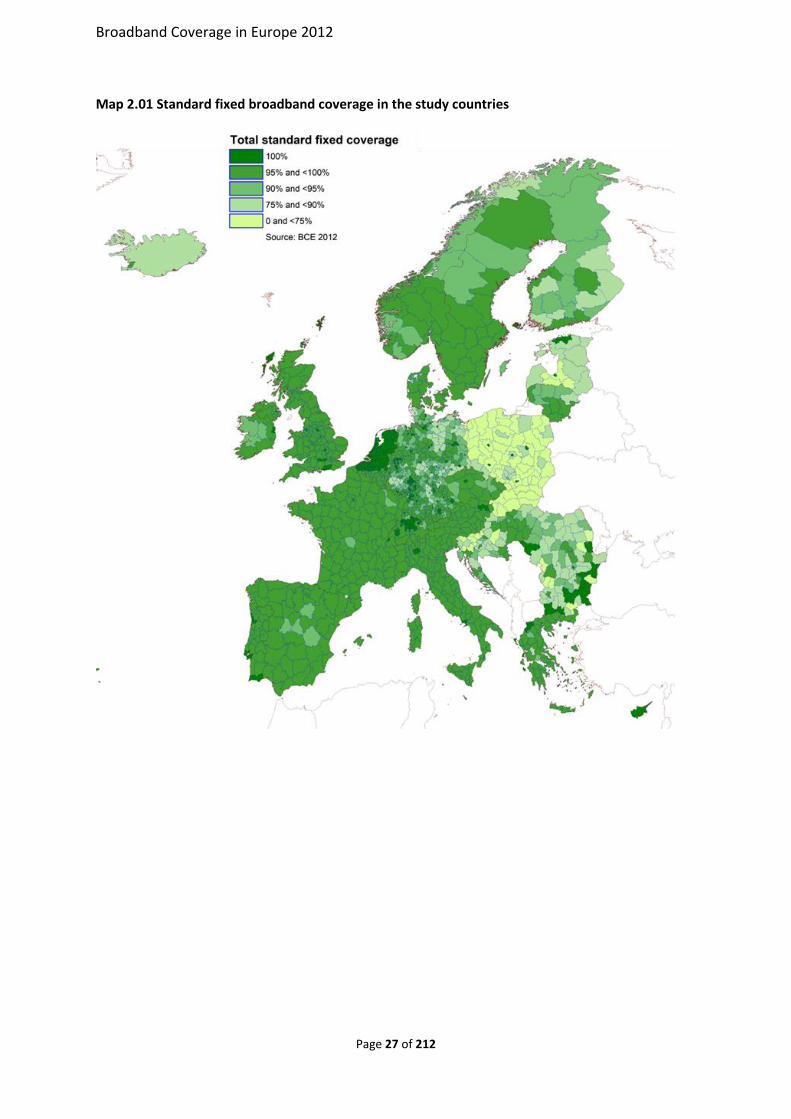
2.2 Total coverage by NUTS 3 areas
The maps in this section show how standard fixed and NGA broadband coverage was distributed
across Europe.
As far as standard fixed broadband is concerned, the map reveals a continent where coverage at the
end of 2012 was virtually complete in the Western countries, but which still had some way to go in a
number of regions of Eastern and Central Europe.
Ten of the study countries had standard fixed coverage greater than 99% and only seven had a
standard fixed coverage below 90%, of which all seven countries were in Eastern Europe. Malta, the
Netherlands and Belgium had the densest populations and had close to 100% standard fixed
broadband coverage. Cyprus, Malta and Luxembourg also benefited from having the smallest land
areas in the study.
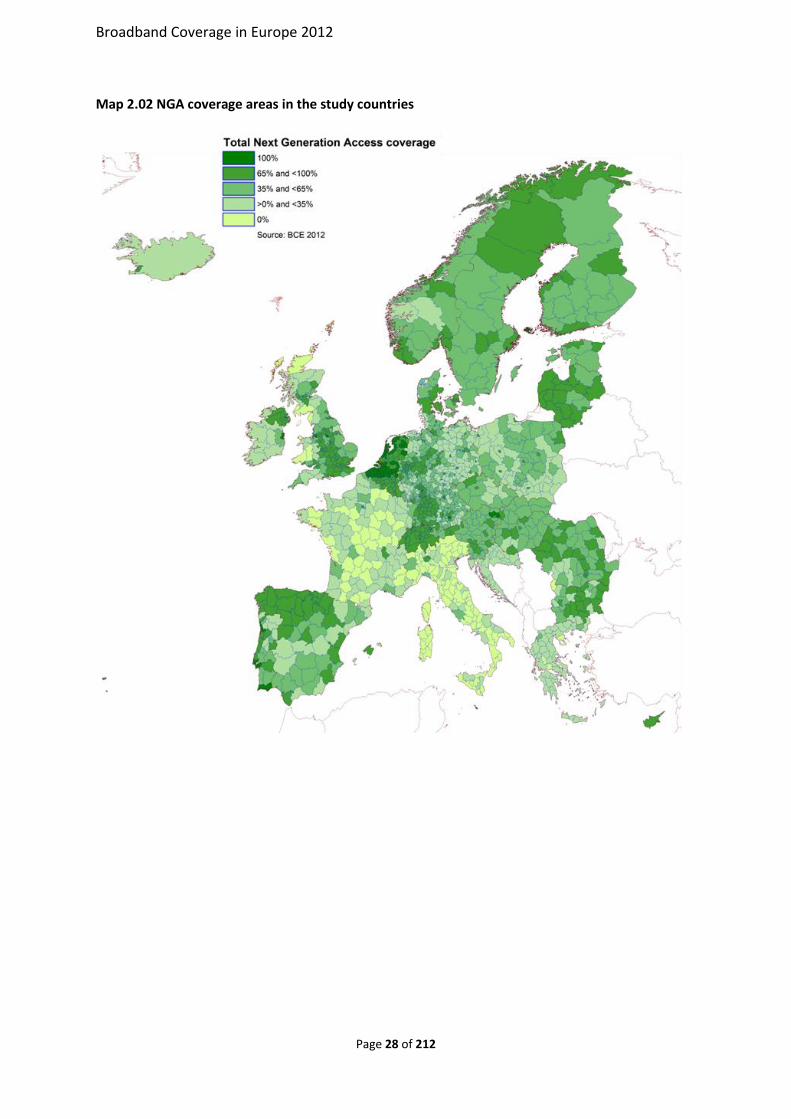
In terms of NGA coverage, we saw significantly more variation in coverage within a country. It was in
Europe’s largest countries that we saw the biggest deficiencies. 80% of the NUTS 3 areas in Italy had
no NGA coverage, and overall only 14% of households could access NGA services. In France, we
estimated that there was no NGA coverage in thirty-eight of the one-hundred NUTS 3 areas at the
end of 2012. Eastern Europe continued to perform well in delivering NGA services to its residents.
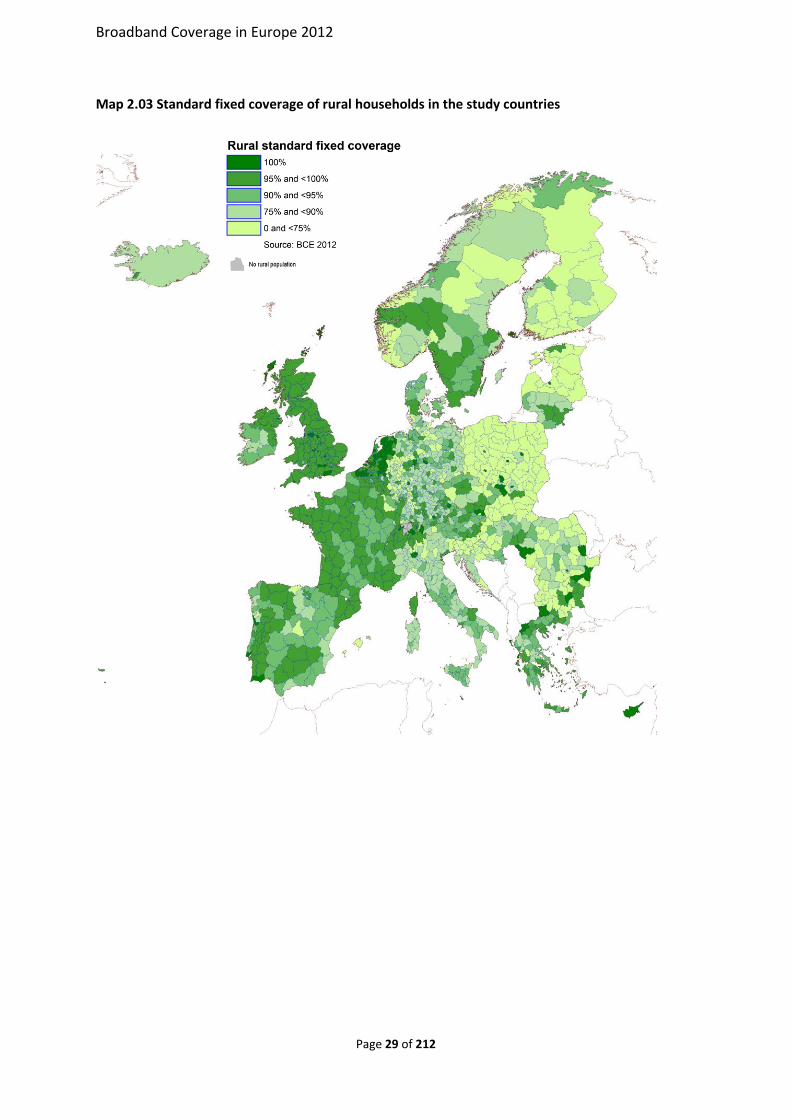
2.3 Rural coverage by NUTS 3 areas
The maps in this section show how standard fixed and NGA broadband coverage was distributed
across rural households in Europe.
For standard fixed services, there were pronounced deficiencies in coverage in Eastern and Northern
Europe. In terms of NGA services, we estimated that there was no rural NGA coverage in eight of
the study countries. The most developed countries were Luxembourg, Malta and the Netherlands.
Italy, one of the largest countries in Europe, had no rural NGA coverage, whilst France had less than
1% coverage.
We could see the impact of state investment in NGA broadband services in Northern Ireland, where
nearly all rural households could access NGA services.
Broadband Coverage in Europe 2012
Page 27 of 212
Map 2.01 Standard fixed broadband coverage in the study countries
Broadband Coverage in Europe 2012
Page 28 of 212
Map 2.02 NGA coverage areas in the study countries
Broadband Coverage in Europe 2012
Page 29 of 212
Map 2.03 Standard fixed coverage of rural households in the study countries
Broadband Coverage in Europe 2012
Page 30 of 212
Map 2.04 NGA coverage of rural households in the study countries
Broadband Coverage in Europe 2012
Page 31 of 212
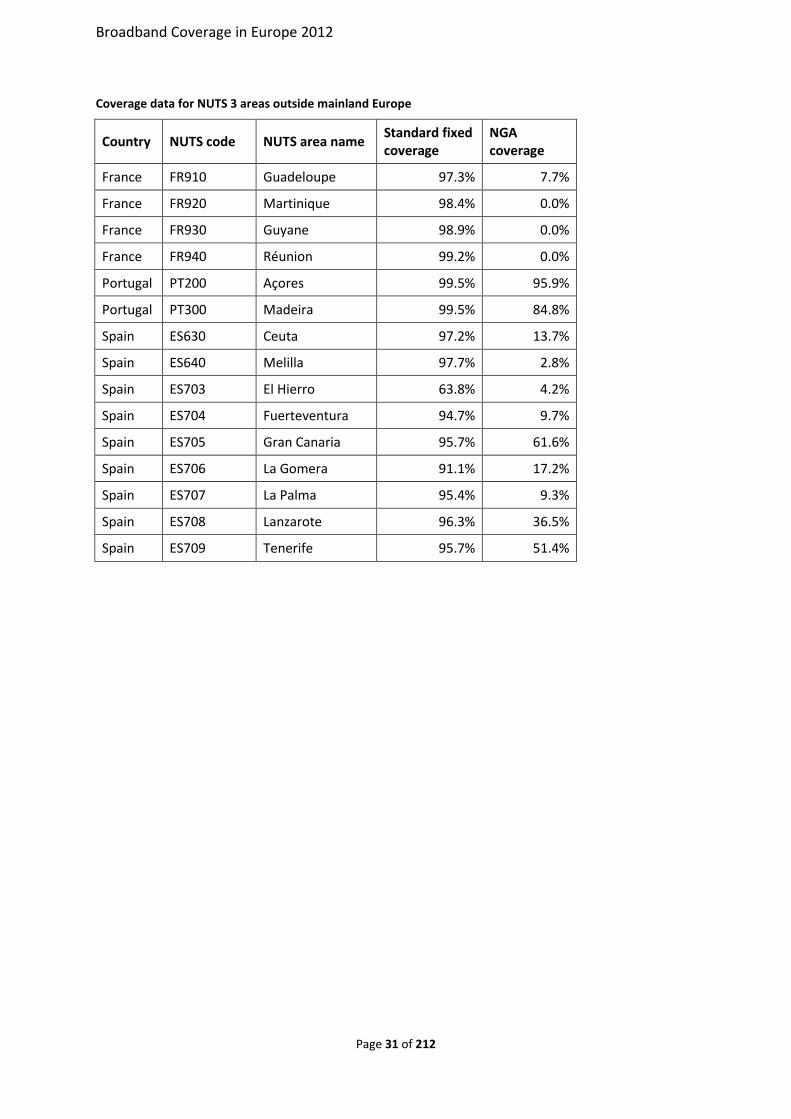
Coverage data for NUTS 3 areas outside mainland Europe
Country NUTS code NUTS area name Standard fixed coverage
NGA coverage
France FR910 Guadeloupe 97.3% 7.7%
France FR920 Martinique 98.4% 0.0%
France FR930 Guyane 98.9% 0.0%
France FR940 Réunion 99.2% 0.0%
Portugal PT200 Açores 99.5% 95.9%
Portugal PT300 Madeira 99.5% 84.8%
Spain ES630 Ceuta 97.2% 13.7%
Spain ES640 Melilla 97.7% 2.8%
Spain ES703 El Hierro 63.8% 4.2%
Spain ES704 Fuerteventura 94.7% 9.7%
Spain ES705 Gran Canaria 95.7% 61.6%
Spain ES706 La Gomera 91.1% 17.2%
Spain ES707 La Palma 95.4% 9.3%
Spain ES708 Lanzarote 96.3% 36.5%
Spain ES709 Tenerife 95.7% 51.4%
Broadband Coverage in Europe 2012
Page 32 of 212
2.4 Country comparisons of total coverage
2.4.1 Standard fixed technologies
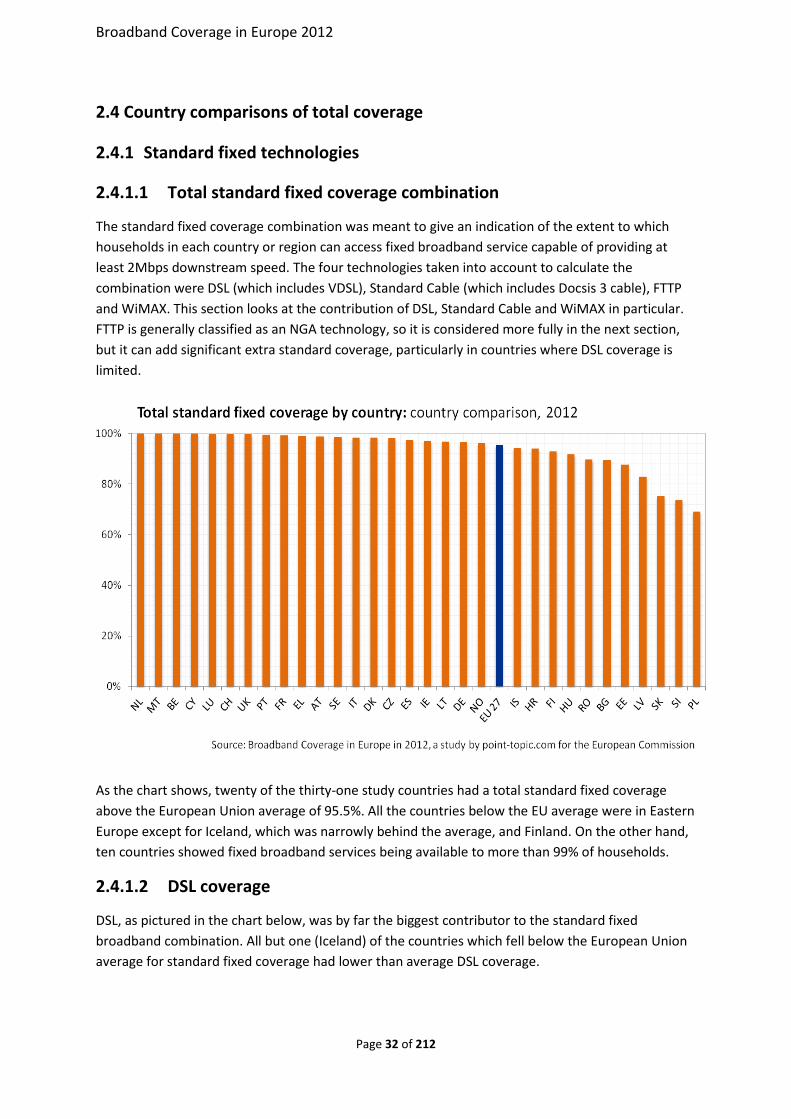
2.4.1.1 Total standard fixed coverage combination
The standard fixed coverage combination was meant to give an indication of the extent to which
households in each country or region can access fixed broadband service capable of providing at
least 2Mbps downstream speed. The four technologies taken into account to calculate the
combination were DSL (which includes VDSL), Standard Cable (which includes Docsis 3 cable), FTTP
and WiMAX. This section looks at the contribution of DSL, Standard Cable and WiMAX in particular.
FTTP is generally classified as an NGA technology, so it is considered more fully in the next section,
but it can add significant extra standard coverage, particularly in countries where DSL coverage is
limited.
As the chart shows, twenty of the thirty-one study countries had a total standard fixed coverage
above the European Union average of 95.5%. All the countries below the EU average were in Eastern
Europe except for Iceland, which was narrowly behind the average, and Finland. On the other hand,
ten countries showed fixed broadband services being available to more than 99% of households.
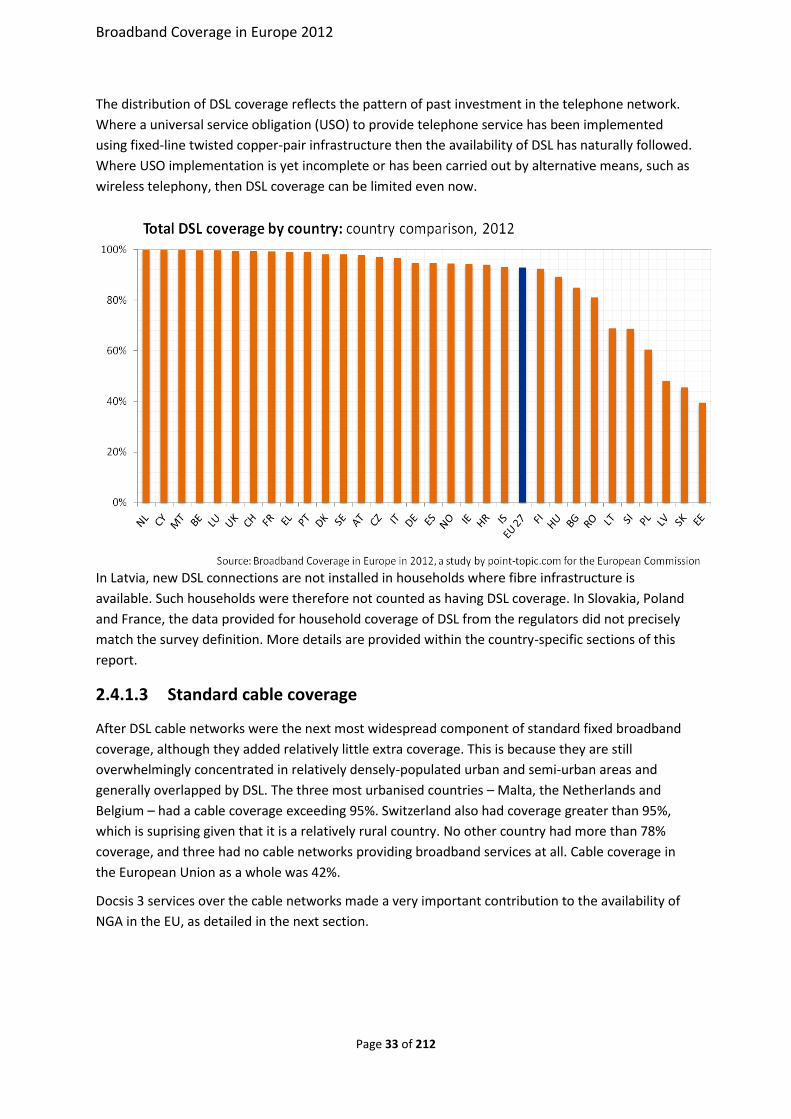
2.4.1.2 DSL coverage
DSL, as pictured in the chart below, was by far the biggest contributor to the standard fixed
broadband combination. All but one (Iceland) of the countries which fell below the European Union
average for standard fixed coverage had lower than average DSL coverage.
Broadband Coverage in Europe 2012
Page 33 of 212
The distribution of DSL coverage reflects the pattern of past investment in the telephone network.
Where a universal service obligation (USO) to provide telephone service has been implemented
using fixed-line twisted copper-pair infrastructure then the availability of DSL has naturally followed.
Where USO implementation is yet incomplete or has been carried out by alternative means, such as
wireless telephony, then DSL coverage can be limited even now.
In Latvia, new DSL connections are not installed in households where fibre infrastructure is
available. Such households were therefore not counted as having DSL coverage. In Slovakia, Poland
and France, the data provided for household coverage of DSL from the regulators did not precisely
match the survey definition. More details are provided within the country-specific sections of this
report.
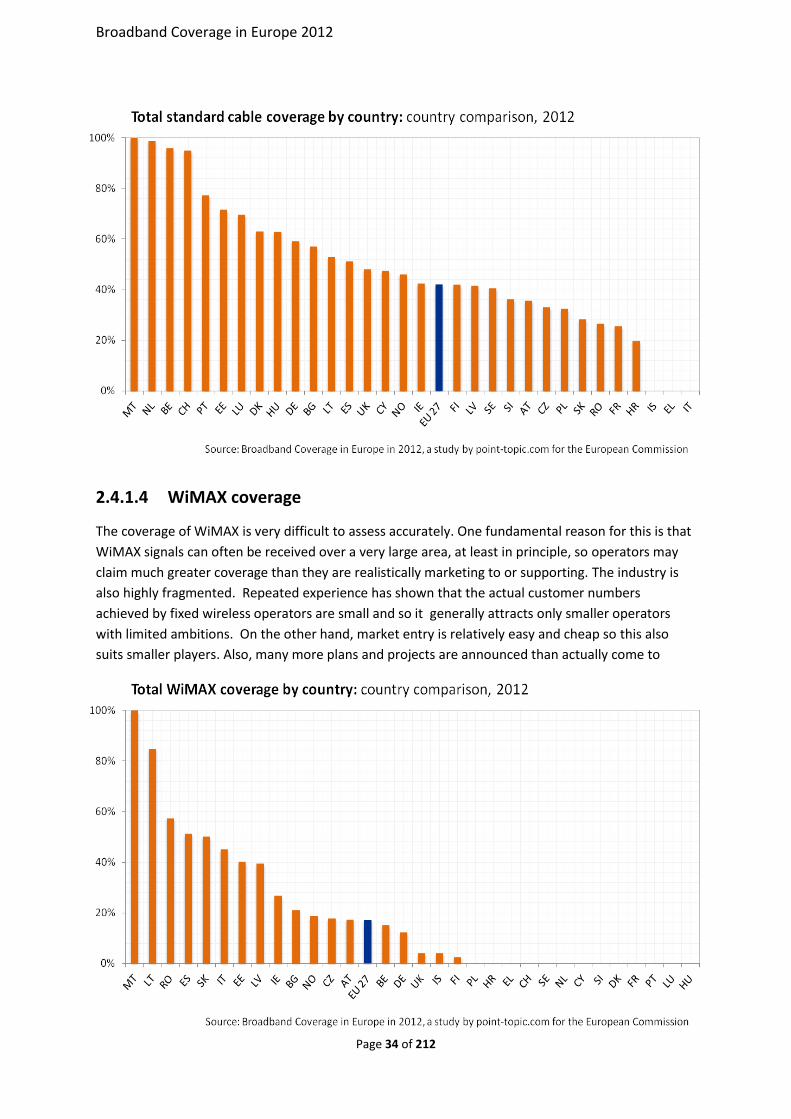
2.4.1.3 Standard cable coverage
After DSL cable networks were the next most widespread component of standard fixed broadband
coverage, although they added relatively little extra coverage. This is because they are still
overwhelmingly concentrated in relatively densely-populated urban and semi-urban areas and
generally overlapped by DSL. The three most urbanised countries – Malta, the Netherlands and
Belgium – had a cable coverage exceeding 95%. Switzerland also had coverage greater than 95%,
which is suprising given that it is a relatively rural country. No other country had more than 78%
coverage, and three had no cable networks providing broadband services at all. Cable coverage in
the European Union as a whole was 42%.
Docsis 3 services over the cable networks made a very important contribution to the availability of
NGA in the EU, as detailed in the next section.
Broadband Coverage in Europe 2012
Page 34 of 212
2.4.1.4 WiMAX coverage
The coverage of WiMAX is very difficult to assess accurately. One fundamental reason for this is that
WiMAX signals can often be received over a very large area, at least in principle, so operators may
claim much greater coverage than they are realistically marketing to or supporting. The industry is
also highly fragmented. Repeated experience has shown that the actual customer numbers
achieved by fixed wireless operators are small and so it generally attracts only smaller operators
with limited ambitions. On the other hand, market entry is relatively easy and cheap so this also
suits smaller players. Also, many more plans and projects are announced than actually come to
Broadband Coverage in Europe 2012
Page 35 of 212
fruition and survive.
Still, WiMAX did play an important role in some countries, filling in gaps or providing a competitive
alternative to the bigger networks. For example, Lithuania, Romania, Slovakia, Estonia and Latvia all
had more than 35% coverage, which helped to offset the low coverage provided by DSL services.
WiMAX did add some coverage to standard fixed coverage where other networks were limited but it
was not a major factor.
In ten countries the project found no active WiMAX services available at all. This now includes
Denmark where the single provider of the technology went bankrupt in 2012, leaving the country
without any WiMAX coverage.
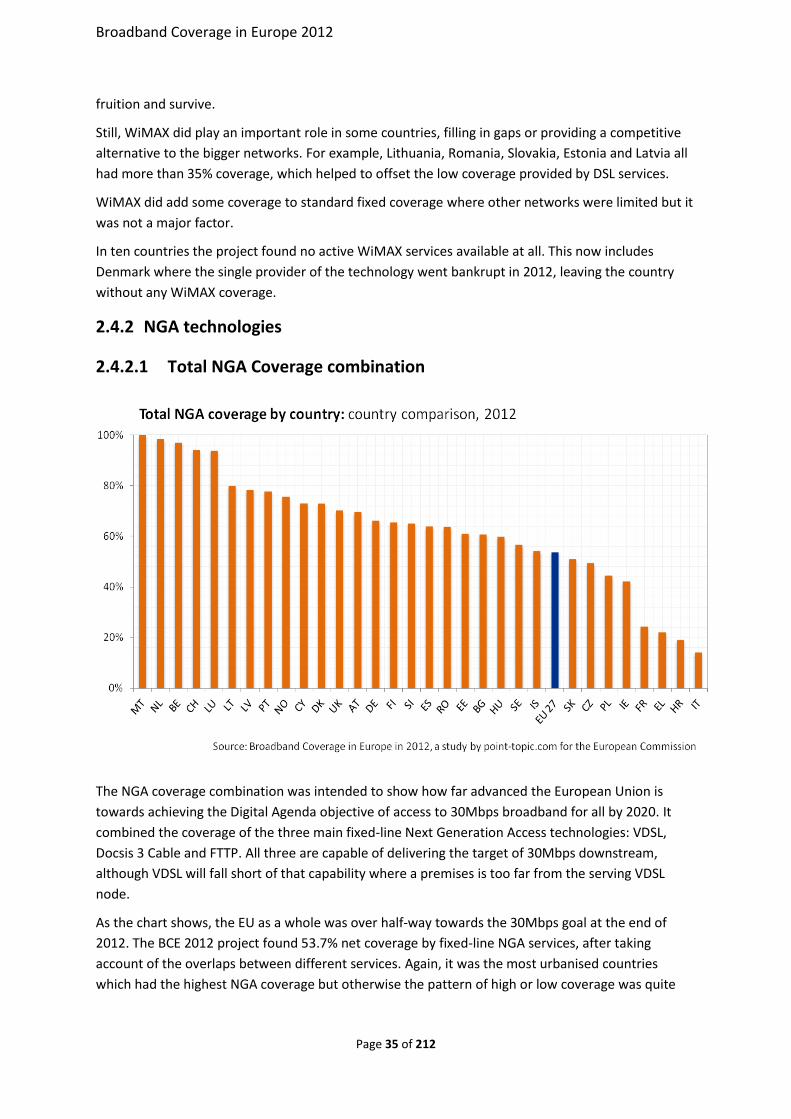
2.4.2 NGA technologies
2.4.2.1 Total NGA Coverage combination
The NGA coverage combination was intended to show how far advanced the European Union is
towards achieving the Digital Agenda objective of access to 30Mbps broadband for all by 2020. It
combined the coverage of the three main fixed-line Next Generation Access technologies: VDSL,
Docsis 3 Cable and FTTP. All three are capable of delivering the target of 30Mbps downstream,
although VDSL will fall short of that capability where a premises is too far from the serving VDSL
node.
As the chart shows, the EU as a whole was over half-way towards the 30Mbps goal at the end of
2012. The BCE 2012 project found 53.7% net coverage by fixed-line NGA services, after taking
account of the overlaps between different services. Again, it was the most urbanised countries
which had the highest NGA coverage but otherwise the pattern of high or low coverage was quite
Broadband Coverage in Europe 2012
Page 36 of 212
mixed. Countries with above average NGA coverage were found in all quarters of Europe, reflecting
the effects of different development policies, infrastructure needs and technology choices.
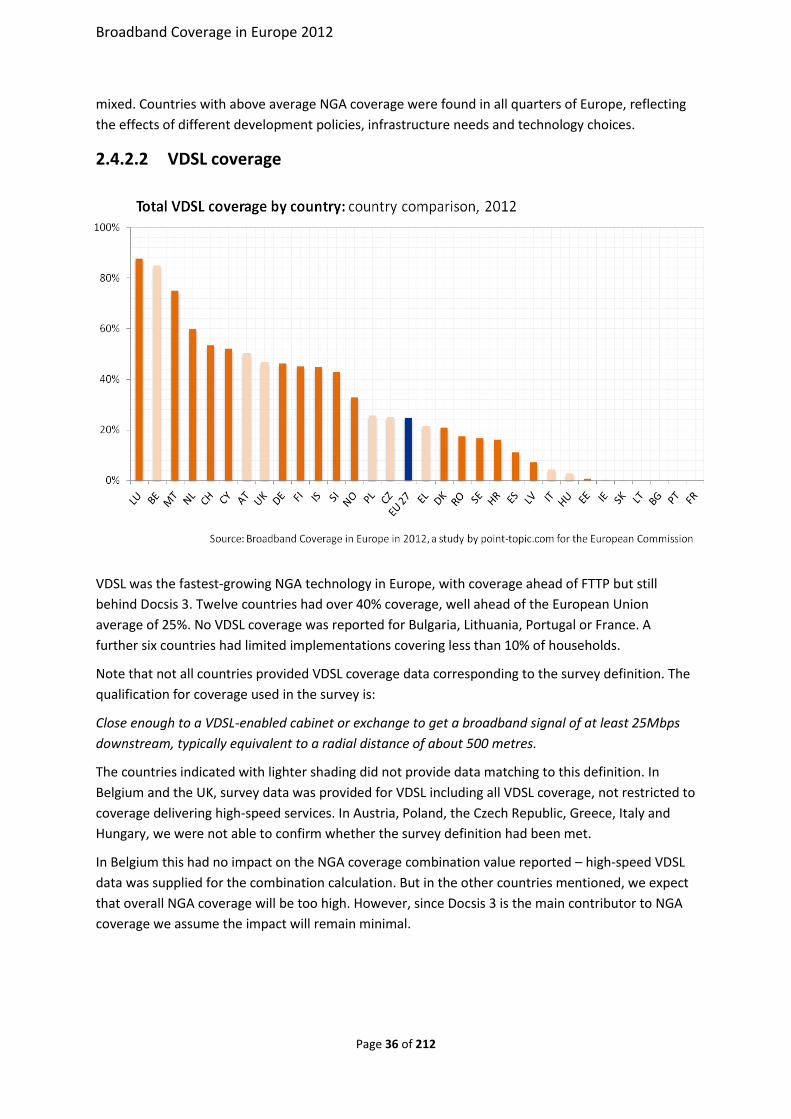
2.4.2.2 VDSL coverage
VDSL was the fastest-growing NGA technology in Europe, with coverage ahead of FTTP but still
behind Docsis 3. Twelve countries had over 40% coverage, well ahead of the European Union
average of 25%. No VDSL coverage was reported for Bulgaria, Lithuania, Portugal or France. A
further six countries had limited implementations covering less than 10% of households.
Note that not all countries provided VDSL coverage data corresponding to the survey definition. The
qualification for coverage used in the survey is:
Close enough to a VDSL-enabled cabinet or exchange to get a broadband signal of at least 25Mbps
downstream, typically equivalent to a radial distance of about 500 metres.
The countries indicated with lighter shading did not provide data matching to this definition. In
Belgium and the UK, survey data was provided for VDSL including all VDSL coverage, not restricted to
coverage delivering high-speed services. In Austria, Poland, the Czech Republic, Greece, Italy and
Hungary, we were not able to confirm whether the survey definition had been met.
In Belgium this had no impact on the NGA coverage combination value reported – high-speed VDSL
data was supplied for the combination calculation. But in the other countries mentioned, we expect
that overall NGA coverage will be too high. However, since Docsis 3 is the main contributor to NGA
coverage we assume the impact will remain minimal.

Broadband Coverage in Europe 2012
Page 37 of 212
2.4.2.3 FTTP coverage
FTTP coverage was largest in Eastern Europe, where the immediate need is greatest – because of the
limitations of other networks – and the residential building stock is most favourable. A large
proportion of housing in these countries consists of flats in system-built blocks, typically forty per
block. It is often economically attractive to run optical fibre to a single block, or even a group of
them, and then distribute broadband service over local networks provided by VDSL, Ethernet or
even FTTH technology. (In-building VDSL distribution is not generally included in the definition of
VDSL coverage for this project.)
In Lithuania and Latvia nearly 80% of households were covered by FTTP. Most of the other Eastern
European countries were above the European Union average of 12.3% as well. The five Nordic
countries had also made a heavy commitment to fibre, all at more than twice the EU average.
Portugal, Luxembourg, Spain, the Netherlands and Swizterland also posted higher than average FTTP
coverage at the end of 2012.
At the other end of the scale, there was no reported FTTP coverage in Cyprus and seven more
countries had less than 5% of households covered.
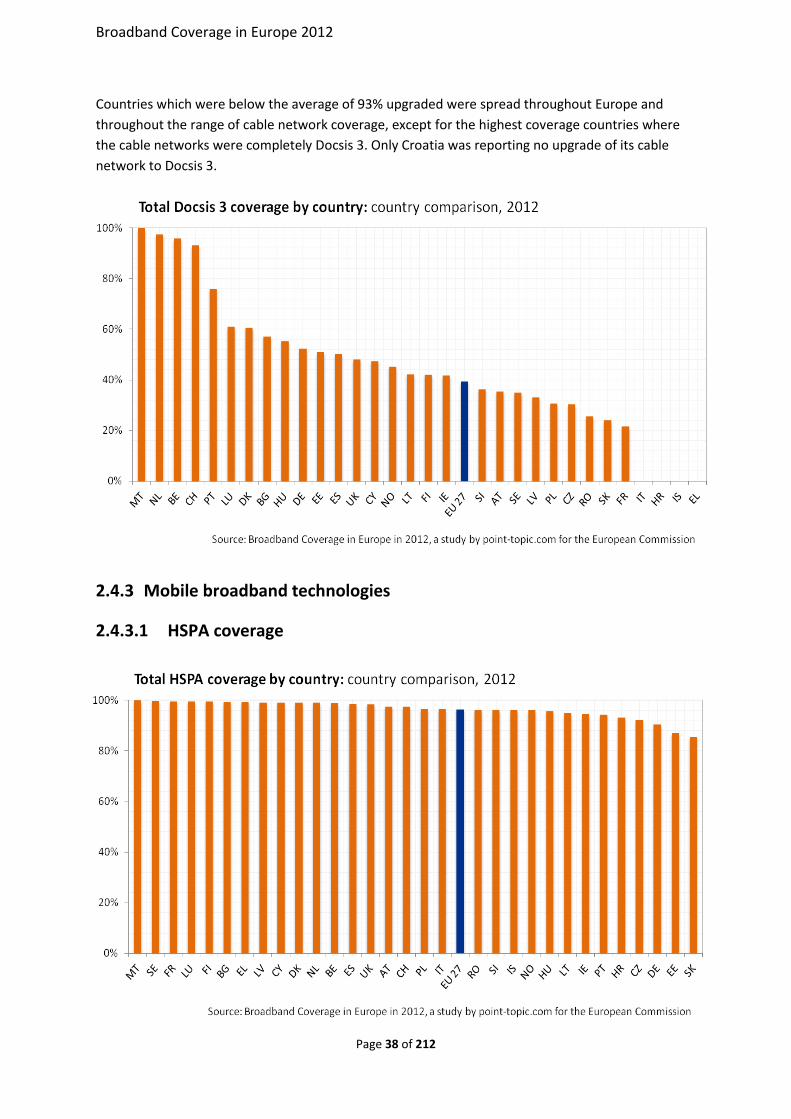
2.4.2.4 Docsis 3 coverage
The European Union’s cable networks have mostly proved able to upgrade quite quickly to Docsis 3
with download speeds of at least 30Mbps evolving towards 100Mbps and above. Across the EU 27 as
a whole over 93% of cable network coverage was Docsis 3 at the end of 2012. Seven countries
reported a complete upgrade and a further nine over 95%, with the others ranging from 71% to 95%.
The proportion will certainly increase over the next few years but some areas will not be suitable for
upgrading. At least one cable operator has closed network segments which it is unable to upgrade.
Broadband Coverage in Europe 2012
Page 38 of 212
Countries which were below the average of 93% upgraded were spread throughout Europe and
throughout the range of cable network coverage, except for the highest coverage countries where
the cable networks were completely Docsis 3. Only Croatia was reporting no upgrade of its cable
network to Docsis 3.
2.4.3 Mobile broadband technologies
2.4.3.1 HSPA coverage
Broadband Coverage in Europe 2012
Page 39 of 212
HSPA has achieved a high degree of coverage across the EU in a relatively short time. Eighteen
countries were above the European Union average of 96.3% and none were below 85%. However,
this represents the mobile operators’ own reported coverage areas in most cases, which use varying
standards as far as actual performance is concerned. Where more rigorous standards were applied,
such as providing at least 1Mbps download speed, coverage areas were found to be lower. As most
users will know, actual performance can be intermittent even well inside expected coverage areas.
One issue with HSPA performance is whether coverage should be measured indoors or outdoors.
Point Topic set the default definition of coverage for the project as being for outdoors performance.
This is to reflect the situation where HSPA is being offered as a direct substitute for fixed-line
broadband to meet the Digital Agenda targets. In this case it is reasonable to assume that
households could cover the cost of an external aerial without making HSPA uncompetitive as a
broadband solution.
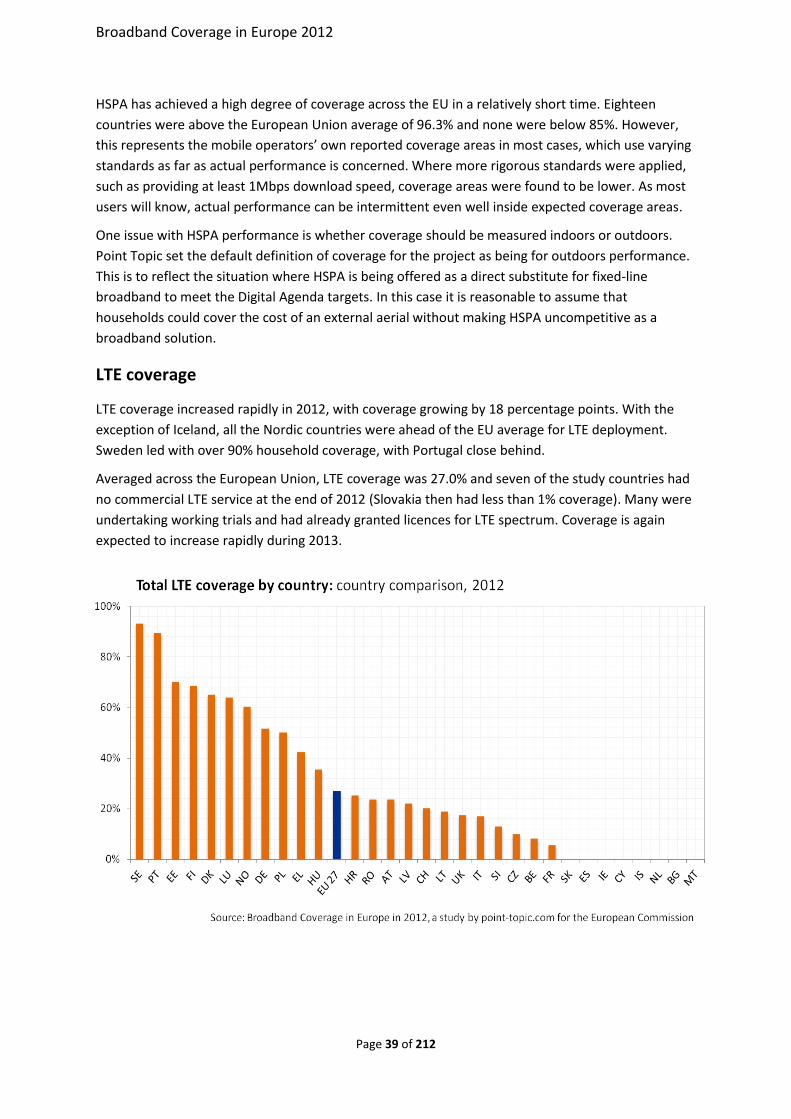
LTE coverage
LTE coverage increased rapidly in 2012, with coverage growing by 18 percentage points. With the
exception of Iceland, all the Nordic countries were ahead of the EU average for LTE deployment.
Sweden led with over 90% household coverage, with Portugal close behind.
Averaged across the European Union, LTE coverage was 27.0% and seven of the study countries had
no commercial LTE service at the end of 2012 (Slovakia then had less than 1% coverage). Many were
undertaking working trials and had already granted licences for LTE spectrum. Coverage is again
expected to increase rapidly during 2013.

Broadband Coverage in Europe 2012
Page 40 of 212
2.4.4 Satellite
All but four of the thirty-one countries surveyed had Ka-band satellite coverage and distribution for
consumer broadband services. The four exceptions are Estonia, Iceland, Latvia and Lithuania.
The project defined coverage as being 100%, in both urban and rural areas, in any country where
service was available from at least one KA-band satellite service provider and as 0% otherwise. On
this basis, twenty-seven countries have 100% coverage and four 0%. This gave an EU coverage
average of 98.6% for both urban and rural areas.
In every country with satellite coverage Point Topic also identified commercial distribution points,
meaning that services are available to the consumer.
Although broadband satellites can “see” virtually every household in the area covered by each beam
footprint, the total data bandwidth which any single beam can provide is limited. This means that
the number of users who can be supported by a single beam is limited by the average bandwidth
used by each user in peak hours. The maximum number of users per beam depends on many factors
and changes with time, but is often quoted as about 200,000. As a result, a satellite beam will not
necessarily have the capacity to serve all the unconnected premises it covers.
Note that satellite coverage was not separately researched for the overseas administrative areas of
the Study Countries which have them (France, Portugal and Spain). These areas were assumed to
enjoy the same satellite coverage as the rest of the country concerned.

Broadband Coverage in Europe 2012
Page 41 of 212
2.5 Country comparisons of rural coverage
2.5.1 Standard fixed technologies
2.5.1.1 Rural standard fixed coverage
Rural standard fixed coverage was usually much lower than total coverage. The European Union
average for total coverage was 95.5%, which fell to 83.2% for the rural equivalent. Coverage also fell
off much more sharply in the less well served countries. Twenty-one countries had rural fixed
broadband coverage above the EU average, but this then ranged down to as low as 11%.
All of the countries below the EU average for rural fixed broadband coverage were in Eastern
Europe, and also Finland.
On many occasions, real data on the coverage of rural households was not available from the
regulator or the operators. In such cases we estimated rural coverage, assuming that the coverage of
a technology within an area will only reach the rural parts if the urban or non-rural parts are 100%
covered. Where real data, reported by NRAs or operators, was available, it sometimes showed that
rural areas did have some coverage, typically just a few percent, even where non-rural areas were
not fully covered. Thus our estimates in the areas without actual data will sometimes understate
rural coverage slightly. This means that the implied coverage in non-rural areas is overstated by the
equivalent amount so that the figure for total coverage is not affected.
2.5.1.2 Rural DSL, Standard Cable and WiMAX coverage
Broadband Coverage in Europe 2012
Page 42 of 212
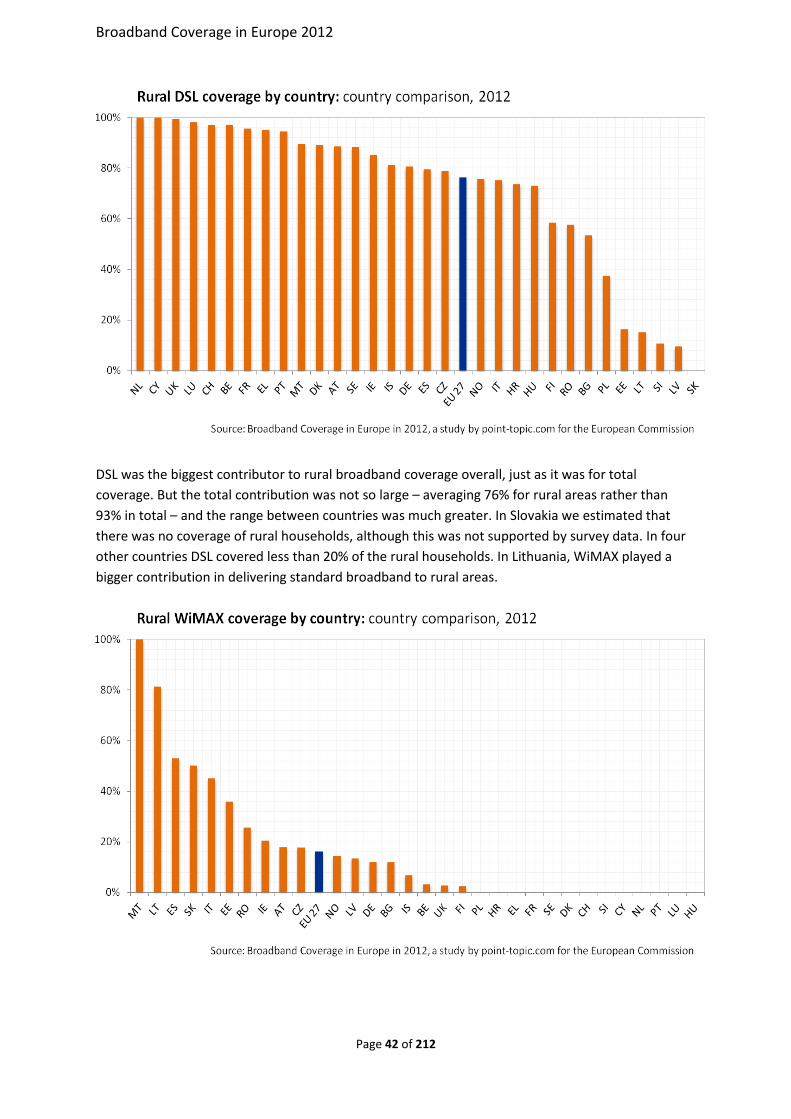
DSL was the biggest contributor to rural broadband coverage overall, just as it was for total
coverage. But the total contribution was not so large – averaging 76% for rural areas rather than
93% in total – and the range between countries was much greater. In Slovakia we estimated that
there was no coverage of rural households, although this was not supported by survey data. In four
other countries DSL covered less than 20% of the rural households. In Lithuania, WiMAX played a
bigger contribution in delivering standard broadband to rural areas.
Broadband Coverage in Europe 2012
Page 43 of 212
Rural WiMAX coverage followed a very similar pattern to total WiMAX coverage, and the percentage
difference was less than for other technologies. This is because WiMAX is assumed to cover urban
and rural areas equally where it is available. Even so, overall average rural coverage was quite low at
16.2%, and ten countries were found not to have any rural WiMAX coverage.
Note that rural networks providing broadband using earlier fixed wireless technologies were
available in many of these and the other study countries but were not included in the survey
because of their limited coverage and bandwidth capability.
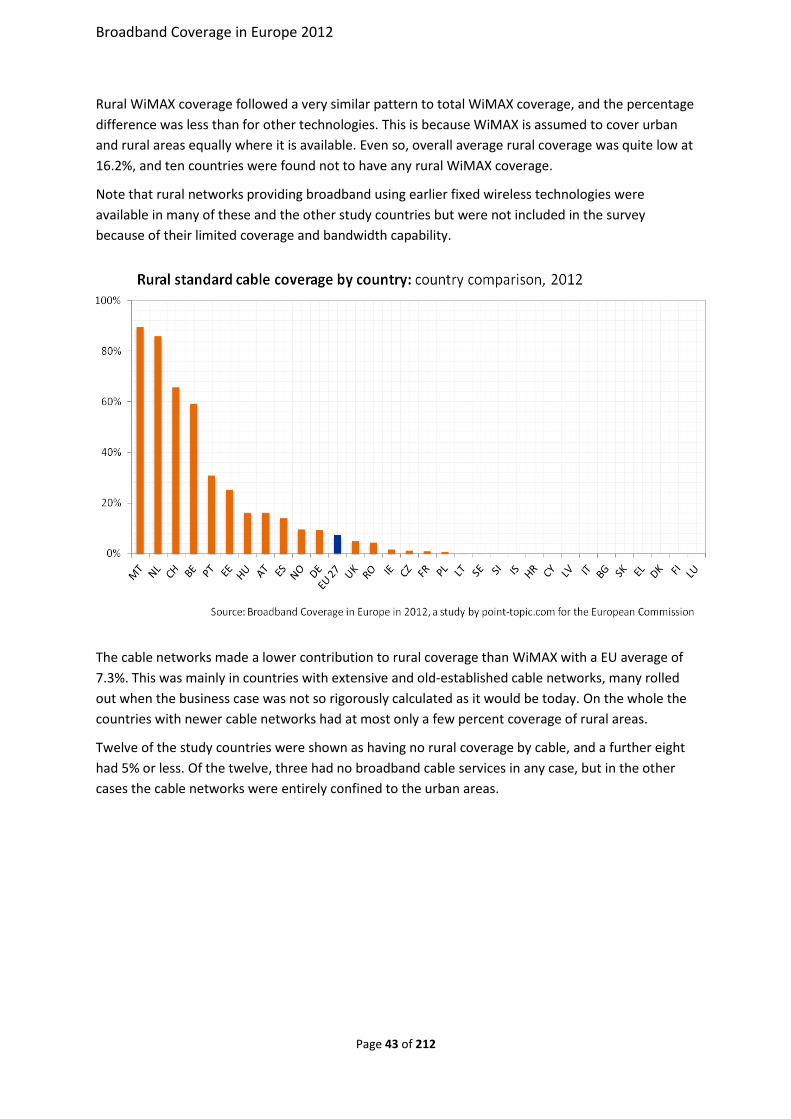
The cable networks made a lower contribution to rural coverage than WiMAX with a EU average of
7.3%. This was mainly in countries with extensive and old-established cable networks, many rolled
out when the business case was not so rigorously calculated as it would be today. On the whole the
countries with newer cable networks had at most only a few percent coverage of rural areas.
Twelve of the study countries were shown as having no rural coverage by cable, and a further eight
had 5% or less. Of the twelve, three had no broadband cable services in any case, but in the other
cases the cable networks were entirely confined to the urban areas.
Broadband Coverage in Europe 2012
Page 44 of 212
2.5.2 NGA technologies
2.5.2.1 Rural NGA coverage
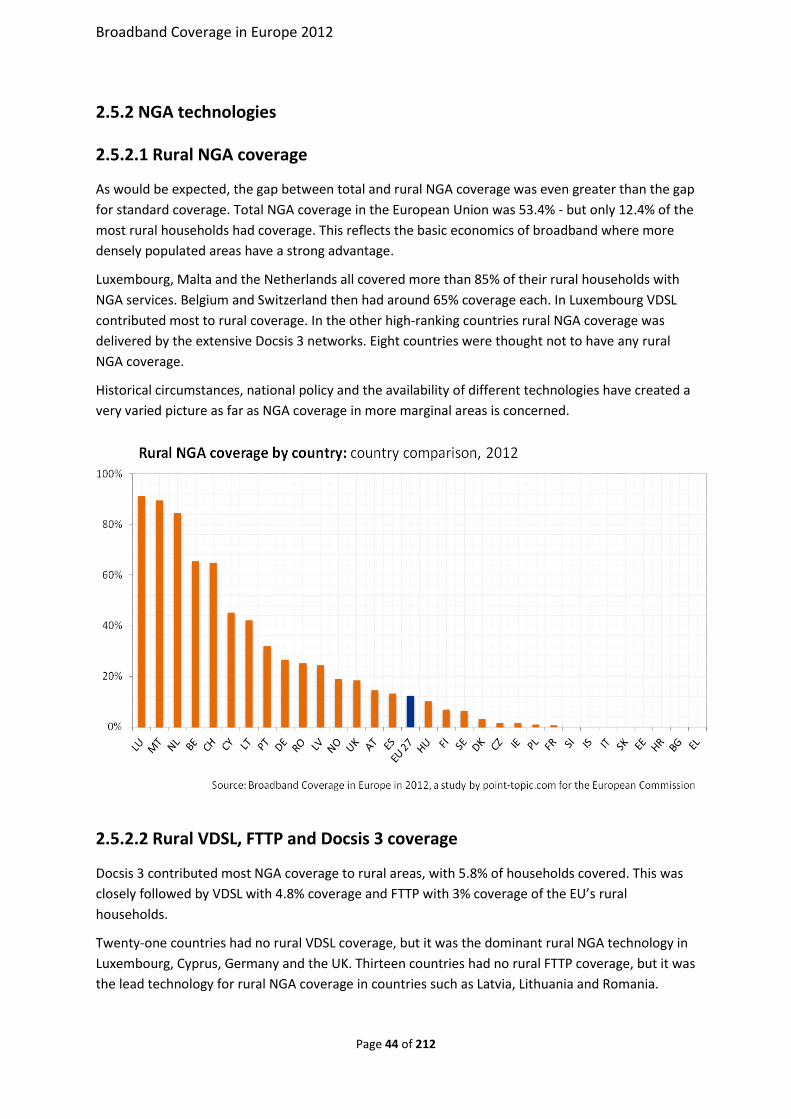
As would be expected, the gap between total and rural NGA coverage was even greater than the gap
for standard coverage. Total NGA coverage in the European Union was 53.4% - but only 12.4% of the
most rural households had coverage. This reflects the basic economics of broadband where more
densely populated areas have a strong advantage.
Luxembourg, Malta and the Netherlands all covered more than 85% of their rural households with
NGA services. Belgium and Switzerland then had around 65% coverage each. In Luxembourg VDSL
contributed most to rural coverage. In the other high-ranking countries rural NGA coverage was
delivered by the extensive Docsis 3 networks. Eight countries were thought not to have any rural
NGA coverage.
Historical circumstances, national policy and the availability of different technologies have created a
very varied picture as far as NGA coverage in more marginal areas is concerned.
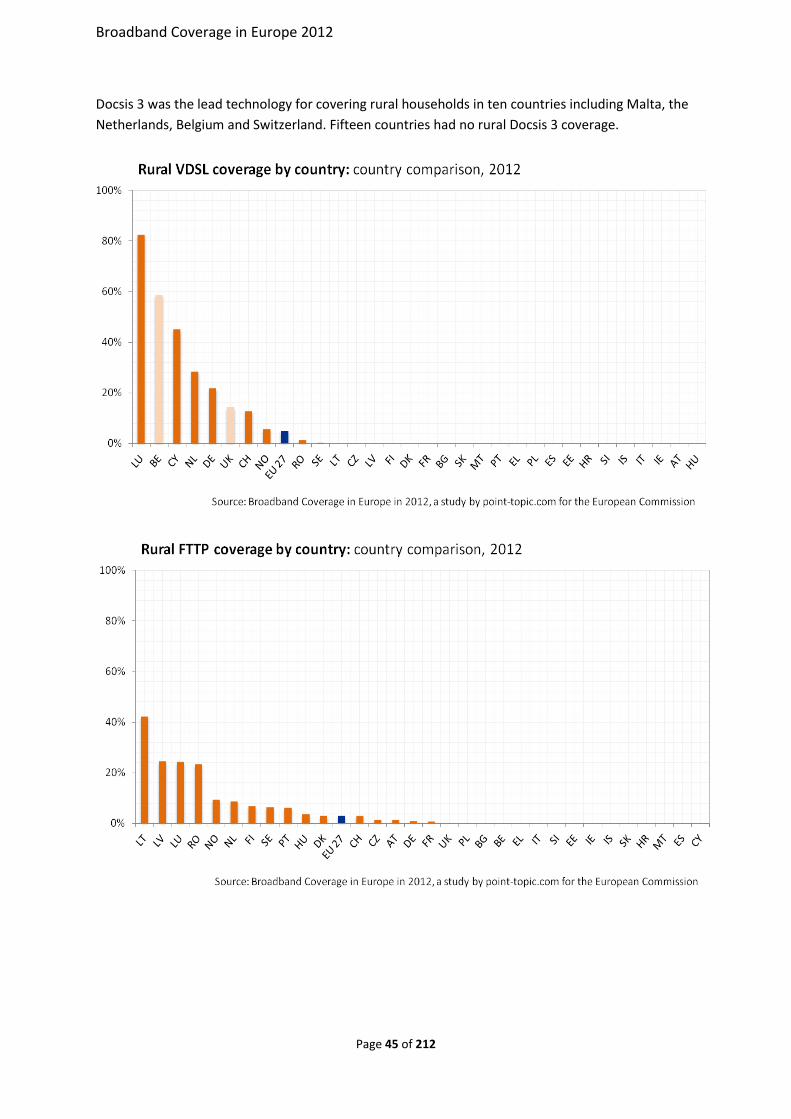
2.5.2.2 Rural VDSL, FTTP and Docsis 3 coverage
Docsis 3 contributed most NGA coverage to rural areas, with 5.8% of households covered. This was
closely followed by VDSL with 4.8% coverage and FTTP with 3% coverage of the EU’s rural
households.
Twenty-one countries had no rural VDSL coverage, but it was the dominant rural NGA technology in
Luxembourg, Cyprus, Germany and the UK. Thirteen countries had no rural FTTP coverage, but it was
the lead technology for rural NGA coverage in countries such as Latvia, Lithuania and Romania.
Broadband Coverage in Europe 2012
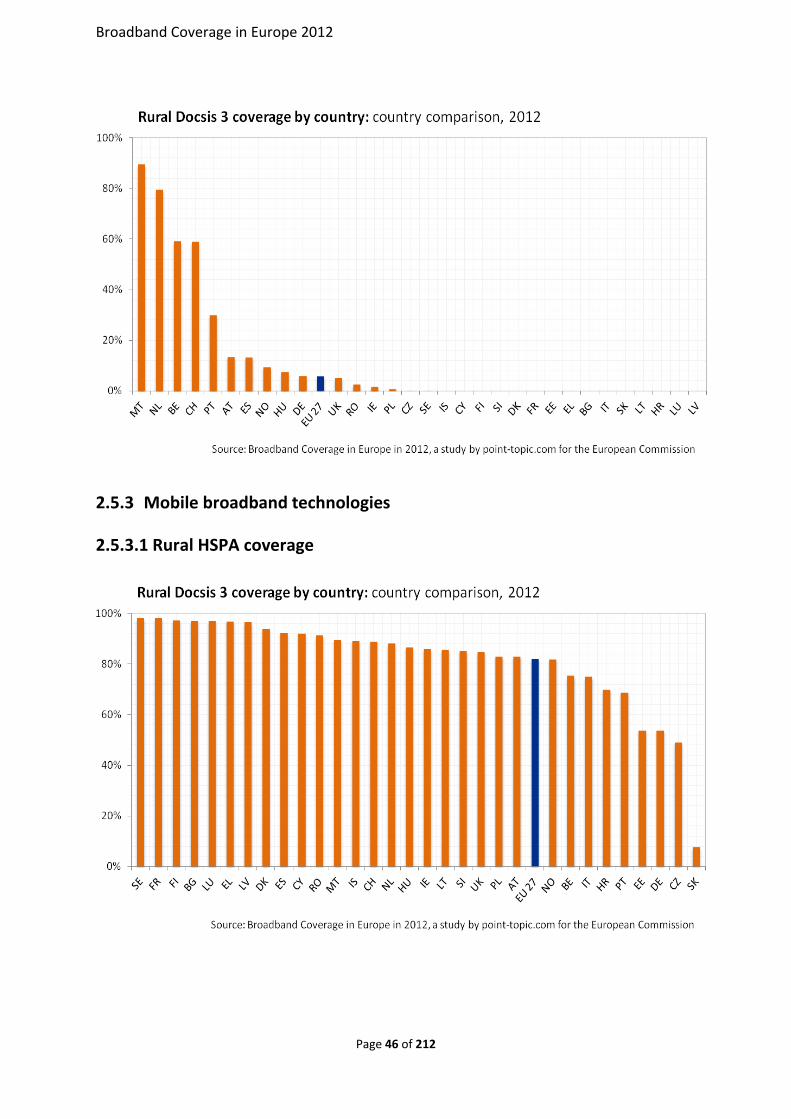
Page 45 of 212
Docsis 3 was the lead technology for covering rural households in ten countries including Malta, the
Netherlands, Belgium and Switzerland. Fifteen countries had no rural Docsis 3 coverage.
Broadband Coverage in Europe 2012
Page 46 of 212
2.5.3 Mobile broadband technologies
2.5.3.1 Rural HSPA coverage
Broadband Coverage in Europe 2012
Page 47 of 212
Leaving aside satellite services, HSPA provided the most extensive broadband coverage in rural
areas, ahead of DSL with 82% against 76%. HSPA almost provided the same amount of coverage in
rural areas as all the standard fixed broadband technologies.
On the other hand there was little information on the actual broadband performance delivered by
HSPA services in the more marginal areas. One clue was provided by the surprisingly low coverage
quoted by Germany. In this case coverage was defined by the ability to receive a download speed of
at least 1Mbps and was quoted at only 53.6%, well below that of most other country. No doubt the
coverage quoted in other countries would be considerably lower if it was subjected to the same
stringent test.
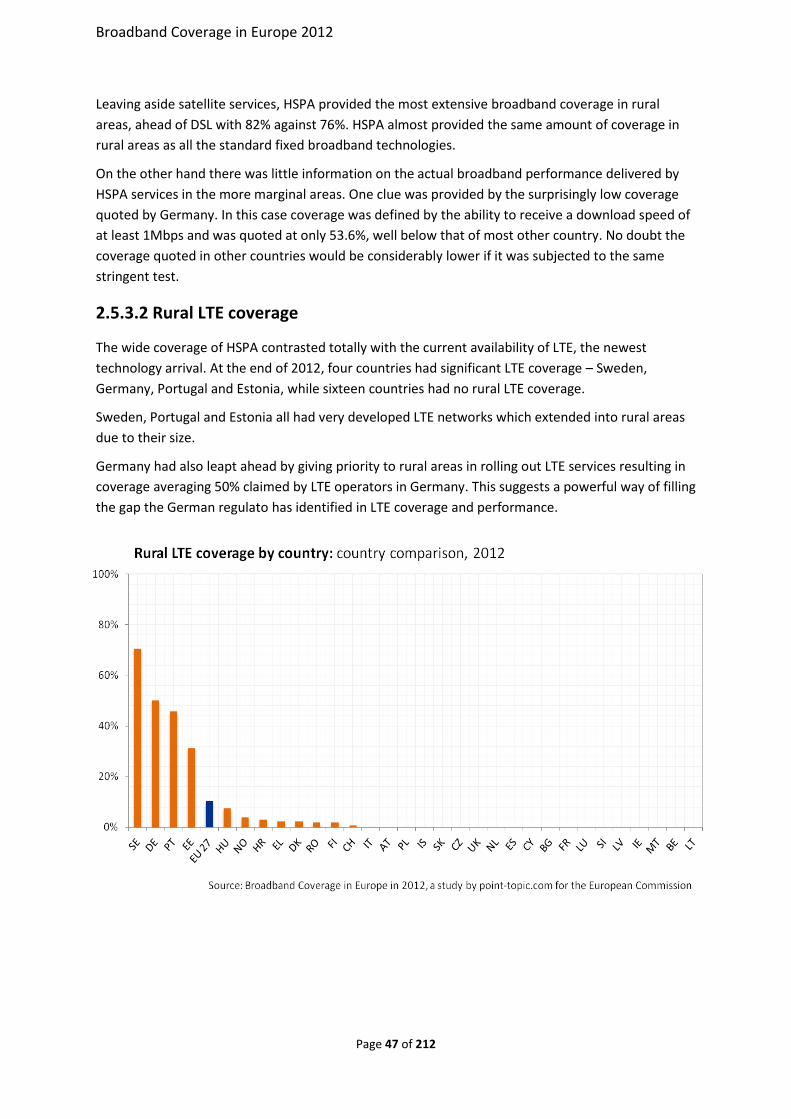
2.5.3.2 Rural LTE coverage
The wide coverage of HSPA contrasted totally with the current availability of LTE, the newest
technology arrival. At the end of 2012, four countries had significant LTE coverage – Sweden,
Germany, Portugal and Estonia, while sixteen countries had no rural LTE coverage.
Sweden, Portugal and Estonia all had very developed LTE networks which extended into rural areas
due to their size.
Germany had also leapt ahead by giving priority to rural areas in rolling out LTE services resulting in
coverage averaging 50% claimed by LTE operators in Germany. This suggests a powerful way of filling
the gap the German regulato has identified in LTE coverage and performance.
Broadband Coverage in Europe 2012
Page 48 of 212
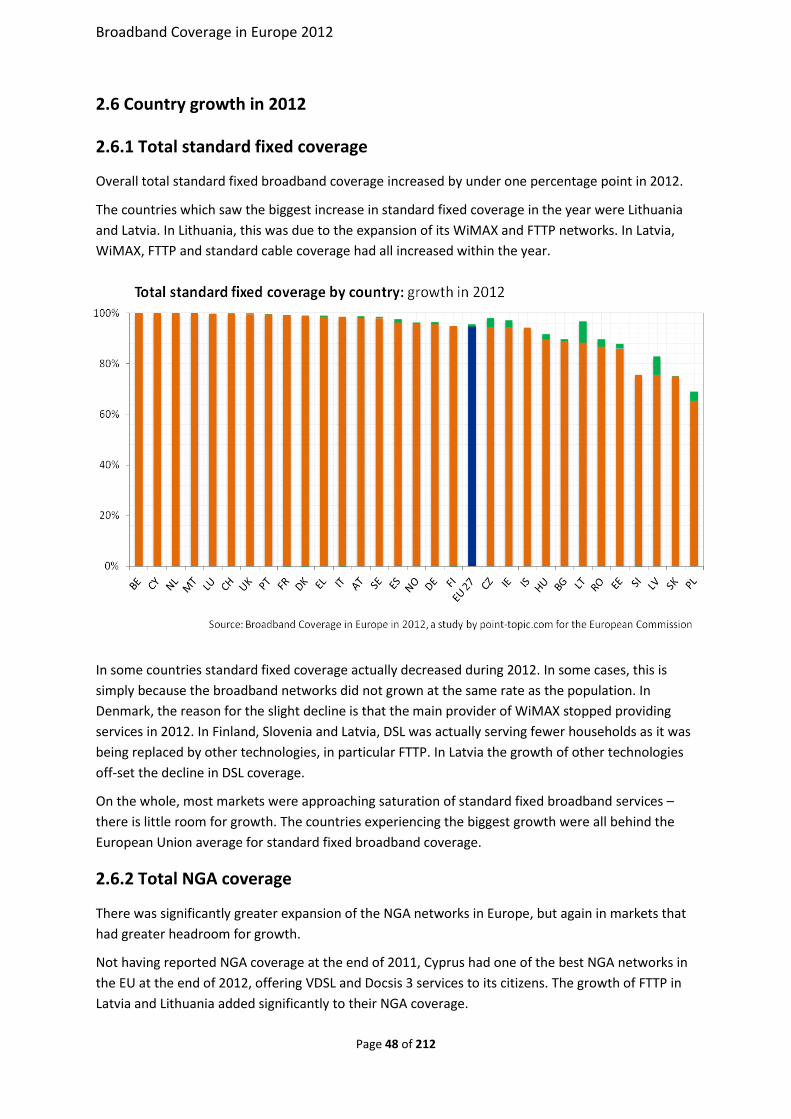
2.6 Country growth in 2012
2.6.1 Total standard fixed coverage
Overall total standard fixed broadband coverage increased by under one percentage point in 2012.
The countries which saw the biggest increase in standard fixed coverage in the year were Lithuania
and Latvia. In Lithuania, this was due to the expansion of its WiMAX and FTTP networks. In Latvia,
WiMAX, FTTP and standard cable coverage had all increased within the year.
In some countries standard fixed coverage actually decreased during 2012. In some cases, this is
simply because the broadband networks did not grown at the same rate as the population. In
Denmark, the reason for the slight decline is that the main provider of WiMAX stopped providing
services in 2012. In Finland, Slovenia and Latvia, DSL was actually serving fewer households as it was
being replaced by other technologies, in particular FTTP. In Latvia the growth of other technologies
off-set the decline in DSL coverage.
On the whole, most markets were approaching saturation of standard fixed broadband services –
there is little room for growth. The countries experiencing the biggest growth were all behind the
European Union average for standard fixed broadband coverage.
2.6.2 Total NGA coverage
There was significantly greater expansion of the NGA networks in Europe, but again in markets that
had greater headroom for growth.
Not having reported NGA coverage at the end of 2011, Cyprus had one of the best NGA networks in
the EU at the end of 2012, offering VDSL and Docsis 3 services to its citizens. The growth of FTTP in
Latvia and Lithuania added significantly to their NGA coverage.
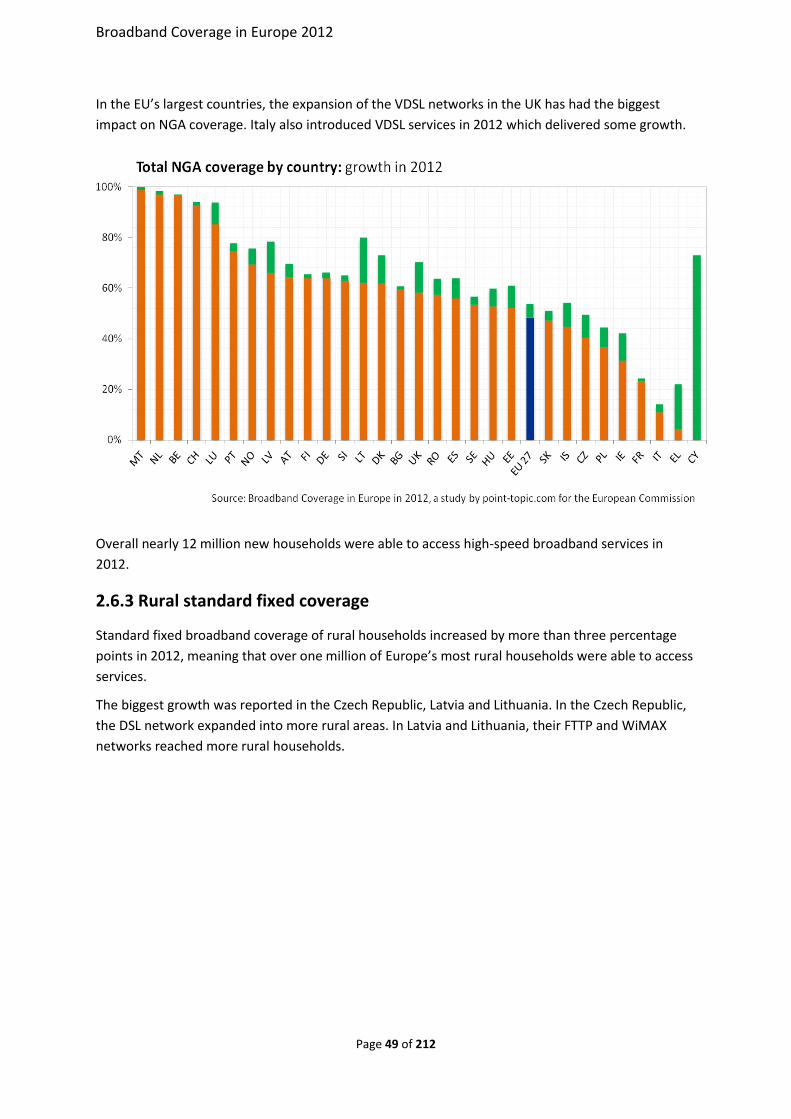
Broadband Coverage in Europe 2012
Page 49 of 212
In the EU’s largest countries, the expansion of the VDSL networks in the UK has had the biggest
impact on NGA coverage. Italy also introduced VDSL services in 2012 which delivered some growth.
Overall nearly 12 million new households were able to access high-speed broadband services in
2012.
2.6.3 Rural standard fixed coverage
Standard fixed broadband coverage of rural households increased by more than three percentage
points in 2012, meaning that over one million of Europe’s most rural households were able to access
services.
The biggest growth was reported in the Czech Republic, Latvia and Lithuania. In the Czech Republic,
the DSL network expanded into more rural areas. In Latvia and Lithuania, their FTTP and WiMAX
networks reached more rural households.

Broadband Coverage in Europe 2012
Page 50 of 212
In general, as most urban areas had close to total standard fixed broadband coverage, any expansion
of the major fixed networks – DSL and cable – had a relatively large impact on the coverage of the
most rural households.
2.6.4 Rural NGA coverage
The upgrade of the cable network in Malta to Docsis 3 means that most rural households can now
access NGA services. In Cyprus, the expansion of the VDSL network has focused mainly on rural
households, with plans for FTTP expansion in urban areas. Switzerland has now caught up with the
Netherlands for rural NGA coverage, mostly due to the expansion of its Docsis 3 cable networks.

Broadband Coverage in Europe 2012
Page 51 of 212
In total, 1.2 million rural households in the European Union gained access to NGA services in 2012.
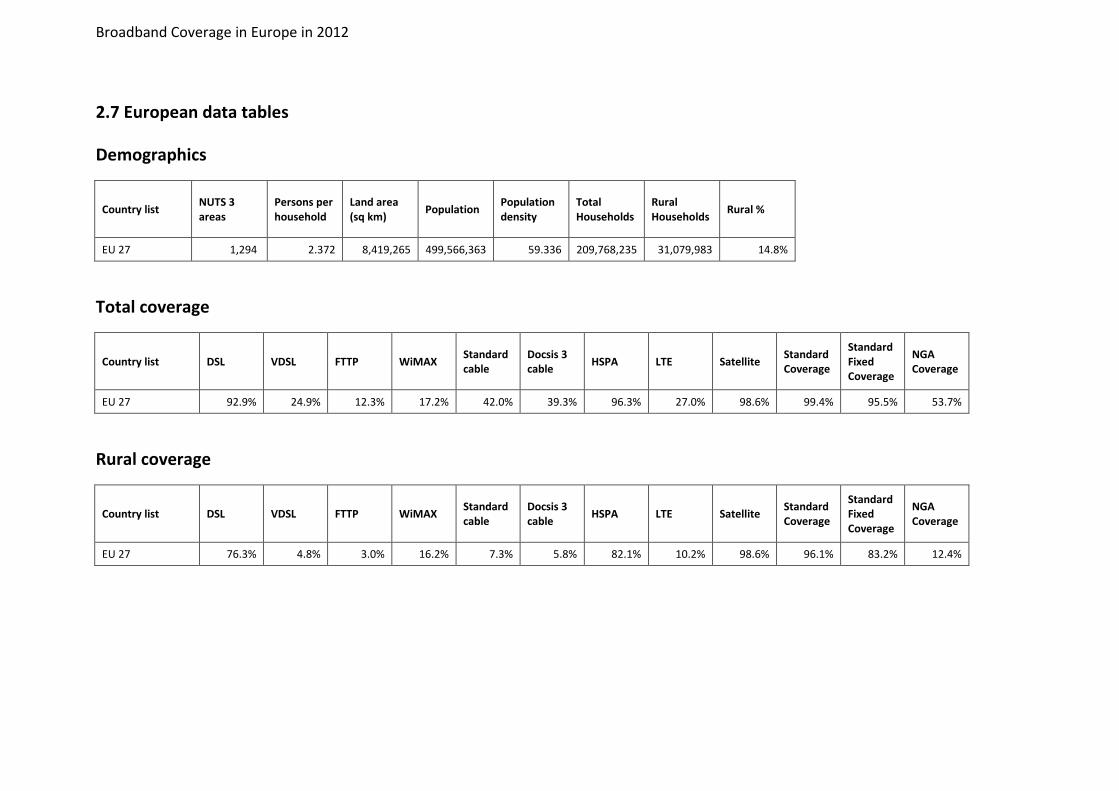
Broadband Coverage in Europe in 2012
2.7 European data tables
Demographics
Country list NUTS 3 areas
Persons per household
Land area (sq km)
Population Population density
Total Households
Rural Households
Rural %
EU 27 1,294 2.372 8,419,265 499,566,363 59.336 209,768,235 31,079,983 14.8%
Total coverage
Country list DSL VDSL FTTP WiMAX Standard cable
Docsis 3 cable
HSPA LTE Satellite Standard Coverage
Standard Fixed Coverage
NGA Coverage
EU 27 92.9% 24.9% 12.3% 17.2% 42.0% 39.3% 96.3% 27.0% 98.6% 99.4% 95.5% 53.7%
Rural coverage
Country list DSL VDSL FTTP WiMAX Standard cable
Docsis 3 cable
HSPA LTE Satellite Standard Coverage
Standard Fixed Coverage
NGA Coverage
EU 27 76.3% 4.8% 3.0% 16.2% 7.3% 5.8% 82.1% 10.2% 98.6% 96.1% 83.2% 12.4%
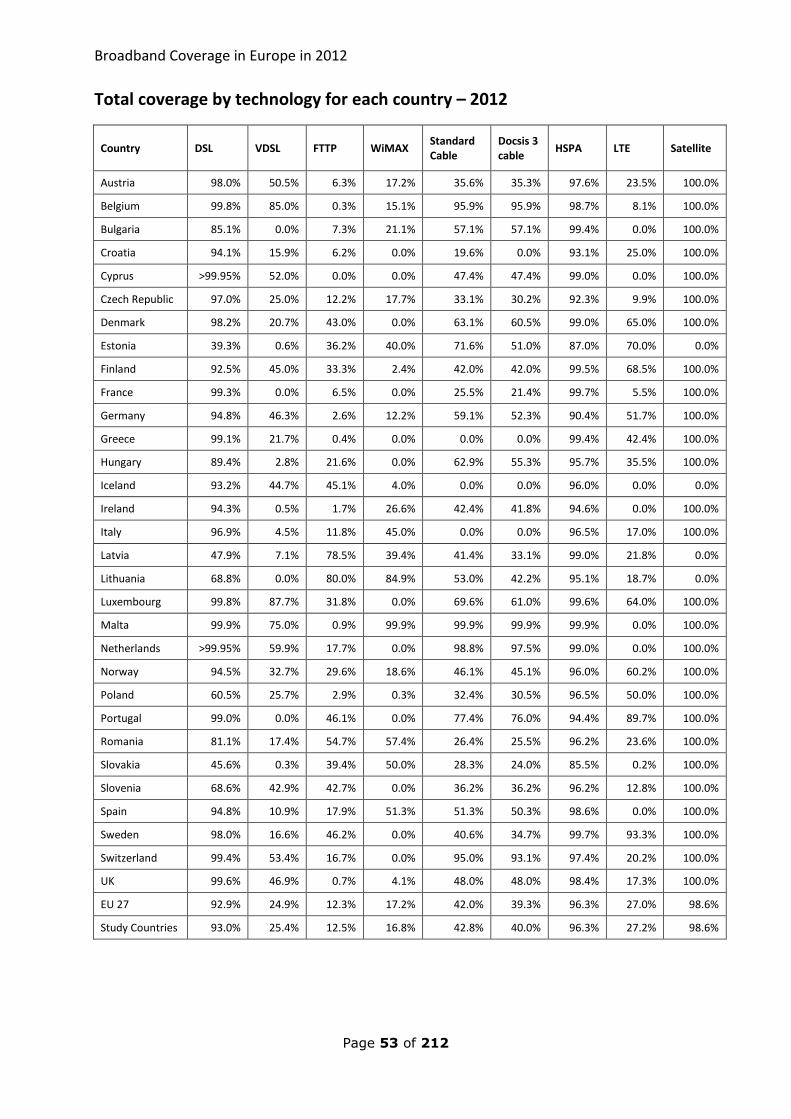
Broadband Coverage in Europe in 2012
Page 53 of 212
Total coverage by technology for each country – 2012
Country DSL VDSL FTTP WiMAX Standard Cable
Docsis 3 cable
HSPA LTE Satellite
Austria 98.0% 50.5% 6.3% 17.2% 35.6% 35.3% 97.6% 23.5% 100.0%
Belgium 99.8% 85.0% 0.3% 15.1% 95.9% 95.9% 98.7% 8.1% 100.0%
Bulgaria 85.1% 0.0% 7.3% 21.1% 57.1% 57.1% 99.4% 0.0% 100.0%
Croatia 94.1% 15.9% 6.2% 0.0% 19.6% 0.0% 93.1% 25.0% 100.0%
Cyprus >99.95% 52.0% 0.0% 0.0% 47.4% 47.4% 99.0% 0.0% 100.0%
Czech Republic 97.0% 25.0% 12.2% 17.7% 33.1% 30.2% 92.3% 9.9% 100.0%
Denmark 98.2% 20.7% 43.0% 0.0% 63.1% 60.5% 99.0% 65.0% 100.0%
Estonia 39.3% 0.6% 36.2% 40.0% 71.6% 51.0% 87.0% 70.0% 0.0%
Finland 92.5% 45.0% 33.3% 2.4% 42.0% 42.0% 99.5% 68.5% 100.0%
France 99.3% 0.0% 6.5% 0.0% 25.5% 21.4% 99.7% 5.5% 100.0%
Germany 94.8% 46.3% 2.6% 12.2% 59.1% 52.3% 90.4% 51.7% 100.0%
Greece 99.1% 21.7% 0.4% 0.0% 0.0% 0.0% 99.4% 42.4% 100.0%
Hungary 89.4% 2.8% 21.6% 0.0% 62.9% 55.3% 95.7% 35.5% 100.0%
Iceland 93.2% 44.7% 45.1% 4.0% 0.0% 0.0% 96.0% 0.0% 0.0%
Ireland 94.3% 0.5% 1.7% 26.6% 42.4% 41.8% 94.6% 0.0% 100.0%
Italy 96.9% 4.5% 11.8% 45.0% 0.0% 0.0% 96.5% 17.0% 100.0%
Latvia 47.9% 7.1% 78.5% 39.4% 41.4% 33.1% 99.0% 21.8% 0.0%
Lithuania 68.8% 0.0% 80.0% 84.9% 53.0% 42.2% 95.1% 18.7% 0.0%
Luxembourg 99.8% 87.7% 31.8% 0.0% 69.6% 61.0% 99.6% 64.0% 100.0%
Malta 99.9% 75.0% 0.9% 99.9% 99.9% 99.9% 99.9% 0.0% 100.0%
Netherlands >99.95% 59.9% 17.7% 0.0% 98.8% 97.5% 99.0% 0.0% 100.0%
Norway 94.5% 32.7% 29.6% 18.6% 46.1% 45.1% 96.0% 60.2% 100.0%
Poland 60.5% 25.7% 2.9% 0.3% 32.4% 30.5% 96.5% 50.0% 100.0%
Portugal 99.0% 0.0% 46.1% 0.0% 77.4% 76.0% 94.4% 89.7% 100.0%
Romania 81.1% 17.4% 54.7% 57.4% 26.4% 25.5% 96.2% 23.6% 100.0%
Slovakia 45.6% 0.3% 39.4% 50.0% 28.3% 24.0% 85.5% 0.2% 100.0%
Slovenia 68.6% 42.9% 42.7% 0.0% 36.2% 36.2% 96.2% 12.8% 100.0%
Spain 94.8% 10.9% 17.9% 51.3% 51.3% 50.3% 98.6% 0.0% 100.0%
Sweden 98.0% 16.6% 46.2% 0.0% 40.6% 34.7% 99.7% 93.3% 100.0%
Switzerland 99.4% 53.4% 16.7% 0.0% 95.0% 93.1% 97.4% 20.2% 100.0%
UK 99.6% 46.9% 0.7% 4.1% 48.0% 48.0% 98.4% 17.3% 100.0%
EU 27 92.9% 24.9% 12.3% 17.2% 42.0% 39.3% 96.3% 27.0% 98.6%
Study Countries 93.0% 25.4% 12.5% 16.8% 42.8% 40.0% 96.3% 27.2% 98.6%
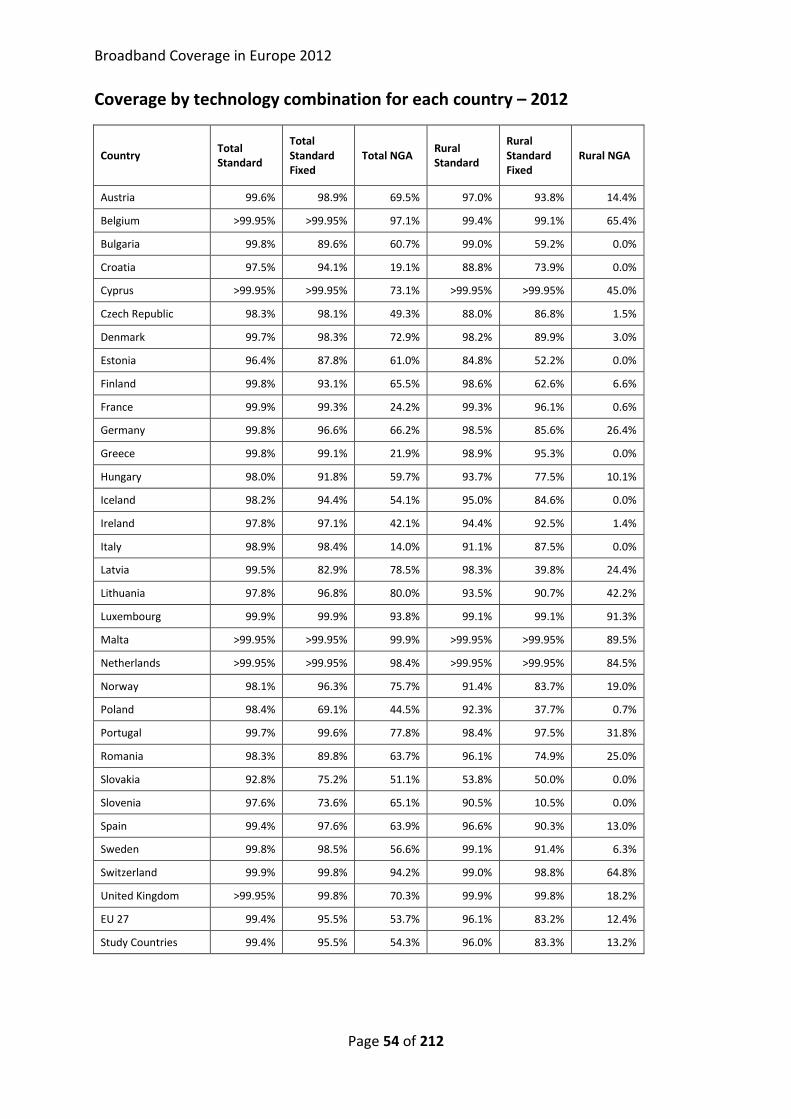
Broadband Coverage in Europe 2012
Page 54 of 212
Coverage by technology combination for each country – 2012
Country Total Standard
Total Standard Fixed
Total NGA Rural Standard
Rural Standard Fixed
Rural NGA
Austria 99.6% 98.9% 69.5% 97.0% 93.8% 14.4%
Belgium >99.95% >99.95% 97.1% 99.4% 99.1% 65.4%
Bulgaria 99.8% 89.6% 60.7% 99.0% 59.2% 0.0%
Croatia 97.5% 94.1% 19.1% 88.8% 73.9% 0.0%
Cyprus >99.95% >99.95% 73.1% >99.95% >99.95% 45.0%
Czech Republic 98.3% 98.1% 49.3% 88.0% 86.8% 1.5%
Denmark 99.7% 98.3% 72.9% 98.2% 89.9% 3.0%
Estonia 96.4% 87.8% 61.0% 84.8% 52.2% 0.0%
Finland 99.8% 93.1% 65.5% 98.6% 62.6% 6.6%
France 99.9% 99.3% 24.2% 99.3% 96.1% 0.6%
Germany 99.8% 96.6% 66.2% 98.5% 85.6% 26.4%
Greece 99.8% 99.1% 21.9% 98.9% 95.3% 0.0%
Hungary 98.0% 91.8% 59.7% 93.7% 77.5% 10.1%
Iceland 98.2% 94.4% 54.1% 95.0% 84.6% 0.0%
Ireland 97.8% 97.1% 42.1% 94.4% 92.5% 1.4%
Italy 98.9% 98.4% 14.0% 91.1% 87.5% 0.0%
Latvia 99.5% 82.9% 78.5% 98.3% 39.8% 24.4%
Lithuania 97.8% 96.8% 80.0% 93.5% 90.7% 42.2%
Luxembourg 99.9% 99.9% 93.8% 99.1% 99.1% 91.3%
Malta >99.95% >99.95% 99.9% >99.95% >99.95% 89.5%
Netherlands >99.95% >99.95% 98.4% >99.95% >99.95% 84.5%
Norway 98.1% 96.3% 75.7% 91.4% 83.7% 19.0%
Poland 98.4% 69.1% 44.5% 92.3% 37.7% 0.7%
Portugal 99.7% 99.6% 77.8% 98.4% 97.5% 31.8%
Romania 98.3% 89.8% 63.7% 96.1% 74.9% 25.0%
Slovakia 92.8% 75.2% 51.1% 53.8% 50.0% 0.0%
Slovenia 97.6% 73.6% 65.1% 90.5% 10.5% 0.0%
Spain 99.4% 97.6% 63.9% 96.6% 90.3% 13.0%
Sweden 99.8% 98.5% 56.6% 99.1% 91.4% 6.3%
Switzerland 99.9% 99.8% 94.2% 99.0% 98.8% 64.8%
United Kingdom >99.95% 99.8% 70.3% 99.9% 99.8% 18.2%
EU 27 99.4% 95.5% 53.7% 96.1% 83.2% 12.4%
Study Countries 99.4% 95.5% 54.3% 96.0% 83.3% 13.2%
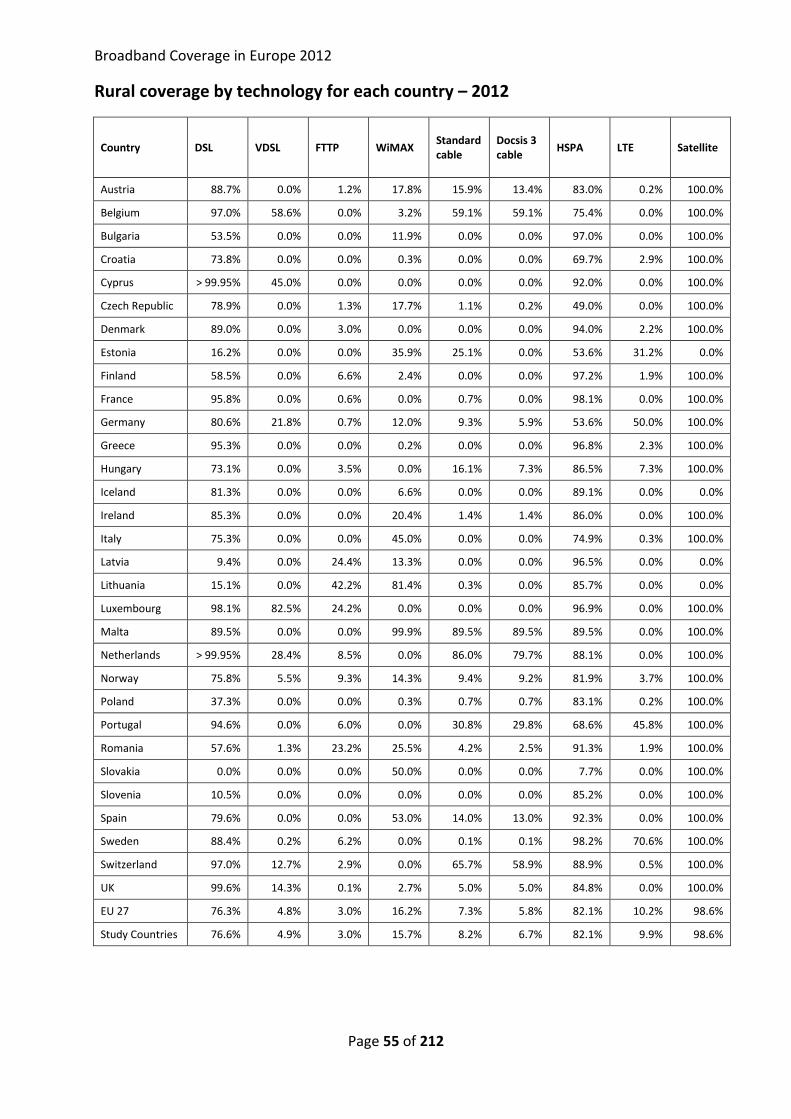
Broadband Coverage in Europe 2012
Page 55 of 212
Rural coverage by technology for each country – 2012
Country DSL VDSL FTTP WiMAX Standard cable
Docsis 3 cable
HSPA LTE Satellite
Austria 88.7% 0.0% 1.2% 17.8% 15.9% 13.4% 83.0% 0.2% 100.0%
Belgium 97.0% 58.6% 0.0% 3.2% 59.1% 59.1% 75.4% 0.0% 100.0%
Bulgaria 53.5% 0.0% 0.0% 11.9% 0.0% 0.0% 97.0% 0.0% 100.0%
Croatia 73.8% 0.0% 0.0% 0.3% 0.0% 0.0% 69.7% 2.9% 100.0%
Cyprus > 99.95% 45.0% 0.0% 0.0% 0.0% 0.0% 92.0% 0.0% 100.0%
Czech Republic 78.9% 0.0% 1.3% 17.7% 1.1% 0.2% 49.0% 0.0% 100.0%
Denmark 89.0% 0.0% 3.0% 0.0% 0.0% 0.0% 94.0% 2.2% 100.0%
Estonia 16.2% 0.0% 0.0% 35.9% 25.1% 0.0% 53.6% 31.2% 0.0%
Finland 58.5% 0.0% 6.6% 2.4% 0.0% 0.0% 97.2% 1.9% 100.0%
France 95.8% 0.0% 0.6% 0.0% 0.7% 0.0% 98.1% 0.0% 100.0%
Germany 80.6% 21.8% 0.7% 12.0% 9.3% 5.9% 53.6% 50.0% 100.0%
Greece 95.3% 0.0% 0.0% 0.2% 0.0% 0.0% 96.8% 2.3% 100.0%
Hungary 73.1% 0.0% 3.5% 0.0% 16.1% 7.3% 86.5% 7.3% 100.0%
Iceland 81.3% 0.0% 0.0% 6.6% 0.0% 0.0% 89.1% 0.0% 0.0%
Ireland 85.3% 0.0% 0.0% 20.4% 1.4% 1.4% 86.0% 0.0% 100.0%
Italy 75.3% 0.0% 0.0% 45.0% 0.0% 0.0% 74.9% 0.3% 100.0%
Latvia 9.4% 0.0% 24.4% 13.3% 0.0% 0.0% 96.5% 0.0% 0.0%
Lithuania 15.1% 0.0% 42.2% 81.4% 0.3% 0.0% 85.7% 0.0% 0.0%
Luxembourg 98.1% 82.5% 24.2% 0.0% 0.0% 0.0% 96.9% 0.0% 100.0%
Malta 89.5% 0.0% 0.0% 99.9% 89.5% 89.5% 89.5% 0.0% 100.0%
Netherlands > 99.95% 28.4% 8.5% 0.0% 86.0% 79.7% 88.1% 0.0% 100.0%
Norway 75.8% 5.5% 9.3% 14.3% 9.4% 9.2% 81.9% 3.7% 100.0%
Poland 37.3% 0.0% 0.0% 0.3% 0.7% 0.7% 83.1% 0.2% 100.0%
Portugal 94.6% 0.0% 6.0% 0.0% 30.8% 29.8% 68.6% 45.8% 100.0%
Romania 57.6% 1.3% 23.2% 25.5% 4.2% 2.5% 91.3% 1.9% 100.0%
Slovakia 0.0% 0.0% 0.0% 50.0% 0.0% 0.0% 7.7% 0.0% 100.0%
Slovenia 10.5% 0.0% 0.0% 0.0% 0.0% 0.0% 85.2% 0.0% 100.0%
Spain 79.6% 0.0% 0.0% 53.0% 14.0% 13.0% 92.3% 0.0% 100.0%
Sweden 88.4% 0.2% 6.2% 0.0% 0.1% 0.1% 98.2% 70.6% 100.0%
Switzerland 97.0% 12.7% 2.9% 0.0% 65.7% 58.9% 88.9% 0.5% 100.0%
UK 99.6% 14.3% 0.1% 2.7% 5.0% 5.0% 84.8% 0.0% 100.0%
EU 27 76.3% 4.8% 3.0% 16.2% 7.3% 5.8% 82.1% 10.2% 98.6%
Study Countries 76.6% 4.9% 3.0% 15.7% 8.2% 6.7% 82.1% 9.9% 98.6%

Broadband Coverage in Europe 2012
Page 56 of 212
3 Coverage by country
3.01 Austria
3.01.1 National coverage by broadband technology
Austria remained ahead of European averages for standard, standard fixed and NGA broadband
coverage, both in total and in rural areas.
Standard fixed broadband coverage was dominated by DSL coverage. At the end of 2012, Austria
reported 98% coverage of households with DSL but was behind the EU average for standard cable
coverage.
Austria gains its NGA advantage with higher than average VDSL coverage. At the end of 2012 more
than 50% of households could access VDSL services, although note that this was not restricted to
households that could access speeds greater than 25Mbps. This offset the comparatively low
deployment of FTTP.
DSL was the key fixed-broadband service for bringing standard broadband to rural areas, although
coverage of cable at rural households was more than twice the European average, and WiMAX also
made a significant contribution. VDSL and FTTP services were still mostly absent in rural areas. Whilst
it has been indicated that there is some VDSL coverage in rural areas, we were able to find no
evidence of the precise locations from the survey or supporting research. Docsis 3 was therefore the
key technology bringing NGA services to rural households.
Overall NGA coverage grew by over five percentage points in 2012, and by nearly 6p.p. in rural areas.
VDSL coverage grew by 4p.p. in the year and made the biggest contribution to the increase.
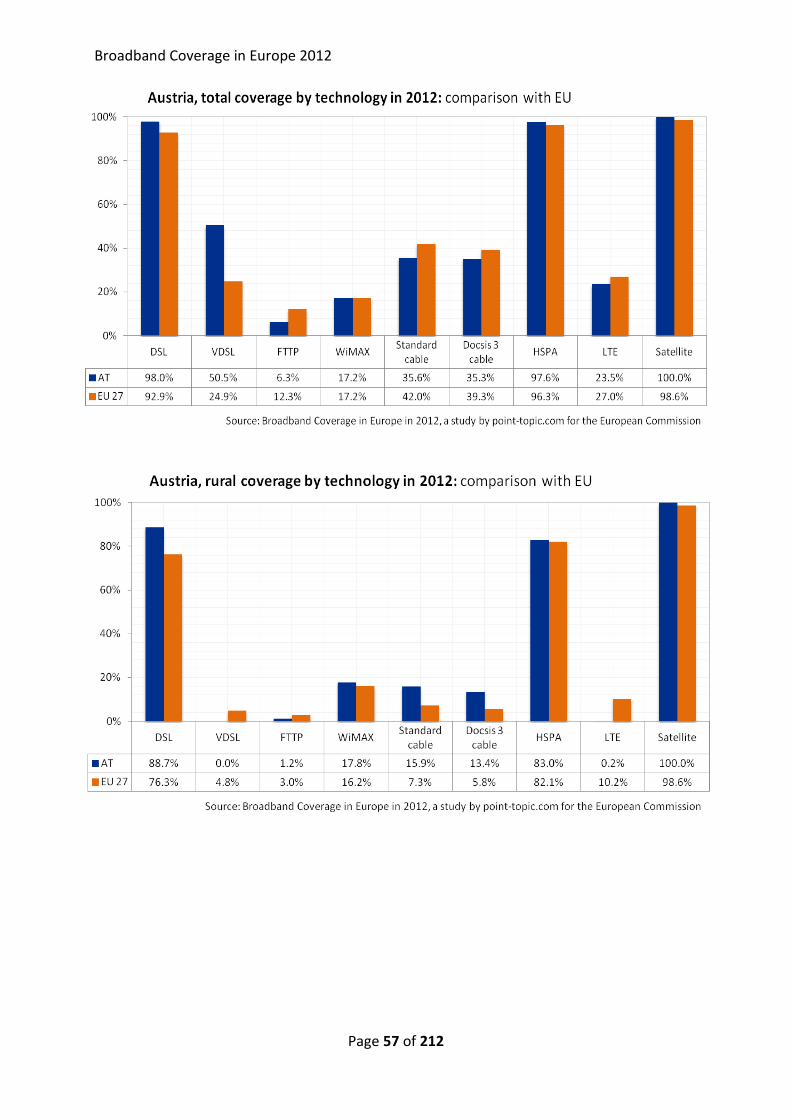
Broadband Coverage in Europe 2012
Page 57 of 212
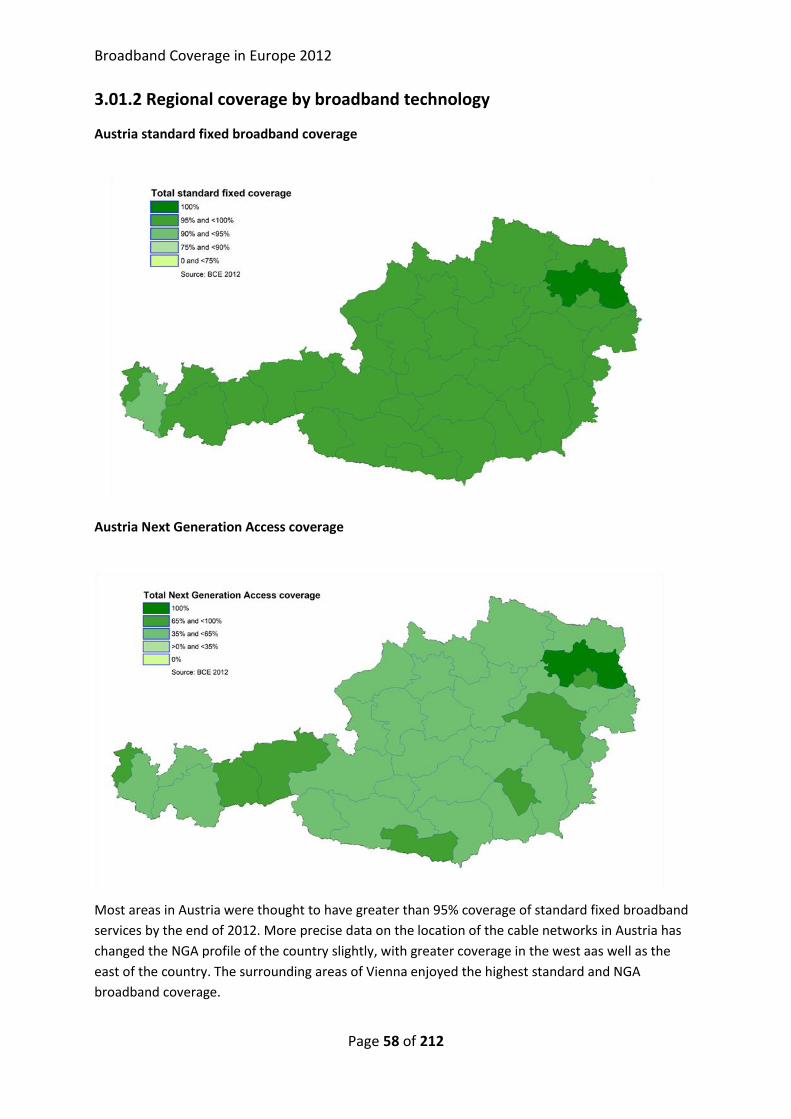
Broadband Coverage in Europe 2012
Page 58 of 212
3.01.2 Regional coverage by broadband technology
Austria standard fixed broadband coverage
Austria Next Generation Access coverage
Most areas in Austria were thought to have greater than 95% coverage of standard fixed broadband
services by the end of 2012. More precise data on the location of the cable networks in Austria has
changed the NGA profile of the country slightly, with greater coverage in the west aas well as the
east of the country. The surrounding areas of Vienna enjoyed the highest standard and NGA
broadband coverage.
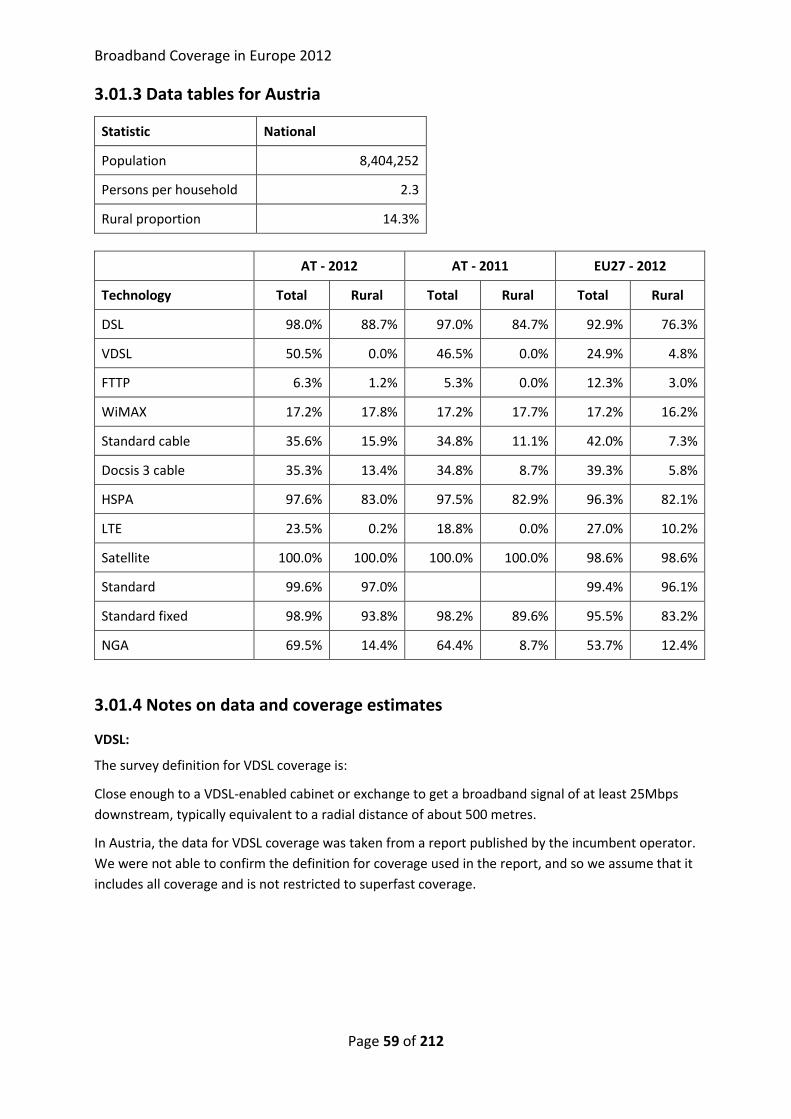
Broadband Coverage in Europe 2012
Page 59 of 212
3.01.3 Data tables for Austria
Statistic National
Population 8,404,252
Persons per household 2.3
Rural proportion 14.3%
AT - 2012 AT - 2011 EU27 - 2012
Technology Total Rural Total Rural Total Rural
DSL 98.0% 88.7% 97.0% 84.7% 92.9% 76.3%
VDSL 50.5% 0.0% 46.5% 0.0% 24.9% 4.8%
FTTP 6.3% 1.2% 5.3% 0.0% 12.3% 3.0%
WiMAX 17.2% 17.8% 17.2% 17.7% 17.2% 16.2%
Standard cable 35.6% 15.9% 34.8% 11.1% 42.0% 7.3%
Docsis 3 cable 35.3% 13.4% 34.8% 8.7% 39.3% 5.8%
HSPA 97.6% 83.0% 97.5% 82.9% 96.3% 82.1%
LTE 23.5% 0.2% 18.8% 0.0% 27.0% 10.2%
Satellite 100.0% 100.0% 100.0% 100.0% 98.6% 98.6%
Standard 99.6% 97.0%
99.4% 96.1%
Standard fixed 98.9% 93.8% 98.2% 89.6% 95.5% 83.2%
NGA 69.5% 14.4% 64.4% 8.7% 53.7% 12.4%
3.01.4 Notes on data and coverage estimates
VDSL:
The survey definition for VDSL coverage is:
Close enough to a VDSL-enabled cabinet or exchange to get a broadband signal of at least 25Mbps
downstream, typically equivalent to a radial distance of about 500 metres.
In Austria, the data for VDSL coverage was taken from a report published by the incumbent operator.
We were not able to confirm the definition for coverage used in the report, and so we assume that it
includes all coverage and is not restricted to superfast coverage.
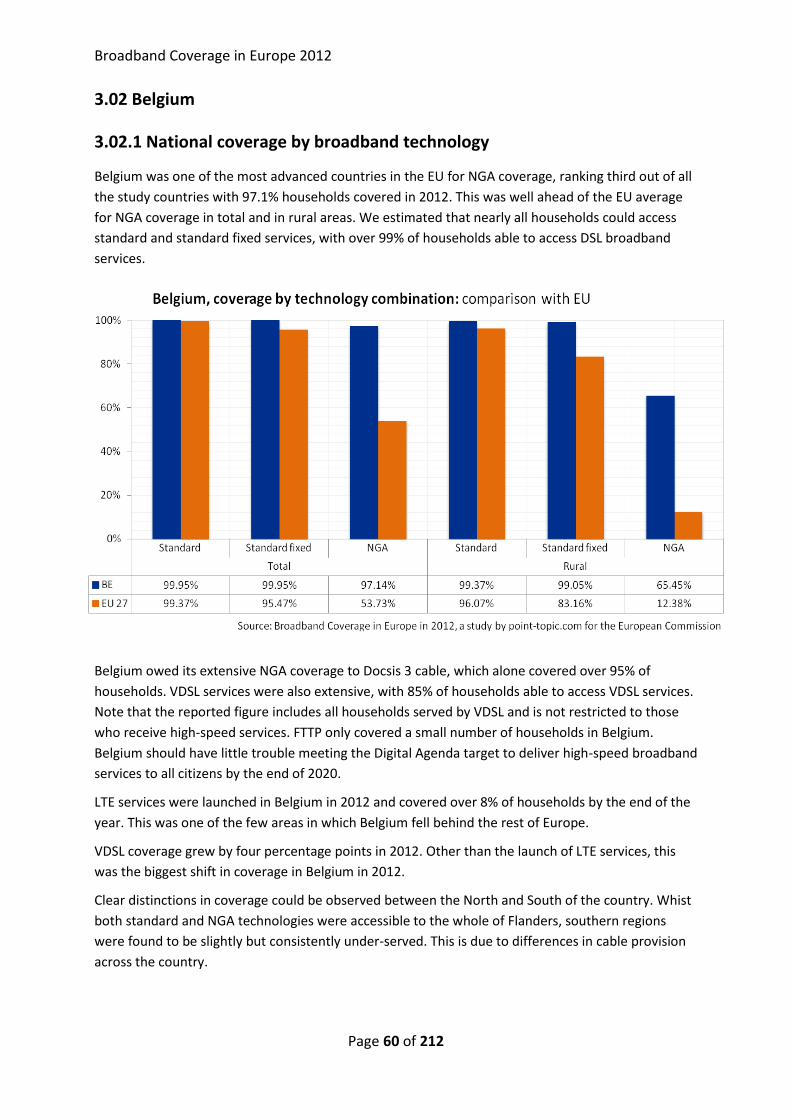
Broadband Coverage in Europe 2012
Page 60 of 212
3.02 Belgium
3.02.1 National coverage by broadband technology
Belgium was one of the most advanced countries in the EU for NGA coverage, ranking third out of all
the study countries with 97.1% households covered in 2012. This was well ahead of the EU average
for NGA coverage in total and in rural areas. We estimated that nearly all households could access
standard and standard fixed services, with over 99% of households able to access DSL broadband
services.
Belgium owed its extensive NGA coverage to Docsis 3 cable, which alone covered over 95% of
households. VDSL services were also extensive, with 85% of households able to access VDSL services.
Note that the reported figure includes all households served by VDSL and is not restricted to those
who receive high-speed services. FTTP only covered a small number of households in Belgium.
Belgium should have little trouble meeting the Digital Agenda target to deliver high-speed broadband
services to all citizens by the end of 2020.
LTE services were launched in Belgium in 2012 and covered over 8% of households by the end of the
year. This was one of the few areas in which Belgium fell behind the rest of Europe.
VDSL coverage grew by four percentage points in 2012. Other than the launch of LTE services, this
was the biggest shift in coverage in Belgium in 2012.
Clear distinctions in coverage could be observed between the North and South of the country. Whist
both standard and NGA technologies were accessible to the whole of Flanders, southern regions
were found to be slightly but consistently under-served. This is due to differences in cable provision
across the country.

Broadband Coverage in Europe 2012
Page 61 of 212
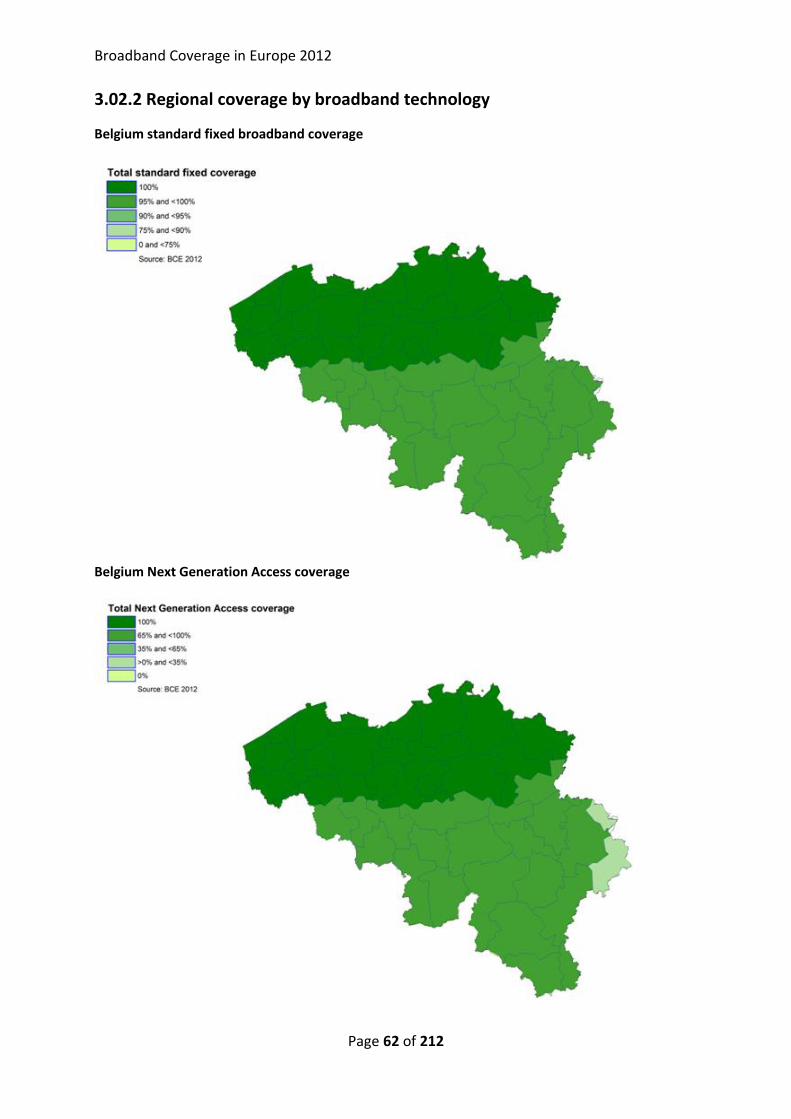
Broadband Coverage in Europe 2012
Page 62 of 212
3.02.2 Regional coverage by broadband technology
Belgium standard fixed broadband coverage
Belgium Next Generation Access coverage
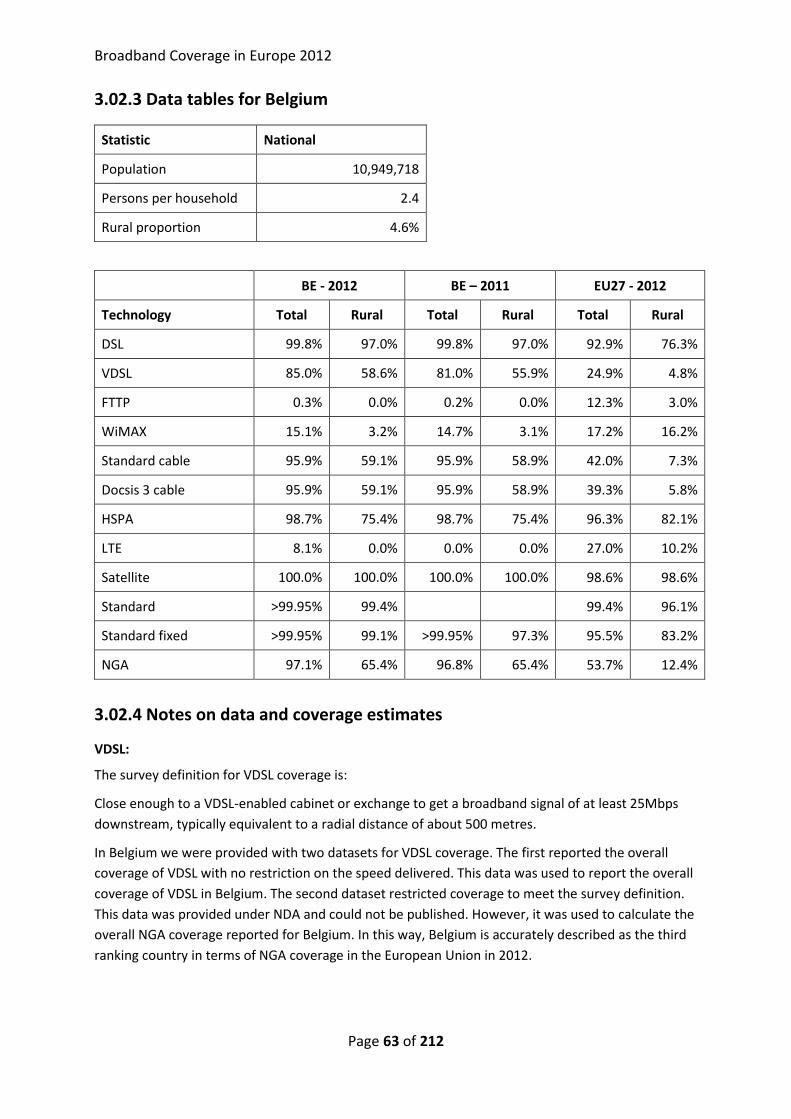
Broadband Coverage in Europe 2012
Page 63 of 212
3.02.3 Data tables for Belgium
Statistic National
Population 10,949,718
Persons per household 2.4
Rural proportion 4.6%
BE - 2012 BE – 2011 EU27 - 2012
Technology Total Rural Total Rural Total Rural
DSL 99.8% 97.0% 99.8% 97.0% 92.9% 76.3%
VDSL 85.0% 58.6% 81.0% 55.9% 24.9% 4.8%
FTTP 0.3% 0.0% 0.2% 0.0% 12.3% 3.0%
WiMAX 15.1% 3.2% 14.7% 3.1% 17.2% 16.2%
Standard cable 95.9% 59.1% 95.9% 58.9% 42.0% 7.3%
Docsis 3 cable 95.9% 59.1% 95.9% 58.9% 39.3% 5.8%
HSPA 98.7% 75.4% 98.7% 75.4% 96.3% 82.1%
LTE 8.1% 0.0% 0.0% 0.0% 27.0% 10.2%
Satellite 100.0% 100.0% 100.0% 100.0% 98.6% 98.6%
Standard >99.95% 99.4%
99.4% 96.1%
Standard fixed >99.95% 99.1% >99.95% 97.3% 95.5% 83.2%
NGA 97.1% 65.4% 96.8% 65.4% 53.7% 12.4%
3.02.4 Notes on data and coverage estimates
VDSL:
The survey definition for VDSL coverage is:
Close enough to a VDSL-enabled cabinet or exchange to get a broadband signal of at least 25Mbps
downstream, typically equivalent to a radial distance of about 500 metres.
In Belgium we were provided with two datasets for VDSL coverage. The first reported the overall
coverage of VDSL with no restriction on the speed delivered. This data was used to report the overall
coverage of VDSL in Belgium. The second dataset restricted coverage to meet the survey definition.
This data was provided under NDA and could not be published. However, it was used to calculate the
overall NGA coverage reported for Belgium. In this way, Belgium is accurately described as the third
ranking country in terms of NGA coverage in the European Union in 2012.

Broadband Coverage in Europe 2012
Page 64 of 212
3.03 Bulgaria
3.03.1 National coverage by broadband technology
Bulgaria was behind the EU averages for standard fixed broadband coverage in total and in rural
areas. Whilst it was ahead of the EU average for total NGA coverage, we estimated that there was no
coverage in rural areas at the end of 2012.
The pattern in overall coverage can be explained by the technology profile in Bulgaria. In 2012 DSL
covered 85% of households. Whilst this is extensive, it falls behind the average of 93% coverage in
the European Union. As DSL is usually the primary technology for delivering standard fixed
broadband coverage, this explains why Bulgaria falls behind the EU average for this measure.
No VDSL coverage was reported for Bulgaria in 2012. FTTP covered just over 7% of households, which
is modest compared to the average coverage in the European Union and particularly compared to
other Eastern European countries. The key technology providing NGA services to households in
Bulgaria was Docsis 3.
The low coverage for FTTP in Bulgaria may seem suprising when compared to other published
sources for broadband coverage. For the purposes of this study, what can sometimes be described as
FTTP was classified as Docsis 3 cable. There is an unspecified amount of FTTLA architecture within
one operator's network, which we believe primarily uses Docsis 3 technology. FTTLA, with fibre being
brought close to the end-user and sometimes into apartment blocks, would be correctly classified as
FTTB but we currently have no evidence of how widespread the technology is. Considering that when
estimating total NGA coverage it makes no difference whether the connection is Docsis 3 or FTTB, we
opted for classifying the whole network as Docsis 3 rather than making an uncertain estimate that a
proportion was FTTB.
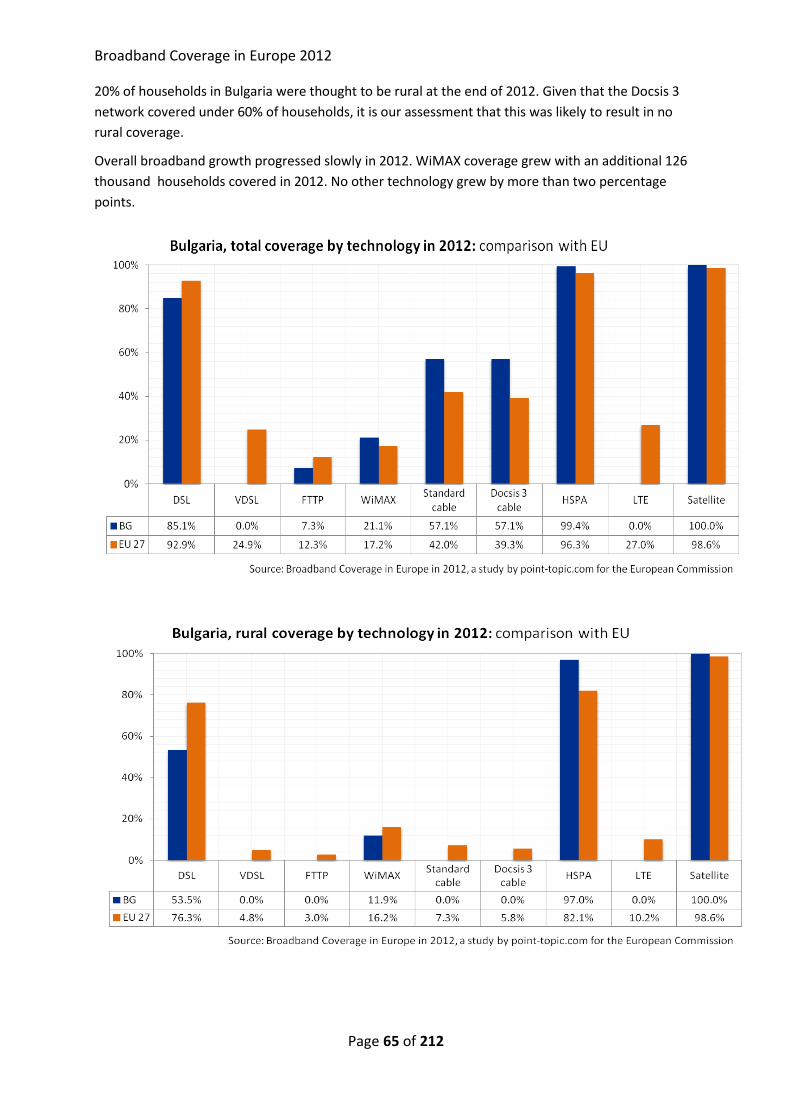
Broadband Coverage in Europe 2012
Page 65 of 212
20% of households in Bulgaria were thought to be rural at the end of 2012. Given that the Docsis 3
network covered under 60% of households, it is our assessment that this was likely to result in no
rural coverage.
Overall broadband growth progressed slowly in 2012. WiMAX coverage grew with an additional 126
thousand households covered in 2012. No other technology grew by more than two percentage
points.
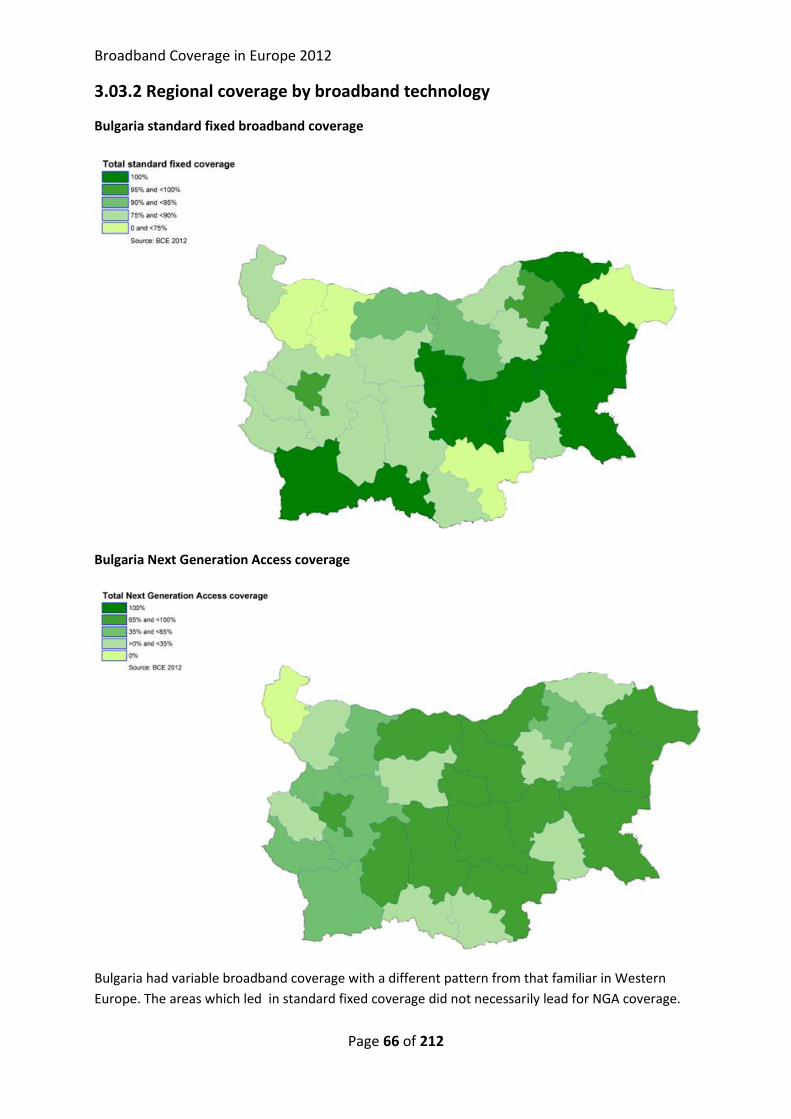
Broadband Coverage in Europe 2012
Page 66 of 212
3.03.2 Regional coverage by broadband technology
Bulgaria standard fixed broadband coverage
Bulgaria Next Generation Access coverage
Bulgaria had variable broadband coverage with a different pattern from that familiar in Western
Europe. The areas which led in standard fixed coverage did not necessarily lead for NGA coverage.
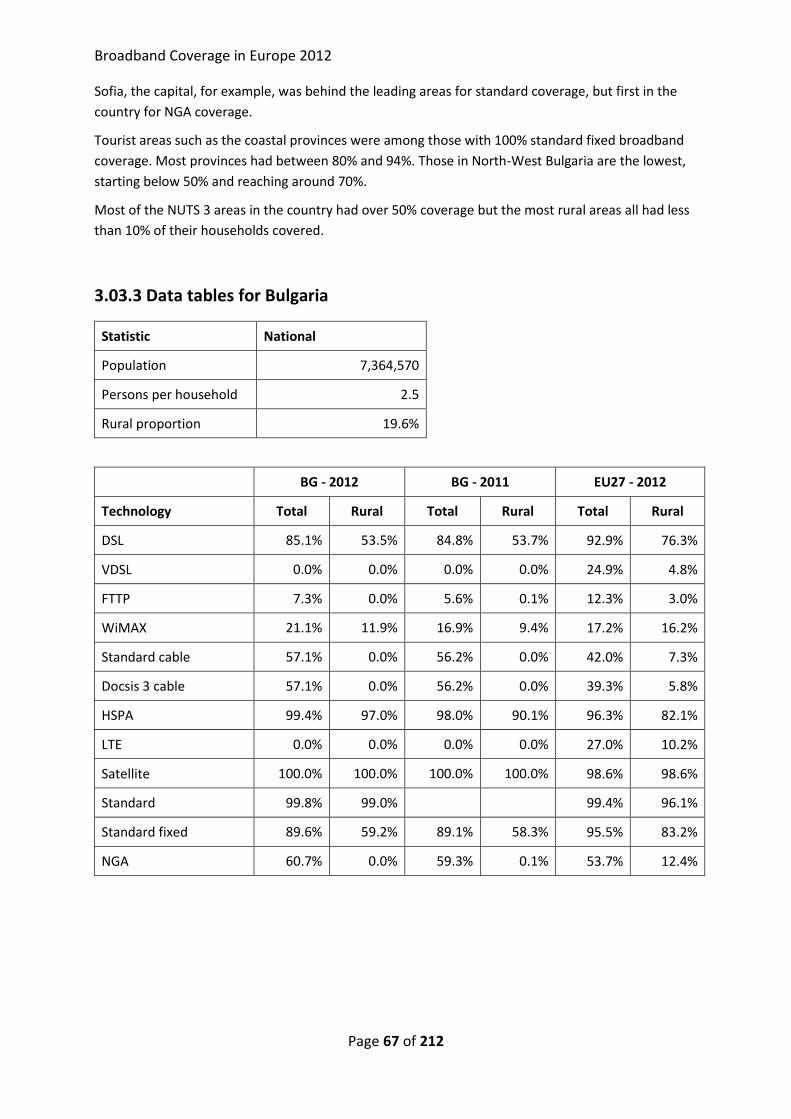
Broadband Coverage in Europe 2012
Page 67 of 212
Sofia, the capital, for example, was behind the leading areas for standard coverage, but first in the
country for NGA coverage.
Tourist areas such as the coastal provinces were among those with 100% standard fixed broadband
coverage. Most provinces had between 80% and 94%. Those in North-West Bulgaria are the lowest,
starting below 50% and reaching around 70%.
Most of the NUTS 3 areas in the country had over 50% coverage but the most rural areas all had less
than 10% of their households covered.
3.03.3 Data tables for Bulgaria
Statistic National
Population 7,364,570
Persons per household 2.5
Rural proportion 19.6%
BG - 2012 BG - 2011 EU27 - 2012
Technology Total Rural Total Rural Total Rural
DSL 85.1% 53.5% 84.8% 53.7% 92.9% 76.3%
VDSL 0.0% 0.0% 0.0% 0.0% 24.9% 4.8%
FTTP 7.3% 0.0% 5.6% 0.1% 12.3% 3.0%
WiMAX 21.1% 11.9% 16.9% 9.4% 17.2% 16.2%
Standard cable 57.1% 0.0% 56.2% 0.0% 42.0% 7.3%
Docsis 3 cable 57.1% 0.0% 56.2% 0.0% 39.3% 5.8%
HSPA 99.4% 97.0% 98.0% 90.1% 96.3% 82.1%
LTE 0.0% 0.0% 0.0% 0.0% 27.0% 10.2%
Satellite 100.0% 100.0% 100.0% 100.0% 98.6% 98.6%
Standard 99.8% 99.0%
99.4% 96.1%
Standard fixed 89.6% 59.2% 89.1% 58.3% 95.5% 83.2%
NGA 60.7% 0.0% 59.3% 0.1% 53.7% 12.4%
Broadband Coverage in Europe 2012
Page 68 of 212
3.03.4 Notes on data and coverage estimates
FTTP vs Docsis 3:
As noted in the commentary, where it was not possible to distinguish between FTTLA and Docsis 3
technology within one network, the whole network was assumed to be Docsis 3 – rather than making
an ill-informed judgement on the FTTB percentage. This does not affect the overall NGA coverage
reported.
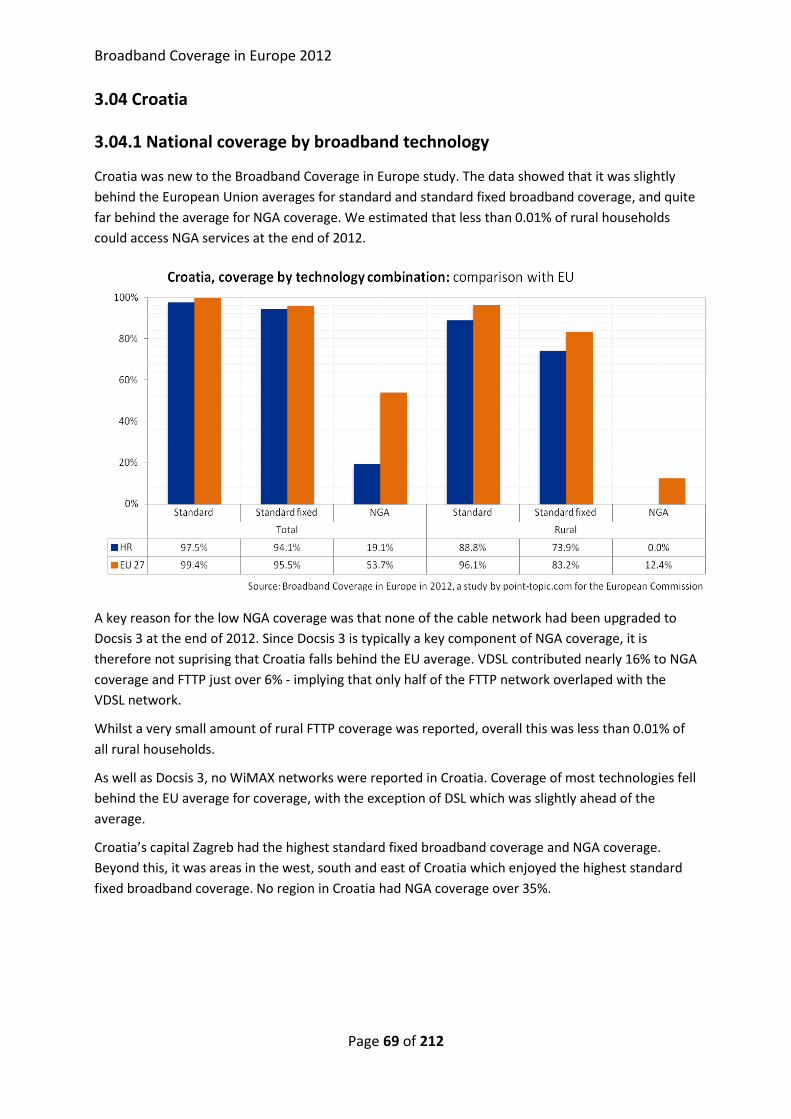
Broadband Coverage in Europe 2012
Page 69 of 212
3.04 Croatia
3.04.1 National coverage by broadband technology
Croatia was new to the Broadband Coverage in Europe study. The data showed that it was slightly
behind the European Union averages for standard and standard fixed broadband coverage, and quite
far behind the average for NGA coverage. We estimated that less than 0.01% of rural households
could access NGA services at the end of 2012.
A key reason for the low NGA coverage was that none of the cable network had been upgraded to
Docsis 3 at the end of 2012. Since Docsis 3 is typically a key component of NGA coverage, it is
therefore not suprising that Croatia falls behind the EU average. VDSL contributed nearly 16% to NGA
coverage and FTTP just over 6% - implying that only half of the FTTP network overlaped with the
VDSL network.
Whilst a very small amount of rural FTTP coverage was reported, overall this was less than 0.01% of
all rural households.
As well as Docsis 3, no WiMAX networks were reported in Croatia. Coverage of most technologies fell
behind the EU average for coverage, with the exception of DSL which was slightly ahead of the
average.
Croatia’s capital Zagreb had the highest standard fixed broadband coverage and NGA coverage.
Beyond this, it was areas in the west, south and east of Croatia which enjoyed the highest standard
fixed broadband coverage. No region in Croatia had NGA coverage over 35%.
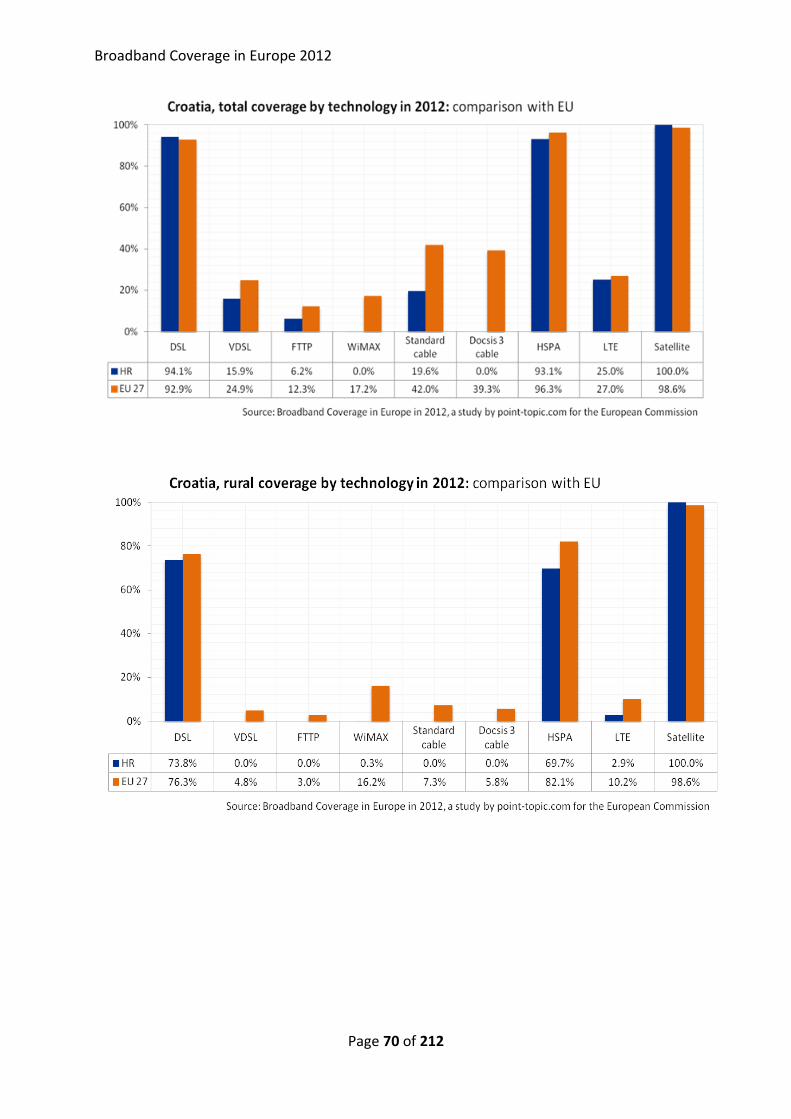
Broadband Coverage in Europe 2012
Page 70 of 212

Broadband Coverage in Europe 2012
Page 71 of 212
3.04.2 Regional coverage by broadband technology
Croatia standard fixed broadband coverage
Croatia Next Generation Access coverage
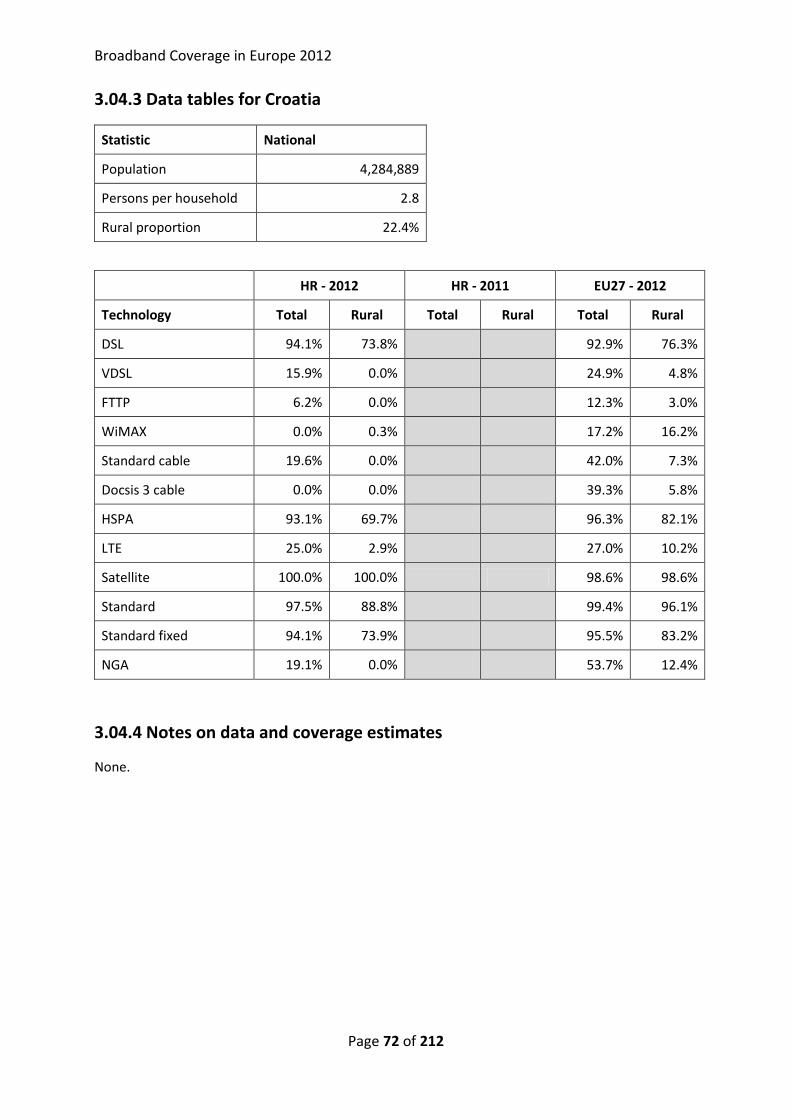
Broadband Coverage in Europe 2012
Page 72 of 212
3.04.3 Data tables for Croatia
Statistic National
Population 4,284,889
Persons per household 2.8
Rural proportion 22.4%
HR - 2012 HR - 2011 EU27 - 2012
Technology Total Rural Total Rural Total Rural
DSL 94.1% 73.8%
92.9% 76.3%
VDSL 15.9% 0.0%
24.9% 4.8%
FTTP 6.2% 0.0%
12.3% 3.0%
WiMAX 0.0% 0.3%
17.2% 16.2%
Standard cable 19.6% 0.0%
42.0% 7.3%
Docsis 3 cable 0.0% 0.0%
39.3% 5.8%
HSPA 93.1% 69.7%
96.3% 82.1%
LTE 25.0% 2.9%
27.0% 10.2%
Satellite 100.0% 100.0% 98.6% 98.6%
Standard 97.5% 88.8%
99.4% 96.1%
Standard fixed 94.1% 73.9%
95.5% 83.2%
NGA 19.1% 0.0%
53.7% 12.4%
3.04.4 Notes on data and coverage estimates
None.
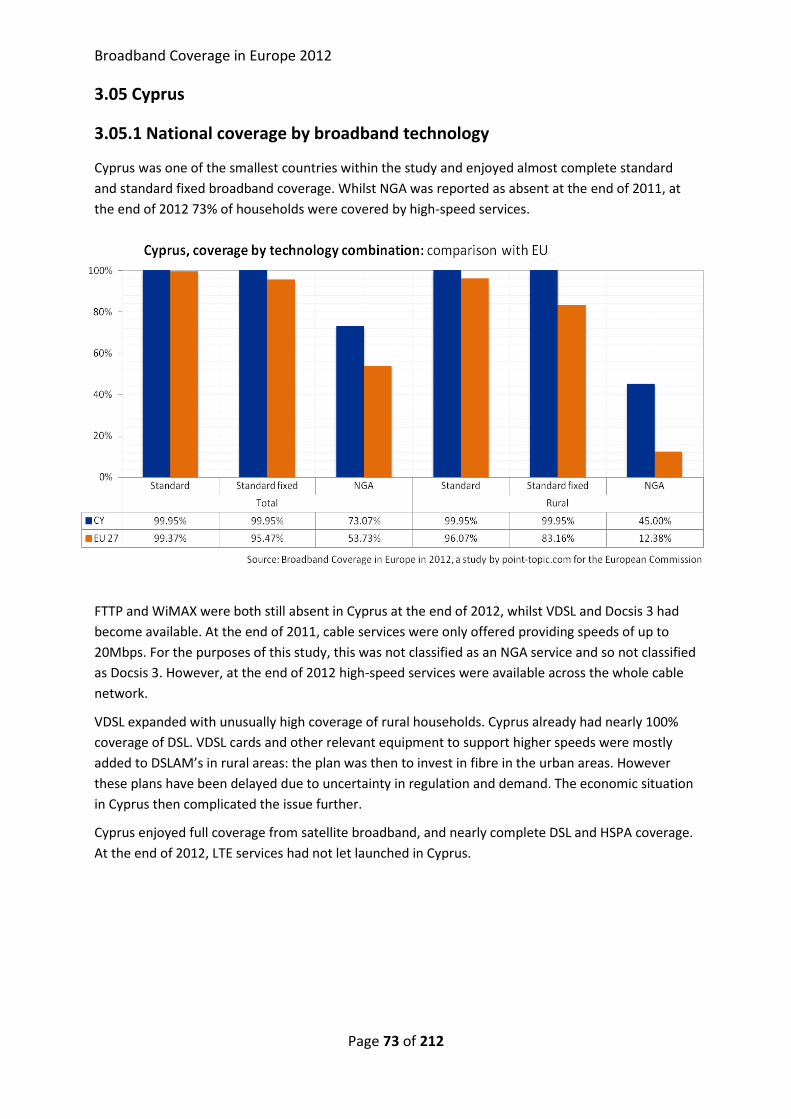
Broadband Coverage in Europe 2012
Page 73 of 212
3.05 Cyprus
3.05.1 National coverage by broadband technology
Cyprus was one of the smallest countries within the study and enjoyed almost complete standard
and standard fixed broadband coverage. Whilst NGA was reported as absent at the end of 2011, at
the end of 2012 73% of households were covered by high-speed services.
FTTP and WiMAX were both still absent in Cyprus at the end of 2012, whilst VDSL and Docsis 3 had
become available. At the end of 2011, cable services were only offered providing speeds of up to
20Mbps. For the purposes of this study, this was not classified as an NGA service and so not classified
as Docsis 3. However, at the end of 2012 high-speed services were available across the whole cable
network.
VDSL expanded with unusually high coverage of rural households. Cyprus already had nearly 100%
coverage of DSL. VDSL cards and other relevant equipment to support higher speeds were mostly
added to DSLAM’s in rural areas: the plan was then to invest in fibre in the urban areas. However
these plans have been delayed due to uncertainty in regulation and demand. The economic situation
in Cyprus then complicated the issue further.
Cyprus enjoyed full coverage from satellite broadband, and nearly complete DSL and HSPA coverage.
At the end of 2012, LTE services had not let launched in Cyprus.
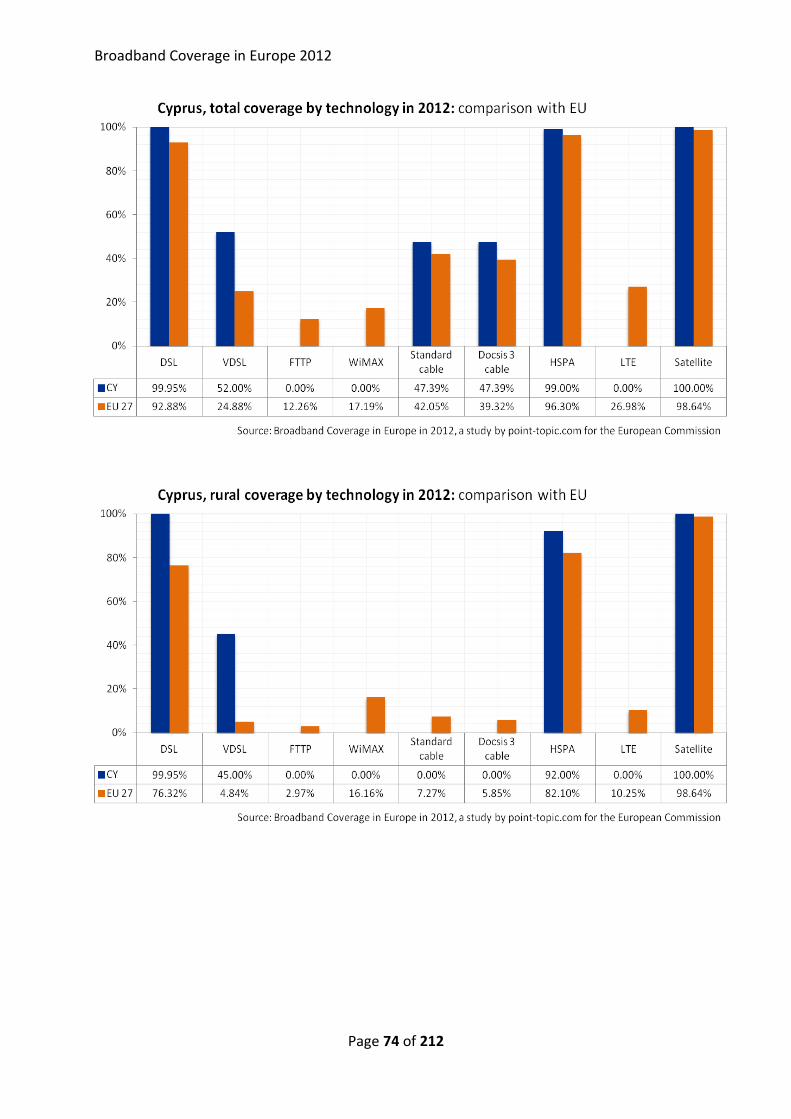
Broadband Coverage in Europe 2012
Page 74 of 212
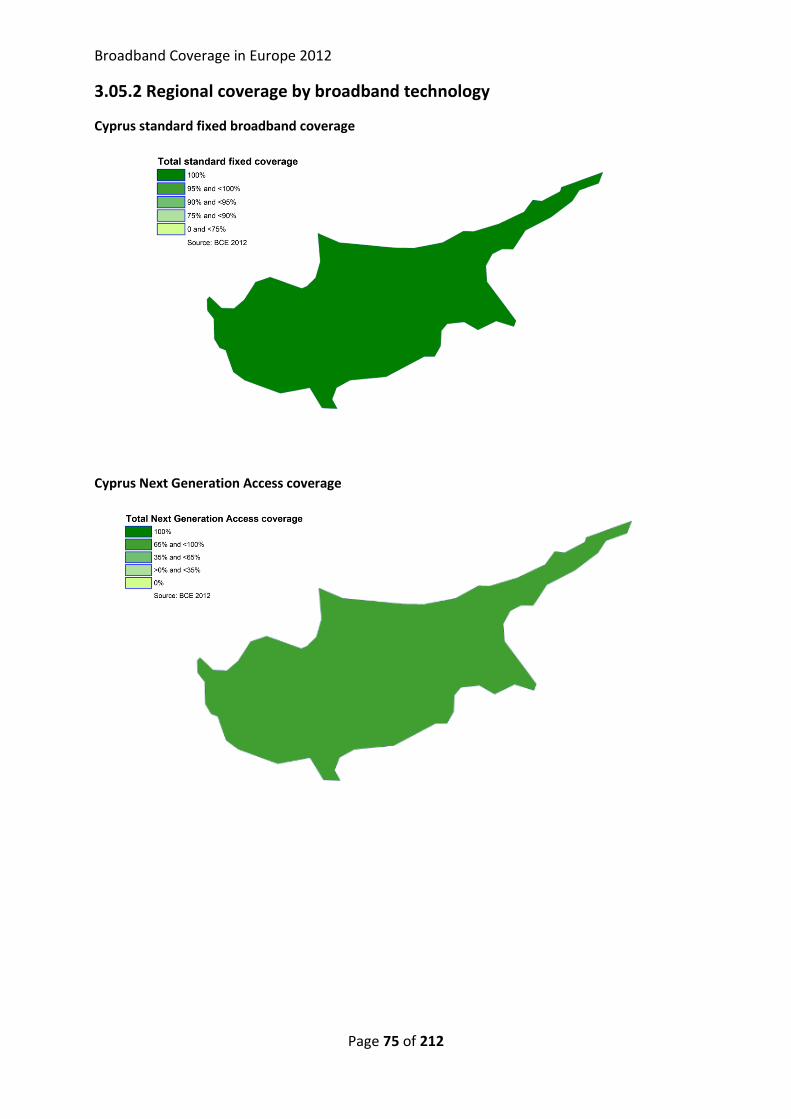
Broadband Coverage in Europe 2012
Page 75 of 212
3.05.2 Regional coverage by broadband technology
Cyprus standard fixed broadband coverage Cyprus Next Generation Access coverage
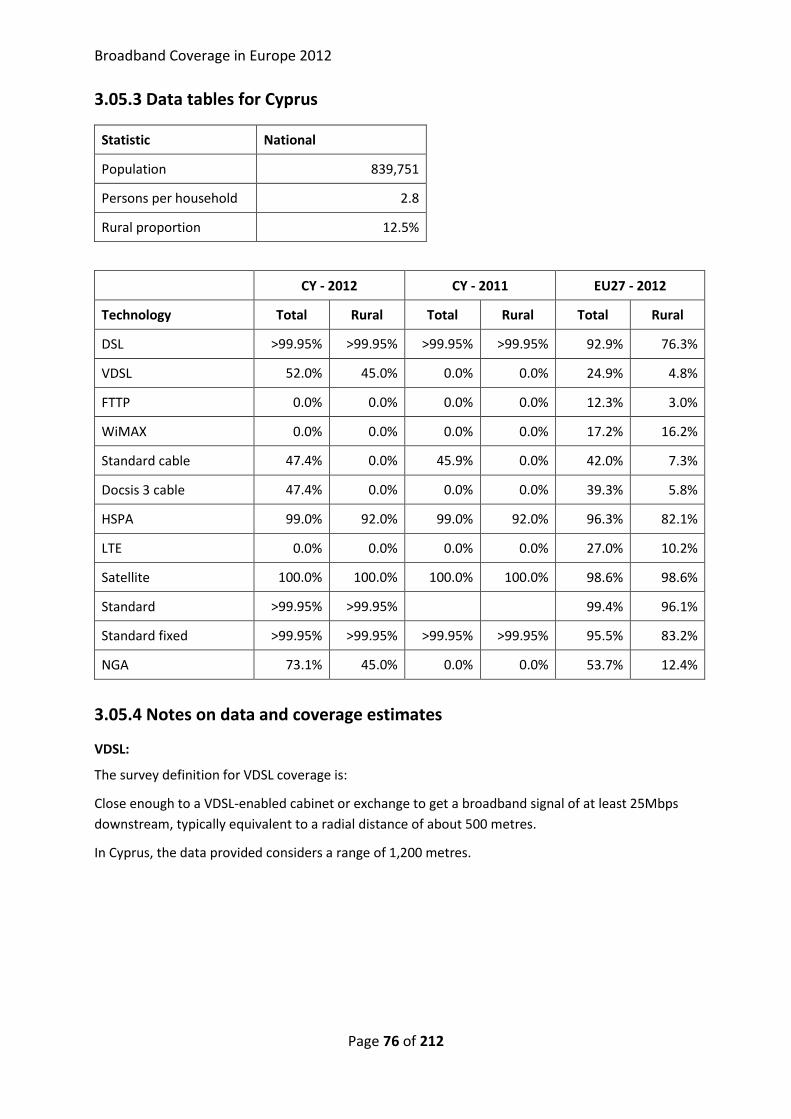
Broadband Coverage in Europe 2012
Page 76 of 212
3.05.3 Data tables for Cyprus
Statistic National
Population 839,751
Persons per household 2.8
Rural proportion 12.5%
CY - 2012 CY - 2011 EU27 - 2012
Technology Total Rural Total Rural Total Rural
DSL >99.95% >99.95% >99.95% >99.95% 92.9% 76.3%
VDSL 52.0% 45.0% 0.0% 0.0% 24.9% 4.8%
FTTP 0.0% 0.0% 0.0% 0.0% 12.3% 3.0%
WiMAX 0.0% 0.0% 0.0% 0.0% 17.2% 16.2%
Standard cable 47.4% 0.0% 45.9% 0.0% 42.0% 7.3%
Docsis 3 cable 47.4% 0.0% 0.0% 0.0% 39.3% 5.8%
HSPA 99.0% 92.0% 99.0% 92.0% 96.3% 82.1%
LTE 0.0% 0.0% 0.0% 0.0% 27.0% 10.2%
Satellite 100.0% 100.0% 100.0% 100.0% 98.6% 98.6%
Standard >99.95% >99.95%
99.4% 96.1%
Standard fixed >99.95% >99.95% >99.95% >99.95% 95.5% 83.2%
NGA 73.1% 45.0% 0.0% 0.0% 53.7% 12.4%
3.05.4 Notes on data and coverage estimates
VDSL:
The survey definition for VDSL coverage is:
Close enough to a VDSL-enabled cabinet or exchange to get a broadband signal of at least 25Mbps
downstream, typically equivalent to a radial distance of about 500 metres.
In Cyprus, the data provided considers a range of 1,200 metres.
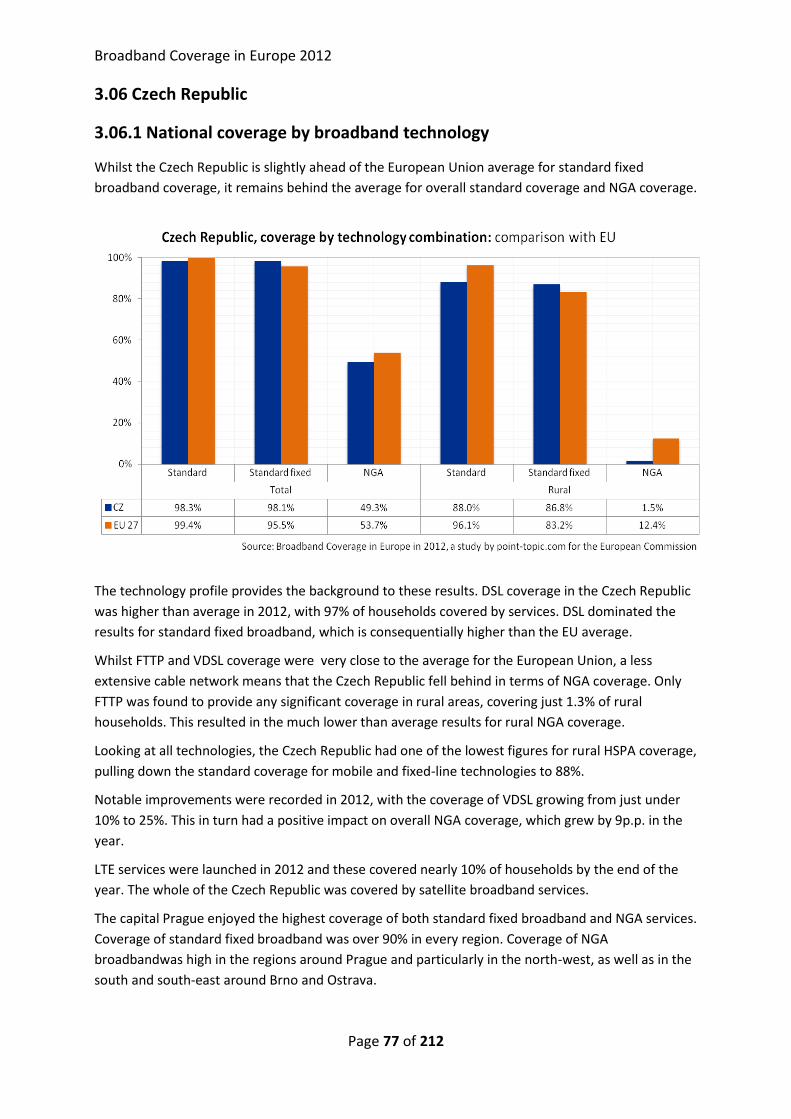
Broadband Coverage in Europe 2012
Page 77 of 212
3.06 Czech Republic
3.06.1 National coverage by broadband technology
Whilst the Czech Republic is slightly ahead of the European Union average for standard fixed
broadband coverage, it remains behind the average for overall standard coverage and NGA coverage.
The technology profile provides the background to these results. DSL coverage in the Czech Republic
was higher than average in 2012, with 97% of households covered by services. DSL dominated the
results for standard fixed broadband, which is consequentially higher than the EU average.
Whilst FTTP and VDSL coverage were very close to the average for the European Union, a less
extensive cable network means that the Czech Republic fell behind in terms of NGA coverage. Only
FTTP was found to provide any significant coverage in rural areas, covering just 1.3% of rural
households. This resulted in the much lower than average results for rural NGA coverage.
Looking at all technologies, the Czech Republic had one of the lowest figures for rural HSPA coverage,
pulling down the standard coverage for mobile and fixed-line technologies to 88%.
Notable improvements were recorded in 2012, with the coverage of VDSL growing from just under
10% to 25%. This in turn had a positive impact on overall NGA coverage, which grew by 9p.p. in the
year.
LTE services were launched in 2012 and these covered nearly 10% of households by the end of the
year. The whole of the Czech Republic was covered by satellite broadband services.
The capital Prague enjoyed the highest coverage of both standard fixed broadband and NGA services.
Coverage of standard fixed broadband was over 90% in every region. Coverage of NGA
broadbandwas high in the regions around Prague and particularly in the north-west, as well as in the
south and south-east around Brno and Ostrava.
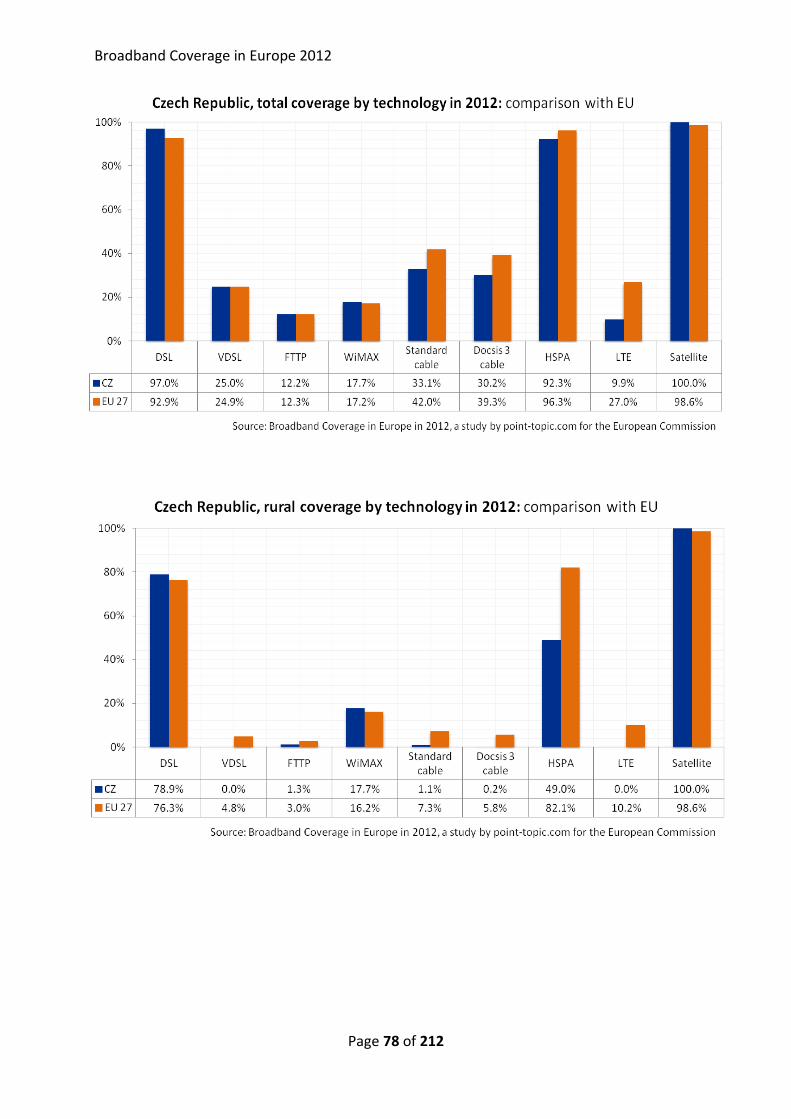
Broadband Coverage in Europe 2012
Page 78 of 212
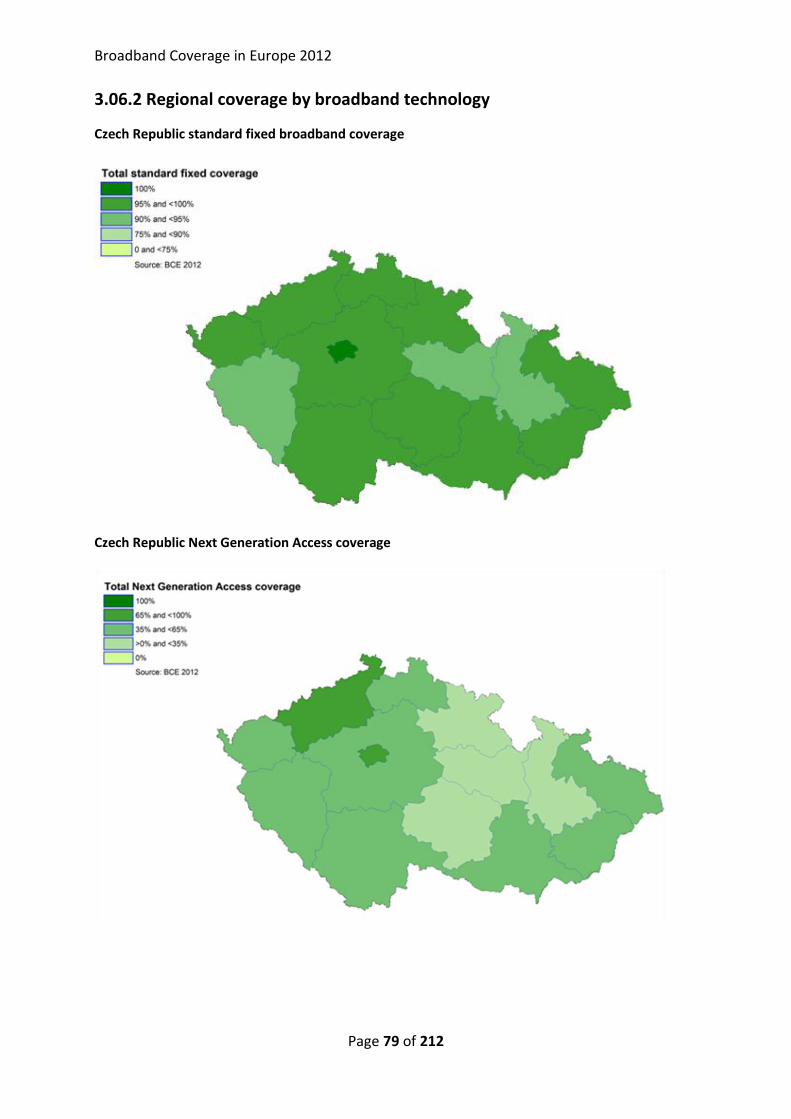
Broadband Coverage in Europe 2012
Page 79 of 212
3.06.2 Regional coverage by broadband technology
Czech Republic standard fixed broadband coverage
Czech Republic Next Generation Access coverage
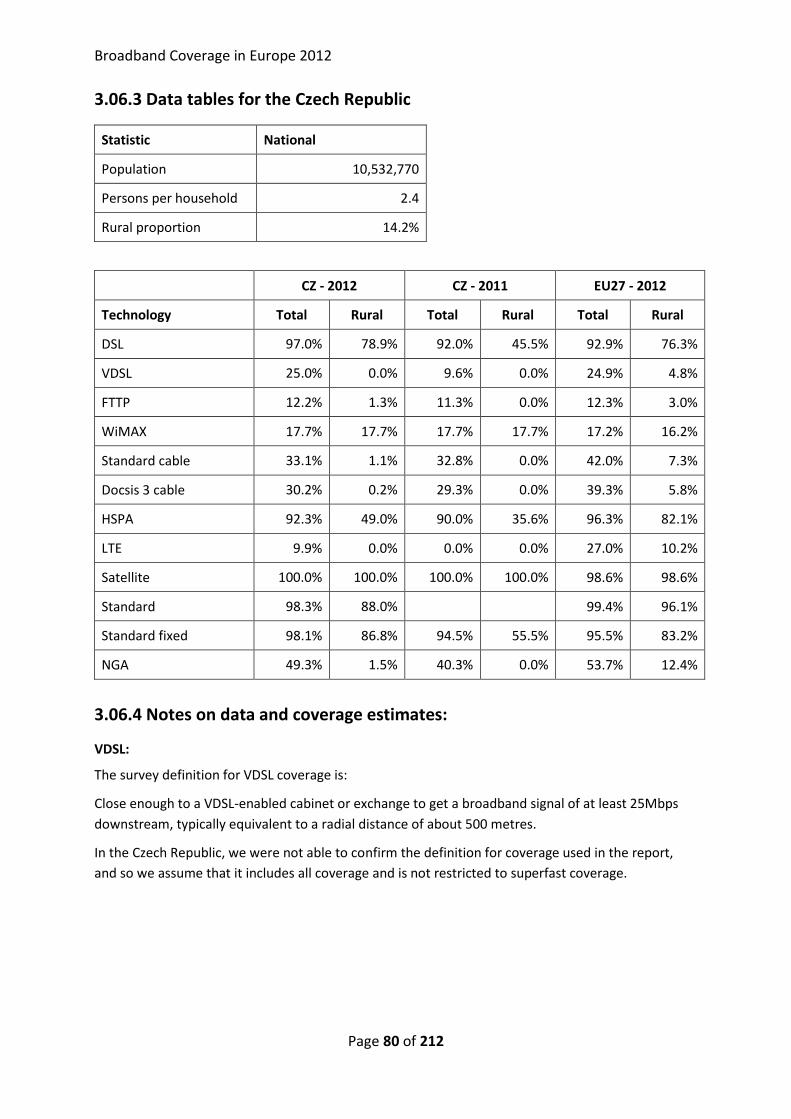
Broadband Coverage in Europe 2012
Page 80 of 212
3.06.3 Data tables for the Czech Republic
Statistic National
Population 10,532,770
Persons per household 2.4
Rural proportion 14.2%
CZ - 2012 CZ - 2011 EU27 - 2012
Technology Total Rural Total Rural Total Rural
DSL 97.0% 78.9% 92.0% 45.5% 92.9% 76.3%
VDSL 25.0% 0.0% 9.6% 0.0% 24.9% 4.8%
FTTP 12.2% 1.3% 11.3% 0.0% 12.3% 3.0%
WiMAX 17.7% 17.7% 17.7% 17.7% 17.2% 16.2%
Standard cable 33.1% 1.1% 32.8% 0.0% 42.0% 7.3%
Docsis 3 cable 30.2% 0.2% 29.3% 0.0% 39.3% 5.8%
HSPA 92.3% 49.0% 90.0% 35.6% 96.3% 82.1%
LTE 9.9% 0.0% 0.0% 0.0% 27.0% 10.2%
Satellite 100.0% 100.0% 100.0% 100.0% 98.6% 98.6%
Standard 98.3% 88.0%
99.4% 96.1%
Standard fixed 98.1% 86.8% 94.5% 55.5% 95.5% 83.2%
NGA 49.3% 1.5% 40.3% 0.0% 53.7% 12.4%
3.06.4 Notes on data and coverage estimates:
VDSL:
The survey definition for VDSL coverage is:
Close enough to a VDSL-enabled cabinet or exchange to get a broadband signal of at least 25Mbps
downstream, typically equivalent to a radial distance of about 500 metres.
In the Czech Republic, we were not able to confirm the definition for coverage used in the report,
and so we assume that it includes all coverage and is not restricted to superfast coverage.
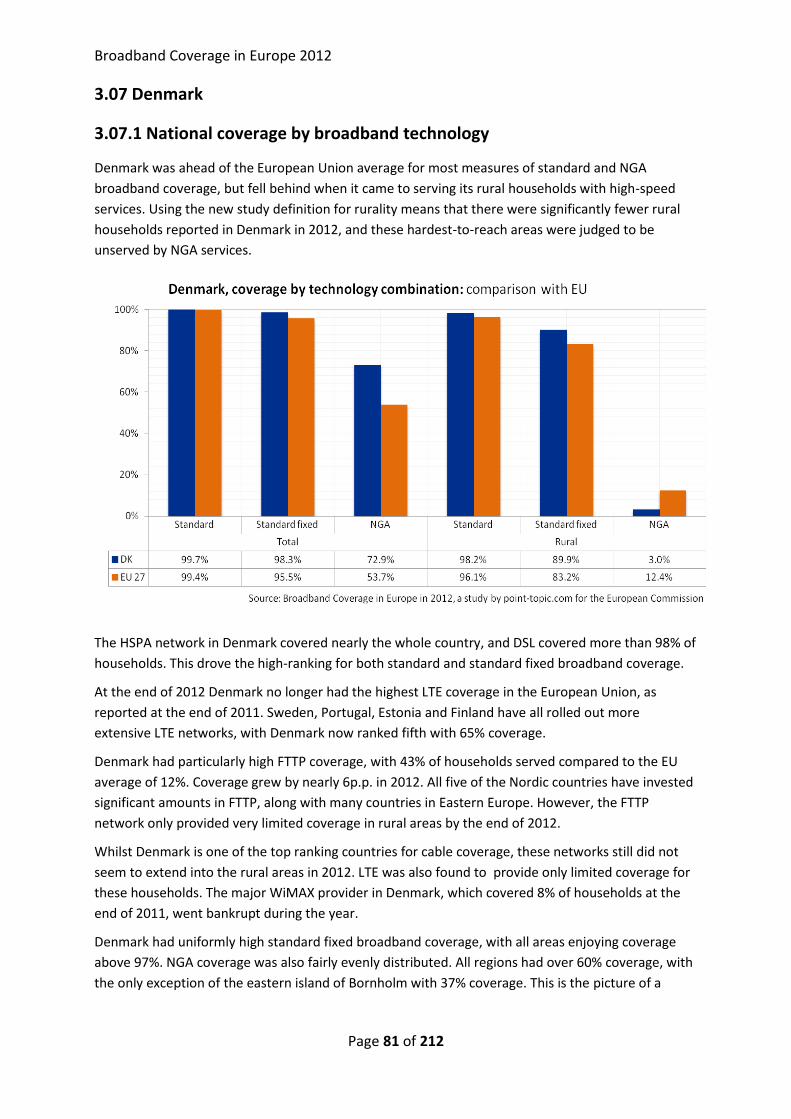
Broadband Coverage in Europe 2012
Page 81 of 212
3.07 Denmark
3.07.1 National coverage by broadband technology
Denmark was ahead of the European Union average for most measures of standard and NGA
broadband coverage, but fell behind when it came to serving its rural households with high-speed
services. Using the new study definition for rurality means that there were significantly fewer rural
households reported in Denmark in 2012, and these hardest-to-reach areas were judged to be
unserved by NGA services.
The HSPA network in Denmark covered nearly the whole country, and DSL covered more than 98% of
households. This drove the high-ranking for both standard and standard fixed broadband coverage.
At the end of 2012 Denmark no longer had the highest LTE coverage in the European Union, as
reported at the end of 2011. Sweden, Portugal, Estonia and Finland have all rolled out more
extensive LTE networks, with Denmark now ranked fifth with 65% coverage.
Denmark had particularly high FTTP coverage, with 43% of households served compared to the EU
average of 12%. Coverage grew by nearly 6p.p. in 2012. All five of the Nordic countries have invested
significant amounts in FTTP, along with many countries in Eastern Europe. However, the FTTP
network only provided very limited coverage in rural areas by the end of 2012.
Whilst Denmark is one of the top ranking countries for cable coverage, these networks still did not
seem to extend into the rural areas in 2012. LTE was also found to provide only limited coverage for
these households. The major WiMAX provider in Denmark, which covered 8% of households at the
end of 2011, went bankrupt during the year.
Denmark had uniformly high standard fixed broadband coverage, with all areas enjoying coverage
above 97%. NGA coverage was also fairly evenly distributed. All regions had over 60% coverage, with
the only exception of the eastern island of Bornholm with 37% coverage. This is the picture of a
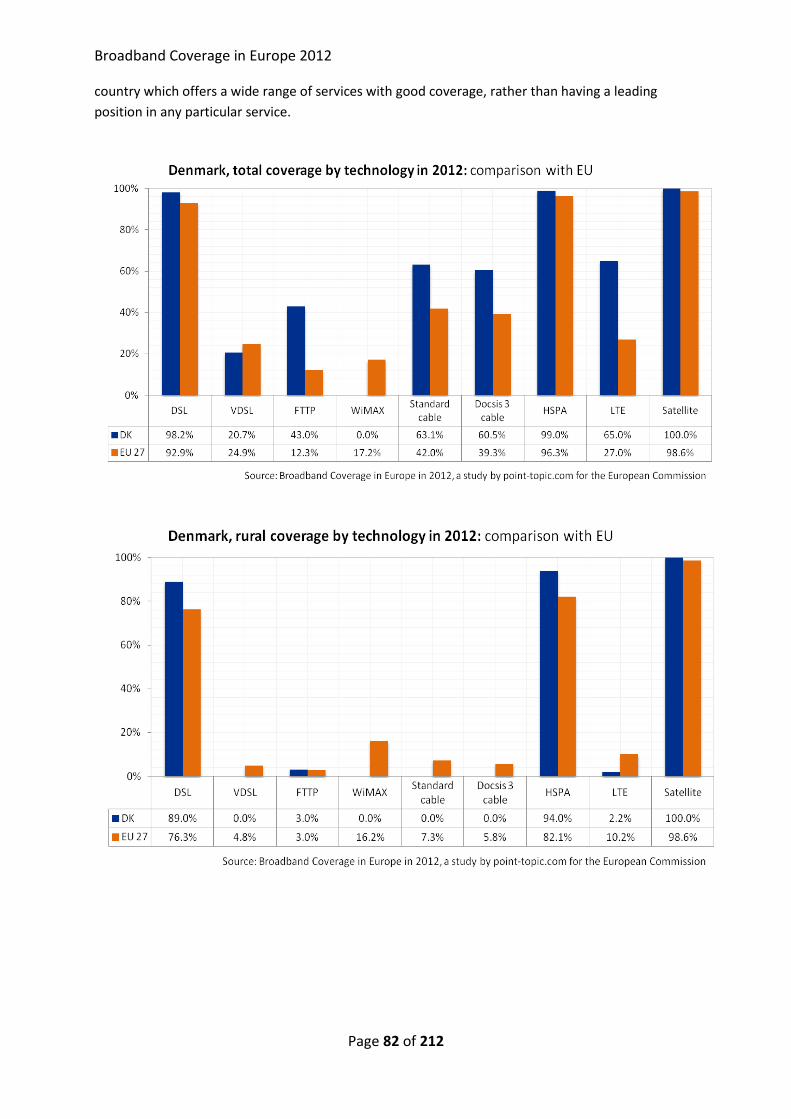
Broadband Coverage in Europe 2012
Page 82 of 212
country which offers a wide range of services with good coverage, rather than having a leading
position in any particular service.
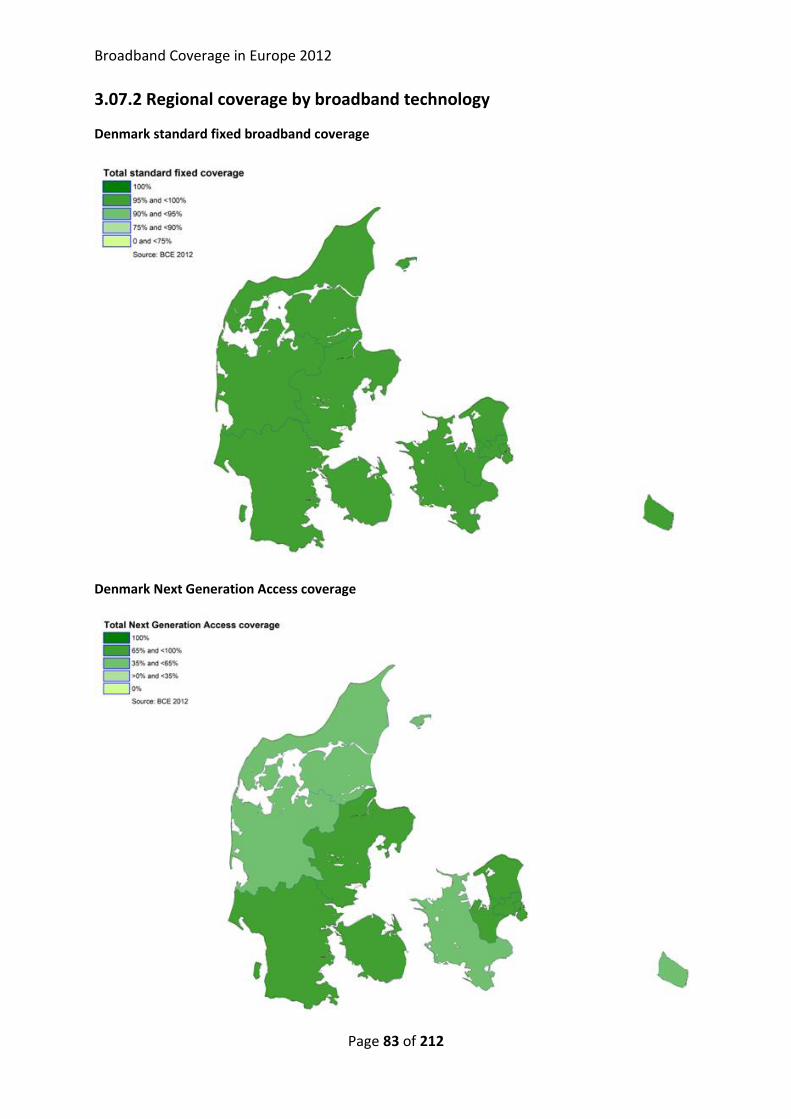
Broadband Coverage in Europe 2012
Page 83 of 212
3.07.2 Regional coverage by broadband technology
Denmark standard fixed broadband coverage
Denmark Next Generation Access coverage
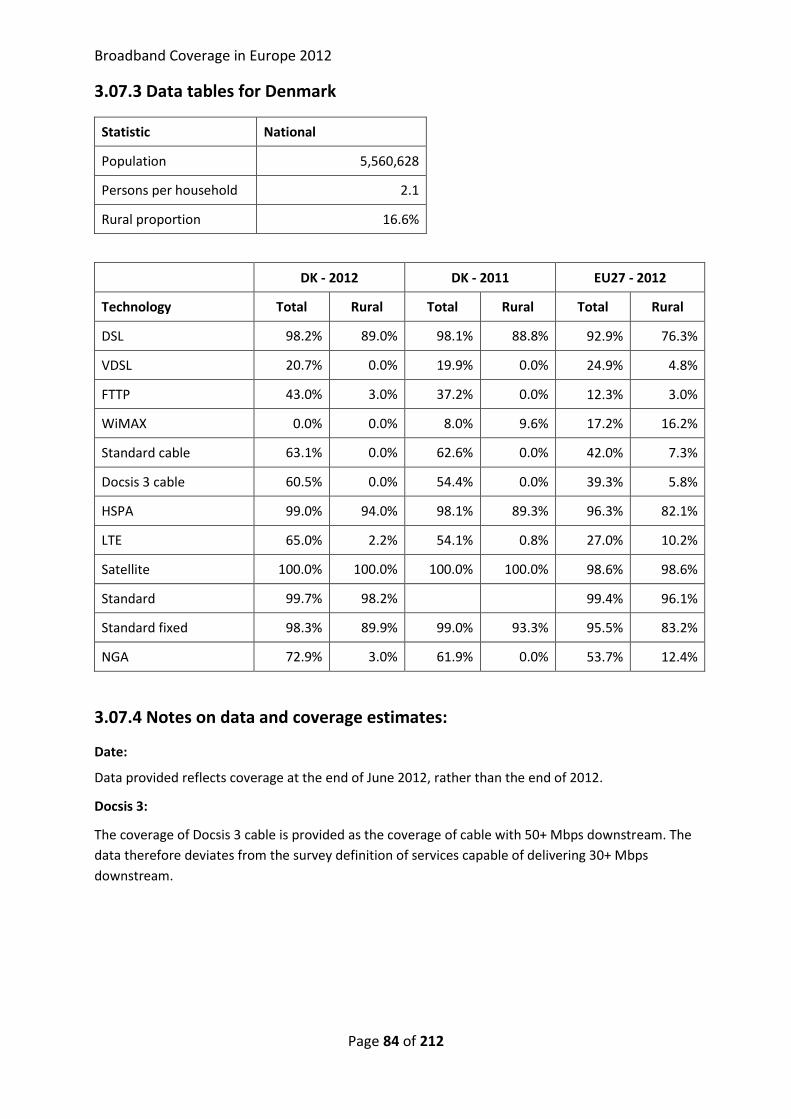
Broadband Coverage in Europe 2012
Page 84 of 212
3.07.3 Data tables for Denmark
Statistic National
Population 5,560,628
Persons per household 2.1
Rural proportion 16.6%
DK - 2012 DK - 2011 EU27 - 2012
Technology Total Rural Total Rural Total Rural
DSL 98.2% 89.0% 98.1% 88.8% 92.9% 76.3%
VDSL 20.7% 0.0% 19.9% 0.0% 24.9% 4.8%
FTTP 43.0% 3.0% 37.2% 0.0% 12.3% 3.0%
WiMAX 0.0% 0.0% 8.0% 9.6% 17.2% 16.2%
Standard cable 63.1% 0.0% 62.6% 0.0% 42.0% 7.3%
Docsis 3 cable 60.5% 0.0% 54.4% 0.0% 39.3% 5.8%
HSPA 99.0% 94.0% 98.1% 89.3% 96.3% 82.1%
LTE 65.0% 2.2% 54.1% 0.8% 27.0% 10.2%
Satellite 100.0% 100.0% 100.0% 100.0% 98.6% 98.6%
Standard 99.7% 98.2%
99.4% 96.1%
Standard fixed 98.3% 89.9% 99.0% 93.3% 95.5% 83.2%
NGA 72.9% 3.0% 61.9% 0.0% 53.7% 12.4%
3.07.4 Notes on data and coverage estimates:
Date:
Data provided reflects coverage at the end of June 2012, rather than the end of 2012.
Docsis 3:
The coverage of Docsis 3 cable is provided as the coverage of cable with 50+ Mbps downstream. The
data therefore deviates from the survey definition of services capable of delivering 30+ Mbps
downstream.
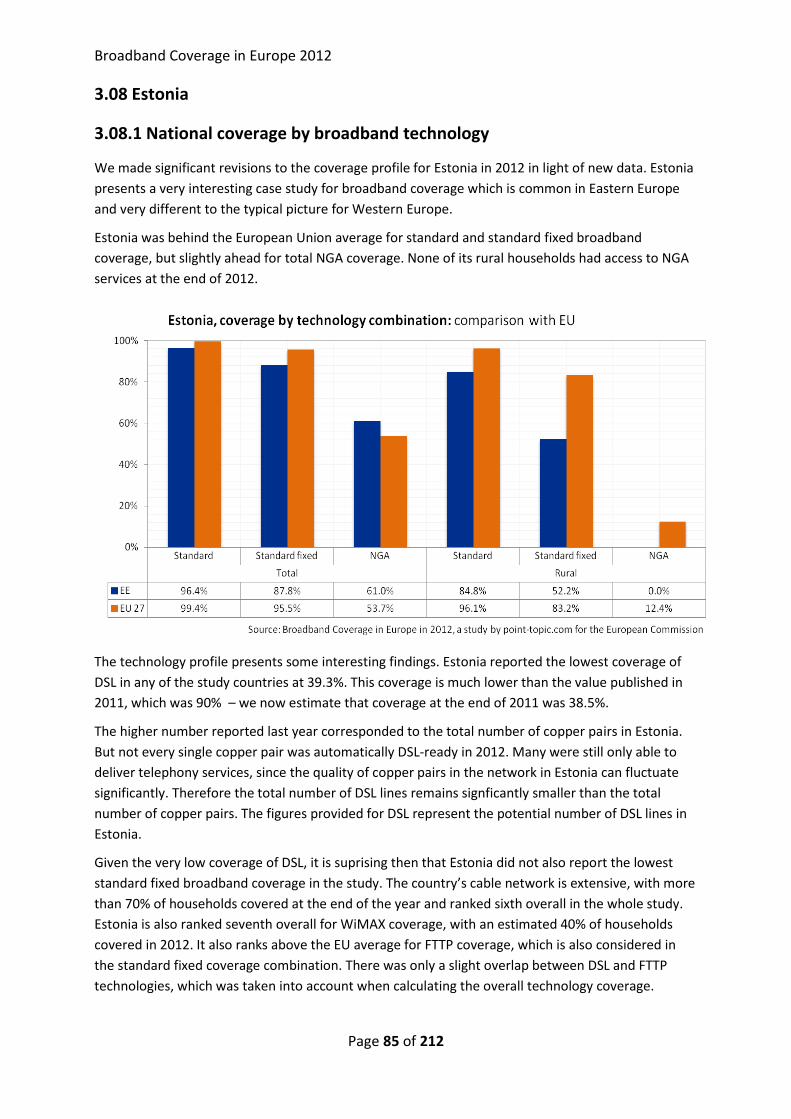
Broadband Coverage in Europe 2012
Page 85 of 212
3.08 Estonia
3.08.1 National coverage by broadband technology
We made significant revisions to the coverage profile for Estonia in 2012 in light of new data. Estonia
presents a very interesting case study for broadband coverage which is common in Eastern Europe
and very different to the typical picture for Western Europe.
Estonia was behind the European Union average for standard and standard fixed broadband
coverage, but slightly ahead for total NGA coverage. None of its rural households had access to NGA
services at the end of 2012.
The technology profile presents some interesting findings. Estonia reported the lowest coverage of
DSL in any of the study countries at 39.3%. This coverage is much lower than the value published in
2011, which was 90% – we now estimate that coverage at the end of 2011 was 38.5%.
The higher number reported last year corresponded to the total number of copper pairs in Estonia.
But not every single copper pair was automatically DSL-ready in 2012. Many were still only able to
deliver telephony services, since the quality of copper pairs in the network in Estonia can fluctuate
significantly. Therefore the total number of DSL lines remains signficantly smaller than the total
number of copper pairs. The figures provided for DSL represent the potential number of DSL lines in
Estonia.
Given the very low coverage of DSL, it is suprising then that Estonia did not also report the lowest
standard fixed broadband coverage in the study. The country’s cable network is extensive, with more
than 70% of households covered at the end of the year and ranked sixth overall in the whole study.
Estonia is also ranked seventh overall for WiMAX coverage, with an estimated 40% of households
covered in 2012. It also ranks above the EU average for FTTP coverage, which is also considered in
the standard fixed coverage combination. There was only a slight overlap between DSL and FTTP
technologies, which was taken into account when calculating the overall technology coverage.
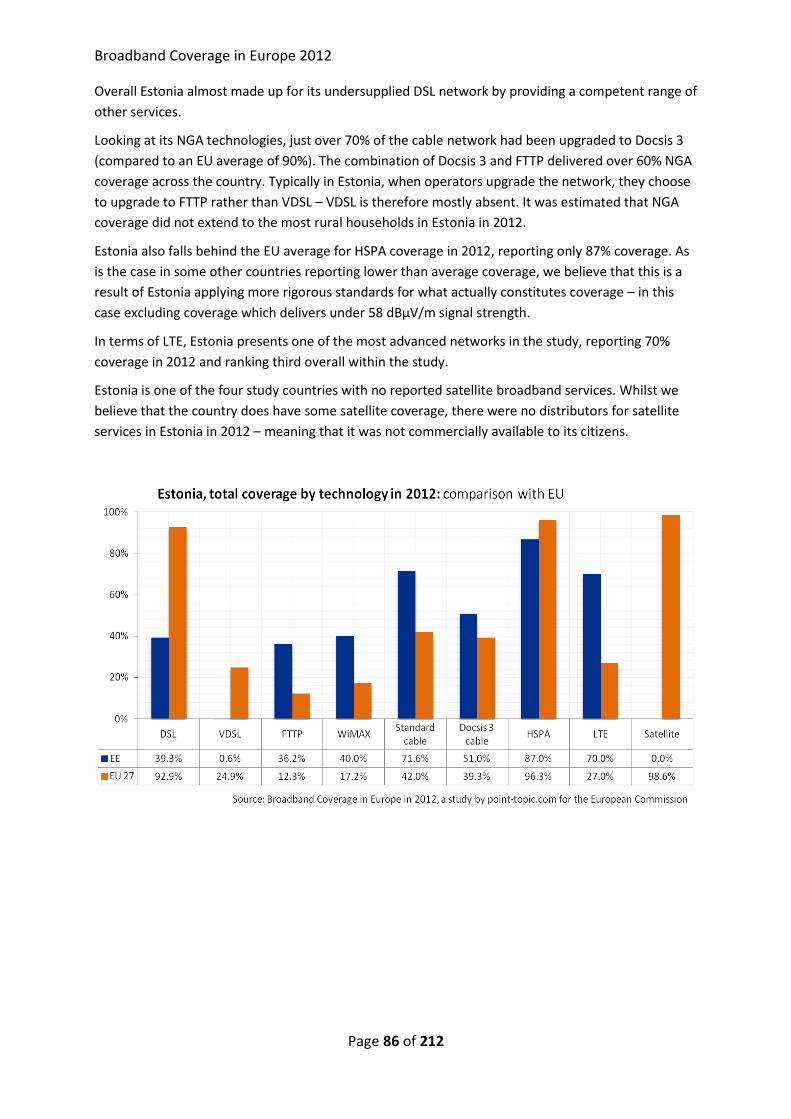
Broadband Coverage in Europe 2012
Page 86 of 212
Overall Estonia almost made up for its undersupplied DSL network by providing a competent range of
other services.
Looking at its NGA technologies, just over 70% of the cable network had been upgraded to Docsis 3
(compared to an EU average of 90%). The combination of Docsis 3 and FTTP delivered over 60% NGA
coverage across the country. Typically in Estonia, when operators upgrade the network, they choose
to upgrade to FTTP rather than VDSL – VDSL is therefore mostly absent. It was estimated that NGA
coverage did not extend to the most rural households in Estonia in 2012.
Estonia also falls behind the EU average for HSPA coverage in 2012, reporting only 87% coverage. As
is the case in some other countries reporting lower than average coverage, we believe that this is a
result of Estonia applying more rigorous standards for what actually constitutes coverage – in this
case excluding coverage which delivers under 58 dBμV/m signal strength.
In terms of LTE, Estonia presents one of the most advanced networks in the study, reporting 70%
coverage in 2012 and ranking third overall within the study.
Estonia is one of the four study countries with no reported satellite broadband services. Whilst we
believe that the country does have some satellite coverage, there were no distributors for satellite
services in Estonia in 2012 – meaning that it was not commercially available to its citizens.
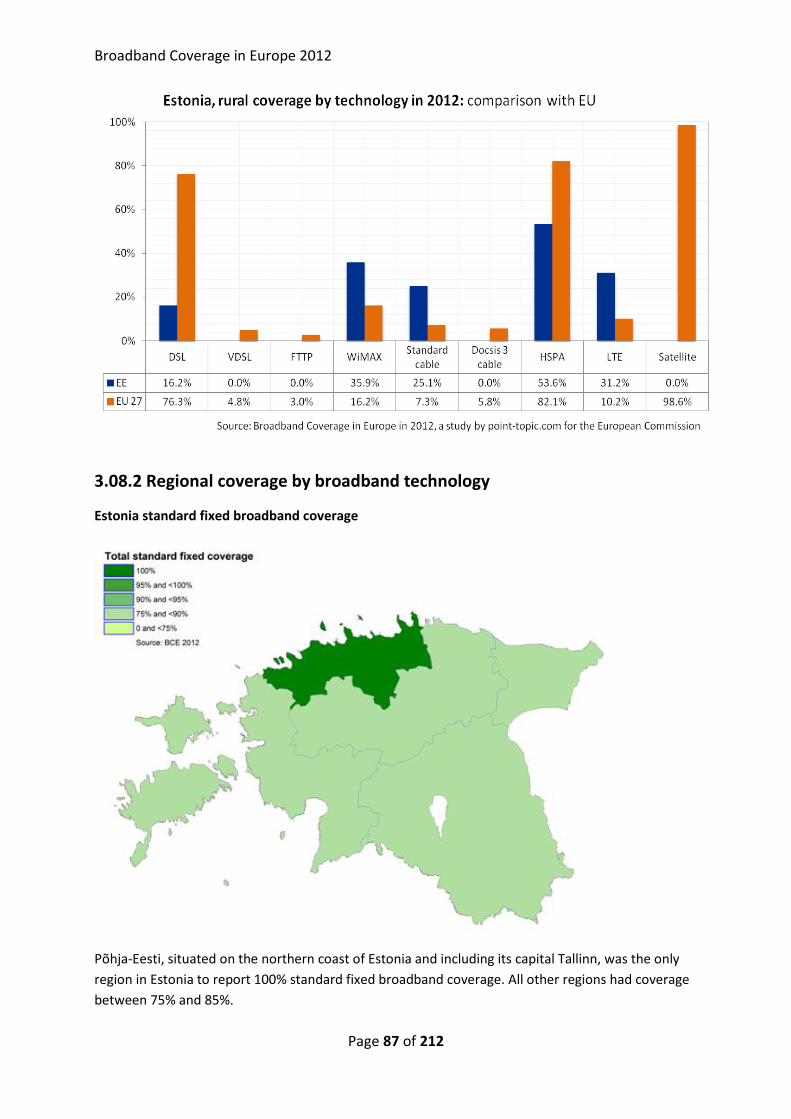
Broadband Coverage in Europe 2012
Page 87 of 212
3.08.2 Regional coverage by broadband technology
Estonia standard fixed broadband coverage
Põhja-Eesti, situated on the northern coast of Estonia and including its capital Tallinn, was the only
region in Estonia to report 100% standard fixed broadband coverage. All other regions had coverage
between 75% and 85%.
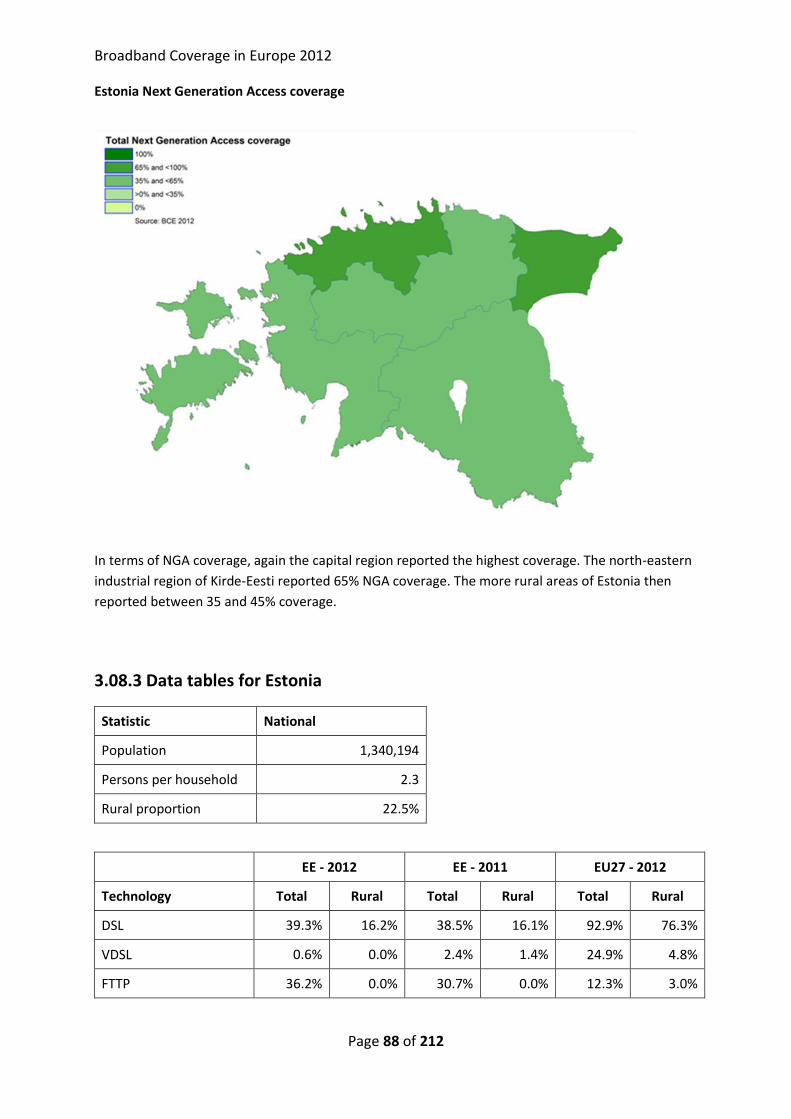
Broadband Coverage in Europe 2012
Page 88 of 212
Estonia Next Generation Access coverage
In terms of NGA coverage, again the capital region reported the highest coverage. The north-eastern
industrial region of Kirde-Eesti reported 65% NGA coverage. The more rural areas of Estonia then
reported between 35 and 45% coverage.
3.08.3 Data tables for Estonia
Statistic National
Population 1,340,194
Persons per household 2.3
Rural proportion 22.5%
EE - 2012 EE - 2011 EU27 - 2012
Technology Total Rural Total Rural Total Rural
DSL 39.3% 16.2% 38.5% 16.1% 92.9% 76.3%
VDSL 0.6% 0.0% 2.4% 1.4% 24.9% 4.8%
FTTP 36.2% 0.0% 30.7% 0.0% 12.3% 3.0%

Broadband Coverage in Europe 2012
Page 89 of 212
WiMAX 40.0% 35.9% 40.0% 35.9% 17.2% 16.2%
Standard cable 71.6% 25.1% 71.5% 13.7% 42.0% 7.3%
Docsis 3 cable 51.0% 0.0% 37.0% 0.0% 39.3% 5.8%
HSPA 87.0% 53.6% 87.0% 53.6% 96.3% 82.1%
LTE 70.0% 31.2% 70.0% 31.0% 27.0% 10.2%
Satellite 0.0% 0.0% 0.0% 0.0% 98.6% 98.6%
Standard 96.4% 84.8%
99.4% 96.1%
Standard fixed 87.8% 52.2% 86.0% 50.4% 95.5% 83.2%
NGA 61.0% 0.0% 52.1% 1.4% 53.7% 12.4%
3.08.4 Notes on data and coverage estimates:
Notes on technology definitions:
HSPA coverage report only includes areas covered by a signal strength greater than 58 dBμV/m,
which is considered sufficient to deliver access to data connections.
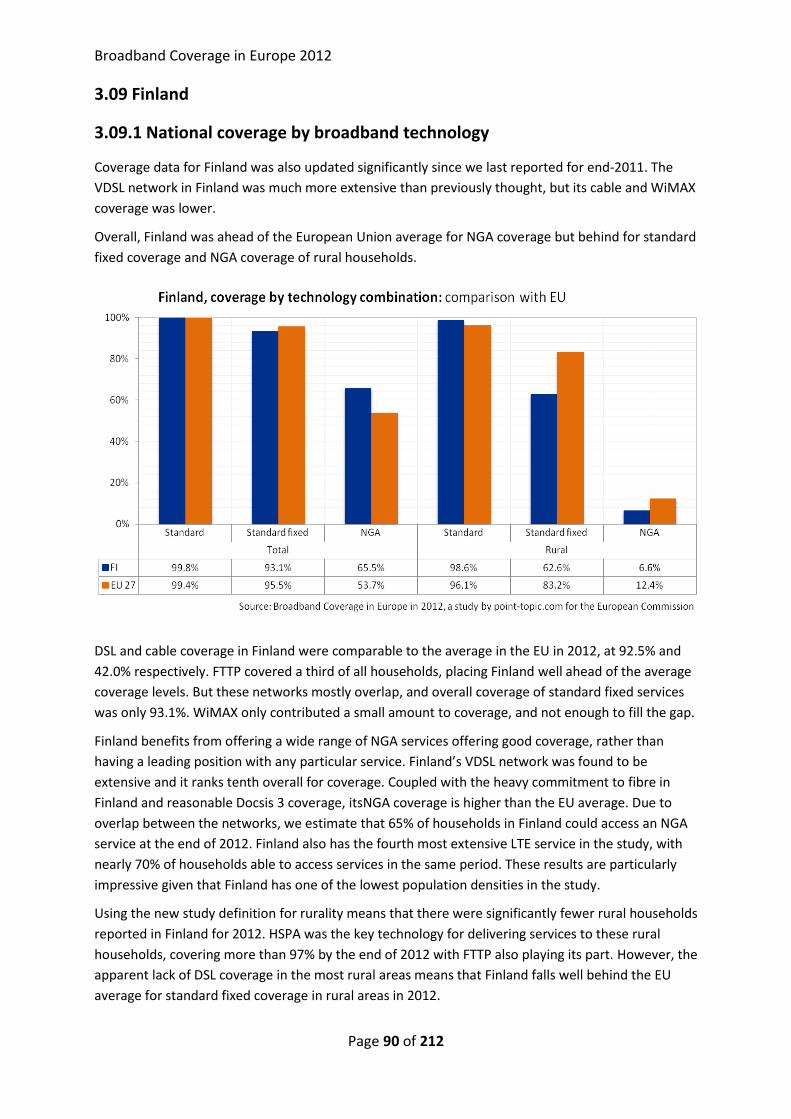
Broadband Coverage in Europe 2012
Page 90 of 212
3.09 Finland
3.09.1 National coverage by broadband technology
Coverage data for Finland was also updated significantly since we last reported for end-2011. The
VDSL network in Finland was much more extensive than previously thought, but its cable and WiMAX
coverage was lower.
Overall, Finland was ahead of the European Union average for NGA coverage but behind for standard
fixed coverage and NGA coverage of rural households.
DSL and cable coverage in Finland were comparable to the average in the EU in 2012, at 92.5% and
42.0% respectively. FTTP covered a third of all households, placing Finland well ahead of the average
coverage levels. But these networks mostly overlap, and overall coverage of standard fixed services
was only 93.1%. WiMAX only contributed a small amount to coverage, and not enough to fill the gap.
Finland benefits from offering a wide range of NGA services offering good coverage, rather than
having a leading position with any particular service. Finland’s VDSL network was found to be
extensive and it ranks tenth overall for coverage. Coupled with the heavy commitment to fibre in
Finland and reasonable Docsis 3 coverage, itsNGA coverage is higher than the EU average. Due to
overlap between the networks, we estimate that 65% of households in Finland could access an NGA
service at the end of 2012. Finland also has the fourth most extensive LTE service in the study, with
nearly 70% of households able to access services in the same period. These results are particularly
impressive given that Finland has one of the lowest population densities in the study.
Using the new study definition for rurality means that there were significantly fewer rural households
reported in Finland for 2012. HSPA was the key technology for delivering services to these rural
households, covering more than 97% by the end of 2012 with FTTP also playing its part. However, the
apparent lack of DSL coverage in the most rural areas means that Finland falls well behind the EU
average for standard fixed coverage in rural areas in 2012.
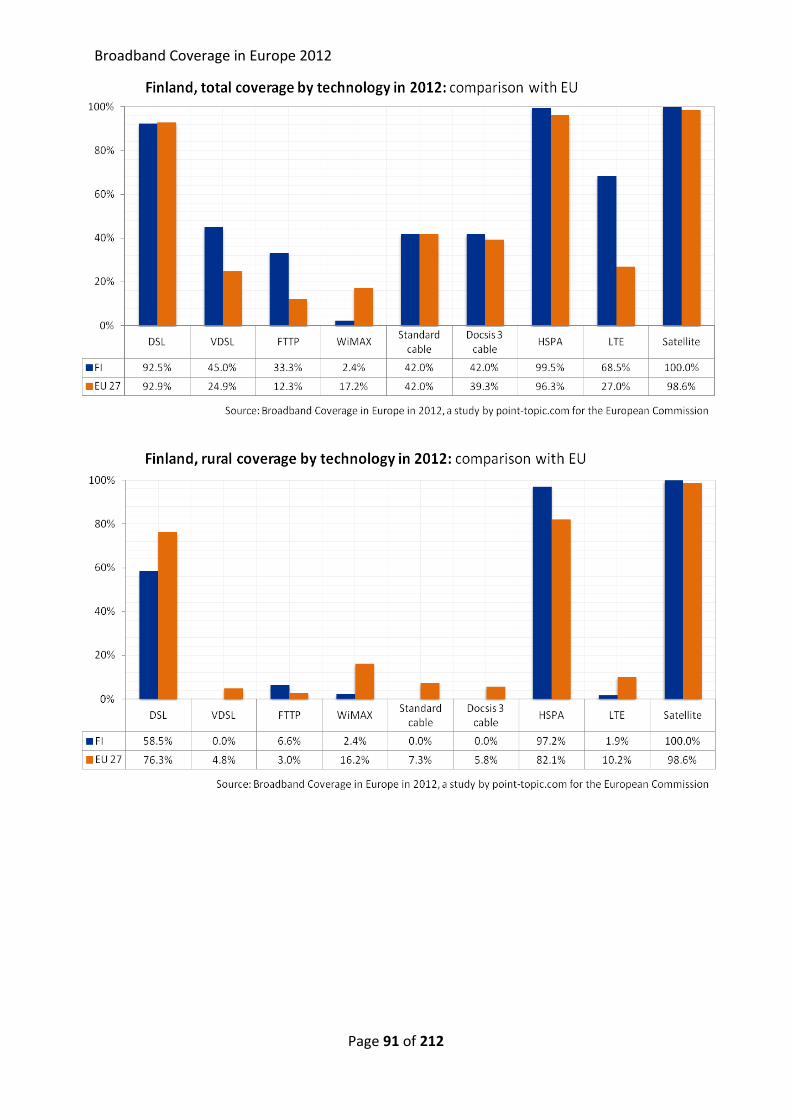
Broadband Coverage in Europe 2012
Page 91 of 212
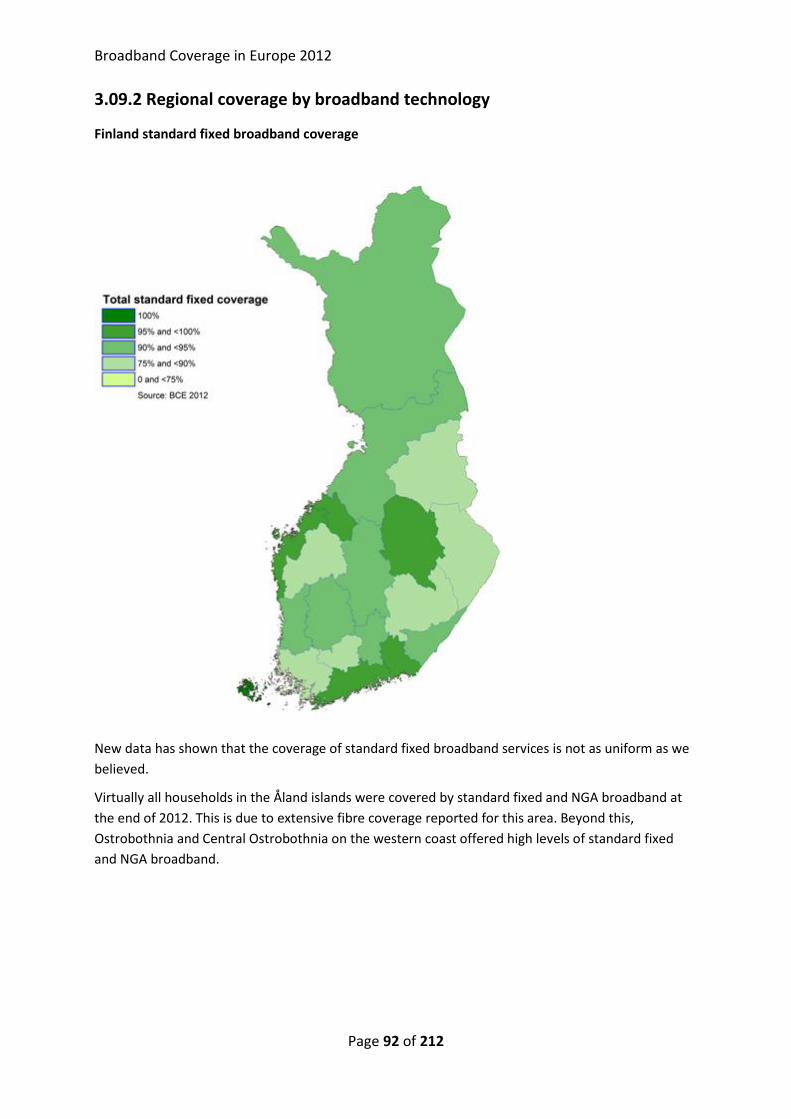
Broadband Coverage in Europe 2012
Page 92 of 212
3.09.2 Regional coverage by broadband technology
Finland standard fixed broadband coverage
New data has shown that the coverage of standard fixed broadband services is not as uniform as we
believed.
Virtually all households in the Åland islands were covered by standard fixed and NGA broadband at
the end of 2012. This is due to extensive fibre coverage reported for this area. Beyond this,
Ostrobothnia and Central Ostrobothnia on the western coast offered high levels of standard fixed
and NGA broadband.

Broadband Coverage in Europe 2012
Page 93 of 212
Finland Next Generation Access coverage
3.09.3 Data tables for Finland
Statistic National
Population 5,514,549
Persons per household 2.1
Rural proportion 18.1%
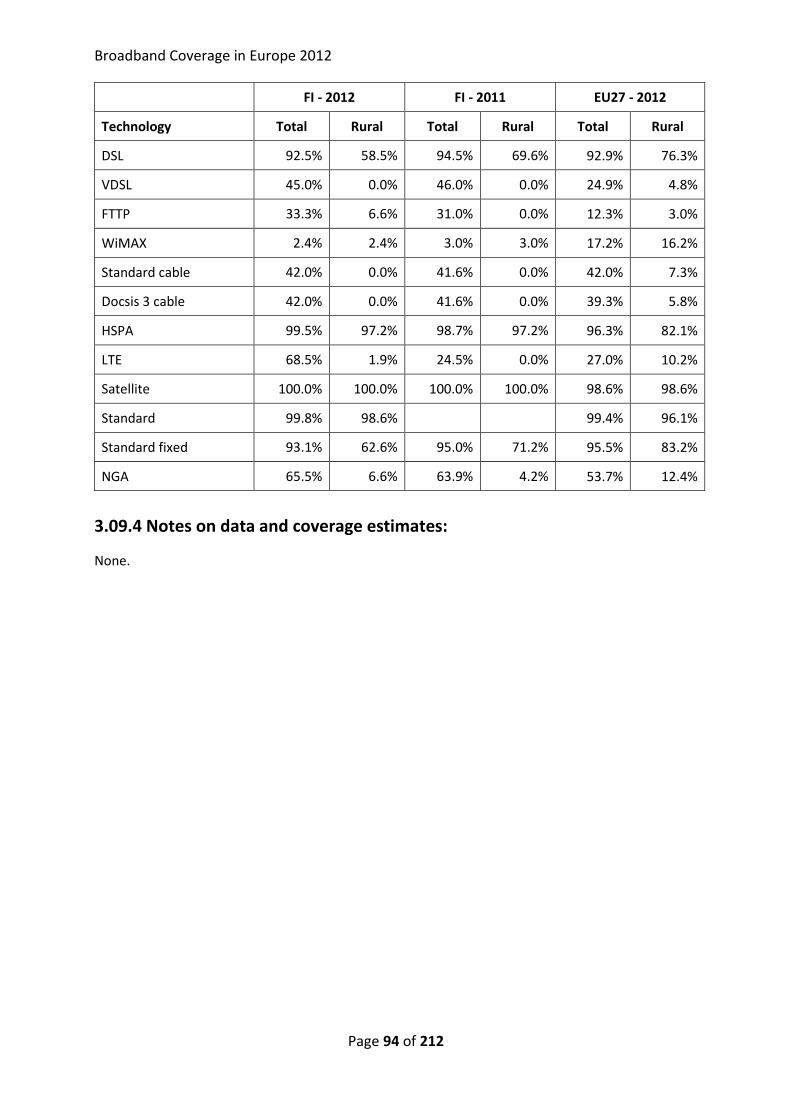
Broadband Coverage in Europe 2012
Page 94 of 212
FI - 2012 FI - 2011 EU27 - 2012
Technology Total Rural Total Rural Total Rural
DSL 92.5% 58.5% 94.5% 69.6% 92.9% 76.3%
VDSL 45.0% 0.0% 46.0% 0.0% 24.9% 4.8%
FTTP 33.3% 6.6% 31.0% 0.0% 12.3% 3.0%
WiMAX 2.4% 2.4% 3.0% 3.0% 17.2% 16.2%
Standard cable 42.0% 0.0% 41.6% 0.0% 42.0% 7.3%
Docsis 3 cable 42.0% 0.0% 41.6% 0.0% 39.3% 5.8%
HSPA 99.5% 97.2% 98.7% 97.2% 96.3% 82.1%
LTE 68.5% 1.9% 24.5% 0.0% 27.0% 10.2%
Satellite 100.0% 100.0% 100.0% 100.0% 98.6% 98.6%
Standard 99.8% 98.6%
99.4% 96.1%
Standard fixed 93.1% 62.6% 95.0% 71.2% 95.5% 83.2%
NGA 65.5% 6.6% 63.9% 4.2% 53.7% 12.4%
3.09.4 Notes on data and coverage estimates:
None.

Broadband Coverage in Europe 2012
Page 95 of 212
3.10 France
3.10.1 National coverage by broadband technology
The results presented for France need careful interpretation and the notes on the source for the data
give more background on the data that has been provided.
France was ahead of the European Union average for standard and standard fixed broadband
measures, particularly in rural areas. But it was some way behind for NGA services – with 24.2% of
households covered it was in the bottom four countries for the study overall.
The data assumes that DSL services were available to nearly all households and most rural
households at the end of 2012. The coverage reported here is not an exact interpretation of
households passed by DSL services, and it is important to note the caveats within the notes at the
end of this chapter.
HSPA services were also found to be available to nearly all householdss – and so the combination of
HSPA coverage and our estimate for DSL coverage results in higher than average coverage for
standard and standard fixed broadband services.
By the end of 2012 France had no VDSL services and lower than average cable coverage. The best
estimate available is that Docsis 3 was available through more than 80% of the cable network,
providing around 20% coverage overall. Note that this is an estimate and precise data is not
available. FTTP was then available to approximately 6.5% of households (again, please refer to the
notes for the precise interpretation of this figure).
The net result is that overall NGA coverage in France is low compared to the rest of the EU. As one of
the EU’s largest countries, this has a big impact on the results presented for the EU 27 as a whole.
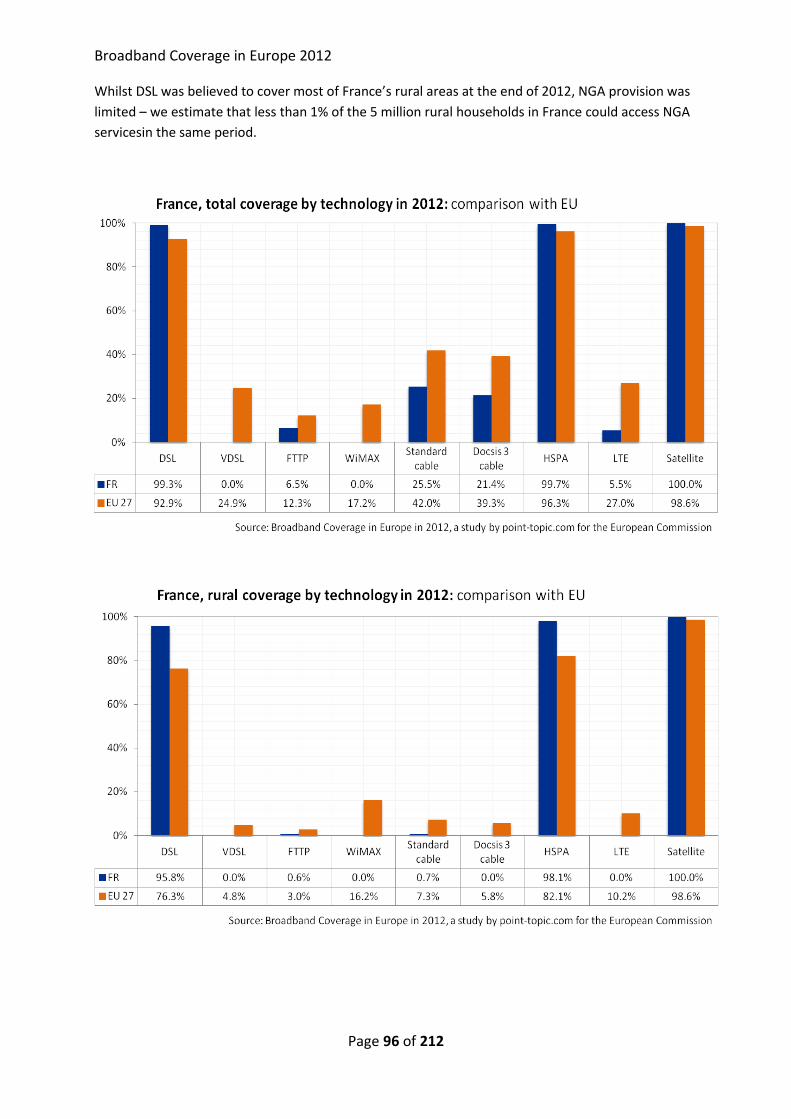
Broadband Coverage in Europe 2012
Page 96 of 212
Whilst DSL was believed to cover most of France’s rural areas at the end of 2012, NGA provision was
limited – we estimate that less than 1% of the 5 million rural households in France could access NGA
servicesin the same period.
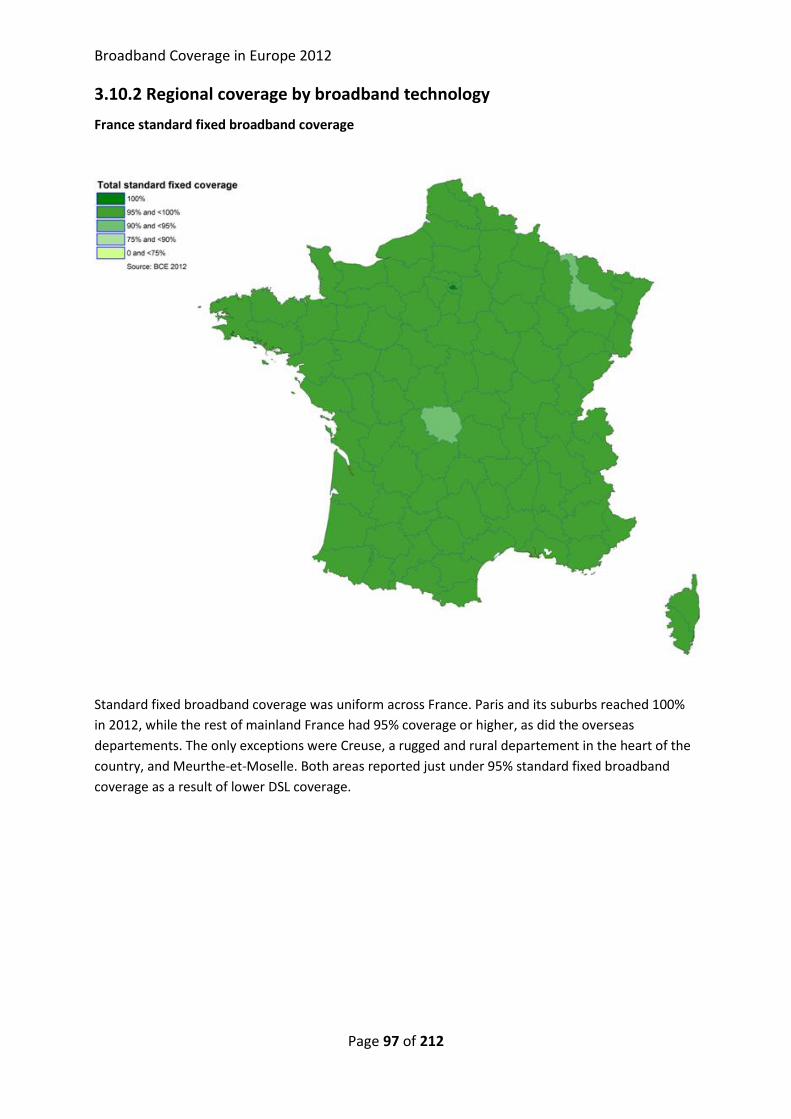
Broadband Coverage in Europe 2012
Page 97 of 212
3.10.2 Regional coverage by broadband technology
France standard fixed broadband coverage
Standard fixed broadband coverage was uniform across France. Paris and its suburbs reached 100%
in 2012, while the rest of mainland France had 95% coverage or higher, as did the overseas
departements. The only exceptions were Creuse, a rugged and rural departement in the heart of the
country, and Meurthe-et-Moselle. Both areas reported just under 95% standard fixed broadband
coverage as a result of lower DSL coverage.
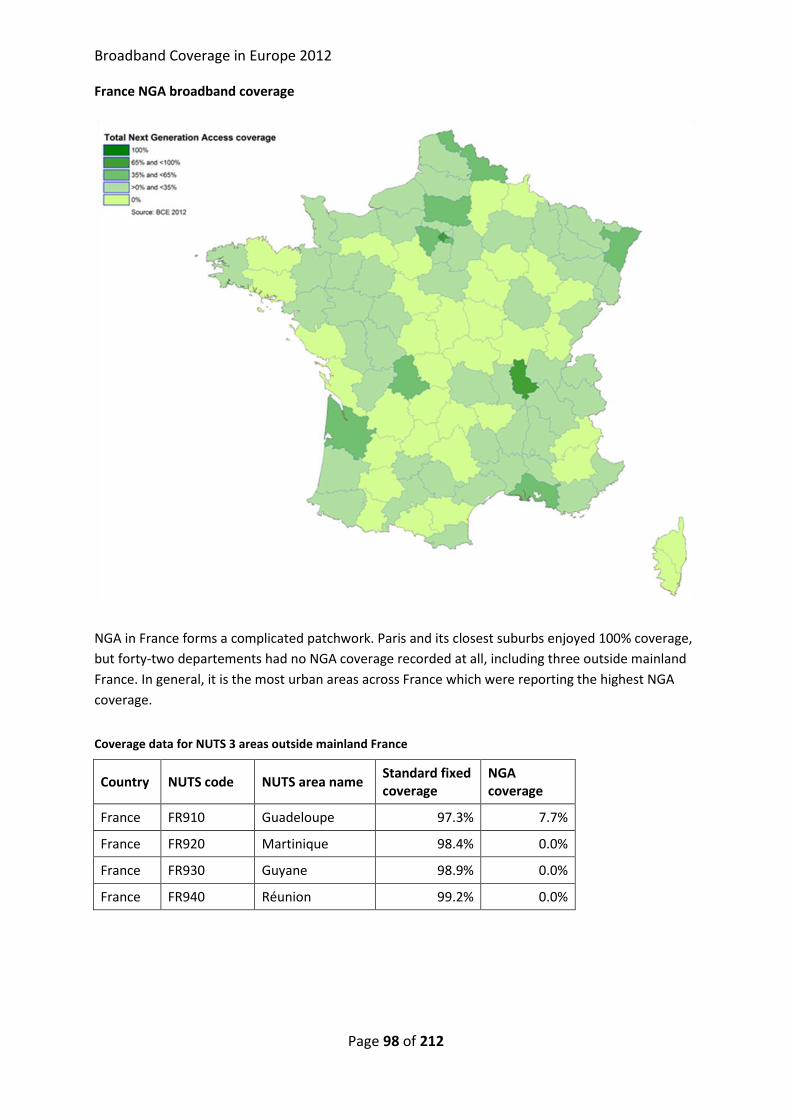
Broadband Coverage in Europe 2012
Page 98 of 212
France NGA broadband coverage
NGA in France forms a complicated patchwork. Paris and its closest suburbs enjoyed 100% coverage,
but forty-two departements had no NGA coverage recorded at all, including three outside mainland
France. In general, it is the most urban areas across France which were reporting the highest NGA
coverage.
Coverage data for NUTS 3 areas outside mainland France
Country NUTS code NUTS area name Standard fixed coverage
NGA coverage
France FR910 Guadeloupe 97.3% 7.7%
France FR920 Martinique 98.4% 0.0%
France FR930 Guyane 98.9% 0.0%
France FR940 Réunion 99.2% 0.0%
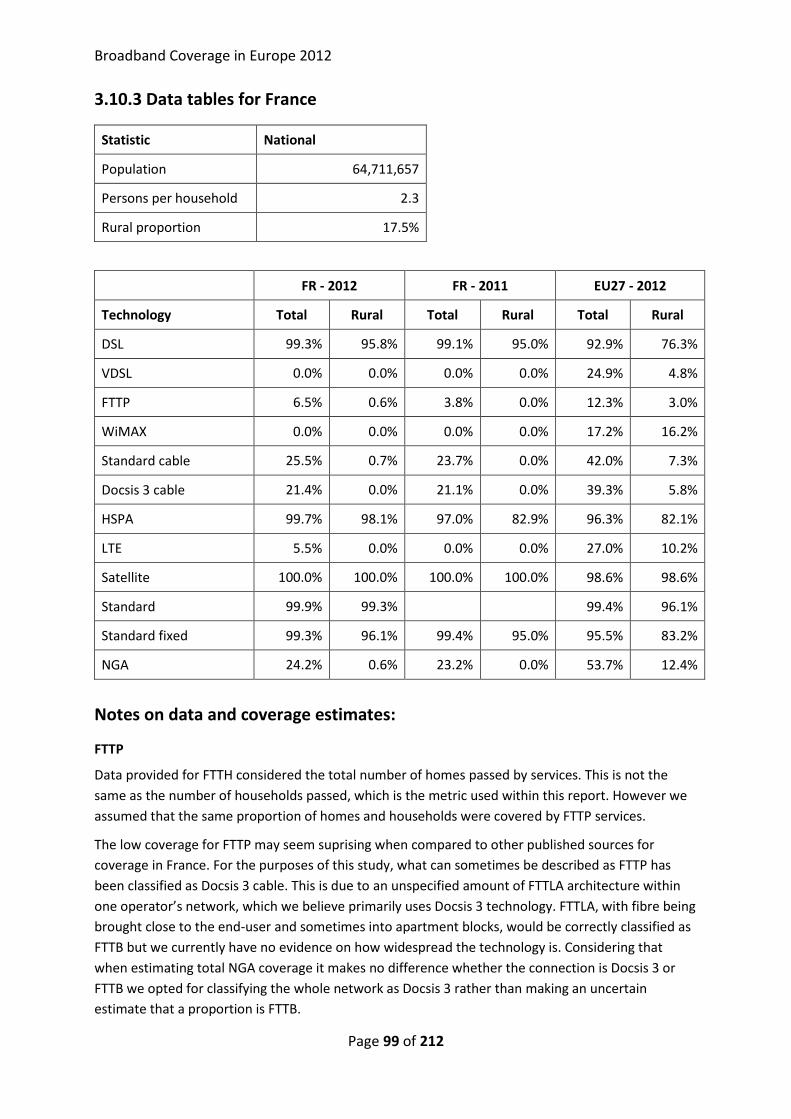
Broadband Coverage in Europe 2012
Page 99 of 212
3.10.3 Data tables for France
Statistic National
Population 64,711,657
Persons per household 2.3
Rural proportion 17.5%
FR - 2012 FR - 2011 EU27 - 2012
Technology Total Rural Total Rural Total Rural
DSL 99.3% 95.8% 99.1% 95.0% 92.9% 76.3%
VDSL 0.0% 0.0% 0.0% 0.0% 24.9% 4.8%
FTTP 6.5% 0.6% 3.8% 0.0% 12.3% 3.0%
WiMAX 0.0% 0.0% 0.0% 0.0% 17.2% 16.2%
Standard cable 25.5% 0.7% 23.7% 0.0% 42.0% 7.3%
Docsis 3 cable 21.4% 0.0% 21.1% 0.0% 39.3% 5.8%
HSPA 99.7% 98.1% 97.0% 82.9% 96.3% 82.1%
LTE 5.5% 0.0% 0.0% 0.0% 27.0% 10.2%
Satellite 100.0% 100.0% 100.0% 100.0% 98.6% 98.6%
Standard 99.9% 99.3%
99.4% 96.1%
Standard fixed 99.3% 96.1% 99.4% 95.0% 95.5% 83.2%
NGA 24.2% 0.6% 23.2% 0.0% 53.7% 12.4%
Notes on data and coverage estimates:
FTTP
Data provided for FTTH considered the total number of homes passed by services. This is not the
same as the number of households passed, which is the metric used within this report. However we
assumed that the same proportion of homes and households were covered by FTTP services.
The low coverage for FTTP may seem suprising when compared to other published sources for
coverage in France. For the purposes of this study, what can sometimes be described as FTTP has
been classified as Docsis 3 cable. This is due to an unspecified amount of FTTLA architecture within
one operator’s network, which we believe primarily uses Docsis 3 technology. FTTLA, with fibre being
brought close to the end-user and sometimes into apartment blocks, would be correctly classified as
FTTB but we currently have no evidence on how widespread the technology is. Considering that
when estimating total NGA coverage it makes no difference whether the connection is Docsis 3 or
FTTB we opted for classifying the whole network as Docsis 3 rather than making an uncertain
estimate that a proportion is FTTB.
Broadband Coverage in Europe 2012
Page 100 of 212
DSL
We have assumed that 99.3% of households could access DSL services by the end of 2012. The
percentage is based on the ratio of DSL copper lines to the global number of copper lines. We were
advised that applying this ratio to estimate household coverage would result in an inaccurate figure,
but we did not have any more precise data available to us.
Cable
It was not possible to gain precise figures for the coverage of Docsis 3 in France. The figure reported
is therefore an estimate.
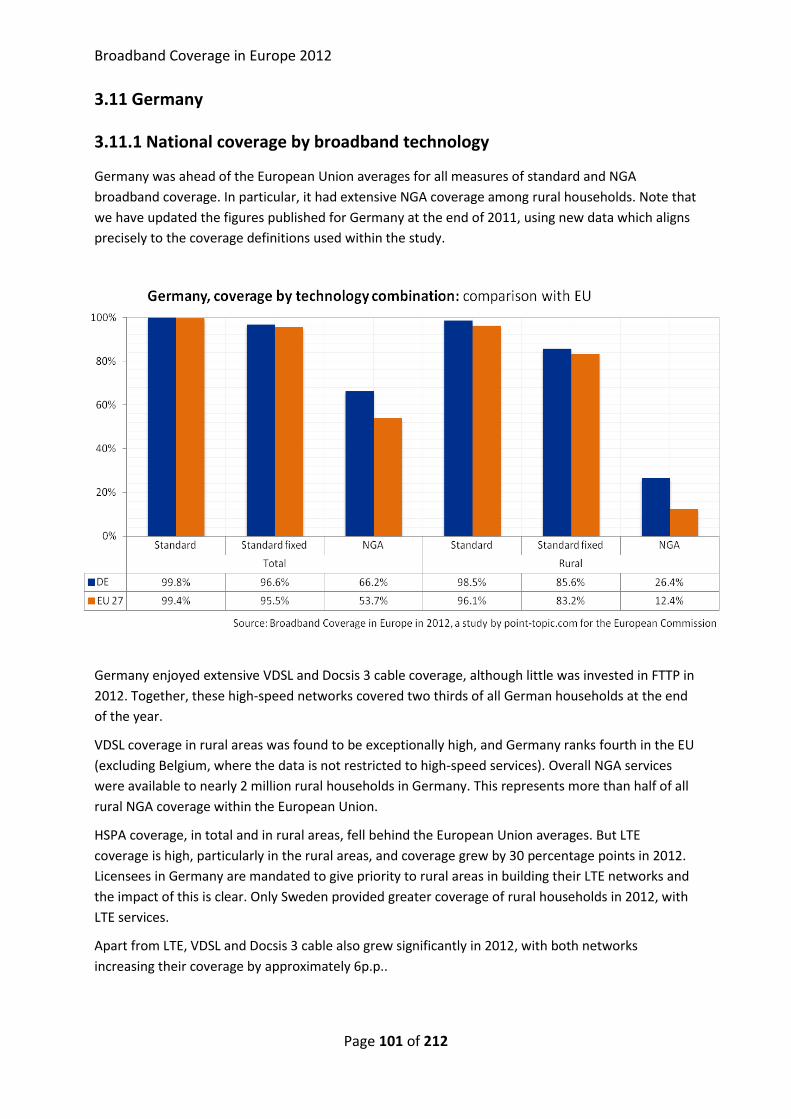
Broadband Coverage in Europe 2012
Page 101 of 212
3.11 Germany
3.11.1 National coverage by broadband technology
Germany was ahead of the European Union averages for all measures of standard and NGA
broadband coverage. In particular, it had extensive NGA coverage among rural households. Note that
we have updated the figures published for Germany at the end of 2011, using new data which aligns
precisely to the coverage definitions used within the study.
Germany enjoyed extensive VDSL and Docsis 3 cable coverage, although little was invested in FTTP in
2012. Together, these high-speed networks covered two thirds of all German households at the end
of the year.
VDSL coverage in rural areas was found to be exceptionally high, and Germany ranks fourth in the EU
(excluding Belgium, where the data is not restricted to high-speed services). Overall NGA services
were available to nearly 2 million rural households in Germany. This represents more than half of all
rural NGA coverage within the European Union.
HSPA coverage, in total and in rural areas, fell behind the European Union averages. But LTE
coverage is high, particularly in the rural areas, and coverage grew by 30 percentage points in 2012.
Licensees in Germany are mandated to give priority to rural areas in building their LTE networks and
the impact of this is clear. Only Sweden provided greater coverage of rural households in 2012, with
LTE services.
Apart from LTE, VDSL and Docsis 3 cable also grew significantly in 2012, with both networks
increasing their coverage by approximately 6p.p..
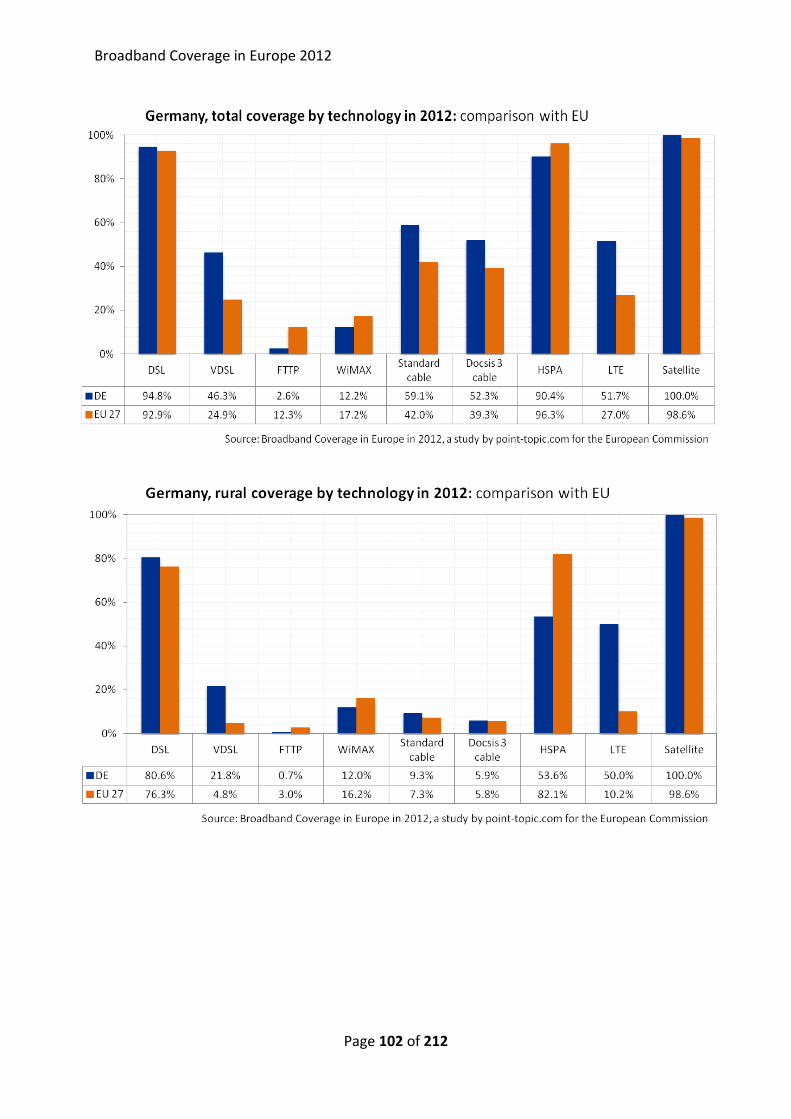
Broadband Coverage in Europe 2012
Page 102 of 212
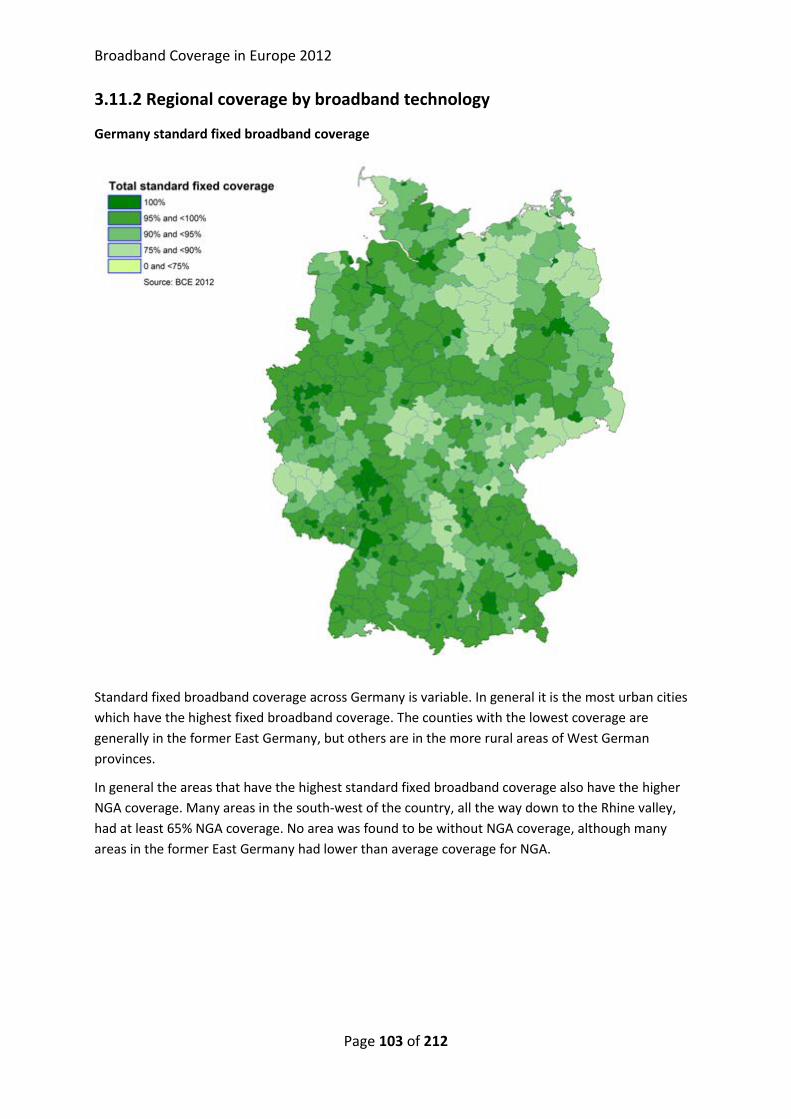
Broadband Coverage in Europe 2012
Page 103 of 212
3.11.2 Regional coverage by broadband technology
Germany standard fixed broadband coverage
Standard fixed broadband coverage across Germany is variable. In general it is the most urban cities
which have the highest fixed broadband coverage. The counties with the lowest coverage are
generally in the former East Germany, but others are in the more rural areas of West German
provinces.
In general the areas that have the highest standard fixed broadband coverage also have the higher
NGA coverage. Many areas in the south-west of the country, all the way down to the Rhine valley,
had at least 65% NGA coverage. No area was found to be without NGA coverage, although many
areas in the former East Germany had lower than average coverage for NGA.
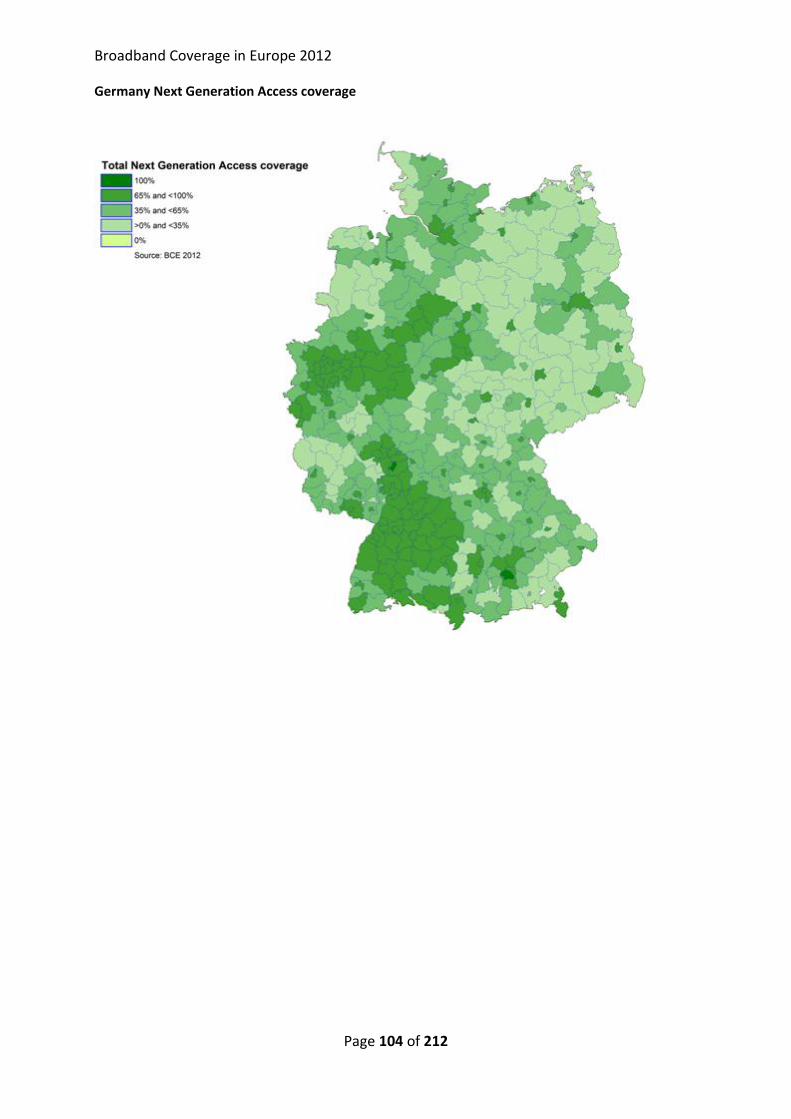
Broadband Coverage in Europe 2012
Page 104 of 212
Germany Next Generation Access coverage
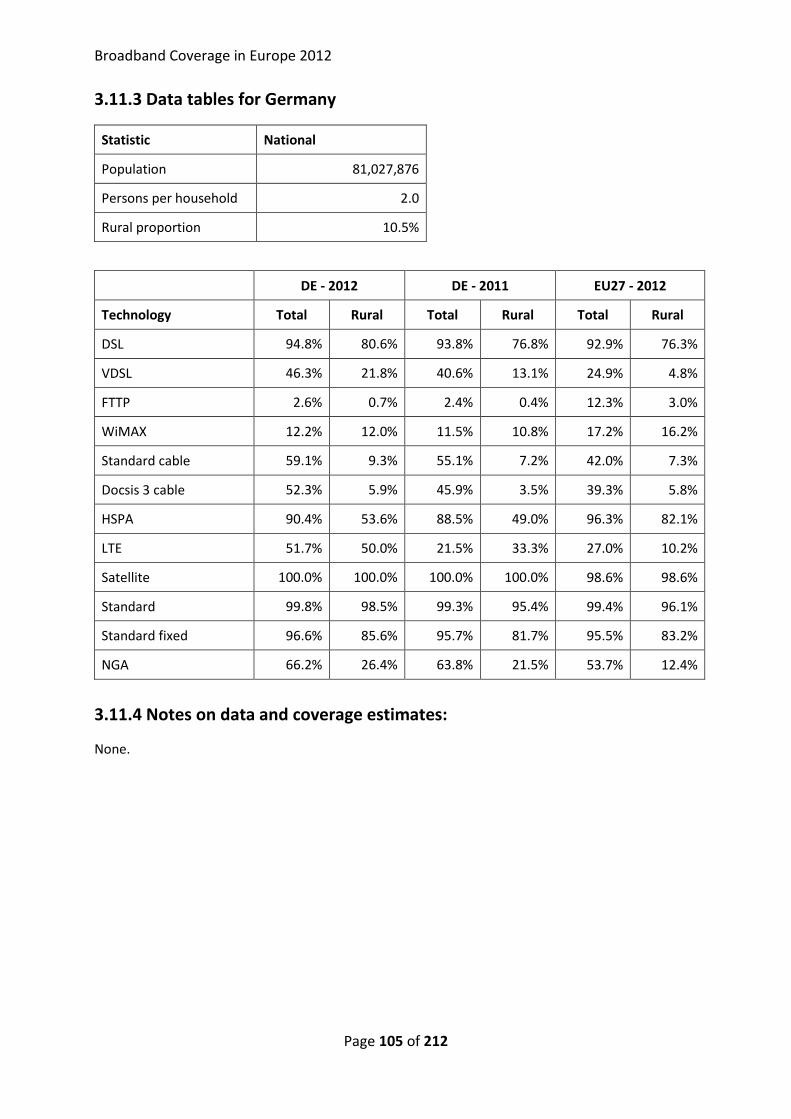
Broadband Coverage in Europe 2012
Page 105 of 212
3.11.3 Data tables for Germany
Statistic National
Population 81,027,876
Persons per household 2.0
Rural proportion 10.5%
DE - 2012 DE - 2011 EU27 - 2012
Technology Total Rural Total Rural Total Rural
DSL 94.8% 80.6% 93.8% 76.8% 92.9% 76.3%
VDSL 46.3% 21.8% 40.6% 13.1% 24.9% 4.8%
FTTP 2.6% 0.7% 2.4% 0.4% 12.3% 3.0%
WiMAX 12.2% 12.0% 11.5% 10.8% 17.2% 16.2%
Standard cable 59.1% 9.3% 55.1% 7.2% 42.0% 7.3%
Docsis 3 cable 52.3% 5.9% 45.9% 3.5% 39.3% 5.8%
HSPA 90.4% 53.6% 88.5% 49.0% 96.3% 82.1%
LTE 51.7% 50.0% 21.5% 33.3% 27.0% 10.2%
Satellite 100.0% 100.0% 100.0% 100.0% 98.6% 98.6%
Standard 99.8% 98.5% 99.3% 95.4% 99.4% 96.1%
Standard fixed 96.6% 85.6% 95.7% 81.7% 95.5% 83.2%
NGA 66.2% 26.4% 63.8% 21.5% 53.7% 12.4%
3.11.4 Notes on data and coverage estimates:
None.
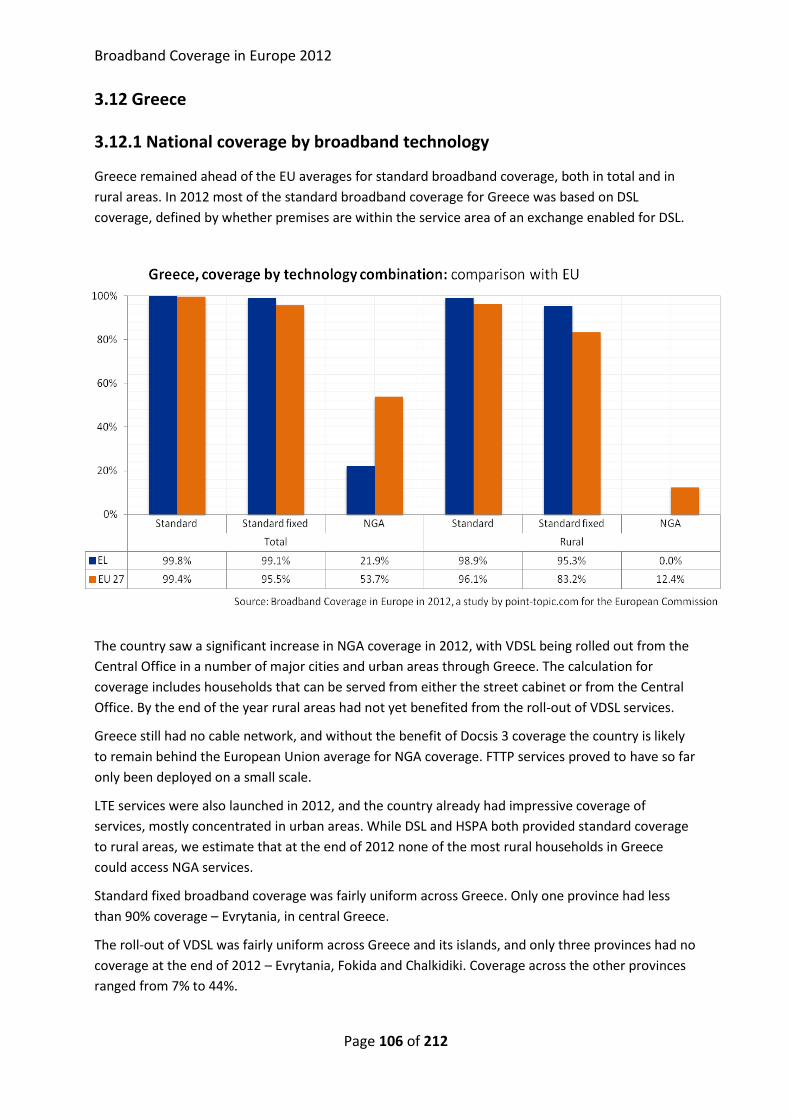
Broadband Coverage in Europe 2012
Page 106 of 212
3.12 Greece
3.12.1 National coverage by broadband technology
Greece remained ahead of the EU averages for standard broadband coverage, both in total and in
rural areas. In 2012 most of the standard broadband coverage for Greece was based on DSL
coverage, defined by whether premises are within the service area of an exchange enabled for DSL.
The country saw a significant increase in NGA coverage in 2012, with VDSL being rolled out from the
Central Office in a number of major cities and urban areas through Greece. The calculation for
coverage includes households that can be served from either the street cabinet or from the Central
Office. By the end of the year rural areas had not yet benefited from the roll-out of VDSL services.
Greece still had no cable network, and without the benefit of Docsis 3 coverage the country is likely
to remain behind the European Union average for NGA coverage. FTTP services proved to have so far
only been deployed on a small scale.
LTE services were also launched in 2012, and the country already had impressive coverage of
services, mostly concentrated in urban areas. While DSL and HSPA both provided standard coverage
to rural areas, we estimate that at the end of 2012 none of the most rural households in Greece
could access NGA services.
Standard fixed broadband coverage was fairly uniform across Greece. Only one province had less
than 90% coverage – Evrytania, in central Greece.
The roll-out of VDSL was fairly uniform across Greece and its islands, and only three provinces had no
coverage at the end of 2012 – Evrytania, Fokida and Chalkidiki. Coverage across the other provinces
ranged from 7% to 44%.
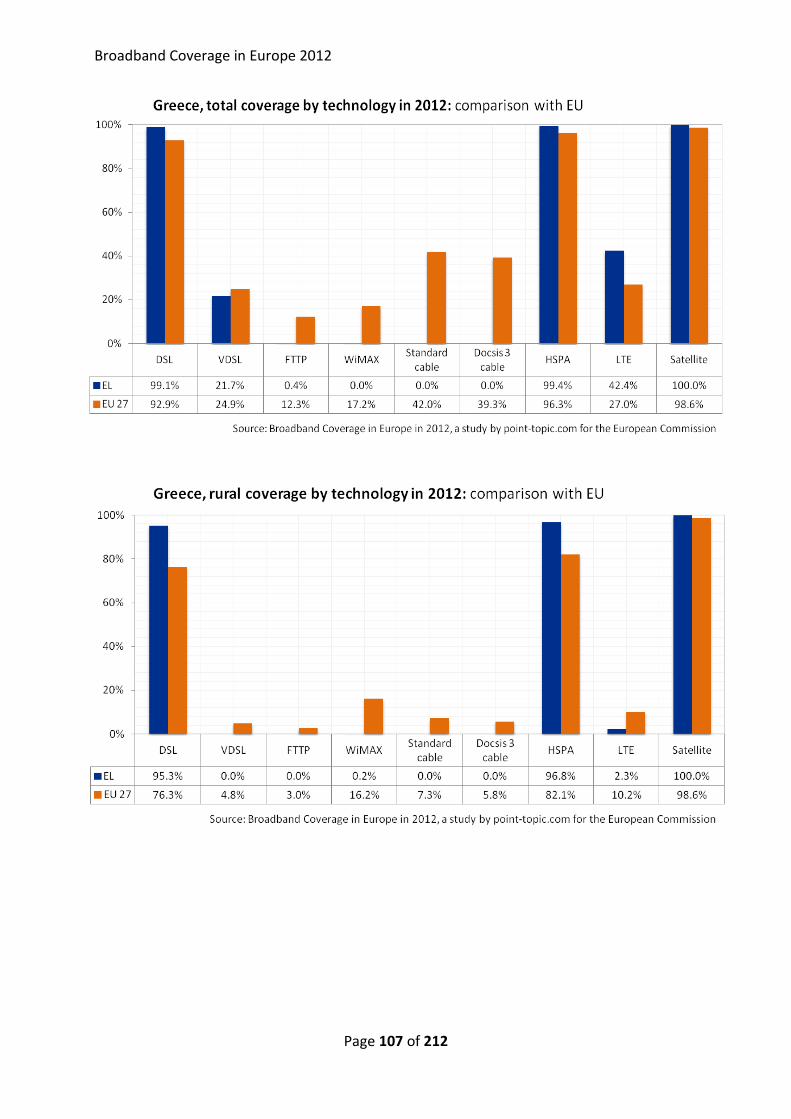
Broadband Coverage in Europe 2012
Page 107 of 212
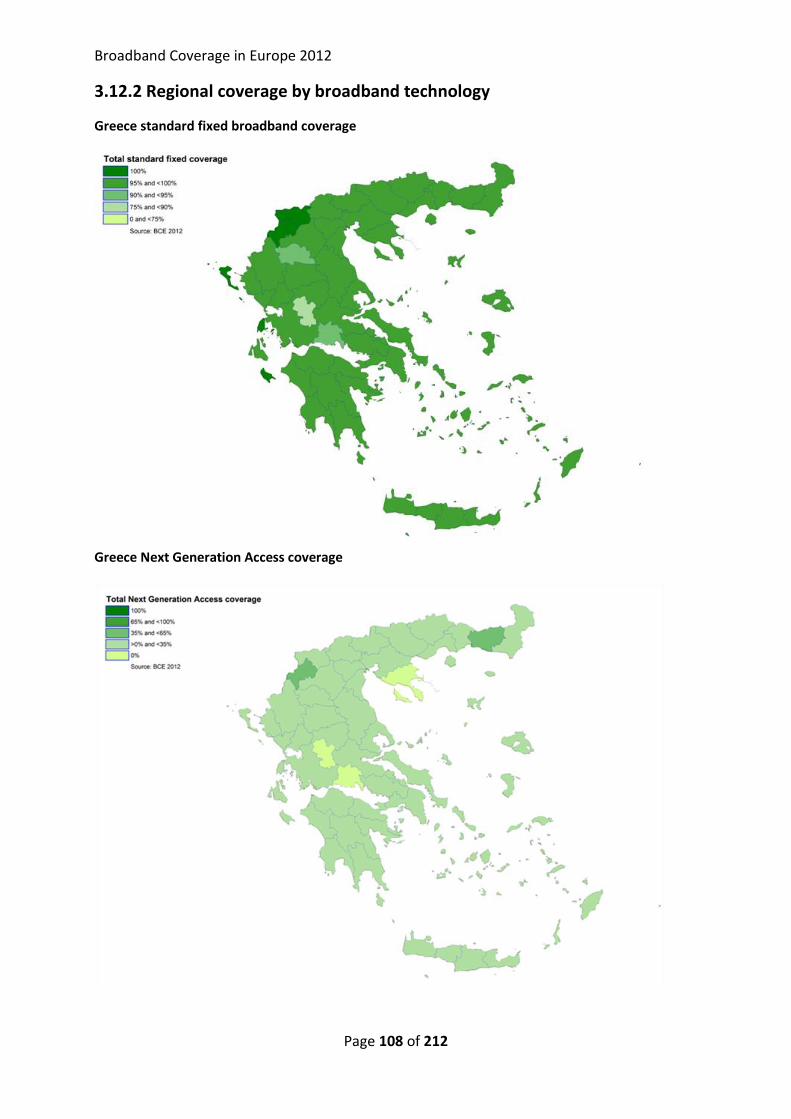
Broadband Coverage in Europe 2012
Page 108 of 212
3.12.2 Regional coverage by broadband technology
Greece standard fixed broadband coverage
Greece Next Generation Access coverage
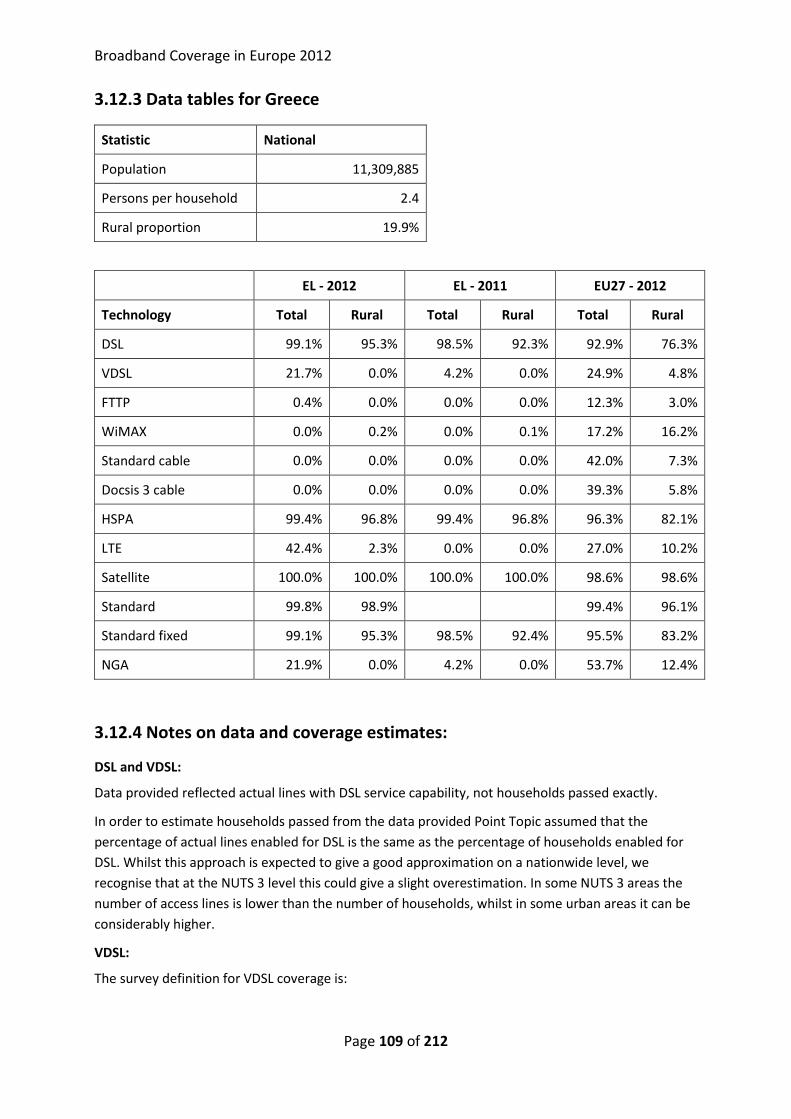
Broadband Coverage in Europe 2012
Page 109 of 212
3.12.3 Data tables for Greece
Statistic National
Population 11,309,885
Persons per household 2.4
Rural proportion 19.9%
EL - 2012 EL - 2011 EU27 - 2012
Technology Total Rural Total Rural Total Rural
DSL 99.1% 95.3% 98.5% 92.3% 92.9% 76.3%
VDSL 21.7% 0.0% 4.2% 0.0% 24.9% 4.8%
FTTP 0.4% 0.0% 0.0% 0.0% 12.3% 3.0%
WiMAX 0.0% 0.2% 0.0% 0.1% 17.2% 16.2%
Standard cable 0.0% 0.0% 0.0% 0.0% 42.0% 7.3%
Docsis 3 cable 0.0% 0.0% 0.0% 0.0% 39.3% 5.8%
HSPA 99.4% 96.8% 99.4% 96.8% 96.3% 82.1%
LTE 42.4% 2.3% 0.0% 0.0% 27.0% 10.2%
Satellite 100.0% 100.0% 100.0% 100.0% 98.6% 98.6%
Standard 99.8% 98.9%
99.4% 96.1%
Standard fixed 99.1% 95.3% 98.5% 92.4% 95.5% 83.2%
NGA 21.9% 0.0% 4.2% 0.0% 53.7% 12.4%
3.12.4 Notes on data and coverage estimates:
DSL and VDSL:
Data provided reflected actual lines with DSL service capability, not households passed exactly.
In order to estimate households passed from the data provided Point Topic assumed that the
percentage of actual lines enabled for DSL is the same as the percentage of households enabled for
DSL. Whilst this approach is expected to give a good approximation on a nationwide level, we
recognise that at the NUTS 3 level this could give a slight overestimation. In some NUTS 3 areas the
number of access lines is lower than the number of households, whilst in some urban areas it can be
considerably higher.
VDSL:
The survey definition for VDSL coverage is:

Broadband Coverage in Europe 2012
Page 110 of 212
Close enough to a VDSL-enabled cabinet or exchange to get a broadband signal of at least 25Mbps
downstream, typically equivalent to a radial distance of about 500 metres.
According to the design of the network in Greece, the maximum cable length between VDSL cabinets
and the Central Office is 800m. Data was provided for all coverage, but this will mostly be for higher-
speed services.
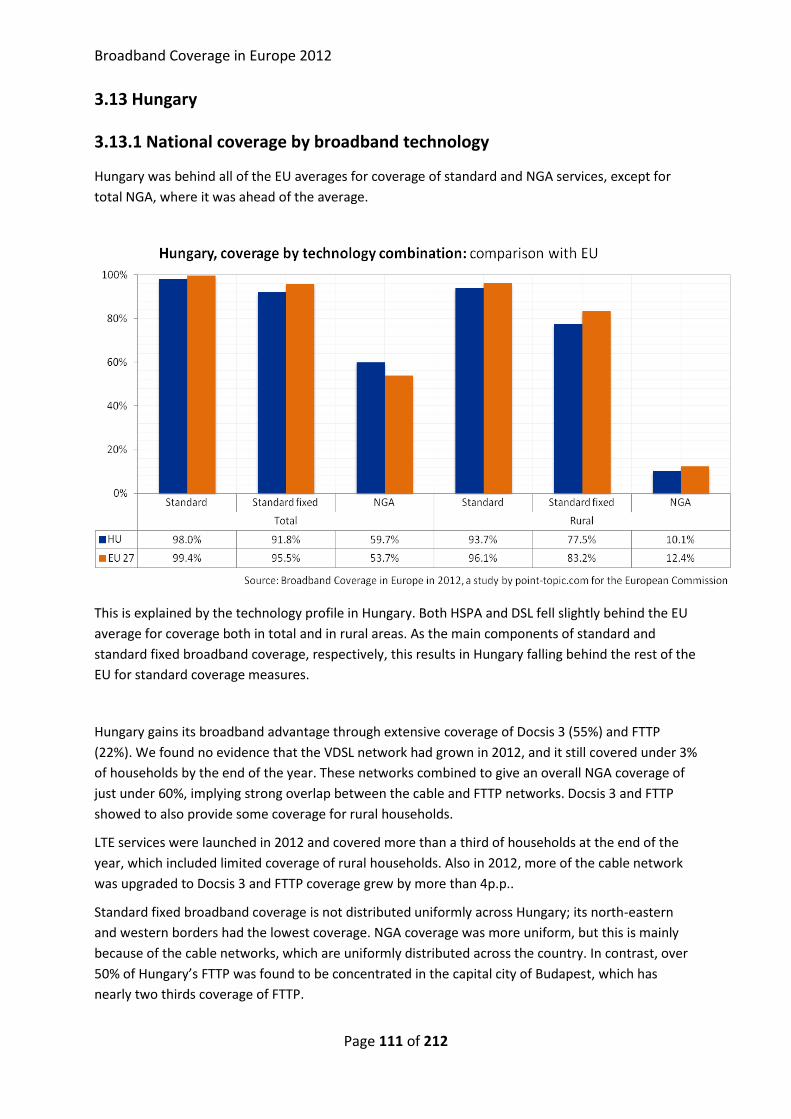
Broadband Coverage in Europe 2012
Page 111 of 212
3.13 Hungary
3.13.1 National coverage by broadband technology
Hungary was behind all of the EU averages for coverage of standard and NGA services, except for
total NGA, where it was ahead of the average.
This is explained by the technology profile in Hungary. Both HSPA and DSL fell slightly behind the EU
average for coverage both in total and in rural areas. As the main components of standard and
standard fixed broadband coverage, respectively, this results in Hungary falling behind the rest of the
EU for standard coverage measures.
Hungary gains its broadband advantage through extensive coverage of Docsis 3 (55%) and FTTP
(22%). We found no evidence that the VDSL network had grown in 2012, and it still covered under 3%
of households by the end of the year. These networks combined to give an overall NGA coverage of
just under 60%, implying strong overlap between the cable and FTTP networks. Docsis 3 and FTTP
showed to also provide some coverage for rural households.
LTE services were launched in 2012 and covered more than a third of households at the end of the
year, which included limited coverage of rural households. Also in 2012, more of the cable network
was upgraded to Docsis 3 and FTTP coverage grew by more than 4p.p..
Standard fixed broadband coverage is not distributed uniformly across Hungary; its north-eastern
and western borders had the lowest coverage. NGA coverage was more uniform, but this is mainly
because of the cable networks, which are uniformly distributed across the country. In contrast, over
50% of Hungary’s FTTP was found to be concentrated in the capital city of Budapest, which has
nearly two thirds coverage of FTTP.
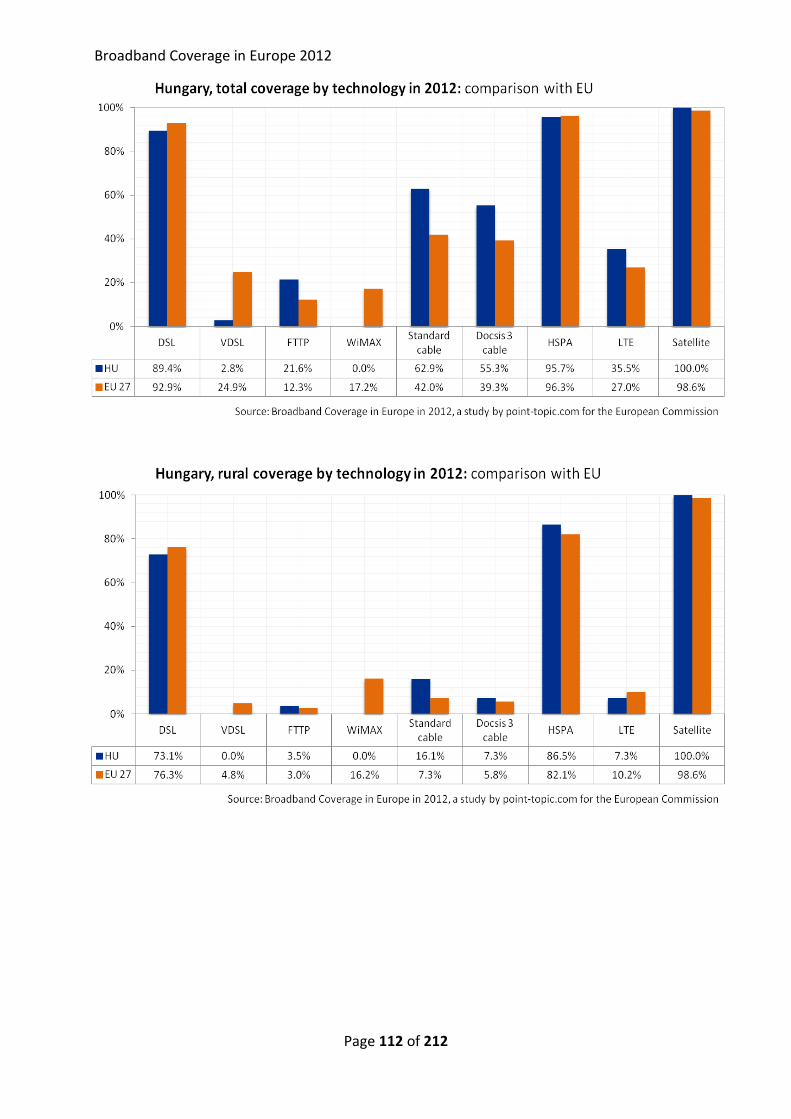
Broadband Coverage in Europe 2012
Page 112 of 212

Broadband Coverage in Europe 2012
Page 113 of 212
3.13.2 Regional coverage by broadband technology
Hungary standard fixed broadband coverage
Hungary Next Generation Access coverage
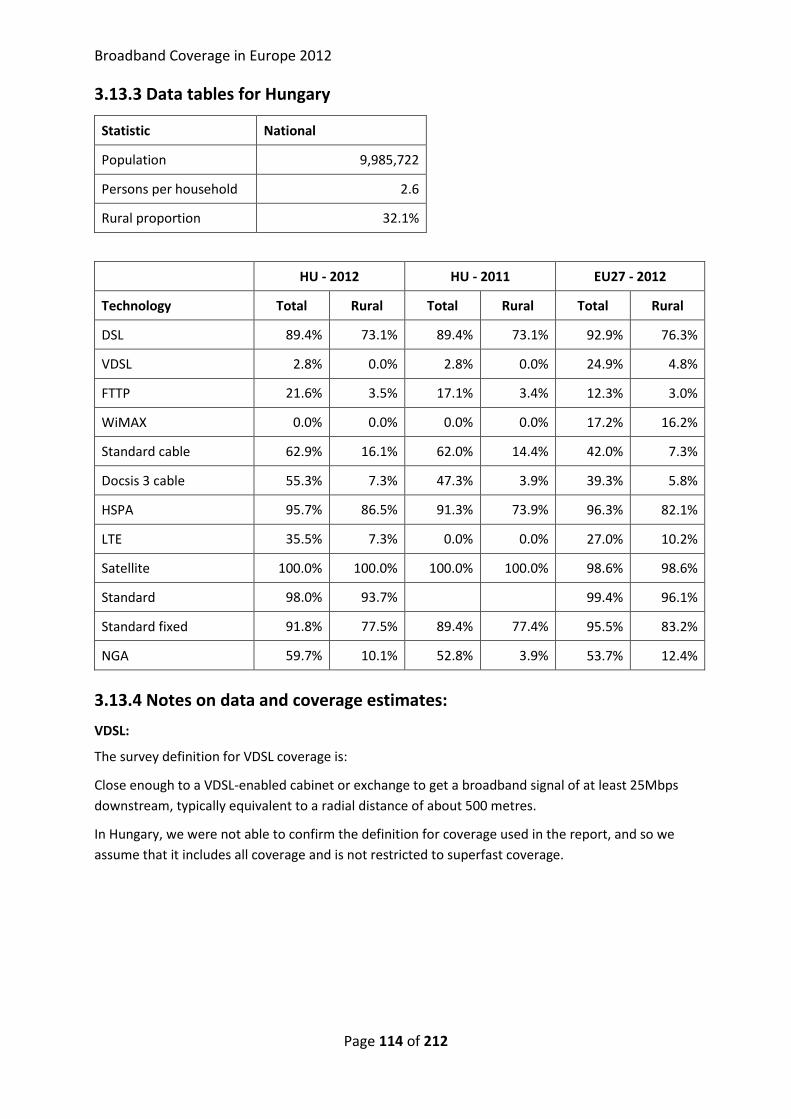
Broadband Coverage in Europe 2012
Page 114 of 212
3.13.3 Data tables for Hungary
Statistic National
Population 9,985,722
Persons per household 2.6
Rural proportion 32.1%
HU - 2012 HU - 2011 EU27 - 2012
Technology Total Rural Total Rural Total Rural
DSL 89.4% 73.1% 89.4% 73.1% 92.9% 76.3%
VDSL 2.8% 0.0% 2.8% 0.0% 24.9% 4.8%
FTTP 21.6% 3.5% 17.1% 3.4% 12.3% 3.0%
WiMAX 0.0% 0.0% 0.0% 0.0% 17.2% 16.2%
Standard cable 62.9% 16.1% 62.0% 14.4% 42.0% 7.3%
Docsis 3 cable 55.3% 7.3% 47.3% 3.9% 39.3% 5.8%
HSPA 95.7% 86.5% 91.3% 73.9% 96.3% 82.1%
LTE 35.5% 7.3% 0.0% 0.0% 27.0% 10.2%
Satellite 100.0% 100.0% 100.0% 100.0% 98.6% 98.6%
Standard 98.0% 93.7%
99.4% 96.1%
Standard fixed 91.8% 77.5% 89.4% 77.4% 95.5% 83.2%
NGA 59.7% 10.1% 52.8% 3.9% 53.7% 12.4%
3.13.4 Notes on data and coverage estimates:
VDSL:
The survey definition for VDSL coverage is:
Close enough to a VDSL-enabled cabinet or exchange to get a broadband signal of at least 25Mbps
downstream, typically equivalent to a radial distance of about 500 metres.
In Hungary, we were not able to confirm the definition for coverage used in the report, and so we
assume that it includes all coverage and is not restricted to superfast coverage.
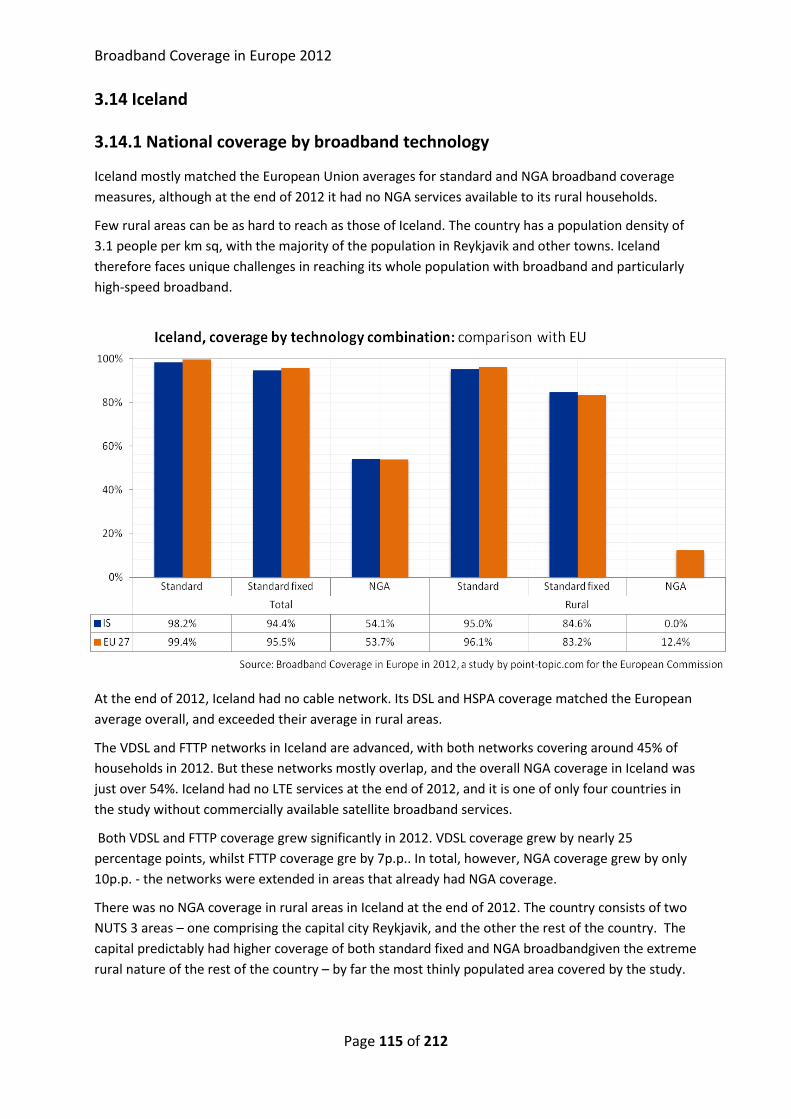
Broadband Coverage in Europe 2012
Page 115 of 212
3.14 Iceland
3.14.1 National coverage by broadband technology
Iceland mostly matched the European Union averages for standard and NGA broadband coverage
measures, although at the end of 2012 it had no NGA services available to its rural households.
Few rural areas can be as hard to reach as those of Iceland. The country has a population density of
3.1 people per km sq, with the majority of the population in Reykjavik and other towns. Iceland
therefore faces unique challenges in reaching its whole population with broadband and particularly
high-speed broadband.
At the end of 2012, Iceland had no cable network. Its DSL and HSPA coverage matched the European
average overall, and exceeded their average in rural areas.
The VDSL and FTTP networks in Iceland are advanced, with both networks covering around 45% of
households in 2012. But these networks mostly overlap, and the overall NGA coverage in Iceland was
just over 54%. Iceland had no LTE services at the end of 2012, and it is one of only four countries in
the study without commercially available satellite broadband services.
Both VDSL and FTTP coverage grew significantly in 2012. VDSL coverage grew by nearly 25
percentage points, whilst FTTP coverage gre by 7p.p.. In total, however, NGA coverage grew by only
10p.p. - the networks were extended in areas that already had NGA coverage.
There was no NGA coverage in rural areas in Iceland at the end of 2012. The country consists of two
NUTS 3 areas – one comprising the capital city Reykjavik, and the other the rest of the country. The
capital predictably had higher coverage of both standard fixed and NGA broadbandgiven the extreme
rural nature of the rest of the country – by far the most thinly populated area covered by the study.
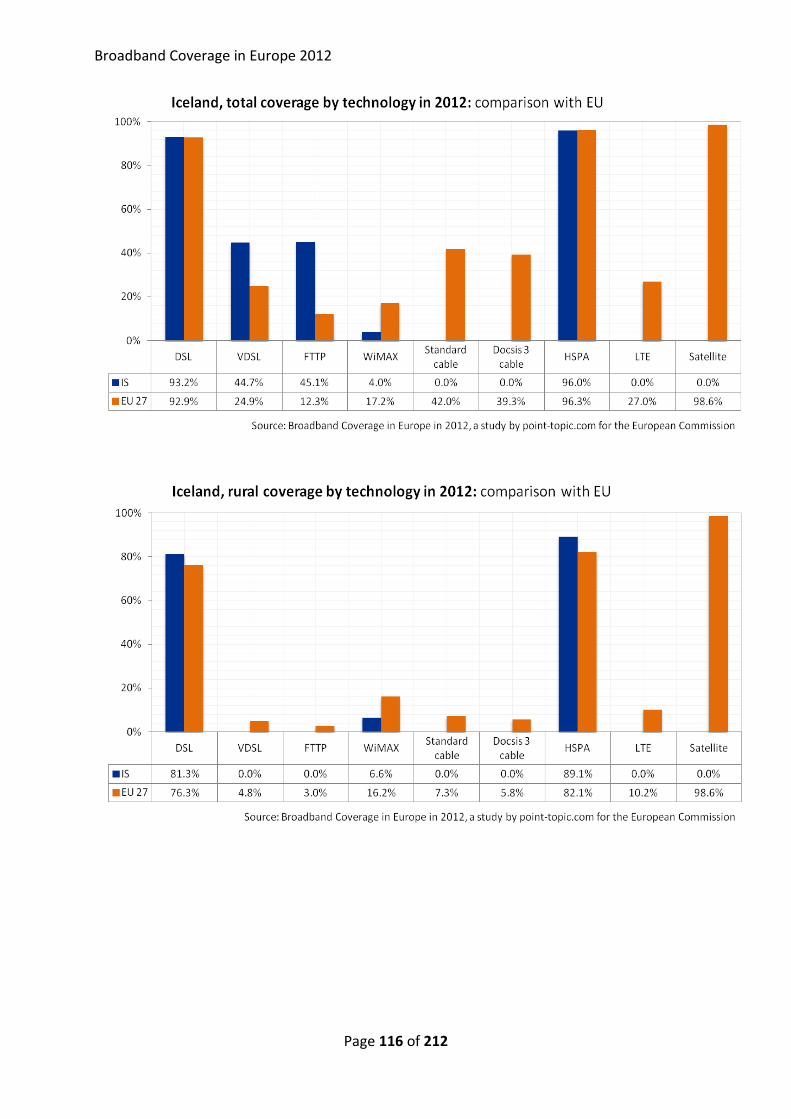
Broadband Coverage in Europe 2012
Page 116 of 212
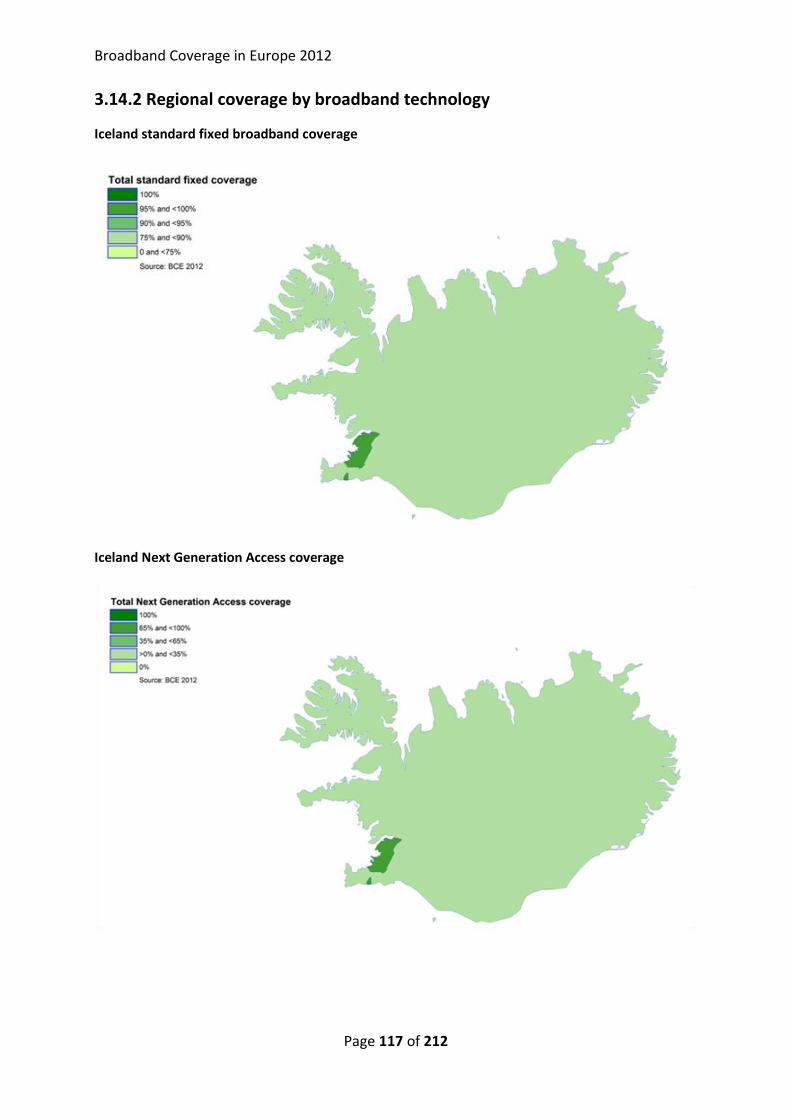
Broadband Coverage in Europe 2012
Page 117 of 212
3.14.2 Regional coverage by broadband technology
Iceland standard fixed broadband coverage
Iceland Next Generation Access coverage
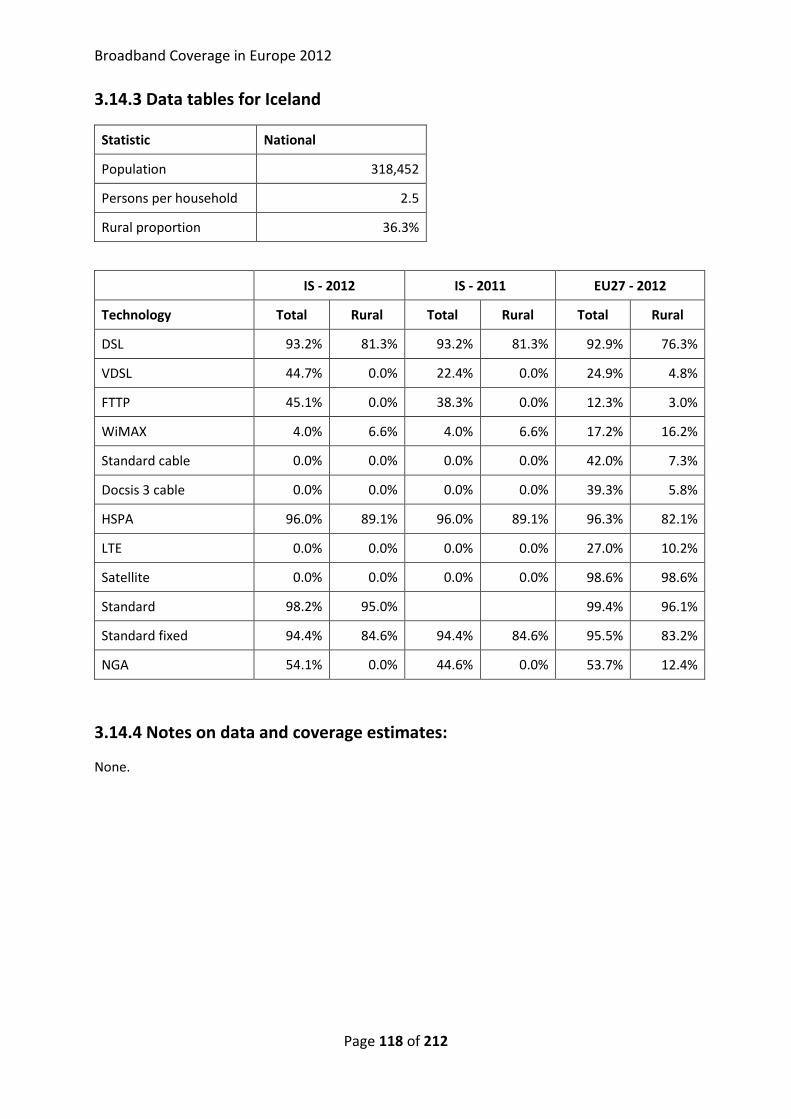
Broadband Coverage in Europe 2012
Page 118 of 212
3.14.3 Data tables for Iceland
Statistic National
Population 318,452
Persons per household 2.5
Rural proportion 36.3%
IS - 2012 IS - 2011 EU27 - 2012
Technology Total Rural Total Rural Total Rural
DSL 93.2% 81.3% 93.2% 81.3% 92.9% 76.3%
VDSL 44.7% 0.0% 22.4% 0.0% 24.9% 4.8%
FTTP 45.1% 0.0% 38.3% 0.0% 12.3% 3.0%
WiMAX 4.0% 6.6% 4.0% 6.6% 17.2% 16.2%
Standard cable 0.0% 0.0% 0.0% 0.0% 42.0% 7.3%
Docsis 3 cable 0.0% 0.0% 0.0% 0.0% 39.3% 5.8%
HSPA 96.0% 89.1% 96.0% 89.1% 96.3% 82.1%
LTE 0.0% 0.0% 0.0% 0.0% 27.0% 10.2%
Satellite 0.0% 0.0% 0.0% 0.0% 98.6% 98.6%
Standard 98.2% 95.0%
99.4% 96.1%
Standard fixed 94.4% 84.6% 94.4% 84.6% 95.5% 83.2%
NGA 54.1% 0.0% 44.6% 0.0% 53.7% 12.4%
3.14.4 Notes on data and coverage estimates:
None.
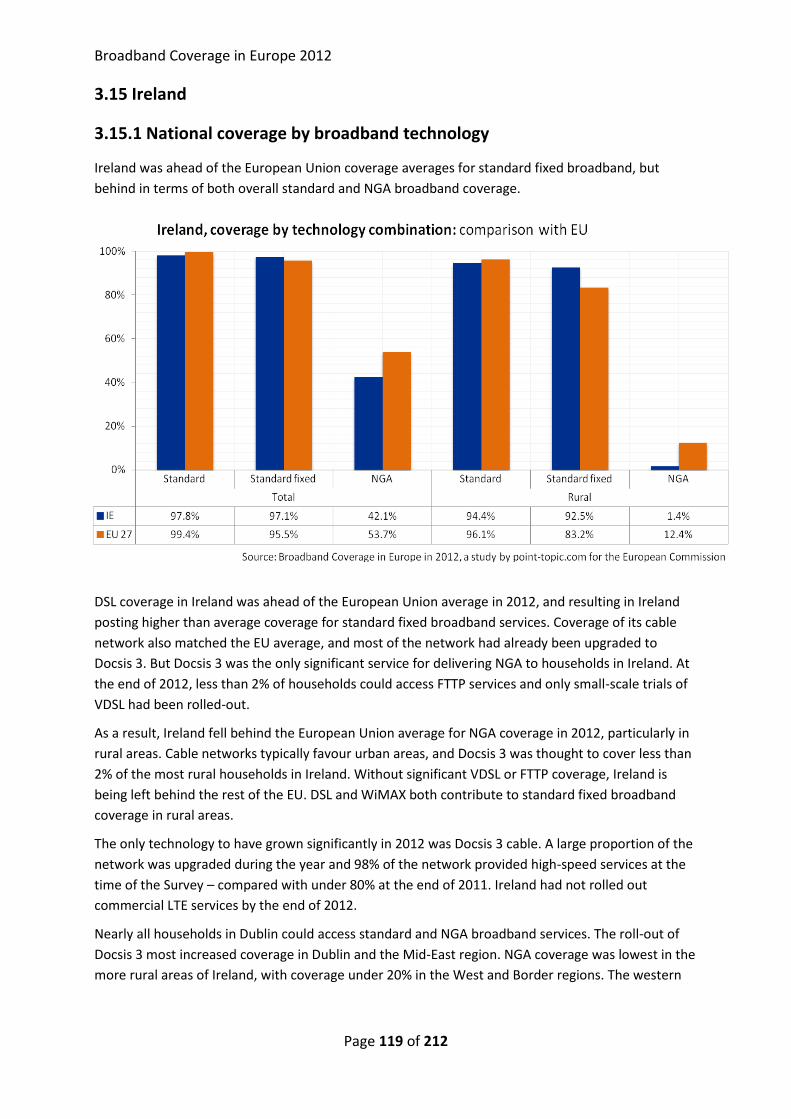
Broadband Coverage in Europe 2012
Page 119 of 212
3.15 Ireland
3.15.1 National coverage by broadband technology
Ireland was ahead of the European Union coverage averages for standard fixed broadband, but
behind in terms of both overall standard and NGA broadband coverage.
DSL coverage in Ireland was ahead of the European Union average in 2012, and resulting in Ireland
posting higher than average coverage for standard fixed broadband services. Coverage of its cable
network also matched the EU average, and most of the network had already been upgraded to
Docsis 3. But Docsis 3 was the only significant service for delivering NGA to households in Ireland. At
the end of 2012, less than 2% of households could access FTTP services and only small-scale trials of
VDSL had been rolled-out.
As a result, Ireland fell behind the European Union average for NGA coverage in 2012, particularly in
rural areas. Cable networks typically favour urban areas, and Docsis 3 was thought to cover less than
2% of the most rural households in Ireland. Without significant VDSL or FTTP coverage, Ireland is
being left behind the rest of the EU. DSL and WiMAX both contribute to standard fixed broadband
coverage in rural areas.
The only technology to have grown significantly in 2012 was Docsis 3 cable. A large proportion of the
network was upgraded during the year and 98% of the network provided high-speed services at the
time of the Survey – compared with under 80% at the end of 2011. Ireland had not rolled out
commercial LTE services by the end of 2012.
Nearly all households in Dublin could access standard and NGA broadband services. The roll-out of
Docsis 3 most increased coverage in Dublin and the Mid-East region. NGA coverage was lowest in the
more rural areas of Ireland, with coverage under 20% in the West and Border regions. The western
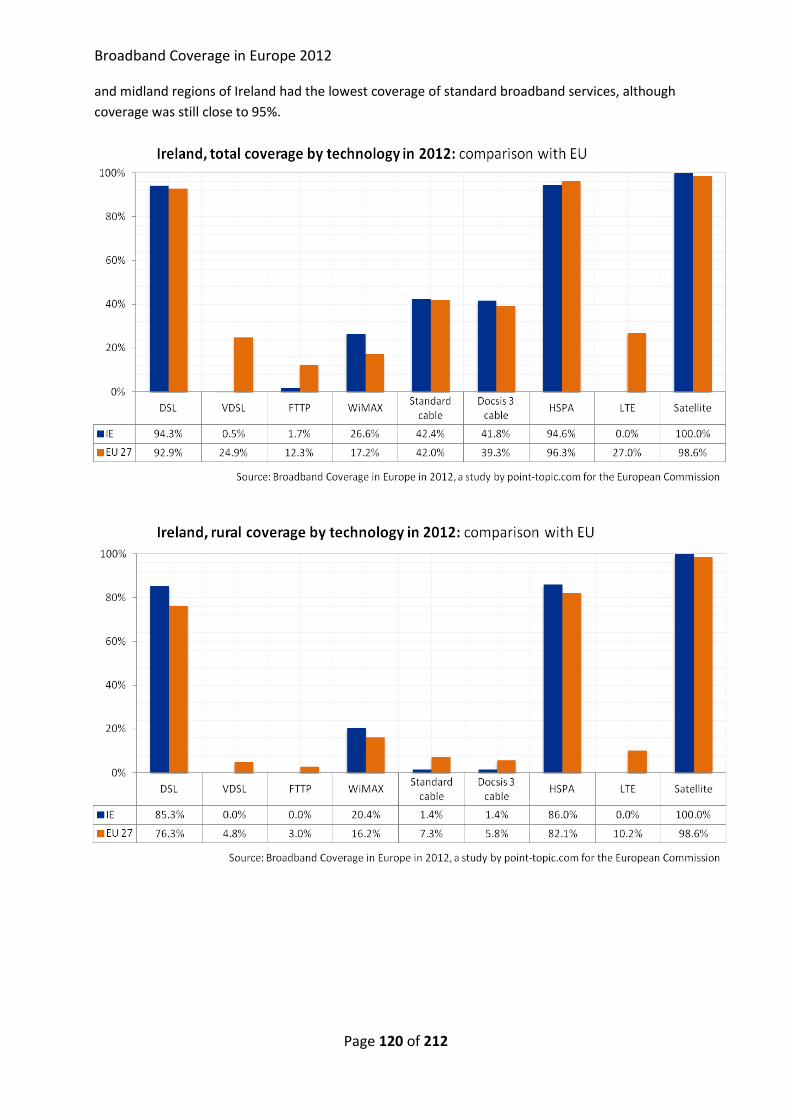
Broadband Coverage in Europe 2012
Page 120 of 212
and midland regions of Ireland had the lowest coverage of standard broadband services, although
coverage was still close to 95%.
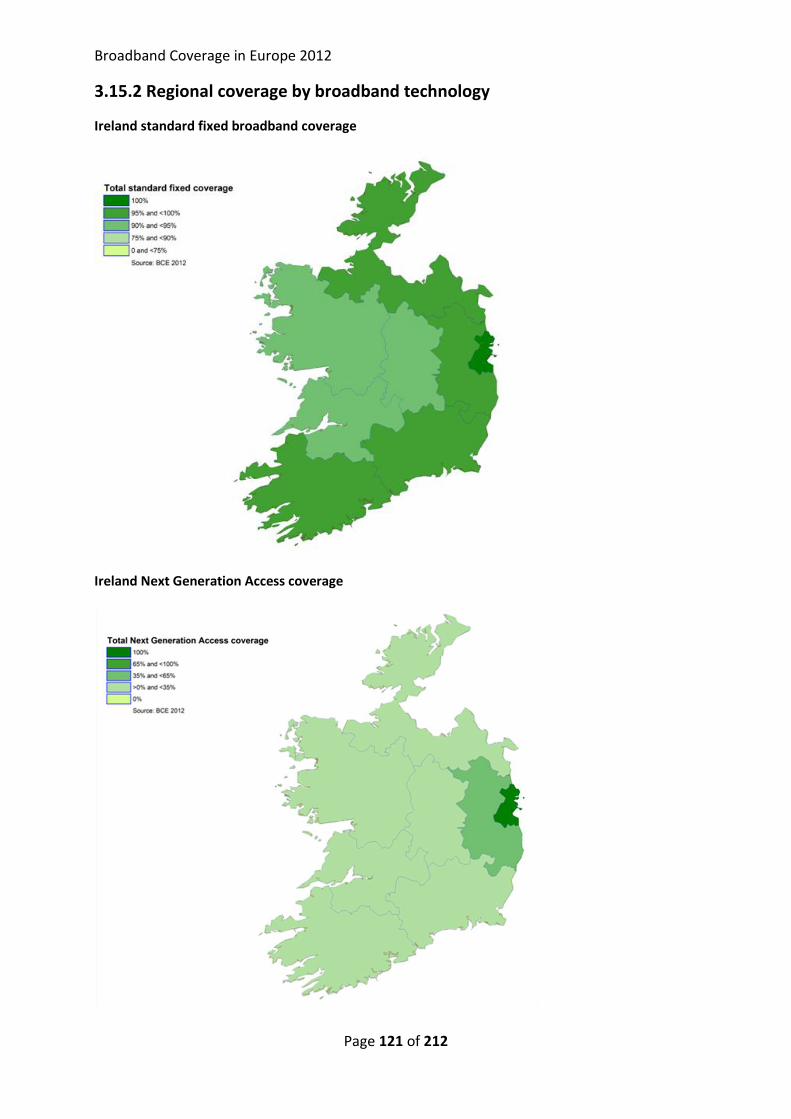
Broadband Coverage in Europe 2012
Page 121 of 212
3.15.2 Regional coverage by broadband technology
Ireland standard fixed broadband coverage
Ireland Next Generation Access coverage
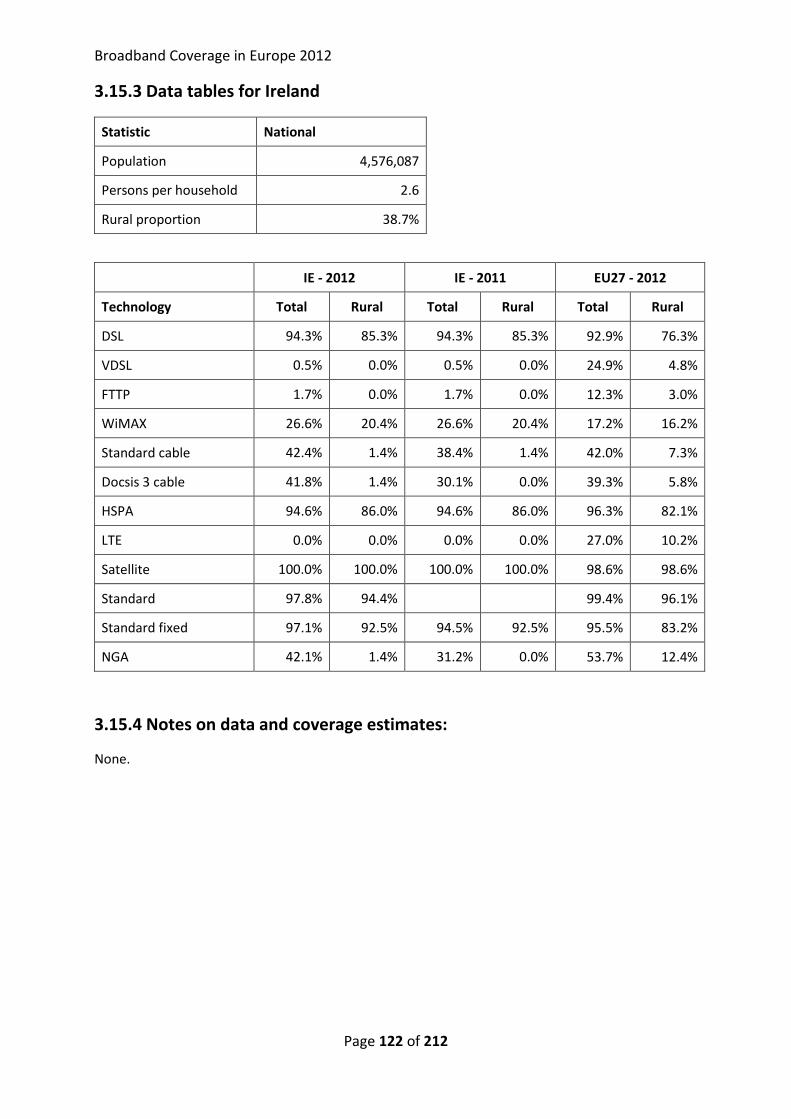
Broadband Coverage in Europe 2012
Page 122 of 212
3.15.3 Data tables for Ireland
Statistic National
Population 4,576,087
Persons per household 2.6
Rural proportion 38.7%
IE - 2012 IE - 2011 EU27 - 2012
Technology Total Rural Total Rural Total Rural
DSL 94.3% 85.3% 94.3% 85.3% 92.9% 76.3%
VDSL 0.5% 0.0% 0.5% 0.0% 24.9% 4.8%
FTTP 1.7% 0.0% 1.7% 0.0% 12.3% 3.0%
WiMAX 26.6% 20.4% 26.6% 20.4% 17.2% 16.2%
Standard cable 42.4% 1.4% 38.4% 1.4% 42.0% 7.3%
Docsis 3 cable 41.8% 1.4% 30.1% 0.0% 39.3% 5.8%
HSPA 94.6% 86.0% 94.6% 86.0% 96.3% 82.1%
LTE 0.0% 0.0% 0.0% 0.0% 27.0% 10.2%
Satellite 100.0% 100.0% 100.0% 100.0% 98.6% 98.6%
Standard 97.8% 94.4%
99.4% 96.1%
Standard fixed 97.1% 92.5% 94.5% 92.5% 95.5% 83.2%
NGA 42.1% 1.4% 31.2% 0.0% 53.7% 12.4%
3.15.4 Notes on data and coverage estimates:
None.
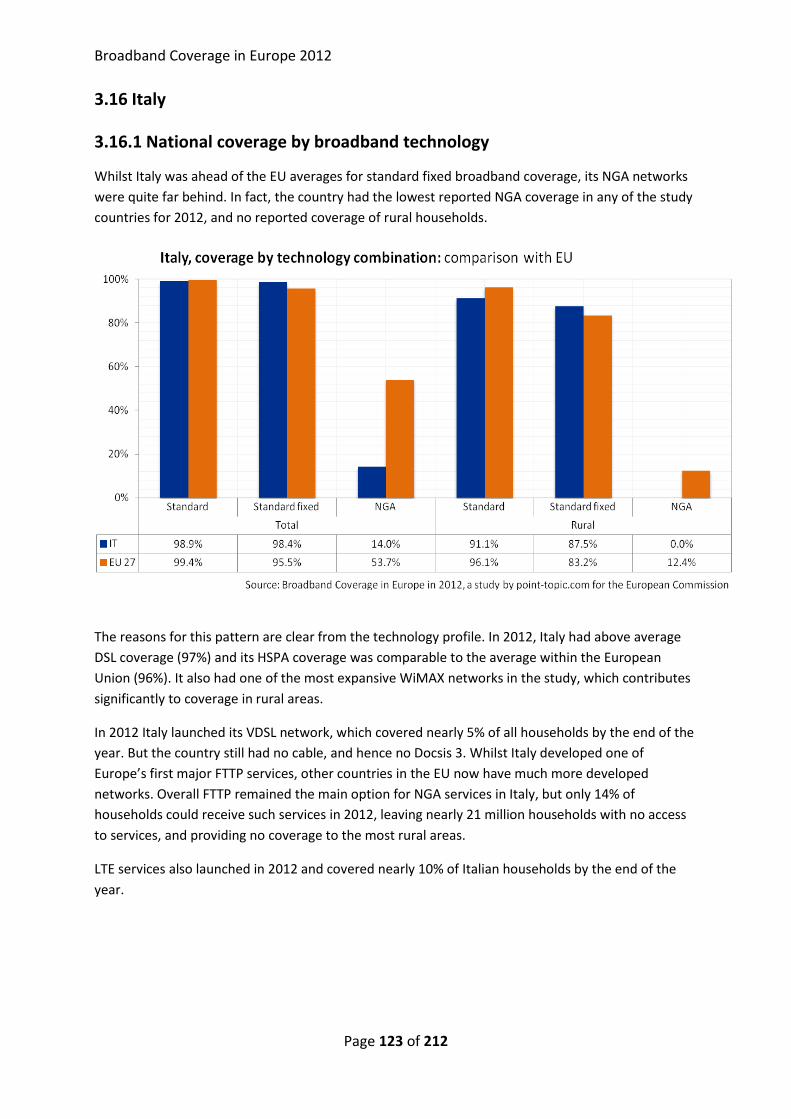
Broadband Coverage in Europe 2012
Page 123 of 212
3.16 Italy
3.16.1 National coverage by broadband technology
Whilst Italy was ahead of the EU averages for standard fixed broadband coverage, its NGA networks
were quite far behind. In fact, the country had the lowest reported NGA coverage in any of the study
countries for 2012, and no reported coverage of rural households.
The reasons for this pattern are clear from the technology profile. In 2012, Italy had above average
DSL coverage (97%) and its HSPA coverage was comparable to the average within the European
Union (96%). It also had one of the most expansive WiMAX networks in the study, which contributes
significantly to coverage in rural areas.
In 2012 Italy launched its VDSL network, which covered nearly 5% of all households by the end of the
year. But the country still had no cable, and hence no Docsis 3. Whilst Italy developed one of
Europe’s first major FTTP services, other countries in the EU now have much more developed
networks. Overall FTTP remained the main option for NGA services in Italy, but only 14% of
households could receive such services in 2012, leaving nearly 21 million households with no access
to services, and providing no coverage to the most rural areas.
LTE services also launched in 2012 and covered nearly 10% of Italian households by the end of the
year.
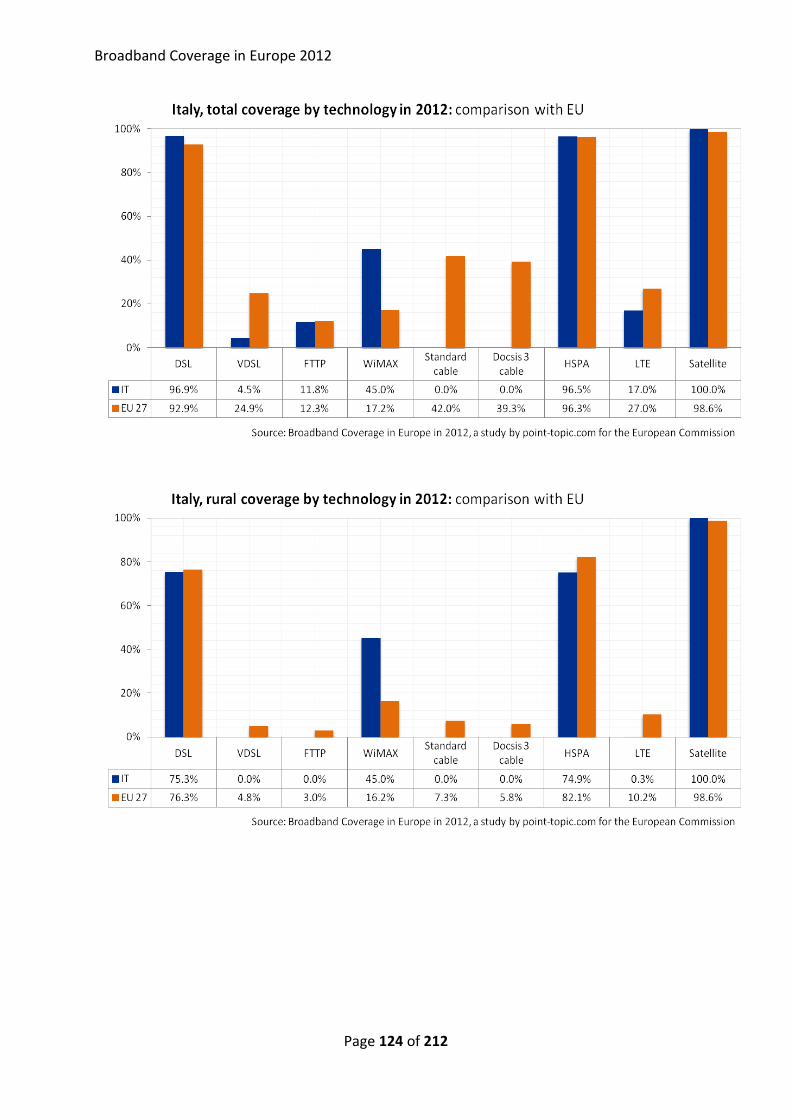
Broadband Coverage in Europe 2012
Page 124 of 212

Broadband Coverage in Europe 2012
Page 125 of 212
3.16.2 Regional coverage by broadband technology
Italy standard fixed broadband coverage
In 2012 Italy had high and, as far as current data goes, fairly uniform standard broadband coverage.
The two most densely populated regions, Milan and Naples, had 100% coverage, while the rest of the
country had over 95%.
Italy’s NGA coverage mainly reflects the roll-out of its pioneering FTTP network. Milan, where it
started, had over 88% coverage in 2012. VDSL services only recently launched in Rome, Torino and
Naples, areas which also have quite extensive FTTP services. But ninety out of Italy’s one-hundred
and ten NUTS areas had no coverage whatsoever by the end of 2012.
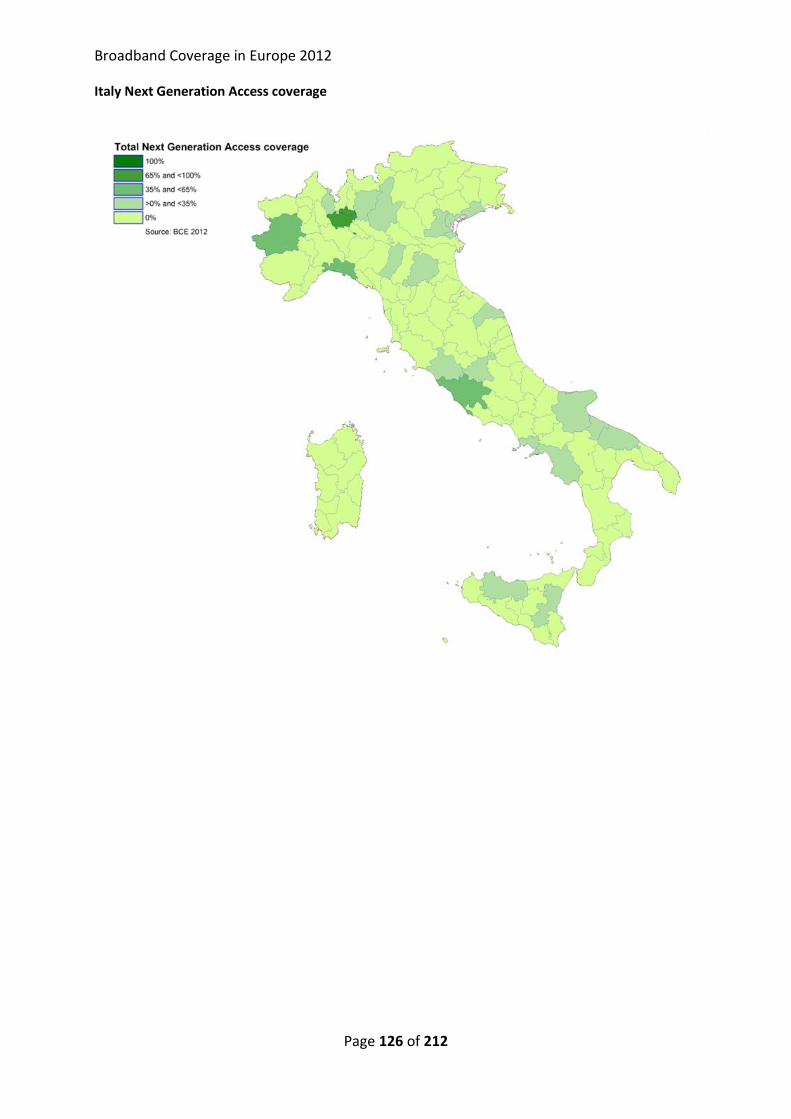
Broadband Coverage in Europe 2012
Page 126 of 212
Italy Next Generation Access coverage
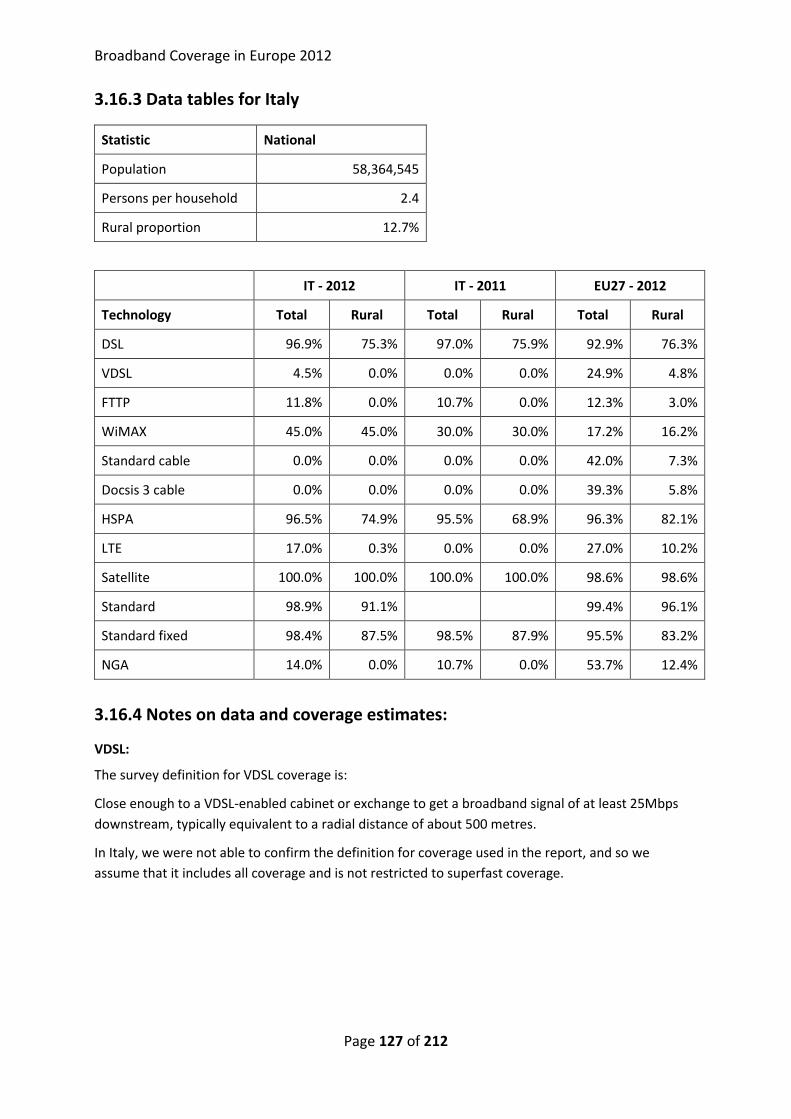
Broadband Coverage in Europe 2012
Page 127 of 212
3.16.3 Data tables for Italy
Statistic National
Population 58,364,545
Persons per household 2.4
Rural proportion 12.7%
IT - 2012 IT - 2011 EU27 - 2012
Technology Total Rural Total Rural Total Rural
DSL 96.9% 75.3% 97.0% 75.9% 92.9% 76.3%
VDSL 4.5% 0.0% 0.0% 0.0% 24.9% 4.8%
FTTP 11.8% 0.0% 10.7% 0.0% 12.3% 3.0%
WiMAX 45.0% 45.0% 30.0% 30.0% 17.2% 16.2%
Standard cable 0.0% 0.0% 0.0% 0.0% 42.0% 7.3%
Docsis 3 cable 0.0% 0.0% 0.0% 0.0% 39.3% 5.8%
HSPA 96.5% 74.9% 95.5% 68.9% 96.3% 82.1%
LTE 17.0% 0.3% 0.0% 0.0% 27.0% 10.2%
Satellite 100.0% 100.0% 100.0% 100.0% 98.6% 98.6%
Standard 98.9% 91.1%
99.4% 96.1%
Standard fixed 98.4% 87.5% 98.5% 87.9% 95.5% 83.2%
NGA 14.0% 0.0% 10.7% 0.0% 53.7% 12.4%
3.16.4 Notes on data and coverage estimates:
VDSL:
The survey definition for VDSL coverage is:
Close enough to a VDSL-enabled cabinet or exchange to get a broadband signal of at least 25Mbps
downstream, typically equivalent to a radial distance of about 500 metres.
In Italy, we were not able to confirm the definition for coverage used in the report, and so we
assume that it includes all coverage and is not restricted to superfast coverage.
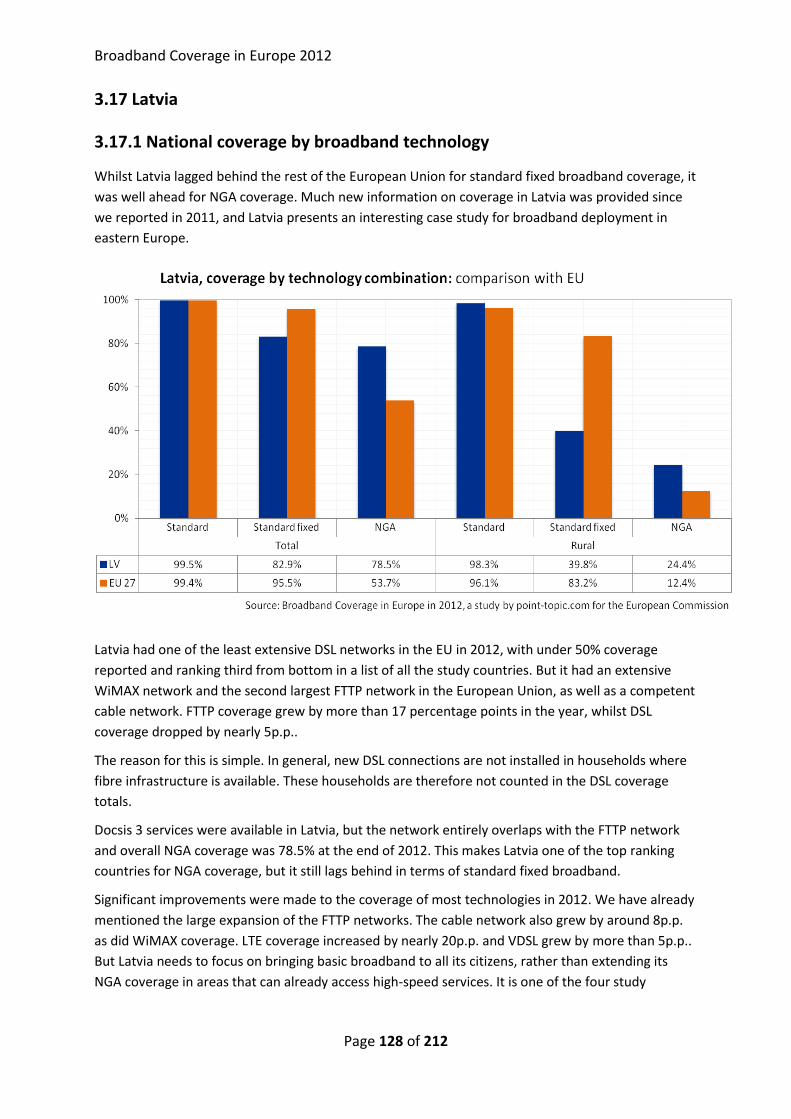
Broadband Coverage in Europe 2012
Page 128 of 212
3.17 Latvia
3.17.1 National coverage by broadband technology
Whilst Latvia lagged behind the rest of the European Union for standard fixed broadband coverage, it
was well ahead for NGA coverage. Much new information on coverage in Latvia was provided since
we reported in 2011, and Latvia presents an interesting case study for broadband deployment in
eastern Europe.
Latvia had one of the least extensive DSL networks in the EU in 2012, with under 50% coverage
reported and ranking third from bottom in a list of all the study countries. But it had an extensive
WiMAX network and the second largest FTTP network in the European Union, as well as a competent
cable network. FTTP coverage grew by more than 17 percentage points in the year, whilst DSL
coverage dropped by nearly 5p.p..
The reason for this is simple. In general, new DSL connections are not installed in households where
fibre infrastructure is available. These households are therefore not counted in the DSL coverage
totals.
Docsis 3 services were available in Latvia, but the network entirely overlaps with the FTTP network
and overall NGA coverage was 78.5% at the end of 2012. This makes Latvia one of the top ranking
countries for NGA coverage, but it still lags behind in terms of standard fixed broadband.
Significant improvements were made to the coverage of most technologies in 2012. We have already
mentioned the large expansion of the FTTP networks. The cable network also grew by around 8p.p.
as did WiMAX coverage. LTE coverage increased by nearly 20p.p. and VDSL grew by more than 5p.p..
But Latvia needs to focus on bringing basic broadband to all its citizens, rather than extending its
NGA coverage in areas that can already access high-speed services. It is one of the four study
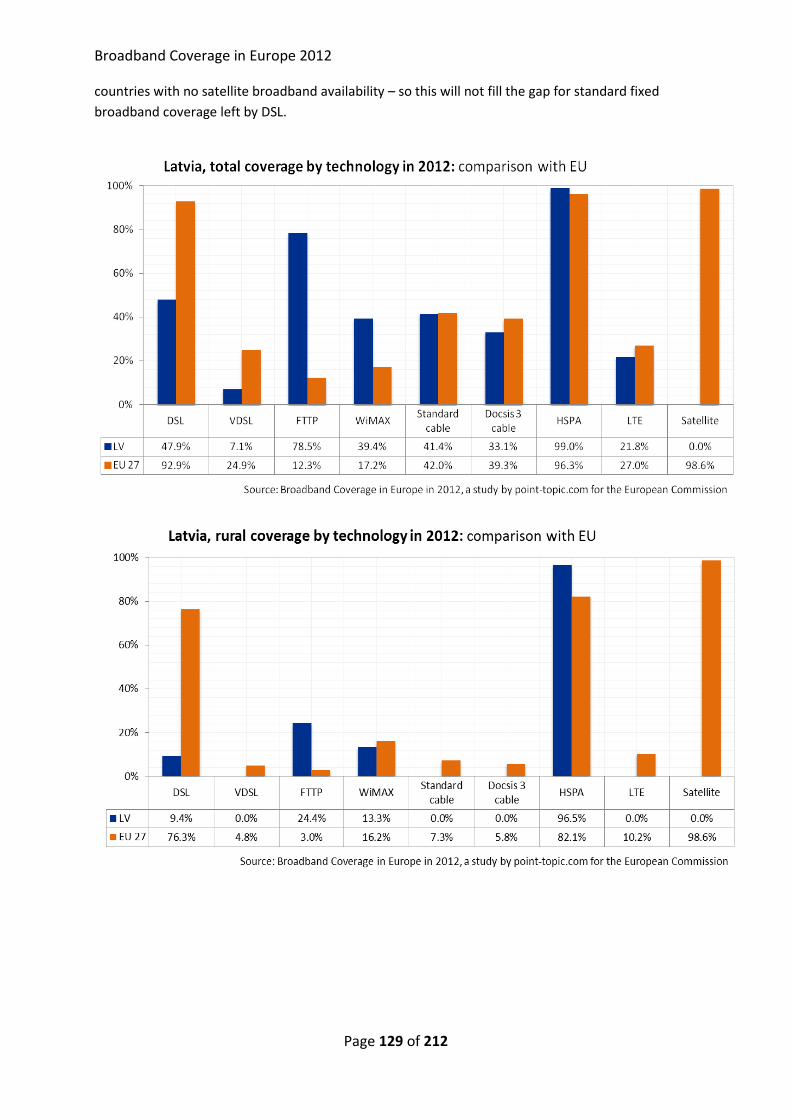
Broadband Coverage in Europe 2012
Page 129 of 212
countries with no satellite broadband availability – so this will not fill the gap for standard fixed
broadband coverage left by DSL.
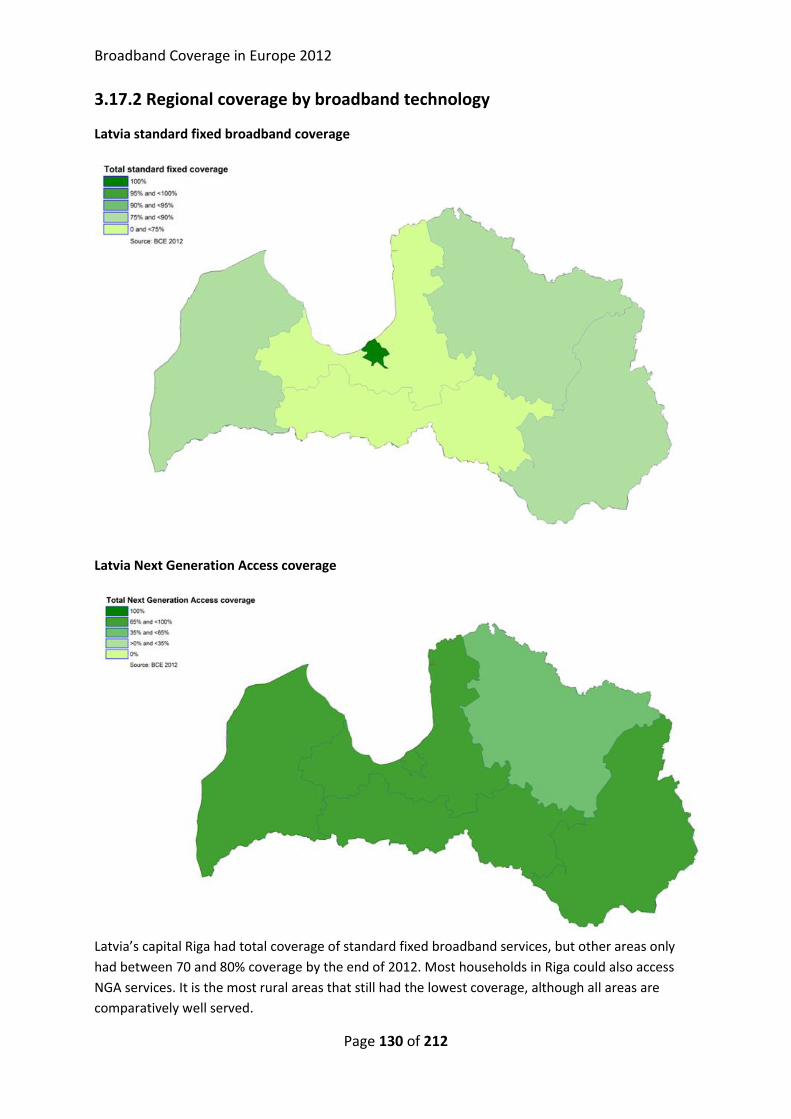
Broadband Coverage in Europe 2012
Page 130 of 212
3.17.2 Regional coverage by broadband technology
Latvia standard fixed broadband coverage
Latvia Next Generation Access coverage
Latvia’s capital Riga had total coverage of standard fixed broadband services, but other areas only
had between 70 and 80% coverage by the end of 2012. Most households in Riga could also access
NGA services. It is the most rural areas that still had the lowest coverage, although all areas are
comparatively well served.

Broadband Coverage in Europe 2012
Page 131 of 212
3.17.3 Data tables for Latvia
Statistic National
Population 2,229,641
Persons per household 2.6
Rural proportion 28.5%
LV - 2012 LV - 2011 EU27 - 2012
Technology Total Rural Total Rural Total Rural
DSL 47.9% 9.4% 52.9% 12.2% 92.9% 76.3%
VDSL 7.1% 0.0% 1.6% 0.0% 24.9% 4.8%
FTTP 78.5% 24.4% 60.8% 7.4% 12.3% 3.0%
WiMAX 39.4% 13.3% 31.6% 1.2% 17.2% 16.2%
Standard cable 41.4% 0.0% 33.1% 0.0% 42.0% 7.3%
Docsis 3 cable 33.1% 0.0% 26.5% 0.0% 39.3% 5.8%
HSPA 99.0% 96.5% 99.0% 96.5% 96.3% 82.1%
LTE 21.8% 0.0% 2.4% 0.0% 27.0% 10.2%
Satellite 0.0% 0.0% 0.0% 0.0% 98.6% 98.6%
Standard 99.5% 98.3%
99.4% 96.1%
Standard fixed 82.9% 39.8% 75.5% 20.8% 95.5% 83.2%
NGA 78.5% 24.4% 66.0% 7.4% 53.7% 12.4%
3.17.4 Notes on data and coverage estimates
VDSL
A household has VDSL coverage if it can receive a VDSL connection delivering a downstream speed of
20 Mbps. Note that this threshold is lower than the survey definition. This has no impact on the NGA
coverage reported for Latvia.
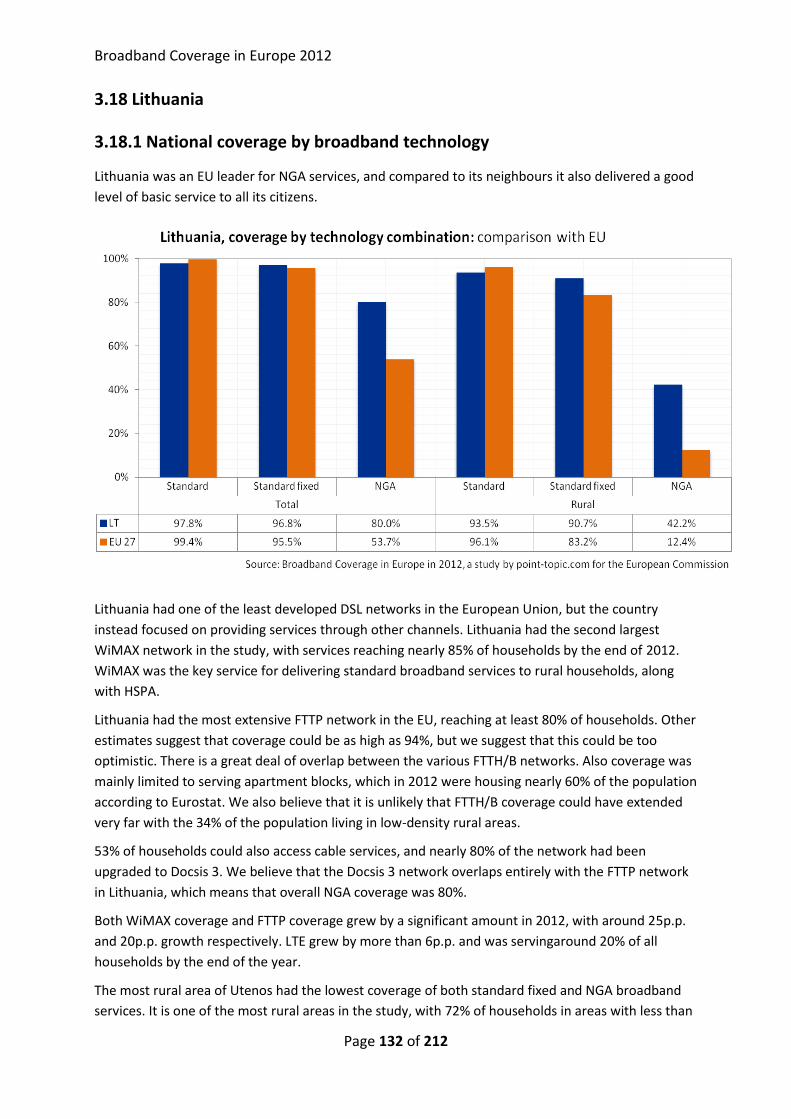
Broadband Coverage in Europe 2012
Page 132 of 212
3.18 Lithuania
3.18.1 National coverage by broadband technology
Lithuania was an EU leader for NGA services, and compared to its neighbours it also delivered a good
level of basic service to all its citizens.
Lithuania had one of the least developed DSL networks in the European Union, but the country
instead focused on providing services through other channels. Lithuania had the second largest
WiMAX network in the study, with services reaching nearly 85% of households by the end of 2012.
WiMAX was the key service for delivering standard broadband services to rural households, along
with HSPA.
Lithuania had the most extensive FTTP network in the EU, reaching at least 80% of households. Other
estimates suggest that coverage could be as high as 94%, but we suggest that this could be too
optimistic. There is a great deal of overlap between the various FTTH/B networks. Also coverage was
mainly limited to serving apartment blocks, which in 2012 were housing nearly 60% of the population
according to Eurostat. We also believe that it is unlikely that FTTH/B coverage could have extended
very far with the 34% of the population living in low-density rural areas.
53% of households could also access cable services, and nearly 80% of the network had been
upgraded to Docsis 3. We believe that the Docsis 3 network overlaps entirely with the FTTP network
in Lithuania, which means that overall NGA coverage was 80%.
Both WiMAX coverage and FTTP coverage grew by a significant amount in 2012, with around 25p.p.
and 20p.p. growth respectively. LTE grew by more than 6p.p. and was servingaround 20% of all
households by the end of the year.
The most rural area of Utenos had the lowest coverage of both standard fixed and NGA broadband
services. It is one of the most rural areas in the study, with 72% of households in areas with less than
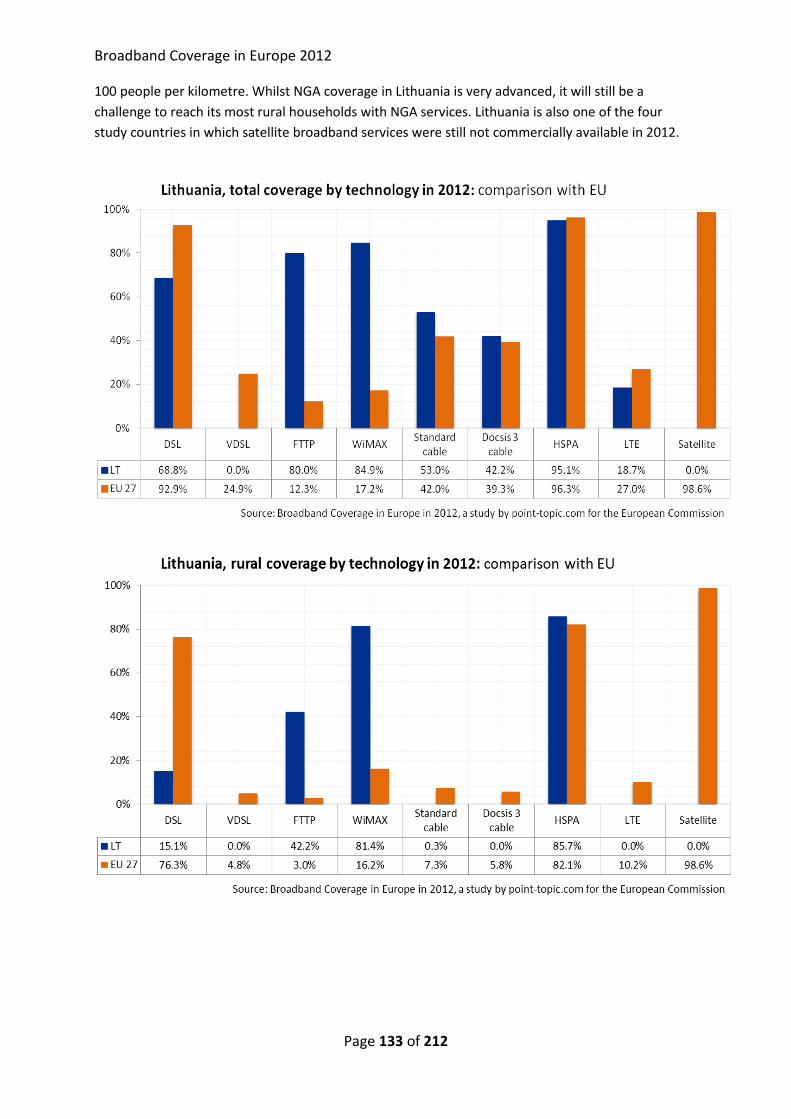
Broadband Coverage in Europe 2012
Page 133 of 212
100 people per kilometre. Whilst NGA coverage in Lithuania is very advanced, it will still be a
challenge to reach its most rural households with NGA services. Lithuania is also one of the four
study countries in which satellite broadband services were still not commercially available in 2012.
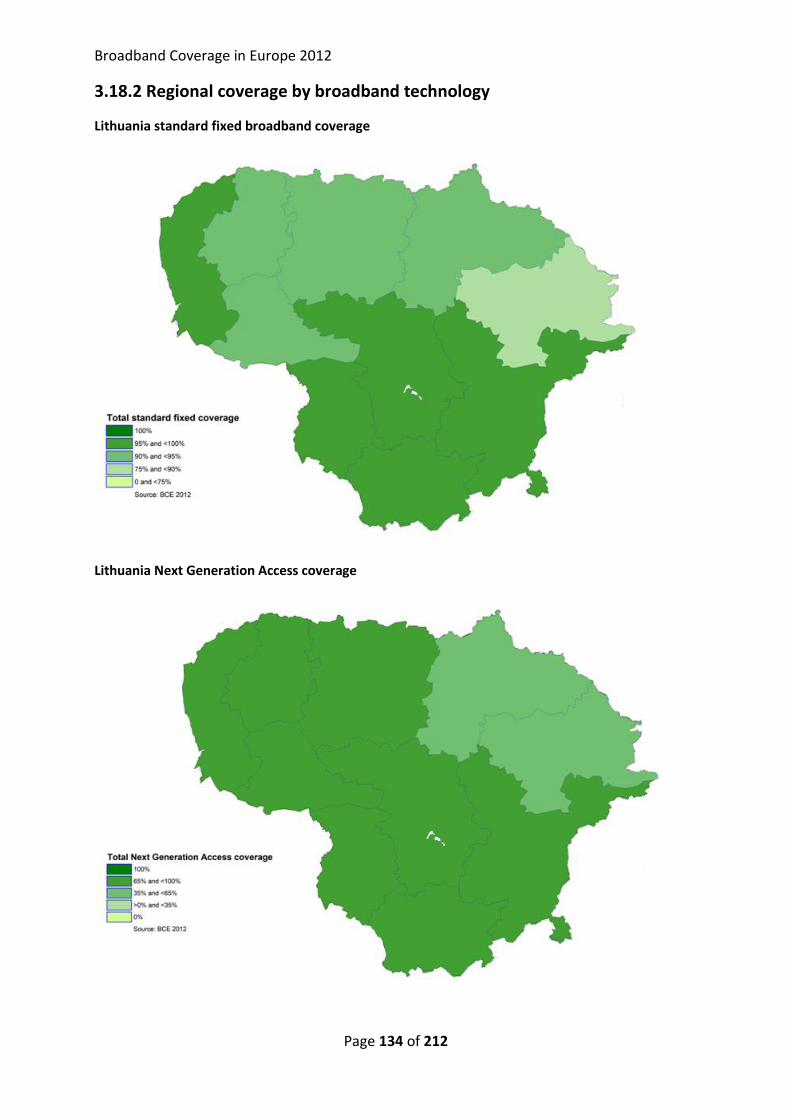
Broadband Coverage in Europe 2012
Page 134 of 212
3.18.2 Regional coverage by broadband technology
Lithuania standard fixed broadband coverage
Lithuania Next Generation Access coverage
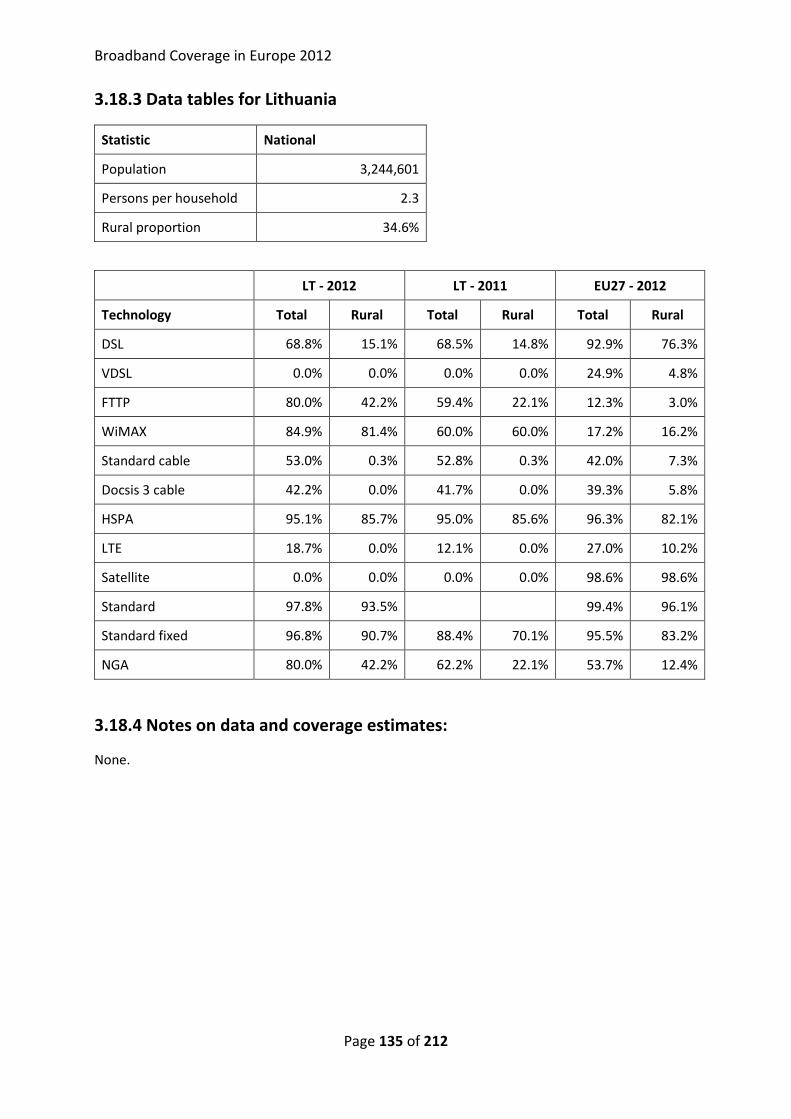
Broadband Coverage in Europe 2012
Page 135 of 212
3.18.3 Data tables for Lithuania
Statistic National
Population 3,244,601
Persons per household 2.3
Rural proportion 34.6%
LT - 2012 LT - 2011 EU27 - 2012
Technology Total Rural Total Rural Total Rural
DSL 68.8% 15.1% 68.5% 14.8% 92.9% 76.3%
VDSL 0.0% 0.0% 0.0% 0.0% 24.9% 4.8%
FTTP 80.0% 42.2% 59.4% 22.1% 12.3% 3.0%
WiMAX 84.9% 81.4% 60.0% 60.0% 17.2% 16.2%
Standard cable 53.0% 0.3% 52.8% 0.3% 42.0% 7.3%
Docsis 3 cable 42.2% 0.0% 41.7% 0.0% 39.3% 5.8%
HSPA 95.1% 85.7% 95.0% 85.6% 96.3% 82.1%
LTE 18.7% 0.0% 12.1% 0.0% 27.0% 10.2%
Satellite 0.0% 0.0% 0.0% 0.0% 98.6% 98.6%
Standard 97.8% 93.5%
99.4% 96.1%
Standard fixed 96.8% 90.7% 88.4% 70.1% 95.5% 83.2%
NGA 80.0% 42.2% 62.2% 22.1% 53.7% 12.4%
3.18.4 Notes on data and coverage estimates:
None.
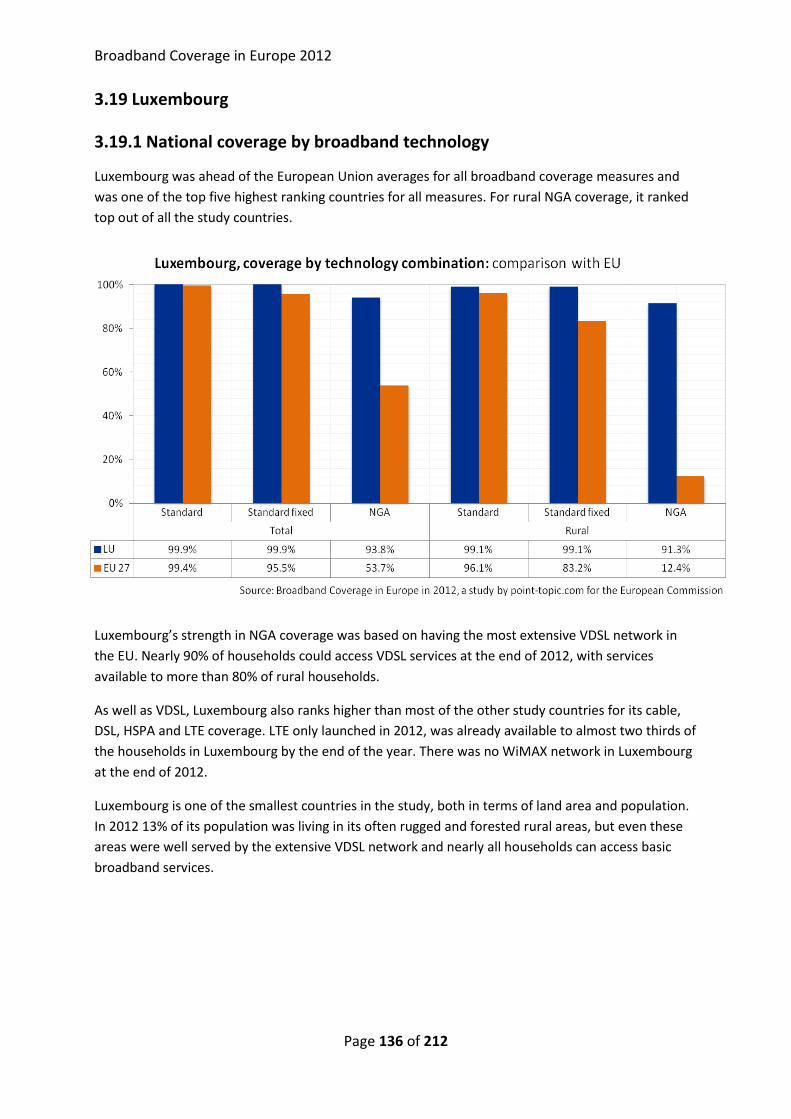
Broadband Coverage in Europe 2012
Page 136 of 212
3.19 Luxembourg
3.19.1 National coverage by broadband technology
Luxembourg was ahead of the European Union averages for all broadband coverage measures and
was one of the top five highest ranking countries for all measures. For rural NGA coverage, it ranked
top out of all the study countries.
Luxembourg’s strength in NGA coverage was based on having the most extensive VDSL network in
the EU. Nearly 90% of households could access VDSL services at the end of 2012, with services
available to more than 80% of rural households.
As well as VDSL, Luxembourg also ranks higher than most of the other study countries for its cable,
DSL, HSPA and LTE coverage. LTE only launched in 2012, was already available to almost two thirds of
the households in Luxembourg by the end of the year. There was no WiMAX network in Luxembourg
at the end of 2012.
Luxembourg is one of the smallest countries in the study, both in terms of land area and population.
In 2012 13% of its population was living in its often rugged and forested rural areas, but even these
areas were well served by the extensive VDSL network and nearly all households can access basic
broadband services.
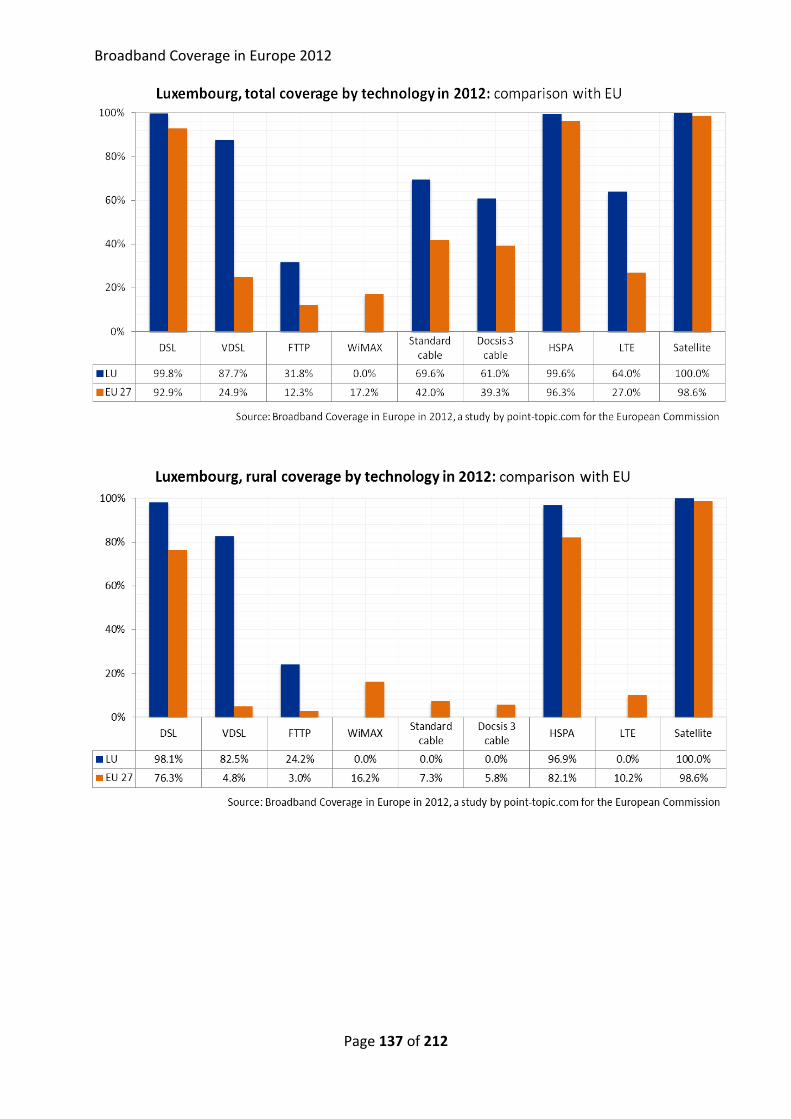
Broadband Coverage in Europe 2012
Page 137 of 212
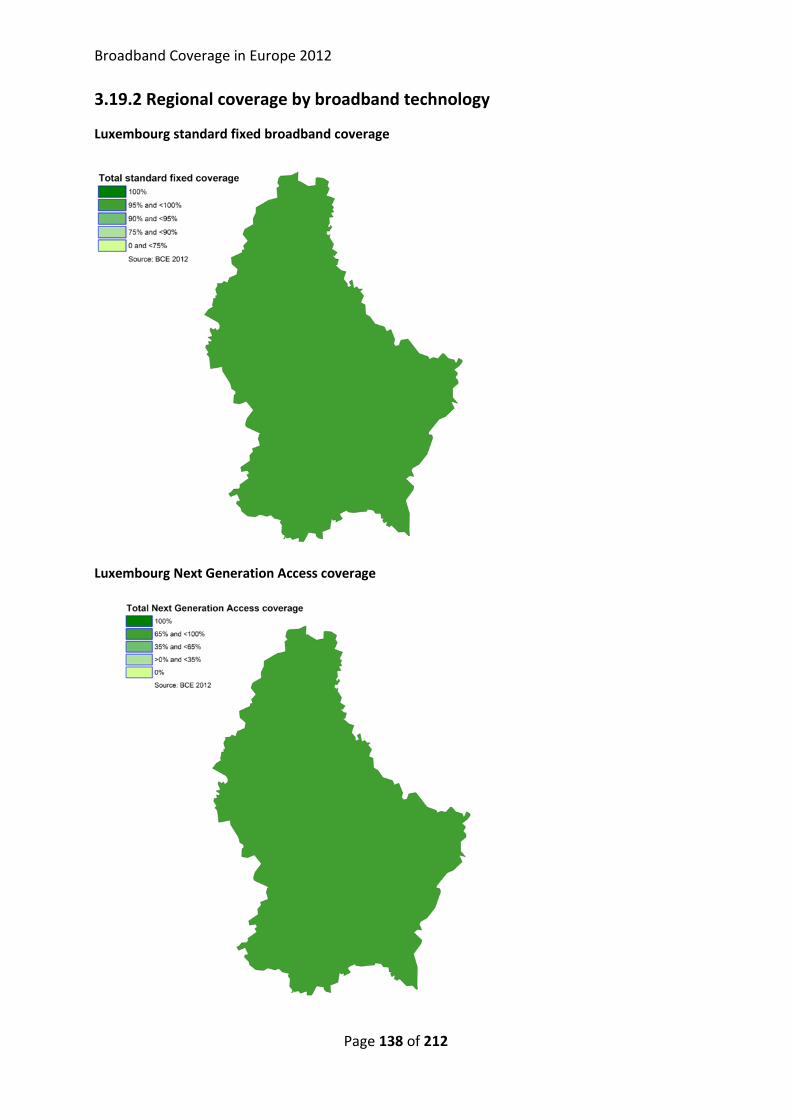
Broadband Coverage in Europe 2012
Page 138 of 212
3.19.2 Regional coverage by broadband technology
Luxembourg standard fixed broadband coverage
Luxembourg Next Generation Access coverage

Broadband Coverage in Europe 2012
Page 139 of 212
3.19.3 Data tables for Luxembourg
Statistic National
Population 524,853
Persons per household 2.4
Rural proportion 13.1%
LU - 2012 LU - 2011 EU27 - 2012
Technology Total Rural Total Rural Total Rural
DSL 99.8% 98.1% 99.8% 98.1% 92.9% 76.3%
VDSL 87.7% 82.5% 80.0% 75.3% 24.9% 4.8%
FTTP 31.8% 24.2% 23.1% 17.6% 12.3% 3.0%
WiMAX 0.0% 0.0% 0.0% 0.0% 17.2% 16.2%
Standard cable 69.6% 0.0% 63.5% 0.0% 42.0% 7.3%
Docsis 3 cable 61.0% 0.0% 52.0% 0.0% 39.3% 5.8%
HSPA 99.6% 96.9% 99.6% 96.9% 96.3% 82.1%
LTE 64.0% 0.0% 0.0% 0.0% 27.0% 10.2%
Satellite 100.0% 100.0% 100.0% 100.0% 98.6% 98.6%
Standard 99.9% 99.1%
99.4% 96.1%
Standard fixed 99.9% 99.1% 99.8% 98.1% 95.5% 83.2%
NGA 93.8% 91.3% 85.2% 84.1% 53.7% 12.4%
3.19.4 Notes on data and coverage estimates:
None.
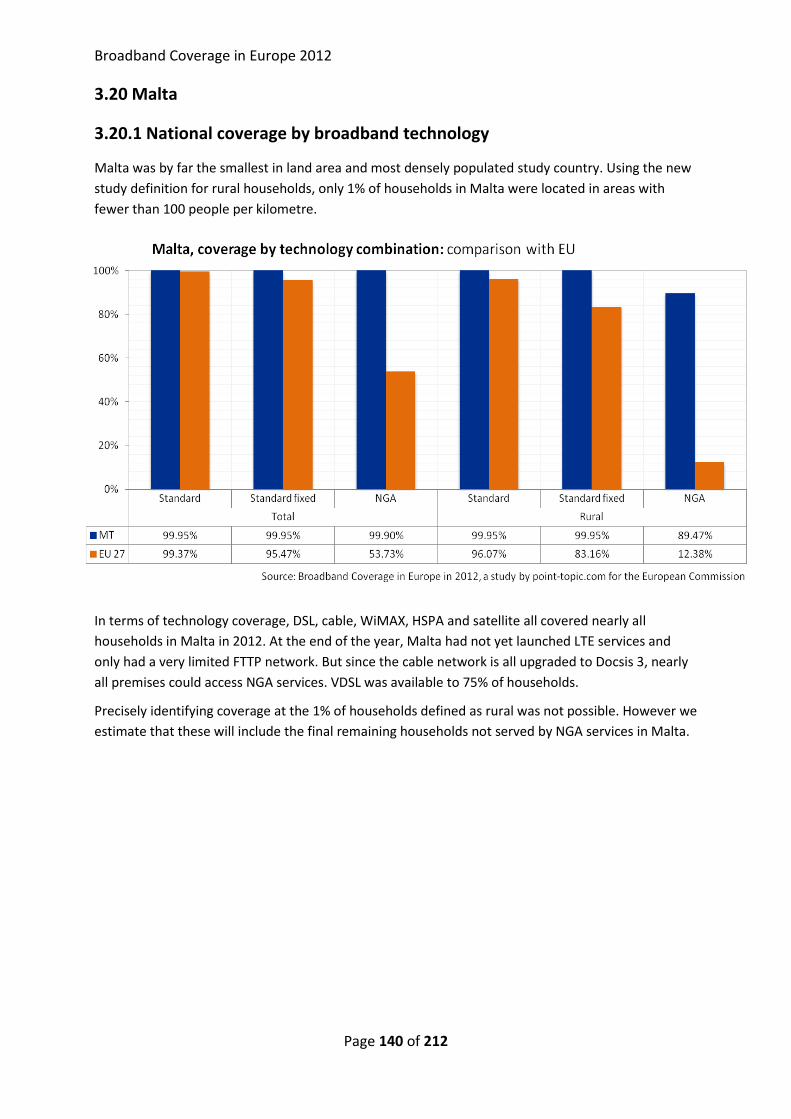
Broadband Coverage in Europe 2012
Page 140 of 212
3.20 Malta
3.20.1 National coverage by broadband technology
Malta was by far the smallest in land area and most densely populated study country. Using the new
study definition for rural households, only 1% of households in Malta were located in areas with
fewer than 100 people per kilometre.
In terms of technology coverage, DSL, cable, WiMAX, HSPA and satellite all covered nearly all
households in Malta in 2012. At the end of the year, Malta had not yet launched LTE services and
only had a very limited FTTP network. But since the cable network is all upgraded to Docsis 3, nearly
all premises could access NGA services. VDSL was available to 75% of households.
Precisely identifying coverage at the 1% of households defined as rural was not possible. However we
estimate that these will include the final remaining households not served by NGA services in Malta.
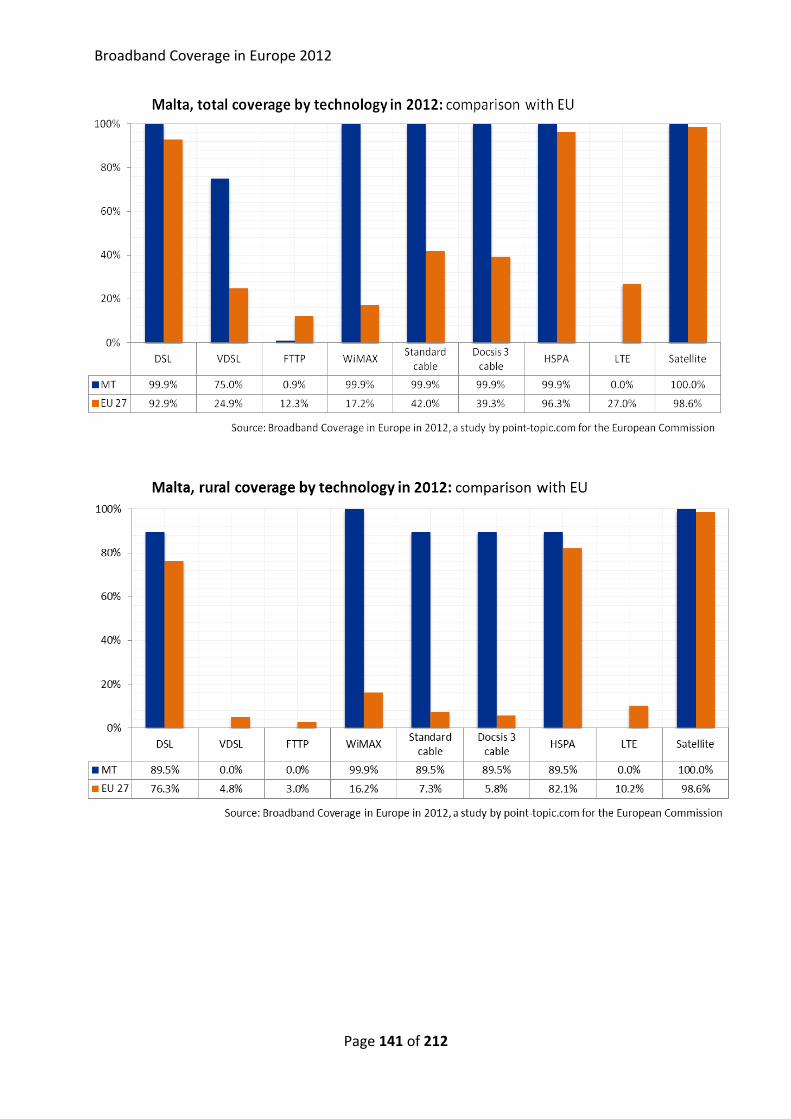
Broadband Coverage in Europe 2012
Page 141 of 212
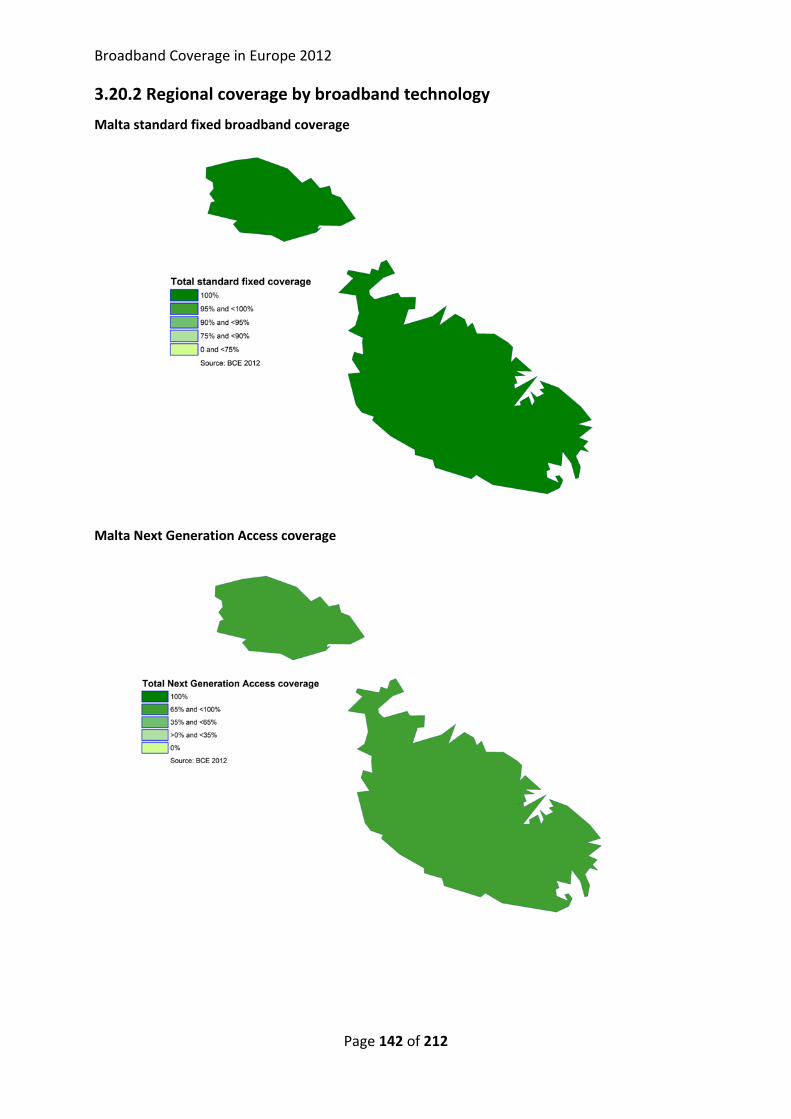
Broadband Coverage in Europe 2012
Page 142 of 212
3.20.2 Regional coverage by broadband technology
Malta standard fixed broadband coverage Malta Next Generation Access coverage

Broadband Coverage in Europe 2012
Page 143 of 212
3.20.3 Data tables for Malta
Statistic National
Population 417,520
Persons per household 2.9
Rural proportion 0.9%
MT - 2012 MT - 2011 EU27 - 2012
Technology Total Rural Total Rural Total Rural
DSL 99.9% 89.5% 99.0% 6.9% 92.9% 76.3%
VDSL 75.0% 0.0% 75.0% 0.0% 24.9% 4.8%
FTTP 0.9% 0.0% 0.0% 0.0% 12.3% 3.0%
WiMAX 99.9% 99.9% 99.9% 99.9% 17.2% 16.2%
Standard cable 99.9% 89.5% 98.5% 2.9% 42.0% 7.3%
Docsis 3 cable 99.9% 89.5% 98.5% 2.9% 39.3% 5.8%
HSPA 99.9% 89.5% 99.0% 6.9% 96.3% 82.1%
LTE 0.0% 0.0% 0.0% 0.0% 27.0% 10.2%
Satellite 100.0% 100.0% 100.0% 100.0% 98.6% 98.6%
Standard >99.95% >99.95%
99.4% 96.1%
Standard fixed >99.95% >99.95% 99.9% 99.9% 95.5% 83.2%
NGA 99.9% 89.5% 98.8% 2.9% 53.7% 12.4%
3.20.4 Notes on data and coverage estimates:
None.
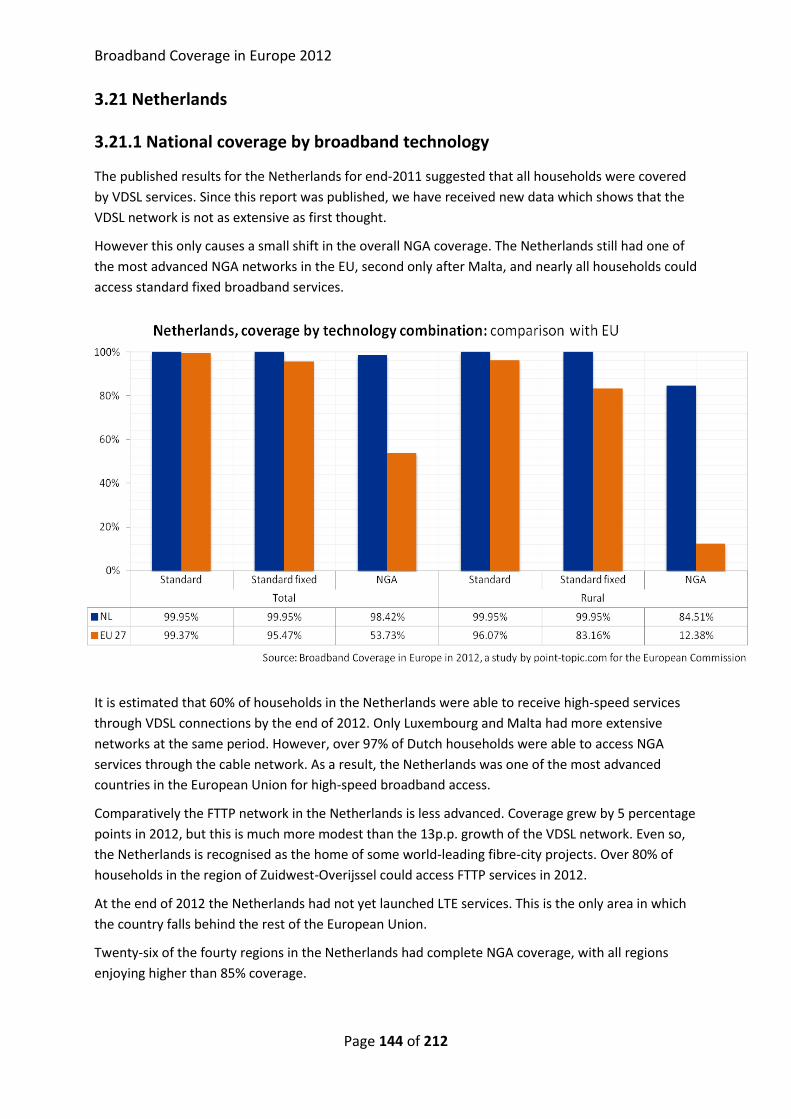
Broadband Coverage in Europe 2012
Page 144 of 212
3.21 Netherlands
3.21.1 National coverage by broadband technology
The published results for the Netherlands for end-2011 suggested that all households were covered
by VDSL services. Since this report was published, we have received new data which shows that the
VDSL network is not as extensive as first thought.
However this only causes a small shift in the overall NGA coverage. The Netherlands still had one of
the most advanced NGA networks in the EU, second only after Malta, and nearly all households could
access standard fixed broadband services.
It is estimated that 60% of households in the Netherlands were able to receive high-speed services
through VDSL connections by the end of 2012. Only Luxembourg and Malta had more extensive
networks at the same period. However, over 97% of Dutch households were able to access NGA
services through the cable network. As a result, the Netherlands was one of the most advanced
countries in the European Union for high-speed broadband access.
Comparatively the FTTP network in the Netherlands is less advanced. Coverage grew by 5 percentage
points in 2012, but this is much more modest than the 13p.p. growth of the VDSL network. Even so,
the Netherlands is recognised as the home of some world-leading fibre-city projects. Over 80% of
households in the region of Zuidwest-Overijssel could access FTTP services in 2012.
At the end of 2012 the Netherlands had not yet launched LTE services. This is the only area in which
the country falls behind the rest of the European Union.
Twenty-six of the fourty regions in the Netherlands had complete NGA coverage, with all regions
enjoying higher than 85% coverage.
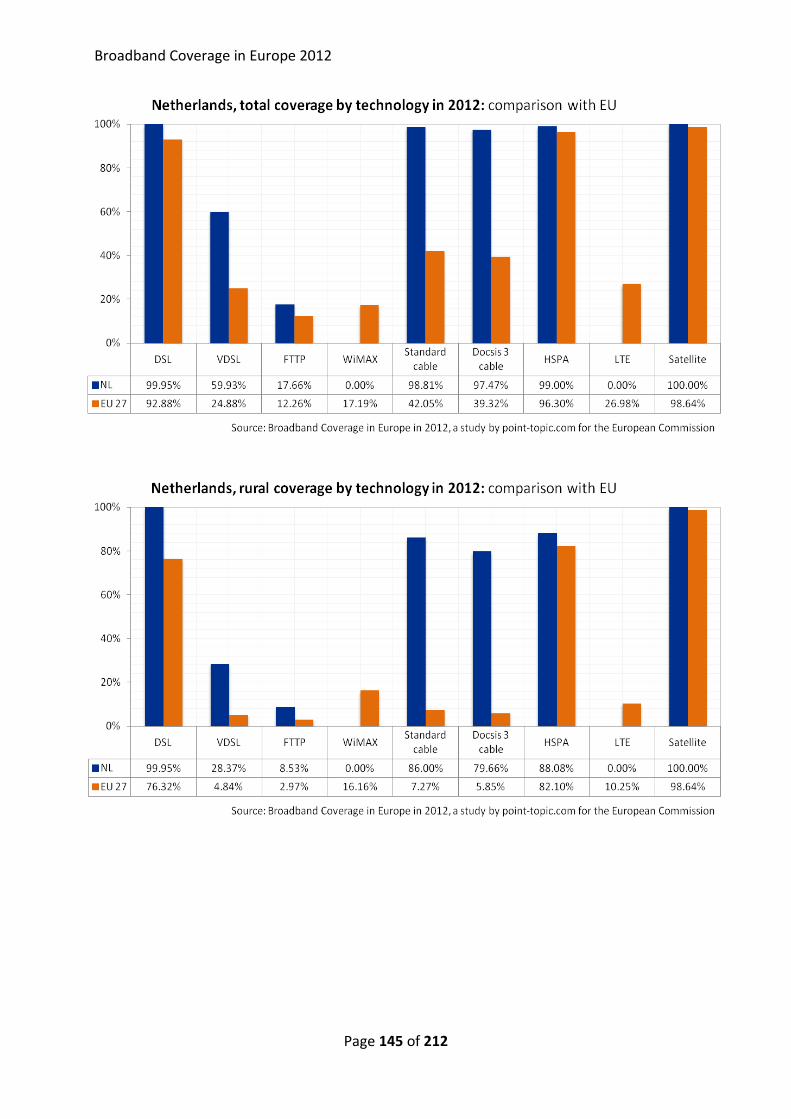
Broadband Coverage in Europe 2012
Page 145 of 212
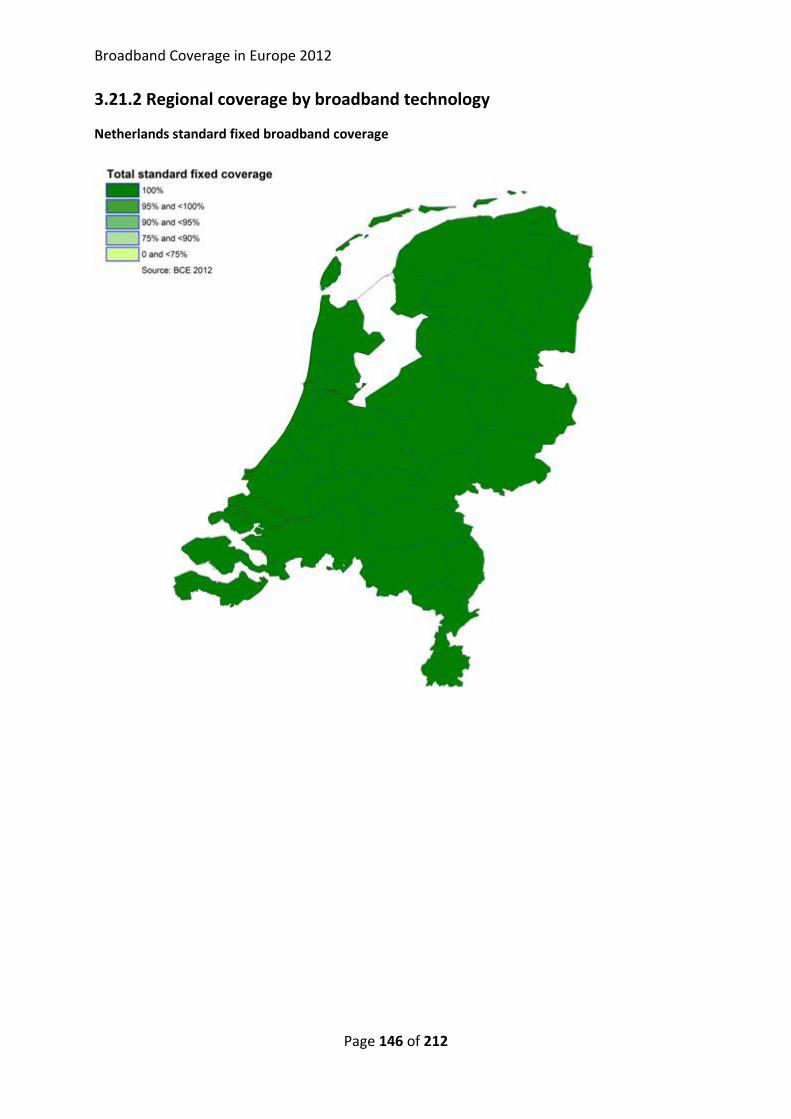
Broadband Coverage in Europe 2012
Page 146 of 212
3.21.2 Regional coverage by broadband technology
Netherlands standard fixed broadband coverage
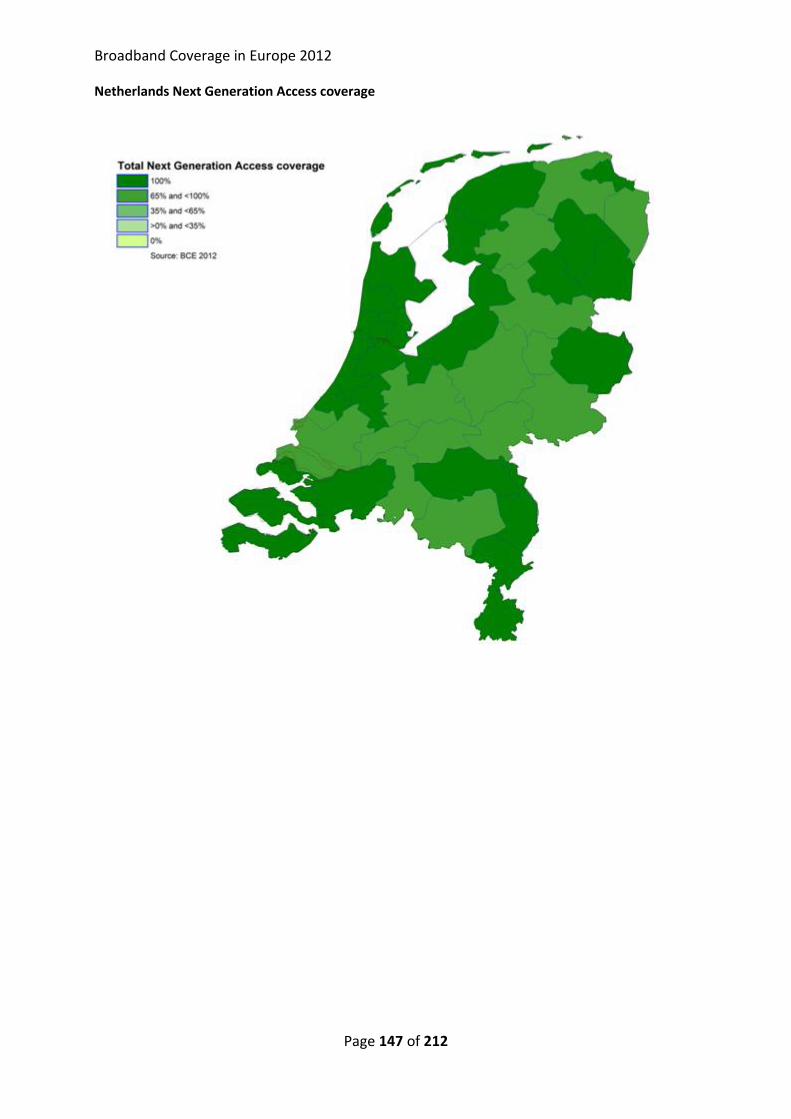
Broadband Coverage in Europe 2012
Page 147 of 212
Netherlands Next Generation Access coverage
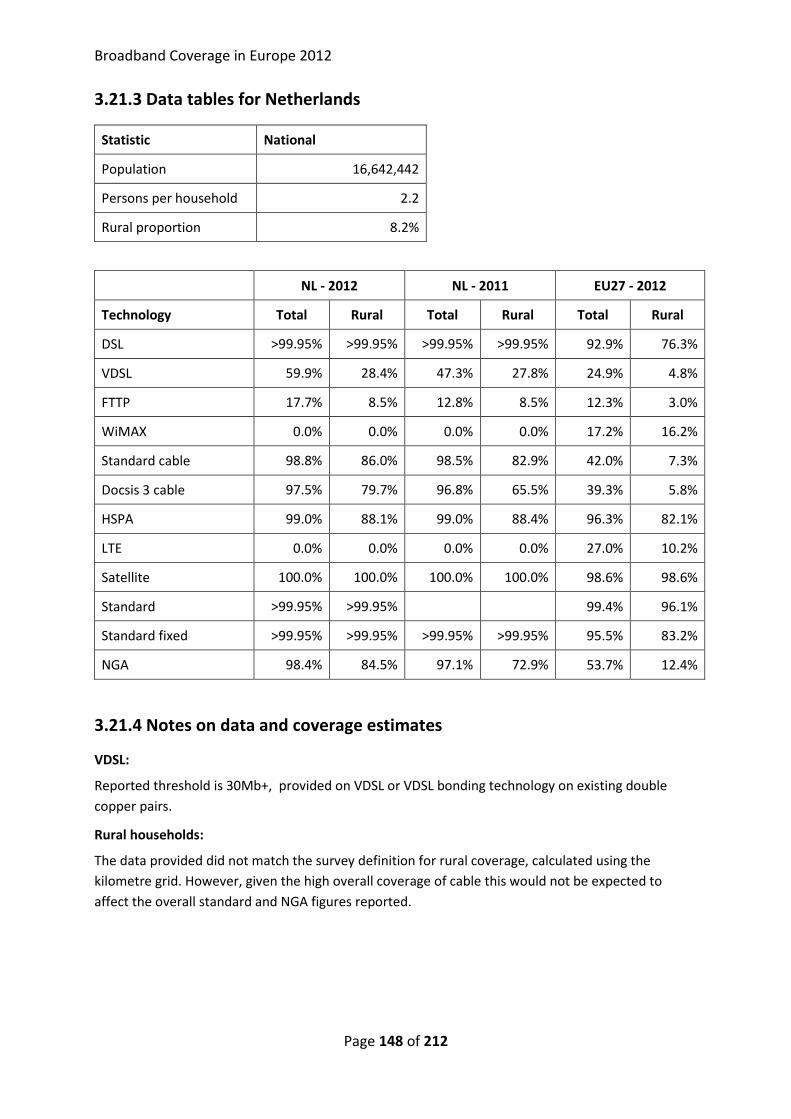
Broadband Coverage in Europe 2012
Page 148 of 212
3.21.3 Data tables for Netherlands
Statistic National
Population 16,642,442
Persons per household 2.2
Rural proportion 8.2%
NL - 2012 NL - 2011 EU27 - 2012
Technology Total Rural Total Rural Total Rural
DSL >99.95% >99.95% >99.95% >99.95% 92.9% 76.3%
VDSL 59.9% 28.4% 47.3% 27.8% 24.9% 4.8%
FTTP 17.7% 8.5% 12.8% 8.5% 12.3% 3.0%
WiMAX 0.0% 0.0% 0.0% 0.0% 17.2% 16.2%
Standard cable 98.8% 86.0% 98.5% 82.9% 42.0% 7.3%
Docsis 3 cable 97.5% 79.7% 96.8% 65.5% 39.3% 5.8%
HSPA 99.0% 88.1% 99.0% 88.4% 96.3% 82.1%
LTE 0.0% 0.0% 0.0% 0.0% 27.0% 10.2%
Satellite 100.0% 100.0% 100.0% 100.0% 98.6% 98.6%
Standard >99.95% >99.95%
99.4% 96.1%
Standard fixed >99.95% >99.95% >99.95% >99.95% 95.5% 83.2%
NGA 98.4% 84.5% 97.1% 72.9% 53.7% 12.4%
3.21.4 Notes on data and coverage estimates
VDSL:
Reported threshold is 30Mb+, provided on VDSL or VDSL bonding technology on existing double
copper pairs.
Rural households:
The data provided did not match the survey definition for rural coverage, calculated using the
kilometre grid. However, given the high overall coverage of cable this would not be expected to
affect the overall standard and NGA figures reported.
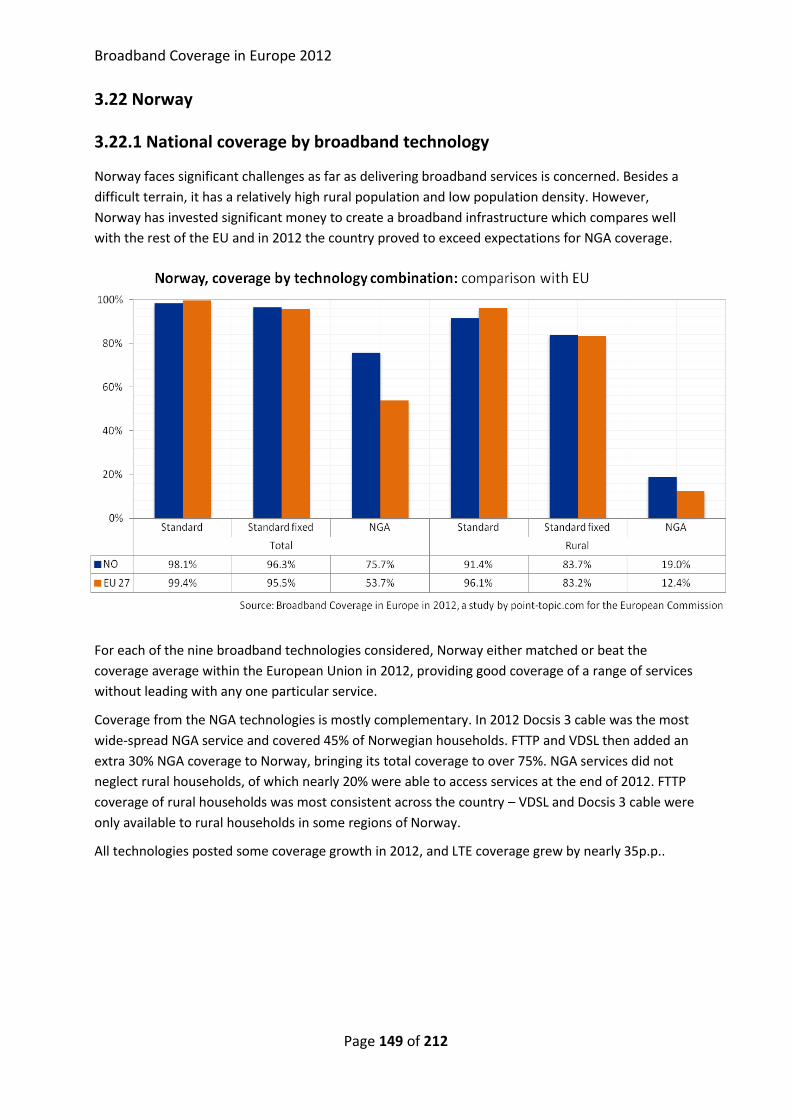
Broadband Coverage in Europe 2012
Page 149 of 212
3.22 Norway
3.22.1 National coverage by broadband technology
Norway faces significant challenges as far as delivering broadband services is concerned. Besides a
difficult terrain, it has a relatively high rural population and low population density. However,
Norway has invested significant money to create a broadband infrastructure which compares well
with the rest of the EU and in 2012 the country proved to exceed expectations for NGA coverage.
For each of the nine broadband technologies considered, Norway either matched or beat the
coverage average within the European Union in 2012, providing good coverage of a range of services
without leading with any one particular service.
Coverage from the NGA technologies is mostly complementary. In 2012 Docsis 3 cable was the most
wide-spread NGA service and covered 45% of Norwegian households. FTTP and VDSL then added an
extra 30% NGA coverage to Norway, bringing its total coverage to over 75%. NGA services did not
neglect rural households, of which nearly 20% were able to access services at the end of 2012. FTTP
coverage of rural households was most consistent across the country – VDSL and Docsis 3 cable were
only available to rural households in some regions of Norway.
All technologies posted some coverage growth in 2012, and LTE coverage grew by nearly 35p.p..
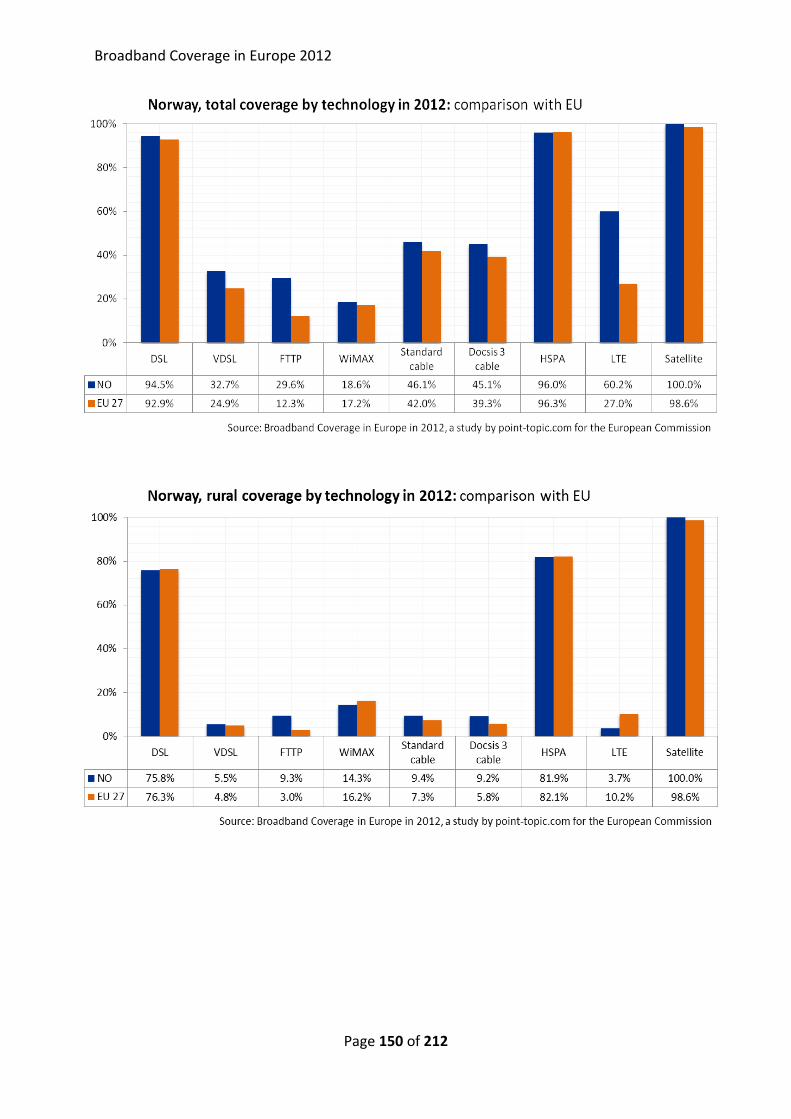
Broadband Coverage in Europe 2012
Page 150 of 212
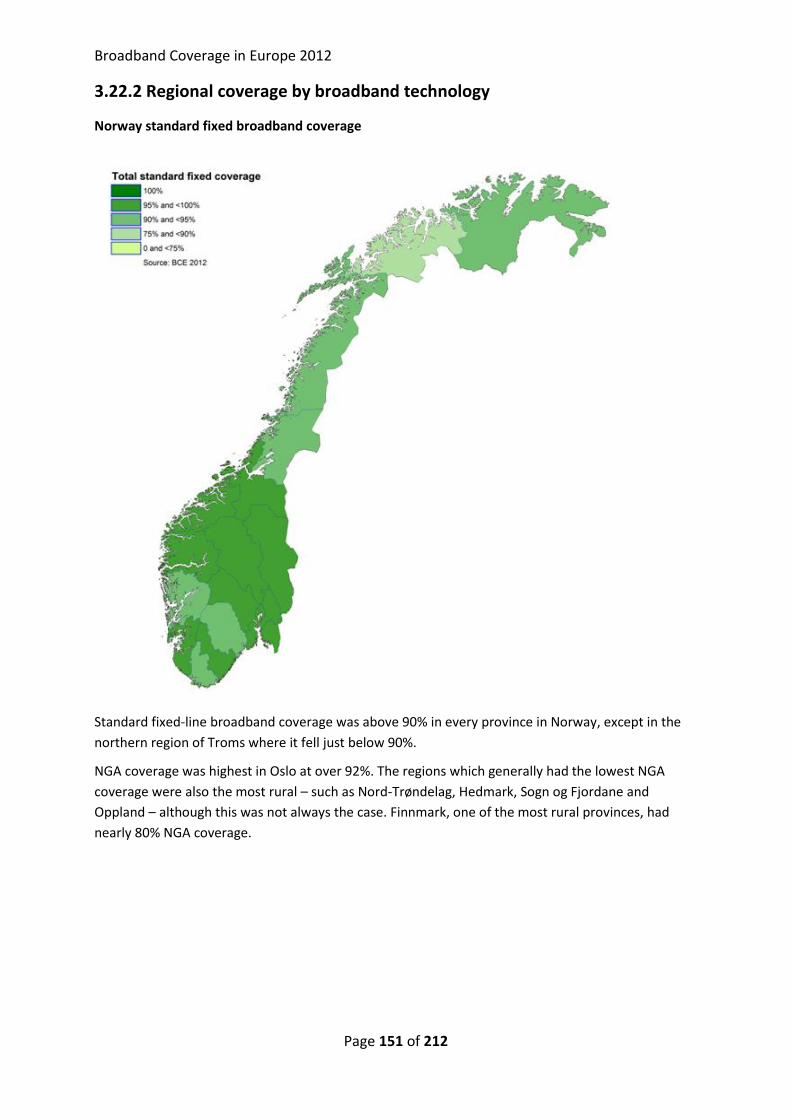
Broadband Coverage in Europe 2012
Page 151 of 212
3.22.2 Regional coverage by broadband technology
Norway standard fixed broadband coverage
Standard fixed-line broadband coverage was above 90% in every province in Norway, except in the
northern region of Troms where it fell just below 90%.
NGA coverage was highest in Oslo at over 92%. The regions which generally had the lowest NGA
coverage were also the most rural – such as Nord-Trøndelag, Hedmark, Sogn og Fjordane and
Oppland – although this was not always the case. Finnmark, one of the most rural provinces, had
nearly 80% NGA coverage.
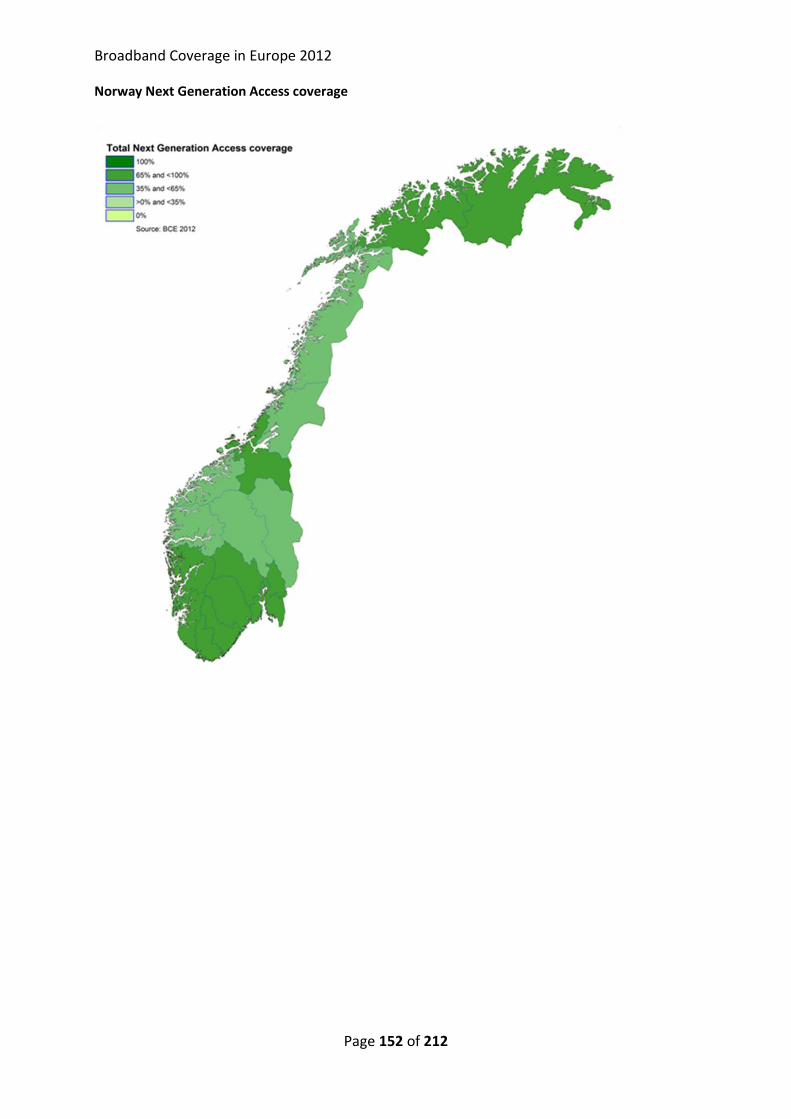
Broadband Coverage in Europe 2012
Page 152 of 212
Norway Next Generation Access coverage
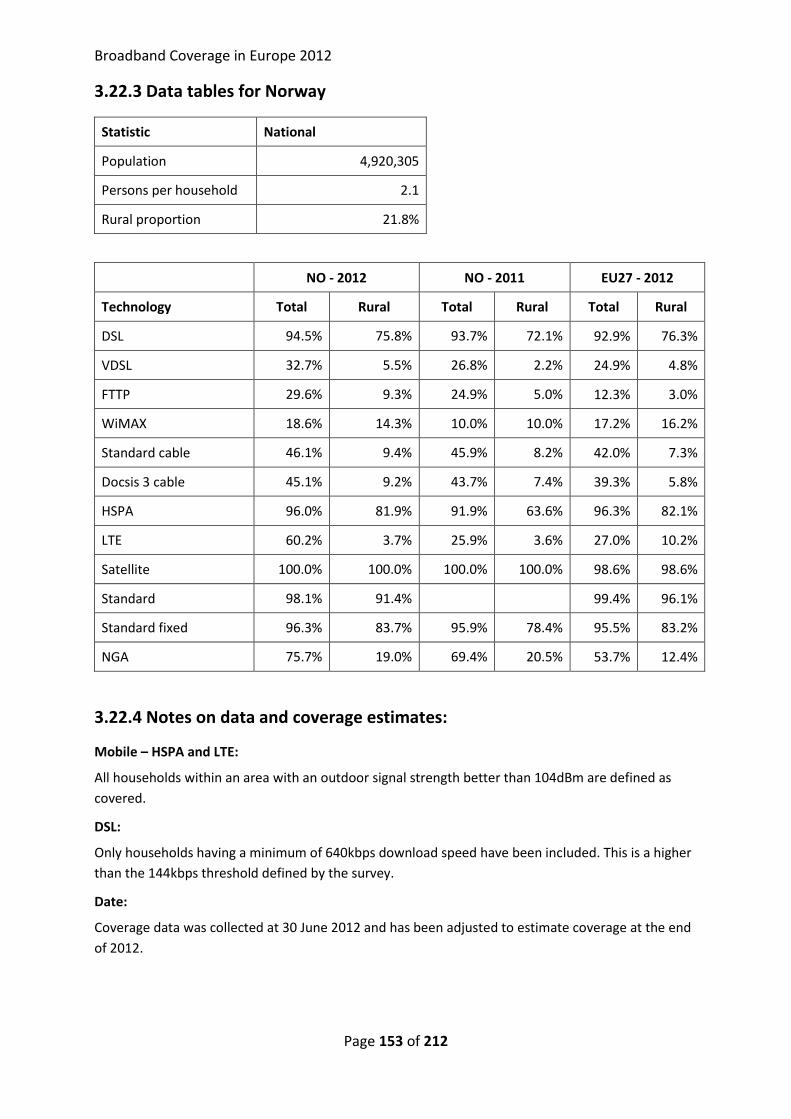
Broadband Coverage in Europe 2012
Page 153 of 212
3.22.3 Data tables for Norway
Statistic National
Population 4,920,305
Persons per household 2.1
Rural proportion 21.8%
NO - 2012 NO - 2011 EU27 - 2012
Technology Total Rural Total Rural Total Rural
DSL 94.5% 75.8% 93.7% 72.1% 92.9% 76.3%
VDSL 32.7% 5.5% 26.8% 2.2% 24.9% 4.8%
FTTP 29.6% 9.3% 24.9% 5.0% 12.3% 3.0%
WiMAX 18.6% 14.3% 10.0% 10.0% 17.2% 16.2%
Standard cable 46.1% 9.4% 45.9% 8.2% 42.0% 7.3%
Docsis 3 cable 45.1% 9.2% 43.7% 7.4% 39.3% 5.8%
HSPA 96.0% 81.9% 91.9% 63.6% 96.3% 82.1%
LTE 60.2% 3.7% 25.9% 3.6% 27.0% 10.2%
Satellite 100.0% 100.0% 100.0% 100.0% 98.6% 98.6%
Standard 98.1% 91.4%
99.4% 96.1%
Standard fixed 96.3% 83.7% 95.9% 78.4% 95.5% 83.2%
NGA 75.7% 19.0% 69.4% 20.5% 53.7% 12.4%
3.22.4 Notes on data and coverage estimates:
Mobile – HSPA and LTE:
All households within an area with an outdoor signal strength better than 104dBm are defined as
covered.
DSL:
Only households having a minimum of 640kbps download speed have been included. This is a higher
than the 144kbps threshold defined by the survey.
Date:
Coverage data was collected at 30 June 2012 and has been adjusted to estimate coverage at the end
of 2012.

Broadband Coverage in Europe 2012
Page 154 of 212
3.23 Poland
3.23.1 National coverage by broadband technology
At the end of 2012, Poland was behind the European Union averages for all the technology
combination measures. Its standard fixed broadband coverage was the lowest in the study, and rural
standard fixed coverage was second lowest after Slovenia.
The technology profile for Poland shows that DSL is responsible for the shortfall in standard fixed
broadband coverage. Just over 60% of households were estimated to be able to access DSL services
at the end of 2012. Standard cable coverage was reasonable at over 32%, but this network mostly
overlaps with the DSL network and cable added only 9% to standard fixed-line coverage. Unlike
elsewhere in Eastern Europe, Poland’s WiMAX and FTTP networks are limited and do not help to fill
the coverage gap.
On the other hand, the roll-out of VDSL increased rapidly in 2012 and over 40% of the network had
been upgraded by the end of the year. These services complemented the deployment of Docsis 3 and
overall NGA services were available to nearly 45% of households. But there was very little coverage
of the most rural households in Poland, and we estimate that less than 1% of households were able
to access NGA services at the end of 2012.
Poland’s LTE network doubled in size in 2012 and could provide services to half of all Polish
households by the end of the year.
Standard fixed broadband coverage was nearly completed in some of Poland’s most urban cities,
including Warsaw, Poznan, Kraków and Lódz. Outside of these areas and in most of Poland, coverage
fell beneath 75%. In the country’s most rural region, Sandomiersko-jędrzejowski, we reported the
lowest standard fixed broadband coverage of any area in the study. Indeed, many of Poland’s NUTS 3
areas have the lowest coverage levels reported within the whole study.

Broadband Coverage in Europe 2012
Page 155 of 212
NGA services also favour the most urban centres, and in general the areas with the highest standard
fixed broadband coverage also had the highest NGA coverage. This makes sense in a country where
most NGA services are delivered through the telephone and cable networks and the FTTP networks
are limited.
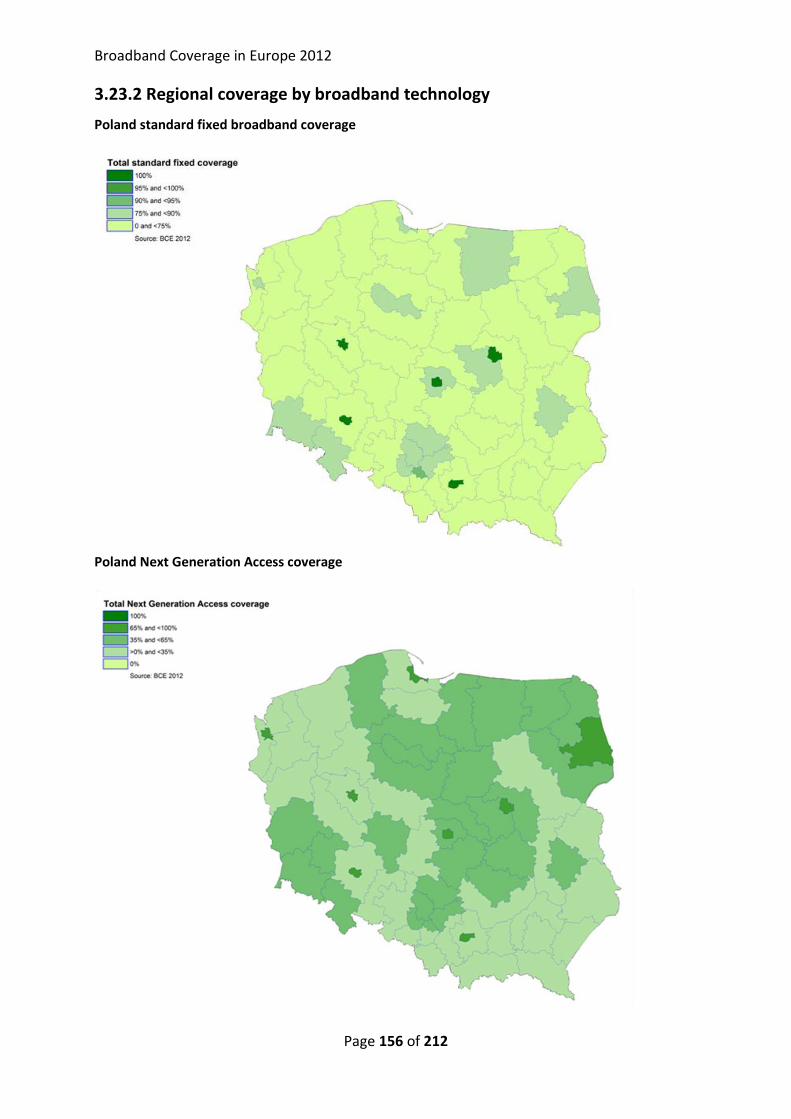
Broadband Coverage in Europe 2012
Page 156 of 212
3.23.2 Regional coverage by broadband technology
Poland standard fixed broadband coverage
Poland Next Generation Access coverage

Broadband Coverage in Europe 2012
Page 157 of 212
3.23.3 Data tables for Poland
Statistic National
Population 38,200,037
Persons per household 2.8
Rural proportion 20.7%
PL - 2012 PL - 2011 EU27 - 2012
Technology Total Rural Total Rural Total Rural
DSL 60.5% 37.3% 60.4% 37.0% 92.9% 76.3%
VDSL 25.7% 0.0% 11.7% 0.0% 24.9% 4.8%
FTTP 2.9% 0.0% 2.2% 0.0% 12.3% 3.0%
WiMAX 0.3% 0.3% 0.3% 0.3% 17.2% 16.2%
Standard cable 32.4% 0.7% 30.2% 0.6% 42.0% 7.3%
Docsis 3 cable 30.5% 0.7% 30.2% 0.6% 39.3% 5.8%
HSPA 96.5% 83.1% 90.0% 51.9% 96.3% 82.1%
LTE 50.0% 0.2% 25.0% 0.0% 27.0% 10.2%
Satellite 100.0% 100.0% 100.0% 100.0% 98.6% 98.6%
Standard 98.4% 92.3%
99.4% 96.1%
Standard fixed 69.1% 37.7% 65.4% 37.5% 95.5% 83.2%
NGA 44.5% 0.7% 36.8% 0.6% 53.7% 12.4%
Notes on data and coverage estimates:
Coverage definitions:
Data supplied for DSL and WiMAX are based on “single-family homes and flats in apartment
buildings” rather than households.
VDSL:
It has been commented that the data concerning VDSL could represent just single-family homes and
flats in apartment buildings with active VDSL service, not including single-family homes and flats in
apartment buildings which are in range of VDSL.
The survey definition for VDSL coverage is:
Close enough to a VDSL-enabled cabinet or exchange to get a broadband signal of at least 25Mbps
downstream, typically equivalent to a radial distance of about 500 metres.

Broadband Coverage in Europe 2012
Page 158 of 212
In Poland, we were not able to confirm the definition for coverage used in the report, and so we
assume that it includes all coverage and is not restricted to superfast coverage.
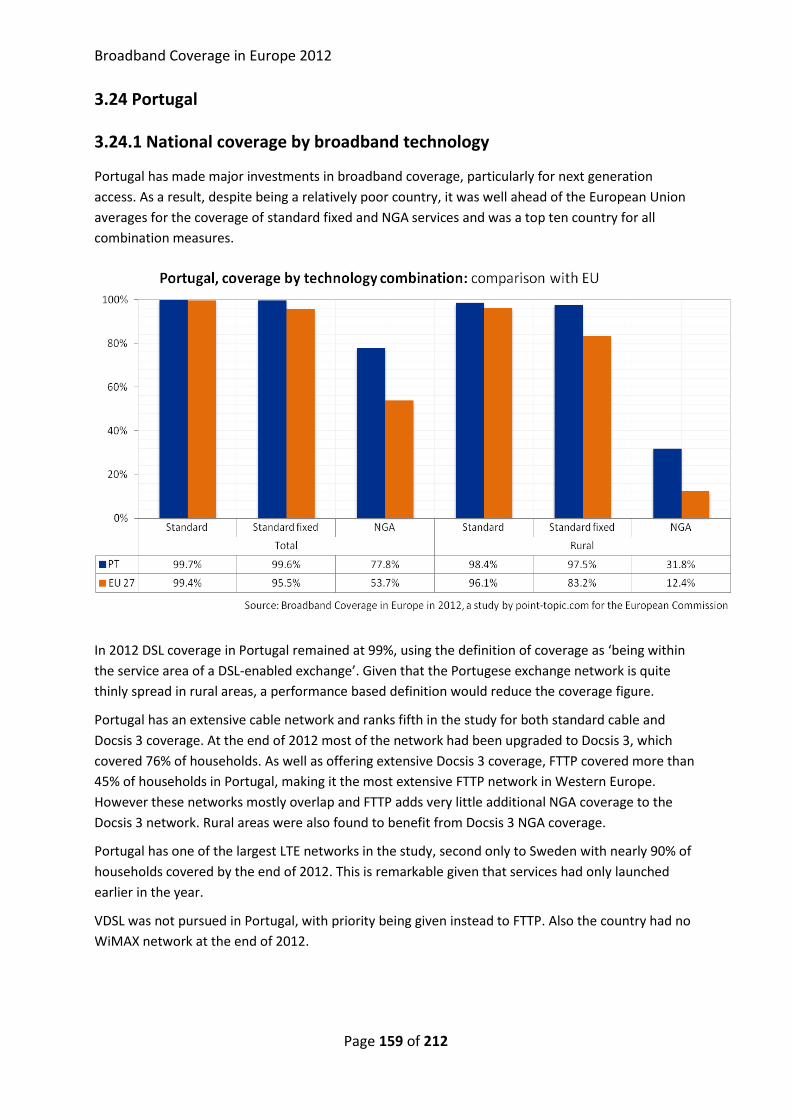
Broadband Coverage in Europe 2012
Page 159 of 212
3.24 Portugal
3.24.1 National coverage by broadband technology
Portugal has made major investments in broadband coverage, particularly for next generation
access. As a result, despite being a relatively poor country, it was well ahead of the European Union
averages for the coverage of standard fixed and NGA services and was a top ten country for all
combination measures.
In 2012 DSL coverage in Portugal remained at 99%, using the definition of coverage as ‘being within
the service area of a DSL-enabled exchange’. Given that the Portugese exchange network is quite
thinly spread in rural areas, a performance based definition would reduce the coverage figure.
Portugal has an extensive cable network and ranks fifth in the study for both standard cable and
Docsis 3 coverage. At the end of 2012 most of the network had been upgraded to Docsis 3, which
covered 76% of households. As well as offering extensive Docsis 3 coverage, FTTP covered more than
45% of households in Portugal, making it the most extensive FTTP network in Western Europe.
However these networks mostly overlap and FTTP adds very little additional NGA coverage to the
Docsis 3 network. Rural areas were also found to benefit from Docsis 3 NGA coverage.
Portugal has one of the largest LTE networks in the study, second only to Sweden with nearly 90% of
households covered by the end of 2012. This is remarkable given that services had only launched
earlier in the year.
VDSL was not pursued in Portugal, with priority being given instead to FTTP. Also the country had no
WiMAX network at the end of 2012.

Broadband Coverage in Europe 2012
Page 160 of 212

Broadband Coverage in Europe 2012
Page 161 of 212
3.24.2 Regional coverage by broadband technology
Portugal standard fixed broadband coverage
Portugal had at least 99% standard broadband coverage across all its NUTS 3 areas in 2012. Lisbon
and Oporto along with their surrounding areas, as well as the southern province of the Algarve, all
enjoyed total coverage.
The coverage of NGA was more varied. The five provinces indicated above had complete coverage.
Three coastal provinces, and also the overseas regions of Madeira and the Azores, had between 81
and 95% NGA coverage. It is the northern and north-eastern regions which had the lowest coverage.
These do not correspond to the most rural areas of the country.
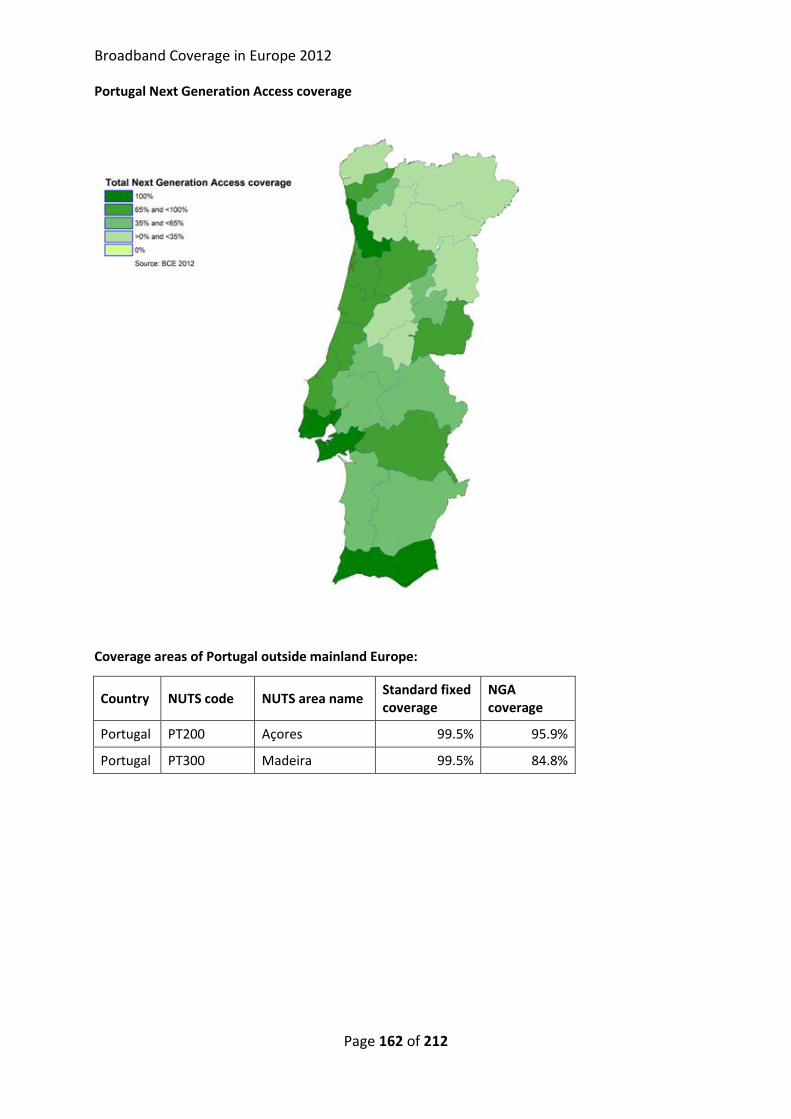
Broadband Coverage in Europe 2012
Page 162 of 212
Portugal Next Generation Access coverage
Coverage areas of Portugal outside mainland Europe:
Country NUTS code NUTS area name Standard fixed coverage
NGA coverage
Portugal PT200 Açores 99.5% 95.9%
Portugal PT300 Madeira 99.5% 84.8%
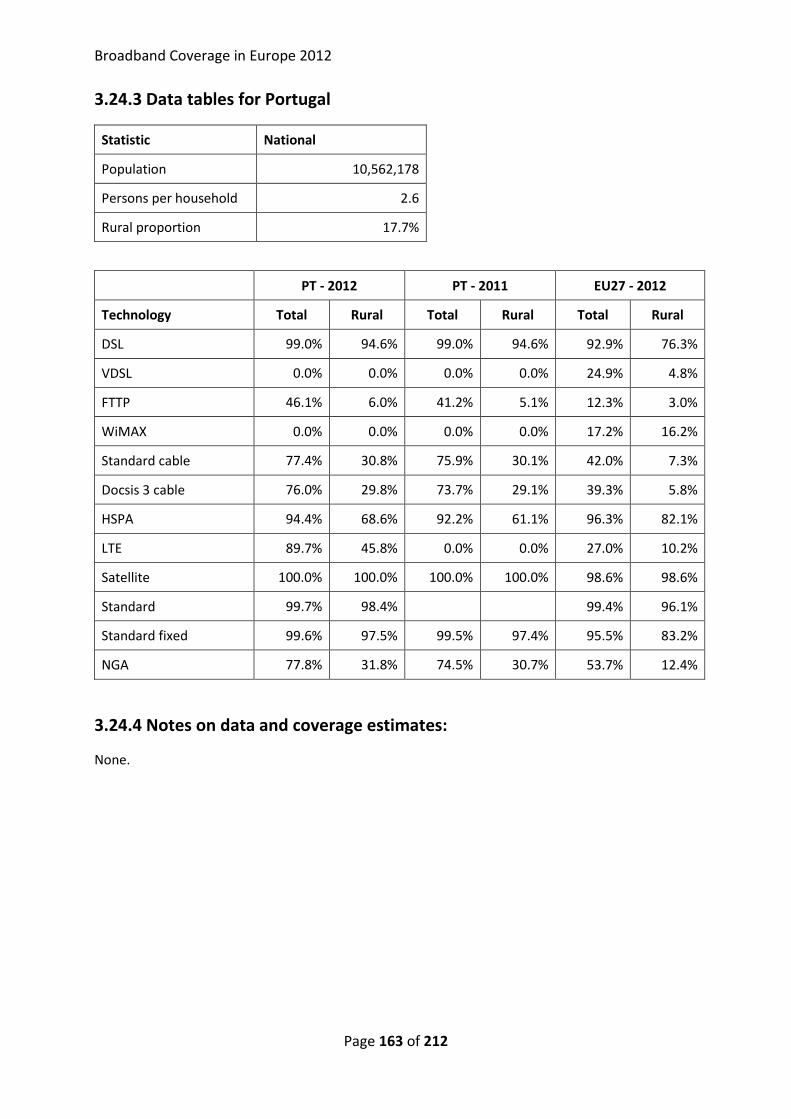
Broadband Coverage in Europe 2012
Page 163 of 212
3.24.3 Data tables for Portugal
Statistic National
Population 10,562,178
Persons per household 2.6
Rural proportion 17.7%
PT - 2012 PT - 2011 EU27 - 2012
Technology Total Rural Total Rural Total Rural
DSL 99.0% 94.6% 99.0% 94.6% 92.9% 76.3%
VDSL 0.0% 0.0% 0.0% 0.0% 24.9% 4.8%
FTTP 46.1% 6.0% 41.2% 5.1% 12.3% 3.0%
WiMAX 0.0% 0.0% 0.0% 0.0% 17.2% 16.2%
Standard cable 77.4% 30.8% 75.9% 30.1% 42.0% 7.3%
Docsis 3 cable 76.0% 29.8% 73.7% 29.1% 39.3% 5.8%
HSPA 94.4% 68.6% 92.2% 61.1% 96.3% 82.1%
LTE 89.7% 45.8% 0.0% 0.0% 27.0% 10.2%
Satellite 100.0% 100.0% 100.0% 100.0% 98.6% 98.6%
Standard 99.7% 98.4%
99.4% 96.1%
Standard fixed 99.6% 97.5% 99.5% 97.4% 95.5% 83.2%
NGA 77.8% 31.8% 74.5% 30.7% 53.7% 12.4%
3.24.4 Notes on data and coverage estimates:
None.
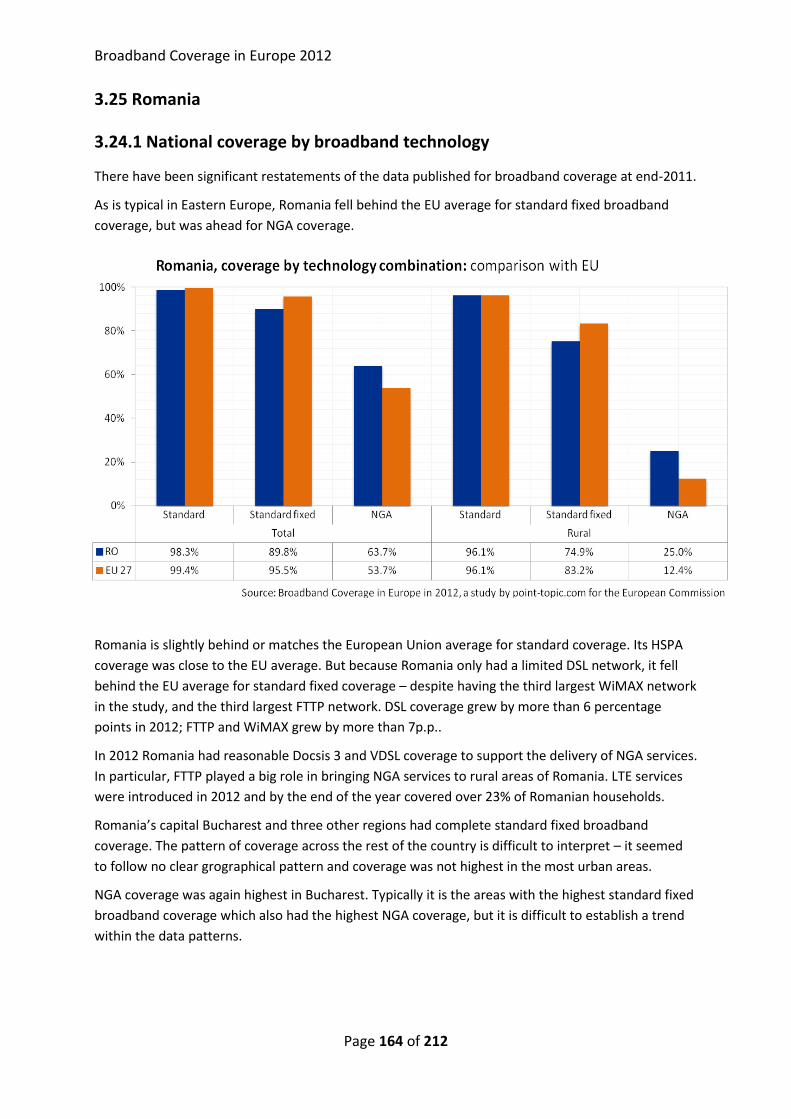
Broadband Coverage in Europe 2012
Page 164 of 212
3.25 Romania
3.24.1 National coverage by broadband technology
There have been significant restatements of the data published for broadband coverage at end-2011.
As is typical in Eastern Europe, Romania fell behind the EU average for standard fixed broadband
coverage, but was ahead for NGA coverage.
Romania is slightly behind or matches the European Union average for standard coverage. Its HSPA
coverage was close to the EU average. But because Romania only had a limited DSL network, it fell
behind the EU average for standard fixed coverage – despite having the third largest WiMAX network
in the study, and the third largest FTTP network. DSL coverage grew by more than 6 percentage
points in 2012; FTTP and WiMAX grew by more than 7p.p..
In 2012 Romania had reasonable Docsis 3 and VDSL coverage to support the delivery of NGA services.
In particular, FTTP played a big role in bringing NGA services to rural areas of Romania. LTE services
were introduced in 2012 and by the end of the year covered over 23% of Romanian households.
Romania’s capital Bucharest and three other regions had complete standard fixed broadband
coverage. The pattern of coverage across the rest of the country is difficult to interpret – it seemed
to follow no clear grographical pattern and coverage was not highest in the most urban areas.
NGA coverage was again highest in Bucharest. Typically it is the areas with the highest standard fixed
broadband coverage which also had the highest NGA coverage, but it is difficult to establish a trend
within the data patterns.
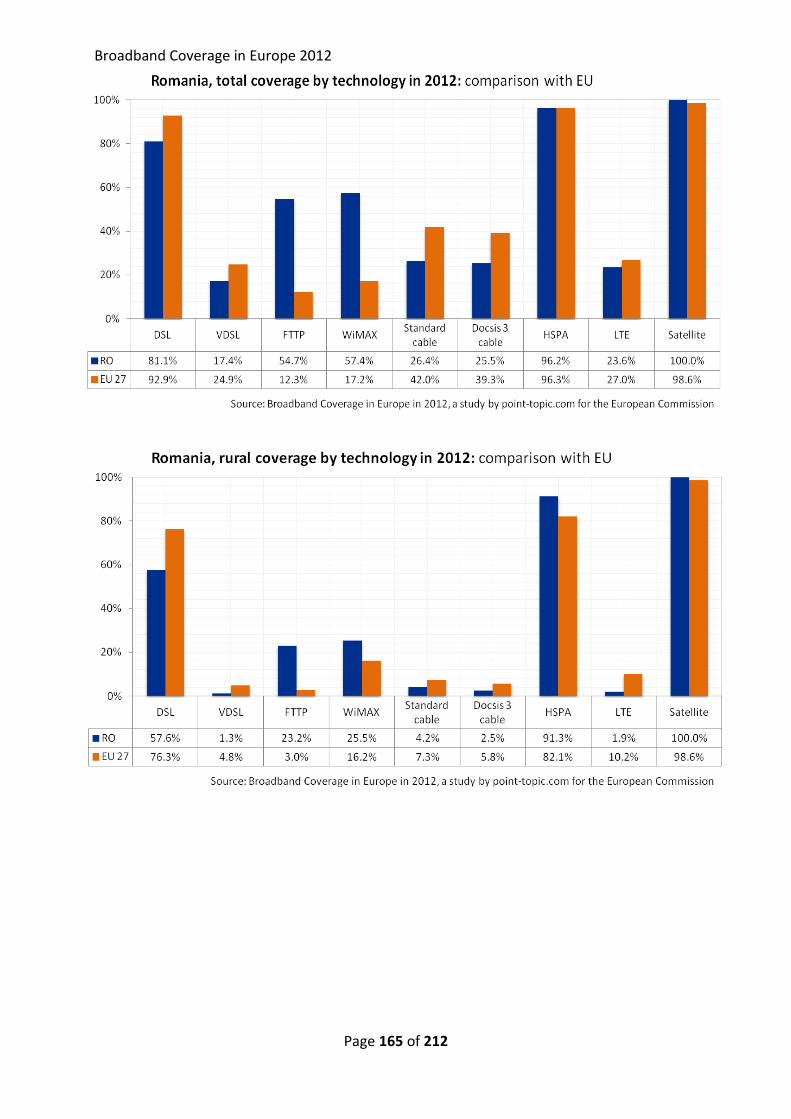
Broadband Coverage in Europe 2012
Page 165 of 212
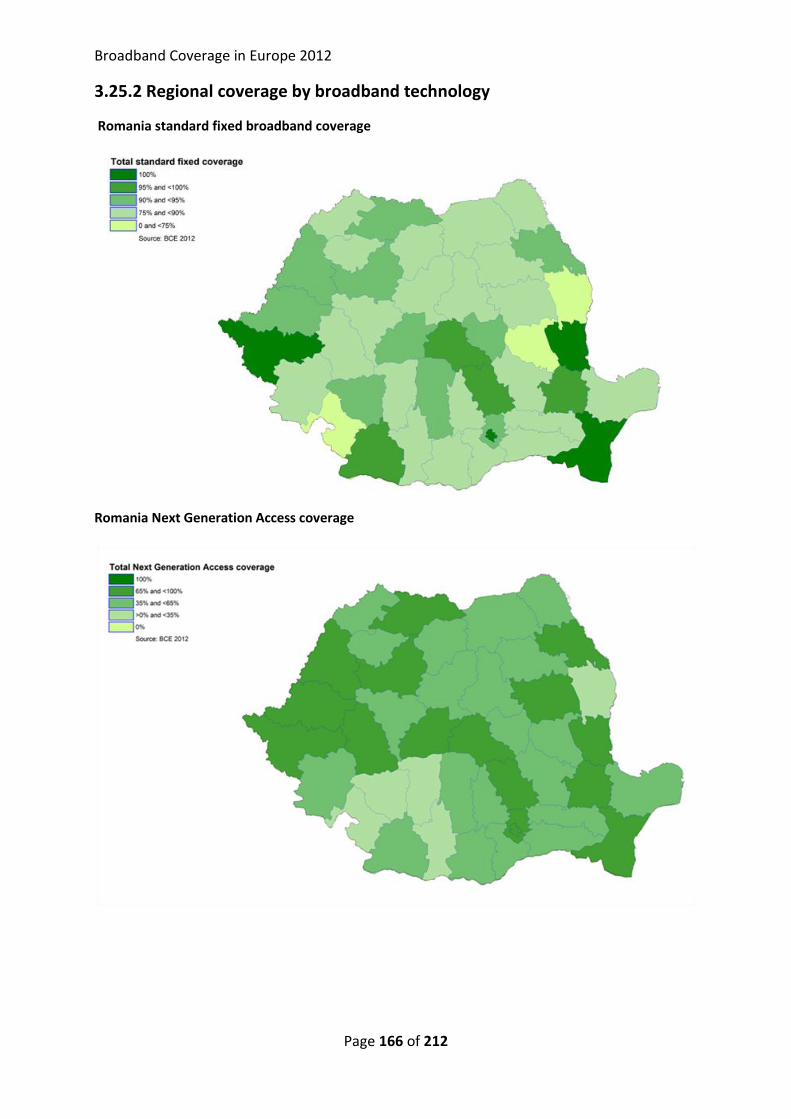
Broadband Coverage in Europe 2012
Page 166 of 212
3.25.2 Regional coverage by broadband technology
Romania standard fixed broadband coverage
Romania Next Generation Access coverage
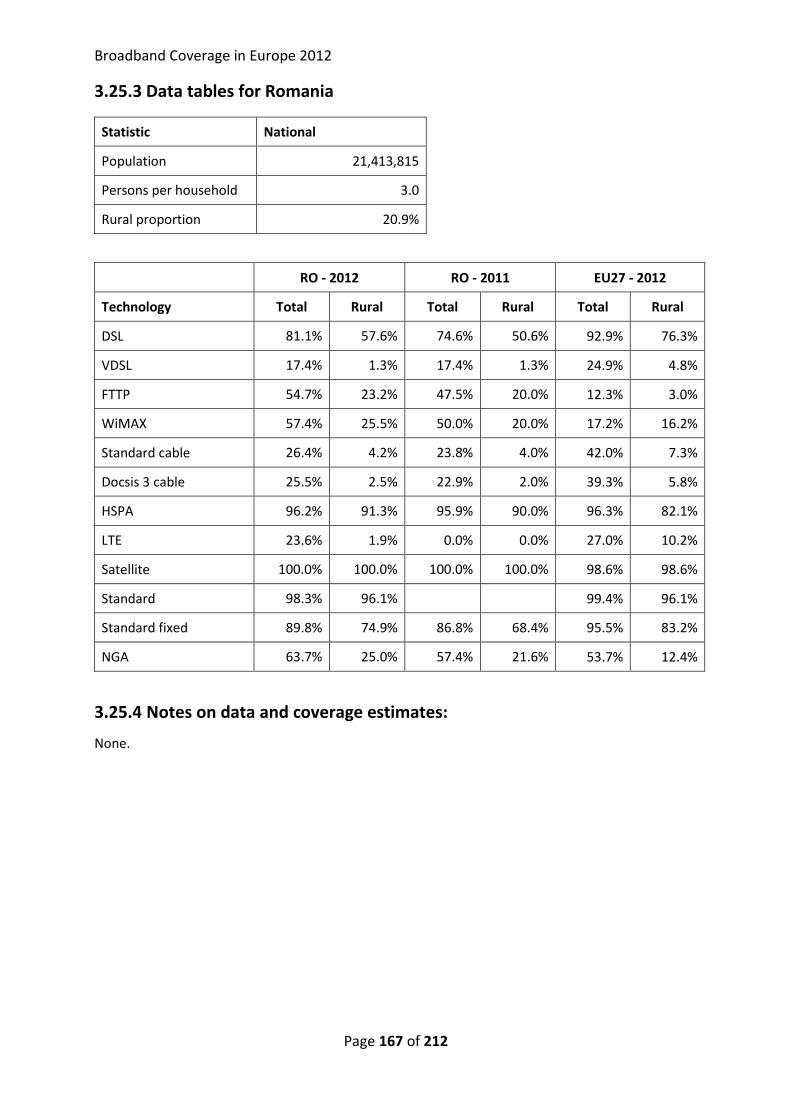
Broadband Coverage in Europe 2012
Page 167 of 212
3.25.3 Data tables for Romania
Statistic National
Population 21,413,815
Persons per household 3.0
Rural proportion 20.9%
RO - 2012 RO - 2011 EU27 - 2012
Technology Total Rural Total Rural Total Rural
DSL 81.1% 57.6% 74.6% 50.6% 92.9% 76.3%
VDSL 17.4% 1.3% 17.4% 1.3% 24.9% 4.8%
FTTP 54.7% 23.2% 47.5% 20.0% 12.3% 3.0%
WiMAX 57.4% 25.5% 50.0% 20.0% 17.2% 16.2%
Standard cable 26.4% 4.2% 23.8% 4.0% 42.0% 7.3%
Docsis 3 cable 25.5% 2.5% 22.9% 2.0% 39.3% 5.8%
HSPA 96.2% 91.3% 95.9% 90.0% 96.3% 82.1%
LTE 23.6% 1.9% 0.0% 0.0% 27.0% 10.2%
Satellite 100.0% 100.0% 100.0% 100.0% 98.6% 98.6%
Standard 98.3% 96.1%
99.4% 96.1%
Standard fixed 89.8% 74.9% 86.8% 68.4% 95.5% 83.2%
NGA 63.7% 25.0% 57.4% 21.6% 53.7% 12.4%
3.25.4 Notes on data and coverage estimates:
None.
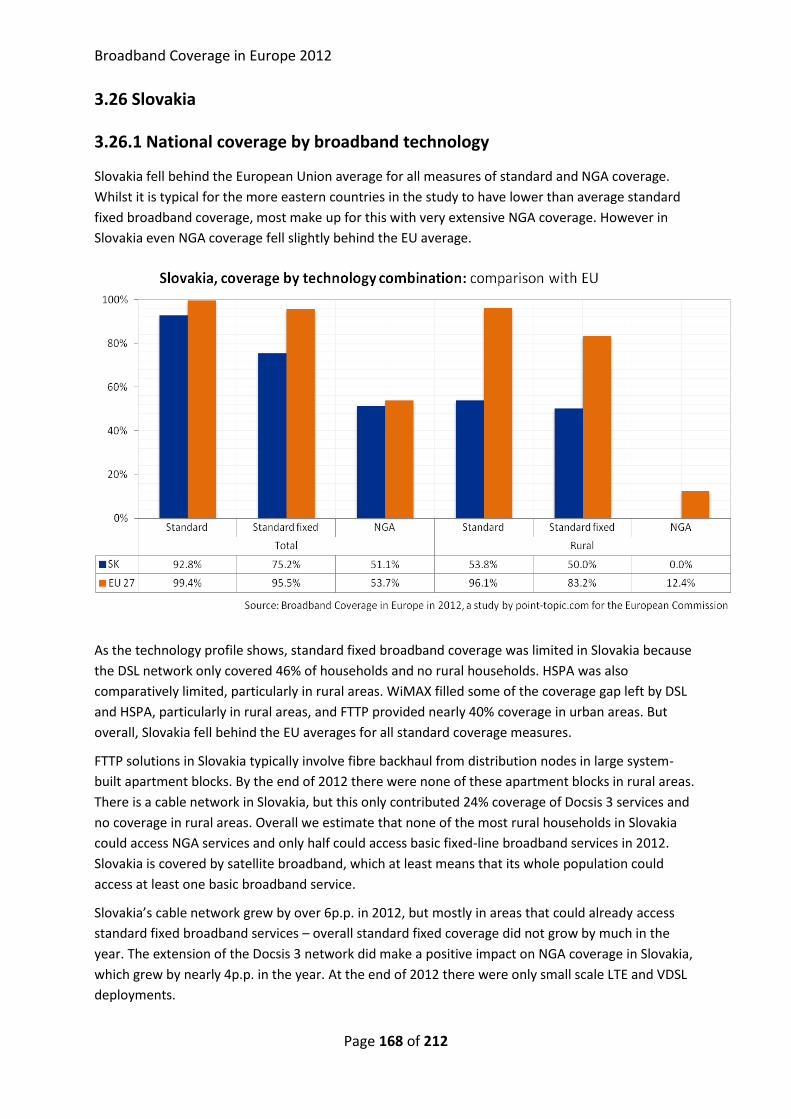
Broadband Coverage in Europe 2012
Page 168 of 212
3.26 Slovakia
3.26.1 National coverage by broadband technology
Slovakia fell behind the European Union average for all measures of standard and NGA coverage.
Whilst it is typical for the more eastern countries in the study to have lower than average standard
fixed broadband coverage, most make up for this with very extensive NGA coverage. However in
Slovakia even NGA coverage fell slightly behind the EU average.
As the technology profile shows, standard fixed broadband coverage was limited in Slovakia because
the DSL network only covered 46% of households and no rural households. HSPA was also
comparatively limited, particularly in rural areas. WiMAX filled some of the coverage gap left by DSL
and HSPA, particularly in rural areas, and FTTP provided nearly 40% coverage in urban areas. But
overall, Slovakia fell behind the EU averages for all standard coverage measures.
FTTP solutions in Slovakia typically involve fibre backhaul from distribution nodes in large system-
built apartment blocks. By the end of 2012 there were none of these apartment blocks in rural areas.
There is a cable network in Slovakia, but this only contributed 24% coverage of Docsis 3 services and
no coverage in rural areas. Overall we estimate that none of the most rural households in Slovakia
could access NGA services and only half could access basic fixed-line broadband services in 2012.
Slovakia is covered by satellite broadband, which at least means that its whole population could
access at least one basic broadband service.
Slovakia’s cable network grew by over 6p.p. in 2012, but mostly in areas that could already access
standard fixed broadband services – overall standard fixed coverage did not grow by much in the
year. The extension of the Docsis 3 network did make a positive impact on NGA coverage in Slovakia,
which grew by nearly 4p.p. in the year. At the end of 2012 there were only small scale LTE and VDSL
deployments.
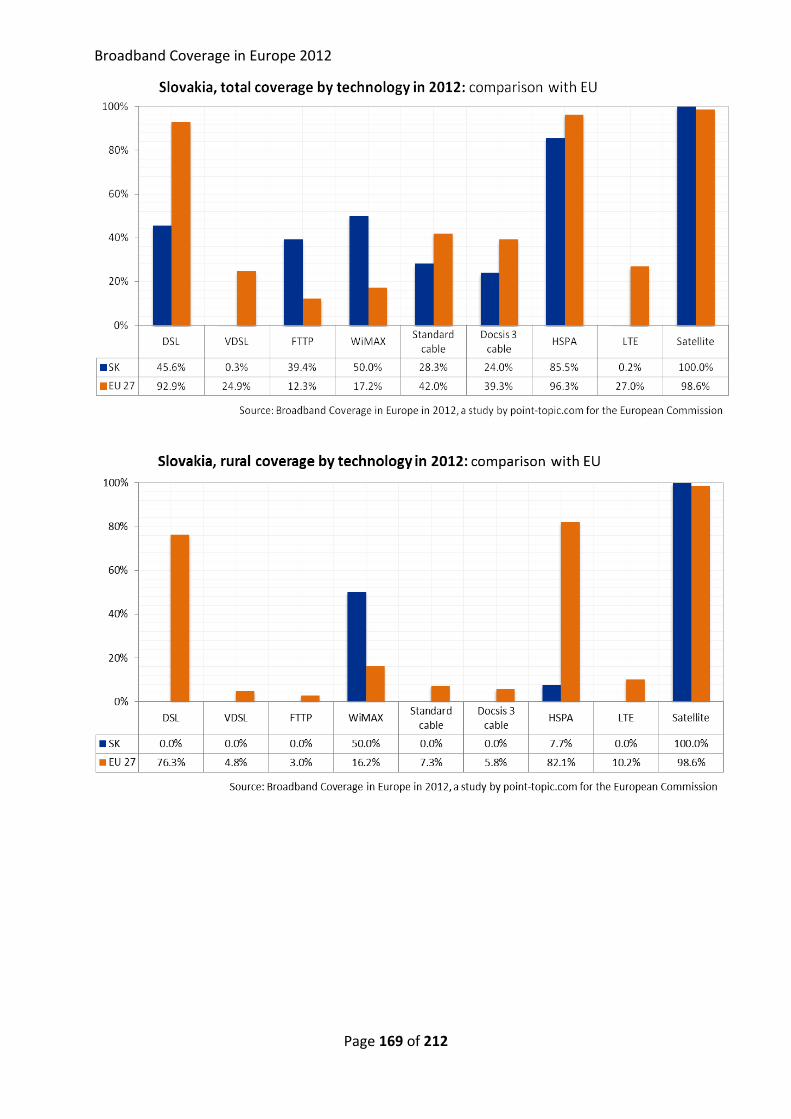
Broadband Coverage in Europe 2012
Page 169 of 212
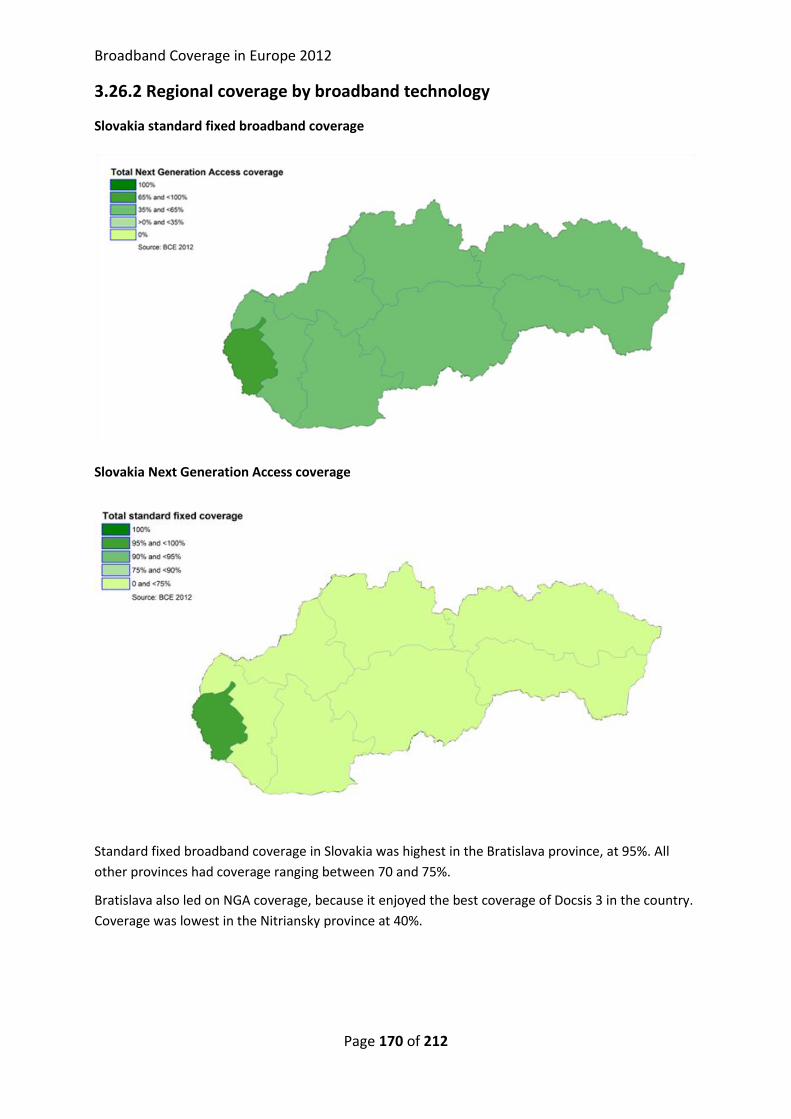
Broadband Coverage in Europe 2012
Page 170 of 212
3.26.2 Regional coverage by broadband technology
Slovakia standard fixed broadband coverage
Slovakia Next Generation Access coverage
Standard fixed broadband coverage in Slovakia was highest in the Bratislava province, at 95%. All
other provinces had coverage ranging between 70 and 75%.
Bratislava also led on NGA coverage, because it enjoyed the best coverage of Docsis 3 in the country.
Coverage was lowest in the Nitriansky province at 40%.
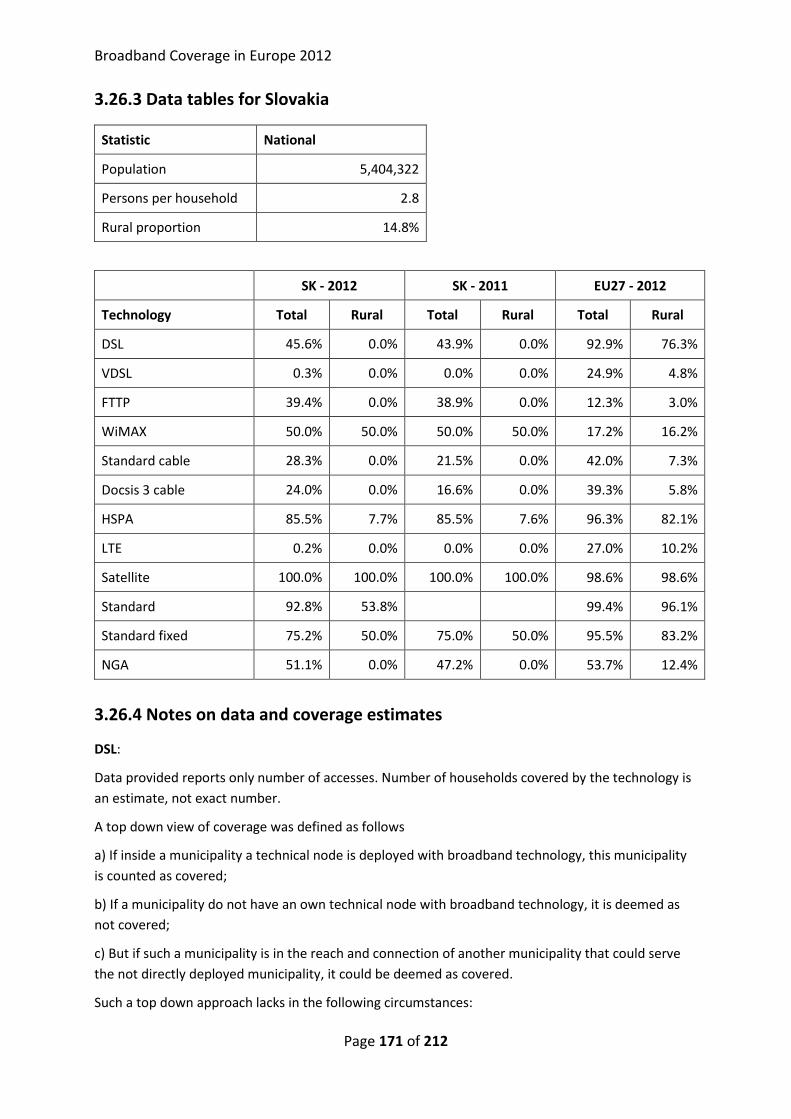
Broadband Coverage in Europe 2012
Page 171 of 212
3.26.3 Data tables for Slovakia
Statistic National
Population 5,404,322
Persons per household 2.8
Rural proportion 14.8%
SK - 2012 SK - 2011 EU27 - 2012
Technology Total Rural Total Rural Total Rural
DSL 45.6% 0.0% 43.9% 0.0% 92.9% 76.3%
VDSL 0.3% 0.0% 0.0% 0.0% 24.9% 4.8%
FTTP 39.4% 0.0% 38.9% 0.0% 12.3% 3.0%
WiMAX 50.0% 50.0% 50.0% 50.0% 17.2% 16.2%
Standard cable 28.3% 0.0% 21.5% 0.0% 42.0% 7.3%
Docsis 3 cable 24.0% 0.0% 16.6% 0.0% 39.3% 5.8%
HSPA 85.5% 7.7% 85.5% 7.6% 96.3% 82.1%
LTE 0.2% 0.0% 0.0% 0.0% 27.0% 10.2%
Satellite 100.0% 100.0% 100.0% 100.0% 98.6% 98.6%
Standard 92.8% 53.8%
99.4% 96.1%
Standard fixed 75.2% 50.0% 75.0% 50.0% 95.5% 83.2%
NGA 51.1% 0.0% 47.2% 0.0% 53.7% 12.4%
3.26.4 Notes on data and coverage estimates
DSL:
Data provided reports only number of accesses. Number of households covered by the technology is
an estimate, not exact number.
A top down view of coverage was defined as follows
a) If inside a municipality a technical node is deployed with broadband technology, this municipality
is counted as covered;
b) If a municipality do not have an own technical node with broadband technology, it is deemed as
not covered;
c) But if such a municipality is in the reach and connection of another municipality that could serve
the not directly deployed municipality, it could be deemed as covered.
Such a top down approach lacks in the following circumstances:
Broadband Coverage in Europe 2012
Page 172 of 212
• Not all municipalities that are deployed with broadband nodes can cover the whole municipality,
• Not all municipalities that could be served by neighbourhood broadband nodes can cover all parts
of the municipality in question,
• Several of the municipalities that do not have own network nodes could be served by many other
network nodes that are not all counted due to their relevance.
The possible coverage provided shall only present a technical coverage scenario based on internal
assumptions if everything works right. Therefore the coverage values are presented as a number of
calculated households per municipalities based on the number of inhabitants EY 2011.
Technical coverage refers to the percentage of households that are able to obtain DSL services,
taking into account the technical and physical constraints in Slovak Telekom’s network.
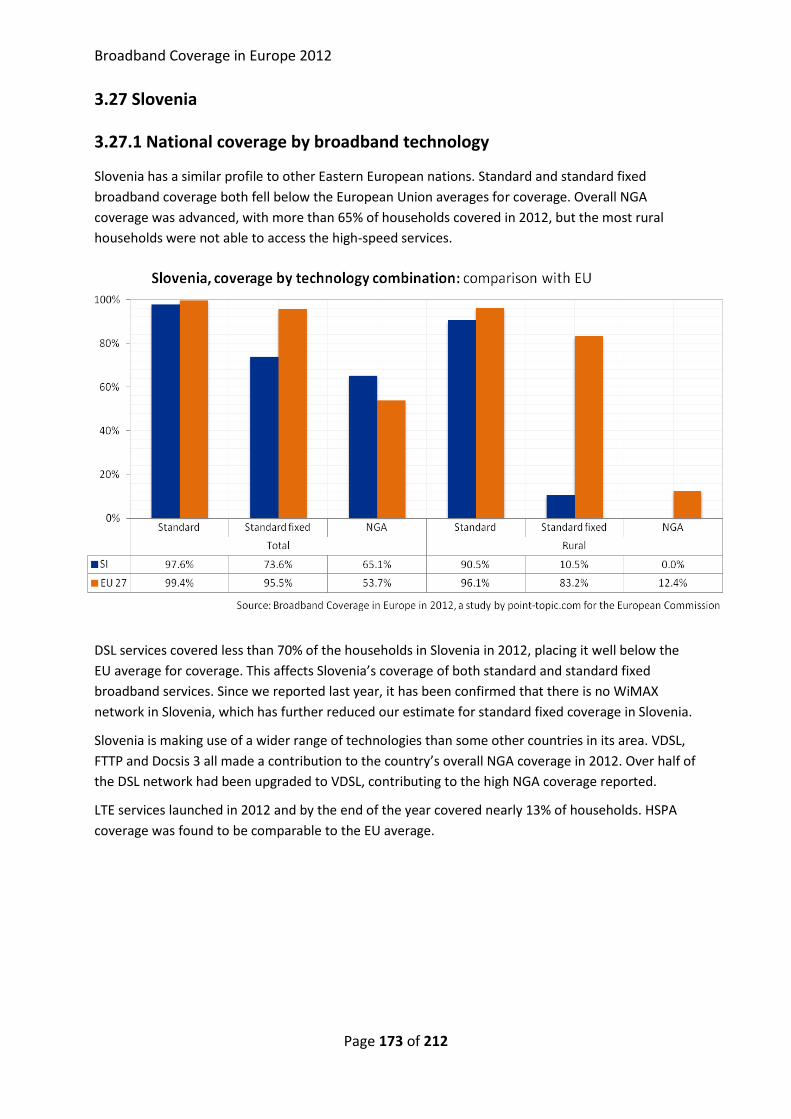
Broadband Coverage in Europe 2012
Page 173 of 212
3.27 Slovenia
3.27.1 National coverage by broadband technology
Slovenia has a similar profile to other Eastern European nations. Standard and standard fixed
broadband coverage both fell below the European Union averages for coverage. Overall NGA
coverage was advanced, with more than 65% of households covered in 2012, but the most rural
households were not able to access the high-speed services.
DSL services covered less than 70% of the households in Slovenia in 2012, placing it well below the
EU average for coverage. This affects Slovenia’s coverage of both standard and standard fixed
broadband services. Since we reported last year, it has been confirmed that there is no WiMAX
network in Slovenia, which has further reduced our estimate for standard fixed coverage in Slovenia.
Slovenia is making use of a wider range of technologies than some other countries in its area. VDSL,
FTTP and Docsis 3 all made a contribution to the country’s overall NGA coverage in 2012. Over half of
the DSL network had been upgraded to VDSL, contributing to the high NGA coverage reported.
LTE services launched in 2012 and by the end of the year covered nearly 13% of households. HSPA
coverage was found to be comparable to the EU average.
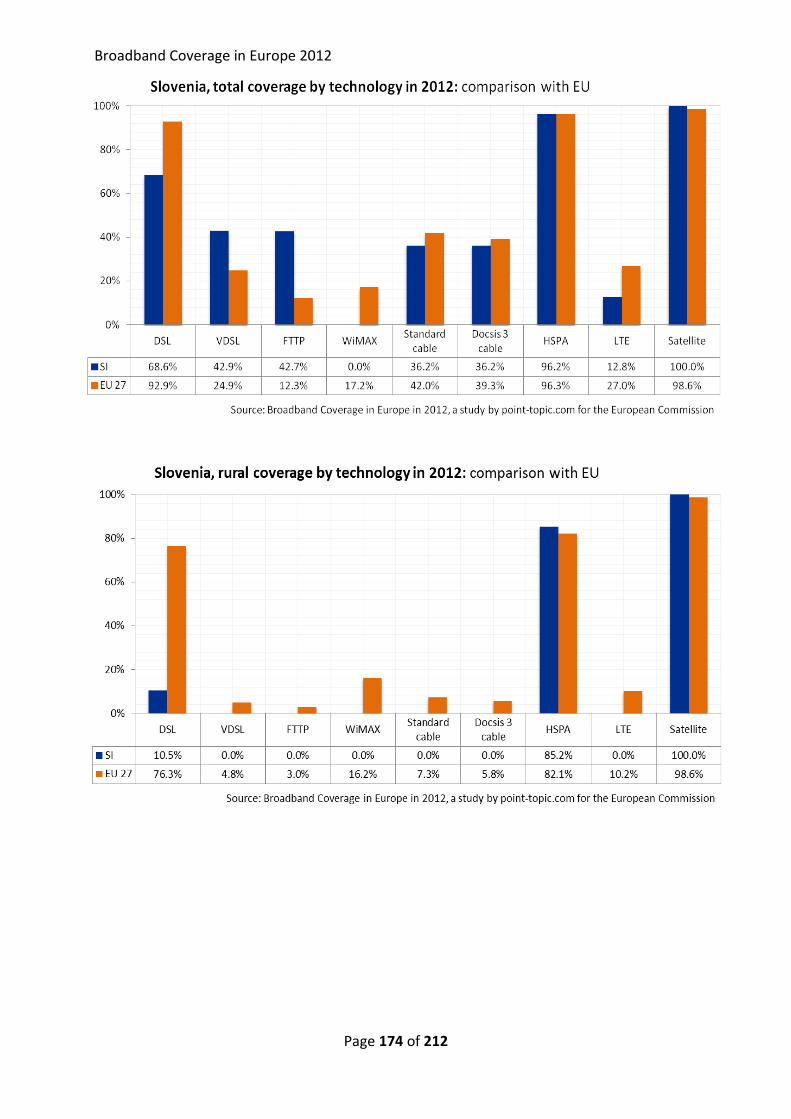
Broadband Coverage in Europe 2012
Page 174 of 212
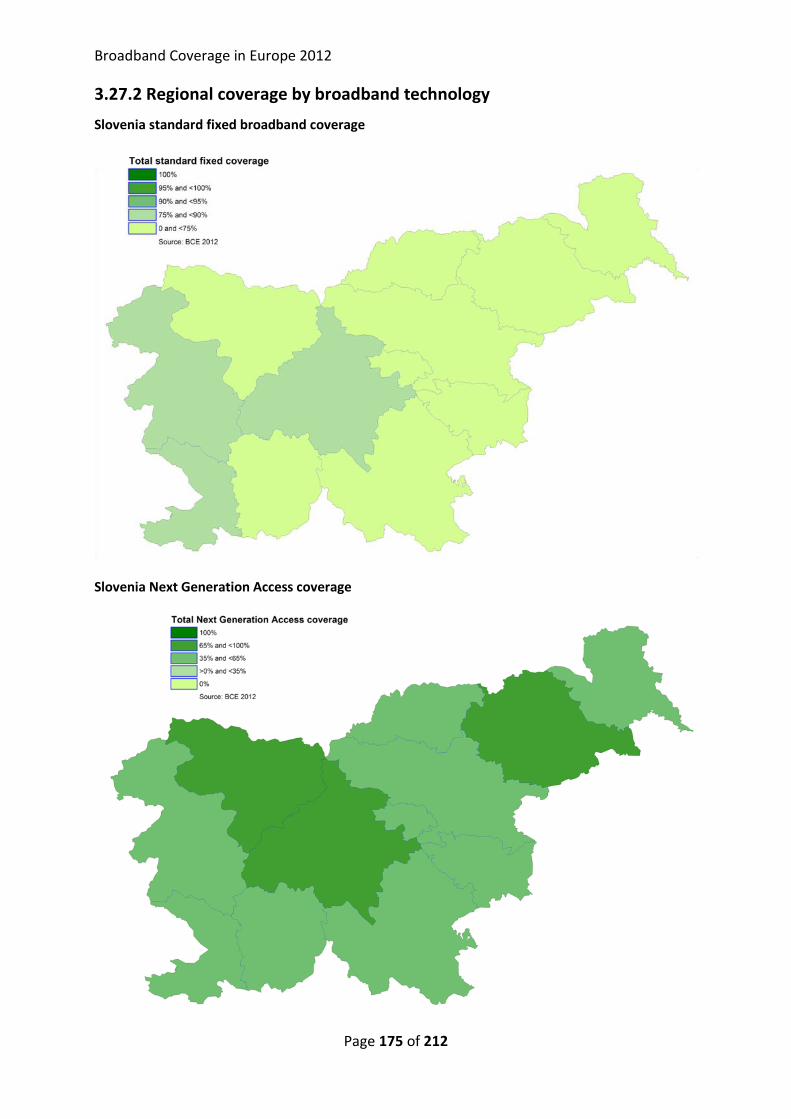
Broadband Coverage in Europe 2012
Page 175 of 212
3.27.2 Regional coverage by broadband technology
Slovenia standard fixed broadband coverage
Slovenia Next Generation Access coverage
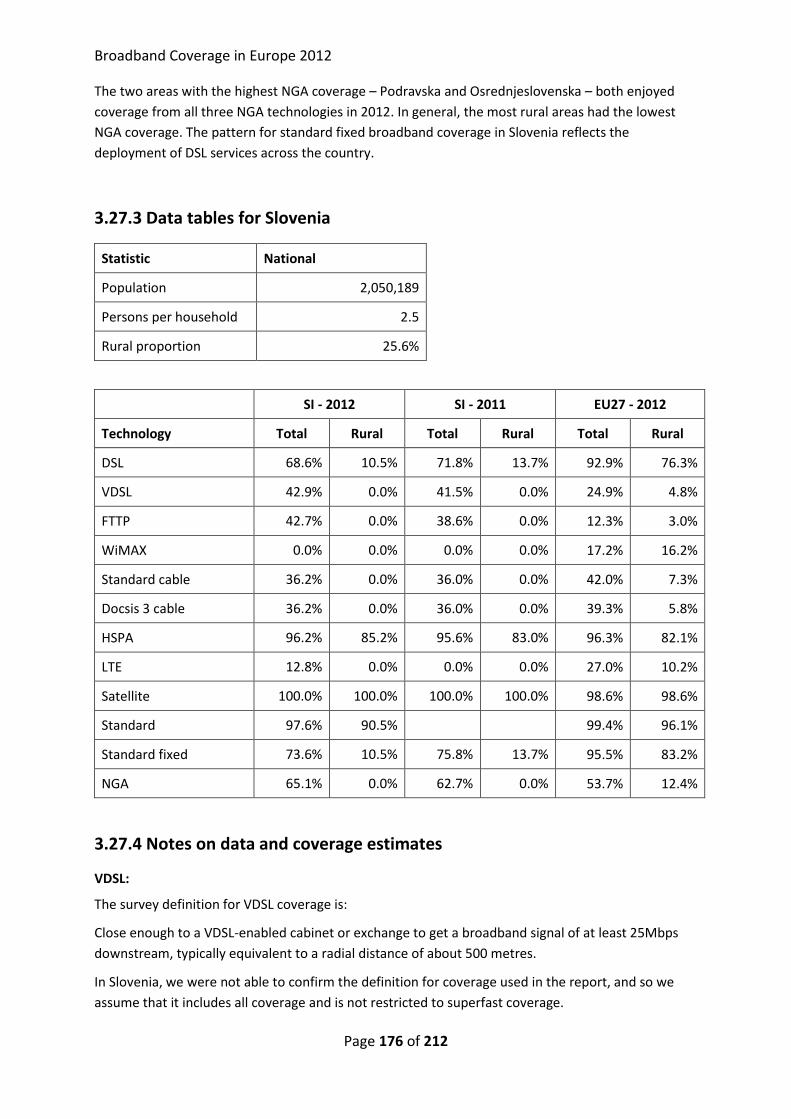
Broadband Coverage in Europe 2012
Page 176 of 212
The two areas with the highest NGA coverage – Podravska and Osrednjeslovenska – both enjoyed
coverage from all three NGA technologies in 2012. In general, the most rural areas had the lowest
NGA coverage. The pattern for standard fixed broadband coverage in Slovenia reflects the
deployment of DSL services across the country.
3.27.3 Data tables for Slovenia
Statistic National
Population 2,050,189
Persons per household 2.5
Rural proportion 25.6%
SI - 2012 SI - 2011 EU27 - 2012
Technology Total Rural Total Rural Total Rural
DSL 68.6% 10.5% 71.8% 13.7% 92.9% 76.3%
VDSL 42.9% 0.0% 41.5% 0.0% 24.9% 4.8%
FTTP 42.7% 0.0% 38.6% 0.0% 12.3% 3.0%
WiMAX 0.0% 0.0% 0.0% 0.0% 17.2% 16.2%
Standard cable 36.2% 0.0% 36.0% 0.0% 42.0% 7.3%
Docsis 3 cable 36.2% 0.0% 36.0% 0.0% 39.3% 5.8%
HSPA 96.2% 85.2% 95.6% 83.0% 96.3% 82.1%
LTE 12.8% 0.0% 0.0% 0.0% 27.0% 10.2%
Satellite 100.0% 100.0% 100.0% 100.0% 98.6% 98.6%
Standard 97.6% 90.5%
99.4% 96.1%
Standard fixed 73.6% 10.5% 75.8% 13.7% 95.5% 83.2%
NGA 65.1% 0.0% 62.7% 0.0% 53.7% 12.4%
3.27.4 Notes on data and coverage estimates
VDSL:
The survey definition for VDSL coverage is:
Close enough to a VDSL-enabled cabinet or exchange to get a broadband signal of at least 25Mbps
downstream, typically equivalent to a radial distance of about 500 metres.
In Slovenia, we were not able to confirm the definition for coverage used in the report, and so we
assume that it includes all coverage and is not restricted to superfast coverage.
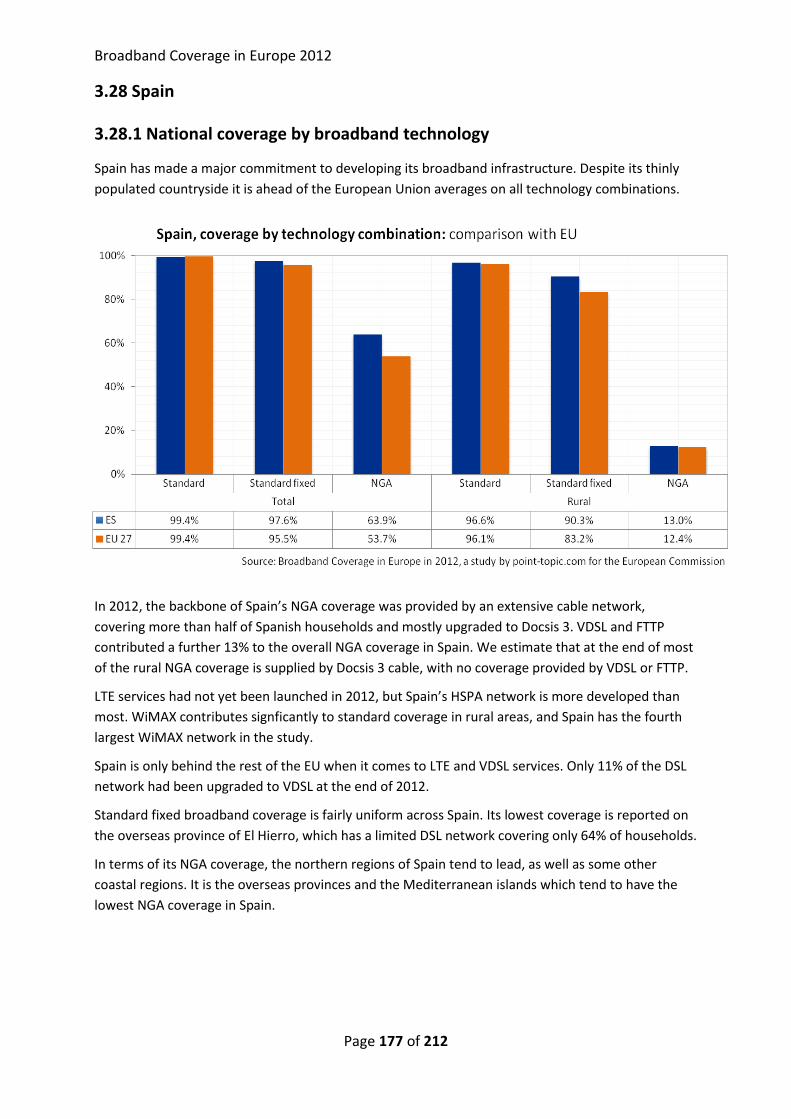
Broadband Coverage in Europe 2012
Page 177 of 212
3.28 Spain
3.28.1 National coverage by broadband technology
Spain has made a major commitment to developing its broadband infrastructure. Despite its thinly
populated countryside it is ahead of the European Union averages on all technology combinations.
In 2012, the backbone of Spain’s NGA coverage was provided by an extensive cable network,
covering more than half of Spanish households and mostly upgraded to Docsis 3. VDSL and FTTP
contributed a further 13% to the overall NGA coverage in Spain. We estimate that at the end of most
of the rural NGA coverage is supplied by Docsis 3 cable, with no coverage provided by VDSL or FTTP.
LTE services had not yet been launched in 2012, but Spain’s HSPA network is more developed than
most. WiMAX contributes signficantly to standard coverage in rural areas, and Spain has the fourth
largest WiMAX network in the study.
Spain is only behind the rest of the EU when it comes to LTE and VDSL services. Only 11% of the DSL
network had been upgraded to VDSL at the end of 2012.
Standard fixed broadband coverage is fairly uniform across Spain. Its lowest coverage is reported on
the overseas province of El Hierro, which has a limited DSL network covering only 64% of households.
In terms of its NGA coverage, the northern regions of Spain tend to lead, as well as some other
coastal regions. It is the overseas provinces and the Mediterranean islands which tend to have the
lowest NGA coverage in Spain.
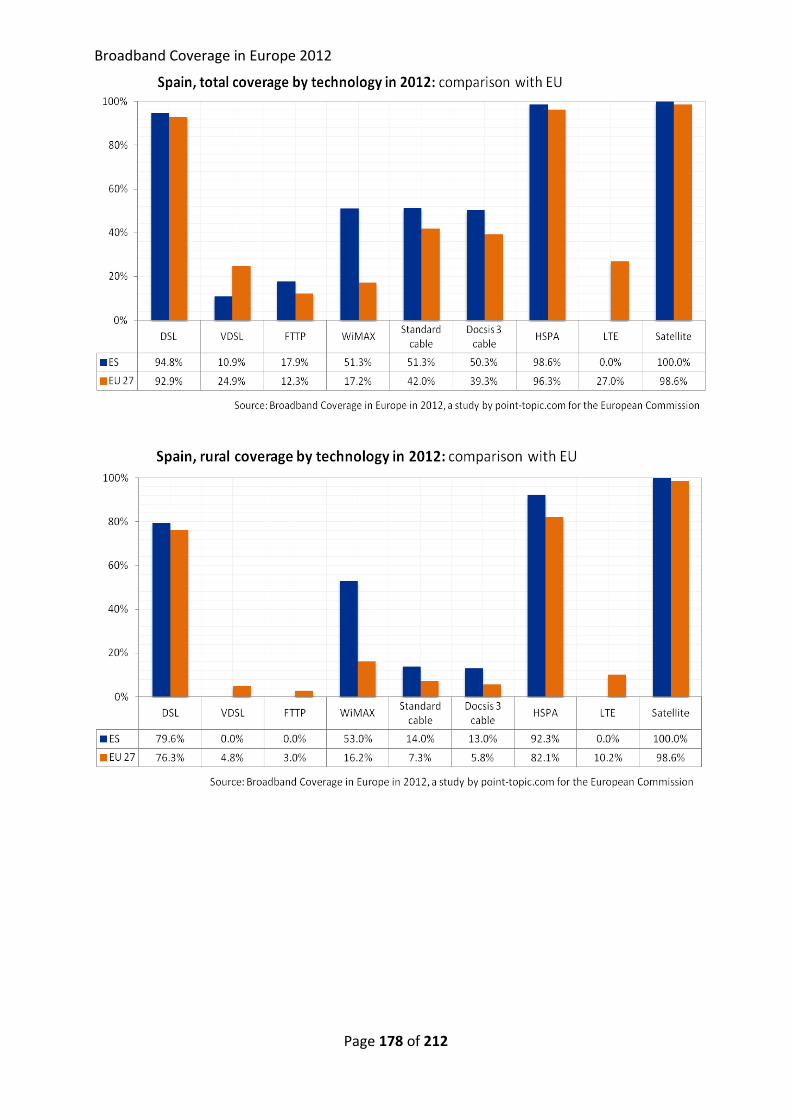
Broadband Coverage in Europe 2012
Page 178 of 212
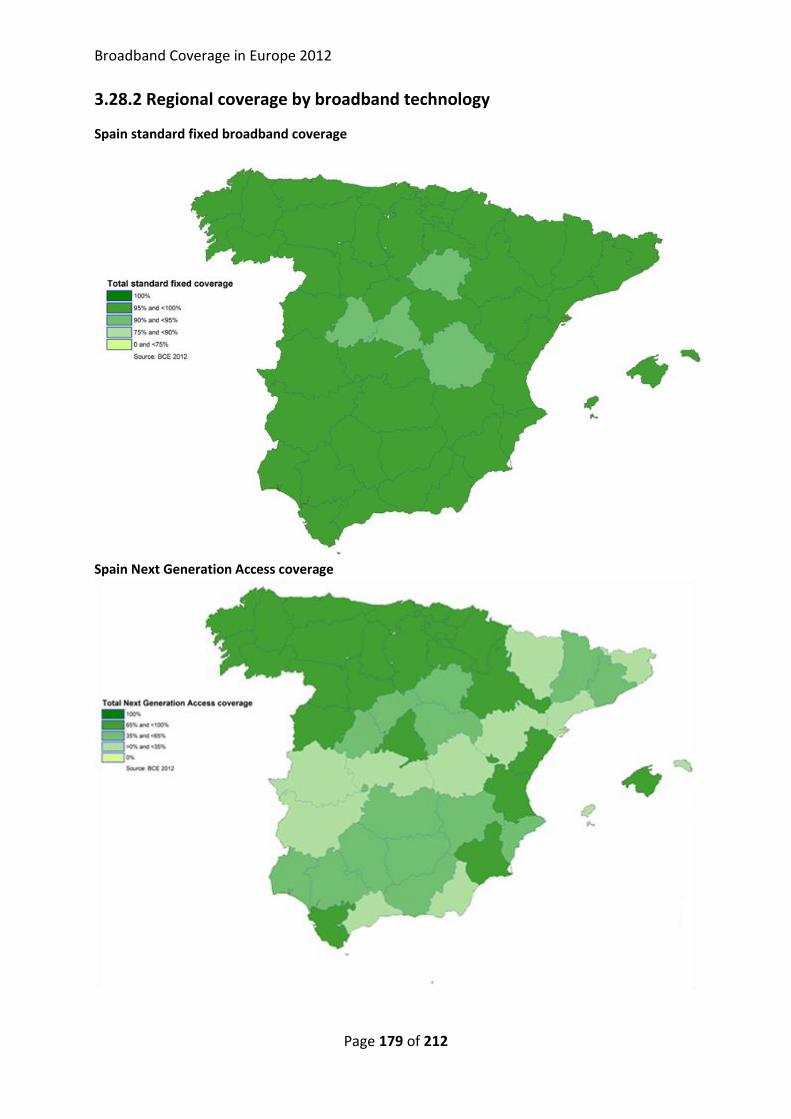
Broadband Coverage in Europe 2012
Page 179 of 212
3.28.2 Regional coverage by broadband technology
Spain standard fixed broadband coverage
Spain Next Generation Access coverage
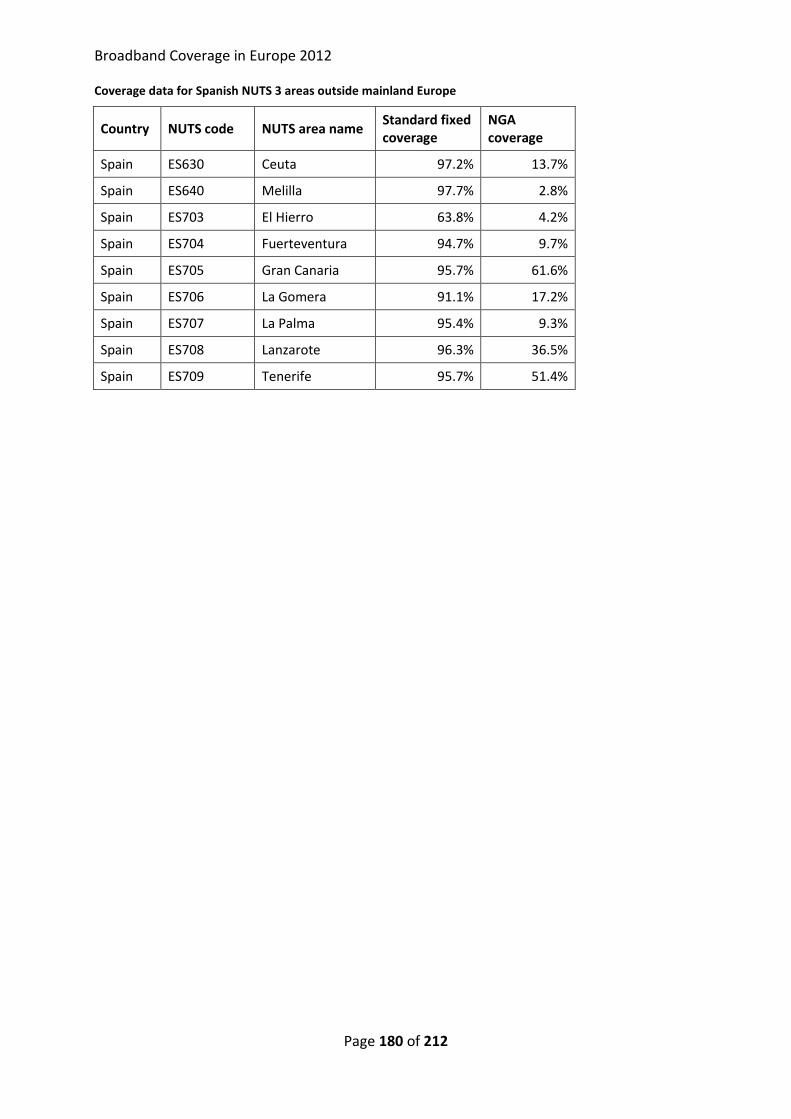
Broadband Coverage in Europe 2012
Page 180 of 212
Coverage data for Spanish NUTS 3 areas outside mainland Europe
Country NUTS code NUTS area name Standard fixed coverage
NGA coverage
Spain ES630 Ceuta 97.2% 13.7%
Spain ES640 Melilla 97.7% 2.8%
Spain ES703 El Hierro 63.8% 4.2%
Spain ES704 Fuerteventura 94.7% 9.7%
Spain ES705 Gran Canaria 95.7% 61.6%
Spain ES706 La Gomera 91.1% 17.2%
Spain ES707 La Palma 95.4% 9.3%
Spain ES708 Lanzarote 96.3% 36.5%
Spain ES709 Tenerife 95.7% 51.4%

Broadband Coverage in Europe 2012
Page 181 of 212
3.28.3 Data tables for Spain
Statistic National
Population 47,021,031
Persons per household 2.7
Rural proportion 17.7%
ES - 2012 ES - 2011 EU27 - 2012
Technology Total Rural Total Rural Total Rural
DSL 94.8% 79.6% 93.3% 68.9% 92.9% 76.3%
VDSL 10.9% 0.0% 10.9% 0.0% 24.9% 4.8%
FTTP 17.9% 0.0% 9.7% 0.0% 12.3% 3.0%
WiMAX 51.3% 53.0% 47.6% 49.1% 17.2% 16.2%
Standard cable 51.3% 14.0% 46.9% 7.5% 42.0% 7.3%
Docsis 3 cable 50.3% 13.0% 46.0% 6.6% 39.3% 5.8%
HSPA 98.6% 92.3% 97.1% 83.8% 96.3% 82.1%
LTE 0.0% 0.0% 0.0% 0.0% 27.0% 10.2%
Satellite 100.0% 100.0% 100.0% 100.0% 98.6% 98.6%
Standard 99.4% 96.6%
99.4% 96.1%
Standard fixed 97.6% 90.3% 96.4% 84.1% 95.5% 83.2%
NGA 63.9% 13.0% 56.0% 6.6% 53.7% 12.4%
3.28.4 Notes on data and coverage estimates:
Cable and FTTH
To calculate households passed from the data reported by the FTTH and HFC operators a conversion
factor was applied.
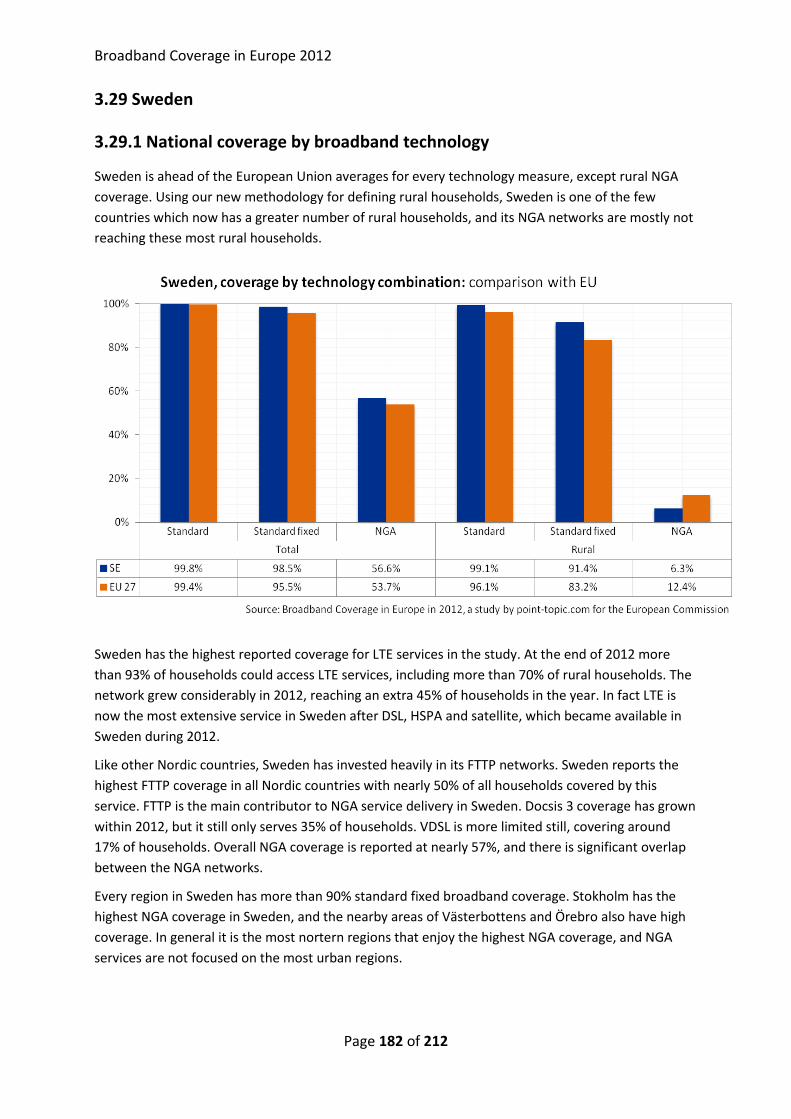
Broadband Coverage in Europe 2012
Page 182 of 212
3.29 Sweden
3.29.1 National coverage by broadband technology
Sweden is ahead of the European Union averages for every technology measure, except rural NGA
coverage. Using our new methodology for defining rural households, Sweden is one of the few
countries which now has a greater number of rural households, and its NGA networks are mostly not
reaching these most rural households.
Sweden has the highest reported coverage for LTE services in the study. At the end of 2012 more
than 93% of households could access LTE services, including more than 70% of rural households. The
network grew considerably in 2012, reaching an extra 45% of households in the year. In fact LTE is
now the most extensive service in Sweden after DSL, HSPA and satellite, which became available in
Sweden during 2012.
Like other Nordic countries, Sweden has invested heavily in its FTTP networks. Sweden reports the
highest FTTP coverage in all Nordic countries with nearly 50% of all households covered by this
service. FTTP is the main contributor to NGA service delivery in Sweden. Docsis 3 coverage has grown
within 2012, but it still only serves 35% of households. VDSL is more limited still, covering around
17% of households. Overall NGA coverage is reported at nearly 57%, and there is significant overlap
between the NGA networks.
Every region in Sweden has more than 90% standard fixed broadband coverage. Stokholm has the
highest NGA coverage in Sweden, and the nearby areas of Västerbottens and Örebro also have high
coverage. In general it is the most nortern regions that enjoy the highest NGA coverage, and NGA
services are not focused on the most urban regions.
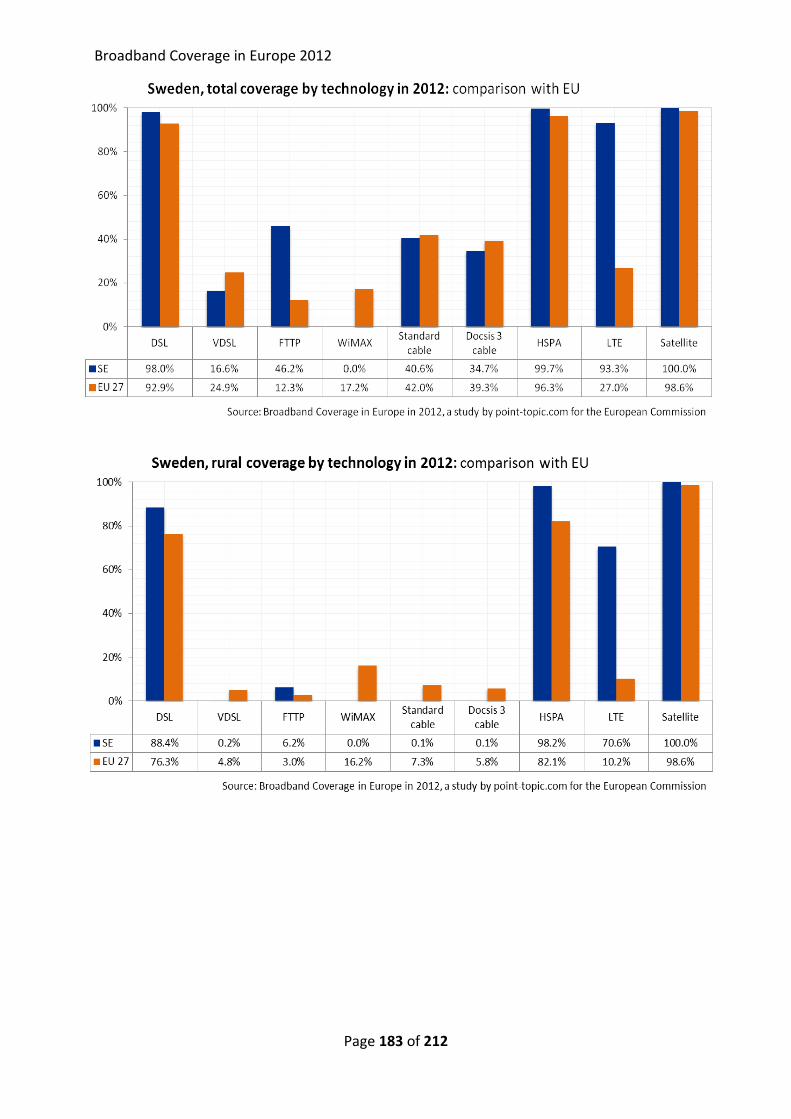
Broadband Coverage in Europe 2012
Page 183 of 212
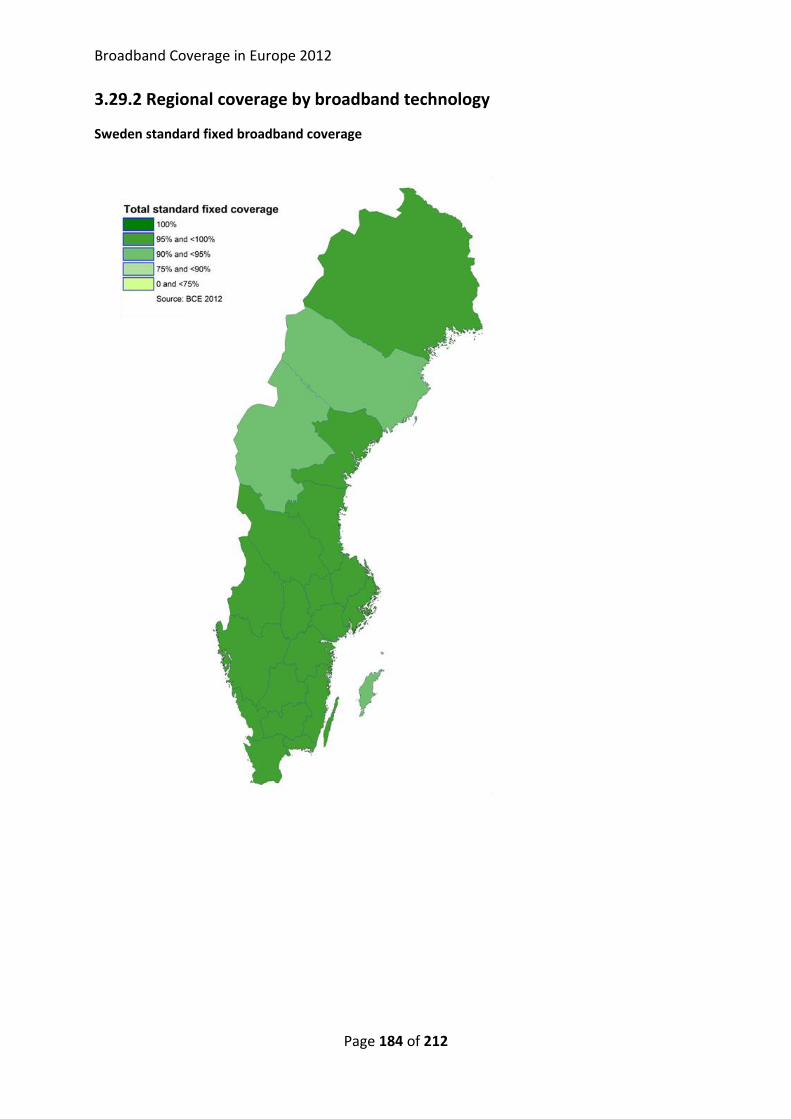
Broadband Coverage in Europe 2012
Page 184 of 212
3.29.2 Regional coverage by broadband technology
Sweden standard fixed broadband coverage

Broadband Coverage in Europe 2012
Page 185 of 212
Sweden Next Generation Access coverage
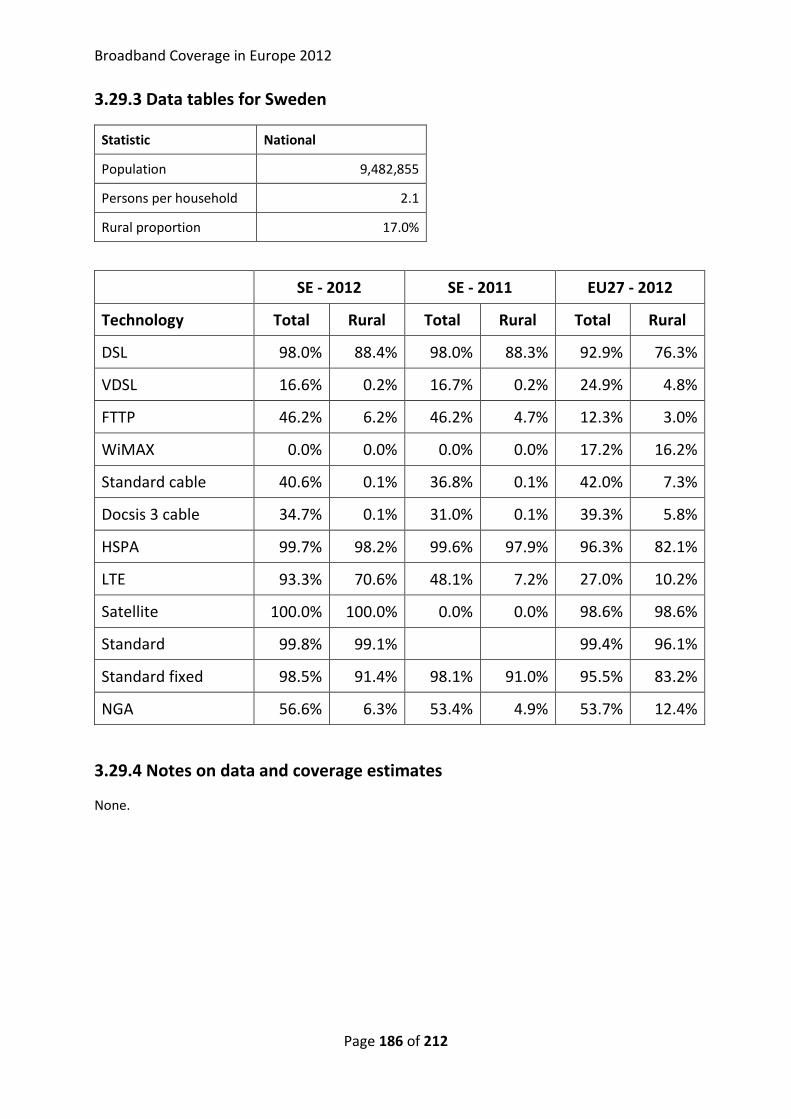
Broadband Coverage in Europe 2012
Page 186 of 212
3.29.3 Data tables for Sweden
Statistic National
Population 9,482,855
Persons per household 2.1
Rural proportion 17.0%
SE - 2012 SE - 2011 EU27 - 2012
Technology Total Rural Total Rural Total Rural
DSL 98.0% 88.4% 98.0% 88.3% 92.9% 76.3%
VDSL 16.6% 0.2% 16.7% 0.2% 24.9% 4.8%
FTTP 46.2% 6.2% 46.2% 4.7% 12.3% 3.0%
WiMAX 0.0% 0.0% 0.0% 0.0% 17.2% 16.2%
Standard cable 40.6% 0.1% 36.8% 0.1% 42.0% 7.3%
Docsis 3 cable 34.7% 0.1% 31.0% 0.1% 39.3% 5.8%
HSPA 99.7% 98.2% 99.6% 97.9% 96.3% 82.1%
LTE 93.3% 70.6% 48.1% 7.2% 27.0% 10.2%
Satellite 100.0% 100.0% 0.0% 0.0% 98.6% 98.6%
Standard 99.8% 99.1%
99.4% 96.1%
Standard fixed 98.5% 91.4% 98.1% 91.0% 95.5% 83.2%
NGA 56.6% 6.3% 53.4% 4.9% 53.7% 12.4%
3.29.4 Notes on data and coverage estimates
None.
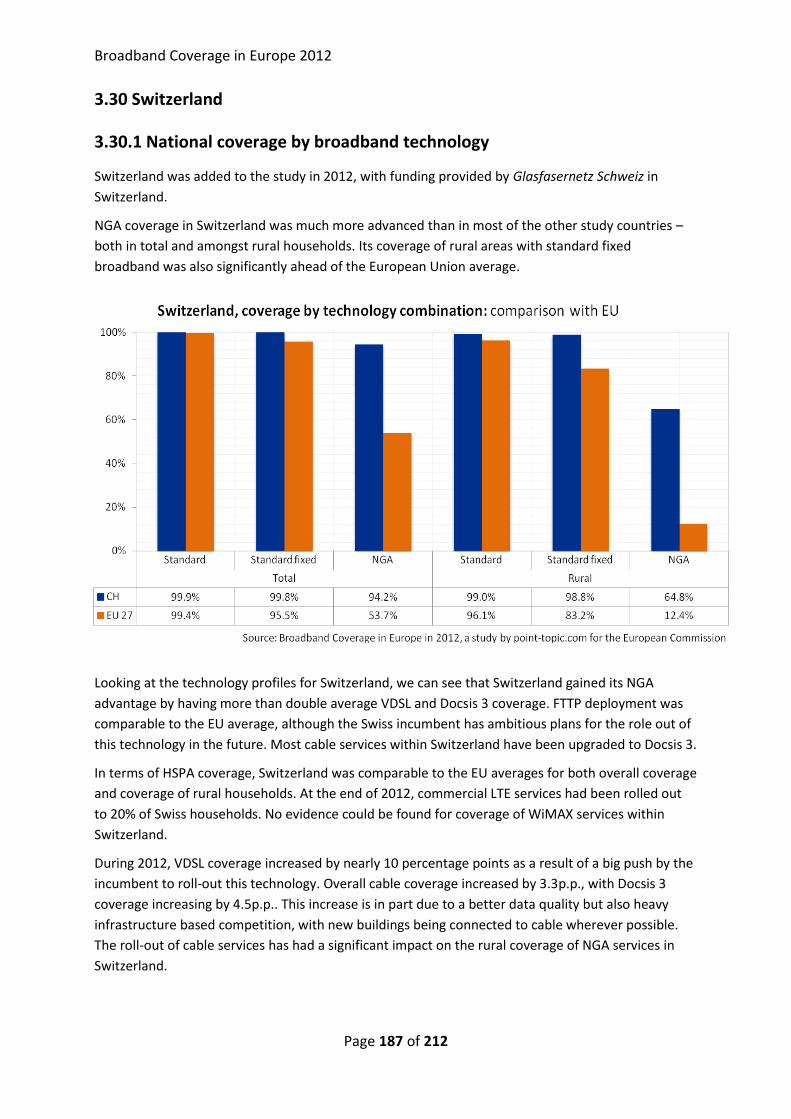
Broadband Coverage in Europe 2012
Page 187 of 212
3.30 Switzerland
3.30.1 National coverage by broadband technology
Switzerland was added to the study in 2012, with funding provided by Glasfasernetz Schweiz in
Switzerland.
NGA coverage in Switzerland was much more advanced than in most of the other study countries –
both in total and amongst rural households. Its coverage of rural areas with standard fixed
broadband was also significantly ahead of the European Union average.
Looking at the technology profiles for Switzerland, we can see that Switzerland gained its NGA
advantage by having more than double average VDSL and Docsis 3 coverage. FTTP deployment was
comparable to the EU average, although the Swiss incumbent has ambitious plans for the role out of
this technology in the future. Most cable services within Switzerland have been upgraded to Docsis 3.
In terms of HSPA coverage, Switzerland was comparable to the EU averages for both overall coverage
and coverage of rural households. At the end of 2012, commercial LTE services had been rolled out
to 20% of Swiss households. No evidence could be found for coverage of WiMAX services within
Switzerland.
During 2012, VDSL coverage increased by nearly 10 percentage points as a result of a big push by the
incumbent to roll-out this technology. Overall cable coverage increased by 3.3p.p., with Docsis 3
coverage increasing by 4.5p.p.. This increase is in part due to a better data quality but also heavy
infrastructure based competition, with new buildings being connected to cable wherever possible.
The roll-out of cable services has had a significant impact on the rural coverage of NGA services in
Switzerland.
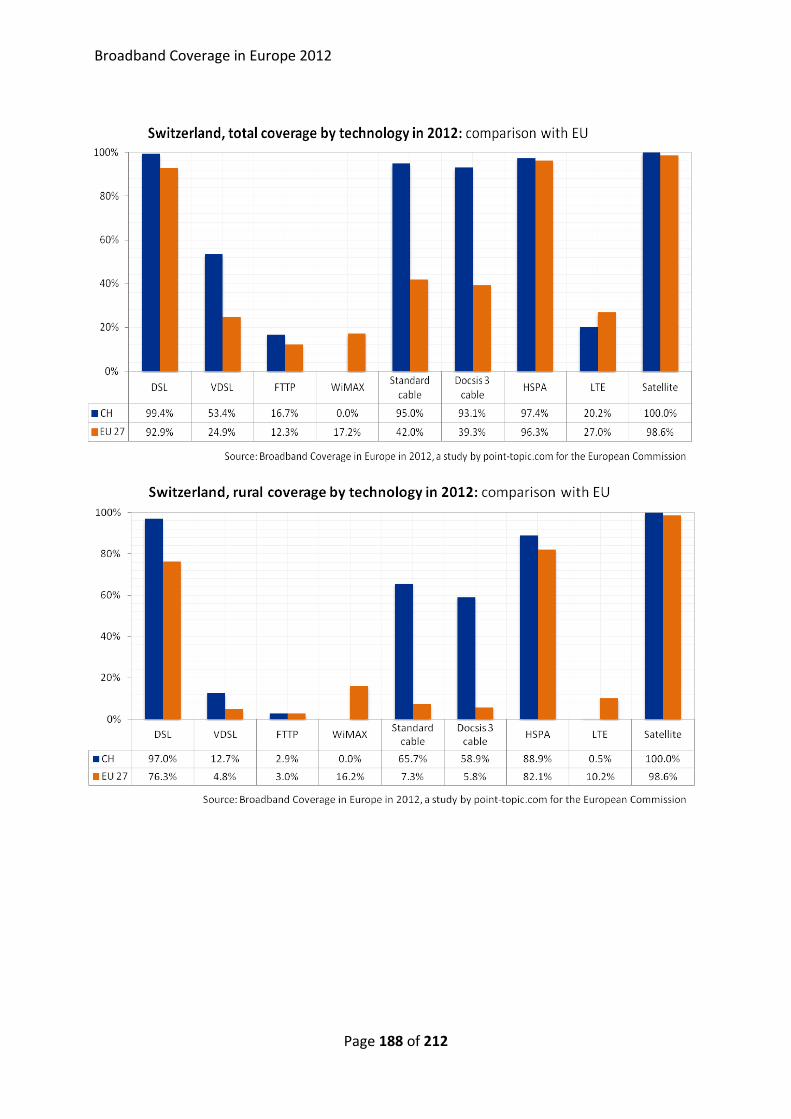
Broadband Coverage in Europe 2012
Page 188 of 212
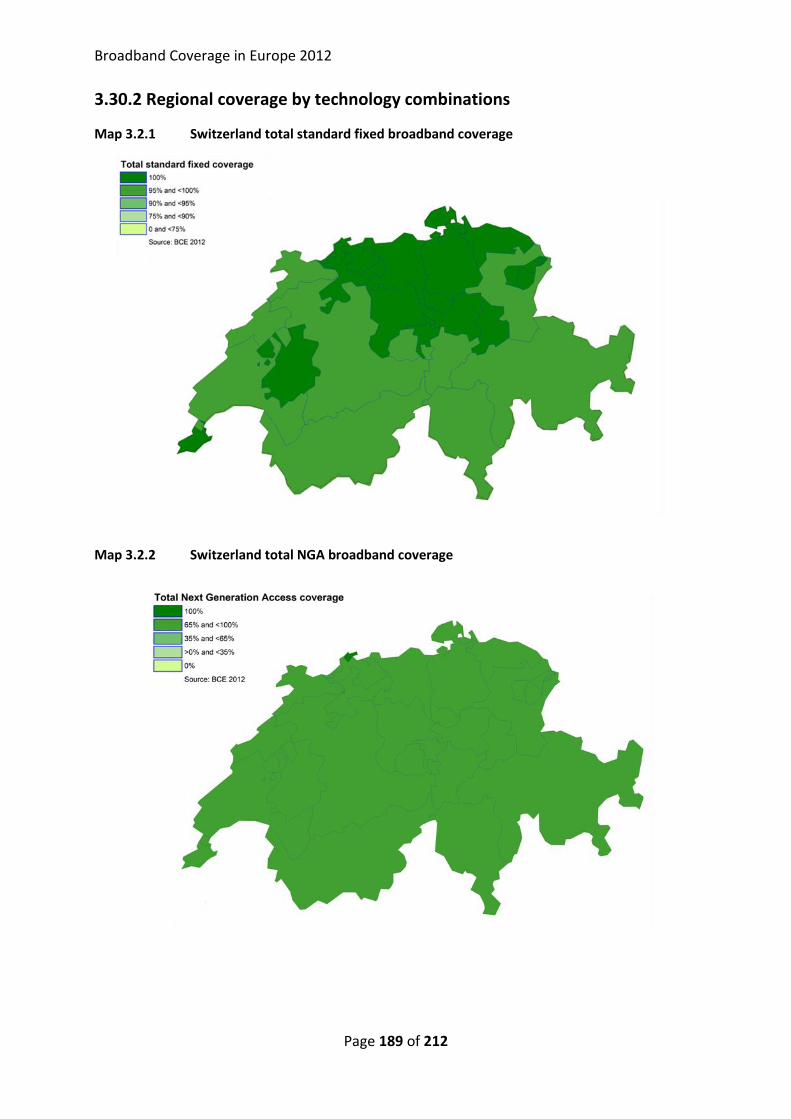
Broadband Coverage in Europe 2012
Page 189 of 212
3.30.2 Regional coverage by technology combinations
Map 3.2.1 Switzerland total standard fixed broadband coverage
Map 3.2.2 Switzerland total NGA broadband coverage
Broadband Coverage in Europe 2012
Page 190 of 212
Coverage of both standard and NGA broadband is fairly consistent across the cantons of Switzerland.
In terms of standard broadband coverage, every canton in Switzerland had over 98% standard
broadband coverage. Only one canton – Basel-Stadt – had 100% coverage of both standard and cable
services. Every canton in Switzerland had NGA coverage greater than 75%.
3.30.3 Data tables for Switzerland
Statistic National
Population 8,040,281
Persons per household 2.2
Rural proportion 14.6%
CH - 2012 CH - 2011 EU27 - 2012
Technology Total Rural Total Rural Total Rural
DSL 99.4% 97.0% 99.4% 96.6% 92.9% 76.3%
VDSL 53.4% 12.7% 43.6% 6.9% 24.9% 4.8%
FTTP 16.7% 2.9% 12.2% 0.0% 12.3% 3.0%
WiMAX 0.0% 0.0% 0.0% 0.0% 17.2% 16.2%
Standard cable 95.0% 65.7% 91.7% 64.4% 42.0% 7.3%
Docsis 3 cable 93.1% 58.9% 88.6% 55.6% 39.3% 5.8%
HSPA 97.4% 88.9% 97.4% 88.9% 96.3% 82.1%
LTE 20.2% 0.5% 0.0% 0.0% 27.0% 10.2%
Satellite 100.0% 100.0% 100.0% 100.0% 98.6% 98.6%
Standard 99.9% 99.0% 99.7% 98.5% 99.4% 96.1%
Standard fixed 99.8% 98.8% 99.7% 98.3% 95.5% 83.2%
NGA 94.2% 64.8% 92.7% 41.2% 53.7% 12.4%
3.30.4 Notes on data and coverage estimates:
None.
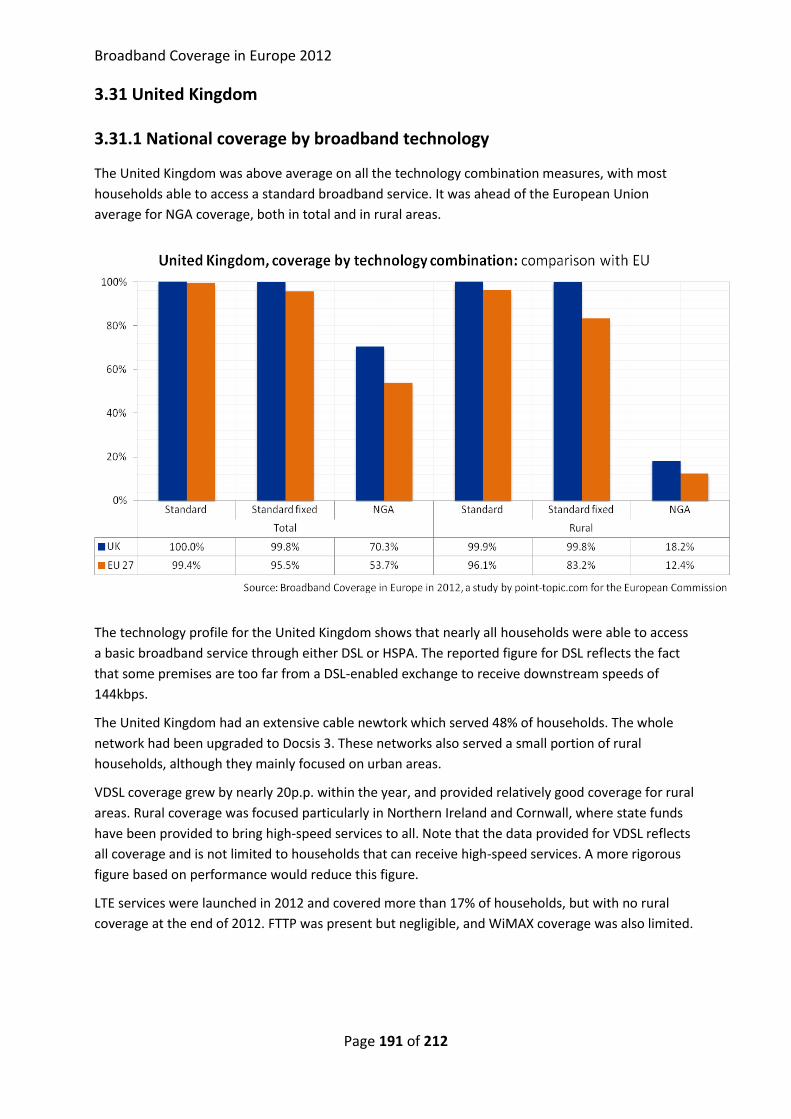
Broadband Coverage in Europe 2012
Page 191 of 212
3.31 United Kingdom
3.31.1 National coverage by broadband technology
The United Kingdom was above average on all the technology combination measures, with most
households able to access a standard broadband service. It was ahead of the European Union
average for NGA coverage, both in total and in rural areas.
The technology profile for the United Kingdom shows that nearly all households were able to access
a basic broadband service through either DSL or HSPA. The reported figure for DSL reflects the fact
that some premises are too far from a DSL-enabled exchange to receive downstream speeds of
144kbps.
The United Kingdom had an extensive cable newtork which served 48% of households. The whole
network had been upgraded to Docsis 3. These networks also served a small portion of rural
households, although they mainly focused on urban areas.
VDSL coverage grew by nearly 20p.p. within the year, and provided relatively good coverage for rural
areas. Rural coverage was focused particularly in Northern Ireland and Cornwall, where state funds
have been provided to bring high-speed services to all. Note that the data provided for VDSL reflects
all coverage and is not limited to households that can receive high-speed services. A more rigorous
figure based on performance would reduce this figure.
LTE services were launched in 2012 and covered more than 17% of households, but with no rural
coverage at the end of 2012. FTTP was present but negligible, and WiMAX coverage was also limited.
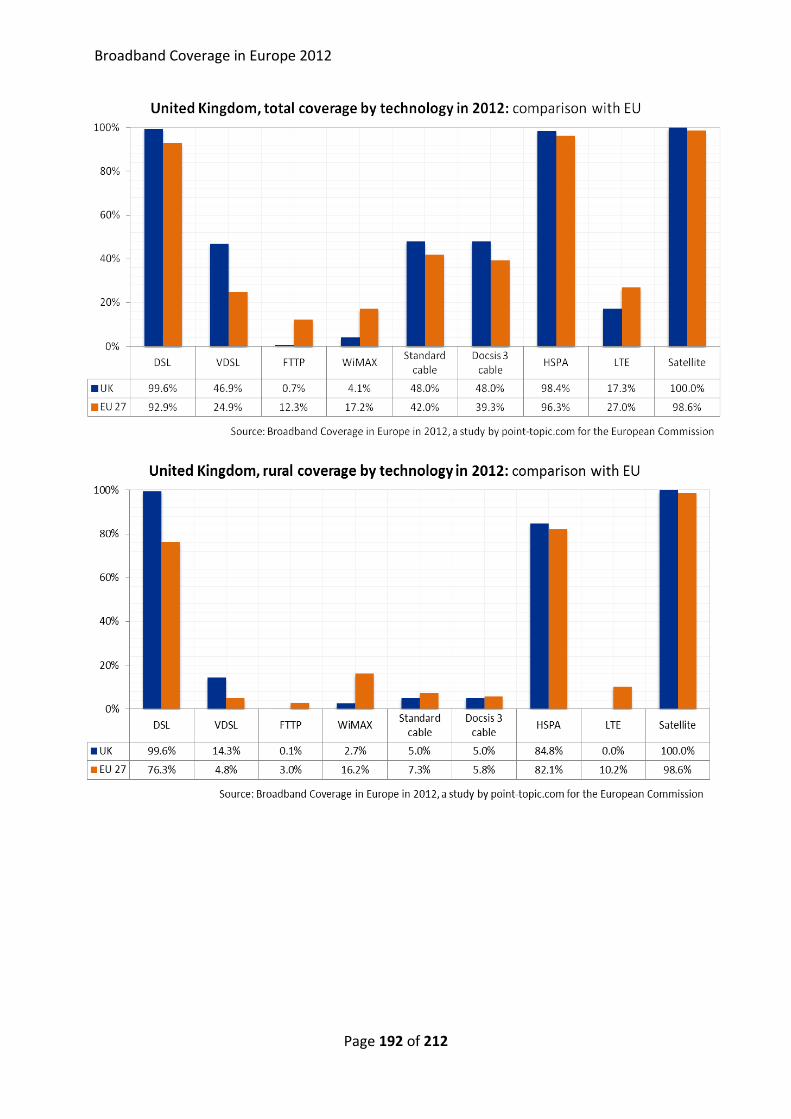
Broadband Coverage in Europe 2012
Page 192 of 212
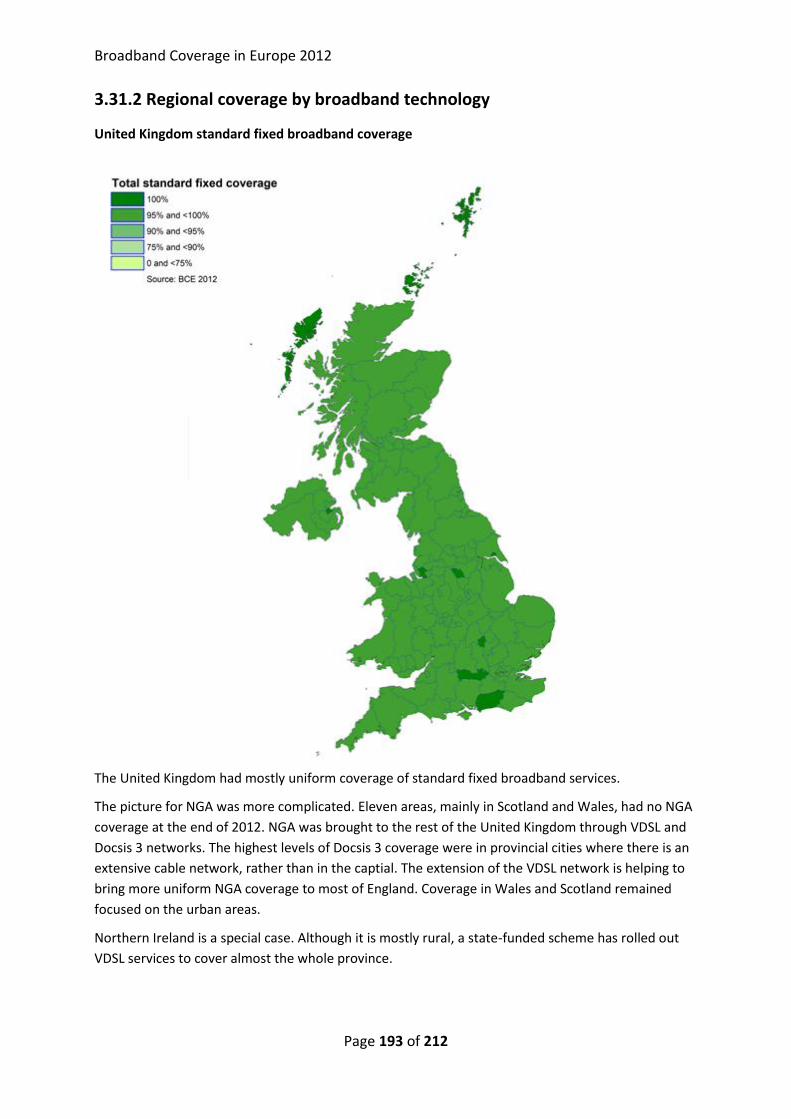
Broadband Coverage in Europe 2012
Page 193 of 212
3.31.2 Regional coverage by broadband technology
United Kingdom standard fixed broadband coverage
The United Kingdom had mostly uniform coverage of standard fixed broadband services.
The picture for NGA was more complicated. Eleven areas, mainly in Scotland and Wales, had no NGA
coverage at the end of 2012. NGA was brought to the rest of the United Kingdom through VDSL and
Docsis 3 networks. The highest levels of Docsis 3 coverage were in provincial cities where there is an
extensive cable network, rather than in the captial. The extension of the VDSL network is helping to
bring more uniform NGA coverage to most of England. Coverage in Wales and Scotland remained
focused on the urban areas.
Northern Ireland is a special case. Although it is mostly rural, a state-funded scheme has rolled out
VDSL services to cover almost the whole province.

Broadband Coverage in Europe 2012
Page 194 of 212
United Kingdom Next Generation Access coverage
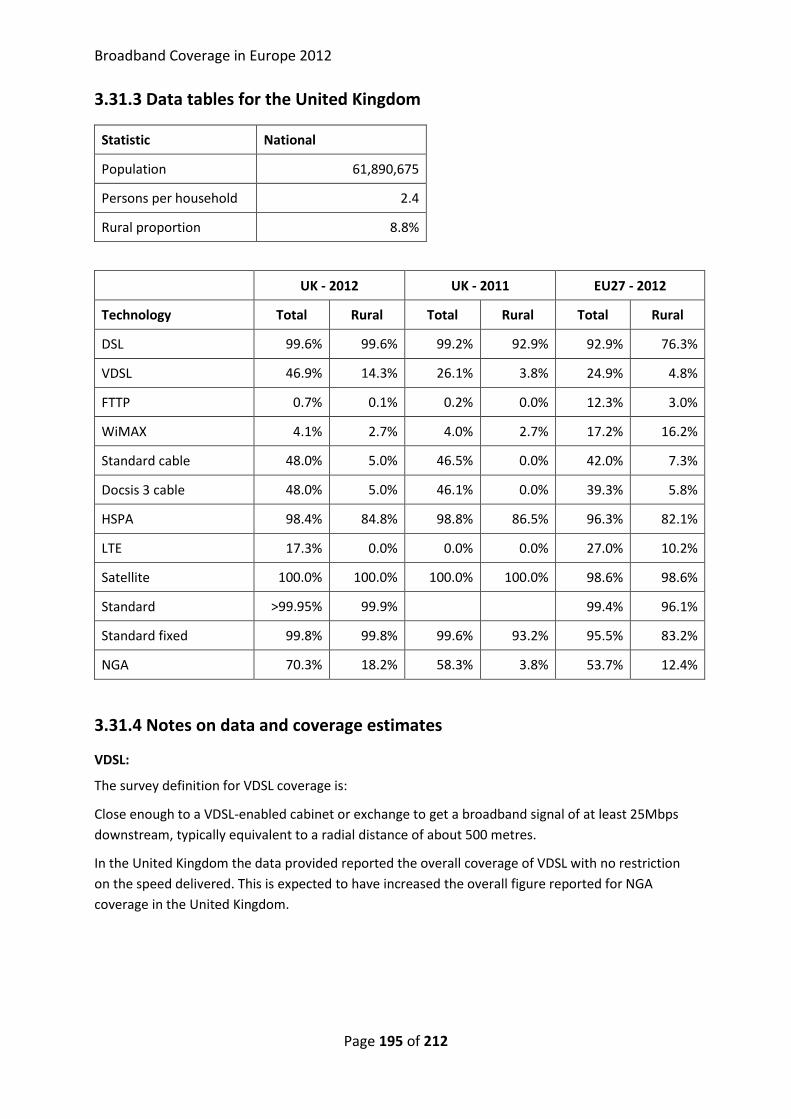
Broadband Coverage in Europe 2012
Page 195 of 212
3.31.3 Data tables for the United Kingdom
Statistic National
Population 61,890,675
Persons per household 2.4
Rural proportion 8.8%
UK - 2012 UK - 2011 EU27 - 2012
Technology Total Rural Total Rural Total Rural
DSL 99.6% 99.6% 99.2% 92.9% 92.9% 76.3%
VDSL 46.9% 14.3% 26.1% 3.8% 24.9% 4.8%
FTTP 0.7% 0.1% 0.2% 0.0% 12.3% 3.0%
WiMAX 4.1% 2.7% 4.0% 2.7% 17.2% 16.2%
Standard cable 48.0% 5.0% 46.5% 0.0% 42.0% 7.3%
Docsis 3 cable 48.0% 5.0% 46.1% 0.0% 39.3% 5.8%
HSPA 98.4% 84.8% 98.8% 86.5% 96.3% 82.1%
LTE 17.3% 0.0% 0.0% 0.0% 27.0% 10.2%
Satellite 100.0% 100.0% 100.0% 100.0% 98.6% 98.6%
Standard >99.95% 99.9%
99.4% 96.1%
Standard fixed 99.8% 99.8% 99.6% 93.2% 95.5% 83.2%
NGA 70.3% 18.2% 58.3% 3.8% 53.7% 12.4%
3.31.4 Notes on data and coverage estimates
VDSL:
The survey definition for VDSL coverage is:
Close enough to a VDSL-enabled cabinet or exchange to get a broadband signal of at least 25Mbps
downstream, typically equivalent to a radial distance of about 500 metres.
In the United Kingdom the data provided reported the overall coverage of VDSL with no restriction
on the speed delivered. This is expected to have increased the overall figure reported for NGA
coverage in the United Kingdom.
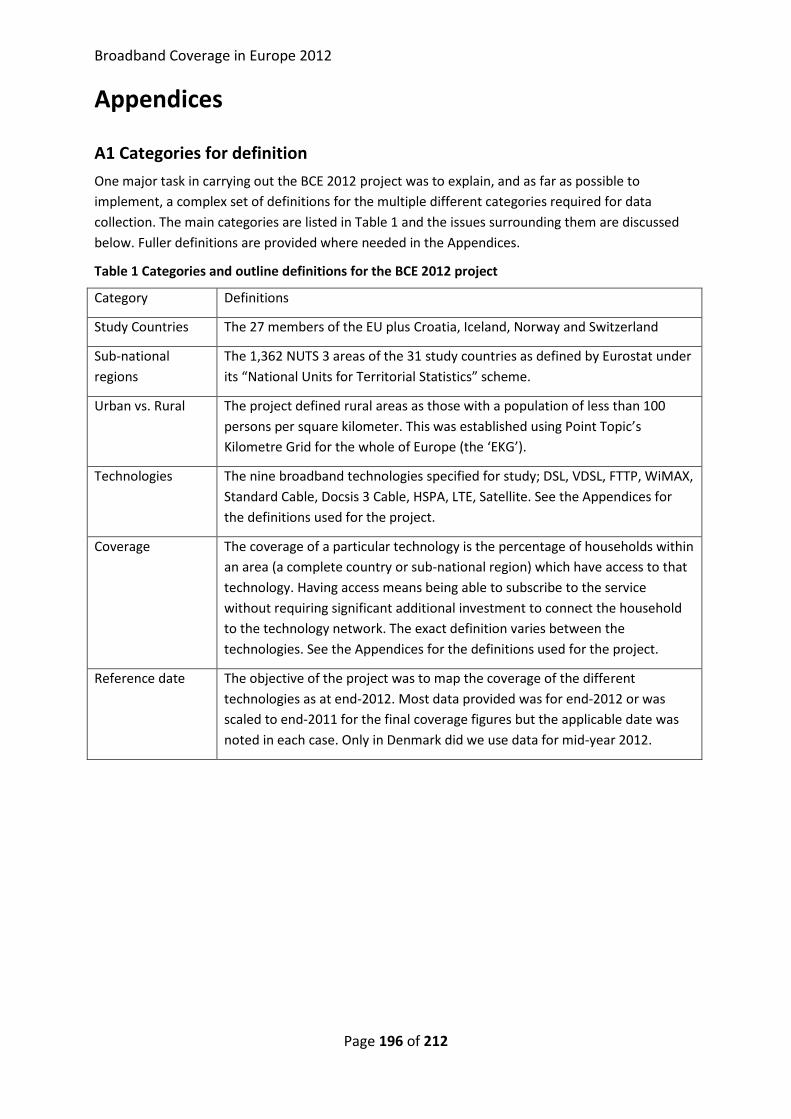
Broadband Coverage in Europe 2012
Page 196 of 212
Appendices
A1 Categories for definition
One major task in carrying out the BCE 2012 project was to explain, and as far as possible to
implement, a complex set of definitions for the multiple different categories required for data
collection. The main categories are listed in Table 1 and the issues surrounding them are discussed
below. Fuller definitions are provided where needed in the Appendices.
Table 1 Categories and outline definitions for the BCE 2012 project
Category Definitions
Study Countries The 27 members of the EU plus Croatia, Iceland, Norway and Switzerland
Sub-national
regions
The 1,362 NUTS 3 areas of the 31 study countries as defined by Eurostat under
its “National Units for Territorial Statistics” scheme.
Urban vs. Rural The project defined rural areas as those with a population of less than 100
persons per square kilometer. This was established using Point Topic’s
Kilometre Grid for the whole of Europe (the ‘EKG’).
Technologies The nine broadband technologies specified for study; DSL, VDSL, FTTP, WiMAX,
Standard Cable, Docsis 3 Cable, HSPA, LTE, Satellite. See the Appendices for
the definitions used for the project.
Coverage The coverage of a particular technology is the percentage of households within
an area (a complete country or sub-national region) which have access to that
technology. Having access means being able to subscribe to the service
without requiring significant additional investment to connect the household
to the technology network. The exact definition varies between the
technologies. See the Appendices for the definitions used for the project.
Reference date The objective of the project was to map the coverage of the different
technologies as at end-2012. Most data provided was for end-2012 or was
scaled to end-2011 for the final coverage figures but the applicable date was
noted in each case. Only in Denmark did we use data for mid-year 2012.
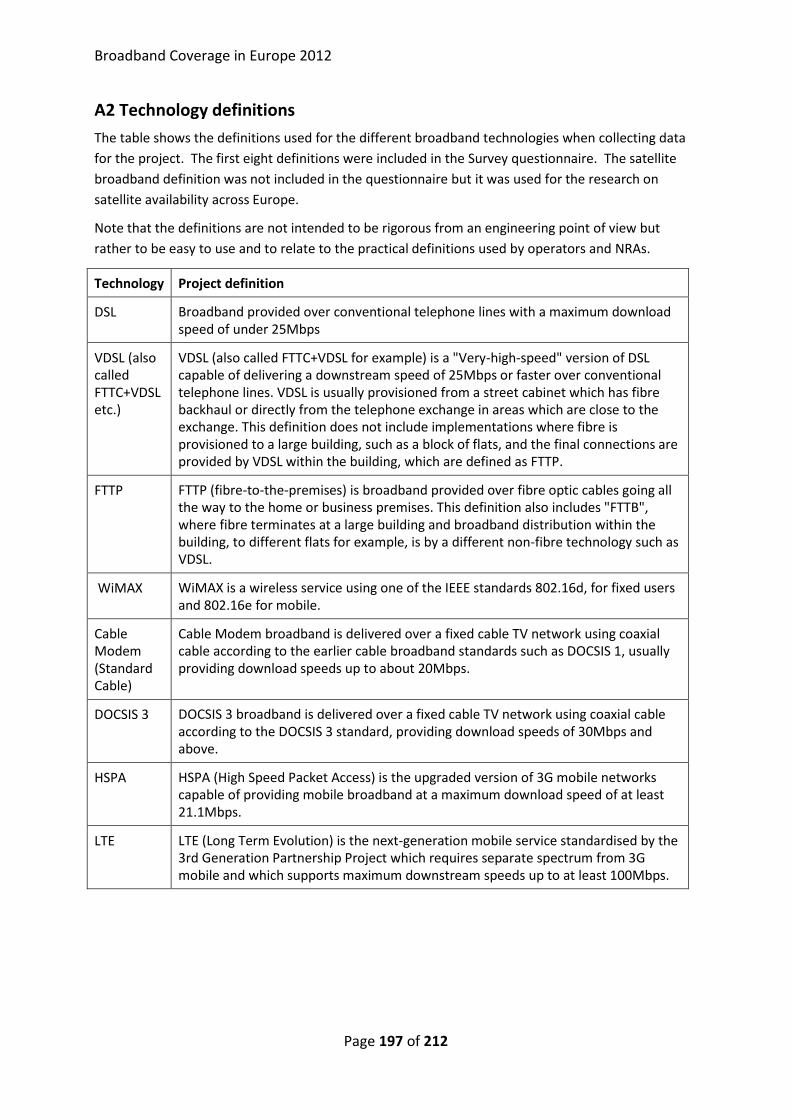
Broadband Coverage in Europe 2012
Page 197 of 212
A2 Technology definitions
The table shows the definitions used for the different broadband technologies when collecting data
for the project. The first eight definitions were included in the Survey questionnaire. The satellite
broadband definition was not included in the questionnaire but it was used for the research on
satellite availability across Europe.
Note that the definitions are not intended to be rigorous from an engineering point of view but
rather to be easy to use and to relate to the practical definitions used by operators and NRAs.
Technology Project definition
DSL Broadband provided over conventional telephone lines with a maximum download speed of under 25Mbps
VDSL (also called FTTC+VDSL etc.)
VDSL (also called FTTC+VDSL for example) is a "Very-high-speed" version of DSL capable of delivering a downstream speed of 25Mbps or faster over conventional telephone lines. VDSL is usually provisioned from a street cabinet which has fibre backhaul or directly from the telephone exchange in areas which are close to the exchange. This definition does not include implementations where fibre is provisioned to a large building, such as a block of flats, and the final connections are provided by VDSL within the building, which are defined as FTTP.
FTTP FTTP (fibre-to-the-premises) is broadband provided over fibre optic cables going all the way to the home or business premises. This definition also includes "FTTB", where fibre terminates at a large building and broadband distribution within the building, to different flats for example, is by a different non-fibre technology such as VDSL.
WiMAX WiMAX is a wireless service using one of the IEEE standards 802.16d, for fixed users and 802.16e for mobile.
Cable Modem (Standard Cable)
Cable Modem broadband is delivered over a fixed cable TV network using coaxial cable according to the earlier cable broadband standards such as DOCSIS 1, usually providing download speeds up to about 20Mbps.
DOCSIS 3 DOCSIS 3 broadband is delivered over a fixed cable TV network using coaxial cable according to the DOCSIS 3 standard, providing download speeds of 30Mbps and above.
HSPA HSPA (High Speed Packet Access) is the upgraded version of 3G mobile networks capable of providing mobile broadband at a maximum download speed of at least 21.1Mbps.
LTE LTE (Long Term Evolution) is the next-generation mobile service standardised by the 3rd Generation Partnership Project which requires separate spectrum from 3G mobile and which supports maximum downstream speeds up to at least 100Mbps.
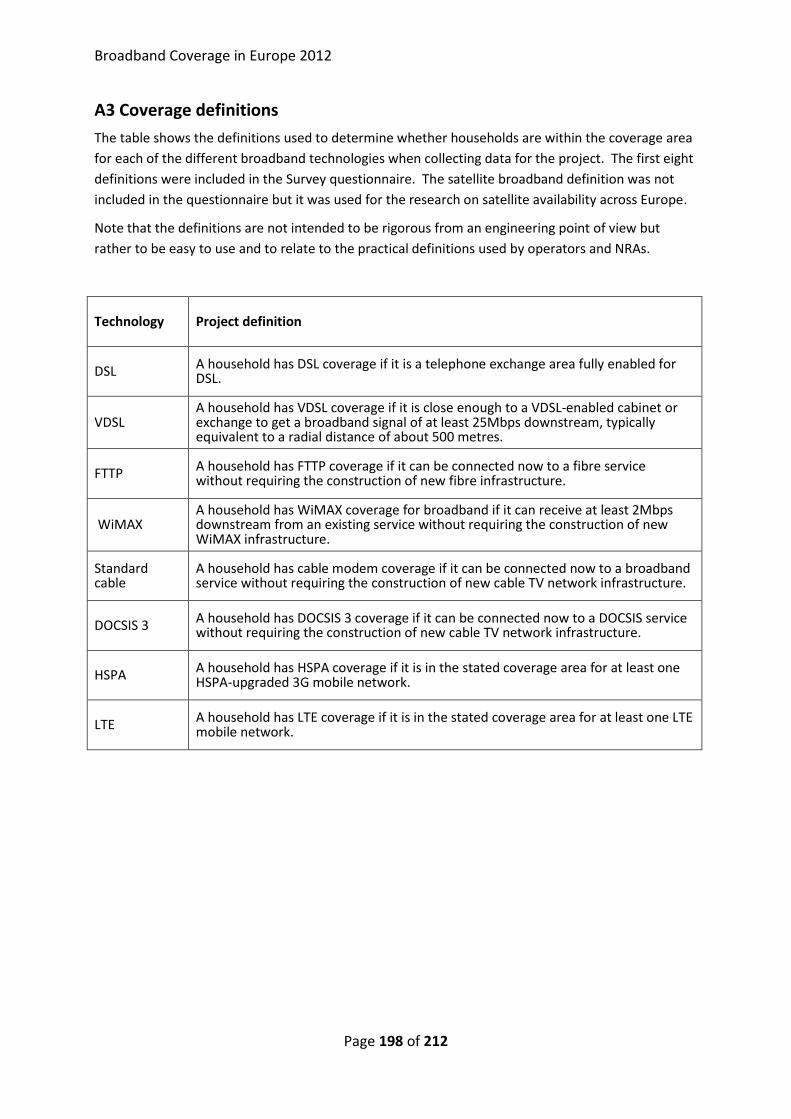
Broadband Coverage in Europe 2012
Page 198 of 212
A3 Coverage definitions
The table shows the definitions used to determine whether households are within the coverage area
for each of the different broadband technologies when collecting data for the project. The first eight
definitions were included in the Survey questionnaire. The satellite broadband definition was not
included in the questionnaire but it was used for the research on satellite availability across Europe.
Note that the definitions are not intended to be rigorous from an engineering point of view but
rather to be easy to use and to relate to the practical definitions used by operators and NRAs.
Technology Project definition
DSL A household has DSL coverage if it is a telephone exchange area fully enabled for DSL.
VDSL A household has VDSL coverage if it is close enough to a VDSL-enabled cabinet or exchange to get a broadband signal of at least 25Mbps downstream, typically equivalent to a radial distance of about 500 metres.
FTTP A household has FTTP coverage if it can be connected now to a fibre service without requiring the construction of new fibre infrastructure.
WiMAX A household has WiMAX coverage for broadband if it can receive at least 2Mbps downstream from an existing service without requiring the construction of new WiMAX infrastructure.
Standard cable
A household has cable modem coverage if it can be connected now to a broadband service without requiring the construction of new cable TV network infrastructure.
DOCSIS 3 A household has DOCSIS 3 coverage if it can be connected now to a DOCSIS service without requiring the construction of new cable TV network infrastructure.
HSPA A household has HSPA coverage if it is in the stated coverage area for at least one HSPA-upgraded 3G mobile network.
LTE A household has LTE coverage if it is in the stated coverage area for at least one LTE mobile network.
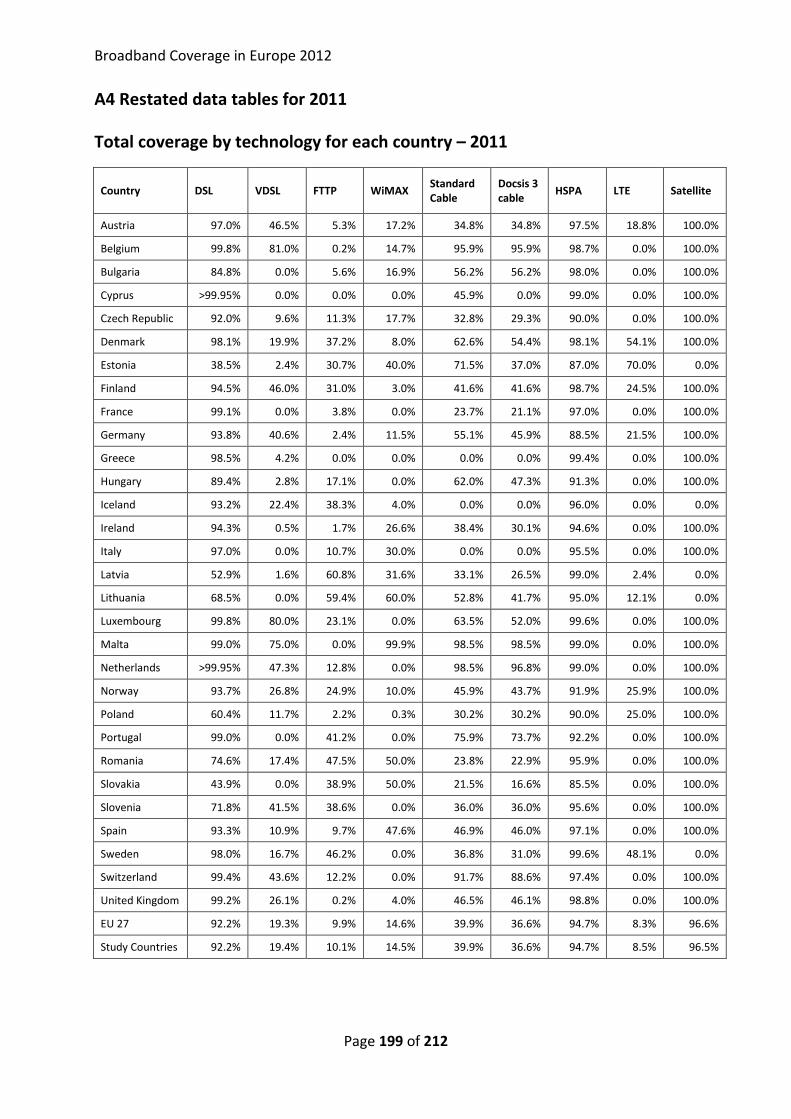
Broadband Coverage in Europe 2012
Page 199 of 212
A4 Restated data tables for 2011
Total coverage by technology for each country – 2011
Country DSL VDSL FTTP WiMAX Standard Cable
Docsis 3 cable
HSPA LTE Satellite
Austria 97.0% 46.5% 5.3% 17.2% 34.8% 34.8% 97.5% 18.8% 100.0%
Belgium 99.8% 81.0% 0.2% 14.7% 95.9% 95.9% 98.7% 0.0% 100.0%
Bulgaria 84.8% 0.0% 5.6% 16.9% 56.2% 56.2% 98.0% 0.0% 100.0%
Cyprus >99.95% 0.0% 0.0% 0.0% 45.9% 0.0% 99.0% 0.0% 100.0%
Czech Republic 92.0% 9.6% 11.3% 17.7% 32.8% 29.3% 90.0% 0.0% 100.0%
Denmark 98.1% 19.9% 37.2% 8.0% 62.6% 54.4% 98.1% 54.1% 100.0%
Estonia 38.5% 2.4% 30.7% 40.0% 71.5% 37.0% 87.0% 70.0% 0.0%
Finland 94.5% 46.0% 31.0% 3.0% 41.6% 41.6% 98.7% 24.5% 100.0%
France 99.1% 0.0% 3.8% 0.0% 23.7% 21.1% 97.0% 0.0% 100.0%
Germany 93.8% 40.6% 2.4% 11.5% 55.1% 45.9% 88.5% 21.5% 100.0%
Greece 98.5% 4.2% 0.0% 0.0% 0.0% 0.0% 99.4% 0.0% 100.0%
Hungary 89.4% 2.8% 17.1% 0.0% 62.0% 47.3% 91.3% 0.0% 100.0%
Iceland 93.2% 22.4% 38.3% 4.0% 0.0% 0.0% 96.0% 0.0% 0.0%
Ireland 94.3% 0.5% 1.7% 26.6% 38.4% 30.1% 94.6% 0.0% 100.0%
Italy 97.0% 0.0% 10.7% 30.0% 0.0% 0.0% 95.5% 0.0% 100.0%
Latvia 52.9% 1.6% 60.8% 31.6% 33.1% 26.5% 99.0% 2.4% 0.0%
Lithuania 68.5% 0.0% 59.4% 60.0% 52.8% 41.7% 95.0% 12.1% 0.0%
Luxembourg 99.8% 80.0% 23.1% 0.0% 63.5% 52.0% 99.6% 0.0% 100.0%
Malta 99.0% 75.0% 0.0% 99.9% 98.5% 98.5% 99.0% 0.0% 100.0%
Netherlands >99.95% 47.3% 12.8% 0.0% 98.5% 96.8% 99.0% 0.0% 100.0%
Norway 93.7% 26.8% 24.9% 10.0% 45.9% 43.7% 91.9% 25.9% 100.0%
Poland 60.4% 11.7% 2.2% 0.3% 30.2% 30.2% 90.0% 25.0% 100.0%
Portugal 99.0% 0.0% 41.2% 0.0% 75.9% 73.7% 92.2% 0.0% 100.0%
Romania 74.6% 17.4% 47.5% 50.0% 23.8% 22.9% 95.9% 0.0% 100.0%
Slovakia 43.9% 0.0% 38.9% 50.0% 21.5% 16.6% 85.5% 0.0% 100.0%
Slovenia 71.8% 41.5% 38.6% 0.0% 36.0% 36.0% 95.6% 0.0% 100.0%
Spain 93.3% 10.9% 9.7% 47.6% 46.9% 46.0% 97.1% 0.0% 100.0%
Sweden 98.0% 16.7% 46.2% 0.0% 36.8% 31.0% 99.6% 48.1% 0.0%
Switzerland 99.4% 43.6% 12.2% 0.0% 91.7% 88.6% 97.4% 0.0% 100.0%
United Kingdom 99.2% 26.1% 0.2% 4.0% 46.5% 46.1% 98.8% 0.0% 100.0%
EU 27 92.2% 19.3% 9.9% 14.6% 39.9% 36.6% 94.7% 8.3% 96.6%
Study Countries 92.2% 19.4% 10.1% 14.5% 39.9% 36.6% 94.7% 8.5% 96.5%

Broadband Coverage in Europe 2012
Page 200 of 212
Coverage by technology combination for each country – 2011
Country Total Standard
Total Standard Fixed
Total NGA Rural Standard
Rural Standard Fixed
Rural NGA
Austria
98.2% 64.4%
89.6% 8.7%
Belgium
>99.95% 96.8%
97.3% 65.4%
Bulgaria
89.1% 59.3%
58.3% 0.1%
Cyprus
>99.95% 0.0%
98.3% 41.2%
Czech Republic
94.5% 40.3%
>99.95% 0.0%
Denmark
99.0% 61.9%
55.5% 0.0%
Estonia
86.0% 52.1%
81.7% 21.5%
Finland
95.0% 63.9%
93.3% 0.0%
France
99.4% 23.2%
50.4% 1.4%
Germany
95.7% 63.8%
92.4% 0.0%
Greece
98.5% 4.2%
84.1% 6.6%
Hungary
89.4% 52.8%
71.2% 4.2%
Iceland
94.4% 44.6%
95.0% 0.0%
Ireland
94.5% 31.2%
77.4% 3.9%
Italy
98.5% 10.7%
92.5% 0.0%
Latvia
75.5% 66.0%
84.6% 0.0%
Lithuania
88.4% 62.2%
87.9% 0.0%
Luxembourg
99.8% 85.2%
70.1% 22.1%
Malta
99.9% 98.8%
98.1% 84.1%
Netherlands
>99.95% 97.1%
20.8% 7.4%
Norway
95.9% 69.4%
99.9% 2.9%
Poland
65.4% 36.8%
>99.95% 72.9%
Portugal
99.5% 74.5%
78.4% 11.5%
Romania
86.8% 57.4%
37.5% 0.6%
Slovakia
75.0% 47.2%
97.4% 30.7%
Slovenia
75.8% 62.7%
68.4% 21.6%
Spain
96.4% 56.0%
91.0% 4.9%
Sweden
98.1% 53.4%
13.7% 0.0%
Switzerland
99.7% 92.7%
50.0% 0.0%
United Kingdom
99.6% 58.3%
93.2% 3.8%
EU 27
94.6% 48.1%
79.9% 8.5%
Study Countries
94.6% 48.4%
79.9% 8.6%
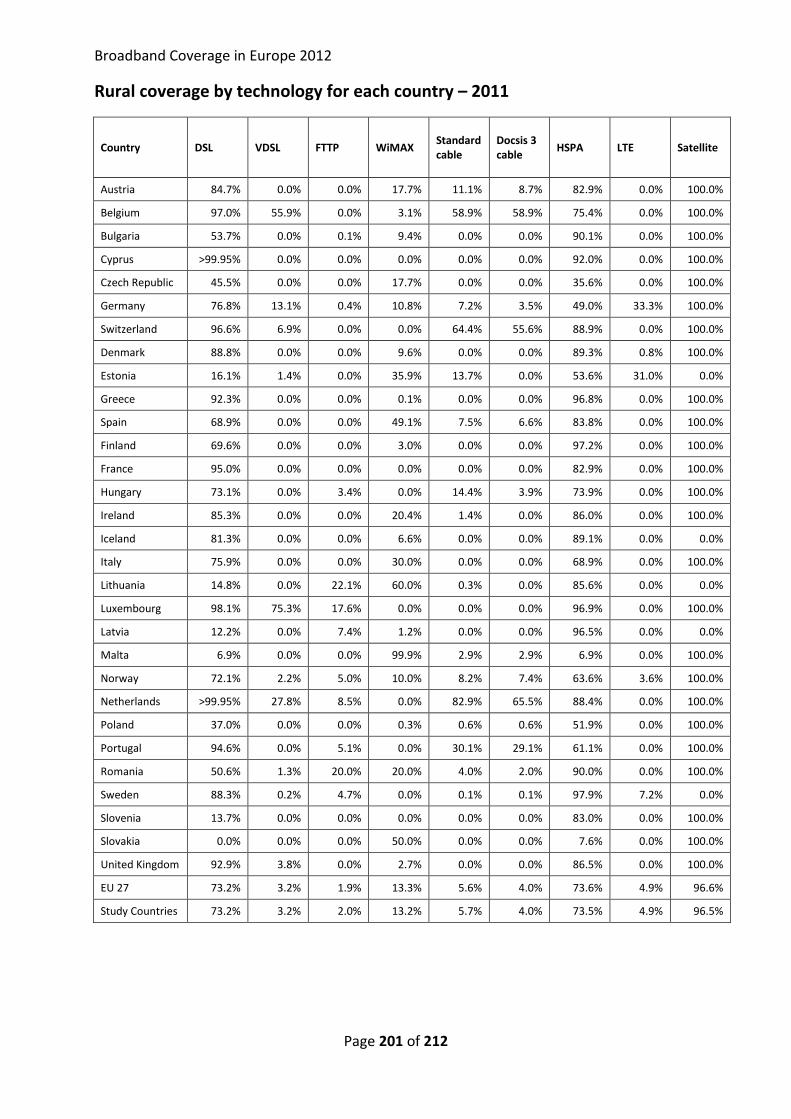
Broadband Coverage in Europe 2012
Page 201 of 212
Rural coverage by technology for each country – 2011
Country DSL VDSL FTTP WiMAX Standard cable
Docsis 3 cable
HSPA LTE Satellite
Austria 84.7% 0.0% 0.0% 17.7% 11.1% 8.7% 82.9% 0.0% 100.0%
Belgium 97.0% 55.9% 0.0% 3.1% 58.9% 58.9% 75.4% 0.0% 100.0%
Bulgaria 53.7% 0.0% 0.1% 9.4% 0.0% 0.0% 90.1% 0.0% 100.0%
Cyprus >99.95% 0.0% 0.0% 0.0% 0.0% 0.0% 92.0% 0.0% 100.0%
Czech Republic 45.5% 0.0% 0.0% 17.7% 0.0% 0.0% 35.6% 0.0% 100.0%
Germany 76.8% 13.1% 0.4% 10.8% 7.2% 3.5% 49.0% 33.3% 100.0%
Switzerland 96.6% 6.9% 0.0% 0.0% 64.4% 55.6% 88.9% 0.0% 100.0%
Denmark 88.8% 0.0% 0.0% 9.6% 0.0% 0.0% 89.3% 0.8% 100.0%
Estonia 16.1% 1.4% 0.0% 35.9% 13.7% 0.0% 53.6% 31.0% 0.0%
Greece 92.3% 0.0% 0.0% 0.1% 0.0% 0.0% 96.8% 0.0% 100.0%
Spain 68.9% 0.0% 0.0% 49.1% 7.5% 6.6% 83.8% 0.0% 100.0%
Finland 69.6% 0.0% 0.0% 3.0% 0.0% 0.0% 97.2% 0.0% 100.0%
France 95.0% 0.0% 0.0% 0.0% 0.0% 0.0% 82.9% 0.0% 100.0%
Hungary 73.1% 0.0% 3.4% 0.0% 14.4% 3.9% 73.9% 0.0% 100.0%
Ireland 85.3% 0.0% 0.0% 20.4% 1.4% 0.0% 86.0% 0.0% 100.0%
Iceland 81.3% 0.0% 0.0% 6.6% 0.0% 0.0% 89.1% 0.0% 0.0%
Italy 75.9% 0.0% 0.0% 30.0% 0.0% 0.0% 68.9% 0.0% 100.0%
Lithuania 14.8% 0.0% 22.1% 60.0% 0.3% 0.0% 85.6% 0.0% 0.0%
Luxembourg 98.1% 75.3% 17.6% 0.0% 0.0% 0.0% 96.9% 0.0% 100.0%
Latvia 12.2% 0.0% 7.4% 1.2% 0.0% 0.0% 96.5% 0.0% 0.0%
Malta 6.9% 0.0% 0.0% 99.9% 2.9% 2.9% 6.9% 0.0% 100.0%
Norway 72.1% 2.2% 5.0% 10.0% 8.2% 7.4% 63.6% 3.6% 100.0%
Netherlands >99.95% 27.8% 8.5% 0.0% 82.9% 65.5% 88.4% 0.0% 100.0%
Poland 37.0% 0.0% 0.0% 0.3% 0.6% 0.6% 51.9% 0.0% 100.0%
Portugal 94.6% 0.0% 5.1% 0.0% 30.1% 29.1% 61.1% 0.0% 100.0%
Romania 50.6% 1.3% 20.0% 20.0% 4.0% 2.0% 90.0% 0.0% 100.0%
Sweden 88.3% 0.2% 4.7% 0.0% 0.1% 0.1% 97.9% 7.2% 0.0%
Slovenia 13.7% 0.0% 0.0% 0.0% 0.0% 0.0% 83.0% 0.0% 100.0%
Slovakia 0.0% 0.0% 0.0% 50.0% 0.0% 0.0% 7.6% 0.0% 100.0%
United Kingdom 92.9% 3.8% 0.0% 2.7% 0.0% 0.0% 86.5% 0.0% 100.0%
EU 27 73.2% 3.2% 1.9% 13.3% 5.6% 4.0% 73.6% 4.9% 96.6%
Study Countries 73.2% 3.2% 2.0% 13.2% 5.7% 4.0% 73.5% 4.9% 96.5%
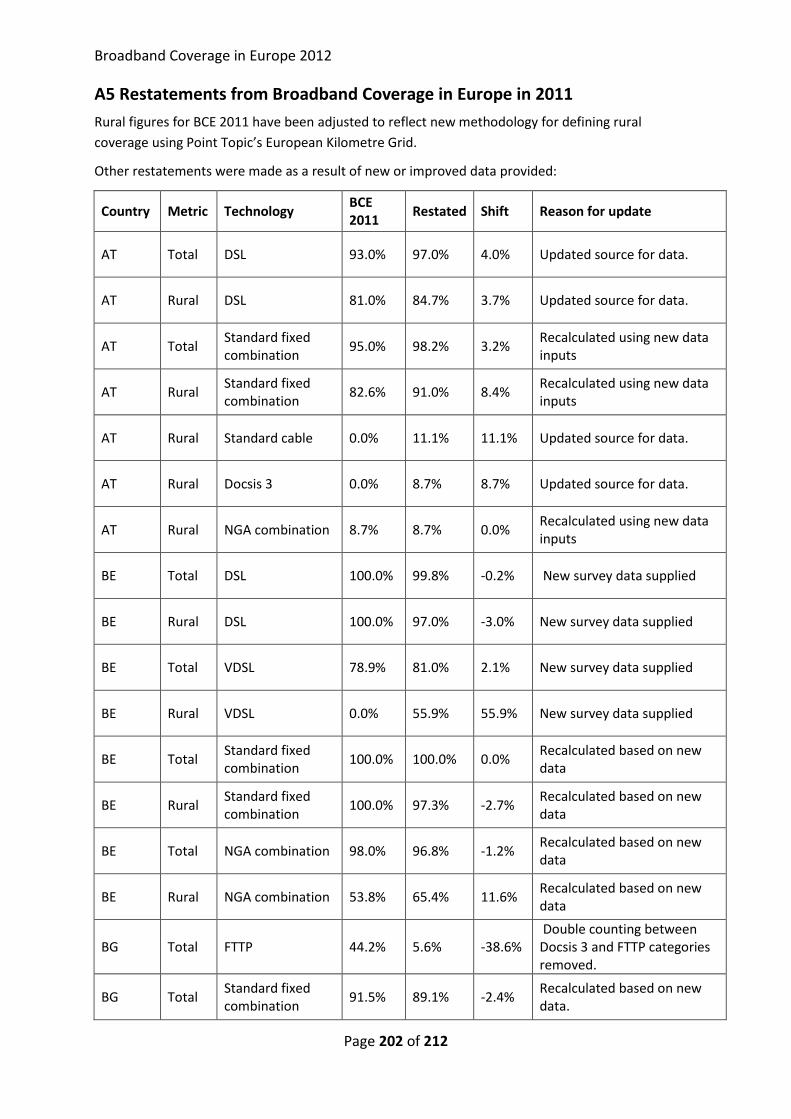
Broadband Coverage in Europe 2012
Page 202 of 212
A5 Restatements from Broadband Coverage in Europe in 2011
Rural figures for BCE 2011 have been adjusted to reflect new methodology for defining rural
coverage using Point Topic’s European Kilometre Grid.
Other restatements were made as a result of new or improved data provided:
Country Metric Technology BCE 2011
Restated Shift Reason for update
AT Total DSL 93.0% 97.0% 4.0% Updated source for data.
AT Rural DSL 81.0% 84.7% 3.7% Updated source for data.
AT Total Standard fixed combination
95.0% 98.2% 3.2% Recalculated using new data inputs
AT Rural Standard fixed combination
82.6% 91.0% 8.4% Recalculated using new data inputs
AT Rural Standard cable 0.0% 11.1% 11.1% Updated source for data.
AT Rural Docsis 3 0.0% 8.7% 8.7% Updated source for data.
AT Rural NGA combination 8.7% 8.7% 0.0% Recalculated using new data inputs
BE Total DSL 100.0% 99.8% -0.2% New survey data supplied
BE Rural DSL 100.0% 97.0% -3.0% New survey data supplied
BE Total VDSL 78.9% 81.0% 2.1% New survey data supplied
BE Rural VDSL 0.0% 55.9% 55.9% New survey data supplied
BE Total Standard fixed combination
100.0% 100.0% 0.0% Recalculated based on new data
BE Rural Standard fixed combination
100.0% 97.3% -2.7% Recalculated based on new data
BE Total NGA combination 98.0% 96.8% -1.2% Recalculated based on new data
BE Rural NGA combination 53.8% 65.4% 11.6% Recalculated based on new data
BG Total FTTP 44.2% 5.6% -38.6% Double counting between Docsis 3 and FTTP categories removed.
BG Total Standard fixed combination
91.5% 89.1% -2.4% Recalculated based on new data.
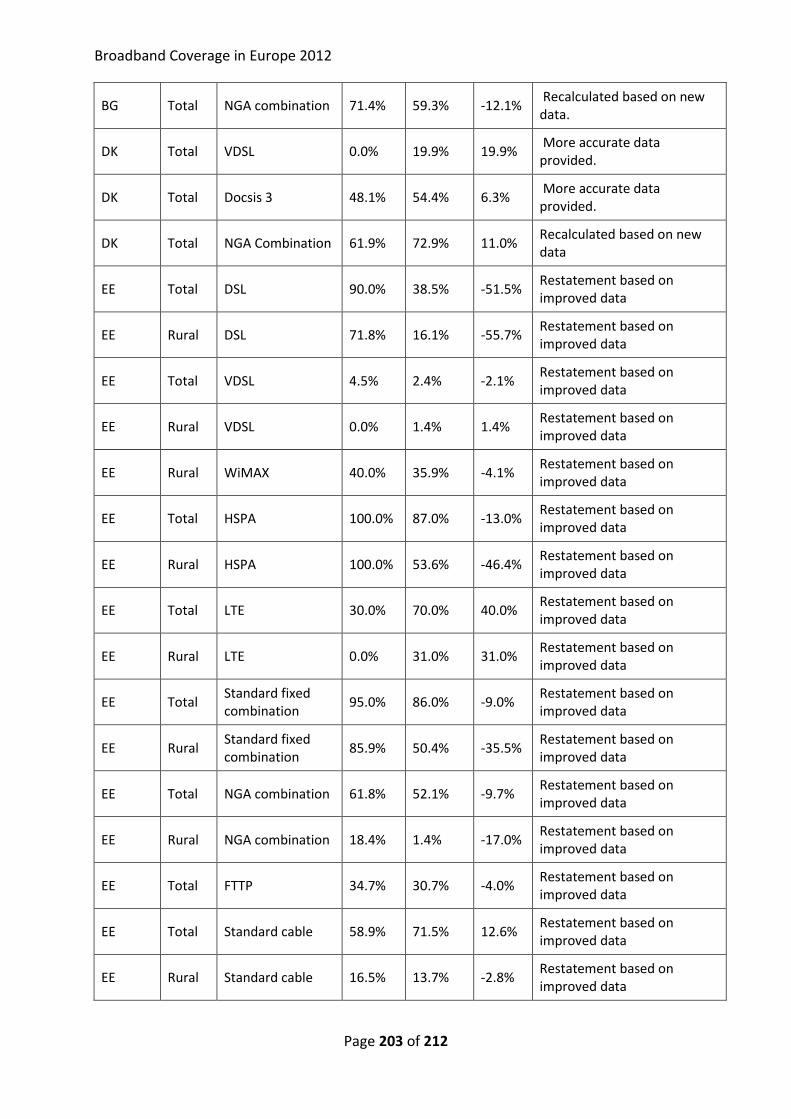
Broadband Coverage in Europe 2012
Page 203 of 212
BG Total NGA combination 71.4% 59.3% -12.1% Recalculated based on new data.
DK Total VDSL 0.0% 19.9% 19.9% More accurate data provided.
DK Total Docsis 3 48.1% 54.4% 6.3% More accurate data provided.
DK Total NGA Combination 61.9% 72.9% 11.0% Recalculated based on new data
EE Total DSL 90.0% 38.5% -51.5% Restatement based on improved data
EE Rural DSL 71.8% 16.1% -55.7% Restatement based on improved data
EE Total VDSL 4.5% 2.4% -2.1% Restatement based on improved data
EE Rural VDSL 0.0% 1.4% 1.4% Restatement based on improved data
EE Rural WiMAX 40.0% 35.9% -4.1% Restatement based on improved data
EE Total HSPA 100.0% 87.0% -13.0% Restatement based on improved data
EE Rural HSPA 100.0% 53.6% -46.4% Restatement based on improved data
EE Total LTE 30.0% 70.0% 40.0% Restatement based on improved data
EE Rural LTE 0.0% 31.0% 31.0% Restatement based on improved data
EE Total Standard fixed combination
95.0% 86.0% -9.0% Restatement based on improved data
EE Rural Standard fixed combination
85.9% 50.4% -35.5% Restatement based on improved data
EE Total NGA combination 61.8% 52.1% -9.7% Restatement based on improved data
EE Rural NGA combination 18.4% 1.4% -17.0% Restatement based on improved data
EE Total FTTP 34.7% 30.7% -4.0% Restatement based on improved data
EE Total Standard cable 58.9% 71.5% 12.6% Restatement based on improved data
EE Rural Standard cable 16.5% 13.7% -2.8% Restatement based on improved data
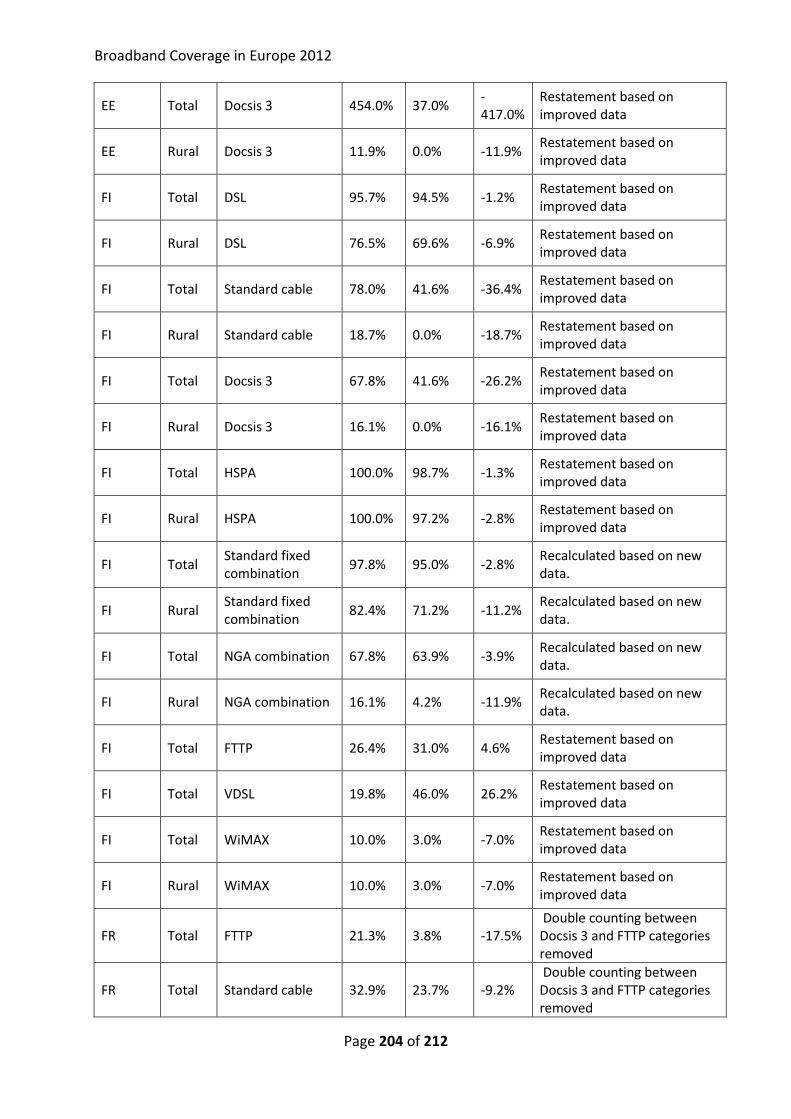
Broadband Coverage in Europe 2012
Page 204 of 212
EE Total Docsis 3 454.0% 37.0% -417.0%
Restatement based on improved data
EE Rural Docsis 3 11.9% 0.0% -11.9% Restatement based on improved data
FI Total DSL 95.7% 94.5% -1.2% Restatement based on improved data
FI Rural DSL 76.5% 69.6% -6.9% Restatement based on improved data
FI Total Standard cable 78.0% 41.6% -36.4% Restatement based on improved data
FI Rural Standard cable 18.7% 0.0% -18.7% Restatement based on improved data
FI Total Docsis 3 67.8% 41.6% -26.2% Restatement based on improved data
FI Rural Docsis 3 16.1% 0.0% -16.1% Restatement based on improved data
FI Total HSPA 100.0% 98.7% -1.3% Restatement based on improved data
FI Rural HSPA 100.0% 97.2% -2.8% Restatement based on improved data
FI Total Standard fixed combination
97.8% 95.0% -2.8% Recalculated based on new data.
FI Rural Standard fixed combination
82.4% 71.2% -11.2% Recalculated based on new data.
FI Total NGA combination 67.8% 63.9% -3.9% Recalculated based on new data.
FI Rural NGA combination 16.1% 4.2% -11.9% Recalculated based on new data.
FI Total FTTP 26.4% 31.0% 4.6% Restatement based on improved data
FI Total VDSL 19.8% 46.0% 26.2% Restatement based on improved data
FI Total WiMAX 10.0% 3.0% -7.0% Restatement based on improved data
FI Rural WiMAX 10.0% 3.0% -7.0% Restatement based on improved data
FR Total FTTP 21.3% 3.8% -17.5% Double counting between Docsis 3 and FTTP categories removed
FR Total Standard cable 32.9% 23.7% -9.2% Double counting between Docsis 3 and FTTP categories removed

Broadband Coverage in Europe 2012
Page 205 of 212
FR Total Docsis 3 27.7% 21.1% -6.6% Double counting between Docsis 3 and FTTP categories removed
FR Total NGA combination 39.1% 23.2% -15.9% Recalculated based on new data provided
FR Total Standard fixed combination
99.30% 99.4% 0.1% Recalculated based on new data provided.
DE Total DSL 92.8% 93.8% 1.0% More accurate data provided
DE Total VDSL 41.5% 40.6% -0.9% More accurate data provided
DE Total FTTP 2.6% 2.4% -0.2% More accurate data provided
DE Total WiMAX 11.5% 11.5% 0.0% More accurate data provided
DE Total Standard cable 52.5% 55.1% 2.6% More accurate data provided
DE Total Docsis 3 38.2% 45.9% 7.7% More accurate data provided
DE Total HSPA 89.1% 88.5% -0.6% More accurate data provided
DE Total LTE 22.5% 21.5% -1.0% More accurate data provided
DE Total Standard fixed combination
95.3% 95.7% 0.4% More accurate data provided
DE Total NGA combination 60.8% 63.8% 3.0% More accurate data provided
DE Rural DSL 51.4% 76.8% 25.4% More accurate data provided
DE Rural VDSL 0.0% 13.1% 13.1% More accurate data provided
DE Rural FTTP 0.0% 0.4% 0.4% More accurate data provided
DE Rural WiMAX 11.5% 10.8% -0.7% More accurate data provided
DE Rural Standard cable 2.0% 7.2% 5.2% More accurate data provided
DE Rural Docsis 3 2.0% 3.5% 1.5% More accurate data provided
DE Rural HSPA 30.7% 49.0% 18.3% More accurate data provided
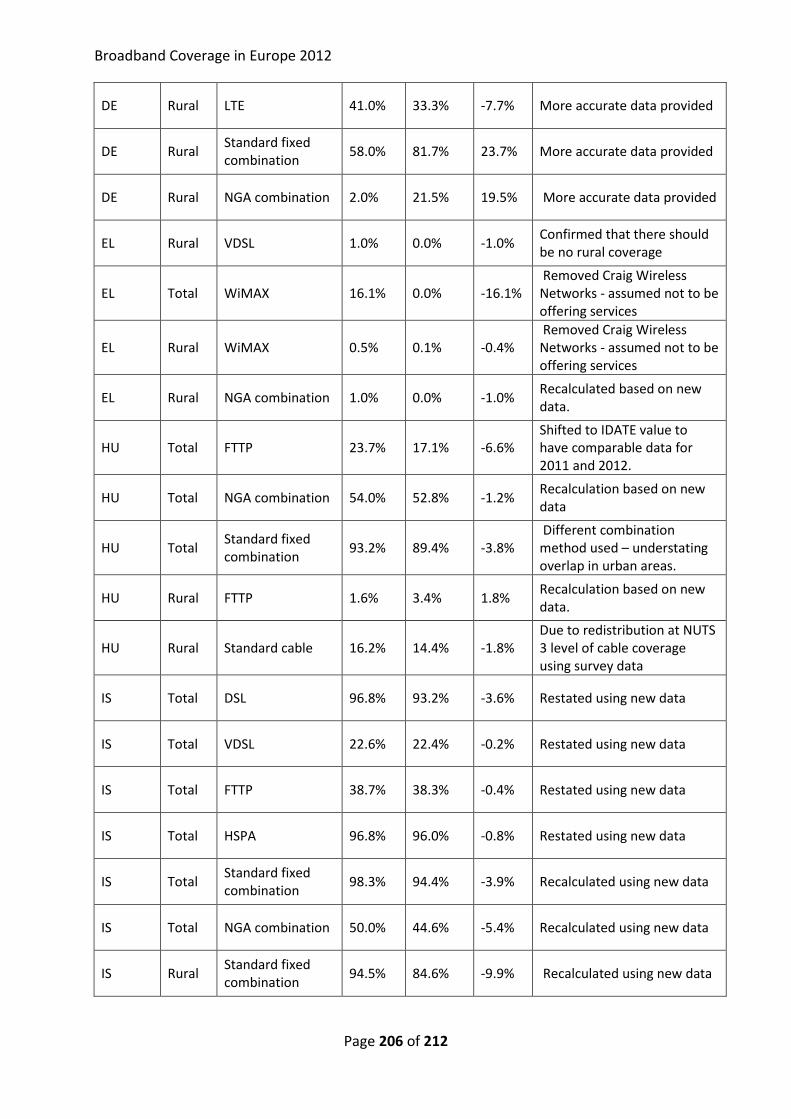
Broadband Coverage in Europe 2012
Page 206 of 212
DE Rural LTE 41.0% 33.3% -7.7% More accurate data provided
DE Rural Standard fixed combination
58.0% 81.7% 23.7% More accurate data provided
DE Rural NGA combination 2.0% 21.5% 19.5% More accurate data provided
EL Rural VDSL 1.0% 0.0% -1.0% Confirmed that there should be no rural coverage
EL Total WiMAX 16.1% 0.0% -16.1% Removed Craig Wireless Networks - assumed not to be offering services
EL Rural WiMAX 0.5% 0.1% -0.4% Removed Craig Wireless Networks - assumed not to be offering services
EL Rural NGA combination 1.0% 0.0% -1.0% Recalculated based on new data.
HU Total FTTP 23.7% 17.1% -6.6% Shifted to IDATE value to have comparable data for 2011 and 2012.
HU Total NGA combination 54.0% 52.8% -1.2% Recalculation based on new data
HU Total Standard fixed combination
93.2% 89.4% -3.8% Different combination method used – understating overlap in urban areas.
HU Rural FTTP 1.6% 3.4% 1.8% Recalculation based on new data.
HU Rural Standard cable 16.2% 14.4% -1.8% Due to redistribution at NUTS 3 level of cable coverage using survey data
IS Total DSL 96.8% 93.2% -3.6% Restated using new data
IS Total VDSL 22.6% 22.4% -0.2% Restated using new data
IS Total FTTP 38.7% 38.3% -0.4% Restated using new data
IS Total HSPA 96.8% 96.0% -0.8% Restated using new data
IS Total Standard fixed combination
98.3% 94.4% -3.9% Recalculated using new data
IS Total NGA combination 50.0% 44.6% -5.4% Recalculated using new data
IS Rural Standard fixed combination
94.5% 84.6% -9.9% Recalculated using new data
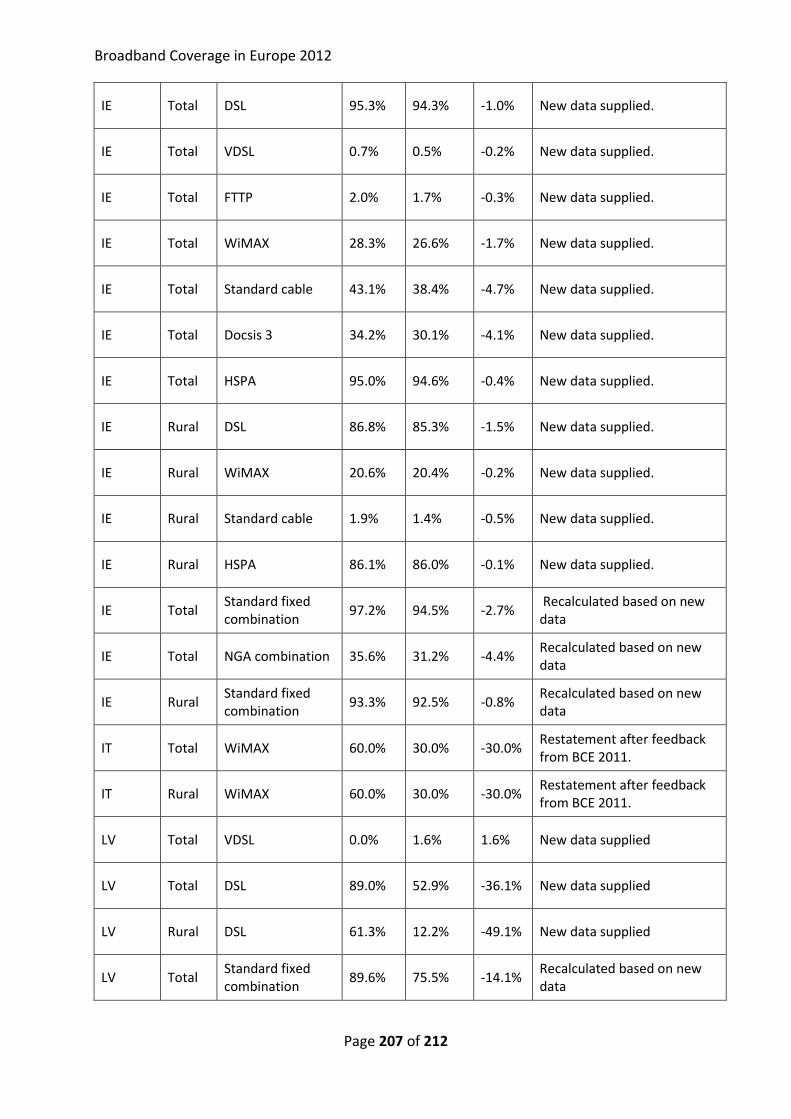
Broadband Coverage in Europe 2012
Page 207 of 212
IE Total DSL 95.3% 94.3% -1.0% New data supplied.
IE Total VDSL 0.7% 0.5% -0.2% New data supplied.
IE Total FTTP 2.0% 1.7% -0.3% New data supplied.
IE Total WiMAX 28.3% 26.6% -1.7% New data supplied.
IE Total Standard cable 43.1% 38.4% -4.7% New data supplied.
IE Total Docsis 3 34.2% 30.1% -4.1% New data supplied.
IE Total HSPA 95.0% 94.6% -0.4% New data supplied.
IE Rural DSL 86.8% 85.3% -1.5% New data supplied.
IE Rural WiMAX 20.6% 20.4% -0.2% New data supplied.
IE Rural Standard cable 1.9% 1.4% -0.5% New data supplied.
IE Rural HSPA 86.1% 86.0% -0.1% New data supplied.
IE Total Standard fixed combination
97.2% 94.5% -2.7% Recalculated based on new data
IE Total NGA combination 35.6% 31.2% -4.4% Recalculated based on new data
IE Rural Standard fixed combination
93.3% 92.5% -0.8% Recalculated based on new data
IT Total WiMAX 60.0% 30.0% -30.0% Restatement after feedback from BCE 2011.
IT Rural WiMAX 60.0% 30.0% -30.0% Restatement after feedback from BCE 2011.
LV Total VDSL 0.0% 1.6% 1.6% New data supplied
LV Total DSL 89.0% 52.9% -36.1% New data supplied
LV Rural DSL 61.3% 12.2% -49.1% New data supplied
LV Total Standard fixed combination
89.6% 75.5% -14.1% Recalculated based on new data
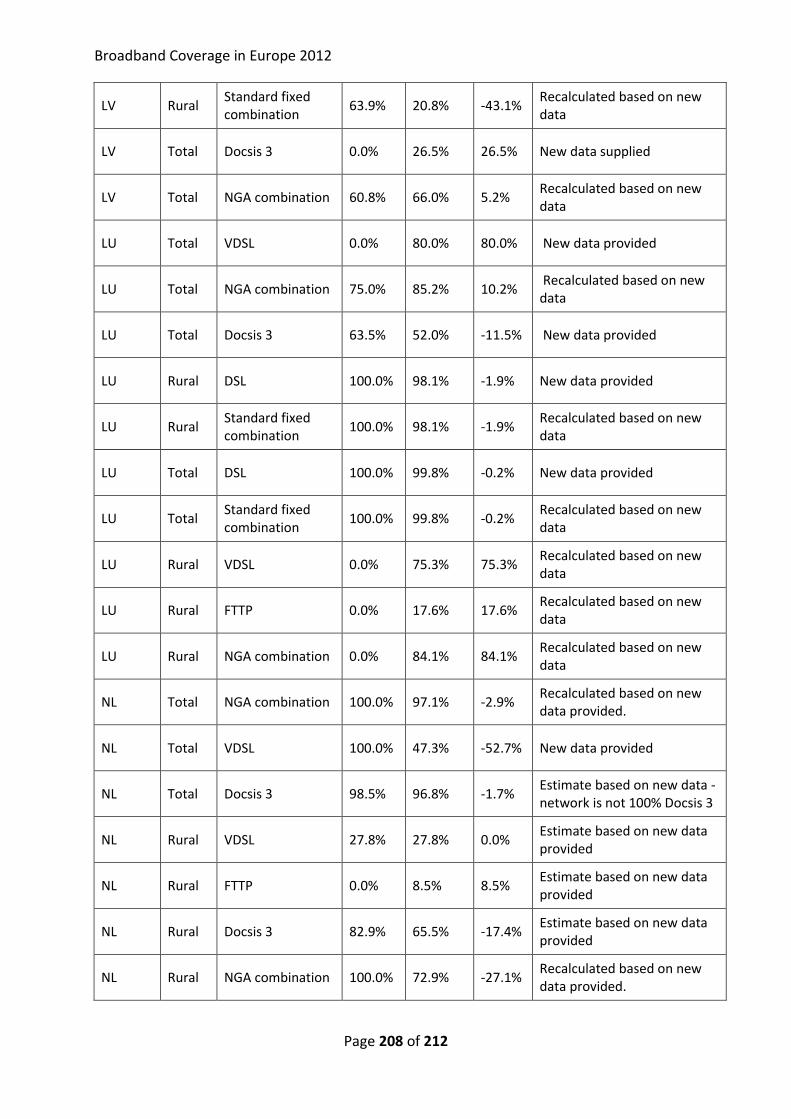
Broadband Coverage in Europe 2012
Page 208 of 212
LV Rural Standard fixed combination
63.9% 20.8% -43.1% Recalculated based on new data
LV Total Docsis 3 0.0% 26.5% 26.5% New data supplied
LV Total NGA combination 60.8% 66.0% 5.2% Recalculated based on new data
LU Total VDSL 0.0% 80.0% 80.0% New data provided
LU Total NGA combination 75.0% 85.2% 10.2% Recalculated based on new data
LU Total Docsis 3 63.5% 52.0% -11.5% New data provided
LU Rural DSL 100.0% 98.1% -1.9% New data provided
LU Rural Standard fixed combination
100.0% 98.1% -1.9% Recalculated based on new data
LU Total DSL 100.0% 99.8% -0.2% New data provided
LU Total Standard fixed combination
100.0% 99.8% -0.2% Recalculated based on new data
LU Rural VDSL 0.0% 75.3% 75.3% Recalculated based on new data
LU Rural FTTP 0.0% 17.6% 17.6% Recalculated based on new data
LU Rural NGA combination 0.0% 84.1% 84.1% Recalculated based on new data
NL Total NGA combination 100.0% 97.1% -2.9% Recalculated based on new data provided.
NL Total VDSL 100.0% 47.3% -52.7% New data provided
NL Total Docsis 3 98.5% 96.8% -1.7% Estimate based on new data - network is not 100% Docsis 3
NL Rural VDSL 27.8% 27.8% 0.0% Estimate based on new data provided
NL Rural FTTP 0.0% 8.5% 8.5% Estimate based on new data provided
NL Rural Docsis 3 82.9% 65.5% -17.4% Estimate based on new data provided
NL Rural NGA combination 100.0% 72.9% -27.1% Recalculated based on new data provided.
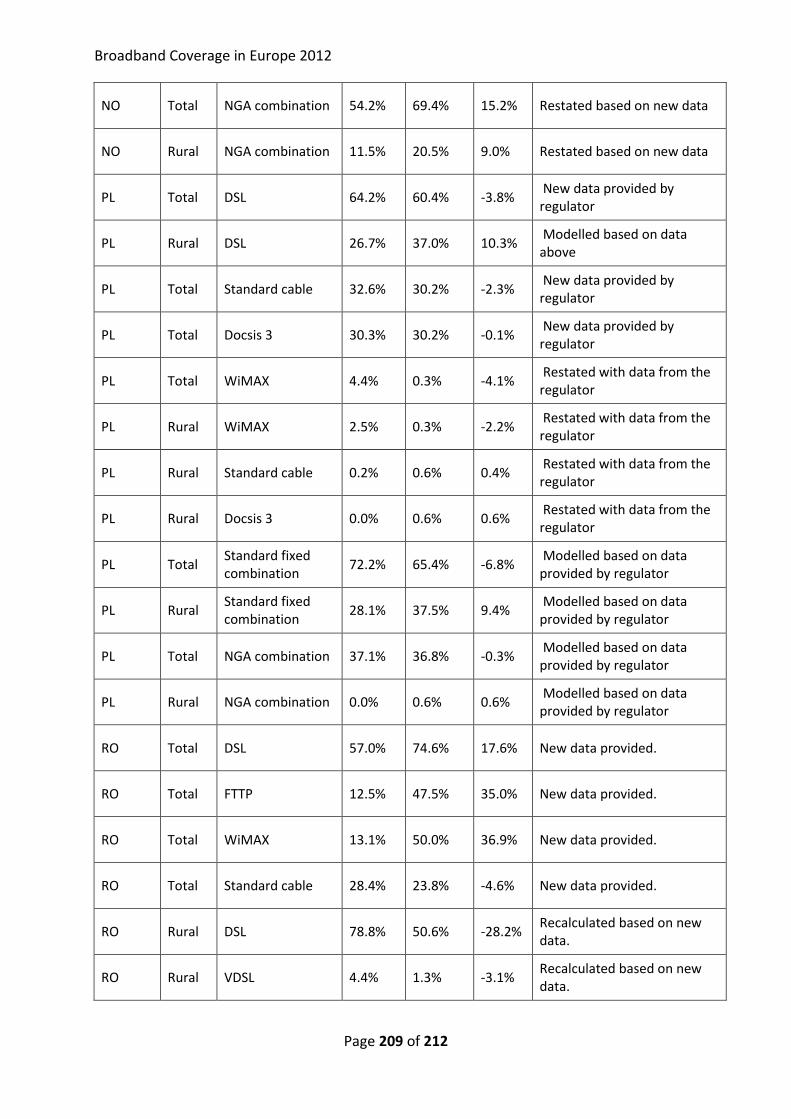
Broadband Coverage in Europe 2012
Page 209 of 212
NO Total NGA combination 54.2% 69.4% 15.2% Restated based on new data
NO Rural NGA combination 11.5% 20.5% 9.0% Restated based on new data
PL Total DSL 64.2% 60.4% -3.8% New data provided by regulator
PL Rural DSL 26.7% 37.0% 10.3% Modelled based on data above
PL Total Standard cable 32.6% 30.2% -2.3% New data provided by regulator
PL Total Docsis 3 30.3% 30.2% -0.1% New data provided by regulator
PL Total WiMAX 4.4% 0.3% -4.1% Restated with data from the regulator
PL Rural WiMAX 2.5% 0.3% -2.2% Restated with data from the regulator
PL Rural Standard cable 0.2% 0.6% 0.4% Restated with data from the regulator
PL Rural Docsis 3 0.0% 0.6% 0.6% Restated with data from the regulator
PL Total Standard fixed combination
72.2% 65.4% -6.8% Modelled based on data provided by regulator
PL Rural Standard fixed combination
28.1% 37.5% 9.4% Modelled based on data provided by regulator
PL Total NGA combination 37.1% 36.8% -0.3% Modelled based on data provided by regulator
PL Rural NGA combination 0.0% 0.6% 0.6% Modelled based on data provided by regulator
RO Total DSL 57.0% 74.6% 17.6% New data provided.
RO Total FTTP 12.5% 47.5% 35.0% New data provided.
RO Total WiMAX 13.1% 50.0% 36.9% New data provided.
RO Total Standard cable 28.4% 23.8% -4.6% New data provided.
RO Rural DSL 78.8% 50.6% -28.2% Recalculated based on new data.
RO Rural VDSL 4.4% 1.3% -3.1% Recalculated based on new data.
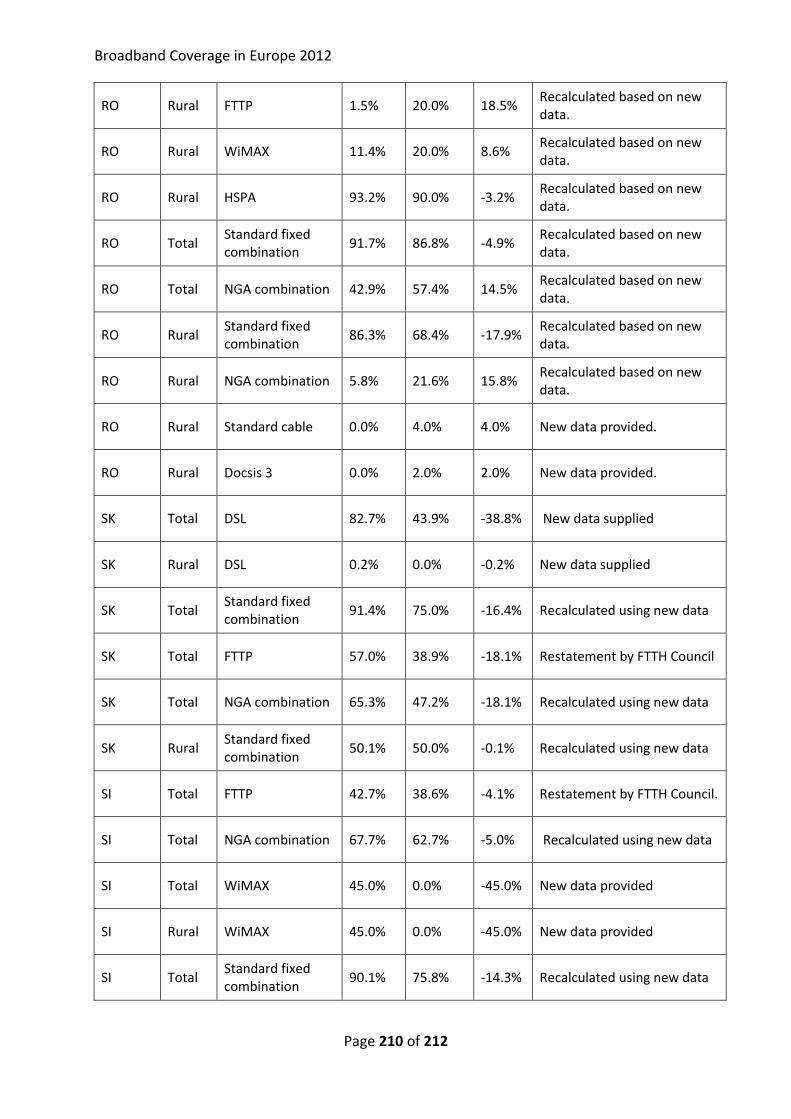
Broadband Coverage in Europe 2012
Page 210 of 212
RO Rural FTTP 1.5% 20.0% 18.5% Recalculated based on new data.
RO Rural WiMAX 11.4% 20.0% 8.6% Recalculated based on new data.
RO Rural HSPA 93.2% 90.0% -3.2% Recalculated based on new data.
RO Total Standard fixed combination
91.7% 86.8% -4.9% Recalculated based on new data.
RO Total NGA combination 42.9% 57.4% 14.5% Recalculated based on new data.
RO Rural Standard fixed combination
86.3% 68.4% -17.9% Recalculated based on new data.
RO Rural NGA combination 5.8% 21.6% 15.8% Recalculated based on new data.
RO Rural Standard cable 0.0% 4.0% 4.0% New data provided.
RO Rural Docsis 3 0.0% 2.0% 2.0% New data provided.
SK Total DSL 82.7% 43.9% -38.8% New data supplied
SK Rural DSL 0.2% 0.0% -0.2% New data supplied
SK Total Standard fixed combination
91.4% 75.0% -16.4% Recalculated using new data
SK Total FTTP 57.0% 38.9% -18.1% Restatement by FTTH Council
SK Total NGA combination 65.3% 47.2% -18.1% Recalculated using new data
SK Rural Standard fixed combination
50.1% 50.0% -0.1% Recalculated using new data
SI Total FTTP 42.7% 38.6% -4.1% Restatement by FTTH Council.
SI Total NGA combination 67.7% 62.7% -5.0% Recalculated using new data
SI Total WiMAX 45.0% 0.0% -45.0% New data provided
SI Rural WiMAX 45.0% 0.0% -45.0% New data provided
SI Total Standard fixed combination
90.1% 75.8% -14.3% Recalculated using new data
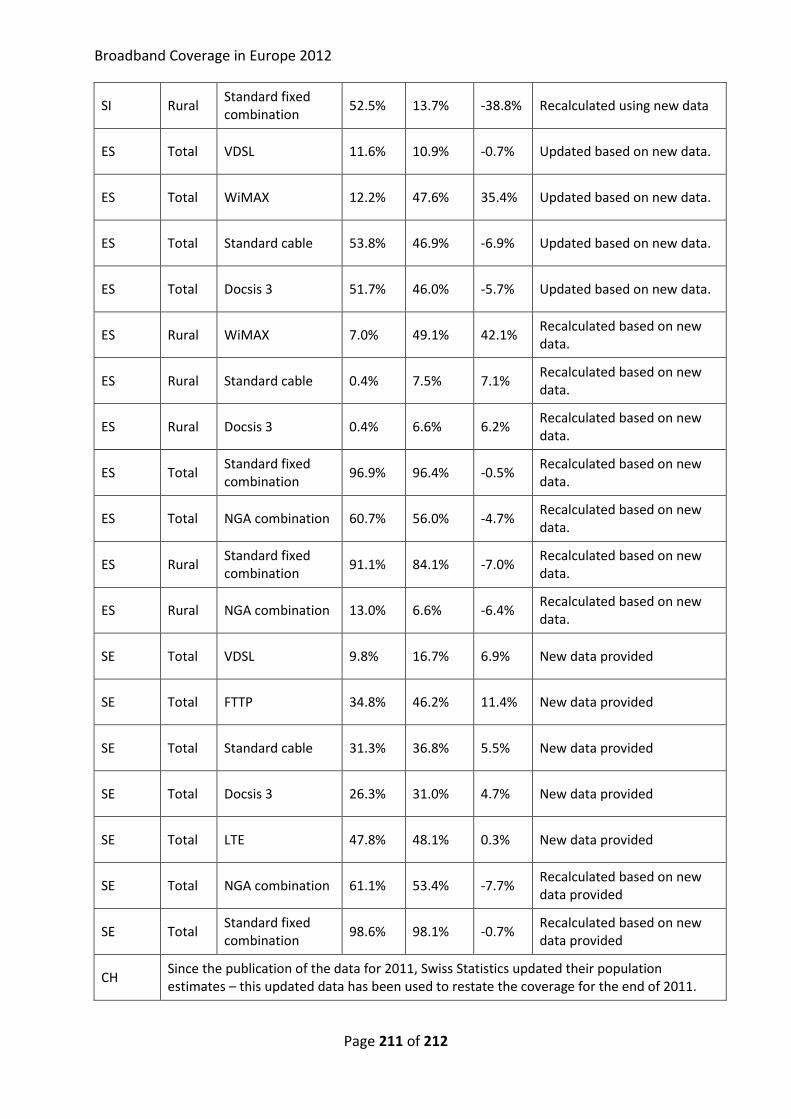
Broadband Coverage in Europe 2012
Page 211 of 212
SI Rural Standard fixed combination
52.5% 13.7% -38.8% Recalculated using new data
ES Total VDSL 11.6% 10.9% -0.7% Updated based on new data.
ES Total WiMAX 12.2% 47.6% 35.4% Updated based on new data.
ES Total Standard cable 53.8% 46.9% -6.9% Updated based on new data.
ES Total Docsis 3 51.7% 46.0% -5.7% Updated based on new data.
ES Rural WiMAX 7.0% 49.1% 42.1% Recalculated based on new data.
ES Rural Standard cable 0.4% 7.5% 7.1% Recalculated based on new data.
ES Rural Docsis 3 0.4% 6.6% 6.2% Recalculated based on new data.
ES Total Standard fixed combination
96.9% 96.4% -0.5% Recalculated based on new data.
ES Total NGA combination 60.7% 56.0% -4.7% Recalculated based on new data.
ES Rural Standard fixed combination
91.1% 84.1% -7.0% Recalculated based on new data.
ES Rural NGA combination 13.0% 6.6% -6.4% Recalculated based on new data.
SE Total VDSL 9.8% 16.7% 6.9% New data provided
SE Total FTTP 34.8% 46.2% 11.4% New data provided
SE Total Standard cable 31.3% 36.8% 5.5% New data provided
SE Total Docsis 3 26.3% 31.0% 4.7% New data provided
SE Total LTE 47.8% 48.1% 0.3% New data provided
SE Total NGA combination 61.1% 53.4% -7.7% Recalculated based on new data provided
SE Total Standard fixed combination
98.6% 98.1% -0.7% Recalculated based on new data provided
CH Since the publication of the data for 2011, Swiss Statistics updated their population estimates – this updated data has been used to restate the coverage for the end of 2011.
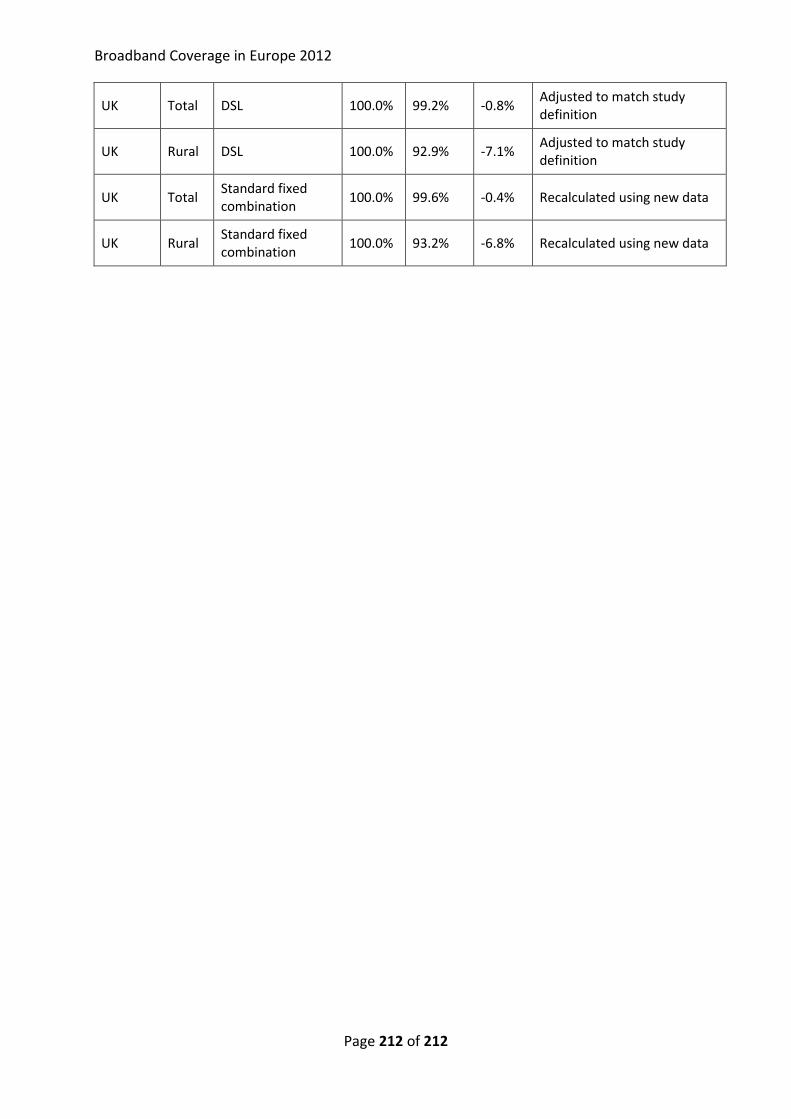
Broadband Coverage in Europe 2012
Page 212 of 212
UK Total DSL 100.0% 99.2% -0.8% Adjusted to match study definition
UK Rural DSL 100.0% 92.9% -7.1% Adjusted to match study definition
UK Total Standard fixed combination
100.0% 99.6% -0.4% Recalculated using new data
UK Rural Standard fixed combination
100.0% 93.2% -6.8% Recalculated using new data