Brüel & Kjær pulse analyzers and...
84
Brüel & Kjær PULSE ANALYZERS AND SOLUTIONS
Transcript of Brüel & Kjær pulse analyzers and...

Brüel & Kjær
pulse analyzers and solutions

2
7700
/70/
71
FFT
and
CPB
An
alys
is77
05
Tim
e C
aptu
re77
08
Tim
e D
ata
Rec
ord
er77
09
Vie
wer
Lic
ense
8700
R
eflex
Bas
e87
01
Refl
ex D
ata
Vie
wer
87
02
Refl
ex B
asic
Pro
cess
ing
8703
R
eflex
Ad
van
ced
Pro
cess
ing
87
04
Refl
ex O
rder
An
alys
is87
05
Refl
ex A
dva
nce
d O
rder
An
alys
is
8706
R
eflex
Sta
nd
ard
ised
CPB
Op
tio
n87
10
Refl
ex S
ou
nd
Qu
alit
y M
etri
csB
Z-56
10
CA
N B
us
7767
PU
LSE
Dat
a M
anag
er
7789
PU
LSE
Tim
e77
96
Au
tom
oti
ve T
est
Man
ager
86
05
ASA
M-O
DS
Op
tio
n
pulse software
3644 NVH Vehicle Simulator7698 Sound Quality7752 Noise Source Identification7758 Acoustic Material Testing7759 Advanced Intensity Analysis7761 Acoustic Test Consultant7788 Vehicle Pass-by7793 Indoor Pass-by7799 Sound Power8606 Array Acoustics Spherical
Beamforming8607 Array Acoustics Acoustic Holography8608 Array Acoustics Beamforming8780 Reflex Building AcousticsBZ-5635 Array Acoustics Quasi-stationary
Calculations
BZ-5636 Array Acoustics Transient CalculationsBZ-5637 Array Acoustics Conformal CalculationsBZ-5638 Array Acoustics
Metrics CalculationsBZ-5639 Array Acoustics Refined Beamforming
CalculationsBZ-5640 Array Acoustics Panel ContributionBZ-5641 Array Acoustics Intensity Component
AnalysisBZ-5642 Array Acoustics In Situ AbsorptionBZ-5939 Array Acoustics Rail Vehicle Moving Source
BeamformingBZ-5943 Array Acoustics Road Vehicle Moving Source
BeamformingBZ-6047 Automotive Sound Quality
Acoustics
7702 Order Analysis7703 Vold-Kalman Order Tracking Filter7773 Envelope Analysis
7790 Multi-plane Balancing Consultant7795 Vibration Check for Aircraft Engines8740 Reflex Angle Domain Analysis
MAchine DiAgnostics
7753 Modal Test Consultant™7765 ODS Test Consultant7754 ME’scopeVES™ Post-test Analysis7755-A Bridge to ME’scope7760 Operational Modal Analysis7764 Multiple-Input Multiple-Output Analysis8718 Reflex Finite Element Interfaces
8719 Reflex Geometry8720 Reflex Modal Analysis 8721 Reflex Advanced Modal Analysis 8722 Reflex Correlation Analysis 8730 Reflex Shock Response AnalysisBZ-8527 Batch Processing for OMA Pro
structurAl DynAMics
6712 Telephone Test on PULSE7797 Basic Electroacoustics
8770 Reflex Telephone TestBZ-5137 Telephone Test
electroAcoustics
7798 Source Path Contribution
VibroAcoustics
Puls
e Pl
Atf
or
M
test
An
D D
AtA
MA
nA
geM
ent

3www.bksv.com/pulse
content PULSE SOFTwARE . . . . . . . . . . . . . . . . . . . . . . . . . . . . . . . . . . . . . . . . . . . . . . . . . . . . . . . . . . . . . . . . . . . . . . . . . . . . . . . . . . . . . . . 2 wELCOME . . . . . . . . . . . . . . . . . . . . . . . . . . . . . . . . . . . . . . . . . . . . . . . . . . . . . . . . . . . . . . . . . . . . . . . . . . . . . . . . . . . . . . . . . . . . . 4 LAN-XI DATA ACQUISITION HARDwARE FOR PULSE . . . . . . . . . . . . . . . . . . . . . . . . . . . . . . . . . . . . . . . . . . . . . . . . . . . . . . . . . . . 5 case study – FERRARI S .P .A . – SCUDERIA FERRARI . . . . . . . . . . . . . . . . . . . . . . . . . . . . . . . . . . . . . . . . . . . . . . . . . . . . . . . . . . 6
analyzers PULSE SOLUTIONS . . . . . . . . . . . . . . . . . . . . . . . . . . . . . . . . . . . . . . . . . . . . . . . . . . . . . . . . . . . . . . . . . . . . . . . . . . . . . . . . . . . . . . 7 PULSE REAL-TIME DATA ACQUISITION . . . . . . . . . . . . . . . . . . . . . . . . . . . . . . . . . . . . . . . . . . . . . . . . . . . . . . . . . . . . . . . . . . . . . . 8 PULSE BASIC ANALyZERS . . . . . . . . . . . . . . . . . . . . . . . . . . . . . . . . . . . . . . . . . . . . . . . . . . . . . . . . . . . . . . . . . . . . . . . . . . . . . . . . 10 TIME DATA RECORDING AND POST-PROCESSING . . . . . . . . . . . . . . . . . . . . . . . . . . . . . . . . . . . . . . . . . . . . . . . . . . . . . . . . . . . . . 12 case study – CONTINENTAL TESTS PULSE REFLEX . . . . . . . . . . . . . . . . . . . . . . . . . . . . . . . . . . . . . . . . . . . . . . . . . . . . . . . . . 14 PULSE REFLEX CORE . . . . . . . . . . . . . . . . . . . . . . . . . . . . . . . . . . . . . . . . . . . . . . . . . . . . . . . . . . . . . . . . . . . . . . . . . . . . . . . . . . . . 16
data ManageMent NVH TESTING . . . . . . . . . . . . . . . . . . . . . . . . . . . . . . . . . . . . . . . . . . . . . . . . . . . . . . . . . . . . . . . . . . . . . . . . . . . . . . . . . . . . . . . . . 18 DATA MANAGEMENT – SOUND AND VIBRATION . . . . . . . . . . . . . . . . . . . . . . . . . . . . . . . . . . . . . . . . . . . . . . . . . . . . . . . . . . . . 19 case study – CHRISTIE DIGITAL SySTEMS CANADA INC . . . . . . . . . . . . . . . . . . . . . . . . . . . . . . . . . . . . . . . . . . . . . . . . . . . . . . 20
acoustics SOUND POwER . . . . . . . . . . . . . . . . . . . . . . . . . . . . . . . . . . . . . . . . . . . . . . . . . . . . . . . . . . . . . . . . . . . . . . . . . . . . . . . . . . . . . . . . 22 case study – THE RENAULT GROUP . . . . . . . . . . . . . . . . . . . . . . . . . . . . . . . . . . . . . . . . . . . . . . . . . . . . . . . . . . . . . . . . . . . . . 24 NSI – ARRAy BASED . . . . . . . . . . . . . . . . . . . . . . . . . . . . . . . . . . . . . . . . . . . . . . . . . . . . . . . . . . . . . . . . . . . . . . . . . . . . . . . . . . . . 26 NSI – INTENSITy MAPPING . . . . . . . . . . . . . . . . . . . . . . . . . . . . . . . . . . . . . . . . . . . . . . . . . . . . . . . . . . . . . . . . . . . . . . . . . . . . . . . 29 case study – EPA wIND FARM PROjECT . . . . . . . . . . . . . . . . . . . . . . . . . . . . . . . . . . . . . . . . . . . . . . . . . . . . . . . . . . . . . . . . . 30 ACOUSTICAL APPLICATIONS FOR wIND TURBINES . . . . . . . . . . . . . . . . . . . . . . . . . . . . . . . . . . . . . . . . . . . . . . . . . . . . . . . . . . . 32 ACOUSTIC MATERIAL TESTING . . . . . . . . . . . . . . . . . . . . . . . . . . . . . . . . . . . . . . . . . . . . . . . . . . . . . . . . . . . . . . . . . . . . . . . . . . . 34 case study – ISUZU – IMPROVING THE SOUND QUALITy OF DIESEL ENGINES . . . . . . . . . . . . . . . . . . . . . . . . . . . . . . . . . . . 36 SOUND QUALITy . . . . . . . . . . . . . . . . . . . . . . . . . . . . . . . . . . . . . . . . . . . . . . . . . . . . . . . . . . . . . . . . . . . . . . . . . . . . . . . . . . . . . . 38 VEHICLE PASS-By NOISE TESTING . . . . . . . . . . . . . . . . . . . . . . . . . . . . . . . . . . . . . . . . . . . . . . . . . . . . . . . . . . . . . . . . . . . . . . . . . 40 INDOOR PASS-By NOISE TESTING . . . . . . . . . . . . . . . . . . . . . . . . . . . . . . . . . . . . . . . . . . . . . . . . . . . . . . . . . . . . . . . . . . . . . . . . . 42 NVH SIMULATOR . . . . . . . . . . . . . . . . . . . . . . . . . . . . . . . . . . . . . . . . . . . . . . . . . . . . . . . . . . . . . . . . . . . . . . . . . . . . . . . . . . . . . . 44 BUILDING ACOUSTICS . . . . . . . . . . . . . . . . . . . . . . . . . . . . . . . . . . . . . . . . . . . . . . . . . . . . . . . . . . . . . . . . . . . . . . . . . . . . . . . . . . 46 VIBRATION CHECK FOR AIRCRAFT ENGINES . . . . . . . . . . . . . . . . . . . . . . . . . . . . . . . . . . . . . . . . . . . . . . . . . . . . . . . . . . . . . . . . . 47 ANGLE DOMAIN ANALySIS . . . . . . . . . . . . . . . . . . . . . . . . . . . . . . . . . . . . . . . . . . . . . . . . . . . . . . . . . . . . . . . . . . . . . . . . . . . . . . 48 Vibroacoustics TIME DOMAIN SOURCE PATH CONTRIBUTION . . . . . . . . . . . . . . . . . . . . . . . . . . . . . . . . . . . . . . . . . . . . . . . . . . . . . . . . . . . . . . . 50
electroacoustics ELECTROACOUSTIC TESTING . . . . . . . . . . . . . . . . . . . . . . . . . . . . . . . . . . . . . . . . . . . . . . . . . . . . . . . . . . . . . . . . . . . . . . . . . . . . . 52 TELEPHONE TESTING . . . . . . . . . . . . . . . . . . . . . . . . . . . . . . . . . . . . . . . . . . . . . . . . . . . . . . . . . . . . . . . . . . . . . . . . . . . . . . . . . . . 54
Machine diagnostics case study – NANjING HIGH SPEED GEAR MANUFACTURING CO ., LTD . . . . . . . . . . . . . . . . . . . . . . . . . . . . . . . . . . . . . . . . . 56 ORDER ANALySIS . . . . . . . . . . . . . . . . . . . . . . . . . . . . . . . . . . . . . . . . . . . . . . . . . . . . . . . . . . . . . . . . . . . . . . . . . . . . . . . . . . . . . . 58 MACHINE DIAGNOSTICS . . . . . . . . . . . . . . . . . . . . . . . . . . . . . . . . . . . . . . . . . . . . . . . . . . . . . . . . . . . . . . . . . . . . . . . . . . . . . . . . 60 BALANCING . . . . . . . . . . . . . . . . . . . . . . . . . . . . . . . . . . . . . . . . . . . . . . . . . . . . . . . . . . . . . . . . . . . . . . . . . . . . . . . . . . . . . . . . . . . 61 structural dynaMics case study – UNIVERSITy OF wINDSOR, CANADA – MODAL ANALySIS AND PULSE REFLEX . . . . . . . . . . . . . . . . . . . . . . . 62 MODAL ANALySIS . . . . . . . . . . . . . . . . . . . . . . . . . . . . . . . . . . . . . . . . . . . . . . . . . . . . . . . . . . . . . . . . . . . . . . . . . . . . . . . . . . . . . 64 SHOCK RESPONSE SPECTRUM ANALySIS . . . . . . . . . . . . . . . . . . . . . . . . . . . . . . . . . . . . . . . . . . . . . . . . . . . . . . . . . . . . . . . . . . . 67 case study – DCTA – THE DEPARTMENT OF AEROSPACE SCIENCE AND TECHNOLOGy . . . . . . . . . . . . . . . . . . . . . . . . . . . . 68 OPERATIONAL MODAL ANALySIS . . . . . . . . . . . . . . . . . . . . . . . . . . . . . . . . . . . . . . . . . . . . . . . . . . . . . . . . . . . . . . . . . . . . . . . . . 70 OPERATING DEFLECTION SHAPES . . . . . . . . . . . . . . . . . . . . . . . . . . . . . . . . . . . . . . . . . . . . . . . . . . . . . . . . . . . . . . . . . . . . . . . . . 72 TEST-FEA INTEGRATION . . . . . . . . . . . . . . . . . . . . . . . . . . . . . . . . . . . . . . . . . . . . . . . . . . . . . . . . . . . . . . . . . . . . . . . . . . . . . . . . . 74
Verification and reliability PRODUCTION TESTING . . . . . . . . . . . . . . . . . . . . . . . . . . . . . . . . . . . . . . . . . . . . . . . . . . . . . . . . . . . . . . . . . . . . . . . . . . . . . . . . . . 76 case study – PRODUCTION QUALITy TESTING FOR wORLDwIDE MANUFACTURING . . . . . . . . . . . . . . . . . . . . . . . . . . . . . 77 VIBRATION TEST AND CONTROL . . . . . . . . . . . . . . . . . . . . . . . . . . . . . . . . . . . . . . . . . . . . . . . . . . . . . . . . . . . . . . . . . . . . . . . . . . 78 wORLDwIDE SERVICE AND SUPPORT . . . . . . . . . . . . . . . . . . . . . . . . . . . . . . . . . . . . . . . . . . . . . . . . . . . . . . . . . . . . . . . . . . . . . . 80
PULSE HARDwARE . . . . . . . . . . . . . . . . . . . . . . . . . . . . . . . . . . . . . . . . . . . . . . . . . . . . . . . . . . . . . . . . . . . . . . . . . . . . . . . . . . . . . 82

4
the Whole MeasureMent chain
Brüel & Kjær delivers advanced tech-
nological solutions and products of re-
nowned quality . These cover the entire
sound and vibration measurement chain,
from a single transducer to complete
turnkey systems .
Products
Our market-leading product portfolio
covers all of the components and tools
required for high-quality measurement
and analysis of sound and vibration . we
are unique in the industry, allowing you
to source all of your components from
one supplier .
systeMs
Our products are designed to fit together
and cooperate intelligently . This simpli-
fies the process of creating systems that
are optimised to solve your specific issues .
solutions
In certain instances, we supply both the
systems themselves and highly skilled
engineers to operate them and supply
analysis results, meaning you can focus
on your core business without worrying
about operating and maintaining equip-
ment .
serVices
we offer a full range of services for our
products and systems including: installa-
tion, training, support, software updates,
calibration, planned maintenance, repair
and rental .
Quality assurance
All products, systems and solutions are
thoroughly tested in harsh environ-
mental conditions . Our status as an ISO
9001-certified company gives you the
peace of mind that extremely high stand-
ards are met in all aspects of our products
and services .
custoMer driVen
Our most important skill is listening to
the challenges customers meet in their
work processes, where increasing func-
tional demands, time pressures, regulato-
ry requirements and budget constraints
mean that getting it right the first time
is becoming ever more critical . Receptive
dialogue allows us to fully understand
specific customer needs and develop
long-term sound and vibration solutions .
Responding to the challenges faced
by our customers has lead us to cover a
diverse range of applications including:
traffic and airport noise, car engine vi-
bration, evaluation of building acoustics,
cabin comfort in passenger aeroplanes,
production quality control, and wind tur-
bine noise . Over the years, we have devel-
oped creative and technically advanced
solutions to innumerable customer prob-
lems, some of which you can see on our
website at: www.bksv.com/casestudies.
local access to a global
organisation
Brüel & Kjær is a global company . we
operate through our network of sales of-
fices and representatives in 55 countries .
These local teams are supported by our
global group of engineering specialists,
who can advise on and solve all manner
of sound and vibration measurement and
analysis problems . To augment our ser-
vice, we regularly hold courses and road-
shows, and participate in sound- and
vibration-focused exhibitions and confer-
ences worldwide .
welcomeBrüel & Kjær supplies integrated solutions for the measurement and analysis of sound and vibration. as a world-leader in sound and
vibration measurement and analysis, we use our core competencies to help industry and governments solve their sound and vibration
challenges, leaving them free to concentrate on their primary tasks: efficiency in commerce and administration.
Our MissiOn is to help our customers measure and manage the quality of sound and vibration in their products and in the environment.
Our VisiOn is to be the first-choice and long-term business partner, delivering innovative technical solutions which create sustainable
value for our customers.

5www.bksv.com/pulse
lan-Xi data acQuisition Hardware for pulselan-Xi data acquistion Hardware is a versatile data acquisition system of modular units. every module can be
used individually as a smaller system front-end, or become part of a distributed-module setup. lan-Xi is fully
compatible with our older idae hardware, and works with both pulse™ and test for i-deas software platforms.
one PlAtforM is All you neeD
The simplest setups and the most
complex systems are all possible
with LAN-XI, which is based on
independent front-end modules .
These work independently or
combined with others, so you can
easily add more modules to ex-
pand your system, and can divide
and distribute it as necessary .
one cAble oPerAtion
The only cable you need is the
network cable – a standard
LAN cable that is used for both
power and data transfer . This is
especially useful in distributed
systems, making large and con-
fusing cable bundles a thing of
the past, and bringing valuable
installation flexibility .
QuAlity MeAsure-Ments the first tiMe
Our unique Dyn-X technology
avoids overloads and level-set-
ting runs . It gives a market-lead-
ing, 160 dB dynamic range that
means LAN-XI is always ready to
capture your measurements .
Overload and cable-break de-
tection mechanisms ensure
there is little risk of ever need-
ing to re-take measurements,
while user-friendly features
minimise human errors .
interchAngeAble front PAnels
A unique feature of the LAN-XI
modules are the interchange-
able front panels which enable
you to quickly adapt to the ca-
bles or transducers required for
your task .
built for fielD AnD lAb use
Small and tough, LAN-XI mod-
ules are made of cast magne-
sium and can withstand being
dropped, shaken and subjected
to demanding environmental
conditions .
The interchangeable front pan-
els are easy to replace should
connectors become damaged .

66
scuderia ferrari was founded by enzo fer-rari over 80 years ago in Modena. the orig-inal name is, still today, the name of the racing team division of ferrari s.p.a.
scuderia ferrari recently invested in a 6-channel Pulse lan-Xi data acquisition system. this is mainly used for engine test bench balancing, a major issue when fer-rari’s formula one engines run at up to 20000 rPM.
ferrari – speed, performance, prestigeItalian sports car manufacturer Ferrari was founded in Modena by Enzo Ferrari in 1929 as Scuderia Ferrari . Originally, the main aim of the company was to allow owner-drivers to race . In time, it became a technical-racing out-post of Alfa Romeo and took over as its racing department in 1933 . In 1939, Enzo Ferrari left Alfa Romeo and opened Auto Avio Costruzioni in Modena at the headquarters of the old Scu-deria Ferrari . In 1943, Auto Avio Costruzioni moved to Maranello where the first part of what would become the Ferrari factory was built and in 1946, the company started to de-sign and build the first Ferrari . In 1960, Ferrari became a Limited Liability Company in which Fiat became a 50-50 partner in 1969 .
Maranello, a town in northern Italy, near Modena, has been home to Scuderia Ferrari and Ferrari’s road car factory since the 1940s . At more than 250,000m2, the factory’s 45 build-ings house more than 3000 workers . It is here that passion, innovation and technology com-bine to create the company’s GT and Formula One cars . The team owns and operates a test track on the same site, the Fiorano Circuit built in 1972, which is used for testing road and race cars . Although the costs involved in Formula One are phenomenally high, motor racing is, and always has been, part of Ferrari’s DNA and Ferrari’s road cars benefit not only from the brand image of the racing cars but also from the unique technical expertise gained from Formula One racing .
getting the right balancewith Formula One cars, vibration is a critical is-sue . Under new FIA rules (Federation Interna-tionale de L’Automobile), and in order to dou-ble engine life, each driver is only allowed to use a maximum of eight engines per season plus a total of four for testing (that is, 20 per Formula One team) and each engine is expect-ed to run for more than 2000 km . Testing has also been strictly limited and no in-season test-ing is allowed except during race weekends during scheduled practice .
Balancing and vibration have therefore taken on new importance . Imbalance is the most com-mon source of vibration in engines . It is a very important factor to be considered in modern engine design, especially where high speed and reliability are significant considerations . By re-ducing these vibrations, deterioration of the en-gine and, ultimately, fatigue failure can be avoided . This can be done by balancing the crankshaft where masses are added or removed at certain positions in a controlled manner . Im-portant factors in modern engine design are dic-tated by increasing speeds, higher performance/weight ratios and enhanced reliability . Balanc-ing leads to more optimal design, superior per-formance, and increased safety and reliability .
Scuderia Ferrari works closely with Centro Ricerche Fiat S .C .p .A . (CRF) – Fiat Group’s major source of expertise in innovation, research and development – to establish targets on vibra-tion that are very important for engine and powertrain development . Consequently, a lot of durability testing is done in a dynamometer test cell (which can simulate the world’s For-mula One race tracks, including time history, torque, RPM, etc .) and the test results com-pared to actual data taken from a car on the test track .
Scuderia Ferrari recently invested in a 6-channel PULSE LAN-XI module with Multi-plane Balancing software for test bench bal-ancing of their Formula One engines . In addi-tion to the PULSE LAN-XI system with its real-time capabilities for FFT analysis, order tracking and time-data recording on unlimited channels, Scuderia Ferrari also acquired two sets of Brüel & Kjær’s PULSE Reflex™ Core for post-processing .
In the past, Ferrari appointed a third party for this balancing task, which was carried out one plane at a time . with the new system they can save substantial time and money as a Fer-
rari engineer now does the task every time a test bench needs to be checked or shows bal-ancing issues . Furthermore, Ferrari can now perform two-plane and multi-plane balancing .
The intention is to evaluate the possibility of implementing the PULSE data acquisition and analysis system as the de facto vibration analysis platform for the Ferrari Formula One team . Fer-rari’s relationship with Brüel & Kjær goes back 30 years and they have a huge installed base of Brüel & Kjær transducers and conditioning am-plifiers including many piezoelectric charge ac-celerometers – Types 4393 and 4326-A – and several CCLD accelerometers including Types 4520, 4525-B and 4526-HT . The accelerometers are mainly used for vibration testing of Formula One engines . In addition, Ferrari has used Type 2634 charge amplifiers connected to Type 4393 accelerometers for vibration testing on Formula One cars for many years .
driver/pit communicationA second PULSE system including a Brüel & Kjær Head and Torso Simulator Type 4128 with built-in mouth simulator and calibrated ear simulators is used at Scuderia Ferrari to test the radio communication link between the racing driver and the engineers at the pit . Drivers are
exposed to 140 dB(A), which is equivalent to a jet engine taking off, and miniature loud-speakers are built into special silicone earplugs that protect the driver’s hearing while, at the same time, allowing him to listen to messages from the pit lane via the radio link . The PULSE-based solution tests speech intelligibility to evaluate and ensure reliable communication in these highly adverse conditions .
the futureThe engineer in charge of Ferrari Formula One track testing will soon evaluate NOTAR™, a multi-channel LAN-XI data acquisition front-end that allows time data recording on up to 12 channels on each module, without connection to a PC but directly onto an SDHC card . This is intended to replace an existing system for data acquisition on the full vehicle and will also in-clude subsequent post-processing with PULSE Reflex .
Brüel & Kjær looks forward to continuing the long relationship with Scuderia Ferrari and our aim is to continue to add value by providing cutting-edge technologies, efficient support, professional service and cooperation with Scu-deria Ferrari’s exceptional engineers .
case study
ferrari s.p.a. – scuderia ferrari
Phot
o co
urte
sy o
f Fer
rari
S.p.
A.

7www.bksv.com/pulse
PULSE LabShop real-time analysis
LAN-XI Stand-alone recorder – NOTAR
Transducers
PULSE Reflex post-processing and analysis
LAN-XI Data Acquisition Hardware
PULSE Time Data Recorder
pulse is Brüel & Kjær’s platform for noise and
vibration analysis.
pulse is probably the most popular analyzer
solution in the world, with over 11,000 systems
sold, with a vast range of software applications
and hardware configurations. pulse is a truly
mature product, building on over 70 years of
measurement experience and innovation.
our industry-leading lan-Xi data acquisi-
tion Hardware naturally teams up with pulse
to make an unbeatable combination. real-time
measurement and analysis, intuitive time-data
acquisition, and powerful post-processing
are complemented with optional embedded-
recording capabilities.
many different possible workflows are
supported, from ad hoc troubleshooting to
targeted performance optimisation, across ap-
plications as diverse as telephone testing and
wind turbine sound estimation.
for highly customised solutions, pulse
supports remote control through VBa and
other high-level programming languages. and
as an open solution, pulse has the capability
to import and export data from a multitude
of sources in many different formats. raw and
analysed data can be stored in multi-user da-
tabases with embedded metadata, or through
industry standards like asam-ods.
no matter what your needs may be, pulse
offers an attractive solution.
pulse solutionsPulse solutions

8
pulse real-time data acQuisition Pulse PlatforM
at the heart of a pulse system lie pulse labshop
and pulse reflex core, which are the main data ac-
quisition and post-processing components.
Pulse labshoP
our well-established flagship for real-time data acqui-
sition from 2 to 1000+ channels. equipped to perform
fundamental analysis software tasks as standard, it is
limited only by the computer running it.
pulse labshop is the real-time acquisition and
multi-analysis platform for many of the other pulse
solutions presented in this catalogue. By itself, pulse
labshop is one of the most popular stand-alone re-
cording, fft, cpB and order analyzers in the world,
with more than 11,000 installations to date.
pulse labshop is built on:
f powerful analysis capabilities
f multi-analysis
f Best-in-class real-time performance
f customisation and programmability
f modular data acquisition hardware – lan-Xi
solid foundation
the flexibility of pulse, combined with its indus-
try-specific solutions, has made it the best-selling
analyzer platform in a wide range of industries,
including:
f automotive
f electroacoustics
f telecommunications
f aerospace and defence
f consumer products
Powerful AnAlysis cAPAbilities
Standard PULSE LabShop analysis tools are:
f FFT analysis
f CPB real-time 1/n-octave analysis
f Order tracking analysis
f Envelope analysis
f Cepstrum analysis
f Steady-state response (SSR) analysis
f Time-capture analysis
f Time data recording option
Multi-AnAlysis
Since most tests can only be run once with the same conditions,
with PULSE LabShop’s multi-analysis capability you can:
f Capture test data and run it through PULSE LabShop’s multi-
ple analyzers in parallel
f Combine any kind of analysis and recording tools to analyse
your data simultaneously, based on the same raw time-data
samples
f Display consistent results in real-time
f Get immediate confidence in the achieved test results .
f Save significant time
Multi-analysis capability is a great strength of PULSE LabShop .
Pulse reAl-tiMe DAtA AcQuisition

9www.bksv.com/pulse
pulse real-time data acQuisition best-in-clAss reAl-tiMe PerforMAnce
PULSE LabShop continuously keeps pace with advances
in computing power, adapting to get the most from your
PC’s performance .
f Runs on Microsoft® windows® 32-bit and 64-bit
operating systems
f Allows use of standard office PCs for measurement
tests
f Analyses typically 160 FFT signals or 80 CPB signals
up to 25 kHz
f Achieves extremely high real-time performance with
high-end PCs and LAN switches
f Analyses 320-channel data up to a 50 kHz bandwidth
/ 131 kHz sampling frequency .
custoMisAtion AnD ProgrAMMAbility
Versatile and highly customisable, PULSE LabShop can be
tailored to your needs . Its built-in ‘Smart Start’ concept:
f Eases the setup of new analyses
f Automatically presents the results on screen
f Stores often-used setup and results views for recall
at the push of a button
PULSE LabShop includes an extensively programmable
interface .
f PULSE LabShop integrates with your application, test
cells and third-party solutions
f Built-in VBA (Visual Basic® for Applications) allows
easy customisation
f Supports Microsoft® Visual Studio® environment
(C++, C#, Visual Basic® .NET, as well as MATLAB®)
MoDulAr DAtA AcQuisition hArDwAre
LAN-XI Data Acquisition Hardware is a versatile system
of modular units . Every module can:
f Be used individually as a small system front-end with
up to 12 channels (depending on module)
f Become part of a distributed-module setup con-
nected via LAN
f Be arranged with many others in convenient racks to
make systems of any size
LAN-XI features:
f Dyn-X technology, which eliminates the need for
input ranging giving a single measuring range of
160 dB
f Interchangeable front-end panels
Integrated system features include:
f Cable-break detection
f Automatic transducer identification using TEDS
(IEEE 1451 .4)
f Automatic calibration sequence for transducers
Scan here to see a video of a large satellite test system:
Pulse reAl-tiMe DAtA AcQuisition

Basic 2-channel FFT measuring sound and vibration, with time monitor and colour contour plot showing vibration levels vs. time and delta cursor readout
Pulse basic analyzers
at the core of pulse are a series of basic analyzers
that represent the beating heart of any pulse system.
our pulse Basic analyzer solutions contain all
you need for simple sound and vibration tests, op-
erating competently as stand-alone applications.
they are easily expanded to fit larger, industry-
specific solutions.
basic fft analyzer
simple, real-time fft analysis is available from
2+ channels for mobility measurements, vibration
diagnostics, or narrow-band analysis of acoustic
signals, featuring:
f autospectrum and cross-spectrum
f waterfall spectrum
f resonance and damping estimation
f Harmonic and side-bands detection
f pure tone detection and sound intensity
f zoom fft
f cepstrum analysis
basic cPb 1/n octaVe analyzer
real-time, constant percentage Bandwidth (cpB)
standardised digital filter-based analysis using 1/1,
1/3, 1/12 and 1/24 octaves for analysing noise,
determining sound power levels, measuring sound
intensity, and monitoring machine vibration. Basic
cpB 1/n-octave analysis is available from 2+ chan-
nels, featuring:
f sound level meter – octave spectrum
f leq logging – sound levels vs. time
f sound intensity – pure tone location while
measuring
f reverberation time calculation – using a loud-
speaker or gunshot
f machine vibration level monitoring – including
pass/fail tolerance check
pulse multi-analysis allows you to combine fft
and cpB analysis and recording tools to analyse
your data simultaneously and display consistent
results in real-time.
pulse Basic analyzersbAsic 2-chAnnel fft AnAlyzer
7770-n2
f Smart Start – a quick, three-step start-up guide
f FFT resolution up to 6400 lines
f FFT analysis bandwidth standard up to 50 kHz (or higher
depending on LAN-XI hardware module used)
f Multi-buffer spectrum logging
f Triggered FFT analysis
f Exponential and linear averaging
f Time-averaging signal enhancement
f Frequency weighting: A, B, C, and D
f Integration and differentiation
Pulse bAsic AnAlyzers

www.bksv.com/pulse 11
Basic 2-channel CPB comparing 1/3-octave analysis from the engine’s sound with detailed 1/24-octave analysis from the engine’s real-time vibration levels
Basic FFT and CPB analyzer featuring easy setup using Smart Start, spreadsheet -type table, overall level monitor giving a quick overview of all channels, and easy data comparison in customisable displays
Basic FFT including overal level meter and time-and-speed monitor, comparing sound and vibration FFT results in one plot for observing vibro-acoustic effects
bAsic 6-chAnnel fft AnAlyzer
7770-n6
f Contains all features of 2-channel FFT analyzer
f Dyn-X technology, which eliminates the need for
input ranging, giving a single measuring range of
160 dB
f Ultra-compact system
f Uses one LAN-XI module
Optional:
f More than 7 hours of autonomous use with LAN-XI
Battery Module Type 2831-A add-on
f Expandable with Time Data Recorder Type 7708
bAsic 2-chAnnel cPb AnAlyzer
7771-n2
f Smart Start – quick three-step start-up guide
f CPB 1/n-octave analysis up to 1/24-octave
f Multi-buffer spectrum logging
f Linear - Leq logging
f Exponential averaging – including slow and fast
f Exponential confidence level averaging for accurate
measurements
f Exponential minimum and maximum hold
f Gated CPB analysis
f Frequency weighting A, B, C and D
bAsic fft AnD cPb AnAlyzer
7700-n, unliMiteD chAnnels
f Portable system combining the best of two worlds
f Up to 60 channels in one portable LAN-XI C-Frame
module rack
f Multi-analysis allows you to use FFT and CPB analysis
simultaneously
f The foundation for a multi-channel system
f Based on modular LAN-XI Data Acquisition Hardware
Optional:
f Up to 3 hours of autonomous use with LAN-XI
Battery Module Type 2831-A added to LAN-XI C- or
D-frame module rack
f Expandable with Time Data Recorder Type 7708
pulse Basic analyzersPulse bAsic AnAlyzers

12
recording time data and then post-processing the
results allows you to decide the analysis parame-
ters later and manipulate the raw data at leisure. in
circumstances such as troubleshooting – when the
exact nature of a problem is unknown – important
information in the results can otherwise be missed
due to the assumptions made when setting up the
analyzer.
time data acquisition and post-processing can
also be essential when real-time analysys are im-
possible due to the number of measurement chan-
nels required, even with the continuing in creases in
computing power.
while recording data, the flexibility of pulse
time data re corder allows you to transfer data to
another computer or server for post-processing and
analysis. pulse time data re corder allows record-
ing and analysing data on separate computers, or
combining computers into one system as a meas-
urement and analysis work station, to further opti-
mise processing capability.
the flexibility of the lan-Xi data acquisition
Hardware platform allows configuration of any
recording solution from 2 to 300 channels, for
mobile or lab-based use. Battery- and dc-powered
options combined with lan connection to the host
pc provide maximal efficiency and minimal test
setup time.
post-processing is easy to perform in pulse re-
flex – our intuitive post-processing software.
time data recording and post-processingtiMe DAtA recorDer – 12 inPuts
7708-n, 1 MoDule
A compact, battery-operated acquisition system with 12 dynam-
ic channels . This is an ideal for unit for benchmarking measure-
ments, with a battery life of up to 8 hours .
tiMe DAtA recorDer – 60 inPuts
7708-n, 1 frAMe
A highly flexible, battery-powered unit with 60 dynamic chan-
nels providing the ultimate in mobile data acquisition .
PULSE Time Data Recorder with level meter and level history for monitoring during data acquisition
tiMe DAtA recorDing AnD Post-Processing

www.bksv.com/pulse 13
050110/5
8700 PULSE Reflex Base
8702 PULSE Reflex Basic Processing
8704 PULSE Reflex Basic Order Analysis
8706 PULSE Reflex Standardized CPB Option
WAV file for 3rd party use
SD card for storage
LAN
LAN
PULSE Data Recorder
PULSE LAN-XI Stand-alone Recorder
PULSE Post-processing
BZ-7848-A
7708 Time Data Recorder
tiMe DAtA recorDer – 320 inPuts
7708-n, MultiPle frAMes
The premier DC- or battery-powered solution is custom
built for data acquisition uses requiring a large number
of dynamic channels .
lAn-Xi stAnD-Alone recorDer
bz-7848-A
LAN-XI Notar™ adds solid-state stand-alone recording
capabilities to one of your existing LAN-XI modules,
which is controllable via the web or the module’s built-
in interface . Supports TEDS for fast setup time, and fea-
tures long battery life for extended recording periods .
time data recording and post-processing
PULSE Time Data Recorder with a level meter indicating overload occurrences and coloured level history keeping track of optimal dynamic range selection
PULSE Time Data Recorder with a time/FFT channel monitor, allowing users to listen to all the channels while the recording is in progress
PULSE Time Data Recorder showing FFT monitor and a tachometer with RPM readout and speed profile
tiMe DAtA recorDing AnD Post-Processing

14
Tyre assembly at the factory in Hannover-Vahrenwald, 1921
When brüel & Kjær needed assistance dur-ing the beta development phase of the post-processing platform Pulse reflex, getting continental’s input was a high pri-ority. for continental ag’s nVh engineer-ing department it was an opportunity to ‘try before you buy’, so they set about comparing the results between their exist-ing Pulse labshop real-time analysis plat-form and the new post-processing plat-form Pulse reflex – which turned out to be even better than they expected.
the company The Continental Corporation is based in Han-nover, Germany and is divided into the Rubber Group and the Automotive Group (Continental AG) . with approximately 2000 tyre retailers and franchises in 15 European countries includ-ing various retail organisations, Continental ranks among the top five automotive suppliers worldwide .
Continental AG (the Automotive Group) is a world-leading manufacturer of tyres, brake systems, vehicle stability control systems, en-gine injection systems, tachographs and other parts for the automotive and transport indus-tries . It achieved sales of approximately €16 bil-lion in 2010 .
Continental AG’s three divisions – Chassis & Safety, Powertrain and Interior – employ around 87,000 people in more than 170 loca-tions worldwide, with NVH centres in the USA, Malaysia and Europe, and a new R&D centre in Shanghai . The famous tyre business is run as a separate unit of Continental AG, and is the world’s fourth largest tyre manufacturer after Bridgestone, Michelin and Goodyear .
historyContinental was founded in Hannover in 1871, as the stock corporation “Continental-Caou-tchouc- und Gutta-Percha Compagnie” . At that time, manufacturing at the main factory in Hannover included soft rubber products, rub-berised fabrics, and solid tyres for carriages and bicycles . with an impressive string of firsts, Continental has remained at the cutting edge of tyre development ever since .
1898 – Production of automobile pneumatic tyres with a plain tread 1900 – Continental balloon fabric seals the gas cells of the first German airship1904 – Develops the first grooved tyres for au-tomobiles in the world1905 – Commences production of riveted anti-skid tyres1909 – French aviator Louis Blériot becomes the first person to fly across the English Chan-nel, with Continental Aeroplan material cover-ing the flying surfaces of his monoplane1951 – Continental commences production of steel-cord conveyor belts 1955 – Develops the first air springs for trucks and buses1974 – Supplies the European automotive in-dustry with the first extrusion blow-moulded polyurethane gaiters1991 – Launches the first environmentally friendly tyres for passenger cars1997 – Presents key technology for hybrid drive systems2003 – Unveils the world’s first road tyre ap-proved for speeds up to 360 km/h (224 mph) – the ContiSportContact 2 Vmax
case study
continental tests pulse refleX
15www.bksv.com/pulse
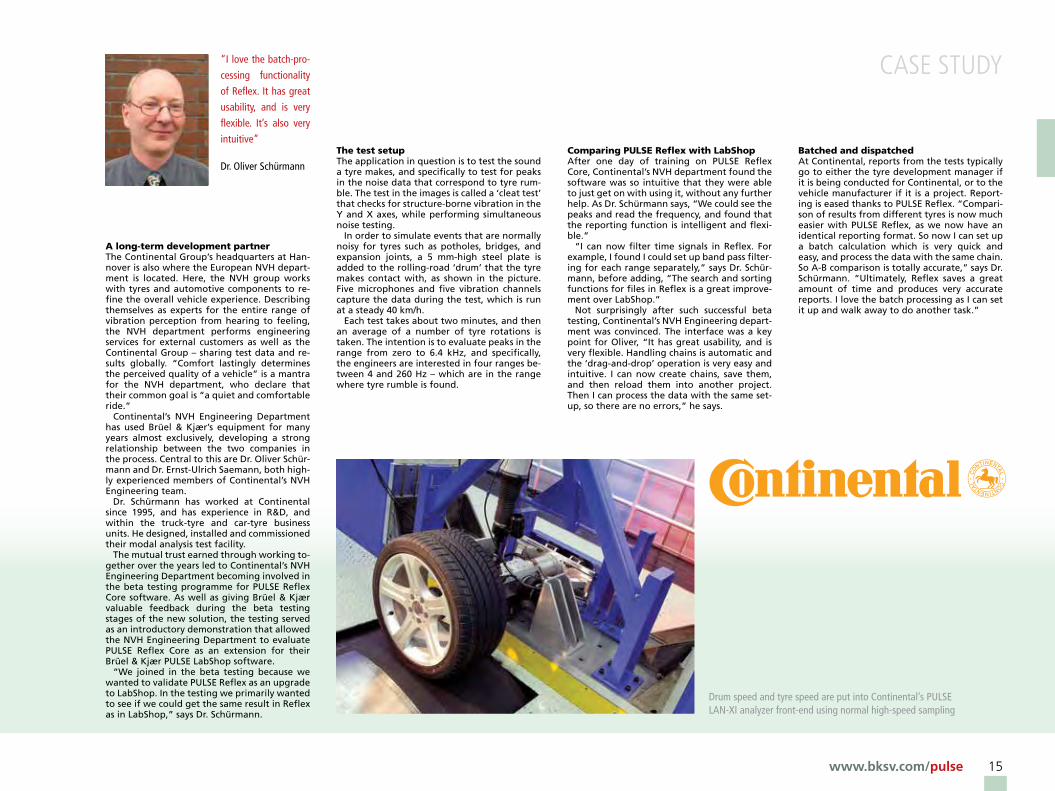
Drum speed and tyre speed are put into Continental’s PULSE LAN-XI analyzer front-end using normal high-speed sampling
case study
a long-term development partnerThe Continental Group’s headquarters at Han-nover is also where the European NVH depart-ment is located . Here, the NVH group works with tyres and automotive components to re-fine the overall vehicle experience . Describing themselves as experts for the entire range of vibration perception from hearing to feeling, the NVH department performs engineering services for external customers as well as the Continental Group – sharing test data and re-sults globally . “Comfort lastingly determines the perceived quality of a vehicle” is a mantra for the NVH department, who declare that their common goal is “a quiet and comfortable ride .”
Continental’s NVH Engineering Department has used Brüel & Kjær’s equipment for many years almost exclusively, developing a strong relationship between the two companies in the process . Central to this are Dr . Oliver Schür-mann and Dr . Ernst-Ulrich Saemann, both high-ly experienced members of Continental’s NVH Engineering team .
Dr . Schürmann has worked at Continental since 1995, and has experience in R&D, and within the truck-tyre and car-tyre business units . He designed, installed and commissioned their modal analysis test facility .
The mutual trust earned through working to-gether over the years led to Continental’s NVH Engineering Department becoming involved in the beta testing programme for PULSE Reflex Core software . As well as giving Brüel & Kjær valuable feedback during the beta testing stages of the new solution, the testing served as an introductory demonstration that allowed the NVH Engineering Department to evaluate PULSE Reflex Core as an extension for their Brüel & Kjær PULSE LabShop software .
“we joined in the beta testing because we wanted to validate PULSE Reflex as an upgrade to LabShop . In the testing we primarily wanted to see if we could get the same result in Reflex as in LabShop,” says Dr . Schürmann .
the test setupThe application in question is to test the sound a tyre makes, and specifically to test for peaks in the noise data that correspond to tyre rum-ble . The test in the images is called a ‘cleat test’ that checks for structure-borne vibration in the y and X axes, while performing simultaneous noise testing .
In order to simulate events that are normally noisy for tyres such as potholes, bridges, and expansion joints, a 5 mm-high steel plate is added to the rolling-road ‘drum’ that the tyre makes contact with, as shown in the picture . Five microphones and five vibration channels capture the data during the test, which is run at a steady 40 km/h .
Each test takes about two minutes, and then an average of a number of tyre rotations is taken . The intention is to evaluate peaks in the range from zero to 6 .4 kHz, and specifically, the engineers are interested in four ranges be-tween 4 and 260 Hz – which are in the range where tyre rumble is found .
comparing Pulse reflex with labshopAfter one day of training on PULSE Reflex Core, Continental’s NVH department found the software was so intuitive that they were able to just get on with using it, without any further help . As Dr . Schürmann says, “we could see the peaks and read the frequency, and found that the reporting function is intelligent and flexi-ble .”
“I can now filter time signals in Reflex . For example, I found I could set up band pass filter-ing for each range separately,” says Dr . Schür-mann, before adding, “The search and sorting functions for files in Reflex is a great improve-ment over LabShop .”
Not surprisingly after such successful beta testing, Continental’s NVH Engineering depart-ment was convinced . The interface was a key point for Oliver, “It has great usability, and is very flexible . Handling chains is automatic and the ‘drag-and-drop’ operation is very easy and intuitive . I can now create chains, save them, and then reload them into another project . Then I can process the data with the same set-up, so there are no errors,” he says .
batched and dispatchedAt Continental, reports from the tests typically go to either the tyre development manager if it is being conducted for Continental, or to the vehicle manufacturer if it is a project . Report-ing is eased thanks to PULSE Reflex . “Compari-son of results from different tyres is now much easier with PULSE Reflex, as we now have an identical reporting format . So now I can set up a batch calculation which is very quick and easy, and process the data with the same chain . So A-B comparison is totally accurate,” says Dr . Schürmann . “Ultimately, Reflex saves a great amount of time and produces very accurate reports . I love the batch processing as I can set it up and walk away to do another task .”
“I love the batch-pro-
cessing functionality
of Reflex. It has great
usability, and is very
flexible. It’s also very
intuitive”
Dr. Oliver Schürmann

16
pulse reflex core is our post-processing software
for fast and efficient analysis, viewing and reporting
of sound and vibration data. at the heart of the sys-
tem is a relational database for managing test pro-
jects and their associated sound and vibration data.
siMPle and intuitiVe
an innovative gui controls a workflow concept
that is easy to learn and consistent across applica-
tions, making pulse reflex core genuinely easy to
use. it deals with both repetitive (test bench) pro-
cedures and ad hoc troubleshooting by including
automation in the workflow without constraining
the user to a pre-defined sequence of operations.
PoWerful analysis caPabilities
multiple parallel analyses can be performed simul-
taneously, including stationary and non-stationary
spectral analysis, order analysis, statistics, and
sound quality metrics. results are automatically
sorted for easy post-processing.
high ProductiVity
Batch processing is included as standard in pulse
reflex core, enabling many recordings to be pro-
cessed in a single batch operation. no matter how
many tests or data types, the results from any num-
ber of tests are automatically sorted for quick com-
parison and reporting.
fleXible data ManageMent
test data and processed results can either be entirely
managed inside the pulse reflex core database or
stored in external files. metadata is used throughout
the workflow for easy data searching, display anno-
tation and automated report generation.
pulse refleX coreDAtA Viewing AnD rePorting
8700, 8701
PULSE Reflex Data Viewer provides automated viewing and re-
porting tools that are both flexible and easy to use . This software
is designed to take data from any source, making it the ideal
viewing and reporting hub for sound and vibration engineers .
stAtionAry AnD non-stAtionAry test DAtA AnAlysis
8700, 8702
PULSE Reflex Basic Processing is an analysis toolbox for FFT and
overall level analysis of recorded data, including acoustic and
human vibration filtering . Batch processing enables collections
of time files to be processed in one operation, and includes the
option of automatic reporting .
The Result Matrix provides an easy overview and simple comparison of large data sets from any number of tests or test runs
Pulse refleX core

www.bksv.com/pulse 17
100162/a
PULSE Reflex post-processing Photon+
2250/2270
PULSE Time Data Recorder
LabShop
Datafiles: *.pti, *.dat/rec, *.wav, *.ati, *.unv, *.uff, *.bunv, *.buff, *.hdf, *.hdr, *.tdf, *.mat, *.bkc, *.afu, *.ww, *.txt
LAN-XI NotarLAN-XI Notar
ADVAnceD orDer AnAlysis
8700, 8702, 8704, 8705
PULSE Reflex Advanced Order Analysis includes both
fixed bandwidth and tracked resampled FFT analysis us-
ing a tachometer speed reference . Special tools include
the graphical auto-tracker for deriving speed informa-
tion without a tachometer, and tachometer repair .
sounD QuAlity Metrics
8700, 8702, 8710
PULSE Reflex Sound Quality Metrics adds a comprehen-
sive range of commonly used metrics to the basic pro-
cessing module . Metric calculations can run in parallel
with other analyses such as FFT or overall analysis, and
can easily be set up to process a large number of record-
ings in a single batch operation .
Automation is built into the workflow. Batch processing and automatic reporting are included as standard.
Microsoft® PowerPoint® and Microsoft® Word are embedded to enable seamless report generation
Recordings can be previewed and edited in preparation for analysis. The spectrogram display allows quick evaluation of frequency and order content.
Scan here for an overview of PULSE Reflex Core:
Pulse refleX core

18
noise Vibration and Harsh ness (nVH) testing
is critical for refining the human experience
of vehicles, making nVH a key vehicle area of
concern, and a vital differentiator between
comparable models.
to achieve the de sired attributes, the ve-
hicle must be engineered to specified nVH
targets from its inception, and subsequently
validated to see that these targets are met
following the development process.
failure to meet targets necessitates trou-
bleshooting to find the root cause of the
problem and eliminate it in a cost-effective
manner – where cost is also measured in
terms of weight and therefore fuel economy.
for an analysis system to suit nVH test-
ing it needs to be portable and robust for in-
vehicle use, scalable and easy to use.
for standardised or repeated tests, real-
time multi-analysis gives results as soon as
you have completed a measurement. avoid-
ing the additional steps required for post-
processing ensures high productivity and al-
lows you to validate your results on-site.
our data-centric architecture means the
systems are built around the data flow, so
tests and results are documented from start
to finish. consequently, storing, retrieving
and reporting are efficient processes that do
not require additional tools or applications.
additional time can be saved by automating
report generation in whatever measurement
report format your company uses.
nVH testingAutoMotiVe test MAnAger
7796-A
A complete NVH toolbox covering stationary and run-up/run-down order track-
ing, time signal inspection, filtering and analysis, narrow-band analysis and mo-
bility testing, featuring:
f Real-time multi-analysis across all channels, covering FFT, 1/n-octave, order
tracking and overall levels
f Option of recording time data and saving automatically to database
f Time domain filtering and manipulation
f Virtual tacho support for Continuously Variable Transmission (CVT)
f Sideband extractor for Hybrid Electrical Vehicles (HEV) switching noise
f Sound power determination for engine testing
Validator provides targeted automatic retrieval of test results for averaging, reporting and comparison to other relevant measurements or target data
nVh testing

www.bksv.com/pulse 19
PortableMeasurement
Station
Printer
PULSEPDM Acquisition & Browsing License BZ -5443
SQL Server®
BZ -5446
PULSEPDM Acquisition & Browsing License BZ -5443
PDM BrowsingLicense BZ -5444
Database Server
BrowsingStation
BrowsingStation
Test Cells OfficeFront-end
MeasurementStation
Front-end
Field MeasurementFront-end
MeasurementStation
120379/a
1 × 7767 -B PULSE Data Manager 5-user license 2 × BZ -5443 PULSE Data Manager Acquisition and Browsing
2 × BZ -5444 PULSE Data Manager Browsing License BZ -5445 10-user Microsoft® SQL Server 2008 R2
following data acquisition and analysis comes
the second vital half of the measurement
process. analysing results is where the in-
depth engineering work starts, where conclu-
sions need to be drawn and decisions made.
examining the large amounts of data gener-
ated across an entire organisation requires a
clear overview and sophisticated capabilities.
pulse data manager (pdm) is our family
of data management systems, which stream-
lines data handling, test documentation and
archiving, and encompasses our extensive ex-
perience of data management.
f safe and orderly data storage
f efficient searching and inspection of
historic data
f access to all data across the test
organisation
f cross-project data comparisons and
calculations
f fast and efficient reporting
metadata in formation of any kind can be at-
tached to label sound and vibration measure-
ments and application data. intuitive database
searching ensures easy data retrieval for dis-
play, comparison, additional calculation, and
reporting.
databases can be hosted on a laptop
for field measurements, or on a network for
cross-organisational use, allowing them to be
accessed throughout the organisation. stor-
age is in a standard microsoft® sQl database.
data managementincluDeD feAtures
f A report generator allows you to create report templates in the layout of
your choice . The reports can be generated in your preferred Microsoft®
Office application – Microsoft® word, Microsoft® Excel® or Microsoft® Power-
Point®
f A calculator provides a dyna mic post-processing environment for arithmeti-
cal calculations and statistical operations on test data
(sound and ViBration)
DAtA MAnAgeMent

20
christie digital systems canada inc., a pri-vately held company that manufactures, most notably, dlP®, dlP cinema® projec-tors and dlP with led illumination display devices (christie® Microtiles®), is a leader in visual solutions for world-class organi-sations, offering diverse applications for business, entertainment, and industry. brüel & Kjær products, including the Pulse lan-Xi data acquisition platform in con-junction with an lds V875 shaker are used as part of the stringent product testing re-gime to improve the design and perfor-mance of christie’s projectors.
christie – the companywith more than 80 years of technological firsts and a long list of product awards under its belt, Christie is no stranger to prestigious events . They have provided solutions for both the Grammy and Emmy Awards and were sponsors for numerous Shanghai world Expo 2010 mul-timedia pavilions, which included one of Chi-na’s largest curved screen displays, a multime-dia theatre and an interactive digital book . Other global organisations using Christie visual solutions include Boeing, General Motors, Mi-crosoft®, Pixar Animation Studios, Shell, Sony Picture Studios, NASDAQ MarketSite, weill Cornell Medical College and Starbucks .
Established in 1929, and a leader in visual so-lutions for world-class organisations, Christie offers diverse applications for business, enter-tainment, and industry .
with expertise in film projection since 1929 and professional projection systems since 1979, Christie has established a global reputation as the world’s single-source provider of a variety of display technologies and solutions for cine-ma, large audience environments, control rooms, business presentations, training facili-ties, 3D and virtual reality, simulation, educa-tion, media and government . Christie has in-stalled over 100,000 projection solutions worldwide .
with more than 1300 employees globally, Christie has an ISO 9001 and ISO 14001 certi-fied facility in Kitchener, Ontario, Canada, as well as a manufacturing facility in Shenzhen, China . Although its core expertise is in projec-tion technology, Christie has four strategic business units – Business Products, Entertain-ment Solutions, Visual Environments including Control Rooms and Advanced Visualisation, and Managed Services .
environmental testing laboratoryIn Christie’s Environmental Testing Laboratory, large digital projectors are tested to ensure ro-bustness for transportation and operations as-pects . The lab contains a variety of equipment for conducting all types of required tests . The tests range from vibration, drop, thermal, sound, pull testing as well as equipment to measure and check part accuracy .
lds V875 shakerFor this purpose, a Brüel & Kjær LDS V875 shak-er with a 6 ft × 6 ft slip table and a 5 ft × 6 ft head expander is used . Senior Mechanical En-gineering Manager Mark Barfoot, B .Sc . P .Eng ., has been at Christie for over 10 years and previ-ously worked for an aerospace company . He says, “This testing used to be done externally but by doing it in-house, we improve the cycle time as we don’t have to wait for a slot at an external facility . I had used LDS shakers at my
case study
cHristie digital systems canada inc.
The Christie CP2220 digital cinema projector is just one of the products subjected to Christie’s rigorous environmental tests using the LDS V875 from Brüel & Kjær
Photos courtesy of Christie Digital Systems Canada Inc.

21www.bksv.com/pulse
Their Brüel & Kjær LDS V875 shaker with slip table and guided head expander is located in Christie’s Environmental Testing Laboratory
cases tudy
previous place of work, so that helped in the decision to buy the V875 three years ago .” He continues, “Also, the slip tables at the external test facility were not big enough for our needs, so the 6 ft × 6 ft slip table Brüel & Kjær could provide together with the unique head ex-pander were key in our decision making .”
The shaker, used in conjunction with the 8-channel laser controller, is used every day for pre-testing prototypes and package testing . The table can create DOF (X, y, Z) vibration and products undergo tests in and out of transport boxes and include:
• ASTM restrained cargo vibration test
• ISTA Loose Cargo Test
• Half-sine shock pulse test
A number of other Brüel & Kjær products are used in the Christie Environmental Testing Lab for a range of applications . These include:
• Miniature Tear-drop IEPE Accelerometer Type 4517
• Hand-held, Battery-powered Stroboscope Type 4912
• Accelerometer Calibrator Type 4294
• Piezoelectric IEPE Accelerometer Type 4507
• Triaxial IEPE Piezoelectric Accelerometer with TEDS Type 4524-B
• Photon+™ Dynamic Signal Analyzer
anechoic chamberLast year, Christie purchased a 10-year old full anechoic chamber with a background noise of 18 dB(A) . Christie added a false floor to allow the chamber to be converted to a hemi-ane-choic chamber when required . Here, using up to three 6-channel LAN-XI modules, sound quality, sound power and noise source identifi-cation software, Christie performs sound pow-er measurements according to ISO 3744 and sound pressure measurements according to a japan Business Machine Makers Association Data Projector Standard .
Christie has also invested in the sound quality software as well as the Binaural Head to allow them to better characterise the sound quality of their products . For most products, not only the level but also the quality of the noise it makes is part of what attracts or repels the cus-tomer – the right sound can lead to increased sales . Mark Barfoot says, “Christie will be mov-ing more towards sound quality in the future . Along with brightness and image quality, sound is one of our customers’ concerns and is, therefore, an increasingly important competi-tive parameter .”
A number of other Brüel & Kjær products are used in their sound testing:
• 6-channel LAN-XI modules
• Sound Intensity Calibrator Type 3541
• ½-inch Free-field Microphones Type 5189-A
• Head and Torso Simulator Type 4100
• Various PULSE software packages
a bright futureThe future certainly looks bright for Christie and not just because its projectors are the brightest in their class – over 30,000 ANSI-lu-mens, which is impressive against a typical 3,000-lumen projector commonly used in a classroom or boardroom . The number of screens worldwide featuring Christie digital cinema projectors is over 16,000, and Christie has 60% market share of North American digi-tal theatres . And the launch of Christie® Micro-Tiles® in 2009 looks set to change future dis-plays in architecture, digital-out-of-home (DOOH), command and control and event pro-duction .
The rapid growth in digital cinema projector sales around the world has led Christie to open a 60,000 ft2 manufacturing facility in Shenz-hen, China . This will enable Christie to invest more in the research and development of oth-er types of digital media products at the Kitch-ener facility and free up capacity for future product development .
Sound power measurements in the anechoic chamber using LAN-XI modules
“Once we got the shaker set up,
it has worked well,” says Mark,
“and we’ve never had to call any-
one out to service it.”

22
4297 Sound Intensity
Calibrator
4190-L-001 Free-field 1/2-inch Microphone with 2669-L, TEDS
4950 Prepolarized Free-field 1/2-inch Microphone
4188-A-021 Prepolarized Free- and Diffuse-field 1/2-inch Microphone with 2671, TEDS
4943-L-001 Diffuse-field 1/2-inch Microphone with 2669-L, TEDS
4942-A-021 Prepolarized Diffuse-field 1/2-inch Microphone with 2671-C, TEDS
4955 Low-noise Free-field 1/2-inch TEDS Microphone
UA-14514 .2 m Telescopic Boom
UA-0801 Lightweight Tripod
UA-1317 Preamplifier Holder
020106/3
4231 Sound Calibrator
AO-0414-T-XXX Cable LEMO 1B to LEMO 1B Connector
Carrying Case Accesories and Cables
B K
4204 Reference
Sound Source
3923 Rotating Microphone Boom
UA-0587 Tripod
Sound Intensity Probe
AO-0087-T-XXX Cable BNC to BNC Connector
AO-0488-T-XXX, B&K Female to LEMO 1B Connector
3599 sound intensity Probe Kit
for determining the noise emissions of products,
sound power is the preferred quantity to investi-
gate because it measures the absolute power of a
noise source independently from its acoustic envi-
ronment. the three main methods used are:
f free-field – placing the source in an acousti-
cally open area (free-field) and determining its
sound power from sound pressure measure-
ments
f reverberation room – placing the source in a
reverberation room (diffuse sound-field) and
determining its sound power from sound pres-
sure measurements
f sound intensity – directly measuring the sound
intensity from the source in any sound field, to
determine its sound power
the first two sound pressure-based methods are
most often used for production audits and high vol-
ume testing, while sound intensity-based methods
are used for engineering and in situ measurements.
whatever the method you choose, we can pro-
vide a system to measure and determine sound
power in accordance with international standards
and directives.
sound powersounD Power solutions
These solutions determine sound power according to interna-
tional standards and measure sound pressure levels at specified
points . They are all based on our PULSE Sound Power Type 7799,
which also assesses annoyance due to tonal components using
tone-to-noise ratio and prominence ratio calculations .
entry leVel solution
7799
A single microphone is used to determine sound power in a free-
field by making serial measurements according to ISO 374X-se-
ries standards . For reverberant room measurements, the system
can be augmented with a rotating microphone boom .
sounD Power

www.bksv.com/pulse
Extract from sound power report showing values used for labelling
Sound Intensity based sound power and mapping
The graphic user-interface is seamlessly integrated into PULSE LabShop
Icons and colour-coding – the number of mouse clicks is reduced to a minimum
Clear indication of the stage of the measurement procedure
Measurement progress bar
Indication of overload
Simultaneous determination of sound power and emission sound pressure
Standards supported
Free-field
ISO 3744
ISO 3745
ISO 3746
ISO 11201
ISO 7779
ECMA 7
EU Directives
2000/14/EC
2009/125/EC
IEC 60704-2-4
Reverberation room
ISO 3741
ISO 3743-1
ISO 3743-2
Sound intensity-based
ISO 9614-2
ECMA 160
sounD intensity-bAseD solution
7799
Determines sound power in any sound field using a se-
rial measurement technique . This solution is designed
to take advantage of the scanning intensity method
ISO 9614-2 while minimising costs .
high-ProDuctiVity solution
7799
Enables simultaneous measurement of sound pres-
sure levels at all of the positions designated by a sound
power standard, e .g ., six microphone positions for the
reverberant field method, and 10 positions for free-field
measurements .
lAbelling for wAshing MAchines
7799
Simplifies the EU-required measurement procedure right
up to the final report, in accordance with EU Directive
2009/125/EC . All household appliances sold in the EU
must feature an energy label including sound power
information, and for washing machines this must cover
both wash and spin cycles .
sounD Power
To learn more about noise labelling scan here:
23

24
Photo courtesy of The Renault Group
in order to achieve higher test efficiency, renault needed to enhance its existing in-stalled brüel & Kjær system and reduce the time spent in the test cell. renault wanted to ease the setup, data processing and measurement validation processes before activation of batch calculations. another important requirement was a new report-ing functionality. the overall objective was to simplify the workflow and calcula-tions in the measurement process and thus decrease idle time when measuring according to a predefined procedure.
the companyThe Renault Group, with headquarters in Bou-logne-Billancourt, France, was founded in 1899 as Société Renault Frères by Louis Renault and his brothers Marcel and Fernand . They quickly made a name for themselves in motor racing, notching up a string of wins with their voiturettes . Indeed, the Renault reputation for innovation was fostered very early on – in 1902 Renault launched the first production sedan car as well as patenting the first turbocharger . In 1996, the company was privatised to create Renault S .A . Today, Renault is present in 118 countries and has a work force of over 127000 employees . Brands include Renault, Dacia and Renault Samsung Motors . Renault-Nissan sold 7,276,398 vehicles worldwide in 2010 .
As well as its distinctive styling, Renault is also known for its car safety and is currently the car manufacturer with the largest number of models achieving the maximum 5 star rating in EuroNCAP crash tests .
Located in Lardy, 40 km south of Paris, the main testing centre dedicated to Renault’s powertrain engineering, covers an area of over 130 ha . with 13 km of tracks and over 250 test benches of all types, it employs nearly 2000 people . Integrated in the NVH department, more than 70 of them devote their activity to controlling various powertrain noises in spe-cialised testing facilities that are among the most modern in Europe .
the nVh development processNVH is critical in the development process . Cus-tomer perception is an important factor in ve-hicle quality . The sound of an engine is de-signed to avoid or limit disagreeable noise and tune others to be more pleasant .
jean-Marc Kieffer, NVH engineer and expert in powertrain radiated noise has been with Re-nault for 21 years . He says, “The NVH develop-ment process is a parallel between the engine and powertrain on one side and the whole ve-hicle on the other . These eventually converge to obtain relevant solutions for both sides . In this process, the role of the powertrain depart-ment is to characterise the noise and vibration of the powertrain, compare the results with the requirements/specifications and to design, redesign and tune the technical solutions ac-cording to the requirements . This ensures that the powertrain that is mounted in the vehicle won’t cause a noise problem for the customer .”
the challengeTo evaluate noise source location for power-train and engines, Renault GMP looked at Brüel & Kjær’s array applications for beam-forming and holography measurement tech-niques to enable standard benchmark testing .
For Renault, it is important to get standard-ised sound power values and report them, not only because of vehicle regulations and legisla-tion but also as a key competitive, qualitative element in the field of engineering, research, and development . jean-Marc Kieffer, explains, “we have two principle areas of emphasis . The first is the law – the sound level that is required for the vehicle in, for example, pass-by – and the second is customer comfort . As well as these two, we also have the pollution issues and the rules/legislation that apply . These of-ten contradict with vehicle noise . For instance, when you want to reduce the carbon dioxide levels of emissions you must act on injection parameters and this will affect the noise level . Other different rules and regulations also of-ten conflict so we have to find compromises .”
In order to achieve higher test efficiency, Re-nault needed to enhance its existing installed Brüel & Kjær system and reduce the time spent in the test cell . Renault wanted to ease the setup, data processing and measurement vali-dation processes before activation of batch cal-culations . Another important requirement was a new reporting functionality . The overall ob-jective was to simplify the workflow and calcu-lations in the measurement process and thus decrease idle time when measuring according to a predefined procedure .
It is, therefore, important to be able to locate and quantify noise sources with reliable, fast and accurate techniques . Mr . Kieffer says, “Much of our work is dedicated to optimising our processes and to reducing the cost or dura-tion of development especially in NVH meas-urement, which involves a lot of expensive sys-tems . Being able to validate fast solutions on the same prototype is also a major advantage for quick trouble-shooting tests .” Brüel & Kjær’s challenge was to try and simplify the workflow and calculations in the measurement process in order to reduce standardised testing time .
Proposed solutionIn order to address the requirements from Re-nault, Brüel & Kjær proposed a range of en-hancements to the current version of the beamforming and SONAH application togeth-er with associated noise source identification software in PULSE . Noise source identification was targeted as a method to characterise sound power for predefined areas on an en-gine/powertrain . The solution would enable Renault to make the measurements suited for standard benchmark testing while using a sim-ple and effective user interface from setup of data acquisition to reporting the results in Ex-cel® . Brüel & Kjær’s proposals included:
• Simplified data acquisition setup and GUI
• Predefined calculation setups for the dif-ferent sides of an engine
• Automated calculation setup simplifying the procedure and post-processing work-flow
• Combined stationary beamforming and SONAH calculation on the same dataset
• Overnight management and performance of batch calculations
• Sound power areas defined as part of cal-culation setup
unique array designwhen working with arrays on a running car en-gine, it is a challenge to practically position the array close to the surfaces that have protrud-ing parts that cannot be removed . To solve this, Brüel & Kjær’s array has removable outer sec-tors . with one sector removed the array can, for example, span a driveshaft and still cover the entire engine side . when a sector is re-moved, this is automatically detected by the
case study
tHe renault group

25www.bksv.com/pulse
Photo courtesy of The Renault Group
case study
cable break detection feature in the front-end and the missing measurement points are auto-matically ignored in subsequent calculations . Renault were pleased with the proposition . “The most important area within which we work with Brüel & Kjær is to identify and quan-tify the noise sources,” says Mr . Kieffer . “A few years ago we were working with intensity measurements and a complete measurement for powertrain took around one week to com-plete,” he explains . “Renault and Brüel & Kjær worked together to improve the way we make sound power measurements and we decided to work with the new array . Today, we have reduced the time of characterisation from five days to one or two days . On top of that, we can now get information that intensity measure-ments are unable to provide . At higher fre-quencies you have a higher resolution than with intensity measurements, even if you measure with points that are close to each other, and you improve the resolution in the NSI localisation . you can also characterise your sources in non-stationary ways of running, es-pecially in run-up . It is, for us, the chance to simulate the behaviour of the engine during, for example, a pass-by test measurement .”
a ten-year relationshipBrüel & Kjær and Renault’s relationship goes back more than 10 years and there are several reasons why this relationship came about . As Mr . Kieffer explains, “First of all, Brüel & Kjær is known worldwide as a microphone manufac-turer and has a reputation for being one of the best . For us it was important to have a good transducer as the basis of our measurement chain . That’s one reason for our choice . Anoth-er is that Brüel & Kjær was the most advanced in the domain of sound power measurement whether with intensity probe or array . That’s why, ten years ago, we chose a holography sys-tem with Non-stationary STSF from Brüel & Kjær . Following that, Brüel & Kjær con-tinued to improve its systems and what ce-mented our choice was when Brüel & Kjær pro-posed the combined system with holography and beamforming . Using the same transducer and the same acquisition system for both beamforming and holography measurements was extremely important to us and made us more productive as we didn’t have to make any changes during measurements . Moreover,
choosing the PULSE platform was a guarantee to getting a versatile, upgradeable and sus-tainable solution in terms of both hardware or software . Finally, the ability for target setting and data correlation, for example, acoustic vs . vibration, through the database management of the PULSE PDM tool was also a determining factor .”
the futureThere is increasing pressure an the automotive industry to be more cost effective while pro-ducing ever more sophisticated and refined vehicles, for example, the development of elec-trical/hybrid powertrains which represents one
of the automotive industry’s fastest growing segments . Mr . Kieffer explains, “The problem we encounter with energy and the environ-ment is the extreme pressure on reducing de-velopment time . whether it be traditional, hy-brid or electrical engines, we are obliged to develop quickly and efficiently . That’s a con-stant pressure in our industry .” He continues, “we have less time because circumstances are moving faster . There are some critical factors that force us to produce answers as soon as possible, for example, energy availability and the problem of environmental pollution . These demand a quick reaction so we have to be more efficient than we actually are today .”
However, testing time is not the only issue at Renault . Renault has largely succeeded in re-
ducing this by using array measurements . Ac-cording to Mr . Kieffer, “The next big challenge is to make a lot of improvements to how we post-process data . One reason for this is that we deal with huge amounts of data today . For example, it’s possible nowadays to measure the behaviour of the powertrain in non-stationary conditions but post-processing the measure-ments is very time-consuming . Our challenge and priority is to improve our post-processing and data storage capabilities .”
The technologies that drive the development of hybrid and battery-driven vehicles are changing the perception of NVH in the auto-motive industry . “just run a little test with an
electrical vehi-cle,” says Mr . Ki-effer, “and you will soon realise that the sound is quite different to that of tradi-tional vehicles .” He continues, “It is clear that we have to develop new methods of processing, new algorithms, etc ., to improve the performance of our systems in measuring high frequencies . For us, another as-pect of the prob-
lems with electrical engines is the very low sound level of the engine compared to other components . Keeping the ability to analyse the noises and to evaluate and localise their sourc-es is vital to us . Recently Brüel & Kjær has, on our request, added the order filtering option to their beamforming solution . That is essen-tial for engine investigations .”
In addition to all the new technologies expe-rienced by the automotive industry, Mr . Kieffer believes that fast exchange of data and images is also an absolute must . “This is important,” he explains, “because when you have to deal and communicate with people it is often quick-er and easier to show them an animation or a mapping where the different sources at differ-ent frequencies or different engine speeds can
clearly be seen . Audio files are another possi-ble option .”
Animation and simulation are, therefore, be-coming increasingly important and are a way of reducing the length of the development process because they affect more accurate cal-culations . And there are different ways of us-ing these . “you can modify your development process and make more calculations at the first stages of the process and less at a later stage,” says Mr . Kieffer . “This means you can reduce the number of prototypes which are expensive . you can also reduce the number of test bench hours . A great way of developing is to be able to provide accurate measurement results in or-der to improve and validate new calculation methods especially in complex matters like en-gine radiated noises . Undoubtedly, the coming years will present exciting challenges for Re-nault and Brüel & Kjær; challenges that will strengthen our cooperation to improve the comfort and performance of the next genera-tion of vehicles .”

26
100117/3
LAN
LAN-XI System3660-C Frame with:
2 × 2831-A Battery Modules1 × 3053-B 12-ch.Module
WA-1558-WSlice Wheel Array with18 × 4959 Microphones
USB Camera Cable
Multichannel Microphone Cable
Software
Scan here to see a video on the use of arrays:
noise source identification (nsi) techniques help
to optimise the noise emissions of products and
their components – on vehicles, aircraft, power-
tools, household goods, wind turbines and much
more. identifying the most important sub-sources
of noise in terms of position, frequency content and
sound power radiation helps decide where design
changes can most effectively improve overall noise
radiation.
array-based nsi provides the fastest measure-
ment process and the highest quality results, and
our range of arrays varies enormously in size and
shape to suit the task in hand.
the three main array software applications are
acoustic Holography type 8607, Beamforming
type 8608 and spherical Beamforming type 8606,
which can all be enhanced with a large number of
options. all calculation and post-processing is per-
formed in the same user-interface.
for a specific challenge, our customised project
department will tailor an optimal solution, drawing
on over 30 years’ experience of designing and in-
stalling hundreds of array-based solutions. whether
the test object is a hearing aid mounted on a test
bench, a high-speed train racing from city to city, or
an aircraft flying overhead, Brüel & Kjær can pro-
vide a complete, turnkey solution.
nsi – array Based
Slice wheel arrays and combo arrays are suitable for both holography and beamforming
nsi – ArrAy bAseD
nsi Acoustic hologrAPhy
8607, 7770-n, 7761, bz--5635, bz-5636, bz-5638
For measurements close to a source, this application provides fast
and accurate acoustic maps of sound pressure, sound intensity
and other sound-field parameters at low to medium frequen-
cies (100 Hz to 5 kHz) . Our patented algorithms ‘SONAH’ and
‘ESM’ allow accurate measurement with relatively small arrays
without encountering edge effects . Acoustic holography also al-
lows results to be calculated closer to and further away from the
source, and the capability of the system can be augmented with
an automatic positioning system, transient and quasi-stationary
calculations and sound quality metrics .
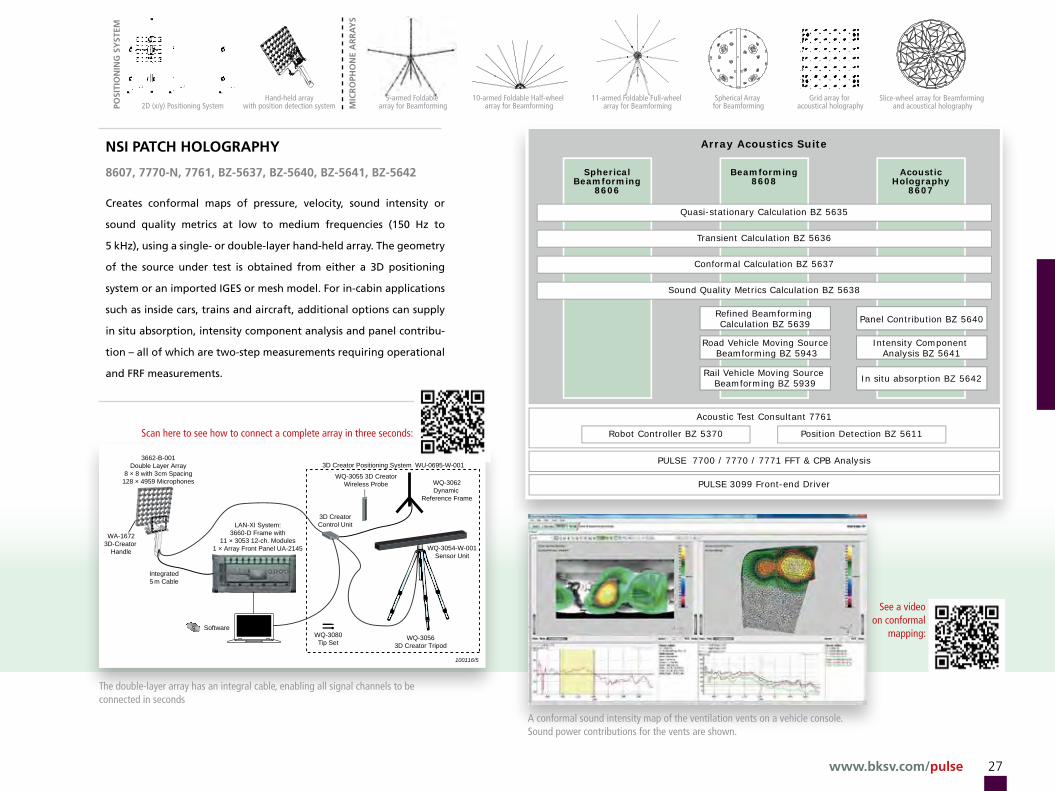
www.bksv.com/pulse 27
PULSE 3099 Front-end Driver
PULSE 7700 / 7770 / 7771 FFT & CPB Analysis
Acoustic Test Consultant 7761
Robot Controller BZ 5370 Position Detection BZ 5611
Array Acoustics Suite
Quasi-stationary Calculation BZ 5635
Transient Calculation BZ 5636
Conformal Calculation BZ 5637
Sound Quality Metrics Calculation BZ 5638
Refined Beamforming Calculation BZ 5639
Road Vehicle Moving Source Beamforming BZ 5943
Rail Vehicle Moving Source Beamforming BZ 5939
Panel Contribution BZ 5640
Intensity Component Analysis BZ 5641
In situ absorption BZ 5642
SphericalBeamforming
8606
Beamforming8608
AcousticHolography
8607
POSI
TIO
NIN
G S
YST
EM
MIC
RO
PHO
NE
AR
RA
YS
2D (x/y) Positioning SystemHand-held array
with position detection system11-armed Foldable Full-wheel
array for Beamforming10-armed Foldable Half-wheel
array for Beamforming5-armed Foldable
array for BeamformingSpherical Array
for BeamformingGrid array for
acoustical holographySlice-wheel array for Beamforming
and acoustical holography
3662-B-001Double Layer Array
8 × 8 with 3cm Spacing128 × 4959 Microphones
100116/5
WA-16723D-Creator
Handle
Integrated 5 m Cable
WQ-3055 3D Creator Wireless Probe
LAN-XI System: 3660-D Frame with
11 × 3053 12-ch. Modules 1 × Array Front Panel UA-2145 WQ-3054-W-001
Sensor Unit
WQ-3056 3D Creator Tripod
3D Creator Control Unit
Software
WQ-3062 Dynamic
Reference Frame
WQ-3080 Tip Set
3D Creator Positioning System WU-0695-W-001
See a video on conformal
mapping:
nsi PAtch hologrAPhy
8607, 7770-n, 7761, bz-5637, bz-5640, bz-5641, bz-5642
Creates conformal maps of pressure, velocity, sound intensity or
sound quality metrics at low to medium frequencies (150 Hz to
5 kHz), using a single- or double-layer hand-held array . The geometry
of the source under test is obtained from either a 3D positioning
system or an imported IGES or mesh model . For in-cabin applications
such as inside cars, trains and aircraft, additional options can supply
in situ absorption, intensity component analysis and panel contribu-
tion – all of which are two-step measurements requiring operational
and FRF measurements .
The double-layer array has an integral cable, enabling all signal channels to be connected in seconds
A conformal sound intensity map of the ventilation vents on a vehicle console. Sound power contributions for the vents are shown.
Scan here to see how to connect a complete array in three seconds:
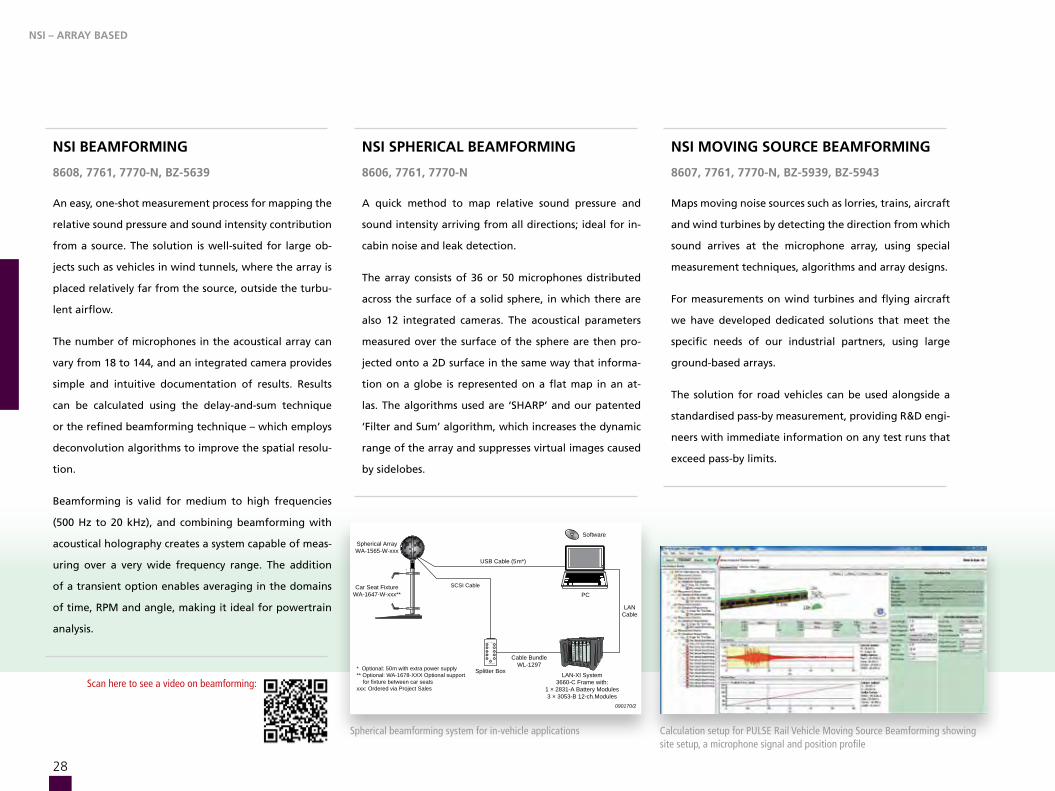
28
PC
Brüel B K7/6-'89& Kjær
1
2
3
4
56
11
10
9
8
7
WB-3477 Split Box
Splitter Box* Optional: 50m with extra power supply** Optional: WA-1678-XXX Optional support for fixture between car seatsxxx: Ordered via Project Sales
Software
LANCable
Cable BundleWL-1297
090170/2
LAN-XI System 3660-C Frame with:
1 × 2831-A Battery Modules 3 × 3053-B 12-ch.Modules
Car Seat FixtureWA-1647-W-xxx**
Spherical ArrayWA-1565-W-xxx
USB Cable (5m*)
SCSI Cable
Scan here to see a video on beamforming:
Spherical beamforming system for in-vehicle applications Calculation setup for PULSE Rail Vehicle Moving Source Beamforming showing site setup, a microphone signal and position profile
nsi beAMforMing
8608, 7761, 7770-n, bz-5639
An easy, one-shot measurement process for mapping the
relative sound pressure and sound intensity contribution
from a source . The solution is well-suited for large ob-
jects such as vehicles in wind tunnels, where the array is
placed relatively far from the source, outside the turbu-
lent airflow .
The number of microphones in the acoustical array can
vary from 18 to 144, and an integrated camera provides
simple and intuitive documentation of results . Results
can be calculated using the delay-and-sum technique
or the refined beamforming technique – which employs
deconvolution algorithms to improve the spatial resolu-
tion .
Beamforming is valid for medium to high frequencies
(500 Hz to 20 kHz), and combining beamforming with
acoustical holography creates a system capable of meas-
uring over a very wide frequency range . The addition
of a transient option enables averaging in the domains
of time, RPM and angle, making it ideal for powertrain
analysis .
nsi sPhericAl beAMforMing
8606, 7761, 7770-n
A quick method to map relative sound pressure and
sound intensity arriving from all directions; ideal for in-
cabin noise and leak detection .
The array consists of 36 or 50 microphones distributed
across the surface of a solid sphere, in which there are
also 12 integrated cameras . The acoustical parameters
measured over the surface of the sphere are then pro-
jected onto a 2D surface in the same way that informa-
tion on a globe is represented on a flat map in an at-
las . The algorithms used are ‘SHARP’ and our patented
‘Filter and Sum’ algorithm, which increases the dynamic
range of the array and suppresses virtual images caused
by sidelobes .
nsi MoVing source beAMforMing
8607, 7761, 7770-n, bz-5939, bz-5943
Maps moving noise sources such as lorries, trains, aircraft
and wind turbines by detecting the direction from which
sound arrives at the microphone array, using special
measurement techniques, algorithms and array designs .
For measurements on wind turbines and flying aircraft
we have developed dedicated solutions that meet the
specific needs of our industrial partners, using large
ground-based arrays .
The solution for road vehicles can be used alongside a
standardised pass-by measurement, providing R&D engi-
neers with immediate information on any test runs that
exceed pass-by limits .
nsi – ArrAy bAseD

29www.bksv.com/pulse
nsi – intensity mapping
9654 Intensity Probe Positioning System9665 Array Positioning System
050107
Sound Intensity Probe
nsi intensity MAPPing
7761, 7752, 7700-n2, 2 inPuts for A sounD intensity Probe, 3 inPuts Are reQuireD for selectiVe intensity MeAsureMents.
Measurement and mapping of sound pressure, sound intensity and other directly
measured sound field parameters
f Calculation of partial sound power for ranking of sub-sources
f Easy, geometry-guided measuring process
f Intuitive documentation using image overlay
f Expandable with:
– Selective intensity mapping
– Automated positioning system
nsi – intensity MAPPing
Two- and three-dimensional sound maps overlaid on an image make
documentation of the noise sources easy to understand. An integrated database
stores results, compares maps, and assists sound power ranking.
Two-dimensional positioning system for a sound intensity probe or array
The sound intensity front-end LAN-XI module has a third input for a reference signal, a socket for the remote control, and a generator output for leak detection tasks
A sound intensity probe with remote-control handle
sound intensity mapping is a versatile tool
to measure the magnitude and direction of
energy in a sound field for a variety of ap-
plications such as determining sound power,
sound absorption and sound transmission.
sound direction and noise ‘hot spots’ can
be quickly determined regardless of back-
ground noise, with visual and aural feedback
during measurements allowing convenient,
on-the-spot results for operational sound
sources.
colour-contour noise maps provide intui-
tive documentation and easy communication
of results with others, and the selective sound
intensity option can further identify the inter-
nal root sources and radiation mechanisms
involved.
when measuring a large number of points,
robotic systems can accurately automate mi-
crophone positioning, while for use on-site
or inside moving vehicles we offer hand-held
systems based on a sound level meter.
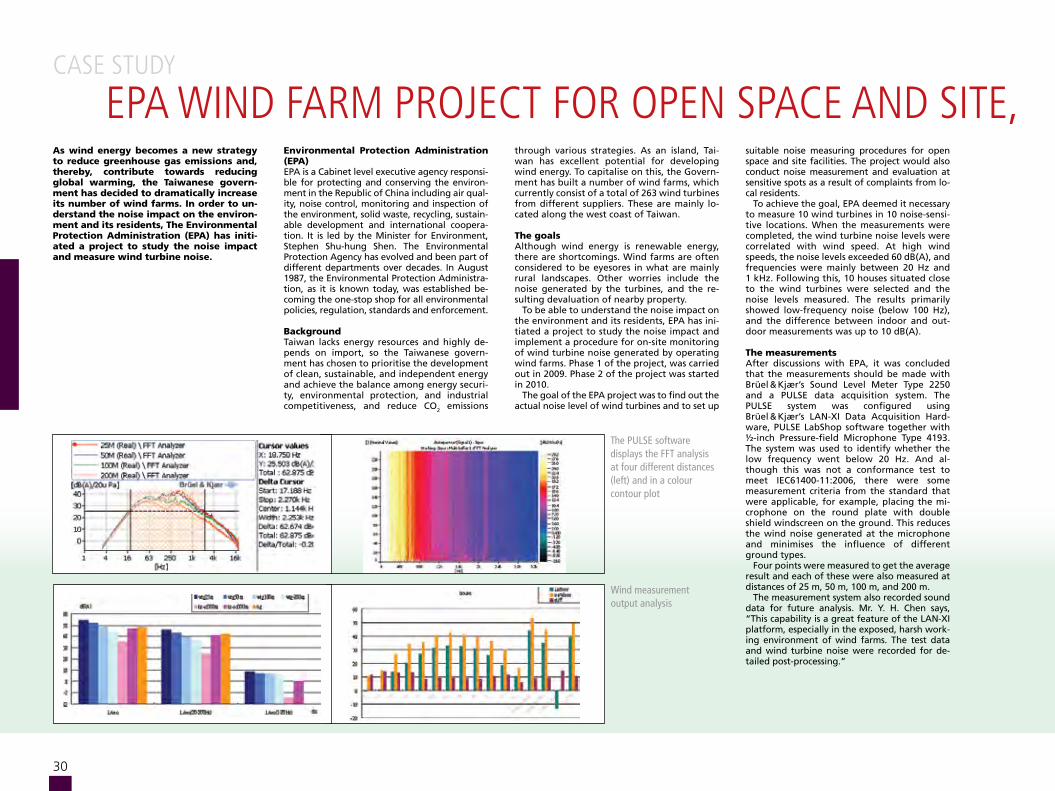
30
The PULSE software displays the FFT analysis at four different distances (left) and in a colour contour plot
Wind measurement output analysis
as wind energy becomes a new strategy to reduce greenhouse gas emissions and, thereby, contribute towards reducing global warming, the taiwanese govern-ment has decided to dramatically increase its number of wind farms. in order to un-derstand the noise impact on the environ-ment and its residents, the environmental Protection administration (ePa) has initi-ated a project to study the noise impact and measure wind turbine noise.
environmental Protection administration (ePa)EPA is a Cabinet level executive agency responsi-ble for protecting and conserving the environ-ment in the Republic of China including air qual-ity, noise control, monitoring and inspection of the environment, solid waste, recycling, sustain-able development and international coopera-tion . It is led by the Minister for Environment, Stephen Shu-hung Shen . The Environmental Protection Agency has evolved and been part of different departments over decades . In August 1987, the Environmental Protection Administra-tion, as it is known today, was established be-coming the one-stop shop for all environmental policies, regulation, standards and enforcement .
backgroundTaiwan lacks energy resources and highly de-pends on import, so the Taiwanese govern-ment has chosen to prioritise the development of clean, sustainable, and independent energy and achieve the balance among energy securi-ty, environmental protection, and industrial competitiveness, and reduce CO2 emissions
through various strategies . As an island, Tai-wan has excellent potential for developing wind energy . To capitalise on this, the Govern-ment has built a number of wind farms, which currently consist of a total of 263 wind turbines from different suppliers . These are mainly lo-cated along the west coast of Taiwan .
the goalsAlthough wind energy is renewable energy, there are shortcomings . wind farms are often considered to be eyesores in what are mainly rural landscapes . Other worries include the noise generated by the turbines, and the re-sulting devaluation of nearby property .
To be able to understand the noise impact on the environment and its residents, EPA has ini-tiated a project to study the noise impact and implement a procedure for on-site monitoring of wind turbine noise generated by operating wind farms . Phase 1 of the project, was carried out in 2009 . Phase 2 of the project was started in 2010 .
The goal of the EPA project was to find out the actual noise level of wind turbines and to set up
suitable noise measuring procedures for open space and site facilities . The project would also conduct noise measurement and evaluation at sensitive spots as a result of complaints from lo-cal residents .
To achieve the goal, EPA deemed it necessary to measure 10 wind turbines in 10 noise-sensi-tive locations . when the measurements were completed, the wind turbine noise levels were correlated with wind speed . At high wind speeds, the noise levels exceeded 60 dB(A), and frequencies were mainly between 20 Hz and 1 kHz . Following this, 10 houses situated close to the wind turbines were selected and the noise levels measured . The results primarily showed low-frequency noise (below 100 Hz), and the difference between indoor and out-door measurements was up to 10 dB(A) .
the measurementsAfter discussions with EPA, it was concluded that the measurements should be made with Brüel & Kjær’s Sound Level Meter Type 2250 and a PULSE data acquisition system . The PULSE system was configured using Brüel & Kjær’s LAN-XI Data Acquisition Hard-ware, PULSE LabShop software together with ½-inch Pressure-field Microphone Type 4193 . The system was used to identify whether the low frequency went below 20 Hz . And al-though this was not a conformance test to meet IEC61400-11:2006, there were some measurement criteria from the standard that were applicable, for example, placing the mi-crophone on the round plate with double shield windscreen on the ground . This reduces the wind noise generated at the microphone and minimises the influence of different ground types .
Four points were measured to get the average result and each of these were also measured at distances of 25 m, 50 m, 100 m, and 200 m .
The measurement system also recorded sound data for future analysis . Mr . y . H . Chen says, “This capability is a great feature of the LAN-XI platform, especially in the exposed, harsh work-ing environment of wind farms . The test data and wind turbine noise were recorded for de-tailed post-processing .”
case study
epa wind farm project for open space and site, noise eValuation and measurement criteria

31www.bksv.com/pulse
Aux. I/O
Rx
RS-2325/1 ch. Input/Output
Controller Module Type 7537A
!
Output 1
100MbitBrüel B K7/6-'89& Kjær
Tacho
Multi Frame Control
No Yes
First or Last Frame
Tx LAN
InputAll Sockets
Cable Lock
1
1
2
3
4
5
D
10 m(min.)
2D−4D(from Rotor Centre)
R0(R0 = H+D)
2
Laptop PC
Headphones
Weather Station
(Downwind)(Upwind)
Wind Direction
DC-signalConverter
Box
Microphone(Reference
Position)
PULSEfront-end
H
OptionalMicrophone
Phot
os c
ourt
esy
of E
PA W
ind
Ener
gy
Making measurements at Miaoli County Chunan Tawn wind farm. The microphone is mounted at the centre of a flat board with its axis pointing towards the wind turbine.
case study
epa wind farm project for open space and site, noise eValuation and measurement criteriaThe conclusions deducted from the measure-ments were:
1. Wind speed dominates the measurements, so placing the microphone on the ground is a necessity.
2. A suitable windscreen is required.
3. Low frequency (1 to 100 Hz) is of concern but difficult to measure.
4. By using Type 4193 microphones, a range from 1 Hz to 20 kHz could be covered. All frequencies can be measured simultane-ously using the PULSE platform and post-analysis is quick and easy.
5. Analysis tools, such as colour contour plots, can be used to identify the pure tone com-ponents. Sound quality can be evaluated to verify the dominant frequency ranges.
6. The wind speed can also be recorded with PULSE for correlation and analysis with the noise data.

32
the enormous growth of the wind turbine indus-
try makes noise problems ever-more pertinent to
personnel in design, r&d and production. we con-
tinuously develop solutions to address these new
challenges, helping to optimise operation, increase
product quality and simplify measurement proce-
dures.
a uniform methodology to ensure consistency
and accuracy in the measurement and analysis
of acoustical emissions is provided by the inter-
national standard ‘iec 61400-11 wind turbine
generator systems: acoustic noise measurement’.
Brüel & Kjær supports the standard with a com-
plete system to determine sound power, tonality
and impulsivity.
for manufacturers of wind turbine components,
our sound and vibration systems ensure quality
control in gearbox and generator test rigs, and our
data acquisition and analysis systems are equally
suited for on-site troubleshooting, production, and
r&d facilities.
improvements in acoustical array design and
calculation algorithms have led to our current rug-
ged, battery-operated systems that are ideal for
outdoor use and quick to set up. large, ground-
based arrays for precision noise source identifica-
tion help researchers and blade designers locate
troublesome areas on full-scale test turbines.
in wind tunnels, array technology is widely used
on scale models, while our flat surface microphones
are ideal for blade profile investigations.
acoustical applications for wind turBinesnoise sentinel
7871, single or MultiPle inPuts
Permanent and semi-permanent solutions for gathering accu-
rate data for planning and noise management of wind turbines
and wind farms . Reliable data enables noise complaints and reg-
ulation compliance to be dealt with in a cost-effective manner .
f web-based subscription solution
f supply – we install and maintain the noise monitoring
equipment
f operation – we collect, verify and manage the noise data,
sound recordings, weather data and video
f Presentation – we provide data that is ready to incorporate
into site-specific compliance reporting
Setup for wind turbine noise measurements according to IEC-61400-11
100037/2
DC-Signal Converter Box
PULSE Front-end 3056-A-040 + Battery 2831-A
LAN (Ethernet)
DC Signals
(Aux Channel)
Headphones
Boundary Layer
Microphone with Windshield
Wind Tu rbine
Meteorological Inputs
Wind Tu rbine parameters and data from integral W eather Station
2
1
W eather StationWQ6
10m (min.)
W eather Station WQ-3336 Pass-by Interface Box 7451
AcousticAl APPlicAtions for winD turbines

www.bksv.com/pulse 33
Scan here to see a video of acoustic noise measurement on wind turbines:
winD turbine sounD Power AnD tonAlity
7700, 7708, 7914, 1 MicroPhone inPut
Dedicated solution to support the IEC 61400-11 standard
and FGw guides for determination of sound power and
tonality .
f Tonality
f Impulsivity, low-frequency noise, infrasound
f Full measurement report including wind turbine
operating details, third-octave and octave spectra
for sound pressure and sound power at the various
wind speeds
AcousticAl ArrAy systeMs
8608, bz-5636, bz-5638, bz-5639, 30 to 108 inPuts for ArrAy MicroPhones
Pentangular array for rapid outdoor beamforming
measurements using delay-and-sum beamforming and
refined beamforming for improved spatial resolution .
f Rugged and easy to use
f Mapping of sound pressure, sound intensity,
loudness and other sound field parameters as
a function of time
f Customised arrays for blade tracking
f Customised, large ground-based arrays for improved
spatial resolution – to distinguish between the
leading and trailing edge of blades
sounD Power of coMPonents
7700-n2, 7752, 7761, 2 inPuts for sounD intensity Probe AnD 1 oPtionAl reference inPut
Sound intensity mapping system for measurement and
mapping of sound pressure, sound intensity and other
field parameters .
f Calculation of partial sound power for ranking sub-
components
f Expandable with:
– Automated positioning system
– Selective intensity mapping
acoustical applications for wind turBines
Sound intensity map of a gearbox test rig
Automated positioning system with an array of 30 microphones
to cover an area of 4m X 6m
Result of sound intensity mapping from a beamforming measurement
AcousticAl APPlicAtions for winD turbines
100118/2
LAN
LAN-XI System3660-C Frame with:
2 × 2831-A Battery Modules2 × 3053-B 12-ch.Modules
WA-1676-W-002 Pentangular Array with 30 × 4959 Microphones
USB Camera Cable
Multichannel Microphone Cable
Software
Pentangular array system for rapid outdoor beamforming measurements

34
Acoustic Material TestSingle-sided
PC
Power Amplifier 2716-C
Sound Calibrator 4231 with Adaptor
DP-0775
030093/6
Impedance Tube Kit (50 Hz − 6.4 kHz) 4206 or
Impedance Tube Kit (100 Hz − 3.2 kHz) 4206-A
Power Amplifier Type 2716 C
+20d
B
On
&O
ff
growing focus on noise control issues combined
with the emergence of sound quality in product
design makes acoustic material testing increasingly
relevant to engineers, designers and manufacturers
from a broad range of industries.
acoustic material testing is the process for de-
termining the acoustic characteristics of materials
in terms of absorption, reflection, impedance, ad-
mittance and transmission loss.
a range of standards covers acoustic material
testing, prescribing well-defined acoustical condi-
tions and special instrumentation to ensure accu-
racy and re peatability.
our complete acoustic material testing systems
make measurements on small samples according
to iso 10534-2, astm e1050 and astm e2611-10
international standards. they cal cu la te transmis-
sion loss based on transfer matrix representation.
simulation software can then help to predict
the impact of specific noise control materials at
an early stage in product development, once the
acoustic characteristics of the materials are accu-
rately known.
acoustic material testingAcoustic MAteriAl test – single-siDeD
7770-n2, 7758, 2 inPuts, 1 outPut
f Sound absorption coefficient and impedance measurements
based on the two-microphone transfer-function method
(ISO10532–2 and ASTM 1050 standards)
Acoustic Material Test – Single-Sided Type 3560-B-T72
We offer different kits according to the standard required
Standard Tube kit Frequency range
ISO 10534 – 2 Type 4206 50 – 6400 Hz
ASTM E1050 – 08 Type 4206 50 – 6400 Hz
ASTM E1050 – 08 Type 4206-A 100 – 3200 Hz
ASTM E2611 – 10 Type 4206-T 50 – 6400 Hz
Acoustic MAteriAl testing

www.bksv.com/pulse 35
Acoustic Material TestDouble-sided
PC
Power Amplifier 2716-C
Sound Calibrator 4231 with Adaptor
DP-0775
Transmission Loss Tube Kit (50 Hz − 6.4 kHz) 4206-T
Power Amplifier Type 2716 C
+20d
B
On
&O
ff
030094/6
Acoustic MAteriAl test – Double-siDeD
7700-n4, 7758, 4 inPuts, 1 outPut
f Sound absorption coefficient and impedance measurements
based on the two-microphone transfer-function method
(ISO10532–2 and ASTM 1050 standards)
f Normal incidence transmission loss and other acoustical
properties
f Ratio of dissipated energy to incident energy
f Characteristic impedance and complex wave number
f Two loaded transmission loss measurement method
(ASTM E2611-10)
acoustic material testing
Acoustic Material Test – Double-Sided Type 3560-B-X73
Type 4206
Type 4206-A Type 4206-T
Frequency range
50 – 1600 Hz • •
100 – 3200 Hz •
500 – 6400 Hz • •
Parameters
Sound absorption coefficient • • •
Reflection coefficient • • •
Acoustic impedance • • •
Acoustic admittance • • •
Transmission loss coefficient •
Tube guide matrix with the different tube types in the top row
Typical results of absorption measurements
Transmission loss measurement
Acoustic MAteriAl testing

36
Phot
os c
ourt
esy
of Is
uzu
in order to improve the perceived sound quality of diesel engines, isuzu cooperat-ed with brüel & Kjær to develop mapping of sound quality metrics, where noise sources can be identified based on their sound character using perception-based metrics such as loudness, sharpness and roughness. together, they also developed a new impulsiveness algorithm to clearly identify the source of impulsive noise in diesel engines. the result of the isuzu/brüel & Kjær project is now the world’s first commercially available sound quality metrics mapping software for beamform-ing and statistically optimal near-field acoustic holography (sonah) systems.
the companyIsuzu Motors Limited is a japanese commercial vehicle and diesel engine manufacturing com-pany, with headquarters in Tokyo . Since the first truck rolled off the assembly line more than 80 years ago, Isuzu has been pioneering technological innovations . Isuzu’s corporate vi-sion is to be a leader in transportation, com-mercial vehicles and diesel engines, supporting its customers and respecting the environment .
Isuzu Motors Limited now focuses on trucks and buses with production in japan, Thailand and various other countries . The trucks range from small pickups to very heavy trucks .
Today, engines are still the heart of Isuzu, and over 20 million of them have been deliv-ered to customers worldwide . They range from 2 .5-litre (4-cylinder) to 16-litre (6-cylinder) and are noted for their reliability and durability . In fact, Isuzu is the supplier of diesel engines to Opel and General Motors . As well as trucks, Isuzu engines are also used in the marine mar-ket and for industrial machinery such as exca-vators and cranes . Isuzu’s main focus is on de-veloping diesel powertrains and improving powertrain quality .
Isuzu’s R&D facilities are located at its Fujisawa plant in Kanagawa Prefecture, south of Tokyo . First commissioned in 1961, this huge site also handles the assembly of commercial vehicles, and manufactures various components .
Isuzu’s relationship with Brüel & Kjær goes back more than 30 years and all their micro-phones and the majority of their accelerome-ters are from Brüel & Kjær . In addition, Isuzu has many PULSE data acquisition and analysis
systems and some wheel arrays . A large por-tion of FFT and CPB analysis at Isuzu is done using PULSE .
Why map sound quality metrics?In recent years, environmental issues have placed emphasis on vehicle emission and vehicle noise including improved engine noise perfor-mance . It is becoming increasingly important not just to reduce the radiated sound pressure, but also to improve the sound quality of vehicles for the comfort of both passengers and local residents . Isuzu regards sound quality as a key selling point and differentiator .
Diesel engines make a characteristic noise known as diesel clatter, diesel nailing, or diesel knock . This is caused largely by the sudden combustion of fuel that has already evaporat-ed when combustion starts . Although unavoid-able, this sound is not desirable and it is notori-ously difficult to identify precisely where the sound is coming from .
Traditional microphone array techniques, such as beamforming and near-field acoustic holography (NAH) localise noise sources based on physical quantities such as sound pressure and sound intensity . However, other sources may have higher values of sound quality met-rics, so the objective data in the contour plot may not accurately reflect one’s subjective per-ception . For example, improving the perceived sound quality of diesel engines may require the identification of noise sources emitting im-pulsive or rough sounds rather than having higher sound pressure level . For this reason, Isuzu got together with Brüel & Kjær to devel-op mapping of sound quality metrics, where noise sources can be identified based on their sound character using perception-based met-rics such as loudness, sharpness and roughness . Together, they also developed a new impul-siveness algorithm to clearly identify the source of impulsive noise in diesel engines .
“The goal behind mapping sound quality metrics is to identify annoying or bad quality sound,” says Mr . Haruki Saito, Manager and Specialist, Noise & Analysis Experiment Group . He continues, “In the past we could measure overall sound pressure level, but the measure-ment was objective and did not provide subjec-tive analysis of the sound as perceived by hu-mans .”
simulationIn order to validate the sound quality map-ping, a simulation using ideal point sources with different sound characteristics was per-formed . It was carried out using both beam-forming and acoustic holography techniques . In the simulation, individual sources had a dominant sound character, for example, sound pressure level, loudness, sharpness, roughness, and impulsiveness, and they were separated spatially on a source plane .
For the simulation of beamforming, a 66-channel wheel array with a diameter of 1m was used, and monopoles were distributed on the source plane 1 metre away from the micro-phone array . For the simulation of acoustic ho-lography an 8 × 8 rectangular array of micro-phones was used with a spacing of 5 cm, and a distance to source of 7 .5 cm .
In the simulation of both array techniques, the sound quality mapping was able to identify sound sources based on their individual charac-teristics rather than using traditional measures such as sound pressure, and the results corre-sponded well with those based on the designed characteristic of individual sources .
integrating the algorithmFollowing simulation and validation, Brüel & Kjær and Isuzu together developed an impulsiveness algorithm to reliably predict the perceived impulsiveness of diesel engine noise . It was confirmed to be useful by comparing the predicted impulsiveness with the results of a lis-tening experiment where perceived impulsive-ness of diesel engine noises was evaluated . The impulsiveness algorithm was then integrated
case study
isuzu – improVing tHe sound Quality of diesel engines

37www.bksv.com/pulse
Mapping various metrics using
beamforming. From top to bottom –
stationary loudness, roughness, and
combined metrics.
Using an 84-channel sector wheel array, beamforming and SONAH measurements were carried out in a hemi-anechoic chamber on both engine A (left) and engine B (right)
case study
isuzu – improVing tHe sound Quality of diesel engines
with sound quality mapping in order to identify impulsive noises in a more efficient manner .
engine noise testingFinally, the mapping of sound quality metrics was applied to practical measurements of two diesel engines (A and B) designed for commer-cial vehicles – the first, a 5 .2 l, in-line 4-cylinder engine and the second, a 9 .8 l in-line 6-cylinder engine .
To cover a broad frequency range, both beamforming and SONAH methods were used – beamforming to identify noise sources at high frequencies and SONAH at low frequen-cies . An 84-channel sector wheel array of 0 .5 m diameter was used to perform all measure-ments . Mr . Saito says, “It takes about a day to set up the system, make the measurements on three surfaces and process the data using Brüel & Kjær’s PULSE platform software .” Measurements included Run-up/run-down from idle to maximum RPM as well as steady state .
The resulting location of problematic noise sources in the sound quality maps disagreed largely with that of traditional sound pressure maps . In the case of the beamforming and SONAH tests on engines A and B, modifications were made on the head cover and the valve gap, and the effect of the modification was validated by performing measurements using a single mi-crophone positioned at a distance of 1m .
Mr . Saito says, “By identifying the problems we can make design changes and ultimately im-prove the sound quality . But we have to decide which metrics are important for various engine conditions, for example, one of the methods is to record the sound quality metric followed by jury evaluation .” He continues, “At the moment, we focus mainly on airborne noise . The domi-nant diesel engine noise is from 800 Hz to 4 kHz . Injector and turbo charger noise can reach 10 kHz and this is currently measured using PULSE and one microphone . we’re very inter-ested to see if the frequency range of sound quality metrics mapping can be increased so that these noise sources can be fully evaluated .”
Isuzu no longer considers sound quality met-rics mapping to be an experimental technology and is the first company in the world to active-ly use this solution to perform real measure-ments . Mr . Saito believes that, “Sound quality metrics mapping software will be very benefi-cial to Isuzu and will become an increasingly valuable tool . The initial tests were made to examine the sound quality of the powertrain on a test bench . However, having seen the re-sults, the department responsible for testing on whole vehicles with engines installed is very interested in using the same technology .” He concludes, “I am very satisfied with sound quality metrics mapping and it has huge po-tential to enable Isuzu to develop our diesel engines that will continue to lead the world .”
now available as standardAs a result of the cooperation between Brüel & Kjær and Isuzu, mapping of sound quality metrics has been implemented in PULSE Beamforming Type 8608 and PULSE Acoustic Holography Type 8607 and is the world’s first commercially available sound quality metrics mapping software for beamforming and SONAH systems – a first class example of how Brüel & Kjær and one of its key customers worked together to develop cutting edge tech-nology for the automotive industry .

consumers identify the sound of any product
as a major component of its overall quality,
and while sound quality has been important
to the automotive industry for decades, it is
now a primary concern for manufacturers
of items as diverse as consumer appliances,
office equipment, power tools, marine equip-
ment, and heavy machinery.
achieving desirable sound quality requires
tools to identify those key characteristics of
sound that correlate to consumer perceptions
of quality. jury evaluation tools then allow
developers and consumers to experience and
evaluate the sounds.
pulse sound Quality type 7698 provides
tools for recording, playback, analysis, com-
parison, modification and characterisation,
and it can be extended with the software
options zwicker loudness Bz-5265, order
analysis Bz-5277 and psycho-acoustic test
Bench Bz-5301.
automotive sound Quality Bundle Bz-
6047 contains an extensive tool set for re-
cording, analysing, auditioning, dissecting,
and synthesising sounds, and enables objec-
tive and achievable sound quality targets that
are specified in engineering terms.
starting a new family of sound quality
software, pulse reflex sound Quality metrics
type 8710 offers a full suite of metrics inte-
grated into the high productivity pulse reflex
core environment.
sounD QuAlity – binAurAl recorDing
7698, bz-6047, 7708, lAn-Xi
Multi-channel, 160 dB dynamic range recording with Time Data Recorder
Type 7708 and PULSE LAN-XI Data Acquisition Hardware .
f 2 sound channels + 2 tachometer channels via sound card (Type 7698/
BZ-6047)
f Head and Torso Simulator (HATS) Type 4100 or Binaural Microphone
Type 4101 for ultra-realistic binaural recording
sound Quality
PULSE Sound Quality Software Type 7698 provides many different ways to edit or modify sound signals. You can listen to the change in sound immediately after modifying it.
sounD QuAlity
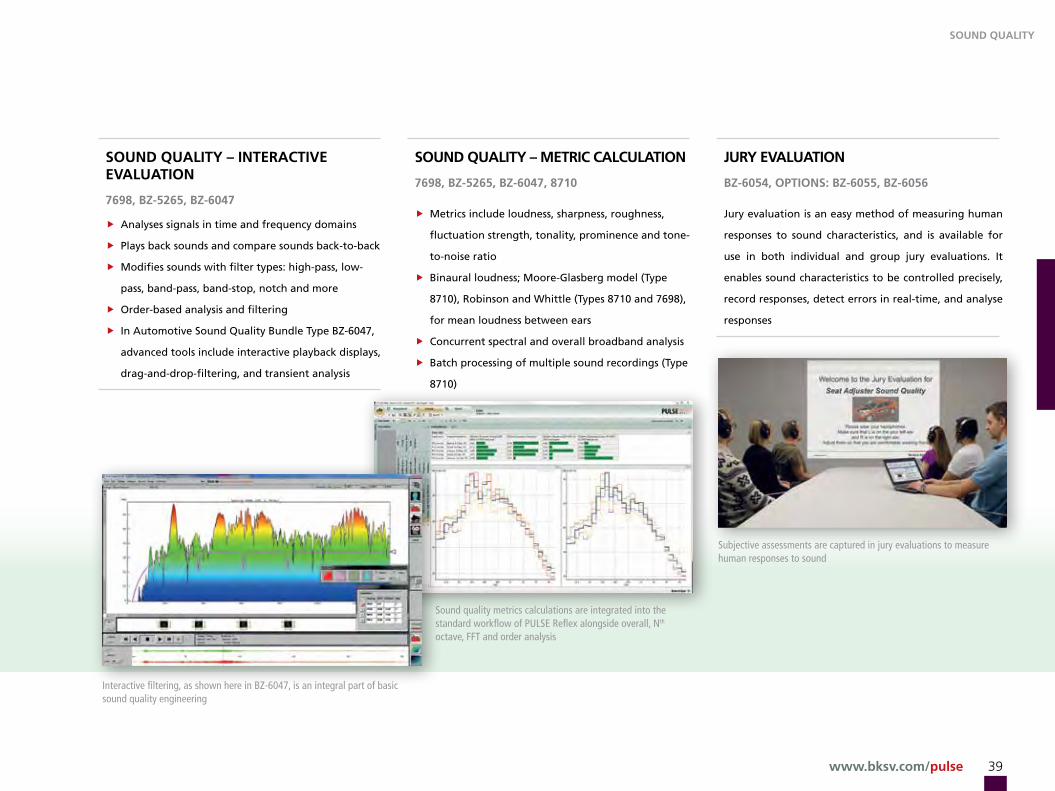
www.bksv.com/pulse 39
sounD QuAlity – interActiVe eVAluAtion
7698, bz-5265, bz-6047
f Analyses signals in time and frequency domains
f Plays back sounds and compare sounds back-to-back
f Modifies sounds with filter types: high-pass, low-
pass, band-pass, band-stop, notch and more
f Order-based analysis and filtering
f In Automotive Sound Quality Bundle Type BZ-6047,
advanced tools include interactive playback displays,
drag-and-drop-filtering, and transient analysis
sounD QuAlity – Metric cAlculAtion
7698, bz-5265, bz-6047, 8710
f Metrics include loudness, sharpness, roughness,
fluctuation strength, tonality, prominence and tone-
to-noise ratio
f Binaural loudness; Moore-Glasberg model (Type
8710), Robinson and whittle (Types 8710 and 7698),
for mean loudness between ears
f Concurrent spectral and overall broadband analysis
f Batch processing of multiple sound recordings (Type
8710)
Jury eVAluAtion
bz-6054, oPtions: bz-6055, bz-6056
jury evaluation is an easy method of measuring human
responses to sound characteristics, and is available for
use in both individual and group jury evaluations . It
enables sound characteristics to be controlled precisely,
record responses, detect errors in real-time, and analyse
responses
sound Quality
Interactive filtering, as shown here in BZ-6047, is an integral part of basic sound quality engineering
Subjective assessments are captured in jury evaluations to measure human responses to sound
Sound quality metrics calculations are integrated into the standard workflow of PULSE Reflex alongside overall, Nth octave, FFT and order analysis
sounD QuAlity

050283/4
Radar and Tripod
Mic. 2 and Tripod 4189 + UA-0801
Mic. 1 and Tripod4189 + UA-0801
WLAN with Omnidirectional
Antenna
In-vehicle Equipment
Reflector
Photocell and TripodWU-0584 + UA-0801
Weather Station WQ-3070-W-001
Throttle Position SensorMM-0097
In-vehicle Suitcase 3643
Operator PC
Ground Station3645 + WLAN
Diversity antennas on ground
Control Room
certifying that vehicles comply with noise emission specifica-
tions requires measuring according to procedures defined by
international standards. these specify a test of powertrain and
tyre/road noise under typical urban traffic conditions, putting
stringent demands on pass-by and coast-by noise testing.
test equipment must support the specialised measure-
ment methods and validate the defined values dictated by
the test standard.
our solutions cover the full spectrum of pass-by testing –
from simple conformance testing to multi-channel diagnostics.
all of our pass-by solutions (outdoor or indoor) support the
most common international standards, including iso 362, sae
j1470, iso 13325 and iso 5130.
in addition, our beamforming array selection provides out-
door sound mapping, helping to accurately locate the sound
sources that contribute to the vehicle’s sound.
VeHicle pass-By noise testing
Vehicle Pass-By system overview
Pass-by In-vehicle Box Type 3643
Vehicle PAss-by noise testing

www.bksv.com/pulse 41
PAss-by conforMAnce test systeM
PULSE Vehicle Pass-by Software Type 7788-A
f Ground-controlled
f Speed measurements by radar
f Reporting and data storage using standard Micro-
soft® word or Microsoft® Excel®
f RPM measurements using telemetry (option)
f weather station (option)
f Two-directional (option)
custoMiseD, grounD stAtion only
PULSE Vehicle Pass-by Software Type 7788-B
f Ground-controlled or vehicle-controlled via w-LAN
f Data storage in the PULSE Data Manager (PDM)
database
f Post-processed results and time data
f Reporting in Microsoft® word, Microsoft® Excel®, or
advanced reporting using PDM
f Additional ground signals
f Data recording (raw time signals)
f Auto start/save
custoMiseD, grounD stAtion AnD in-Vehicle, PAss-by systeM
PULSE Vehicle Pass-by Software Type 7788-C
f Ground-controlled vehicle-controlled using w-LAN
f Data storage in the PDM database
f Post-processed results and time data
f Reporting in Microsoft® word, Microsoft® Excel®, or
advanced reporting using PDM
f Additional ground and in-vehicle signals
f Data recording (raw time signals)
f Auto start/save
f GPS speed can be used
f GPS sync for synchronising front-ends
VeHicle pass-By noise testing
Results can be put directly into Microsoft® Word and Microsoft® Excel®
Advanced reporting with PULSE Data Manager (PDM)
Measurements according to standards
Vehicle PAss-by noise testing

42
measuring a vehicle’s interior and exterior noise dur-
ing operation is far simpler indoors, using large semi-
anechoic chambers containing chassis dynamometers
– as many automotive manufacturers and sub-sup-
pliers do. eliminating variables such as weather and
site variations makes measurements more reproduc-
ible, while the stationary vehicle allows more instru-
mentation.
simulation of normal pass-by noise is achieved
by placing a row of microphones alongside the test
vehicle so that there is no need to drive the test
vehicle past stationary microphones, as is standard
in a conventional outdoor pass-by measurement.
instead the vehicle is accelerated in the same way
on a chassis dynamometer.
simultaneous recordings are taken of a tachom-
eter signal from the dynamometer, the vehicle’s ex-
terior noise at all microphone positions, and any
additional vehicle parameters. tyre noise correction
then assists accurate comparisons with field pass-
by measurement results.
smaller rooms that lack the spatial dimensions
dictated by the current iso 362 pass-by standard
are also suitable environments for indoor pass-by
testing. even where the required 7.5 m width from
the vehicle centre-line and more than 20 m length
will not fit in an anechoic room, our software ac-
curately extrapolates the measurements.
the time-domain-based calculations enable
doppler-effect correction, as well as audible play-
back analysis with recorded and synthesised signals
– helping you to quickly identify areas of interest.
the measurement and calculation procedure
satisfies the iso 362 pass-by standard and is ready
for the new standard that will replace it, which will
make indoor pass-by noise testing a standard con-
formance test alongside field pass-by testing.
indoor pass-By noise testinginDoor PAss-by noise testing
inDoor PAss-by test
7700-n, 7793
Simulation of vehicle pass-by noise testing in hemi-anechoic rooms
for product development and trouble-shooting .
f Test setup can be created in Microsoft® Excel® and later import-
ed into the system
f Support of non-optimal room size through flexible definition of
microphone array
f Simulation of Doppler effect
f Tyre noise correction allows substitution with tyre noise meas-
ured on the test track
f Pass-by values automatically calculated upon completion of
measurement
f Exterior noise contribution analysis is available with indicator
microphones and volume velocity sound source

www.bksv.com/pulse 43
eXterior noise contribution AnAlysis
Calculation of exterior noise contribution in time-domain from the various noise
sources .
f Sum of contributions may be compared with the measured total level to validate
the component contributions
f Source modelling of components such as engine, transmission, exhaust/intake, tyres
f Contribution results may be exported to Microsoft® word or Microsoft® Excel® for
further analysis and reporting
indoor pass-By noise testing
The microphone array for indoor pass-by setup can be configured in Microsoft® Excel® and then imported
Exterior noise contribution results of individual sound source components System configuration for indoor pass-by and exterior noise contribution analysis
inDoor PAss-by noise testing
VVS Tube Assembly UA-1684

44
nVH simulation accurately reproduces the noise
and vibration of a vehicle in a realistic interactive
driving environment, allowing measured data from
vehicles and components, target levels, and data
from cae models to be evaluated.
simulation improves understanding of customer
preferences, vehicle-level target setting, cascading
of subsystem and component targets, evaluating
engineering changes, managing evaluation, target
sign-off, and troubleshooting.
engineering vehicle sound to match brand and
customer expectations is assisted with a range of
jury evaluation and engineering interfaces that al-
low assessors and engineers to interact with the
nVH data in real-time.
Pulse nVh Vehicle siMulator Versions:
f desktop nVH simulator – featuring a steering
wheel, pedals, gear shift lever/paddles for
interactive evaluation of nVH data by assess-
ing the different sounds and vibrations as you
‘drive’ through a changing virtual scenario.
f full-vehicle nVH simulator – re-creates sound
and vibration stimuli in a stationary, complete
vehicle with a projection screen showing the
virtual scenario. this provides a controlled,
immersive evaluation environment for design
evaluation of sound and vibration.
f dts on-road simulator – imports nVH data
into an actual ‘mule’ car and re-creates vehicle
sound in real-time, synchronising sounds to
perfectly match vehicle speed, engine speed,
pedal position and more parameters.
f dts exterior sound simulator – facilitates
sound design by assessing exterior sound and
auditioning alternatives. it assists design-
ing and assessing electric and hybrid vehicle
sound, as well as ‘conventional’ vehicle sound
such as exterior exhaust sound quality.
nVH simulatorDesKtoP nVh siMulAtor
3644, 8601
Data preparation software enables NVH and vehicle performance
data to be extracted from recordings made on the road, a test bench
(or any other source of NVH data) and prepared for free driving in
an NVH simulator . Available modules include:
f Core and visuals module – enables the user to configure data
into vehicle models, build virtual vehicles for assessment, choose
which vehicles to compare in a test, and drive the vehicles
interactively with virtual instrumentation for feedback of vehicle
RPM, gear and speed information
f jury evaluation module – enables the user to compare vehicle
sounds in a structured jury evaluation, store results, and perform
initial processing on them
f Engineering module – enables the user to control, modify and
save individual sounds representing components of the vehicle
f Engineering and jury module – gives the benefit of both mod-
ules and allows the user to design and engineer the sound of
the vehicle and perform structured evaluations to get qualified
subjective opinions of the results
nVh siMulAtor

www.bksv.com/pulse 45
Scan here to see a video of the NVH Simulator:
Dts on-roAD siMulAtor
8601-n
The DTS On-road Simulator allows vehicle sounds cre-
ated using the Desktop NVH Simulator to be expe-
rienced in a real car while driving on the road . The
sounds of the existing vehicle are modified rather
than replaced, resulting in a very natural presenta-
tion of the target sounds
eXterior sounD siMulAtor
8601-t
The Exterior Sound Simulator utilises the powerful
capabilities of the NVH Simulator for sound creation,
modification and evaluation, and applies these to ex-
terior vehicle sound .
f For ‘quiet vehicle’ applications
f For exterior sound quality applications
nVH simulator
The DTS On-road Simulator is used for back-to-back evaluations of bench-marked vehicles or proposed targets, while driving a real ‘mule’ vehicle
A variety of visual road scenarios can be selected. Custom scenarios featuring real-world test tracks and roads can be easily created.
Real-time spectral analysis, modification, and recording of subjective preference (and the driver’s actions) are always available while driving and interacting with sound contributions.
The DTS Exterior Sound Simulator is used to design and evaluate the sounds of the vehicle,
as heard by pedestrians
nVh siMulAtor
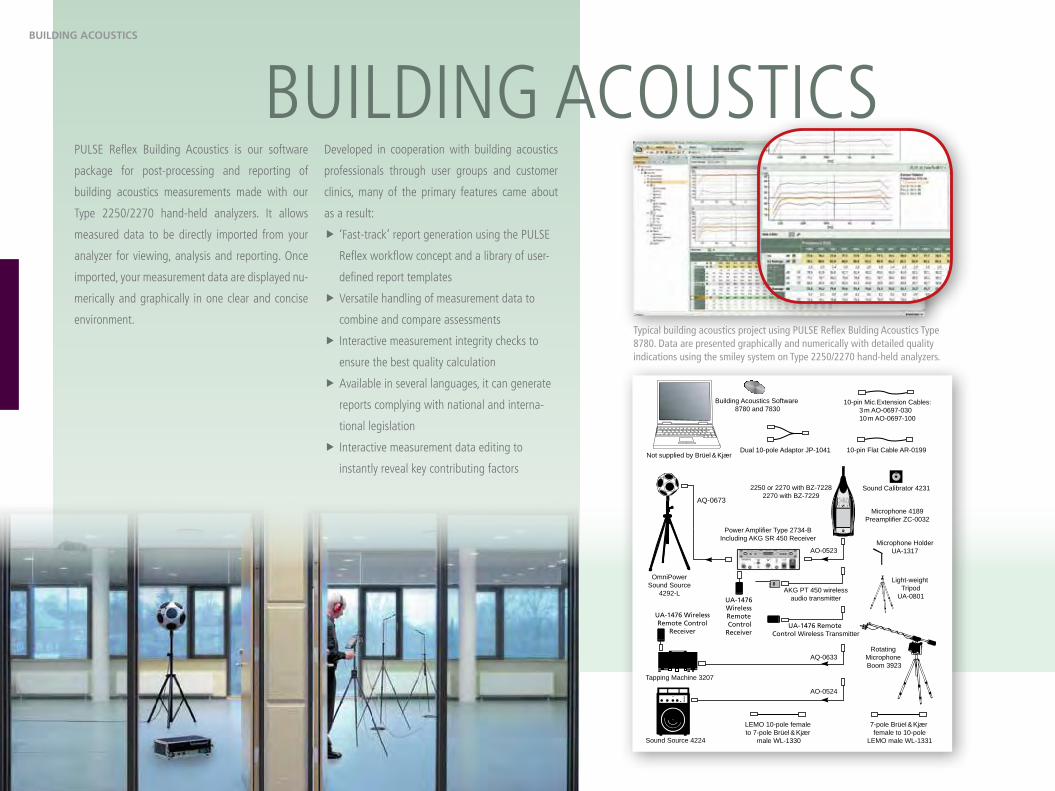
4646
Sound Source 4224
OmniPowerSound Source
4292-L
10-pin Flat Cable AR-0199Dual 10-pole Adaptor JP-1041
10-pin Mic.Extension Cables:3 m AO-0697-030 10 m AO-0697-100
LEMO 10-pole female to 7-pole Brüel & Kjær
male WL-1330
Sound Calibrator 42312250 or 2270 with BZ-72282270 with BZ-7229
Microphone 4189Preamplifier ZC-0032
Rotating Microphone Boom 3923
Light-weight Tripod
UA-0801
Microphone HolderUA-1317
Building Acoustics Software 8780 and 7830
Not supplied by Brüel & Kjær
AO-0523
AQ-0633
AO-0524
7-pole Brüel & Kjær female to 10-pole
LEMO male WL-1331
Tapping Machine 3207
UA-1476 Wireless Remote Control
Receiver
UA-1476 Wireless Remote Control
Receiver
Power Amplifier Type 2734-BIncluding AKG SR 450 Receiver
UA-1476 Remote Control Wireless Transmitter
AKG PT 450 wirelessaudio transmitter
AQ-0673
pulse reflex Building acoustics is our software
package for post-processing and reporting of
building acoustics measurements made with our
type 2250/2270 hand-held analyzers. it allows
measured data to be directly imported from your
analyzer for viewing, analysis and reporting. once
imported, your measurement data are displayed nu-
merically and graphically in one clear and concise
environment.
developed in cooperation with building acoustics
professionals through user groups and customer
clinics, many of the primary features came about
as a result:
f ‘fast-track’ report generation using the pulse
reflex workflow concept and a library of user-
defined report templates
f Versatile handling of measurement data to
combine and compare assessments
f interactive measurement integrity checks to
ensure the best quality calculation
f available in several languages, it can generate
reports complying with national and interna-
tional legislation
f interactive measurement data editing to
instantly reveal key contributing factors
builDing Acoustics
Building acoustics
Typical building acoustics project using PULSE Reflex Bulding Acoustics Type 8780. Data are presented graphically and numerically with detailed quality indications using the smiley system on Type 2250/2270 hand-held analyzers.

47www.bksv.com/pulse
to guarantee the maintenance of aircraft en-
gines and optimise aircraft uptime, our vibra-
tion check systems perform field verification
on specific engines. measurements are made
according to the procedures specified by the
engine manufacturer’s main tenance manual.
tur bo meca-based engine maintenance sys-
tems are available for 22 different variants, cov-
ering arriel, makila, arrius, turmo, ardiden and
rtm 322 engines among others. new systems
for other engine types can easily be developed
by our customised project department.
all verification of vibration levels is per-
formed in one engine run-up, with reference
to two tacho meter signals: one from the gas
generator and one from the power turbine
(free turbine). a warning is given if level limi-
tations are exceeded.
results are automatically stored in a da-
tabase and displayed in a contour plot show-
ing frequency, speed and level, in order to
aid fault diagnosis. a report is produced im-
mediately, ac cor ding to the manufacturer’s
template.
ViBration cHecKVibrAtion checK systeM for AircrAft engines
8324-g, 4 inPuts
PULSE Vibration Check System including:
f Necessary software, portable PC, etc .
f Accelerometer with high-temperature cable, integrated charge converter/
filter and TEDS (10 m in all)
engine-sPecific setuP
uA-1678-A-0XX
f PULSE Vibration Check System for Turbomeca engines, node-locked license
f Annual Software Maintenance and Support Agree ment
f Tacho harness
f Shoulder-bag for cables
Vibration referenced to the two tachos, engine run-up speed profile, and test and pass/fail information
for aircraft engines
VibrAtion checK for AircrAft engines

4848
rising fuel costs and growing environmental con-
cerns put pressure on manufacturers to develop
higher efficiency engines and powertrains with
lower emissions. this development direction would
traditionally lead to lower horsepower and degrad-
ed nVH performance:
tougher eMissions legislation
f in existing engines, this can result in higher
combustion noise and an increase in the
contribution from powertrain noise to overall
vehicle noise
deMand for better fuel econoMy
f leads to new and lighter engines with smaller
water passages and less damping of power-
train noise
f requires lightweight and low-friction gearbox-
es with increased gear noise and gear rattle
f increasing use of 2- and 3-cylinder engines
with inherent imbalance
the market, however, still expects good driving per-
formance and superior comfort – thus increasing
the challenge for nVH engineers.
the pulse platform provides a wide range of tools
for general powertrain nVH analysis and simulation in
the context of the whole vehicle. our systems perform
angle domain analysis alongside other types of analy-
sis, such as fft and 1/3-octave noise analysis.
the angle domain offers a different perspective on
nVH issues where the angular position of a rotating
component (often the engine crankshaft) can reveal
noise sources which are cyclic in nature, such as the
firing of a particular cylinder, or a mechanical excita-
tion occurring at a fixed point in the duty cycle.
angle domain analysisAngle DoMAin AnAlysis
4393 Charge Accelerometer measuring fuel injector pulsing
4526 Hi-temp Accelerometer measuring fuel combustion
4527 Hi-temp Accelerometermeasuring piston knock
Pressure sensor measuringcylinder pressure
Magnetic pick-up measuring flywheel pulses
Torque meter (on Dyna-TTmometer) measuring dynamic torque
2981 Laser Tacho Probe measuring TDC on flywheel
Crankshaft encoder measuring angle pulses
3056-A -040
LAN-XI
120595
3053-B -120
LAN-XI
4326 Charge Accelerometer
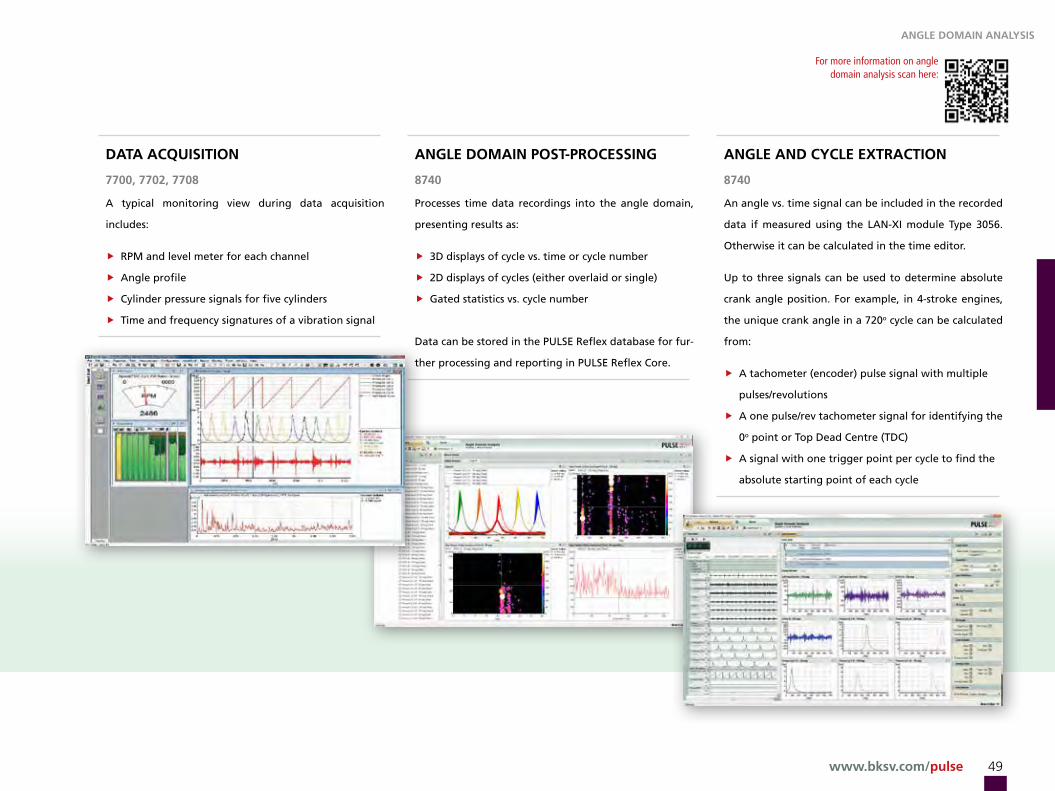
49www.bksv.com/pulse
For more information on angle domain analysis scan here:angle domain analysis
Angle DoMAin AnAlysis
DAtA AcQuisition
7700, 7702, 7708
A typical monitoring view during data acquisition
includes:
f RPM and level meter for each channel
f Angle profile
f Cylinder pressure signals for five cylinders
f Time and frequency signatures of a vibration signal
Angle DoMAin Post-Processing
8740
Processes time data recordings into the angle domain,
presenting results as:
f 3D displays of cycle vs . time or cycle number
f 2D displays of cycles (either overlaid or single)
f Gated statistics vs . cycle number
Data can be stored in the PULSE Reflex database for fur-
ther processing and reporting in PULSE Reflex Core .
Angle AnD cycle eXtrAction
8740
An angle vs . time signal can be included in the recorded
data if measured using the LAN-XI module Type 3056 .
Otherwise it can be calculated in the time editor .
Up to three signals can be used to determine absolute
crank angle position . For example, in 4-stroke engines,
the unique crank angle in a 720o cycle can be calculated
from:
f A tachometer (encoder) pulse signal with multiple
pulses/revolutions
f A one pulse/rev tachometer signal for identifying the
0o point or Top Dead Centre (TDC)
f A signal with one trigger point per cycle to find the
absolute starting point of each cycle

50
8206-200 Hammer
Front-end
MeasurementStation
4299 Volume Velocity Source
4524 Triaxial Accelerometer
4958 Array Microphone
4101Binaural Microphone
Powertrain Radiated
Powertrain Structure-borne
Intake Orifice
Exhaust Radiated
Exhaust Structure-borne
Ancillaries
4949 Surface Microphone
Wind2981Tacho probe
How will each component contribute to the overall
sound of a product? How can you tell where the
sound is coming from? How does it travel to where
you hear it? and what can you do to improve the
sound of the vehicle?
whether assessing the contributions of an en-
gine on a test bed, or identifying operational con-
tributions on the road, time-domain source path
contribution (spc) allows you to assess transfer
paths and contributions to quickly evaluate the
noise and vibration perceived by vehicle occupants.
our unique time-domain technology allows you
to listen to and compare data sets back-to-back,
and assess the effects that developments will have
on the final products through spc models. the sys-
tem can also inspect data in the frequency domain,
giving great flexibility.
understanding how noise and vibration is trans-
mitted through different paths in and around the
vehicle allows you to rank contributions using vari-
ous nVH methods such as mount-stiffness and im-
pedance matrix methods for structure-borne nVH,
and source-substitution for airborne nVH.
using data recorded in the time domain means
you can solve any potential problems during analy-
sis from a safely captured data set, while you are
listening to or evaluating the calculated time sig-
nals.
time domain source patH contriButionPulse sPc Viewer
7798-A
General base license for all SPC methods .
Pulse sPc Mount stiffness AnD iMPeDAnce MAtriX MethoDs
7798-b
Frequency-domain structure-borne and airborne contribution
analysis (mount stiffness and impedance matrix) . Post-processing
analysis of contributions, source strengths and path sensitivities .
tiMe DoMAin source PAth contribution

www.bksv.com/pulse 51
Pulse sPc MAtriX MethoD with Prin-ciPle coMPonent DecoMPosition
7798-c
Frequency-domain quantification of non-correlated con-
tributions to the receivers . Identifies source strengths of
airborne sources via microphone indicator positions and
the use of principal component analysis to derive proper
acoustic source models .
Pulse sPc MultiPle coherence MethoD tyPe
7798-D
The SPC Multiple Coherence module allows the quick as-
sessment of contributions from multiple uncorrelated or
partially correlated sources, such as tyre noise in a vehicle .
Pulse tiMe DoMAin sPc
7798-e
Time-domain SPC calculates contributions, source
strengths and forces using matrix inversion, source
substitution and mount stiffness methods in the time-
domain . The time-domain SPC results can be replayed
and viewed in the SPC software . Typically they are ana-
lysed using SPC Time Insight to rapidly evaluate, analyse,
modify, compare and communicate the results . They can
be further analysed using PULSE Reflex to quickly and
efficiently view orders, spectra, waterfall spectra, com-
pare source and contribution levels, and generate test
reports . The time-domain results can also be used in the
PULSE NVH Vehicle Simulator as part of a fully interac-
tive driving simulation .
sPc tiMe insight
8601-s
SPC Time Insight allows you to play back, analyse and
modify time-domain SPC results . It performs in-depth
root-cause analysis, changes source levels and path sen-
sitivities to reflect possible design changes, sets target
levels, and compares measurements side-by-side . Users
can observe and analyse data in real-time or off-line, and
easily evaluate and communicate results .
time domain source patH contriButiontiMe DoMAin source PAth contribution
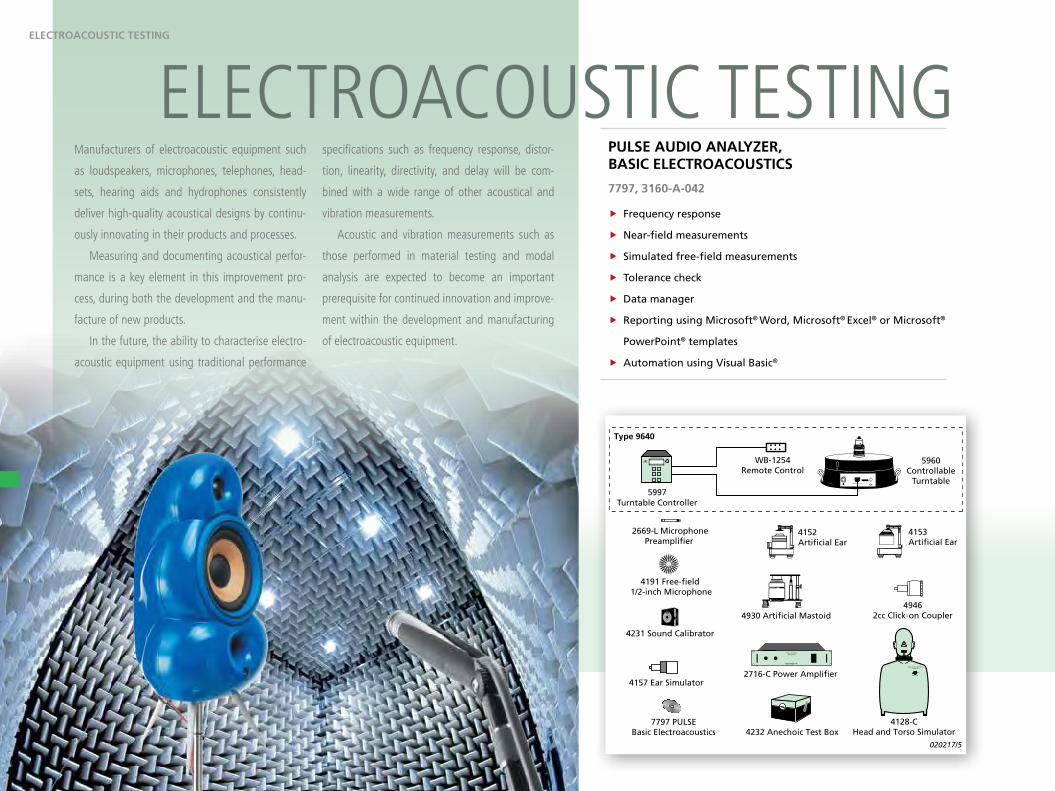
52
4128-CHead and Torso Simulator
type 9640
2669-L Microphone Preamplifier
4930 Artificial Mastoid
020217/5
7797 PULSEBasic Electroacoustics
4153Artificial Ear
5960Controllable
Turntable
B K7/6-'89
Brüel & Kjær
Mode Enter
Start Stop
PowerOn
Turntable Controller Type 5949
5997Turntable Controller
wB-1254Remote Control
bbb K
brüel & Kjær
Head and Torso SimulatorType 4128
4157 Ear Simulator
4191 Free-field 1/2-inch Microphone
4152Artificial Ear
4232 Anechoic Test Box
2716-C Power Amplifier
Power AmplifierType 2716 C
4231 Sound Calibrator
+20d
bo
n&
off
49462cc Click-on Coupler
manufacturers of electroacous tic equipment such
as loudspeakers, microphones, telephones, head-
sets, hearing aids and hydro phones consistently
deliver high-quality acoustical designs by continu-
ously inno vating in their products and processes.
measuring and documenting acoustical perfor-
mance is a key element in this improvement pro-
cess, during both the development and the manu-
facture of new products.
in the future, the ability to characterise electro-
acoustic equipment using traditional performance
specifications such as frequency response, distor-
tion, linearity, directivity, and delay will be com-
bined with a wide range of other acoustical and
vibration measurements.
acoustic and vibration measurements such as
those performed in material testing and modal
analysis are expected to be come an important
prerequisite for continued innovation and im prove-
ment within the development and manufacturing
of electro acoustic equipment.
electroacoustic testingPulse AuDio AnAlyzer, bAsic electroAcoustics
7797, 3160-A-042
f Frequency response
f Near-field measurements
f Simulated free-field measurements
f Tolerance check
f Data manager
f Reporting using Microsoft® word, Microsoft® Excel® or Microsoft®
PowerPoint® templates
f Automation using Visual Basic®
electroAcoustic testing

www.bksv.com/pulse 53
Pulse ProfessionAl AuDio AnAlyzer, ADVAnceD electro-Acoustics
7907-s1, 3160-A-042
Features as Basic Electroacoustics, plus:
f Harmonic distortion measurements
f Intermodulation distortion for near-field
measurements
f DIFF distortion measurement for near-field
measurements
f Directional response measurements and polar plot
f Thiele-Small parameters
f PULSE sequencer for automation
Pulse wiDe rAnge AuDio AnAlyzer
7797, 3560-c-t61
For measurement of loudspeakers and hydrophones .
f Frequency response
f Reporting using Microsoft® word, Microsoft®
Excel® or Microsoft® PowerPoint® templates
f Sequencing using Visual Basic®
f Distortion analysis
electroacoustic testingelectroAcoustic testing
Directivity measurements are performed using Steady State Response (SSR) or Time Selective Response (TSR) analysis, with the results displayed as a polar plot
Frequency response and distortion measurements are performed using SSR analysis, revealing results with a known high accuracy
Simulated free-field measurements using TSR analysis for determining frequency response and harmonic distortion

54
mobile conversations can take place almost any-
where – from quiet offices to noisy outdoor en-
vironments. and since users demand high voice
quality in all situations, the acoustic perception
of devices is critical. corded handset/headset tel-
ephones and mobile devices alike need advanced
acoustic and electronic signal processing combined
with superior design.
we offer two standardised test configurations,
with one configuration based on a telephone test
head equipped with a stand-alone mouth simula-
tor and ear simulator. the second configuration is
based on a Head and torso simulator (Hats), with
an integrated mouth simulator and one or two in-
tegrated ear simulators.
thanks to several decades of playing an active
part in standardisation within the telecommuni-
cation industry, Brüel & Kjær is regarded as the
worldwide industry reference, setting standards for
telephone testing worldwide.
our experience of providing high-quality acous-
tic solutions provides us with a solid foundation
from which to develop new products for emerging
telephone technologies and markets.
telepHone testingtelePhone testing using stAnDArDiseD ProceDures
8770, 8771, 8772
For performing measurements in compliance with international
and national standards for frequency response, loudness rating,
noise, distortion, echo, switching, etc .
f Perception-based evaluation of speech quality
f Measurements on handsets, headsets and hands-free com-
munication devices
f Imitates the use of communication devices in everyday life
f Supports Head And Torso Simulator (HATS) and telephone test
head configuration
f Automated calibration procedures
f Easy control of measurements
f Imports measurements from legacy telephone testing
software
f Ear and mouth simulator conforms to ITU-T P .51, P .57, P .58,
P .64, IEEE 269 and IEEE 661 standards
f Automatic reporting in Microsoft® word, Microsoft® Excel® or
Microsoft® PowerPoint®
telePhone testing

www.bksv.com/pulse 55
4128-D Head and Torso Simulator
4602-B Test Head Mouth Simulatorwith 4227 Mouth Simulator
4191 Free-field 1/2-inch
Microphone
2716-CPower Amplifier
4185Ear Simulator
4195wide Band Ear
Simulator
020230/4
UA-1317Microphone Holder
DP-0775Calibration Adaptor
for 1/4-inch Microphone
UA-0801 Lightweight
Tripod
4938Pressure-field 1/4-inch
Microphone2670Falcon Range® 1/2-inch
Microphone Preamplifier
Power AmplifierType 2716 C
+2
0d
bo
n&
off
4231Sound
Calibrator
bbb K
brüel & Kjær
Head and Torso SimulatorType 4128
telePhone testing in siMulAteD noise enVironMents
bz-5830, bz-5831, bz-5832, bz-5833
Evaluates noise suppression and speech enhancements
techniques under controlled conditions, using real
speech signals and environmental noises as background
sound .
f Creation of simulated noise environment using
standardised loudspeaker configurations
f Measurements of PESQ, SNRI, NPLR, ASL, etc .
f Measurements of S-MOS, N-MOS and G-MOS
f Automated calibration procedures
f Easy control of measurements
f Automatic reporting in Microsoft® word, Microsoft®
Excel® or Microsoft® PowerPoint® .
telepHone testing
Automated measurement execution and presentation of results including pass/fail indication are provided in a single screen view
Full documentation of the complete suite of tests is provided in a Microsoft® Word document exhibiting live curves and pass/fail indication
Data from various measurements which have been produced by the telephone test application can be compared with measurement data imported from the previous-generation telephone test application
telePhone testing
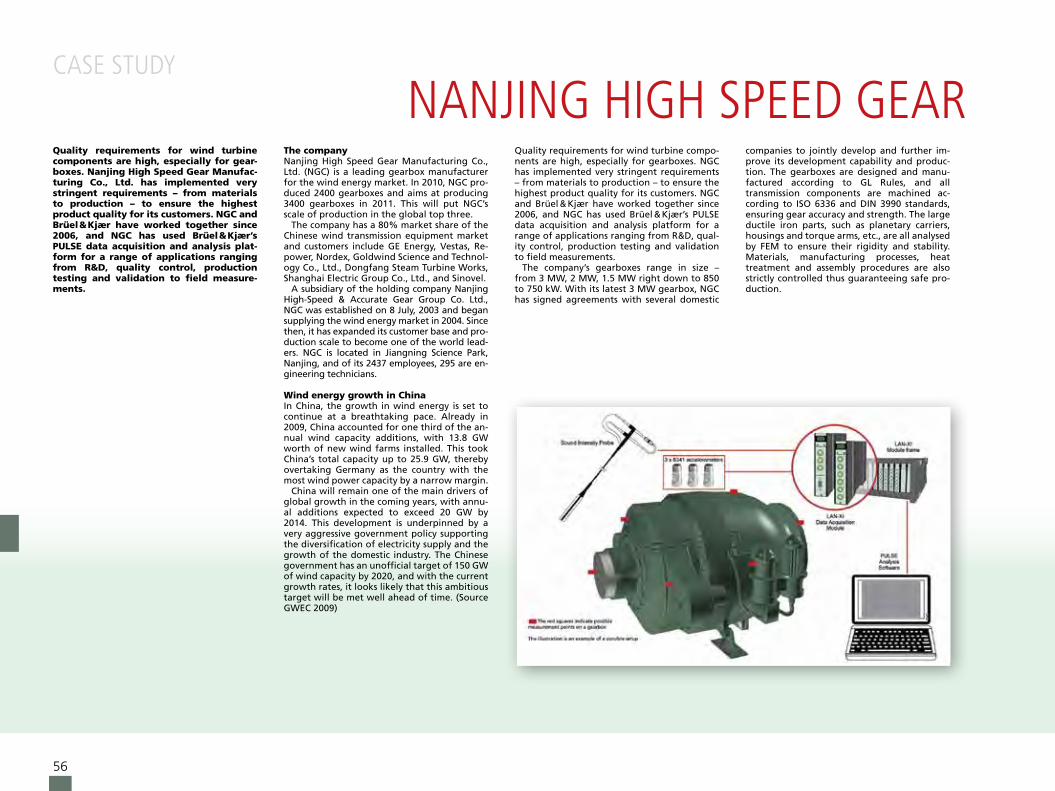
56
Quality requirements for wind turbine components are high, especially for gear-boxes. nanjing high speed gear Manufac-turing co., ltd. has implemented very stringent requirements – from materials to production – to ensure the highest product quality for its customers. ngc and brüel & Kjær have worked together since 2006, and ngc has used brüel & Kjær’s Pulse data acquisition and analysis plat-form for a range of applications ranging from r&d, quality control, production testing and validation to field measure-ments.
the companyNanjing High Speed Gear Manufacturing Co ., Ltd . (NGC) is a leading gearbox manufacturer for the wind energy market . In 2010, NGC pro-duced 2400 gearboxes and aims at producing 3400 gearboxes in 2011 . This will put NGC’s scale of production in the global top three .
The company has a 80% market share of the Chinese wind transmission equipment market and customers include GE Energy, Vestas, Re-power, Nordex, Goldwind Science and Technol-ogy Co ., Ltd ., Dongfang Steam Turbine works, Shanghai Electric Group Co ., Ltd ., and Sinovel .
A subsidiary of the holding company Nanjing High-Speed & Accurate Gear Group Co . Ltd ., NGC was established on 8 july, 2003 and began supplying the wind energy market in 2004 . Since then, it has expanded its customer base and pro-duction scale to become one of the world lead-ers . NGC is located in jiangning Science Park, Nanjing, and of its 2437 employees, 295 are en-gineering technicians .
Wind energy growth in chinaIn China, the growth in wind energy is set to continue at a breathtaking pace . Already in 2009, China accounted for one third of the an-nual wind capacity additions, with 13 .8 Gw worth of new wind farms installed . This took China’s total capacity up to 25 .9 Gw, thereby overtaking Germany as the country with the most wind power capacity by a narrow margin .
China will remain one of the main drivers of global growth in the coming years, with annu-al additions expected to exceed 20 Gw by 2014 . This development is underpinned by a very aggressive government policy supporting the diversification of electricity supply and the growth of the domestic industry . The Chinese government has an unofficial target of 150 Gw of wind capacity by 2020, and with the current growth rates, it looks likely that this ambitious target will be met well ahead of time . (Source GwEC 2009)
Quality requirements for wind turbine compo-nents are high, especially for gearboxes . NGC has implemented very stringent requirements – from materials to production – to ensure the highest product quality for its customers . NGC and Brüel & Kjær have worked together since 2006, and NGC has used Brüel & Kjær’s PULSE data acquisition and analysis platform for a range of applications ranging from R&D, qual-ity control, production testing and validation to field measurements .
The company’s gearboxes range in size – from 3 Mw, 2 Mw, 1 .5 Mw right down to 850 to 750 kw . with its latest 3 Mw gearbox, NGC has signed agreements with several domestic
companies to jointly develop and further im-prove its development capability and produc-tion . The gearboxes are designed and manu-factured according to GL Rules, and all transmission components are machined ac-cording to ISO 6336 and DIN 3990 standards, ensuring gear accuracy and strength . The large ductile iron parts, such as planetary carriers, housings and torque arms, etc ., are all analysed by FEM to ensure their rigidity and stability . Materials, manufacturing processes, heat treatment and assembly procedures are also strictly controlled thus guaranteeing safe pro-duction .
case study
nanjing HigH speed gear manufacturing co., ltd.

57www.bksv.com/pulse
NGC mainly produces wind turbine gearboxes. The plant covers an area of 258 acres (172 000 m2) and produces approximately 4000 MW annually
Photo courtesy of Nanjing High Speed Gear Manufacturing Co., Ltd.
case study
nanjing HigH speed gear manufacturing co., ltd.All gearboxes undergo a series of tests and
validations . These include nominal power test, 300% load test and stress test . Results show that the gearbox working efficiency is higher, the noise level and temperature rising is lower, and the tooth stress and load distribution are qualified . During testing, a large amount of data was gathered for use as the groundwork for the development of large power gearboxes .
A special lubrication cooling system has also been designed for all gearboxes . This system is internally circulated, and bearings and mesh-ing positions between gears are lubricated im-pulsively by the oil pump . The lubricating effi-ciency is highly improved and as a result is more reliable and safe .
Brüel & Kjær plays an important part in ensur-ing the highest gearbox quality at NGC . Every test bench at NGC’s two production facilities
has a Brüel & Kjær data acquisition and analysis system and every single gearbox is run through a production quality control measurement pro-gram that meets strict customer requirements and ensures the highest customer satisfaction .
Brüel & Kjær setups, similar to the one shown above, are used by NGC for research, design and development purposes . They were used during the development of the new 3 Mw gearbox and will also be used for the even larger gearboxes that are currently under de-velopment .
NGC does not compromise with quality and totally trusts the products provided by Brüel & Kjær . Equally important are the local presence and the relationship built over the years between NGC and Brüel & Kjær .
In fact, Brüel & Kjær is used exclusively at NGC and key reasons for this include a strong field
presence and assistance with test measure-ment setup, quick local support, reliable quali-ty and the wide range of sound and vibration solutions .
NGC selected Brüel & Kjær back in 2006 for sound and vibration quality control testing af-ter an in-depth evaluation of various suppliers . Today, it has Brüel & Kjær data acquisition and analysis systems installed at all test benches for both quality control in production and R&D .
NGC and Brüel & Kjær both look forward to future challenges, as the demands for larger gearboxes increase and new requirements for quality and reliability have to be met .

58
in rotating and reciprocating machines, varying
load conditions and imperfections in the moving
parts cause vibrations and associated sounds. the
vibrations are shaped by the structural properties
of the moving and stationary parts of the machine.
order analysis relates measurements to revolu-
tions of a rotating part, improving knowledge about
machinery such as aircraft and automotive engines,
powertrains, pumps, compressors and electric motors.
tyPical uses:
f separation of rotational and structural noise
and vibration phenomena
f identification of noise generated by rotational
vibrations
f determination of critical speeds and excited
resonances
f investigation of instabilities in rotating machin-
ery caused by varying load
order analysis Methods:
Without tracking – for analysis of lower or-
ders and moderate rpm slew rates, based on fre-
quency spectra from fft analyses
With tracking – for analysis of higher orders
or higher rpm slew rates, based on order spectra
and tracked resampling from tacho signals used as
reference
Both methods operate in real-time, providing
spectra, 3d plots like ‘colour contour’ or ‘campbell
diagram’, individual order, and structural slices ver-
sus rpm of one or more rotating parts. all methods
support the use of multiple tacho signals as refer-
ences, and with the autotracker functionality it is
possible to extract the tacho signal directly from a
measurement input, for example in cases where a
tacho signal is not directly available.
all data can be tagged with process data such
as temperature, oil pressure, position, wind speed,
and all order analysis results can be shown in rela-
tion to these auxiliary parameters.
order analysisorDer AnAlysis with trAcKing
7770-n, 7702-n, unliMiteD inPuts
This configuration provides FFT-based order analysis as well as
order tracking on an unlimited number of channels . Order track-
ing is useful when frequency smearing will compromise the FFT-
based analysis, and when:
f Higher orders are of interest
f Orders are not well separated
f RPM ranges are wide
f Slew rates are high
Order analysis with and without tracking, first and second order cut vs. time and run-up speed profile vs. time
orDer AnAlysis

www.bksv.com/pulse 59
orDer AnAlysis without trAcKing
7770-n, 7702-n2, unliMiteD inPuts
This basic configuration provides FFT-based order ana-
lysis on an unlimited number of channels with up to 2
tacho signals . FFT-based order analysis is an attractive
solution when:
f Only lower orders are of interest
f Orders are well separated
f RPM ranges are limited
f Slew rates are moderate
f Processing resources are scarce
Mobile orDer AnAlysis
7770-n6, 7702-n6, 7708-n6, 6 inPuts
This configuration provides FFT-based order analysis as
well as order tracking and time data recording on six
channels, which is possible on one LAN-XI module . This
mobile order analysis solution is the solution when:
f The solution must be portable
f Order analysis with tracking is occasionally needed
f Time data recording is mandatory
f Post-processing is preferred
ADVAnceD orDer AnAlysis
7700-n6, 7702-n6, 7703, 7705, 6 inPuts
This configuration has order tracking on six channels .
On top of this it has Vold-Kalman tracking filter (V-K)
and time capture for V-K pre-analysis . Time capture com-
prises STFT (Short Time Fourier Transform), suited for
analysis of transients . Vold-Kalman is the solution for:
f Very high slew rate, gear shifts
f Close or crossing orders
f Extraction of order waves
f Tacho drop outs
FFT-based order analysis with colour contour and waterfall plot
Order acquisition with speed profile, monitoring critical speeds
CCLD Laser Tacho Probe Type 2981
Laser Tacho Probe Type 2981 with optical fibre
cable
Engine speed sensor WQ-2350
orDer AnAlysis

60
moving parts in any rotating machine will
eventually cause annoying vibrations that
ultimately lead to breakdowns due to produc-
tion and assembly tolerances, wear, and load
variation.
machine diagnostics is the pulse configu-
ration for addressing vibration problems in ro-
tating machines. our tools can be used in run-
up/down sessions, and combined to diagnose
multiple faults – such as performing cepstrum
analysis of order spec tra or envelope spectra.
all analyses can be performed simul-
taneously, and the raw signals can be record-
ed for subsequent analysis using the exten-
sion pulse time data recorder. diagnostics
on transient phenomena is then performed
with pulse time capture.
all data can be tagged with auxiliary pa-
rameters such as temperature, oil pressure,
posi tion, and wind speed, and all results
shown in relation to these.
macHine diagnosticsMAchine DiAgnostics
7770-n, 7702-n, 7773
Machine Diagnostic system includes:
f Multi-tachometer
f FFT order analysis
f Order tracking
f Signal enhancement
f Envelope analysis on bearings
f Cepstrum analysis on gearboxes
f Process data /auxiliary parameter logging
The configuration comprises Order Analysis Type 7702-N . See Order Analysis on
page 59 in this catalogue for properties and capabilities . Any LAN-XI Data Acqui-
sition Hardware module is suitable for machine diagnostics, giving from 2 to 12
input channels . Auxiliary parameter logging requires LAN-XI module Type 3056 .
Order analysis with Campbell diagram and colour contour plots with custom colours
Displays:
f waterfall
f Colour contour
f Campbell diagram
f Order and frequency slices
f RPM profiles
f Order and spectral data as
function of process data
MAchine DiAgnostics

www.bksv.com/pulse 61
imbalance results from an uneven distribution
of mass in a rotor, causing vibrations that are
transmitted to the bearings and other parts of
the machine. imperfect mass distribution can
be due to material faults, design errors, manu-
facturing and assembly errors, and especially
faults occurring during operation.
reducing these vibrations achieves better
performance and more cost-effective opera-
tion, and avoids deterioration and fatigue fail-
ure. this requires the rotor to be balanced by
adding or removing mass at certain positions.
our system determines balance quality
for single-plane and two-plane balancing ac-
cording to the iso1940–1 standard. multi-
plane Balancing consultant type 7790-B
adds three- and four-plane balancing.
Balancing consultant has an intuitive,
task-oriented user-interface that leads you
quickly through the necessary tasks for setup,
measurement and reporting.
the balancing process can either be per-
formed in situ, where the rotor is balanced in
its own bearings and supporting structure, or
by balancing the rotors in separate balancing
machines.
trim balancing is also supported, using
rotor data stored from previous balancing
sessions. this ensures fast correction of small
residual imbalances in cases where balancing
has to be repeated.
BalancingbAlAncing fft AnD bAlAncing trAcKing
7770-n3, 7702-n3, 7790-A, 2 inPuts, 1 tAcho inPut
Balancing can be based on either frequency spectra (FFT) or order spectra (or-
der tracking) . Traditional FFT-based balancing is sufficient in many measure-
ment situations . However, in cases with unstable machinery speed and/or high-
frequency resolution requirements, order tracking should be used to eliminate
frequency smearing and provide more accurate results . Balancing using order
tracking requires Order Analysis Type 7702 .
Five-stage two-plane balancing including shaft vibration level and shaft centre position, sensor and trial masses layout
bAlAncing

62
Dr. Colin Novak, Assistant Professor, Department of Mechanical, Automotive and Materials Engineering at The University of Windsor
Phot
os c
ourt
esy
of U
nive
rsity
of W
inds
or
automotive glass subwoofer technology has been in the development stage for a few years now. read how the university of Windsor has played an integral role in its development, using brüel & Kjær hard-ware and Pulse reflex software.
the university of Windsor – cutting-edge researchThe University of windsor with its 16,000 full-time students is located in the Canadian prov-ince of Ontario, where the Detroit River consti-tutes the border between Canada and the US city of Detroit . The area is dominated by the automotive industry and includes some of the world’s biggest automakers, research and de-velopment centres, OEMs and sub-suppliers . It is no wonder then that automotive research and initiatives have a high priority at the Uni-versity . The involvement of partners from the automotive industry, OEMs and suppliers often results in cutting edge research and collabora-tive partnerships which benefit businesses and industries in Canada and beyond .
“The industries from across the border have frequently approached the University for its NVH expertise to help them develop their products and solve their NVH problems,” ex-plains Dr . Colin Novak, Assistant Professor, De-partment of Mechanical, Automotive and Ma-terials Engineering at the University of windsor . “I think that the reason for our suc-cess is partly due to the quality of the faculty and the core competencies we represent . How-ever, the major contributor is our well-estab-lished cooperation with leading automotive companies ensuring the use of the latest re-search and providing our students with hands-on experience .”
Dr . Novak continues, “we have a full NVH program including a lot of application experi-ence and theoretical knowledge . Companies and inventors have products they want to in-troduce to the market . They may have the con-cept but not the expertise to test product qual-ity, nor the manpower or ability to get them launched and that’s where we come in,” says Dr . Novak . “And with Brüel & Kjær as our pre-ferred supplier of sound and vibration applica-tions we can provide our partners with accu-rate data and efficient service . So, for us, working with pioneers in the field of sound and vibration means that we are at the fore-front of technology . In addition, Brüel & Kjær
has one of the best NVH testing facilities just 45 minutes away – the unique ARC in Detroit . we enjoy using the facility together with our customers and it is also where we can learn new technologies that we can use to solve our customers’ NVH problems,” says Dr . Novak .
turning car rear windows into sound sys-temsA recent project involved a large Canadian-based automotive supplier who approached The University of windsor with an innovative Swed-ish audio technology it had acquired the rights to and that could potentially transform a car’s rear window into a giant speaker . This would reduce the typical electrical load of an audio sys-tem by up to 75%, improve the fuel efficiency of a vehicle and provide valuable savings to vehicle manufacturers . In addition, the technology could reduce a vehicle’s weight by up to nine kilograms, yet again contributing to fuel effi-ciency . The groundbreaking system would re-place conventional subwoofers with the vehi-cle’s rear window as the source of sound and free up space inside the vehicle .
Some in-house testing on the technology had been carried out by the automotive supplier but key areas such as psychoacoustics were missing, and this is where Dr . Novak and his team of nine graduates could help . “If we can move the glass in a particular fashion, then we can make the window act as a speaker,” says Dr . Novak . His team developed a piezoelectric actuator – a bar-shaped device which receives the signal from the audio system and submits it to rigid, but highly-sensitive springs that run along the bottom of the window causing it to pulsate with the music . Dr . Novak explains, “Es-sentially, it’s a spring system that’s driven by a piezoelectric stack . we make the rear window of the car vibrate in phase with the music and that actually is the subwoofer of the car – light, simple and doesn’t take up any space .”
The prototype was installed in a Chrysler 300, one of two test cars for the system . Dr . Novak explains, “In the vehicle at the base of the windshield, we have two of these actuators in-stalled between the glass and the structure of the car . The glass is fixed along the top and is free to move along the two sides and the bot-tom, so the windshield can move . By having two of these actuators mounted to the glass, we can move the two sides of the glass inde-pendently so that the one sheet will move like
two different speakers .” He continues, “Basically, the window itself will move, albeit very little – a fraction of a millimetre – because we have such a large surface area . That means the glass doesn’t have to move as much as the speaker cone would .”
One of Dr . Novak’s main areas of expertise is psychoacoustics, so one aspect of the work of his AUTO 21 project team was to improve the quality of the sound generated by the glass speaker . To do this, a Head and Torso Simula-tor (HATS) and a ½-inch Prepolarized Free-field Microphone Type 4189 were used . The HATS is a mannequin with built-in mouth simulators and calibrated ear simulators that provide realistic reproduction of the acoustic properties of an average adult human head and torso .
“To begin with, we’ve been working on the subwoofer application on the windshield al-though we are looking into a more full-range speaker for the future”, says Dr . Novak . “we’re using the prototype installed in the vehicle to fine-tune the windshield’s available frequen-cies according to the acoustic features of the cabin, and especially the low-frequency com-ponent of the speaker system . The bigger the diameter of the speaker, the lower the fre-quency it’s capable of going,” he explains . “we’re aiming at between 10 and 120 Hz and hope to get it up to about 180 Hz whereas the most conventional subwoofers in your car only go up to about 90 Hz .”
One of the main challenges facing Dr . No-vak’s team was the sensitivity of the actuators which function like springs and according to Dr . Novak, “have their own set of mechanical characteristics or natural frequencies .” So set-ting an operating range for these is a chal-lenge as it is so far removed from the natural mode .
In order to determine the natural frequen-cies and acoustic properties of the actuators,
modal analysis was performed on the actuators two to three times a week for about a month . The test results were sent to the manufacturer on a regular basis and who, in turn, made de-sign adjustments and submit for re-testing .
The initial testing of the actuator designs was performed on a test rig which consisted of a mass placed on top of the actuator, which had a weight equivalent to half of that of a wind-shield glass . Ten Miniature Triaxial CCLD Accel-erometers Type 4524-B were mounted at the top of the mass and also to the mechanical ele-ments within the actuator itself . A Mini-shaker Type 4810 was used as the excitation source us-ing both sinusoidal and random input with a frequency range of 10 to 200 Hz . Other hard-ware included a CCLD Force Transducer Type 8230-001 and a PULSE C-frame with Type 7540 and Type 3040 Dyn-X modules . Data acquisi-tion was done using PULSE Modal Test Consult-ant Type 7753 (MTC) .
From the experiments, both the natural fre-quencies and the resulting mode shapes of the actuator were determined . This information was important as it was critical that the actua-tion did not have resonant frequencies within the 10 to 120 Hz operating frequency range . Using the animation capabilities of the MTC software, it was possible to ensure that the
case study
modal analysis and pulse refleX, uniVersity of windsor, canada
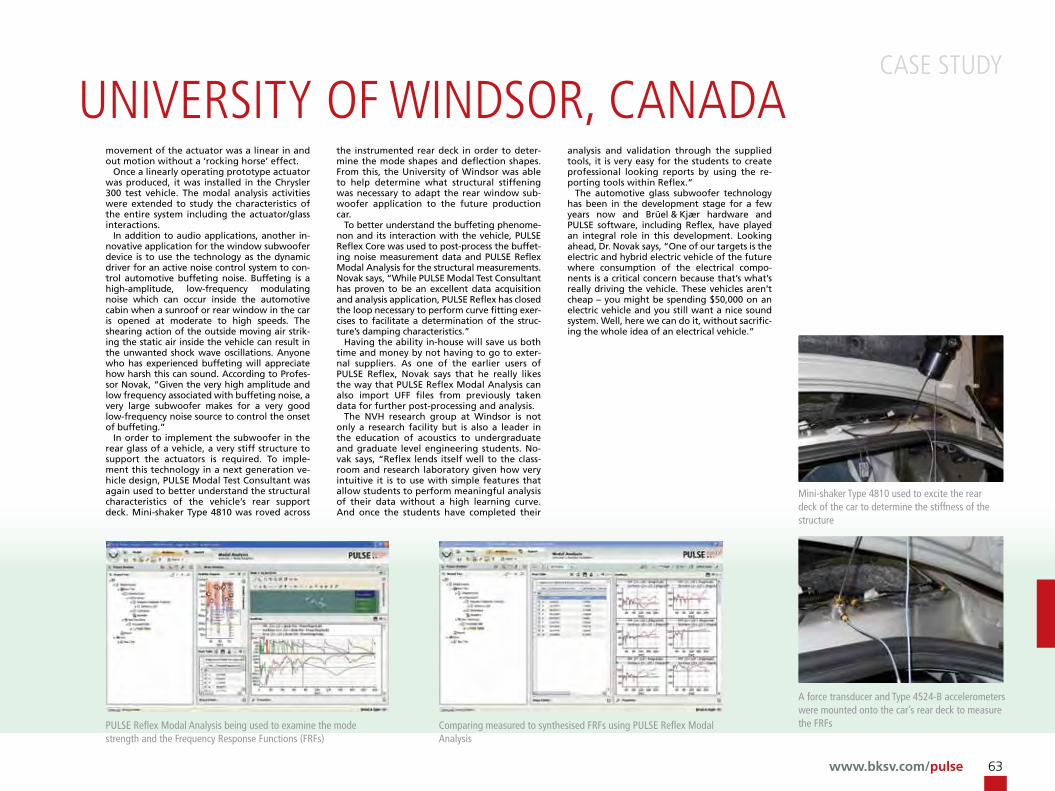
63www.bksv.com/pulse
Mini-shaker Type 4810 used to excite the rear deck of the car to determine the stiffness of the structure
A force transducer and Type 4524-B accelerometers were mounted onto the car’s rear deck to measure the FRFsPULSE Reflex Modal Analysis being used to examine the mode
strength and the Frequency Response Functions (FRFs)Comparing measured to synthesised FRFs using PULSE Reflex Modal Analysis
case study
modal analysis and pulse refleX, uniVersity of windsor, canada movement of the actuator was a linear in and out motion without a ‘rocking horse’ effect .
Once a linearly operating prototype actuator was produced, it was installed in the Chrysler 300 test vehicle . The modal analysis activities were extended to study the characteristics of the entire system including the actuator/glass interactions .
In addition to audio applications, another in-novative application for the window subwoofer device is to use the technology as the dynamic driver for an active noise control system to con-trol automotive buffeting noise . Buffeting is a high-amplitude, low-frequency modulating noise which can occur inside the automotive cabin when a sunroof or rear window in the car is opened at moderate to high speeds . The shearing action of the outside moving air strik-ing the static air inside the vehicle can result in the unwanted shock wave oscillations . Anyone who has experienced buffeting will appreciate how harsh this can sound . According to Profes-sor Novak, “Given the very high amplitude and low frequency associated with buffeting noise, a very large subwoofer makes for a very good low-frequency noise source to control the onset of buffeting .”
In order to implement the subwoofer in the rear glass of a vehicle, a very stiff structure to support the actuators is required . To imple-ment this technology in a next generation ve-hicle design, PULSE Modal Test Consultant was again used to better understand the structural characteristics of the vehicle’s rear support deck . Mini-shaker Type 4810 was roved across
the instrumented rear deck in order to deter-mine the mode shapes and deflection shapes . From this, the University of windsor was able to help determine what structural stiffening was necessary to adapt the rear window sub-woofer application to the future production car .
To better understand the buffeting phenome-non and its interaction with the vehicle, PULSE Reflex Core was used to post-process the buffet-ing noise measurement data and PULSE Reflex Modal Analysis for the structural measurements . Novak says, “while PULSE Modal Test Consultant has proven to be an excellent data acquisition and analysis application, PULSE Reflex has closed the loop necessary to perform curve fitting exer-cises to facilitate a determination of the struc-ture’s damping characteristics .”
Having the ability in-house will save us both time and money by not having to go to exter-nal suppliers . As one of the earlier users of PULSE Reflex, Novak says that he really likes the way that PULSE Reflex Modal Analysis can also import UFF files from previously taken data for further post-processing and analysis .
The NVH research group at windsor is not only a research facility but is also a leader in the education of acoustics to undergraduate and graduate level engineering students . No-vak says, “Reflex lends itself well to the class-room and research laboratory given how very intuitive it is to use with simple features that allow students to perform meaningful analysis of their data without a high learning curve . And once the students have completed their
analysis and validation through the supplied tools, it is very easy for the students to create professional looking reports by using the re-porting tools within Reflex .”
The automotive glass subwoofer technology has been in the development stage for a few years now and Brüel & Kjær hardware and PULSE software, including Reflex, have played an integral role in this development . Looking ahead, Dr . Novak says, “One of our targets is the electric and hybrid electric vehicle of the future where consumption of the electrical compo-nents is a critical concern because that’s what’s really driving the vehicle . These vehicles aren’t cheap – you might be spending $50,000 on an electric vehicle and you still want a nice sound system . well, here we can do it, without sacrific-ing the whole idea of an electrical vehicle .”
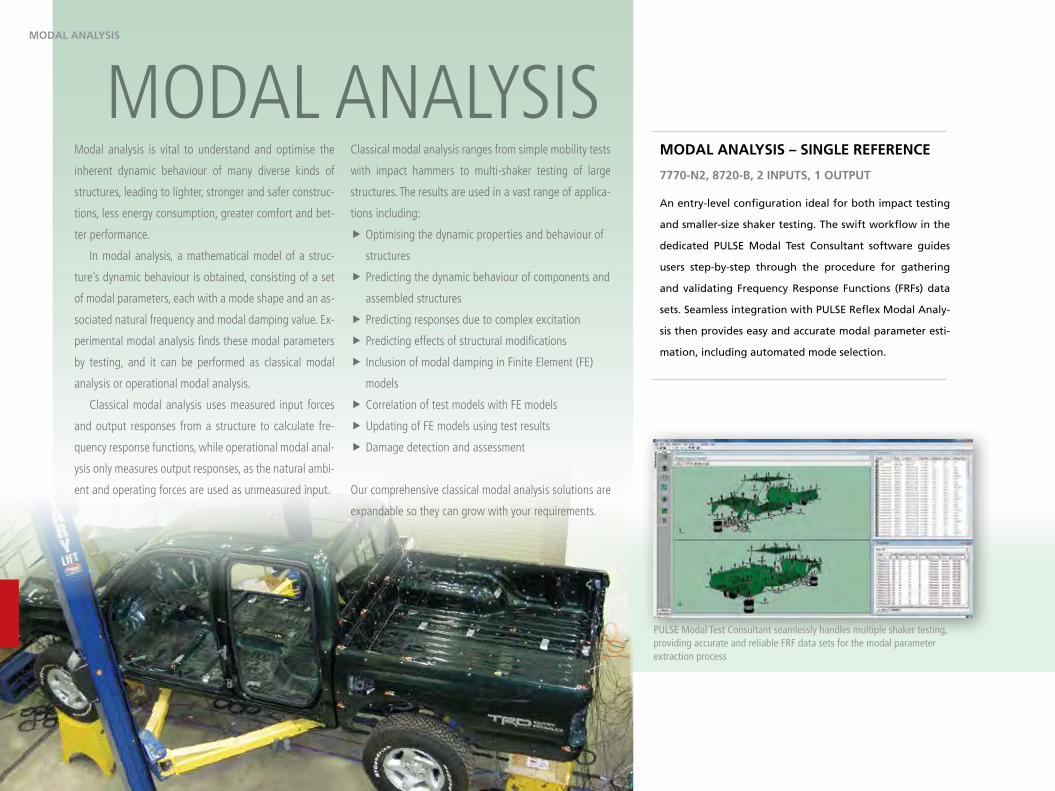
64
PULSE Modal Test Consultant seamlessly handles multiple shaker testing, providing accurate and reliable FRF data sets for the modal parameter extraction process
modal analysis is vital to understand and optimise the
inherent dynamic behaviour of many diverse kinds of
structures, leading to lighter, stronger and safer construc-
tions, less energy consumption, greater comfort and bet-
ter performance.
in modal analysis, a mathematical model of a struc-
ture’s dynamic behaviour is obtained, consisting of a set
of modal parameters, each with a mode shape and an as-
sociated natural frequency and modal damping value. ex-
perimental modal analysis finds these modal parameters
by testing, and it can be performed as classical modal
analysis or operational modal analysis.
classical modal analysis uses measured input forces
and output responses from a structure to calculate fre-
quency response functions, while operational modal anal-
ysis only measures output responses, as the natural ambi-
ent and operating forces are used as unmeasured input.
classical modal analysis ranges from simple mobility tests
with impact hammers to multi-shaker testing of large
structures. the results are used in a vast range of applica-
tions including:
f optimising the dynamic properties and behaviour of
structures
f predicting the dynamic behaviour of components and
assembled structures
f predicting responses due to complex excitation
f predicting effects of structural modifications
f inclusion of modal damping in finite element (fe)
models
f correlation of test models with fe models
f updating of fe models using test results
f damage detection and assessment
our comprehensive classical modal analysis solutions are
expandable so they can grow with your requirements.
modal analysisMoDAl AnAlysis
MoDAl AnAlysis – single reference
7770-n2, 8720-b, 2 inPuts, 1 outPut
An entry-level configuration ideal for both impact testing
and smaller-size shaker testing . The swift workflow in the
dedicated PULSE Modal Test Consultant software guides
users step-by-step through the procedure for gathering
and validating Frequency Response Functions (FRFs) data
sets . Seamless integration with PULSE Reflex Modal Analy-
sis then provides easy and accurate modal parameter esti-
mation, including automated mode selection .

www.bksv.com/pulse 65
Reports can be prepared in parallel with the analysis process, linking important results as they are produced. High-quality reports are easily to create in Microsoft® Word, Microsoft® Excel® or Microsoft®
PowerPoint®
PULSE Reflex Modal Analysis ensures you always have the right curve-fitter at hand with low-order and high-order curve-fitters in the time and frequency domain
PULSE Reflex Modal Analysis guides you efficiently through measurement validation, parameter estimation setup, mode selection, analysis validation, and reporting
MoDAl AnAlysis – single reference
7770-n, 8720-b, unliMiteD inPuts, 1 outPut
As in the previous configuration, but with more inputs
for enhanced shaker testing capabilities and higher data
consistency . More DOFs can be easily measured using
multiple data sets with roving transducers .
MoDAl AnAlysis – MultiPle references
7770-n4, 8720-b, 8721, 4 inPuts, 1 outPut
A configuration that enables users to solve cases with
repeated roots and closely coupled modes by perform-
ing impact testing using a triaxial or multiple single axial
accelerometers as references . Includes a targeted set of
best-in-class mode indicator functions, curve-fitters and
validation tools for producing quality results with maxi-
mum confidence .
MoDAl AnAlysis – MultiPle references
7770-n, 8721-b, unliMiteD inPuts AnD outPuts
As in the previous configuration, but with the added
functionality of performing Multiple-Input Multiple-
Output (MIMO) analysis . Ideal for testing large, complex
and symmetrical structures, and in demanding situations
such as those featuring weakly excited, heavily damped
or local modes .
MoDAl AnAlysis

66
eXciter guiDe
Type DescriptionMax force [N, (lbf)] Max displacement
Pk-Pk [mm, (in)]Sine peak Random RMS
4808 Permanent Magnetic Vibration Exciter 187 (42) - 12.7 (0.5)
4809 Vibration Exciter 60 (13.5) - 8.0 (0.32)
4810 Mini Shaker 10 (2.25) - 6.0 (0.24)
4824 Modal Exciter 100 (22) 70 (15) 25.4 (1)
4825 Modal Exciter 200 (45) 140 (31) 25.4 (1)
4826 Modal Exciter 400 (90) 280 (63) 25.4 (1)
4827 Modal Exciter 650 (146) 420 (94) 50.8 (2)
4828 Modal Exciter 1000 (225) 650 (146) 50.8 (2)
Note: Table shows selected modal exciters only . Exciters above 1000 N are available . Modal excitation systems with matching power amplifiers are available .
iMPAct hAMMer guiDe
Type Description Max force [N, (lbf)] Overall length [m, (in)]
8203 Force Transducer / Impact Hammer 1250 (281) 0.106 (4.2)
8204 Miniature Impact Hammer 220 (50) 0.122 (4.8)
8206 General Purpose Impact Hammer 220 (50) – 4448 (1000)* 0.22 (8.72)
8207 Heavy Duty Impact Hammer – One pound head 22.2k (5k) 0.30 (11.7)
8208 Heavy Duty Impact Hammer – Three pound head 22.2k (5k) 0.39 (15.2)
8210 Heavy Duty Impact Hammer – Twelve pound head 22.2k (5k) 0.90 (35.3)
*Available in four different versions
Our solutions cover the entire measurement and analysis chain
including accelerometers and force transducers, impact hammers,
modal exciter systems, data acquisition front-ends and measure-
ment and analysis software .
– eXciters and transducers
Power AmplifierType 2716 C
UA-1598UA-1599wZ-0066
Stinger Kit
UA-1480Spirit Level
UA-1478Set of 100 Swivel Bases
8230Force Transducer
impact hammers
shaker
Modal excitation systems
Additional Accessories
UA-1607UA-1608Modal
Exciter Stand
020226/4
4294Calibration Exciter
DV-0460 DV-0459Calibration Clips
uniaxial Accelerometers triaxial Accelerometers
IEPETEDS
4507-B
IEPE 4394
IEPETEDS
4506-B
4524-BIEPETEDS
4527IEPE
8206 Hammer
Power Amplifier
8203 + 2647-B8204820782088210
8001+ 2647-B × 2
Impedance Head
Modal Shaker
5961Hand-held
Exciter
IEPE 4517
modal analysis
Shakers and exciters on www.bksv.com
Vibration transducers on www.bksv.com
MoDAl AnAlysis

www.bksv.com/pulse 6767
Watch a video about SRS here:
a single transient shock event such as a pyroshock
or a structural impact can damage components in a
structural system. similarly, earthquakes can cause
catastrophic failures in bridges and buildings. and
with any motion input into a system, the response
can be amplified by structural resonances, increas-
ing the damage.
shock response spectrum (srs) analysis soft-
ware computes the shock response spectrum from
transients in the time domain. it converts motion
input to a set of single degree of freedom (sdof)
damped oscillator responses. the response ampli-
tudes of the oscillators are plotted as a function
of sdof frequency to produce the shock response
spectrum.
the frequencies are generally logarithmically
spaced, typically with 1/n-octave spacing. the am-
plitudes of the srs are derived from the individual
sdof responses (at user-defined frequencies) by
taking the maximum response either during the pri-
mary shock event or during the residual response
to the event. most commonly, the overall maximum
response is used, which includes both primary and
residual responses – called ‘maximax’.
all five of the srs models mentioned in the iso
18431 – 4:2007 standard are available, and with
these five srs models and nine ordinary criteria
for amplitude calculation (shock instances), you
can configure up to 45 different response types to
match your requirements.
Four time histories (at left) with a SRS for the first time history
Five SRS models
Shock instances
’maximax’
srs (sHocK response spectrum analysis)
srs (shocK resPonse sPectruM AnAlysis)

68
Phot
os c
ourt
esy
of D
CTA
the department of aerospace science and technology (dcta) is the brazilian national military research centre for aviation and space flight. dcta is subordinated to the brazilian air force and coordinates all technical and scientific activities related to the aerospace sector. noise and vibra-tion testing play a vital role in many phas-es of operations and dcta benefits from brüel & Kjær’s complete measurement so-lutions. they have a large installed base of brüel & Kjær products ranging from shak-ers for environmental and structural test-ing, noise and vibration sensors for a wealth of applications from rugged flight-testing to highly sophisticated laboratory use, multichannel data acquisition and analysis platforms, and an enormous range of noise, vibration and shock soft-ware application packages.
dcta and brüel & Kjær – a long and fruitful relationshipThe Department of Aerospace Science and Technology (DCTA) is the Brazilian national military research centre for aviation and space flight . DCTA is subordinated to the Brazilian Air Force and coordinates all technical and sci-entific activities related to the aerospace sector in which there are interests by the Ministry of Defence .
DCTA’s interests within the world of noise and vibration are multi-fold and they have greatly benefited from a long-term and close relationship with Brüel & Kjær . with opera-tions covering everything from validating equipment for transport, launch and flight-path loading, high quality, efficient testing is vital .
Noise and vibration testing plays a vital role in many phases of operations, and DCTA ben-efits from the complete measurement solu-tions offered by Brüel & Kjær . They have a large installed base of Brüel & Kjær products ranging from shakers for environmental and structural testing, noise and vibration sensors for a wealth of applications from rugged flight-testing to highly sophisticated laborato-ry use, multichannel data acquisition and ana-lysis platforms, and a huge range of noise, vi-bration and shock software application packages .
The Brüel & Kjær/DCTA relationship goes back many years and, with the LDS and Brüel & Kjær merger at the end of 2008, the relationship has become even stronger . Local Brüel & Kjær expertise, with full service and calibration facilities, further provides the fun-dament for a long-lasting relationship, provid-ing CTA with high quality, goal-focused, time- and cost-efficient testing solutions .
The Institute of Aeronautics and Space (IAE) (Instituto de Aeronaútica e Espaço) is a division of DCTA and develops projects in the aeronau-tical, aerospace and defence sectors . IAE is co-responsible for the execution of the Brazilian Space Mission – working on projects such as the VLS-1 Launcher, which is designed to launch small satellites into low earth orbit . IAE also supports the Brazilian Air Force with, for example, flight test capabilities . They also pro-vide launch capabilities for microgravity ex-periments supporting the VS-30 and VS-40 launchers .
dcta’s impressive range of brüel & Kjær solutionsSatellite and launcher testing is a multi-discipli-nary operation . Environmental vibration/acoustic durability testing is paramount to en-sure that structures and equipment can survive a launch; SRS analysis determines shock re-sponse properties of structures; modal testing facilitates the understanding and optimisation of dynamic properties of structures; vibration qualification testing provides system and com-ponent acceptance testing .
The systems necessary to cover such a diver-sity of tests range from shakers for environ-mental and structural testing; flight-tested and laboratory noise and vibration sensors; high-speed, multi-channel data acquisition and analysis platforms, and an enormous range of noise, vibration and shock software applica-tion packages .
DCTA has several LDS shakers and controllers for standard vibration testing of electronic equipment . Recently, DCTA purchased the larg-est LDS shaker on the market, the V994 . The V944 shaker was tested in Brüel & Kjær’s Royston office in the UK and shipped to Brazil, where it now awaits installation following the comple-tion of DCTA’s newest test facility .
with well over 100 channels of PULSE IDAe front-ends (in 17 frames), some 66 channels of
LAN-XI data acquisition modules, and a wide range and number of acoustic and vibration sensors to match, DCTA are in a position to carry out all relevant noise and vibration meas-urement/analysis tasks . Backed by the PULSE applications LabShop, Operational Modal Analysis (OMA), Modal Test, Reflex Shock Re-sponse Analysis and PULSE Data Manager, DCTA are in a position to carry out relevant noise and vibration testing and qualification of satellites, space launchers and their compo-nents .
launcher and satellite noise and vibration testingThe demands placed upon a rocket and its pay-load are severe during rocket launch . Launch-ers generate extreme noise and vibration and, at separation stages, pyroshocks cause addi-tional severe loading of the launcher .
Validating equipment for launch is, there-fore, not a small task . Testing must be made at all stages of the product – during development to provide qualification of finite element mod-els, during qualification and acceptance test-ing to validate the design via extensive vibra-tion testing . DCTA provides for the complete on-board measurement and telemetry systems, and can perform dedicated launcher tests such as separation tests, firing tests and transporta-tion tests .
separation tests using shock response and modal analysisDCTA (IAE) is tasked with the upcoming sepa-ration test of the VGLS-1 Launcher and plans to use an 80-channel PULSE system for shock, PULSE Reflex SRS applications and 60 channels for vibration . PULSE OMA will be used to ana-lyse the pyroshock and the response in addi-tional detail .
PULSE Shock Response Analysis Type 8730 computes the shock response spectrum (SRS) from transients in the time domain in order to determine the damage potential of transient events such as pyroshock .
A transient (shock) event, such as pyroshock or a structural impact, has the potential to damage components in a structural system . just as with any motion input to a system, the response can be amplified by structural reso-nances, increasing the damage potential .
case study
dcta – tHe department of aerospace science and tecHnology

69www.bksv.com/pulse
DCTA’s range of Brüel & Kjær solutions spans the whole
measurement chain
Launcher in support structure before firing test. During the launcher firing test, Brüel & Kjær Type 4956 microphones, Type 2670 preamplifiers, and a PULSE data acquisition system are used to obtain noise data.
PULSE Reflex Shock Response Analysis
PULSE Operational Modal Analysis
case study
dcta – tHe department of aerospace science and tecHnologyThe aim of the SRS calculation is to convert
motion input to a set of Single Degree of Free-dom (SDOF) damped oscillator responses cal-culated in the time domain . The response am-plitudes of the oscillators are plotted as a function of SDOF frequency to produce the shock response spectrum .
PULSE Operational Modal Analysis Type 7760 is an analysis tool for effective modal identifi-cation in cases where only the output is known . The software allows you to perform accurate modal identification under opera-tional conditions and in situations where the structure is impossible or difficult to excite us-ing externally applied forces .
Experimental modal analysis is the process of using experimental data to determine the modal parameters (natural frequency, damp-ing ratio, and mode shape) of a structure for the modes in the frequency range of interest . The mode shape is the deflection pattern that represents the relative displacement of all parts of the structure for that particular mode .
Modal parameters are important because they describe the inherent dynamic properties of a structure . The set of modal parameters constitutes a unique set of numbers that can be used for model validation and updating, design verification, benchmarking, trouble-shooting, quality control or structural health monitoring .
In classical modal analysis, the modal parame-ters are found by fitting a model to frequency response functions (or impulse response func-tions) relating excitation forces to vibration re-sponses . In Operational Modal Analysis (OMA),
the modal identification is based on the vibra-tion responses only, and different identification techniques are used .
launcher firing tests using operational modal analysisDuring launcher firing tests, OMA is used to validate the excited modes of the launcher during the ignition and burning phases .
Also during the firing test, noise data is ob-tained to validate/investigate/understand in detail the influence of noise on the thermal protection of the engine, and to correlate with the models for lift-off noise .
launcher transportation test using vibra-tion durability testing and operational modal analysisPart of the environmental test program of a launcher is the transportation tests, covering packaging, loading, flight- and road-trans-port .
PULSE Operational Modal Analysis is used to validate the vibration level and natural excit-ed modes of the launcher throughout these phases .
component testing using vibration shak-ersDCTA (IAE) performs environmental testing services for internal and external customers . Environmental testing is required to verify reli-ability and flight safety requirements .
DCTA has several LDS shakers and an LDS vibration control system to answer local de-mands for the different space programs, aero-
space and automotive applications it is in-volved in .
flight tests using modal analysisDCTA (IAE) also provides flight test services for the Brazilian Air Force, testing modifications on aircraft and helicopters and re-establishing flight envelopes .
As part of these services, classical and opera-tional modal analysis (OMA) was carried out on a modified and unmodified helicopter dur-ing on-ground and in-flight tests .
The tests made it possible to identify any critical modes that would significantly influ-ence the structural and aerodynamic behav-iour of the helicopter, with consequential maintenance and safety issues .
launch telemetry using acoustic and vi-bration sensorsBrüel & Kjær is working closely with DCTA to deliver a range of sensors and airborne ampli-fiers to provide critical flight data to their on-board telemetry system for the VLS-1 satellite launch vehicle program .
Missile firing tests using operational modal analysisDCTA (IAE) is involved in missile firing tests that are performed on the ground and vali-dated in-flight using OMA . The missile flight profiles are loaded into the shaker controller to verify all environmental conditions of the DCTA-developed missiles during flight .
These tests assist and help design the inter-face between the missile and the aircraft .
Separation testing

70
calibrator Miscellaneous
uniaxial Accelerometers triaxial Accelerometers
4294Calibration Exciter
020234/3
DV-0460
DV-0459
Calibration Clips
Charge to IEPE Converter 2647-A/B/C
UA-1480Spirit Level
UA-1473 Set of 100 Swivel BasesUA-1478 Set of 100 Swivel Bases
IEPETEDS
IEPETEDS
4507-B
CHARGE 4393
IEPE 4394
IEPETEDS
4506-B
IEPETEDS
4524-B
8344
4527IEPE
CHARGE 4326-A
457XPR(DC)
2981Tacho probe
Learn more about Operational modal analysis
on www.bksv.com
in operational modal analysis (oma) only the out-
put of a structure is measured, using the ambient
and operating forces as unmeasured input. oma
is used instead of classical modal analysis for ac-
curate modal identification under actual operating
conditions, and in situations where it is difficult or
impossible to artificially excite the structure.
many civil engineering and mechanical struc-
tures are difficult to excite artificially due to their
physical size, shape or location. civil engineering
structures are also loaded by ambient forces such
as the waves against offshore structures, the wind
on buildings, and traffic on bridges, while mechani-
cal structures such as aircraft, vehicles, ships and
machinery exhibit self-generated vibrations during
operation. in oma, these forces that would pro-
duce erroneous results in classical modal analysis
are instead harnessed as input forces.
as oma can be performed in situ during nor-
mal operation, setup time is reduced and downtime
can be eliminated. adding further value, our oma
systems are also scalable, making both hardware
and software easy to upgrade. patents protect the
core technology behind our oma software, includ-
ing the efficient and powerful frequency domain
decomposition (fdd), enhanced frequency domain
decomposition (efdd) and curve-fit frequency do-
main decomposition (cfdd) techniques.
oma software is available in three versions –
pro, standard and light, which differ mainly in the
number of techniques they provide.
operational modal analysisoPerAtionAl MoDAl AnAlysis
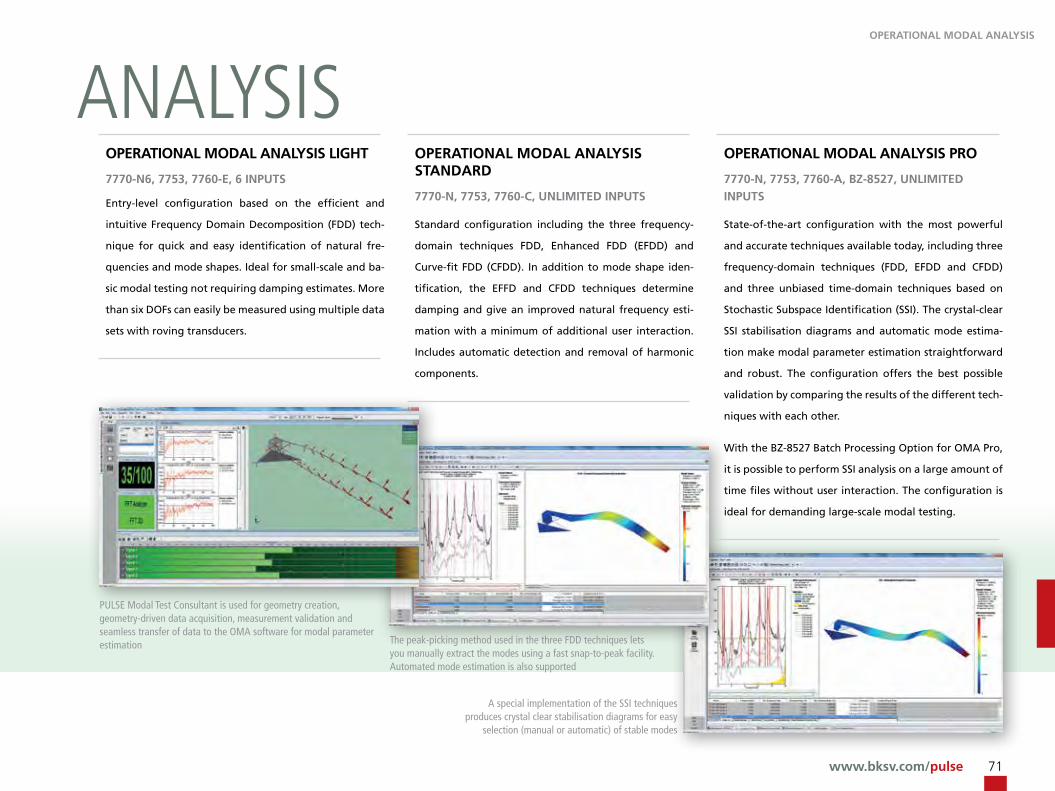
www.bksv.com/pulse 71
oPerAtionAl MoDAl AnAlysis light
7770-n6, 7753, 7760-e, 6 inPuts
Entry-level configuration based on the efficient and
intuitive Frequency Domain Decomposition (FDD) tech-
nique for quick and easy identification of natural fre-
quencies and mode shapes . Ideal for small-scale and ba-
sic modal testing not requiring damping estimates . More
than six DOFs can easily be measured using multiple data
sets with roving transducers .
oPerAtionAl MoDAl AnAlysis stAnDArD
7770-n, 7753, 7760-c, unliMiteD inPuts
Standard configuration including the three frequency-
domain techniques FDD, Enhanced FDD (EFDD) and
Curve-fit FDD (CFDD) . In addition to mode shape iden-
tification, the EFFD and CFDD techniques determine
damping and give an improved natural frequency esti-
mation with a minimum of additional user interaction .
Includes automatic detection and removal of harmonic
components .
oPerAtionAl MoDAl AnAlysis Pro
7770-n, 7753, 7760-A, bz-8527, unliMiteD inPuts
State-of-the-art configuration with the most powerful
and accurate techniques available today, including three
frequency-domain techniques (FDD, EFDD and CFDD)
and three unbiased time-domain techniques based on
Stochastic Subspace Identification (SSI) . The crystal-clear
SSI stabilisation diagrams and automatic mode estima-
tion make modal parameter estimation straightforward
and robust . The configuration offers the best possible
validation by comparing the results of the different tech-
niques with each other .
with the BZ-8527 Batch Processing Option for OMA Pro,
it is possible to perform SSI analysis on a large amount of
time files without user interaction . The configuration is
ideal for demanding large-scale modal testing .
operational modal analysis
PULSE Modal Test Consultant is used for geometry creation, geometry-driven data acquisition, measurement validation and seamless transfer of data to the OMA software for modal parameter estimation The peak-picking method used in the three FDD techniques lets
you manually extract the modes using a fast snap-to-peak facility. Automated mode estimation is also supported
A special implementation of the SSI techniques produces crystal clear stabilisation diagrams for easy
selection (manual or automatic) of stable modes
oPerAtionAl MoDAl AnAlysis
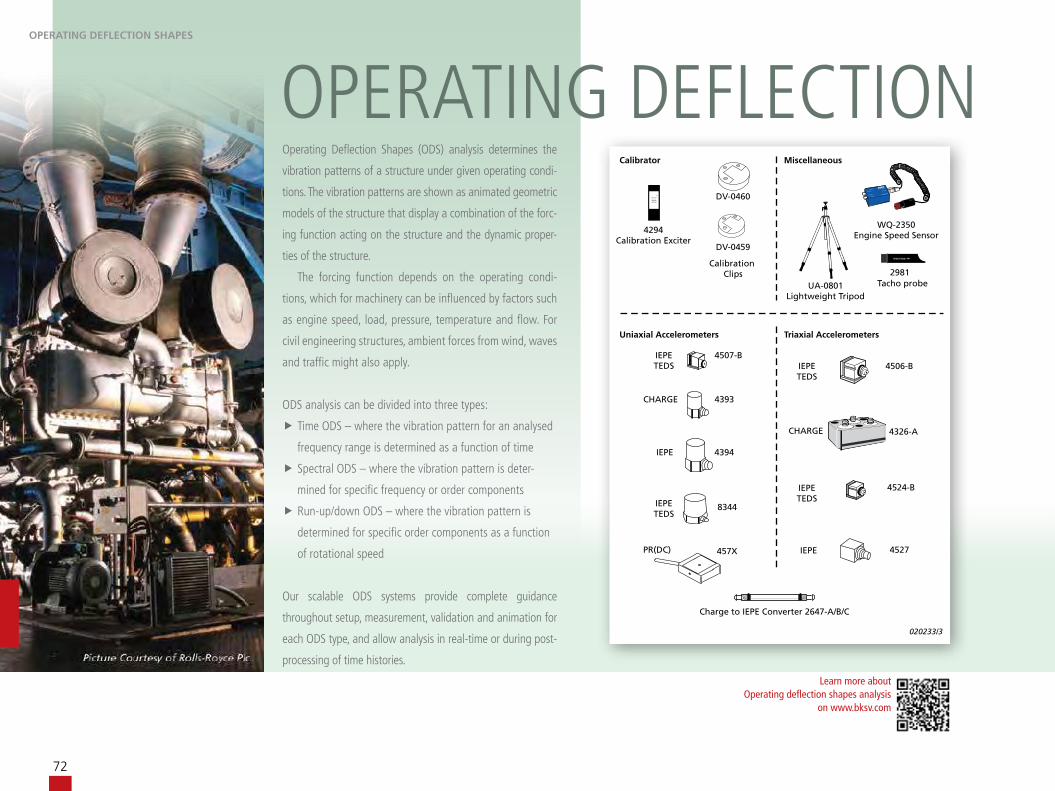
72
calibrator Miscellaneous
uniaxial Accelerometers triaxial Accelerometers
4294Calibration Exciter
020233/3
DV-0460
DV-0459
Calibration Clips
Charge to IEPE Converter 2647-A/B/C
IEPETEDS
IEPETEDS
4507-B
CHARGE 4393
IEPE 4394
IEPETEDS
4506-B
IEPETEDS
4524-B
8344
4527IEPE
CHARGE 4326-A
457XPR(DC)
2981Tacho probeUA-0801
Lightweight Tripod
wQ-2350Engine Speed Sensor
operating deflection shapes (ods) analysis determines the
vibration patterns of a structure under given operating condi-
tions. the vibration patterns are shown as animated geometric
models of the structure that display a combination of the forc-
ing function acting on the structure and the dynamic proper-
ties of the structure.
the forcing function depends on the operating condi-
tions, which for machinery can be influenced by factors such
as engine speed, load, pressure, temperature and flow. for
civil engineering structures, ambient forces from wind, waves
and traffic might also apply.
ods analysis can be divided into three types:
f time ods – where the vibration pattern for an analysed
frequency range is determined as a function of time
f spectral ods – where the vibration pattern is deter-
mined for specific frequency or order components
f run-up/down ods – where the vibration pattern is
determined for specific order components as a function
of rotational speed
our scalable ods systems provide complete guidance
throughout setup, measurement, validation and animation for
each ods type, and allow analysis in real-time or during post-
processing of time histories.
operating deflection sHapes
Learn more about Operating deflection shapes analysis
on www.bksv.com
oPerAting Deflection shAPes

www.bksv.com/pulse 73
The shapes can be saved in a table in terms of acceleration, velocity and displacement. Different animation types and views are supported including side-by-side, overlaid and difference animation.
Run-up/down ODS analysis allows determination of the vibration pattern for frequency and order components versus RPM. Contour plots are available for easy detection and separation of orders and structural resonances.
tiMe AnD sPectrAl oDs
7770-n2, 7765-A, 2 inPuts
Entry-level configuration especially suited for spectral
ODS using multiple data sets . Applicable for:
f Stable machine speed
f Analysing lower and/or well-separated spectral
components
Order Analysis Type 7702 option is recommended in cas-
es of slight instability and for analysing higher and close
spectral components, in order to eliminate smearing .
tiMe AnD sPectrAl oDs
7770-n, 7765-A, unliMiteD inPuts
This configuration allows simultaneous response meas-
urements in more DOFs, offering additional advantages
such as:
f Shorter test time
f Higher data consistency
f Time ODS in multiple DOFs
See comments on Order Analysis Type 7702 .
run-uP/Down oDs
7770-n, 7702-n, 7765-b, unliMiteD inPuts
State-of-the-art configuration with the full range of ODS
techniques: Time ODS, spectral ODS (frequency- or order-
based) and run-up/down ODS analysis . Supports analysis
of stationary, quasi-stationary and transient signals .
The configuration is ideal for advanced large-scale ODS
analysis .
operating deflection sHapes
The ODS Test Consultant incorporates time-saving tools to give maximum data reliability in the shortest possible test time. One example is the Graphical Tacho Setup for straightforward tacho detection.
oPerAting Deflection shAPes
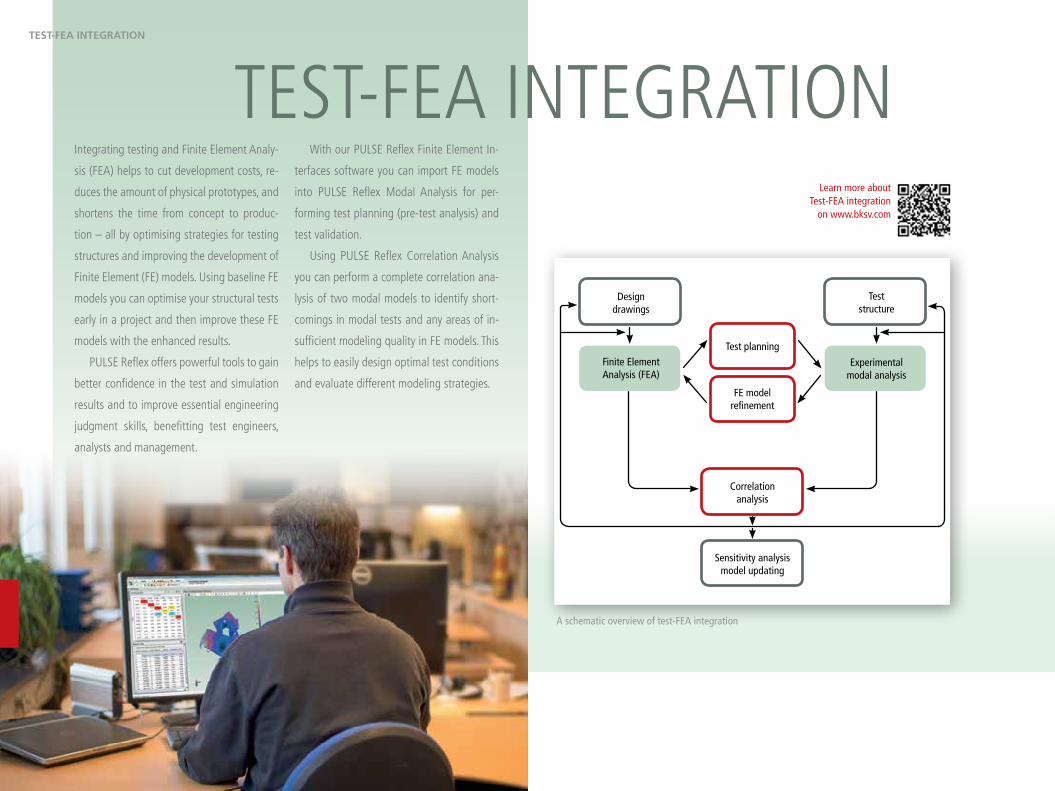
74
Learn more about Test-FEA integration
on www.bksv.com
integrating testing and finite element analy-
sis (fea) helps to cut development costs, re-
duces the amount of physical prototypes, and
shortens the time from concept to produc-
tion – all by optimising strategies for testing
structures and improving the development of
finite element (fe) models. using baseline fe
models you can optimise your structural tests
early in a project and then improve these fe
models with the enhanced results.
pulse reflex offers powerful tools to gain
better confidence in the test and simulation
results and to improve essential engineering
judgment skills, benefitting test engineers,
analysts and management.
with our pulse reflex finite element in-
terfaces software you can import fe models
into pulse reflex modal analysis for per-
forming test planning (pre-test analysis) and
test validation.
using pulse reflex correlation analysis
you can perform a complete correlation ana-
lysis of two modal models to identify short-
comings in modal tests and any areas of in-
sufficient modeling quality in fe models. this
helps to easily design optimal test conditions
and evaluate different modeling strategies.
test-fea integration
A schematic overview of test-FEA integration
test-feA integrAtion
Designdrawings
Teststructure
Finite ElementAnalysis (FEA)
Experimentalmodal analysis
Test planning
FE model refinement
Correlationanalysis
Sensitivity analysismodel updating

www.bksv.com/pulse 75
PULSE Reflex Correlation Analysis: Complete model correlation of test and FEA results.
PULSE Reflex Modal Analysis: Animation of FEA modes provides useful information for setting up and performing modal tests.
test PlAnning AnD VAliDAtion
8700, 8718, 8719, 8720/21
Using PULSE Reflex Finite Element Interfaces and PULSE Reflex Modal Analysis enables:
f Import and visualisation of FE models from leading programs like Nastran®,
Ansys®, Abaqus® or as UFF files
f Animation of FE models to investigate frequency range of interest, mode density,
mode order, critical modes, etc .
f Animation of FE models to select optimal excitation and response points and direc-
tions for modal testing
f Decimation of FE models to accurate test models for modal testing
f Comparison of modal test results with FEA results
MoDel correlAtion
8700, 8718, 8719, 8722
Using PULSE Reflex Finite Element Interfaces and PULSE Reflex Correlation Analysis al-
lows you to perform a complete visual and numerical correlation analysis of two modal
models (test vs . FE, test vs . test or FE vs . FE) including:
f Geometry alignment and DOF mapping between models
f Comparison of models based on mode table values and mode shape animations
f Mode shape correlations based on AutoMAC, CrossMAC, AutoOrthogonality and
CrossOrthogonality calculations
f Mode pairing based on frequency, damping and mode shape correlations
PULSE Reflex Modal Analysis: Decimation of an FE model to a test model by selecting points on the FE model.
test-feA integrAtion

protecting brand value increasingly requires living
up to the quality expectations of customers, and
whether it is an automotive or a telecom/audio
product, manufacturers must constantly enhance
production tests.
Brüel & Kjær’s core competencies in sound and
vibration is based on more than 70 years of expe-
rience within the design and production of equip-
ment for measuring sound and vibration.
applying our knowledge and systems to pro-
duction testing gives a competitive advantage to
products, at the same time as helping to save costs.
Brüel & Kjær has production test solutions that can
be applied for:
f incoming component inspection
f in-line production testing
f end-of-line production testing
we supply complete systems covering the complete
range of vibration and acoustic production testing,
from a single test station to fully serviced complete
plant systems and turnkey services.
our comprehensive range includes all of the
necessary components including microphones, ac-
celerometers, preamplifiers, couplers, front-ends,
databases and report generators.
production testingProDuction testing
130010/a
1
2
3
4
5
6
Acoustic and vibration test chamber
Signal conditioning and data acquisition
Analysis and reporting
A typical customised production test system based on standard system components

www.bksv.com/pulse 77
With component production facilities around the world contributing to the man-ufacture of precise measurement equip-ment, brüel & Kjær needs detailed and strictly centralised control of production test targets. When a new system was called for to maintain our r&d targets in production by tracking and analysing test outcomes around the world, we decided to build our own.
The key challenge for our R&D department is maintaining and meeting targets during the actual production of equipment . This is espe-cially critical for high-value electronic compo-nents and assemblies such as we make . while go/no go testing is important to give a fast pass or fail, high value assemblies cannot be simply rejected and it is necessary to ‘drill down’ into the results to analyse the reasons for any fail-ures to meet designated specifications . Equally, documenting the consistency of effective pro-duction is a vital part of modern manufactur-ing . In sum, data is everything, and time is short .
remote manufacturingIn the modern business climate, remote manu-facturing is widespread, and Brüel & Kjær is no exception . Consequently, we need a system
that monitors, analyses and responds to prod-uct and component quality issues quickly, cov-ering assembly plants in multiple locations around the world .
with our primary R&D expertise and infra-structure located in our Denmark headquar-ters, we need a testing service that has infra-structure at the various assembly plants, while delivering results remotely to test engineers located elsewhere . Test engineers need to track production quality expressed in terms of numerical values that govern whether or not the tested unit has met expected targets .
The bottom line is that the test should ensure components, circuit boards and finished prod-ucts roll off the production lines around the world, including at subsidiary companies and suppliers, with a specified level of quality com-mensurate with our demanding and precise standards, in order to retain our leading mar-ket position . All while minimising any reduc-tion in the rate of production .
searching for a solutionwe set out to find an objective, automated test solution capable of assessing the electroacous-tic quality of products, allowing those that do not meet the appropriate level of quality to be rejected .
requirements were:• Production sites around the world• Full oversight from headquarters• Complete central target control• No possibility of local adjustment
we needed a test engine to make this possible and looked at the market to get one . However, as the ones available did not offer everything we wanted, we decided to make our own .
Our experts in production testing and meas-urement innovation are used to creating sys-tems like this, and a custom solution was able to provide the entire package – not just instru-mentation but design, domain expertise, soft-ware and operating services .
Brüel & Kjær’s large global support network enables us to draw on our extensive service ex-perience and established resources throughout the world . Consequently, the system allows us to track test results from sub-suppliers in Thai-land, China, japan, Taiwan, other locations in Denmark, France and the US, and headquar-ters in Nærum, Denmark .
data managementA database manager helps to set up all meas-urements, control instruments, and save data in a database . Data is carried on a server that is local to the manufacturing location and backed up every night . Rather than permanent moni-toring, it records the tests permanently for later analysis . This all takes place at Brüel & Kjær’s Class-A data centre in Melbourne, Australia, which has more than 20 years of remote man-agement experience with our noise monitoring solution customers – who include many of the world’s airports . All test data is collated, secure-ly stored and maintained, and is accessible 24/7 to authorised users of the system . The system can operate on multiple production lines across multiple locations, providing a single entry point for monitoring production testing .
system benefits• Consistent level of test quality across the
products• Full visibility of remote manufacturing
quality• Shows long-term trends and issues early to
enable action before they affect produc-tion
• Delivers trustworthy results checked by ex-perts at HQ
• Continuous quality improvements• Flexibility and mobility of production lines• Focus on constant cost reduction• Less expensive global travel• Less dependence on operator skill level• Cross-functional data sharing• Secure data hosting
production Quality testing for worldwide manufacturingcase study
“With this system we have
oversight at headquarters
through the remote connec-
tions. We want full control, es-
pecially on production sites...
If something needs to be
changed, we do it from head-
quarters and then push it to
their systems.”
jesper Bo Vedel, manager of test engineering, Brüel & Kjær
“Confidence, and the ability to see the
quality are what we want. With this sys-
tem we have so much visibility that we
feel very safe – and we trust it to deliver”
torben Bjørn, Vice president of operations, Brüel & Kjær
Data Hosting
Web Site
Server
End of line Testing
Sub assembly Testing
Other Test Parameters
Quality Control
Site 1
Web Site
Server
End of line Testing
Sub assembly Testing
Other Test Parameters
Quality Control
Sites 2, 3, ..
Setup / Change Services
Fault Resolution Services
Preventive Maintenance
Technology Hosting
Remote Monitoring
Remote Control
Remote Upgrade
Web Analysis Support
Services 120714

78
I/O Interface
Ethernet Interface
Ethernet Interface
UUT or ClimaticChamber
020222/4
Laptop PC
DriveSignal
AmplifiedSignal
DynamicSignal
ControlSignal
VibrationController
AmplifierVibrationExciter
PULSE Analyzer
ViBration test and controlVibrAtion test AnD control
ensuring reliability and durability requires accurate
replication of real-life vibration conditions during
r&d and production operations. testing strategies
include accelerated lifetime testing, accelerated
stress testing, durability testing, lifecycle testing,
package testing, and squeak and rattle detection.
from mobile phone sub-assemblies through to
complete satellite systems, our comprehensive solu-
tions cover applications throughout the entire spec-
trum of vibration testing – covering payloads up to
6000 kg, with force ranges from 9 n to 289 kn.
the unbeatable performance of our systems
combines with their versatility to make them highly
efficient for r&d and production testing. all shak-
ers offer the widest achievable range of test levels.
our technical experience is frequently in de-
mand to tailor customer-specific solutions for the
most exacting requirements, in markets including
aerospace, automotive, space, defence, electronics
and machinery production.
global support, service and training is part of
our unique appeal, and draws on both our unri-
valled experience and global coverage. on-site ser-
vice and maintenance contracts are offered glob-
ally for all vibration test system configurations.
the range we offer includes vibration control-
lers, lds shakers, slip-tables and energy-efficient
amplifiers, giving us all of the components we need
to meet virtually any test requirement in the world
today. this allows you to acquire all your measure-
ment and testing components from one supplier,
and to enjoy all the benefits of capability, scale and
resilience that we offer.
VibrAtion controllers
Vc-lAn AnD lAser/coMet
Multi-point control of complex structures with an intuitive user in-
terface to support workflows from basic tests like sine, random and
shock, up to advanced system tests for the most challenging scenarios .
f Automated reporting
f waveform recording and replication
f Resonance search track and dwell

www.bksv.com/vts 79
PerMAnent-MAgnet shAKers
V101-V455
PeAK force rAtings froM 9 n to 489 n
f Modal and structural analysis
f Electronic assembly test
f Calibration systems
Efficient armature design allows for delivery
of impressive peak forces and acceleration
over a very wide frequency range .
Air-cooleD electro- DynAMic shAKers
V555-V780
PeAK force rAtings froM 667 n to 5115 n
f Automotive component testing
f Aerospace component testing
f Electronic assembly testing
f Structural testing and analysis
f Vibration stress testing under varied
environmental conditions
f In-house test and calibration facilities
with a combination of a wide frequency
range, high force and high acceleration,
this range of air-cooled shaker systems
delivers excellent all-round capabilities for
testing all types of components and smaller
assemblies .
Air-cooleD high force electroDynAMic shAKers
V830-V8
PeAK force rAtings froM 8.9 kn to 60 kn
f Automotive parts and systems – quali-
fication testing
f Electronic assembly, computer equip-
ment testing
f Avionics and military hardware testing
f Satellite component testing
f Product and package testing
f General stress screening
The industry standard for automotive,
military and electronic testing . Full ver-
satility and capability as demanded for
research and development, product
qualification and stress screening .
wAter-cooleD Very high force electroDynAMic shAKers
V9-V994
PeAK force rAtings froM 89 kn to 289 kn
f High-force, long-duration automotive
testing
f Space, avionics and military hardware
testing
f Low-frequency and shock pulse testing
f Product and package testing
f 3-axis testing of complete satellite
systems
f Multi-shaker, multi-axis application
f Suitable for cleanroom environments
Scan here to learn more about vibration test systems:
VibrAtion test AnD control

80
360-Degree serVices
1 installation to get you up and running
Our skilled engineers will not leave you
until you are up and running . From soft-
ware to comprehensive systems, their ex-
pertise will save you time .
2 training – efficiency from the start
Get instruction from the people who
know the Brüel & Kjær products best .
we offer extensive national and interna-
tional training programmes that give you
the opportunity to improve and increase
your capabilities .
3 support – help is always at hand
If you need help, just call our hotline
during normal working hours to talk to
experienced Brüel & Kjær engineering
support teams .
4 software updates and revisions
Ensure you are always up-to-date with
a Software Maintenance and Support
Agreement that grants holders exclu-
sive access to licensed software products
including tested version upgrades, up-
dates, and patches .
5 expert calibration
Planned, regular calibration assures
measurement data quality and valid-
ity . we offer a comprehensive range of
calibration services including accredited
calibration, traceable calibration, and
verification – performed at your site or in
our laboratories .
6 hardware maintenance – no un-pleasant surprises
Under the maintenance scheme we test
your instruments according to their origi-
nal specifications and bring them up to
standard .
7 repair – authorised service staff and original parts
Our highly skilled service engineers use
original equipment and spare parts to
ensure repair quality and to extend your
product’s working life, on-site or in our
workshop .
8 rental – a realistic option
For short-term projects, or when your in-
strumentation is being repaired, why not
rent from us? This means you can always
say yes to sound and vibration measure-
ment opportunities .
worldwide serVice and supportworlDwiDe serVice AnD suPPort
to provide you with the best customer ser-
vice we continuously expand our offerings
and improve our internal processes – en-
suring the same ‘best-in-class’ standards
around the globe.
a single point of contact speeds up your
enquiries by connecting you to the right
person the very first time, and our multi-
lingual global customer care organisation
will be eager to assist you in any way. they
submit your requests for service, track your
orders end-to-end, and proactively inform
you about the status and delivery schedule.
and if you need technical support, they will
route you to a dedicated contact.
equipment calibration and repair is ex-
pertly carried out in one of Brüel & Kjær’s
accredited calibration centres. our global
product care team is regularly trained and
certified to perform calibrations and re-
pairs of instrumentation, in order to main-
tain the same high standards that new
equipment enjoys.
Knowledgeable global field service en-
gineers will be at your disposal for on-site
field services including installation, system
configuration, fault resolution, calibration
and preventative maintenance of entire
systems. a range of services reduces the
risk of faults occurring during use.
your local support team is backed by
a global group of engineering specialists
who can offer advice and solutions for
the many kinds of sound and vibration
measurement and analysis challenges that
you might encounter. professional project
management and engineering test services
combined with experienced technical sup-
port provide additional value and en-
sure continued smooth operation.

www.bksv.com/pulse 81
worldwide serVice and supportif you use Pulse, you Might:
f Like to benefit from new Microsoft® im-
provements to stay on track with latest
technology
f Need support on a regular basis, such as
when the system is installed, when a new
version is released or when a new opera-
tor takes over
f Experience Microsoft® updates that bring
the risk of PULSE not functioning prop-
erly and need help to fix it
f want to constantly improve efficiency by
taking advantage of the enhancements
and improvements to the features and
functionality of PULSE
f Need to reduce the cost of ownership
and manage the life-cycle of your system
f Enjoy the peace of mind of knowing
your agreement is active
f Gain exclusive access to attractive offers
and receive invitations to join seminars
and user days
Brüel & Kjær’s Software Maintenance and
Support Agreement is designed to cover all
of the above .
softwAre MAintenAnce AnD suP-
Port AgreeMent
Keeping pace with evolving business re-
quirements means that you need to ensure
your PULSE system remains up-to-date . The
Brüel & Kjær Software Maintenance and
Support Agreement keeps your PULSE sys-
tem at the forefront of this evolution and
provides access to expert technical user-sup-
port when you need it .
whAt’s incluDeD
tested to work with Microsoft® Win-dows® – keep Pulse secure and reliable
we ensure your PULSE application remains
secure and reliable with each Microsoft® up-
date by continuously testing our products on
the latest versions of the Microsoft® windows®
operating system, including all critical updates .
upgrade – benefit from the newest technology
Our development department constantly im-
proves the functionality and user-interface of
PULSE, spending thousands of hours improv-
ing our software based on customer feed-
back . with a valid Software Maintenance
and Support Agreement you will benefit
from these very latest developments .
exclusive access to hotline
your local Brüel & Kjær support team is com-
mitted to helping you when technical exper-
tise is required . The hotline is backed up by
our global team of skilled product specialists
and application engineers . with an agree-
ment you will receive support, and be our
service and support organisation’s highest
priority .
unify the versions of Pulse software – become more flexible
If you have more than one PULSE system, it
is likely that they are different versions . This
gives you less flexibility and/or higher cost, as
operators need to know how to use different
programs and interfaces . with the Software
Maintenance and Support Agreement, all
versions will be updated to the latest version .
receive attractive offers during the year
with a Software Maintenance and Support
Agreement you will receive attractive of-
fers made especially for agreement holders,
giving you substantial savings during the
year .
one-yeAr AgreeMent ProgrAMMe
The Software Maintenance and Support
Agreement (M1), entitles you to receive pri-
ority technical user-support for the current
software version and any version released
within 12 months, as well as direct and im-
mediate access to all software updates and
revisions issued by Brüel & Kjær for licenced
products .
Multi-yeAr renewAl ProgrAMMe
Besides all the agreement benefits, the mul-
ti-year version of M1 gives ongoing compati-
bility with the latest Microsoft® operating
systems and unifies software versions, always
keeping you up-to-date . Additionally, our
calibration service (including collection and
delivery) can be bundled into the agreement
for improved data quality and cost savings .
worlDwiDe serVice AnD suPPort

82
pulse HardwareInput Type Product Name Type No.
Input Channels
Front Panel
Generator Output
Channels
Frequency Range
Front Panel Connectors
Included Optional
Direct CCLDa Mic. Preamp. (0 or 200V
polarization voltage) Chargeb
3-ch. Input Module LAN-XI 102.4 kHz (Mic, CCLD, V)
3052-A-030 3 -0 Hz to
102.4 kHzBNC:
UA-2100-030LEMO:
UA-2101-030SOUND INT:
UA-2104-031DBT: UA-2114-03
4-ch. Input Module LAN-XI 51.2 kHz (Mic, CCLD, V)
3050-A-040 4 -
0 Hz to 51.2 kHz
BNC:UA-2100-040
LEMO:UA-2101-040
SOUND INT:UA-2104-031
6-ch. Input Module LAN-XI 51.2 kHz (Mic, CCLD, V)
3050-A-060 6 -BNC:
UA-2100-060
LEMO:UA-2101-060
SOUND INT:UA-2104-031
CHARGE AMP:UA-2105-060c SUB-D: UA-2103
TRIAX:UA-2108-060
6CH ARRAY:UA-2112-060
MONITOR:UA-2113-066 DBT: UA-2114-060
4-ch. Input Module/HS Tacho + 8 ch. LAN-XI 51.2 kHz
(Mic, CCLD, V, HS Tacho, Aux)3056-A-040 4+8 -
Aux BNC:UA-2111-040
Aux LEMO: UA-2110-040 SOUND INT: UA-2104-031
Generator, 4/2-ch. Input/Output Module LAN-XI 51.2 kHz (Mic, CCLD, V)
3160-A-042 4 2BNC:
UA-2100-060LEMO/BNC: UA-2102-042
SOUND INT: UA-2104-031
DBT: UA-2114-042
Generator, 2/2-ch. Input/Output Module LAN-XI 51.2 kHz (MIc, CCLD, V)
3160-A-022 2 2BNC:
UA-2100-022LEMO/BNC:
UA-2102-022
Direct CCLDa
Chargeb
12-ch. Input Module LAN-XI 25.6 kHz (CCLD, V)
3053-B-120 12 -0 Hz to
25.6 kHzSMB:
UA-2107-120TRIAX:
UA-2108-120 12CH ARRAY: UA-2112-120
Battery Module
Battery Module 2831-A -The battery module is a rechargeable Li-Ion battery with an output voltage of 14.8 V and a capacity of 6400 mAh. On the front, 5 LED status indicators show the remaining capacity.
LAN-XI Frames
5-module LAN-XI Front-end Frame Type 3660-C
3660-C-000Houses up to 4/3 input/output modules + 1/2
batteriesMains (90-264 V AC, 47 – 63 Hz) or DC powered (10 – 32 V).Phase and sample-synchronous measurement with other PULSE front-ends including IDAe.Plug-and-play modules can be removed for field measurements using a single module, or swapped for calibration or repair.Modules can be locked or screwed in place.Operation is silent as long as the temperature of the unit is within safety limits. If the maximum operating temperature is reached, cooling fans start. Their SPL is < 30dB at 1m.
11-module LAN-XI Front-end Frame Type 3660-D
3660-D-000Houses up to 10/9 input/
output modules + 1/2 batteries
1
2
3
4
5
6
1
2
1
2
3
4
5
6
1
2
1
2
3
4
5
6
1
2
1
2
5
6
1
2
1
2
3
1
2
3
4
5
6
6
7
8
9
10
11
a Constant Current Line Drive for CCLD (DeltaTron)/ICP®/IEPE accelerometers or microphone preamplifierb Via CCLD Converter Type 2646 or the range of Charge to CCLD Converters Type 2647c UA-2105-060 requires a Type 2647-A, -B, -C, or -D per channel
1
2
3
4
AUX 1 - 4
AUX 5 - 8
HS
Tach
o
1
2
3
4
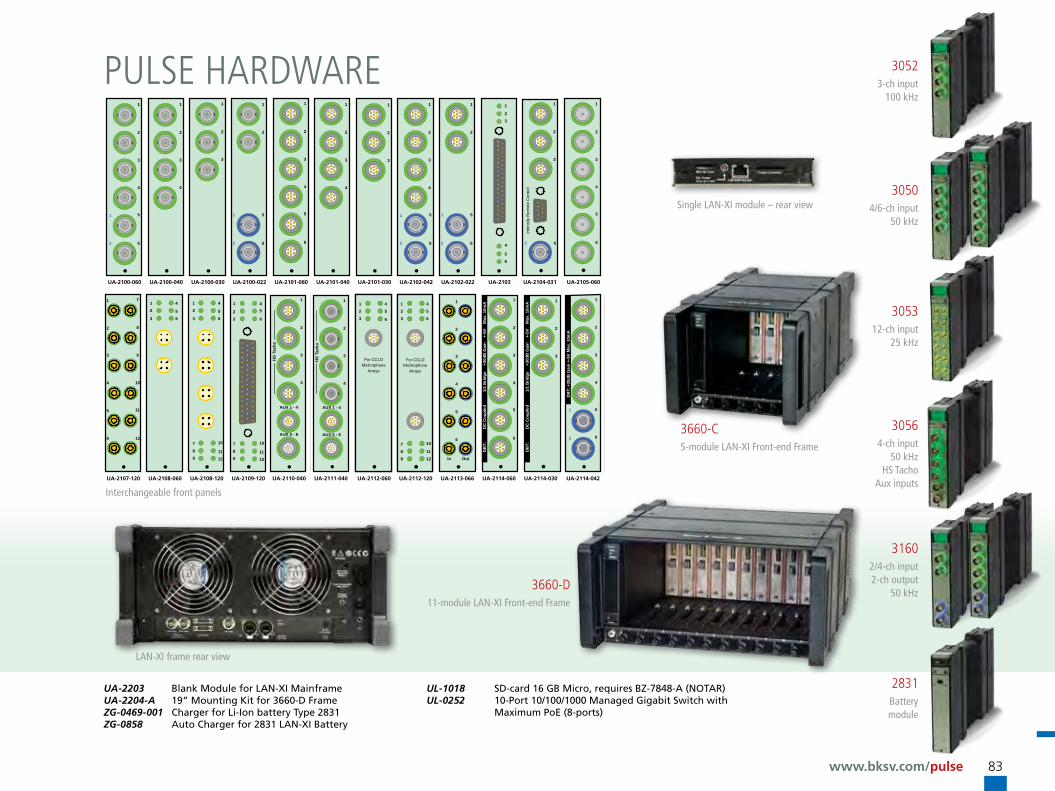
www.bksv.com/pulse 83
30504/6-ch input
50 kHz
30523-ch input
100 kHz
30564-ch input
50 kHzHS Tacho
Aux inputs
305312-ch input
25 kHz
31602/4-ch input 2-ch output
50 kHz
2831Battery module
1
2
3
4
1
2
3
1
2
5
6
1
2
1
2
3
4
5
6
1
2
3
4
1
2
3
1
2
3
4
5
6
1
2
1
2
5
6
1
2
1
23
4
56
1
2
3
4
5
6
Off Active
1
2
3
IntensityRemote Control
7
8
9
10
11
12
1
2
3
4
5
6
12
3
4
56
12
3
10
1112
4
56
789
1
23
10
1112
45
6
789
12
3
45
6
789
10
1112
For CCLDMichrophone
Arrays
1
2
3
4
5
6
1
2
3
1
2
3
4
5
6
In Out
1
2
3
4
1
2
1
2
3
4
5
6
1
2
1
2
3
4
1
2
12
3
45
6
For CCLDMichrophone
Arrays
1
2
3
4
1
2
3
1
2
5
6
1
2
1
2
3
4
5
6
1
2
3
4
1
2
3
1
2
3
4
5
6
1
2
1
2
5
6
1
2
1
23
4
56
1
2
3
4
5
6
Off Active
7
8
9
10
11
12
1
2
3
4
5
6
12
3
4
56
12
3
10
1112
4
56
789
12
3
45
6
789
10
1112
For CCLDMicrophone
Arrays
1
2
3
4
5
6
In Out
1
2
3
4
5
6
1
2
12
3
45
6
For CCLDMicrophone
Arrays
1
2
3
4
5
6
DB
T:
DC
Cou
pled
1
/1 B
ridge
+
30dB
Gai
n
+-5V
M
ax. 1
0mA
1
2
3
DB
T:
DC
Cou
pled
1
/1 B
ridge
+
30dB
Gai
n
+-5V
M
ax. 1
0mA
1
2
3
Inte
nsity
Rem
ote
Con
trol
62
UA-2100-040
2UA-2100-030
3UA-2100-022
4UA-2101-060
5UA-2101-040
6UA-2101-030
7UA-2102-042
8UA-2102-022
9UA-2103
10UA-2105-060
11UA-2106
12UA-2104-031
13UA-2107-120
14UA-2108-060
15UA-2108-120
16UA-2112-120
18UA-2113-066
19UA-2100-060
1UA-2112-060 UA2114-060 UA2114-030
20 21
Old number1703-A-060
Old number1703-A-030
1
2
3
4
5
6
In Out
UA-2113-066
24
1
2
3
4
AUX 1 - 4
AUX 5 - 8
HS
Tach
o
UA2110-040
25
1
2
3
4
AUX 1 - 4
AUX 5 - 8
HS
Tach
o
UA2111-040
26UA2114-042
22
1
2
3
4
5
6
DB
T: +
30dB
Gai
n +-
5V M
ax. 1
0mA
1
2
UA2115-042
23
1
2
3
4
5
6
VIC
1
2
Opdateret 2012-07-17, 14:21
1
2
3
10
11
12
4
5
6
7
8
9
UA-2109-120
17 27
1
2
3
4
1
2
3
1
2
5
6
1
2
1
2
3
4
5
6
1
2
3
4
1
2
3
1
2
3
4
5
6
1
2
1
2
5
6
1
2
1
23
4
56
1
2
3
4
5
6
Off Active
7
8
9
10
11
12
1
2
3
4
5
6
12
3
4
56
12
3
10
1112
4
56
789
12
3
45
6
789
10
1112
For CCLDMicrophone
Arrays
1
2
3
4
5
6
In Out
1
2
3
4
5
6
1
2
12
3
45
6
For CCLDMicrophone
Arrays
1
2
3
4
5
6
DB
T:
DC
Cou
pled
1
/1 B
ridge
+
30dB
Gai
n
+-5V
M
ax. 1
0mA
1
2
3
DB
T:
DC
Cou
pled
1
/1 B
ridge
+
30dB
Gai
n
+-5V
M
ax. 1
0mA
1
2
3
Inte
nsity
Rem
ote
Con
trol
62
UA-2100-040
2UA-2100-030
3UA-2100-022
4UA-2101-060
5UA-2101-040
6UA-2101-030
7UA-2102-042
8UA-2102-022
9UA-2103
10UA-2105-060
11UA-2106
12UA-2104-031
13UA-2107-120
14UA-2108-060
15UA-2108-120
16UA-2112-120
18UA-2113-066
19UA-2100-060
1UA-2112-060 UA2114-060 UA2114-030
20 21
Old number1703-A-060
Old number1703-A-030
1
2
3
4
5
6
In Out
UA-2113-066
24
1
2
3
4
AUX 1 - 4
AUX 5 - 8
HS
Tach
oUA2110-040
25
1
2
3
4
AUX 1 - 4
AUX 5 - 8
HS
Tach
o
UA2111-040
26UA2114-042
22
1
2
3
4
5
6
DB
T: +
30dB
Gai
n +-
5V M
ax. 1
0mA
1
2
UA2115-042
23
1
2
3
4
5
6
VIC
1
2
Opdateret 2012-07-17, 14:21
1
2
3
10
11
12
4
5
6
7
8
9
UA-2109-120
17 27
1
2
3
4
1
2
3
1
2
5
6
1
2
1
2
3
4
5
6
1
2
3
4
1
2
3
1
2
3
4
5
6
1
2
1
2
5
6
1
2
1
23
4
56
1
2
3
4
5
6
Off Active
7
8
9
10
11
12
1
2
3
4
5
6
12
3
4
56
12
3
10
1112
4
56
789
12
3
45
6
789
10
1112
For CCLDMicrophone
Arrays
1
2
3
4
5
6
In Out
1
2
3
4
5
6
1
2
12
3
45
6
For CCLDMicrophone
Arrays
1
2
3
4
5
6
DB
T:
DC
Cou
pled
1
/1 B
ridge
+
30dB
Gai
n
+-5V
M
ax. 1
0mA
1
2
3
DB
T:
DC
Cou
pled
1
/1 B
ridge
+
30dB
Gai
n
+-5V
M
ax. 1
0mA
1
2
3
Inte
nsity
Rem
ote
Con
trol
62
UA-2100-040
2UA-2100-030
3UA-2100-022
4UA-2101-060
5UA-2101-040
6UA-2101-030
7UA-2102-042
8UA-2102-022
9UA-2103
10UA-2105-060
11UA-2106
12UA-2104-031
13UA-2107-120
14UA-2108-060
15UA-2108-120
16UA-2112-120
18UA-2113-066
19UA-2100-060
1UA-2112-060 UA2114-060 UA2114-030
20 21
Old number1703-A-060
Old number1703-A-030
1
2
3
4
5
6
In Out
UA-2113-066
24
1
2
3
4
AUX 1 - 4
AUX 5 - 8
HS
Tach
o
UA2110-040
25
1
2
3
4
AUX 1 - 4
AUX 5 - 8
HS
Tach
o
UA2111-040
26UA2114-042
22
1
2
3
4
5
6
DB
T: +
30dB
Gai
n +-
5V M
ax. 1
0mA
1
2
UA2115-042
23
1
2
3
4
5
6
VIC
1
2
Opdateret 2012-07-17, 14:21
1
2
3
10
11
12
4
5
6
7
8
9
UA-2109-120
17 27
1
2
3
4
1
2
3
1
2
5
6
1
2
1
2
3
4
5
6
1
2
3
4
1
2
3
1
2
3
4
5
6
1
2
1
2
5
6
1
2
1
23
4
56
1
2
3
4
5
6
Off Active
1
2
3
IntensityRemote Control
7
8
9
10
11
12
1
2
3
4
5
6
12
3
4
56
12
3
10
1112
4
56
789
1
23
10
1112
45
6
789
12
3
45
6
789
10
1112
For CCLDMichrophone
Arrays
1
2
3
4
5
6
1
2
3
1
2
3
4
5
6
In Out
1
2
3
4
1
2
1
2
3
4
5
6
1
2
1
2
3
4
1
2
12
3
45
6
For CCLDMichrophone
Arrays
1
2
3
4
1
2
3
1
2
5
6
1
2
1
2
3
4
5
6
1
2
3
4
1
2
3
1
2
3
4
5
6
1
2
1
2
5
6
1
2
1
23
4
56
1
2
3
4
5
6
Off Active
1
2
3
IntensityRemote Control
7
8
9
10
11
12
1
2
3
4
5
6
12
3
4
56
12
3
10
1112
4
56
789
1
23
10
1112
45
6
789
12
3
45
6
789
10
1112
For CCLDMichrophone
Arrays
1
2
3
4
5
6
1
2
3
1
2
3
4
5
6
In Out
1
2
3
4
1
2
1
2
3
4
5
6
1
2
1
2
3
4
1
2
12
3
45
6
For CCLDMichrophone
Arrays
uA-2105-060uA-2100-060 uA-2100-040
uA-2107-120
uA-2100-030
uA-2108-060
uA-2100-022
uA-2108-120
uA-2101-060
uA-2109-120 uA-2110-040
uA-2101-040
uA-2112-060uA-2111-040 uA-2114-042
uA-2101-030
uA-2112-120
uA-2102-042
uA-2113-066
uA-2102-022
uA-2114-060
uA-2103
uA-2114-030
uA-2104-031
3660-d 11-module LAN-XI Front-end Frame
3660-c 5-module LAN-XI Front-end Frame
Single LAN-XI module – rear view
LAN-XI frame rear view
Interchangeable front panels
pulse Hardware
UA-2203 Blank Module for LAN-XI MainframeUA-2204-A 19” Mounting Kit for 3660-D FrameZG-0469-001 Charger for Li-Ion battery Type 2831ZG-0858 Auto Charger for 2831 LAN-XI Battery
UL-1018 SD-card 16 GB Micro, requires BZ-7848-A (NOTAR)UL-0252 10-Port 10/100/1000 Managed Gigabit Switch with
Maximum PoE (8-ports)

BF
020
9 –
21
www.bksv.com
heADQuArters: brüel & Kjær sound & Vibration Measurement A/s · DK-2850 nærum · Denmarktelephone: +45 77 41 20 00 · fax: +45 45 80 14 05 · www.bksv.com · [email protected]
Local representatives and service organisations worldwide
Brüel & Kjær is a world-leading manufacturer and supplier of sound
and vibration measurement systems.
we help our partners and customers measure and manage the quality of
sound and vibration in products and the environment. our focus areas are
automotive businesses, ground transportation, aerospace, space, defence,
airport environment, urban environment, telecom and audio.
Brüel & Kjær has an unparalleled portfolio of sound and vibration measuring
equipment and is a renowned partner for innovative instrumentation solutions.
with more than 90 sales offices or local agents in 55 countries, and eight
accredited calibration centres worldwide, we provide immediate and
comprehensive customer support.