Bree.gov.au Resources and energy—the outlook for Australia Australasian Rail Association Heavy...
16
bree.gov.au Resources and energy—the outlook for Australia Australasian Rail Association Heavy Haul Rail: Newcastle 27-28 August 2014 Wayne Calder Deputy Executive Director Bureau of Resources and Energy Economics (BREE)
-
Upload
gerard-claude-henderson -
Category
Documents
-
view
220 -
download
1
Transcript of Bree.gov.au Resources and energy—the outlook for Australia Australasian Rail Association Heavy...

bree.gov.au
Resources and energy—the outlook for Australia
Australasian Rail Association Heavy Haul Rail: Newcastle 27-28 August 2014
Wayne CalderDeputy Executive Director
Bureau of Resources and Energy Economics (BREE)
bree.gov.au
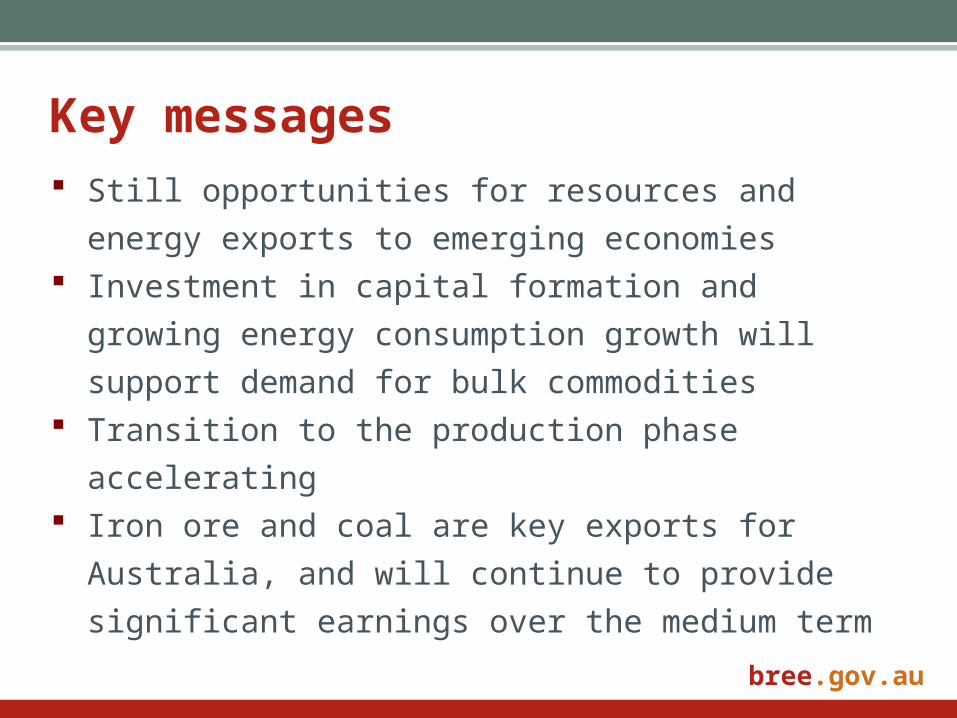
Key messages Still opportunities for resources and energy exports
to emerging economies Investment in capital formation and growing
energy consumption growth will support demand
for bulk commodities Transition to the production phase accelerating Iron ore and coal are key exports for Australia, and
will continue to provide significant earnings over
the medium term
bree.gov.au
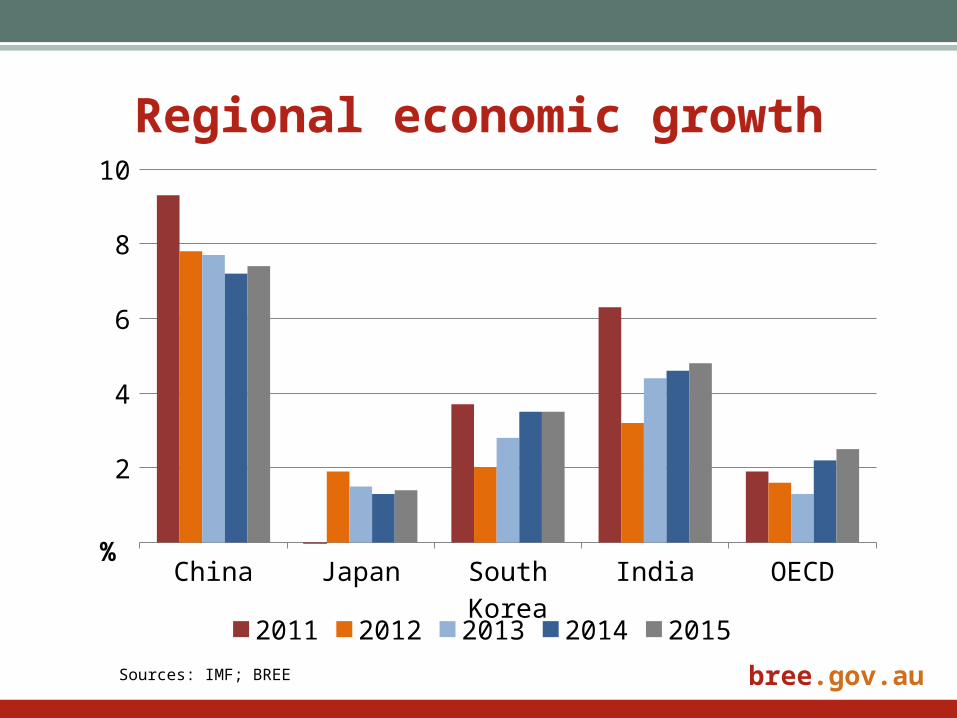
Regional economic growth
China Japan South Korea India OECD
2
4
6
8
10
2011 2012 2013 2014 2015
%
Sources: IMF; BREE
bree.gov.au
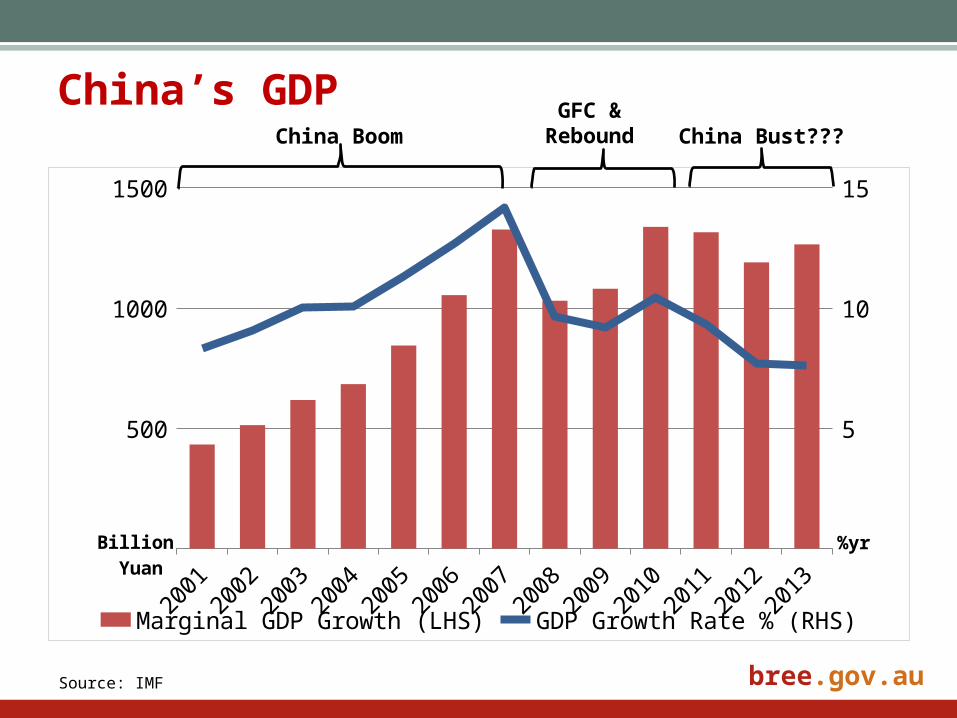
China’s GDP
2001
2002
2003
2004
2005
2006
2007
2008
2009
2010
2011
2012
2013
500
1000
1500
5
10
15
Marginal GDP Growth (LHS) GDP Growth Rate % (RHS)
Billion Yuan
%yr
Source: IMF
China Boom China Bust???GFC &
Rebound

bree.gov.au
Steel production growth to be steady
2013 2014 2015 2016 2017 2018 2019
200
400
600
800
1000
1200
1400
1600
China EU 28 Japan US India
Mt
Source: BREE

bree.gov.au
China’s monthly steel production
Jan-10 Jul-10 Jan-11 Jul-11 Jan-12 Jul-12 Jan-13 Jul-13 Jan-14
20
40
60
80
Mt
bree.gov.au
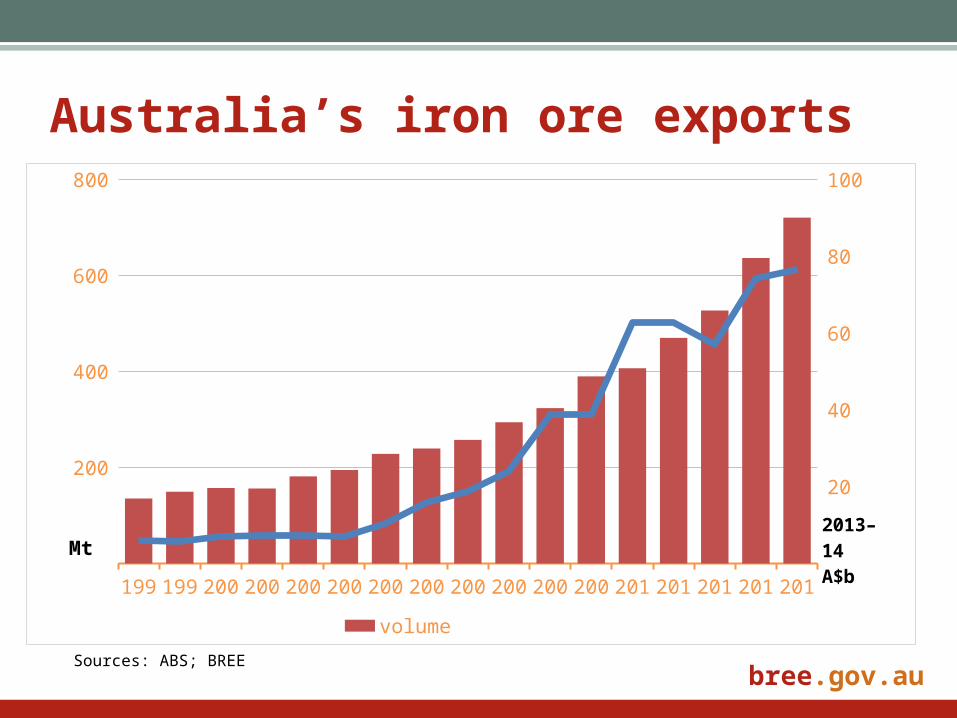
Australia’s iron ore exports
Sources: ABS; BREE
199
199
200
200
200
200
200
200
200
200
200
200
201
201
201
201
201
200
400
600
800
20
40
60
80
100
volume value (right axis)
Mt2013–14A$b
bree.gov.au
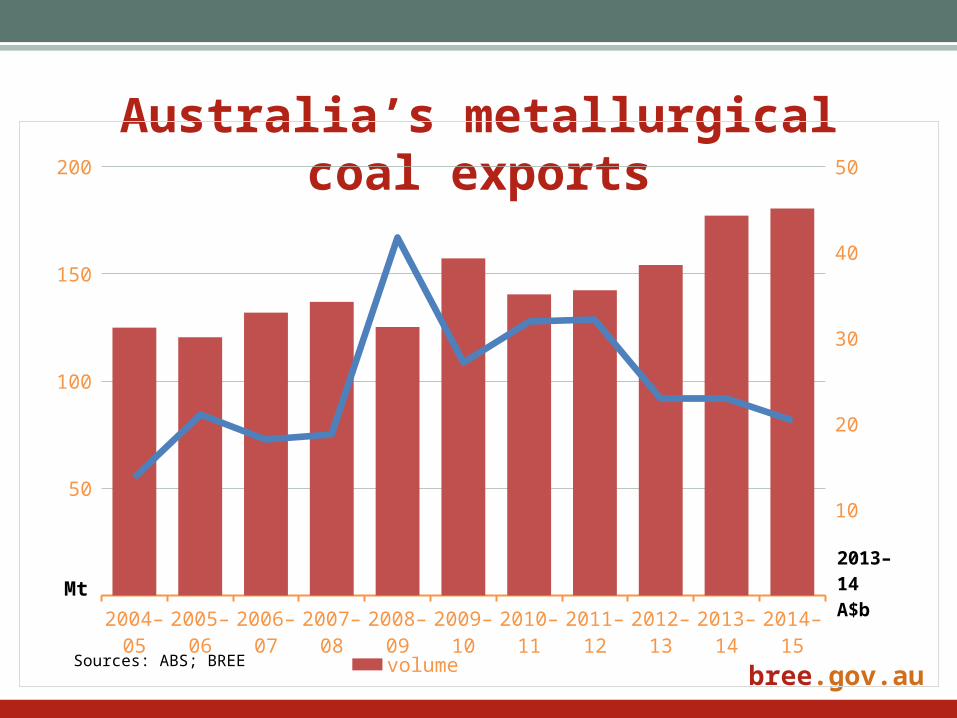
Australia’s metallurgical coal exports
Sources: ABS; BREE
2004–05
2005–06
2006–07
2007–08
2008–09
2009–10
2010–11
2011–12
2012–13
2013–14
2014–15
50
100
150
200
10
20
30
40
50
volume value (right axis)
Mt
2013–14A$b
bree.gov.au
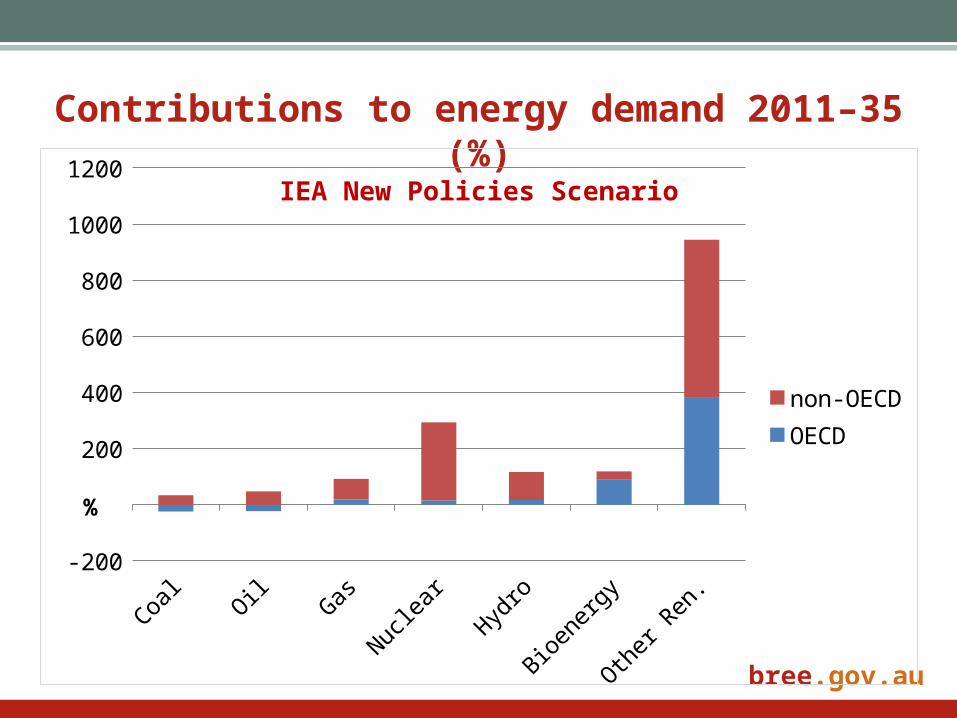
Contributions to energy demand 2011–35 (%)
IEA New Policies Scenario
Coal
OilGas
Nucle
ar
Hydro
Bioe
nerg
y
Other
Ren
.-200
200
400
600
800
1000
1200
non-OECDOECD
%

bree.gov.au
Contributions to energy demand 2011–35 (Mtoe)
IEA New Policies Scenario
Coal
OilGas
Nucle
ar
Hydro
Bioe
nerg
y
Other
Ren
.-500
500
1000
1500
non-OECDOECD
Mtoe
bree.gov.au
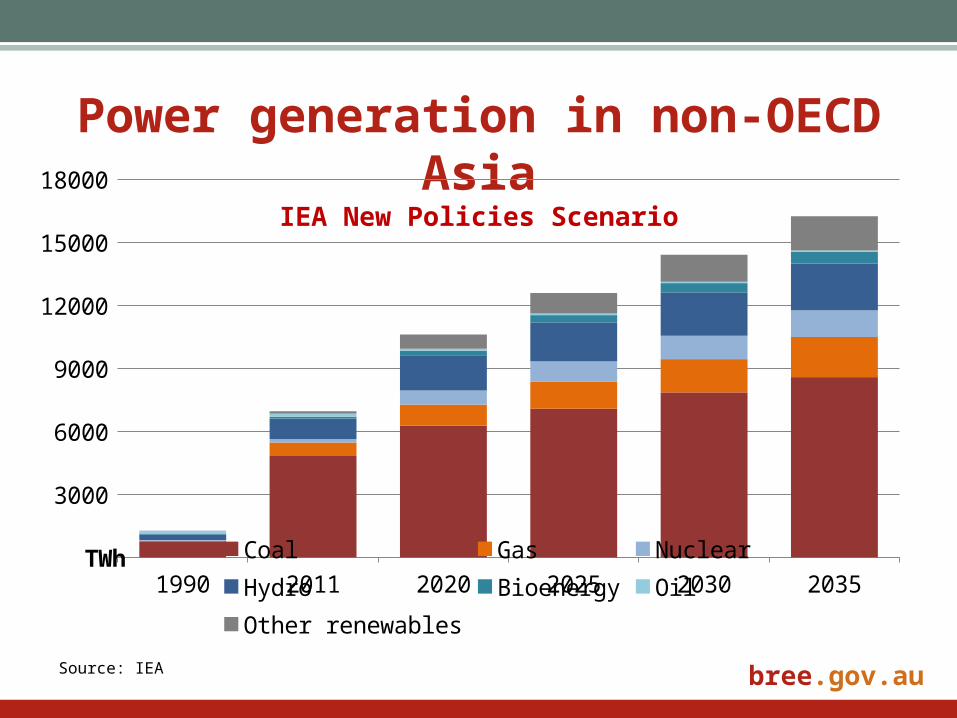
Power generation in non-OECD Asia
IEA New Policies Scenario
1990 2011 2020 2025 2030 2035
3000
6000
9000
12000
15000
18000
Coal Gas Nuclear HydroBioenergy Oil Other renewables
TWh
Source: IEA

bree.gov.au
China’s electricity generation
Jan-
96
Jan-
98
Jan-
00
Jan-
02
Jan-
04
Jan-
06
Jan-
08
Jan-
10
Jan-
12
Jan-
14
200
400
600
Thermal Hydro NuclearWind Other
Billion kWh
Electricity generation has
been increasing rapidly
and will continue to grow
Thermal (coal and gas)
sources account for the
bulk of generation
Inertia in the energy
system will prevent any
rapid change in
generation mix
bree.gov.au
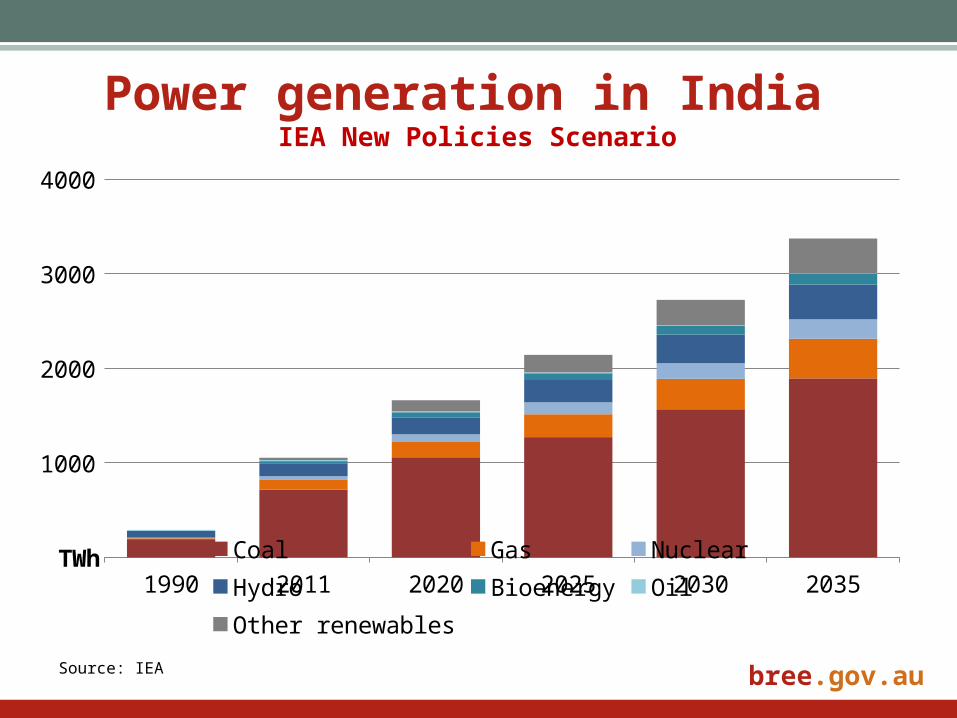
Power generation in India IEA New Policies Scenario
1990 2011 2020 2025 2030 2035
1000
2000
3000
4000
Coal Gas Nuclear HydroBioenergy Oil Other renewables
TWh
Source: IEA

bree.gov.au
Australia’s thermal coal exports
Sources: ABS; BREE
2004–05
2005–06
2006–07
2007–08
2008–09
2009–10
2010–11
2011–12
2012–13
2013–14
2014–15
-50
50
150
250
10
20
30
volume value (right axis)
Mt2013–14A$b

bree.gov.au
The production phase to increase export earnings
2008–09
2009–10
2010–11
2011–12
2012–13
2013–14
2014–15
2015–16
2016–17
2017–18
2018–19
40
80
120
160
200
240
280
energy resources
2013-14A$b
bree.gov.au
Contact
Wayne Calder
Deputy Executive Director
Bureau of Resources and Energy Economics
02 6243 7718