Brand Equity in the Canadian Coffee Shop Industry -...
42
The Importance of Brand Equity in Coffee Shop Chains - A Comparative Analysis of Tim Hortons and Starbucks in Canada May 2013 Author: Tenna Heesch Jørgensen Exam Number: 401692 Supervisor: Polymeros Chrysochou Department of Business Administration Aarhus University Characters: 84,249
Transcript of Brand Equity in the Canadian Coffee Shop Industry -...

The Importance of Brand Equity in Coffee Shop Chains
- A Comparative Analysis of Tim
Hortons and Starbucks in Canada
May 2013
Author: Tenna Heesch Jørgensen
Exam Number: 401692
Supervisor: Polymeros Chrysochou
Department of Business Administration
Aarhus University
Characters: 84,249

Aarhus University Spring 2013
Page 2 of 42
Abstract The aim of the thesis is to investigate which dimensions explain brand equity as well as which of
these dimensions affect brand equity the most. The theory will be applied to two competing brands; a
domestic brand with great market share and a global brand that both operate in the same industry.
The motivation for the investigation lies in the fact that the world is a global marketplace enabling
brands to compete in many markets and industries at once. However, it is unclear whether or not it is
an advantage to be a global company when competing with local companies for the same market
share. In this connection the thesis will be researching which dimensions contribute in building
strong brand equity with a focus on a comparative analysis of the Canadian coffee-shop chain, Tim
Hortons, and the American chain, Starbucks, in Canada. It will also investigate which of these two
brands has the strongest brand equity as well as which dimensions are most important in contributing
to strong brand equity for the Canadian customer. The analysis will be put in relation to the two
brands’ respective market shares in the Canadian foodservice industry where Tim Hortons is the
leading brand and Starbucks holds a smaller share of the market.
In order to give an answer to the outlined problem different theories of brand equity will be
investigated and David A. Aaker’s work will be used as the basis for the analysis of brand equity.
Aaker suggests that five measures explains brand equity; awareness, loyalty, perceived quality,
associations and market behavior. The Canadian foodservice industry will also be researched and the
two brands’ history and relationship to the industry will be studied. A quantitative method was used
in order to investigate the brand equities of the two brands and a questionnaire based on Aaker’s
brand equity theory was send out to Canadian students. The data was analyzed using paired sample t-
tests in order to compare the variables across the two brands and factor analysis was used to group
variables in the association dimension of brand equity. Lastly, two regression analyzes were used to
determine which dimensions explained the two brands’ brand equities.
It was found that the two brands differed significantly on the dimensions of awareness, loyalty and
perceived quality where Tim Hortons had better awareness and loyalty and Starbucks was
considered having a higher perceived quality. The two brands also differed significantly on all
associations except two; they were both associated with being reliable and popular. It was however
found that no significant differences existed between the two brands’ brand equities as well as
loyalty was the only significant dimension explaining brand equity for both brands. Since brand
equity did not seem to explain the two brands’ respective market shares in the foodservice industry,

Aarhus University Spring 2013
Page 3 of 42
other alternatives to this question is discussed in the thesis. It was however discovered that though
Starbucks had a low market share in the overall foodservice industry in Canada, the brand was the
leader in the specialty coffee section of the industry. One suggestion provided in the thesis on Tim
Hortons’ high market share, is that due to the brand’s high awareness level in combination with its
consistent quality and offering good value for money, consumers choose to purchase their coffee
shop products from Tim Hortons on a regular basis. On the other hand, Starbucks’ associations
indicate a high class, modern and global-minded brand with high service levels which could fit better
with the associations of a specialty coffee shop. These associations combined with Starbucks not
offering good value for money could lead to consumers making occasional coffee shop visits to the
brand’s facilities and therefore also explain the brand’s low market share of the foodservice industry
and high share in the specialty coffee section. The thesis concludes that the two brands do differ
significantly from each other on Aaker’s dimensions constituting brand equity though no significant
difference was found in their respective brand equities. Also based on the analysis it is concluded
that only the loyalty dimension is significant in explaining both brands’ brand equity in Canada. It is
lastly concluded that Starbucks has not been able to compete with Tim Hortons in the overall
foodservice industry in Canada but has been able to distinguish its brand from Tim Hortons in the
specialty coffee section

Aarhus University Spring 2013
Page 4 of 42
Table of Contents Abstract ............................................................................................................................................................. 2
Table of Contents .............................................................................................................................................. 4
1 Introduction ............................................................................................................................................... 6
1.1 Problem Statement ............................................................................................................................. 6
1.2 Content .............................................................................................................................................. 6
1.3 Assumptions and Delimitations ......................................................................................................... 7
2 The Importance of Branding ...................................................................................................................... 7
3 Brand Equity .............................................................................................................................................. 9
3.1 The Importance of Brand Equity ....................................................................................................... 9
3.1.1 Value for the Firm ..................................................................................................................... 9
3.1.2 Value for the Consumer ........................................................................................................... 10
3.2 Differences in Measuring Brand Equity between FMCG and the Service Industry........................ 11
3.3 The Brand Equity Ten Model .......................................................................................................... 12
3.4 Alternative Measures of Brand Equity ............................................................................................ 14
4 The Consumer Foodservice Industry in Canada ...................................................................................... 15
4.1 Tim Hortons ..................................................................................................................................... 16
4.2 Starbucks ......................................................................................................................................... 17
5 Analysis ................................................................................................................................................... 18
5.1 Procedure and Method ..................................................................................................................... 18
5.2 Analysis of Data .............................................................................................................................. 19
5.2.1 Socio-Demographics ............................................................................................................... 19
5.2.2 Awareness measures ................................................................................................................ 20
5.2.3 Loyalty measures ..................................................................................................................... 21
5.2.4 Perceived Quality .................................................................................................................... 22
5.2.5 Associations ............................................................................................................................. 23
5.2.6 Brand Equity ............................................................................................................................ 26
5.3 Regression Analysis ........................................................................................................................ 26

Aarhus University Spring 2013
Page 5 of 42
5.3.1 Tim Hortons ............................................................................................................................. 26
5.3.2 Starbucks ................................................................................................................................. 28
5.3.3 Conclusion on Analysis ........................................................................................................... 29
5.4 Limitations of the Data .................................................................................................................... 29
6 Discussion ................................................................................................................................................ 30
6.1 Future Research ............................................................................................................................... 33
7 Conclusion ............................................................................................................................................... 34
8 Bibliography ............................................................................................................................................ 37
9 Appendix A - Questionnaire .................................................................................................................... 39

Aarhus University Spring 2013
Page 6 of 42
1 Introduction Every company in today’s business world wishes to establish brand equity in order to set itself apart from
competition as well as to increase firm value. As defined in previous research: “Strong brands enjoying high
brand equity can help managers to relish higher margins, greater customer loyalty, less vulnerability to
competitive attacks, […].” (Gill & Dawra 2010, p. 189). It is therefore important for a company to be aware
of the factors affecting its brand equity in order to stay on top in a competitive environment.
With today’s open markets, global companies have the chance to set themselves apart from domestic
competition, and thereby potentially become market leaders in more than one country. However, it is not
always possible for these companies to gain market share and compete with the local companies, even
though they are successful in other foreign countries. This could be caused by many things, e.g. that the
global company does not adjust to local customs, or due to a local company’s strong brand equity in the
domestic community. This could be the case in the Canadian foodservice industry where the Canadian
company, Tim Hortons, controls 18.2% of the market while the globally successful company, Starbucks,
only sits on approximately 3% of the Canadian market (Euromonitor 2012b). This paper will therefore be
searching for a reason why this is the case in Canada, and it will investigate it on the grounds of the
companies’ respective brand equities in Canada.
1.1 Problem Statement
The paper will investigate which dimensions contribute in building strong brand equity. The focus will be on
a comparative analysis of the Canadian coffee-shop chain Tim Hortons and Starbucks in Canada. It will also
investigate which of these two brands has the strongest brand equity, as well as which dimensions are most
important in contributing to strong brand equity for the Canadian customer.
1.2 Content
The first section of the paper states the purpose and the reasoning behind the chosen subject of the study. The
second section of the paper will explain the background of branding and why it is important for companies to
be aware of their brand. The third section will go in further detail with brand equity and the drivers behind it
in order to be able to research the brand equities of Tim Hortons and Starbucks, and will also put brand
equity in relation to the marketing mix of both products and services. Different researchers’ works on brand
equity will be discussed in order to give a broader sense of what research has been done in the field of brand
equity. A model explaining and measuring brand equity will be discussed in this section as well. The fourth
section in the paper will introduce the brands Tim Hortons and Starbucks, and their relation to the Canadian
foodservice industry will be investigated. The fourth section will analyze the two brands’ brand equity based
on a questionnaire answered by Canadian consumers, and will be investigating the differences in the two
brands’ equity drivers in order to answer the problem statement outlined in the first section. The fifth section
will analyze the questionnaire results using paired sample t-tests, factor analysis as well as perform two

Aarhus University Spring 2013
Page 7 of 42
regression analyses with brand equity as the dependent variable. The last sections will discuss the results
based on a comparison of the theoretical sections and the results of the questionnaire, and a conclusion on the
paper in its entirety will end the paper.
1.3 Assumptions and Delimitations
The paper does not deal with all possible explanations and models of brand equity since there are many
researchers investigating it, and many explanations can be found in the literature. The paper will therefore be
concentrating on one of the main researchers’ work on brand equity, David A. Aaker, and two other articles
will be used and their models discussed in the paper, though only Aaker’s model is used in the analysis done
in the paper.
Another important delimitation of this paper is that it does not distinguish between coffee and food purchases
when analyzing the brand equity of Tim Hortons and Starbucks, even though their respective selections vary.
This is done for simplicity’s sake which means that the questionnaire states “coffee shop visits”1 instead of
clarifying whether it was a coffee or food purchase. It is believed that this delimitation will not affect the
outcome of the analysis since consumers purchase both food and coffee at both shops, as well as the
companies belong to the foodservice industry in Canada.
Many scholars have written papers evaluating the different theories which help enlighten the weaker points
of the used theories. Though many articles exist on the subject, this paper will only be using one (Gill &
Dawra 2010) since many critique the same researchers and their theories. The article is chosen since it
presents both Aaker’s and Keller’s different viewpoints as well as the weaknesses and strengths of both
researchers. The article is also comprised of a study where the dimensions of brand equity are investigated
and discussed which can help put the results of the analysis done in this paper into perspective.
It is also acknowledged that McDonald’s is a third great player in the Canadian consumer foodservice
industry, but it has been decided not to integrate this into the study since it first recently began focusing on
coffee beverages with the opening of McCafé.
2 The Importance of Branding A brand is defined in many ways, but a commonly accepted definition is:
“A name, term, sign, symbol, or design, or combination of them which is intended to
identify the goods and services of one seller or group of sellers and to differentiate them
from those of competitors.” (Kotler in Keller 1993, p. 2)
1 See Appendix A

Aarhus University Spring 2013
Page 8 of 42
Another, different interpretation of the term brand is found from the Chartered Institute of Marketing which
sees the brand as a symbol of the consumers’ experiences with a company’s product and/or services (Kotler
et al. 2009). This definition mainly focuses on the consumers and how they distinguish a company from
other companies. It stresses that a brand is an asset that companies cannot entirely control since it is up to the
consumers to interpret the signals and symbols developed by the companies which are all intended to
strengthen the brand names. In line with this statement is the fact that “brands are often used as symbolic
resources for the construction and maintenance of identity” (Kotler et al. 2009, p. 426). This means that
branding a product is not merely about the product in itself; it is also about what the product should represent
and what associations it should reflect. An example of this could be the sports brand Nike; consumers do not
buy Nike because it is the best product or gives the best value for money. They buy Nike sports shoes
because wearing them in a public forum says something about the consumer as a person. In other words, it is
an individual statement expressed through the purchase of a brand.
A brand can also be seen as one of the most important assets a company has since it is a resource that creates
value or equity to the company (Brodie 2009). A strong and consistent brand identity can provide a company
with a strong position as well as a strong identity in the market the company operates in which makes it
easier for consumers to remember and connect with the brand (Aaker 2002). Though a brand creates value to
a company, it does take time for it to be expressed in the company’s statements. It is not developed overnight
which can potentially be problematic because marketing managers are often evaluated on their short-term
performances and therefore some managers ignore the importance of building up a strong brand due to the
lack of quick results (Aaker 1991).
Another important aspect of branding is the role it performs for consumers and for companies respectively
(Kotler et al. 2009). For consumers, a brand can signal a certain level of quality which makes it easier for a
consumer to know the level of satisfaction he/she will obtain when buying a given brand. It will also
decrease time spent during shopping since a brand represents a given set of associations in the minds of the
consumers (Aaker 1991). Shopping known brands also reduces the perceived risks with the purchase since
the consumer already knows about the product and what to expect from it. For a company, a brand provides
legal protection of unique features as well as the brand name; these can all be protected by trademarks
(Kotler et al. 2009, p. 428). A strong brand with loyal customers also creates a more predictable demand
forecast which reduces uncertainty in the production. In line with loyalty, consumers may be willing to pay a
higher price for the products or services which creates a higher profit margin for the company. These are just
a few advantages for consumers and companies that are directly related to brands and the branding of them.
It can therefore be concluded that brands are important because they set a company apart from its
competitors and thus ease the processes involved for consumers when deciding on buying a product, as well
as decrease uncertainty for the company due to more stable forecasts.

Aarhus University Spring 2013
Page 9 of 42
3 Brand Equity Brand equity has many definitions in the existing literature, but one of the most renowned definitions is
David A. Aaker’s: “a set of assets and liabilities linked to a brand, its name and symbol, that add to or
subtract from the value provided by a product or service to a firm and/or that firm’s customers.” (Aaker
1991, p. 15). A more financially based definition of brand equity is set forth by Simon & Sullivan (1993);
this definition states that brand equity is found when a firm’s book value is subtracted from the brand value,
meaning it is the extra value added to the company due to its brand.
There are many theories on the subject brand equity, and many researchers have written articles discussing
the different theories’ strengths and weaknesses. In this research paper, the Brand Equity Ten model (Aaker
2002, p. 319) will be introduced and discussed since it will form the basis of the research done in the paper.
This model has been chosen due to its ability to be used in quantitative research and because Aaker has
strived to make a standard measure of brand equity (Gill & Dawra 2010). Another researcher’s work that
will be commented on in the paper is Kevin L. Keller’s since he has a different approach of explaining brand
equity which involves both direct and indirect measures (Keller 1993).
Both authors’ focus is on consumer-based brand equity. This is relevant for the research presented in this
paper which will analyze a questionnaire answered by Canadian consumers, and the theoretical background
set out in this paper will help with understanding how to interpret the answers in connection with the drivers
behind brand equity.
3.1 The Importance of Brand Equity
Brand equity is important since financial measures tend to focus only on short term results which can lead to
brand building activities being reduced in order to obtain fast financial results in the short run. Especially
sales promotions, e.g. short term price reductions, are proved to diminish brand equity over time, even
though it creates short term financial gains (Yoo, et al 2000). Therefore having clear and easily
understandable brand strength measures will make it easier to justify why brand building activities should
not be terminated in favor of greater financial outcomes in the short run (Aaker 2002). If cutting down on
brand strengthening measures continues over a longer period of time, the profits of the firm risk being
reduced as the brand is no longer as strong as it once was. This is a reason why brand equity is important:
because it can maintain and increase profits in the longer run. Another reason why brand equity is an
important element in the product and service markets today is because it adds value to both the firm as well
as to the customers (Aaker 1991).
3.1.1 Value for the Firm
Aaker (1991) states that for a company, the added value can be found in e.g. a competitive advantage, brand
loyalty or in increased efficiency and effectiveness of marketing programs. A competitive advantage is

Aarhus University Spring 2013
Page 10 of 42
defined as: “a company’s ability to perform in one or more ways that competitors cannot or will not
match.”(Kotler et al. 2009, p. 373). According to Aaker (1991), brand equity can provide a firm with a
competitive advantage in the sense that competitors cannot match the given performance because they lack
brand equity to do so. The competitive advantage could be brand loyal customers as they will not be willing
to switch to a competitor, even though their prices are better. With strong brand equity, firms have extension
opportunities as well and can explore new markets with their brand name being the entry ticket to the new
market. This means that a brand with high brand equity does not only constitute a threat to competitors in its
own market, but also potentially in other markets. As mentioned in the beginning of the section, brand equity
also gives value to the firm by providing brand loyalty. According to Aaker (2002), brand loyalty gives a
firm time to respond to competitor threats as well as it attracts new customers. The last mentioned value-
adder which was the efficiency and effectiveness in marketing plans means that an established brand with
high brand equity does not need to prove itself through their marketing. The marketing plan is to ensure that
consumers remember and recall the brand in purchase decisions regarding the product range that the product
is part of (Aaker 1991).
3.1.2 Value for the Consumer
It is not only companies that can benefit from high brand equity; consumers greatly benefit from it in their
everyday lives as well. According to Aaker (1991), the value brand equity can provide consumers are: easier
processing of information, confidence in the purchase decision and use satisfaction.
When a consumer is bombarded with offers, price promotions and overloads of information on brands in the
supermarket after a long day on the job, it is easier for a consumer to choose a known brand they can
recognize and recall from memory. This lessens the processing of information since they already know about
the attributes of the product, and it makes them confident in the purchase decision as well. The consumer
knows what to expect from the product and also most likely knows beforehand whether or not the product is
liked in the household. This is in line with the use satisfaction that high brand equity can provide since the
consumer again knows what he/she likes about the product and whether or not the attributes of the product
are suitable for the intended use of it. All in all, high brand equity lessens the insecurities consumers can
experience in a purchase situation since they know of the brand and the value for the consumer is to know
he/she will be pleased with the purchase (Aaker 1991).
In conclusion, it can be argued that brand equity is important due to the value it provides to both firms and
consumers. This is respectively seen in competitive advantages, brand loyalty and efficiency and
effectiveness in marking plans as well as in easier information process, confidence in the purchase decision
and use satisfaction.

Aarhus University Spring 2013
Page 11 of 42
3.2 Differences in Measuring Brand Equity between FMCG and the Service Industry
The difference between a fast-moving consumer good (FMCG) and a service is the tangible product. The
consumer has a physical product to relate to the brand of a FMCG-company whereas other factors play a role
to the consumer when evaluating the brand of a service company. The marketing mix is extended when
marketing services as opposed to marketing FMCG. The marketing mix is used when assessing the tools that
can be used to influence buyer decisions (Kotler et al. 2009). When marketing FMCG, the first 4P’s of the
marketing mix is often sufficient to use, and these are: product, place, price and promotion (Kotler et al.
2009). From the studies of the marketing mix’s effect on brand equity it can be determined that:
“…managers must invest in advertising, distribute through retail stores with good images, increase
distribution intensity, and reduce frequent use of price promotions.” (Yoo, et al 2000, p. 208). The reason
advertising has an effect on brand equity is because it is first of all positively related to perceived quality,
and secondly it shows that the firm is investing in its brand (Yoo, et al 2000). The place and intensity of
distribution also has a great impact on brand equity according to Yoo et al. (2000) since consumers only
show loyalty when there is consistency between the product and the store image. The distribution intensity is
also important since consumer satisfaction will increase when a product is available in many stores due to the
convenience of less travel and search time for the consumer (Yoo, et al 2000). Price promotions will reduce
brand equity in the long run, even though it creates financial gains in the short run. It decreases brand equity
since price promotions can indicate low-quality brand image as well as create consumer confusion between
expected and observed prices which leads to an image of unstable quality (Yoo, et al 2000). The studies of
Yoo et al. (2000) also shows that price has no significant correlation to the dimensions of brand equity,
meaning that even though price indicates high quality, it does not create loyalty nor does it increase brand
awareness.
When it comes to services, another three P’s are necessary, and therefore people, process and physical
evidence have been added to the 4P’s framework. The reason for adding the last three P’s can be found in the
existing literature: “…in case of tangibles, the product represents the brand but in case of intangibles, the
whole company is treated as the brand.” (Nath & Bawa 2011, p. 137). Since the whole company represents
the brand, it is necessary to include the employees who represent the brand, the stores where the services are
bought or presented, as well as the processes of obtaining the given services. According to Tan (2012),
service quality is of great importance when it comes to consumer-based brand equity in the service industry
since it is the consumers’ perceptions of the service providers that can lead to strong brand equity.
According to Schmenner (1986) in Tan (2012), there are four types of services: service factories, service
shops, mass services and professional services. They define restaurant chains as service shops which have
two distinctive features: high level of consumers’ interaction with the service processes meaning service
shops relies heavily on their human capital as well as providing customized business services (Tan et al.
2012). This means that customers can ask for additional services or for particular attention which is not as

Aarhus University Spring 2013
Page 12 of 42
Source: Kotler et al. 2009 and Tan et al. 2012
common in a fast-moving consumer goods shop (Tan et al. 2012). It is stated that: “…service quality of a
specific brand is found to be a vital element that affects the creation of brand equity in the service shop
business.” (Tan et al. 2012, p. 71). This proves that the extra 3P’s in the marketing mix do have a significant
effect on brand equity in the service sectors. The dimensions of service quality are tangibles, responsiveness,
empathy, assurance, recovery and knowledge (Tan et al. 2012). These translate into the added 3P’s of the
marketing mix framework as seen in table 1 below.
As seen in table 1, responsiveness, empathy and knowledge can be categorized in the people dimension of
the marketing mix as they represent important elements, employees of a service shop must be given or
already possess in order to provide excellent customer services. Recovery is found in the process dimension
since it is important to implement processes that can restore errors in a correct and fast manner since service
shops rely on offering great, consistent service to customers. Tangibles and assurance is found in the
physical evidence dimension since the servicescape is of great importance in service shops because it is the
only tangible that can be associated with the brand.
It can be concluded that when dealing with service companies the 7P’s of the marketing mix has to be
assessed. Furthermore, the actual effect of the extra three P’s in the marketing mix on brand equity is found
to be the service quality since it has a significant effect on certain brand equity factors. The actual effects are
found in the dimensions of service quality portrayed in table 1 which all relates to people, process and
physical evidence in the marketing mix.
3.3 The Brand Equity Ten Model
It is necessary to have a model measuring brand equity since, as stated earlier, most measures of how well a
firm is doing are financial (Aaker 2002). The Brand Equity Ten model has therefore been a useful tool and
has been discussed and used by many researchers.
Table 1 Dimensions of service quality categorized into the added 3P's in the marketing mix

Aarhus University Spring 2013
Page 13 of 42
Source: Aaker, 2002, p. 319
In figure 1, Aaker’s Brand Equity Ten model (Aaker 2002, p. 319) is shown. It is based on five dimensions
that all reflect the strength of brand equity. The first four dimensions which are the loyalty, perceived
quality/leadership, associations/ differentiation and the awareness measures indicate the customers’
perceptions of the brand whereas the last dimension, market behavior, represents market-based behavior
(Aaker 2002). When using the model, only the dimension important to the given research should be used
since not all dimensions are of equal importance in every study.
Under loyalty measures, price premiums and satisfaction are found. Price premiums indicate the amount a
customer is willing to pay in order to obtain a certain brand in comparison with a competing brand that offers
similar or fewer benefits (Aaker 1991). Satisfaction measures how willing a customer is to stick to a brand,
and questions such as: “Does the product or service meet your expectations?” (Aaker 2002, p. 323) can be
asked. The issues with these measures are, firstly, that in consumers’ minds a price premium will always be a
comparison with competing firms, and therefore not only one price premium exists for one given brand.
When measuring satisfaction, it cannot be used on consumers who have not tried the product or service, and
can therefore only measure the brand equity within the customer base (Aaker 2002). Issues regarding
perceived quality measures are that consumers compare the quality of the given company’s product or
service with either competitors or might even compare it to a whole industry, and this comparison is
unknown to the researcher. It is also important to keep in mind that loyal customers will always be more
Figure 1 David A. Aaker’s Brand Equity Ten model

Aarhus University Spring 2013
Page 14 of 42
biased when it comes to perceived quality than the average customer will be (Aaker 2002). According to
Aaker (2002), the associations can be measured in three ways: brand-as-product, brand-as-person and brand-
as-organization. The first deals with a brand’s value and can be measured by figuring out whether or not the
brand is good value for money. When doing this, it is important to set a frame for comparison, for instance
stating: “among comparable brands”(Aaker 2002, p. 326). The second measure is good to use when the
investigated brands have minor physical differences and can be important for brands which: “have
personalities, are consumed in social settings and makes statements about those who drink [it].” (Aaker
2002). An example of this could be Coca Cola and Pepsi since the taste has minor differences, and it is more
or less the statement the two drinks have that determines which one a consumer chooses to purchase. This
measure should only be used with brands who position themselves as being personality brands. The last
measure is only relevant for organizations whose organization is visible (Aaker 2002). Awareness can be
measured on many different levels; two of the more important ones being recognition and recall of brands.
The issue with this measure is to use the most appropriate one for the given brands or product groups (Aaker
2002). The market behavior can measure the market share and can: “…provide a valid and sensitive
reflection of the brand’s standing with customers.”(Aaker 2002, p. 331).
It can be concluded that Aaker uses both customer-based dimensions as well as a market-related dimension
in order to measure the strength of brand equity in his model. The model consists of ten items, each
representing one of the five dimensions, and the dimensions should only be used in research when they are of
relevance.
3.4 Alternative Measures of Brand Equity
Another interpretation of brand equity and how to measure it is found in Kevin L. Keller’s work. He defines
brand equity as: “The differential effect of the brand knowledge on consumer response to the marketing of
the brand.” (Gill & Dawra 2010, p. 190). In this approach, brand awareness and brand image measures the
strength of brand equity (Gill & Dawra 2010) which means the focus is entirely customer-based, as opposed
to Aaker who also includes the last dimension of the market behavior to his model. In this measure of brand
equity, both indirect and direct measures are used. The indirect measure tries to assess the sources of brand
equity in terms of brand recognition and brand knowledge whereas the direct measure measures brand equity
by assessing the impact of brand knowledge on consumers’ response to the marketing program (Gill &
Dawra 2010). The first dimension of Keller’s model which was brand awareness, is an essential part of brand
equity. It is important that consumers think of the given brand when thinking of the product category it
belongs to while it can also affect the decision of buying the brand, even though the consumer knows no
other brand associations (Keller 1993). The second dimension which was brand image, is defined as:
“…perceptions about a brand as reflected by the brand associations held in consumer memory.” (Keller
1993, p. 3). The brand associations are divided into three categories: attributes, benefits and brand attitudes.

Aarhus University Spring 2013
Page 15 of 42
They respectively represent the descriptive features of the product or service, the personal value a consumer
attaches to the product or service attributes and the consumer’s overall evaluation of the brand (Keller 1993).
The first two attributes determine whether or not the overall brand attitude is positive or negative, though
brand attributes are only valued and interpreted by consumers if the attributes are important to them (Keller
1993). Therefore marketers have to be aware of what product or service attributes are important for the
consumers because focusing on these attributes can increase brand equity.
Gill and Dawra (2010) classifies Aaker and Keller into two different schools of thought; Aaker belongs to
the school that defines brand equity in terms of a set of assets whereas the school Keller is part of measures
brand equity as: “…the additional preference a consumer has for a branded product over a similar no-name
product…” (Gill & Dawra 2010, p. 189). In Gill and Dawra’s (2010) study, they attempt to combine the two
schools’ measures of brand equity since flaws are found in both models. Keller’s measure is stated to only
provide a framework for measuring brand awareness and brand image, but no actual measure of brand equity
is given (Gill & Dawra 2010). Aaker’s Brand Equity Ten model: “…only provides an indication towards a
set of items that can contribute to brand equity.” (Gill & Dawra 2010, p. 191). Through their study of the
toothpaste product category, they are able to conclude that Aaker’s dimensions only explain 34.9 percent of
the brand equity (Gill & Dawra 2010). The results of their study also show that brand awareness has an
indirect impact on brand equity through the dimension brand image. This means that brand awareness and
brand image are not two distinct dimensions of brand equity, but rather that brand awareness leads to brand
image which in turn leads to brand equity (Gill & Dawra 2010). Therefore, through Gill and Dawra’s study,
it is shown that both models lack in measuring brand equity in the toothpaste product category, but it is
unknown whether or not this translates into other product or service categories.
It can be concluded that Keller’s model is more simplistic compared to Aaker’s five dimensions of brand
equity, though it has been proven through Gill and Dawra’s study that they are both insufficient in explaining
brand equity in the toothpaste product category.
4 The Consumer Foodservice Industry in Canada Canada can be defined as a coffee drinking nation as 64% of adult Canadians drink coffee every day, and the
coffee consumption in Canada has the fastest growth among coffee consuming countries (Euromonitor
2012b). The industry that will be examined in the paper is the Canadian foodservice industry with a focus on
the overall industry as well as the sectors: coffee, chained foodservices and cafés and bars2. The Canadian
consumer foodservice industry has, as all other industries, experienced a downturn on sales due to the
economic recession. However, in 2011, it experienced a recovery in sales growth due to a decrease in
economic uncertainty and improved consumer confidence, as well as an increase in demand for specialty
2 Also referred to as the specialty coffee section

Aarhus University Spring 2013
Page 16 of 42
coffees (Euromonitor 2012b). Since Canadians have already embraced coffee, and the country has one of the
highest consumptions in the world, innovation and growth in this industry will be difficult to continuously
improve. However, the section of the consumer foodservice industry that will experience the most growth in
the coming years is café and bars due to the increase in demand of specialty coffees (Euromonitor 2012b). A
trend in the industry is caused by the increased urbanization that is taking place in Canada these years; a
more fashionable urban setting of the servicescape is now necessary, and the new designs of the
servicescapes are designed to make customers stay longer at the establishments (Euromonitor 2012b).
As can be seen in table 2, Tim Hortons has a brand share of 18.2% which makes the brand the leading
chained foodservice in Canada whereas Starbucks comes in with a much smaller share of 2.3%. However,
when it comes to the cafés/bars section of the industry which is experiencing the greatest growth due to the
specialty coffee demand increase, Starbucks sits on 44.5% of the brand shares, and Tim Hortons is not to
find in this section. This could be due to the fact that Tim Hortons first launched specialty coffees in 2011
(Euromonitor 2012b). From table 2 it can also be seen that Starbucks has 7% of the brand shares when it
comes to coffee whereas Tim Hortons has 5.2% of the brand shares. They are both not the leaders in this
category of the industry since Starbucks has the 5th
largest brand share and Tim Hortons comes in 7th (Table 8
in Euromonitor 2013).
The Canadian consumer foodservice industry can be said to be in good conditions, though currently
recovering from the economic recession. Since Canadians are great coffee consumers, the market for coffee
products and services has almost reached its growth potential, but there has, however, been a stronger growth
in the demand of specialty coffees in later years. Tim Hortons has the greatest brand share in the industry
overall but when it comes to specialty coffee, Starbucks is the brand in control and with coffee in general, the
two companies’ brand shares are close.
4.1 Tim Hortons
Tim Hortons was founded in 1964 by the Canadian hockey player Tim Horton and is today the largest quick
service restaurant chain in Canada (www.timhortons.ca 2012). The store originally only offered coffee and
donuts, but has over the years expanded its product line into also including other baked goods and lunch
Table 2 Brand Shares of Tim Hortons and Starbucks in Canada
Sources: ¹ Table 9 in Euromonitor 2012b, ² Table 8 in Euromonitor 2012a, ³ Table 8 in Euromonitor 2013

Aarhus University Spring 2013
Page 17 of 42
options, including bagels and sandwiches (www.timhortons.ca 2012). Today, the chain has 3,295 stores
across Canada and is the leading company within the consumer foodservice industry and accounts for almost
11% of value sales (Euromonitor 2012d). Due to the increased demand in specialty coffees, Tim Hortons
introduced a new specialty coffee line in 2011as well as expanding its products into including smoothies and
a more varied, healthy breakfast selection (Euromonitor 2012d). Tim Hortons has experienced great success
in Canada and many Canadians refuse to buy other brands than Tim Hortons in the consumer foodservice:
“…Canadians have become proud and patriotic towards the brand which has
become a household name. A large section of the population has developed loyalty to
Tim Hortons which is further supported by the fact that the company involves itself in
the community in form of sponsored sports programmes for children, organizing
clean-up events across the country and various other fund-raising activities.”
(Euromonitor 2012d, p. 5)
It shows that Tim Hortons is not just a company serving coffee and food products, but is also a company that
cares for its community. This can be seen in the company’s mission statement which is to deliver superior
quality products for their guests which is done through leadership, innovation and partnerships
(www.timhortons.ca 2012). The vision for Tim Hortons is to be the quality leader in everything they do
which is the reason Tim Hortons has a store policy ensuring that brewed coffee is not served if it has been
ready for more than twenty minutes (www.timhortons.ca 2012).
It is not only the Canadian consumers who acknowledge Tim Hortons’ leading position in the Canadian
foodservice industry and the Canadian communities; the Royal Canadian Mint, who produces Canada’s
circulation coins, also acknowledge the importance Tim Hortons possesses: in 2004 Tim Hortons was the
sole distributor of the world’s first colored circulation coin which is made in order to “…remind Canadians
in a singular way of our proud role in world history and to honor those who made the ultimate sacrifice to
defend our freedom.” (www.timhortons.ca 2012, Press Releases). This illustrates the great presence the
brand has in Canada and that the brand is an incorporated part of Canadian history.
It can be concluded that Tim Hortons is the leading player on the Canadian foodservice industry, and it has a
great presence in the Canadian market with many outlets throughout the country and with many loyal
consumers.
4.2 Starbucks
Starbucks is a globally renowned brand with over 15,000 stores placed in 50 countries worldwide with the
first foreign store opening in 1987 in Canada (www.starbucks.ca 2013). Today, Starbucks has 1,120
operating stores across Canada and is ranked first in the cafés/bars sector with a 15% value share in sales and
holds 13% of the outlets in the sector (Euromonitor 2012a).

Aarhus University Spring 2013
Page 18 of 42
Starbucks’ mission statement is: “To inspire and nurture the human spirit – one person, one cup and one
neighborhood at a time.”(www.starbucks.ca 2013). Starbucks will do this through serving high quality
coffee, engaging with their customers and make them feel at home at the Starbucks stores (www.starbucks.ca
2013). Starbucks also strives to position itself as a “third place experience”, meaning the stores become the
place between home and work where consumers can meet and relax with friends (Euromonitor 2012c). This
is seen as one of Starbucks’ key objectives and has always been one of its strengths in the competitive
specialty coffee shop category. However, according to Euromonitor (2012c) Starbucks no longer just
competes with its competitors in this category as many foodservice operators want to profit from the increase
in demand of specialty coffees and offers these products at lower prices which is the case with Tim Hortons
and its launch of specialty coffees in Canada in 2011. According to Starbucks’ brand positioning, it is
important for Starbucks to localize its products, and therefore different blends and products are offered in
different countries (Euromonitor 2012c). In 2011, Starbucks removed “Starbucks Coffee” from its logo due
to: “…further expansion into the grocery channel with products that are unrelated to coffee, but is also a
testament to the company’s belief in the power of its brand.” (Euromonitor 2012c, p. 38). With this removal
of the brand name from the logo indicates a confidence in the brand having a strong presence in the countries
it operates in.
It can be concluded that Starbucks is a globally strong brand with strong values that customers can appreciate
and relate to. However, Starbucks is beginning to face competition from other categories within the
consumer foodservice industry and since Tim Hortons is the industry leader in the foodservice industry, the
shift in competition is of great relevance.
5 Analysis
5.1 Procedure and Method
The analysis will be based on Aaker’s Brand Equity Ten model where the four dimensions representing the
consumers’ perceptions of the brands were used in the questionnaire. As seen below in table 3, the brand
equity dimension consists of the variable “I like the brand XX” and will be used in the analysis as the
dependent variable in order to assess and interpret the four, independent dimensions which Aaker believes
are determining factors of brand equity. It is illustrated in table 3 how the questions from the questionnaire
will be used to analyze the dimensions of brand equity and brand equity itself. Respondents were asked to
rate the items on a 5-point Likert scale with 1 being “highly disagree” and 5 being “highly agree” or on a
bipolar scale with 5 points as well which is seen with the questions under associations in table 3.

Aarhus University Spring 2013
Page 19 of 42
Table 3 Question index
In this paper, brand equity is based on the respondents’ attitude towards the brand since consumers’ opinions
on the brand are part of brand equity and part of creating value for the brand and its company.
The first part of the analysis will compare Tim Hortons and Starbucks, based on paired sample t-tests in
order to find out whether or not significant differences exist in the different dimensions and the variables
belonging to the dimensions between the two brands. The variables in the associations dimension will be
grouped based on a factor analysis on each of the brands’ associations, and lastly a multiple regression
analysis on each brand will be conducted in order to see which dimensions predict most of the value of the
brand equity. The two regression models will be compared to detect whether or not it is the same dimensions
and variables determining the brand equity.
5.2 Analysis of Data
5.2.1 Socio-Demographics
The questionnaire was sent out to students as well as exchange students who either study or have been
studying at Wilfred Laurier University in Waterloo in the province Ontario in Canada. 85 responses were
received, and 62 of these were usable for further analysis. 54.8% of the respondents were Canadian while the
rest were of different origin which is due to exchange students also answering the questionnaire. The gender
distribution of the respondents is 80.6% females and 19.4% males which causes the sample to be skewed

Aarhus University Spring 2013
Page 20 of 42
towards female participants. Since the questionnaire has been sent to a university, all respondents are
classified as students where 67.7% are unemployed and 29% have a part-time job. The average age of
respondents is 21.4 years old. This means the results are only applicable to students and their opinions and
beliefs about Tim Hortons and Starbucks.
9.7% of the respondents never visit coffee shops, 45.2% of the respondents visit coffee shops 1-2 times a
week, 21% visits coffee shops 3-4 times a week, 6.5% visits coffee shops 5-6 times a week and 17.7% visits
them daily. This means that on average the respondents visits coffee shops once to twice a week. The result
from an independent sample t-test indicates that there are no significant difference between the 9.7%
respondents, who never visit coffee shops and the rest of the sample. It is therefore recognized that these
respondents occasionally visit coffee shops which could not be expressed in the questionnaire. The 9.7%
respondents are therefore kept in the sample for further analysis.
The analysis of the dimensions is done through paired sample t-tests in order to determine whether or not
there are significant differences between Tim Hortons and Starbucks. The differences can indicate a more
positive or negative attitude towards the two brands and can help determine which dimensions the
respondents favor the most when it comes to the brand equities of the two brands.
5.2.2 Awareness measures
When asked what coffee shops the respondents could recall, 51.3% had Tim Hortons as their first recalled
brand while Starbucks was the first recalled brand in 32.3% of the cases. Aaker (1991) describes this as the
brand being top-of-mind which is the strongest position a non-dominant brand can be in since it puts the
brand ahead of the game when it comes to competition. 93.6% recalled Tim Hortons as one of their first
three recalled brands while 79.1% of the respondents recalled Starbucks as one of their first three recalled
brands. Aaker (1991) states that when consumers are able to recall a brand from memory when thinking of a
given product group, it indicates a strong brand position for the given brand. From a paired sample t-test, it
can be determined that there is a significant difference in the recall of the two brands where Tim Hortons’
recall level is significantly3 higher than the one for Starbucks. All respondents were aware of both brands
when presented with a list of coffee shops existing in Canada. Therefore recall will be the variable
considered for further analysis of the awareness dimension.
It can be determined that significantly more respondents were able to recall Tim Hortons from memory than
Starbucks, though all respondents were able to recognize both brands.
3 Sig. (2-tailed) = 0.010
Aarhus University Spring 2013
Page 21 of 42
5.2.3 Loyalty measures
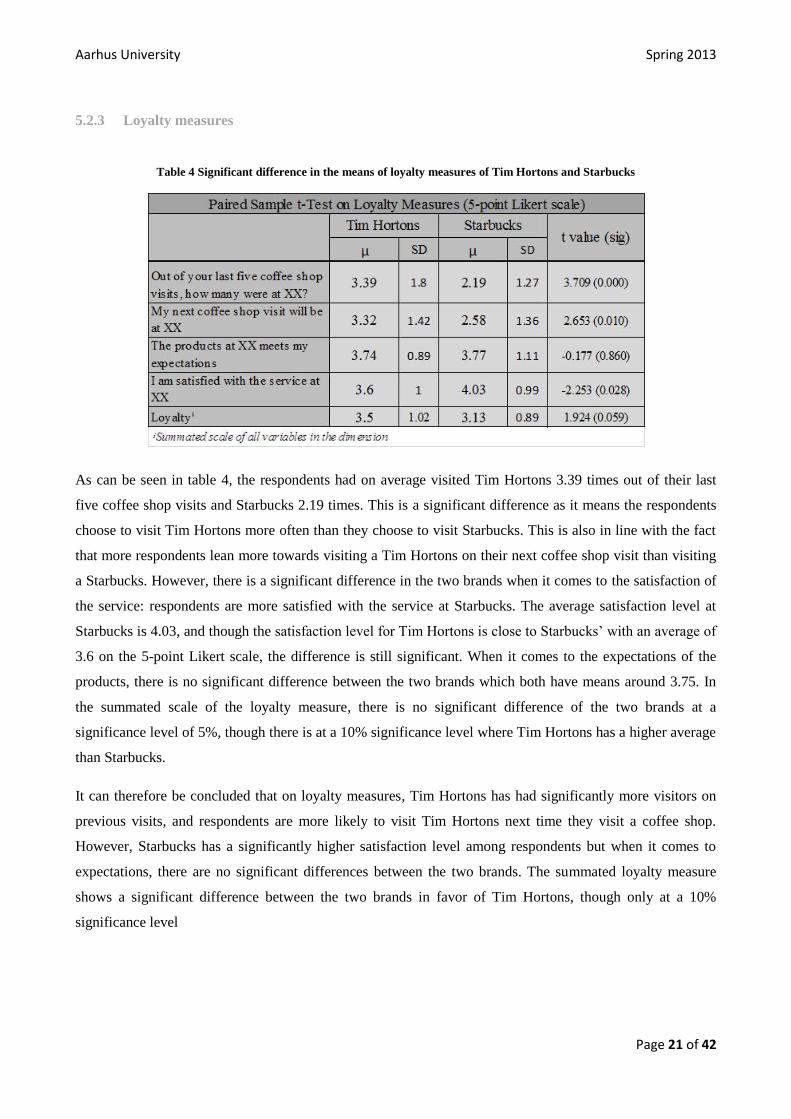
Table 4 Significant difference in the means of loyalty measures of Tim Hortons and Starbucks
As can be seen in table 4, the respondents had on average visited Tim Hortons 3.39 times out of their last
five coffee shop visits and Starbucks 2.19 times. This is a significant difference as it means the respondents
choose to visit Tim Hortons more often than they choose to visit Starbucks. This is also in line with the fact
that more respondents lean more towards visiting a Tim Hortons on their next coffee shop visit than visiting
a Starbucks. However, there is a significant difference in the two brands when it comes to the satisfaction of
the service: respondents are more satisfied with the service at Starbucks. The average satisfaction level at
Starbucks is 4.03, and though the satisfaction level for Tim Hortons is close to Starbucks’ with an average of
3.6 on the 5-point Likert scale, the difference is still significant. When it comes to the expectations of the
products, there is no significant difference between the two brands which both have means around 3.75. In
the summated scale of the loyalty measure, there is no significant difference of the two brands at a
significance level of 5%, though there is at a 10% significance level where Tim Hortons has a higher average
than Starbucks.
It can therefore be concluded that on loyalty measures, Tim Hortons has had significantly more visitors on
previous visits, and respondents are more likely to visit Tim Hortons next time they visit a coffee shop.
However, Starbucks has a significantly higher satisfaction level among respondents but when it comes to
expectations, there are no significant differences between the two brands. The summated loyalty measure
shows a significant difference between the two brands in favor of Tim Hortons, though only at a 10%
significance level

Aarhus University Spring 2013
Page 22 of 42
5.2.4 Perceived Quality
Table 5 Significant difference in the means of perceived quality measures of Tim Hortons and Starbucks
As it is seen in table 5, there are no significant differences in the means of the two brands when it comes to
having an overall better quality than their competitors. Tim Hortons and Starbucks respectively have an
average of 3.34 and 3.58 which indicates that respondents overall agree that the two brands have better
quality than their competitors. As mentioned previously in the paper, it is unknown whom the individual
respondents compare the brands to and if the respondents even compare the brands to the same competitors.
However since most respondents recalled the same coffee shops, it is assumed that the comparison to
competitors is somewhat similar among the respondents. When the two other questions relating to the
perceived quality dimension are investigated, it shows that there are significant differences between Tim
Hortons and Starbucks with Tim Hortons scoring lower on the scale “low quality/high quality” with an
average of 2.65 against an average of 4.3 of the quality at Starbucks. Tim Hortons’ average on “inconsistent
quality/consistent quality” is also significantly lower than the one for Starbucks. When summating the
variables, there is a significant difference between Tim Hortons and Starbucks when it comes to perceived
quality with the perceived quality of Starbucks being significantly higher than the one of Tim Hortons.
It can therefore be concluded that there is no significant difference between Tim Hortons’ and Starbucks’
overall quality being better than their competitors’, and that even though Starbucks has significantly higher
and more consistent quality than Tim Hortons. In total, Starbucks does have a significantly higher perceived
quality than Tim Hortons.

Aarhus University Spring 2013
Page 23 of 42
5.2.5 Associations
Table 6 Significant difference in the means of loyalty measures of Tim Hortons and Starbucks
There are significant differences in the means of all association measures between the two brands except on
“unreliable/reliable” and “unpopular/popular” where both brands are considered being popular with means
above 4 as seen in table 6 above. Tim Hortons offers better value for money, is more old-fashioned, more
local minded, more down to earth, has a less relaxed atmosphere than Starbucks as well as a lower service
level and it lacks more in customer service compared to Starbucks which is visualized below in figure 2.
Figure 2 Respondents’ associations of the brands Tim Hortons and Starbucks
Aarhus University Spring 2013
Page 24 of 42
The associations that distinct the two brands most from each other are, firstly, value for money where Tim
Hortons offers significantly better value for money according to the respondents. Secondly, Tim Hortons and
Starbucks differ in the minds of the consumers when it comes to being old-fashioned or modern where Tim
Hortons is seen as being significantly more old-fashioned than Starbucks. A reason for this could be the long
tradition of Tim Hortons in Canada, as well as the fact the brand only recently introduced specialty coffees in
its coffee beverage range.
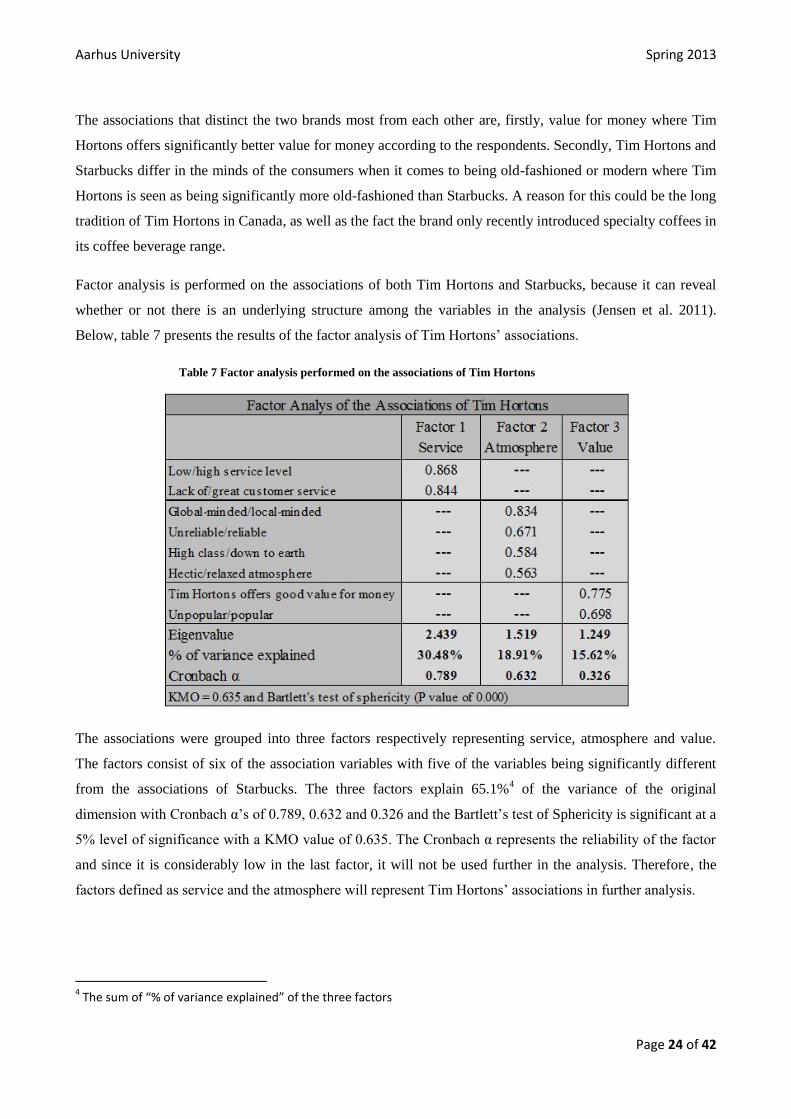
Factor analysis is performed on the associations of both Tim Hortons and Starbucks, because it can reveal
whether or not there is an underlying structure among the variables in the analysis (Jensen et al. 2011).
Below, table 7 presents the results of the factor analysis of Tim Hortons’ associations.
Table 7 Factor analysis performed on the associations of Tim Hortons
The associations were grouped into three factors respectively representing service, atmosphere and value.
The factors consist of six of the association variables with five of the variables being significantly different
from the associations of Starbucks. The three factors explain 65.1%4 of the variance of the original
dimension with Cronbach α’s of 0.789, 0.632 and 0.326 and the Bartlett’s test of Sphericity is significant at a
5% level of significance with a KMO value of 0.635. The Cronbach α represents the reliability of the factor
and since it is considerably low in the last factor, it will not be used further in the analysis. Therefore, the
factors defined as service and the atmosphere will represent Tim Hortons’ associations in further analysis.
4 The sum of “% of variance explained” of the three factors

Aarhus University Spring 2013
Page 25 of 42
The factor analysis for Starbucks is represented below in table 8.
Table 8 Factor analysis performed on the associations of Starbucks
The associations of Starbucks were grouped into two factors also representing atmosphere and service,
though with slightly different variables representing the two groups; “unpopular/popular” has replaced
“hectic/relaxed atmosphere” in the atmosphere factor and “XX offers good value for money” has been added
to the service factor. The factors consist of seven of the associations variables with five of the variables used
being significantly different from those of Tim Hortons. The two factors explain 61.9%5 of the variance of
the original dimension, and the Cronbach α’s are 0.619 and 6.92, indicating that both factors are reliable and
will therefore both be used in further analysis. The Bartlett’s test of Sphericity is significant at a 5% level of
significance with a KMO of 0.733.
A paired sample t-test will not be performed on the factors since they do not consist of the exact same
variables, and furthermore two of the bipolar variables are reversed in the atmosphere factor for Starbucks.
Due to this, the comparison would not be reliable and is therefore discarded for the association dimension.
It can be concluded that Tim Hortons’ and Starbucks’ associations differ on all the variables except on
“unpopular/popular” and “unreliable/reliable” where they are both rated as being popular and reliable brands.
The two brands’ associations have individually been grouped into two factors: service and atmosphere.
Though labeled the same, there are small differences in the factors for the two brands.
5 Again, the sum of “% of variance explained” of the two factors

Aarhus University Spring 2013
Page 26 of 42
5.2.6 Brand Equity
When it comes to liking the two brands, there are no significant differences in the means of Tim Hortons and
Starbucks which respectively have averages of 3.76 and 3.44 as displayed below in table 9.
Table 9 No significant difference in the means of brand equity of Tim Hortons and Starbucks
Though the difference is not significant, Tim Hortons’ average is slightly higher than Starbucks’, and the
standard deviation of the variable is also slightly smaller, indicating a more coherent opinion among the
respondents. It is concluded that there is no significant difference in the brand equities of the two brands.
5.3 Regression Analysis
A multiple regression analysis has been run for both brands in order to understand which dimensions predict
brand equity the best for each of the two brands. Two multiple regression models will be made in this
section; one for the brand equity of Tim Hortons and one for the brand equity of Starbucks and they will then
be compared in the discussion section. Both regression outputs have been checked for multicollinearity
which is discovered to not be an issue for either of the models as the tolerance levels are all above 20%. It
indicates that more than 20% of the variance in the independent variables are unique to the individual
variables and cannot be predicted by using other independent variables. Also, there were no Pearson
correlations above 0.7 among the independent variables which also verifies a lack of multicollinearity.
5.3.1 Tim Hortons
The regression model for Tim Hortons includes the independent variables, loyalty and perceived quality, as
well as the two association-factors, service and atmosphere. In table 10 below, the regression model on brand
equity for Tim Hortons is shown.
µ SD µ SD
I like the brand XX 3.76 1.155 3.44 1.313 1.542 (0.128)
Paired Sample t-Test on Brand Equity (5-point Likert scale)
Tim Hortons Starbuckst value (sig.)

Aarhus University Spring 2013
Page 27 of 42
Table 10 Regression analysis on brand equity for Tim Hortons
The adjusted R2 indicates that the model explains 44.3% of the variance of the dependent variable, and the
reason why the adjusted R2 has been used is because it takes the number of independent variables used to
assess the dependent variable into account. The awareness variable has a positive relationship with brand
equity indicating that when more consumers are able to recall Tim Hortons from memory, the better the
brand’s brand equity will be. However, as seen in table 10 the variable is not statistically significant. The
loyalty variable has a positive effect on brand equity since the beta-coefficient is 0.805, meaning that an
increase in loyalty of 1 point on the 5-point Likert scale increases brand equity by 0.805 point. In other
words, whenever a customer for instance returns to Tim Hortons, or the products meet a customer’s
expectations, brand equity will increase, given that the rest of the independent variables are kept constant.
The loyalty measure is statistically significant. The perceived quality measure, on the other hand, has a
small, negative relationship with brand equity but since the significance level is 0.49, it is not significant in
the regression model. This is also the case for the service-factor of the association variable which otherwise
indicates that if the service level increases, brand equity would decrease. The atmosphere-factor of the
association variable has a positive relationship with brand equity. From table 10, it can be seen that whenever
atmosphere increases with 1 point, brand equity will increase with 0.253 point if all other variables are kept
constant. This means that the more local-minded, reliable, down to earth and relaxed atmosphere Tim
Hortons portrays, the better brand equity the brand could have. Even so, the variable is not significant in the
regression model. From table 10, it is seen that the constant term is not significant6 and is therefore
disregarded, and the regression model for Tim Hortons’ brand equity is as follows:
6 Lower bound: -1.024 and upper bound: 1.604

Aarhus University Spring 2013
Page 28 of 42
From the conducted regression analysis, it can be determined that the loyalty measure is the only significant
dimension explaining Tim Hortons’ brand equity, and it has a positive correlation with the brand equity. It
can therefore be concluded that Tim Hortons’ brand equity increases when the loyalty dimension increases.
5.3.2 Starbucks
The regression model for Starbucks consists of independent variables similar to Tim Hortons’ with the
exception to small differences in the factored association variables as discussed earlier in the analysis. Table
11 below shows the regression output for the brand equity of Starbucks.
Table 11 Regression analysis on brand equity of Starbucks
The adjusted R2 for Starbucks’ regression model is 0.526 which means the independent variables explain
52.6% of the variance in brand equity. The awareness variable has a small positive relationship with brand
equity, though not statistically significant. It would mean that increasing the awareness level of Starbucks in
Canada would only lead to a small increase in the brand’s brand equity. The loyalty variable has a positive
relationship with brand equity, meaning that if coffee shop visits at Starbucks increases, Starbucks’ brand
equity will also increase, again given that the other independent variables are kept constant. The loyalty
variable is of significance in the regression model. The perceived quality variable has a beta coefficient of
0.091 which indicates that a 1 point increase in perceived quality will increase brand equity by 0.091 point as
well, though the relationship is not significant. The atmosphere factor of the association variable is also not
significant, and the variable has a negative relationship with brand equity with a beta coefficient of -0.291.

Aarhus University Spring 2013
Page 29 of 42
This means for instance that an increase towards being more global-minded or towards being perceived as
being more high class would have a negative effect on brand equity for Starbucks. The constant term is not
significant7 in the regression model and the regression model for Starbucks’ brand equity is therefore as
displayed below:
It can be concluded that the only significant measure explaining Starbucks’ brand equity is loyalty. The
loyalty measure has a positive relationship with Starbucks’ brand equity which means that whenever the
brand’s loyalty increases, so does its brand equity in Canada.
5.3.3 Conclusion on Analysis
It can first of all be concluded from the above analysis that Tim Hortons and Starbucks do have significant
differences in the dimensions defined by Aaker where the loyalty measure is significantly higher for Tim
Hortons than for Starbucks and vice versa with the perceived quality measure. Secondly, it is worth noting
that the loyalty measure has a greater impact on Starbucks’ brand equity than it has on Tim Hortons’ as seen
in the regression analysis. Both regression models show a strong, positive correlation between the loyalty
measure and brand equity, and it is the only measure that is significant. The overall conclusion based on
Aaker’s Brand Equity Ten model is that neither Tim Hortons nor Starbucks has stronger brand equity than
the other and it is the loyalty dimension that explains both brands’ brand equity.
5.4 Limitations of the Data
The sample size that the analysis was based on is small; with a completion rate of 76% and with a removal of
outliers, the sample consists of 62 respondents. Small sample sizes can cause the data being “overfitted,”
causing the result to be unnaturally good but non-generalizable (Jensen et al. 2011). The analysis is based on
a convenience sample, which means the data can: “…only be used in exploratory research for generating
ideas, insights or hypothesis” (Jensen et al. 2011, p. 246) which means it cannot be recommended to be used
for descriptive research. Therefore, the analysis done in this paper can only give insights to what dimensions
of brand equity that influences brand equity for the brands Tim Hortons and Starbucks. Since the data is
based on a convenience sample (Jensen et al. 2011) which have the limitations of selection bias and no
definable population. The bias consists of the fact that the collected data consists entirely of students in the
age of 18-45 attending a Canadian university in the area Waterloo-Kitchener in the province Ontario in
Canada. Due to this selection bias, the data does not give a representative look of the average Canadian but
only on consumers studying at Canadian universities. The percentage of male and female respondents is not
equally distributed in the data which again causes the data to not be very generalizable. Another observation
7 Lower bound: -1.003 and upper bound: 2.109

Aarhus University Spring 2013
Page 30 of 42
worth noting is that many foreign students have answered the questionnaire which is a limitation in the sense
that the analysis is to measure the brand equity and its dimensions of two brands in Canada. However, a
paired sample t-test shows that there are only few significant differences among non-Canadian respondents
and Canadian respondents, though these differences can also be caused by the small sample size. Therefore
the analysis done in the above section was based on both non-Canadians and Canadians.
A limitation connected to the association dimension is the fact that respondents’ true associations of the two
brands were not investigated; it was a predetermined set of associations the respondents was asked to rate on
a 5-point Likert scale. Though it is acknowledged it would have generated a more realistic result since, as
mentioned earlier, consumers only put value on the associations they find important themselves. However, it
was also recognized that this could have generated a lower completion rate since more work would have
been required of the respondent.
Another limitation is the fact that the brand equity dimension is not based on an analysis. By analyzing what
attributes consumers find important in coffee shops, the definition of brand equity could have been made
more precise as well as cover more aspects of the term than only the consumer’s fondness towards the brand.
Since Aaker defines this paper’s definition of brand equity as part of the loyalty measures of the Brand
Equity Ten model, the loyalty variables of the two brands will inevitably correlate positively with the brand
equity set out. This is acknowledged but due to constraint resources the pre-analysis identifying the
important attributes of coffee shops in the foodservice industry has not been possible to perform. Therefore
the definition of brand equity is found used in the analysis is found suitable though only relevant on the
consumer perspective of brand equity.
6 Discussion From the previous analysis it is evident that there is no significant difference in the brand equity between
Tim Hortons and Starbucks, though the significance level is close to 10%. It had however been expected that
a significant difference would have been the case and with Tim Hortons having a significantly greater brand
equity than Starbucks. One reason for this expectation is found in section 4.1 where it is stated that Tim
Hortons is the leading company in the foodservice industry in Canada. In this section it was also stated that
Tim Hortons has become a household name that many Canadians cares strongly about. Another reason for
this expectation is found in section 3.2 where it is emphasized that distribution intensity plays an important
role in brand equity (Yoo, et al 2000). Since Tim Hortons have more than 3,000 outlets across Canada it was
expected that due to less search and travel time to find a Tim Hortons, its brand equity would be higher than
Starbucks, who has fewer outlets across Canada. However, from the analysis conducted in this paper, it
cannot be concluded that there is a significant difference in the brand equities of the two brands.

Aarhus University Spring 2013
Page 31 of 42
A variable that was not expected to be significantly different between the two brands were the recall variable
where Tim Hortons had more presence than Starbucks had. It had been expected that both brands would be
recalled by all respondents since, as stated in section 4, both brands are leading brands; Tim Hortons in the
overall foodservice industry and Starbucks in the specialty coffee sector of that industry and with an increase
in demand of specialty coffee products, Starbucks was expected to have similar recall levels as Tim Hortons.
If taking Gill & Dawra’s (2010) work into consideration which stated that brand awareness leads to brand
image which then leads to brand equity, it can be said that Tim Hortons has a significantly better basis for
developing brand equity than Starbucks has because more consumers recall the brand.
When investigating the variables constituting the loyalty dimensions, it has been noted in section 5.2.3 that
respondents were more satisfied with the service at Starbucks. Even though this is the case, it is not reflected
in the respondents’ visits to Starbucks where significantly more respondents had visited and planned on
visiting Tim Hortons on their next coffee shop visit. As Gill & Dawra (2010) argue, satisfaction is not part of
the loyalty measure because being satisfied with the brand is not synonymous with being loyal to the brand
as well. It can therefore be said that the service satisfaction does not play an essential role in choosing which
coffee shop to visit. Other factors must therefore determine why more respondents choose to visit Tim
Hortons and therefore further investigation of the perceived quality measure will be done. Though a
significant difference is found in the “inconsistent/consistent quality” variable with Starbucks scoring higher
than Tim Hortons, Tim Hortons is still perceived to have a consistent quality. The average score was 3.71 on
a 5-point Likert scale which on the one hand indicates a consistent quality though on the other hand the
quality itself was considered low with an average of 2.65. In other words, Tim Hortons’ quality is perceived
to be low but consistent. A consistent quality can lead to less risk associated with purchasing from the given
brand as described in the pre-purchase stage of the three-stage model of the consumer decision making
process described in Lovelock et al. (2008). A consistent quality lessens the functional risk which is the risk
of any unsatisfactory performance outcome. This means that consumers know what quality to expect from
the brand when deciding on whether or not to use the brand. Though Tim Hortons is perceived to have a low
quality, the quality is perceived to be consistent and therefore consumers are prepared for the lower quality
as well as the lower service satisfaction that comes with visiting Tim Hortons instead of Starbucks. This
means that consumers do not feel they take a risk when visiting Tim Hortons and therefore, as long as it is
expected it does not matter to the consumer if the service or quality is lower than at a Starbucks. From this
perspective it can also be argued that the service-related associations where the associations of Starbucks are
significantly higher than Tim Hortons’, are of little importance to consumers when choosing what coffee
shop to visit. Lovelock et al. (2008) also argues that customers evaluate service quality by comparing what
they expect against what they perceive meaning that service expectations can vary from brand to brand.

Aarhus University Spring 2013
Page 32 of 42
Therefore based on the fact that the products from each of the brands meet the consumers’ expectations8, it
can be said that consumers have higher service expectations to Starbucks than they do to Tim Hortons.
However, Starbucks is not considered to offer good value for money which Tim Hortons in return is. This
could mean that consumers acknowledge that Starbucks is of better quality than Tim Hortons but the quality
does not match up to the price premium of Starbucks’ products. According to Aaker (2002) being willing to
pay a price premium in order to obtain a brand in comparison with another brand offering similar or fewer
benefits, is part of the loyalty measure. The price premium can be either positive or negative and it can be
suggested that a negative price premium is the case with Starbucks when compared to Tim Hortons.
However, from this study it cannot be determined with certainty due to a lack of data that measures the price
premium; it can only be determined that Starbucks is not associated with offering good value for money.
Another argument that can be made is that since Tim Hortons offers good value for money the consumers’
regular consumption of goods from coffee shops will take place at Tim Hortons while Starbucks is visited
when splurging on more expensive specialty coffees. This could explain why Tim Hortons is the overall
industry leader while Starbucks is the leader of the specialty coffee section in Canada. Another observation
from the data gives another suggestion of why Starbucks is leading the specialty coffee section and is found
in the associations. Starbucks is associated with being more modern, global-minded and high class than Tim
Hortons. As determined in the regression analysis, these associations are not part of explaining brand equity,
but they could however be part of explaining Starbucks’ low market share of the foodservice industry and its
high market share in the specialty coffee section. As Keller (1993) argues, it is only the associations that
consumers attach to the given service or product group that are of importance to the consumer. If the above
mentioned associations are what consumers expects of a specialty coffee brand then it could be the
explanation to why Starbucks’ market share of that particular section is so high while it is low in the overall
foodservice industry. The associations also go well in hand with the argument of consumers expecting
greater service from Starbucks. However, further studies on this statement would have to be carried out since
this paper gives no empirical prove of it which could be obtained through studies clarifying what
associations of specialty coffee shops are of importance to the consumers.
From the two regression analyses performed in the analysis chapter, it could be concluded that there was one
measure of brand equity as defined by Aaker that could explain brand equity; the loyalty measure. For both
brands, the loyalty measure was significant and with a positive relationship to brand equity, it indicated that
whenever loyalty increases, so would brand equity. The correlation was indicated to be greater for Starbucks
than for Tim Hortons with beta coefficients of 0.987 and 0.805 respectively. However, when taking the 90%
confidence interval9 into consideration, the interpretation that Starbucks’ loyalty measure has a greater
relationship with brand equity is not as certain. However, it can with certainty be said that the relationship
8 Tim Hortons: µ = 3.74 and Starbucks: µ = 3.77
9 Tim Hortons: [0.493 - 1.118] and Starbucks: [0.670 - 1.304]

Aarhus University Spring 2013
Page 33 of 42
with brand equity is positive for both brands since the intervals for both brands’ loyalty measures are above
zero. An interesting aspects of these regression results is that from the paired sample t-test performed on the
two loyalty measures, Tim Hortons’ loyalty measure is significantly better than Starbucks’ at a 10%
significance level. However, the correlation of the loyalty measure and brand equity in the regression models
is larger for Starbucks than it is for Tim Hortons.
The remaining dimensions which are awareness, perceived quality and associations, defined in the two
factors, service and atmosphere, had no significant impact on brand equity. It had, however, been expected
that the service factor from the association dimension would have had a significant impact on brand equity.
The main reason for this is because both Tim Hortons and Starbucks are considered to be service shops
where the service quality is of great importance for consumer-based brand equity. As stated in section 3.2,
the service is a vital element in the service shop where the consumers’ perceptions of the service providers
can lead to strong brand equity. Because the service factor for both brands consists of the variables “lack
of/great customer service” and “low/high service level”, it was expected that it would have had a significant
explaining part of brand equity. Another reason why the service factor was expected to have an impact on
brand equity is the fact that people are an important aspect of the marketing mix for service companies as
discussed in section 3.2. It is stressed that responsiveness and empathy are important aspects of the people
employed at the company of the brand. However, the service factor was of no significance when explaining
brand equity in the regression models.
The perceived quality had also been expected to be of significance since service shops have a physical
product that is delivered to the customers, and it was therefore expected to have an impact on brand equity.
Also, because Starbucks sits on much of the market share in the specialty coffee sector, it had been expected
that the perceived quality would have a significant role in explaining brand equity in the case of Starbucks. It
had, however, not been expected in the case of Tim Hortons due to the lower expectations to the brand. In
both regression models, the perceived quality was found to be of no significance when explaining brand
equity.
The last dimension of Aaker’s Brand Equity Ten model, market behavior, indicates that Tim Hortons is the
superior of the two brands, given that it has the largest market share of 18.2% against Starbucks’ 2.3% in the
foodservice industry in Canada. However, this dimension is financial-based and was not part of the analysis
of the two brand’s brand equity in the analysis section, and it is therefore unknown from this study whether
or not the measure would have had an impact in explaining brand equity.
6.1 Future Research
Keller’s definition of brand equity and his theory of how brand equity is build was considered to be used for
the analysis but as Gill & Dawra (2010) states, it does not provide a measure of brand equity, but rather just
Aarhus University Spring 2013
Page 34 of 42
the framework of how to measure the dimensions brand awareness and brand image. Because the aim of this
study was to determine if there is a difference in Tim Hortons’ and Starbucks’ brand equity and which
dimensions are of most importance to the Canadian customer, it would not have been possible with Keller’s
theory. What his theory could have provided to the study was to determine which associations and brand
attributes that were most important to the Canadian consumer and would have made it possible to
recommend what attributes to focus on in order to improve the brand equities of Tim Hortons and Starbucks.
Nevertheless, this was not the aim of the study, and therefore Aaker’s Brand Equity Ten model was found
most suitable but could be used in future research in order to clarify what consumers recon of the brands.
Another way the study could have been conducted was the combination of Aaker’s and Keller’s theories as
done by Gill & Dawra (2010) in section 3.4. Gill & Dawra came to the conclusion that by combining
Aaker’s and Keller’s theories, it could be said that brand awareness leads to brand image which in turn leads
to brand equity. By conducting the analysis like this, it would have been found what associations consumers
found important in each of the two brands. These associations could then be compared in order to determine
which brand had the more positive associations in the minds of the consumers. However, as mentioned in the
limitations of the analysis the data should have been differently done; i.e. the respondents should have been
able to state their own associations of the brands instead of rating associations they might not even associate
with the brands.
7 Conclusion The paper has investigated brand equity and which dimensions contribute in explaining and building strong
brand equity and has been studying Tim Hortons’ and Starbucks’ brand equities in Canada. This was done in
order to determine whether or not any differences in the two brands’ brand equities could be detected and
whether or not it could explain their individual brand shares in the Canadian foodservice industry. The
analysis was based on quantitative measures in the form of a questionnaire sent out to Canadian students.
It was first of all concluded that branding of products and services is of great importance for both consumers
and companies; for consumers, branding can reduce search and time costs and for companies branding, helps
set them apart from competitors in the same industry. The paper further concludes that strong brand equity is
important as well since it firstly adds value to a company through competitive advantages, brand loyalty and
makes marketing plans more effective and efficient. These factors can help maintain and increase a
company’s profit in the long run too. Brand equity secondly provides value to consumers through easier
information processing, confidence in the purchase situation and use satisfaction.
The paper also investigated the difference in FMCG companies and service companies in order to detect
whether or not differences in measuring brand equity were present. It could be concluded that service quality

Aarhus University Spring 2013
Page 35 of 42
has to be assessed when dealing with service companies since the actual effect of the additional three P’s,
people, process and physical evidence, on brand equity is found in the service quality. The service qualities
related to people was used in the analysis in the association dimensions of the two brands.
It can furthermore be concluded that the two presented theories of Aaker and Keller use two different
approaches to measure and explain brand equity. Aaker uses five dimensions which are a combination of
consumer-based and market related dimensions, whereas Keller only uses consumer-based dimensions to
explain brand equity. Based on Gill & Dawra’s studies, it was concluded that both theories lacked in
explaining brand equity in the toothpaste product category, though a combination of the two theories led to
the result that brand awareness could lead to brand image which in turn could lead to brand equity.
The Canadian foodservice industry was investigated, and it could be concluded that Tim Hortons had 18.2%
of the market share in the industry and was therefore the industry leader, whereas Starbucks only had 2.3 %
of the market share in the industry. However, Starbucks possessed 44.5% of the market share in the specialty
coffee sector of this industry, and it could furthermore be concluded that this sector is experiencing an
increase in demand these years.
In the analysis of Tim Hortons’ and Starbucks’ brand equity, it was firstly stated that brand equity in this
study would be based on the respondents’ attitudes towards the brands since consumers’ opinions on the
brand are a part of brand equity. From the analysis it could first of all be concluded that there were no
significant differences in the brand equity of the two brands, nor were there any differences in what
dimensions explained brand equity. For both brands, the loyalty measure was the only significant dimension
explaining brand equity and Starbucks’ loyalty measure had a stronger, positive correlation with brand equity
than Tim Hortons’ had. When investigating the different dimension of Aaker’s model, it could be concluded
that Tim Hortons had significantly higher levels of awareness and loyalty; more respondents were able to
recall Tim Hortons from memory and more respondents had visited Tim Hortons than Starbucks in their past
five coffee shop visit as well and planned on visiting the coffee shop. Starbucks had a significantly better
perceived quality than Tim Hortons, though both brands were perceived to have an overall better quality than
their competitors which translates well to both Tim Hortons’ leading position in the foodservice industry and
Starbucks’ leading position in the specialty coffee sector. In the analysis it could moreover be concluded that
the only associations that the two brands did not significantly differ on were the ones associated with
reliability and popularity.
When explaining Tim Hortons’ great market share, no conclusive answer could be provided from the studies
in the paper, though suggestions were made. One suggestion was that with Tim Hortons’ consistent quality
and good value for money, consumers do not find any functional risks associated with purchasing from the
brand. It is furthermore argued that since consumers are aware of and expect a lower quality at Tim Hortons

Aarhus University Spring 2013
Page 36 of 42
than at Starbucks, it does not play a significant role in their decision making process. Tim Hortons’ higher
awareness level among respondents can be part of the explanation of the brands’ high market share in the
foodservice industry as well. A suggestion of why Starbucks possesses the leader position in the specialty
coffee section was also made. It was suggested that the associations of the brand being global-minded, high
class and modern could be the associations consumers attach to specialty coffee brands, and therefore the
reason why Starbucks is successful in that section of the foodservice industry.
The overall conclusion is that based on Aaker’s Brand Equity Ten model, the dimensions explaining brand
equity are awareness, loyalty, perceived quality, associations and market shares. Analysis based on this
model, though excluding the market measure, states that neither Tim Hortons nor Starbucks had stronger
brand equity than the other, and it was the loyalty dimension that partly explained both brands’ brand equity.
It can furthermore be concluded that Starbucks has been able to distinguish itself from the domestic brand,
Tim Hortons, in the specialty coffee section, but has not been able to compete with the brand in the overall
foodservice industry in Canada.
Aarhus University Spring 2013
Page 37 of 42
8 Bibliography
Aaker, D.A. 2002, Building Strong Brands, 1st edn, Free Press, London.
Aaker, D.A. 1991, Managing Brand Equity, 1st edn, The Free Press, New York.
Brodie, R.J. 2009, "From goods to service branding", Marketing Theory, vol. 9, no. 1, pp. 107.
Euromonitor 2013, Coffee in Canada, Euromonitor International, London.
Euromonitor 2012a, Café/Bars in Canada, Euromonitor International, London.
Euromonitor 2012b, Consumer Foodservice in Canada, Euromonitor International, London.
Euromonitor 2012c, Starbucks Corp in Consumer Foodservice (World), Euromonitor International, London.
Euromonitor 2012d, Tim Horton's Inc in Consumer Foodservice (Canada), Euromonitor International,
London.
Gill, M.S. & Dawra, J. 2010, "Evaluating Aaker's sources of brand equity and the mediating role of brand
image", Journal of Targeting, Measurement and Analysis for Marketing, vol. 18, no. 3-4, pp. 189-198.
Jensen, M.B., Nielsen, A.L. & Tudoran, A. (eds) 2011, Selected chapters from Marketing Research: An
Applied Approach and Multivariate Data Analysis: A Global Perspective, 1st edn, Pearson Custom
Publishing, Harlow, England.
Keller, K.L. 1993, "Conceptualizing, Measuring, and Managing Customer-Based Brand Equity", The
Journal of Marketing, vol. 57, no. 1, pp. 1.
Kotler, P., Keller, K.L., Brady, M., Goodman, M. & Hansen, T. 2009, Marketing Management, 13th edn,
Pearson Education, England.
Lovelock, C.H., Wirtz, J. & Chew, P. 2008, Essentials of Service Marketing, 1st edn, Pearson Education
Centre, United States.
Nath, P. & Bawa, A. 2011, "Measurement of brand equity of services--scale construction and validation",
Journal of Services Research, vol. 11, no. 2, pp. 135.

Aarhus University Spring 2013
Page 38 of 42
Simon, C.J. & Sullivan, M.W. 1993, "The Measurement and Determinants of Brand Equity: A Financial
Approach", Marketing Science, vol. 12, no. 1, pp. 28.
Starbucks 2013, , About Us [Homepage of Starbucks Corporation], [Online]. Available:
http://www.starbucks.ca/about-us/our-heritage [2013, March 31].
Tan, T.M., Liew, T.W., William, L.S.S., Michelle, O.B.F. & Tan, S. 2012, "Consumer-based Brand Equity
in the Service Shop", International Journal of Marketing Studies, vol. 4, no. 4, pp. 60.
Tim Hortons 2012, , About Us [Homepage of Tim Hortons Inc.], [Online]. Available:
http://www.timhortons.com/ca/en/about/index.html [2013, April 1].
Yoo, B. & et al 2000, "An examination of selected marketing mix elements and brand equity", Journal of the
Academy of Marketing Science, vol. 28, no. 2, pp. 195.

Aarhus University Spring 2013
Page 39 of 42
9 Appendix A - Questionnaire

Aarhus University Spring 2013
Page 40 of 42
_

Aarhus University Spring 2013
Page 41 of 42

Aarhus University Spring 2013
Page 42 of 42