Bond Assessing Buyer Preferences for Property Attributes … · 2018-07-23 · Assessing Buyer...
42
Conjoint Analysis: Assessing Buyer Preferences for Property Attributes to Assist with the Estimation of Land Contamination Stigma Sandy Bond, MBS, ANZIV, Lecturer (Massey University, NZ) Doctoral Candidate, Property Studies Department School of Economics & Finance, Curtin Business School Curtin University of Technology, GPO Box U 1987, Perth 6845. Work: 61 8 9266 4451, Fax: 61 8 9266 7694 Email: [email protected]
Transcript of Bond Assessing Buyer Preferences for Property Attributes … · 2018-07-23 · Assessing Buyer...
Conjoint Analysis:
Assessing Buyer Preferences for Property Attributes to Assist with
the Estimation of Land Contamination Stigma
Sandy Bond, MBS, ANZIV, Lecturer (Massey University, NZ) Doctoral Candidate, Property Studies Department
School of Economics & Finance, Curtin Business School Curtin University of Technology, GPO Box U 1987, Perth 6845.
Work: 61 8 9266 4451, Fax: 61 8 9266 7694 Email: [email protected]
2
Conjoint Analysis:
Assessing Buyer Preferences for Property Attributes to Assist with the Estimation of Land
Contamination Stigma
Keywords: Conjoint analysis – buyer preferences – utility - property attributes - contaminated land –
remediation - stigma
Abstract: The traditional approach to property valuation that dominates valuation theory and practice in
Australasia is the Sales Comparison Approach. However, the approach relies heavily on the availability of
comparable sales price data and the ability of the valuer to adjust these for differences in property attributes
between the comparable and subject properties. A plentiful supply of sales price data greatly assists the task of
determining how each of these attributes contributes to price but in circumstances where comparable sales price
information is scarce, as is often the case for contaminated property, other information sources are required to
achieve this.
One option open to valuers faced with a scarcity of comparable sales data is to find out directly from the buyers
what their preferences are for particular property attributes. Knowing how important each property attribute is
to buyers enables the attribute to be correctly weighted in the valuation process. This paper summarizes the
results of a study that uses conjoint analysis, a survey-based technique, to determine the importance of land
contamination and other relevant property attributes in purchasers' buying behaviour of remediated residential
land. From the results, the extent that "stigma"1 should be taken into account in valuations of post-remediated
residential property was ascertained.
1 “Stigma” is the blighting effect on property value caused by perceived risk and uncertainty. Uncertainties relate to negative intangible factors such as: the inability to effect a total "cure"; risk of failure of the remediation method; risk of changes in legislation or remediation standards; difficulty in obtaining finance, or simply, a fear of the unknown. Post-remediation “stigma” is the residual loss in value after all costs of remediation, including insurance and monitoring have been allowed for.
3
Brief Literature Review
"The basic concept that perceptions of risks can affect market value of once-contaminated property is
reasonable. Quantifying the effect of those perceptions in particular cases, however, is not always
straightforward", (Elliot-Jones, 1995).
Due to the significance of risk perceptions in the valuation of contaminated property2 this section reviews the
literature dealing with approaches to measuring risk perceptions and discusses the effect these have on
contaminated property values. The review incorporates a discussion of the theories underlying these approaches
that come from various academic disciplines including finance, economics, marketing, and psychology. Further,
it provides the rational for focusing on the behavioural approaches to risk analysis in this paper. By way of
introduction, a brief discussion of risk perceptions from the social scientists’ viewpoint is presented first.
Social Theories of Risk3
According to Golding (1992) risk research was first legitimised as an academic endeavour in the US with the
passage of legislation in the early 1970’s relating to environmental protection, with funding for it becoming
available from agencies such as the Environmental Protection Agency. It was in 1979 that the Technology
Assessment and Risk Analysis (TARA) program set the directions for the boundaries of risk research.
Subsequently, it was at the first annual meeting of the Society for Risk Analysis that found that the public
It equates to the difference in value between a remediated contaminated site and a comparable “clean” site with no history of contamination.
2 Including both currently and previously contaminated property.
3 The research reported in this section is referenced primarily from Krimsky and Golding (1992).
4
perceptions of risk differ markedly from expert assessments and this formed the basis for much of the risk
research since then.
Krimsky and Golding (1992) explain that the divergence in views of risk is in part due to the influence on risk
policies from the field of economics. The economists’ view of risk is based on expected utility theory that
comprises a set of decision rules that define rational behaviour. It assumes people will follow these rules if they
have sufficient information and time to dwell on the consequences of alternative decision paths.
Krimsky and Golding, however, suggest that the public’s perception towards risk will vary according to a wide
range of variables including voluntariness, catastrophic potential, dread etc. This view, which departs from the
view that risk may be reduced to a common metric, is based on “cognitive theory” of how people think and
reason. This theory shows that risk decisions are made on the basis of multiple attributes that describe the risk
event. It has been the driving force behind risk communication research and has become enshrined in laws such
as the Superfund Amendment and Reauthorization Act 1986 (SARA).
A number of the studies have been conducted to help understand these divergent views of risk, and a selection
of these is presented next.
In a study of risk perception Kunreuther (1992) contrasted two models of choice: expected utility theory
(economics) and sequential model of choice (principles of bounded rationality). He found that individuals have a
hard time dealing with the concept of probability and tend to rely on salient information (past experience) and
easily accessible sources (friends and neighbours) rather than utilising statistical data and making tradeoffs
between costs and benefits. Further, he found that people use rules of thumb (heuristics) that enable them either
to disregard the possibility of a disastrous event or cause them to show disproportionate concern about the
5
potential. He suggests that violations of expected utility theory are due to attributes other than outcomes such as
ambiguity or vagueness about probabilities. The result is that risks that are uncontrollable, unknowable, or have
catastrophic potential, are feared by the public even though they are unlikely. He suggests that this may explain
the NIMBY (Not In My Back Yard) Syndrome where experts may perceive siting of hazardous facility as safe
while nearby residents focus on the impact of a potential leak.
Slovic (1992) studied peoples’ perceptions toward risks and benefits, and their preferences for various kinds of
risk/benefit tradeoffs. To do this he used what he terms a “psychometric approach”. This approach involved the
use of questionnaires that incorporate attitude questions, word associations, and scenario generations. He asked
respondents to rate hazards based on various qualities such as catastrophic potential, controllability etc., to
produce quantitative measures of perceived risk. Factor analysis was used to group similar characteristics of
risks.
The findings showed that risk meant different things to different people. Laypeople assess risk differently from
“experts”. While laypeople take annual fatalities (assessed by experts) into account their judgements of risk
were sensitive to other factors. From the factor analysis, Slovic found “dread risk” (seen as having catastrophic
potential and been uncontrollable and involuntary) is an important factor for laypersons. This indicated that it is
perceived as more risky. This was in contrast to the experts’ perceptions that were not closely related to this
factor. The experts see risk as synonymous with expected annual mortality. Thus, conflicts exist about risk as
each group has different definitions.
Slovic’s discussion of risk perception included the concept of stigma. He associates this word with risk
perception and suggests the link between the two is “peril”. From the results of his study he also suggests that
aesthetics (ugly or upsetting), visibility, dangerous and disruptive are factors in stigmatisation. He found that
6
mechanisms of social amplification, such as heavy media coverage and attention drawn to problems by special
interest groups, can increase the stigma.
Kasperson (1992) argues for new approaches to risk analysis that fuse the technical and social conceptions for
risk. He explains that hazard events interact with psychological, social, institutional and cultural processes in
ways that can heighten perceptions of risk and shape risk behaviour. The behavioural responses in turn generate
secondary social or economic consequences, e.g. stigmatisation; loss of confidence in institutions; and insurance
costs. These trigger demand for further institutional responses and protective actions. Thus, Kasperson defines
risk as both a threat of physical harm (an event or a report of an event, releases, exposures or consequences)
and the result of cultural and social processes when these events are communicated to others (social
amplification) and the results of such communication.
While not denying the need for technical risk analysis, the foregoing authors simply argue for the need to include
the social view of risk in the risk analysis. As such the emphasis of this paper is on risk perceptions from the
social perspective. The econometric treatment of risk perception and stigma is covered adequately by other
authors (see for example Dixon et al. 1988; Abelson 1979; Zeiss & Atwater 1989, 1990; Colwell 1990;
Priestley & Evans 1990; Smolen, Moore, & Conway 1992; Levesque 1994; Bond 1995; Dotzour 1997;
Simons, Bowen, & Sementelli 1997; Reichert 1997; Dale, Murdoch, Thayer, & Waddell 1999; and
McCluskey & Rausser 2000). The next section provides a brief review of the property literature from a social
and behavioural perspective.
Behavioural Research in the Property Literature
In a parallel to the above researchers of risk perceptions, Diaz (1999) recognises the need to consider the
social and behavioural perspectives in property research by claiming “the essence of property is human
7
behaviour”(Diaz III 1999, p.326). Similar to the risk research, the traditional approach to property research
that has dominated is what Diaz terms the “finance paradigm” which was inherited originally from economics.
This approach is theoretically underpinned by the rational man ideology and the efficient market hypothesis.
Regression-based econometric techniques to analyse property sales dominate the approach, but Diaz argues
that such an approach that views property as an investment that can be fully defined by its cash flows is
restrictive. Further, he suggests that because the finance paradigm’s data are sales prices its power to illuminate
the economic activity of property is limited, and it is this weakness that has led to the behavioural approach.
Diaz argues for the need to observe human behaviour of economic activity to overcome the shortcomings of
focusing the analysis on the sales analysis approach. The techniques used to do this, such as controlled
experiments and opinion surveys have not been accepted by the finance tradition and generate data that require
evaluative statistics different from those commonly used in the finance tradition. The theory of the behavioural
approach is likewise different to those used under the finance paradigm and is grounded in psychology and the
work of Newell and Simon (1972) in human information processing and problem solving.
Grissom (1991) highlights the importance of understanding buyer behaviour when applying the sales comparison
approach and making adjustments to comparable properties. The skill of the valuer rests in the selection of
comparable properties, the recognition of key variables, and the adjustments to make to the sale price of each
comparable sale for differences in the variables between the subject property and the comparable. These
adjustments are based on the valuer’s judgement and expertise in interpreting buyer behaviour. Yet, Greaves
(1984) implies that valuers do not fully understand how variables behave in contributing to the value of
residential property.
8
A study by Adair et al. (1996) tests the hypothesis that valuers consider value elements in the same way that
buyers do. “If this contention is valid, then it is reasonable to expect valuers to display a high degree of similarity
to buyers in their consideration of the most salient influences”. They identified 69 variables from the US and
British valuation and econometric literature. After a pilot survey of valuers and buyers in Belfast, 55 variables
were identified as relevant to the Belfast housing market. They then asked valuers (76) and buyers (506) in the
Belfast residential market to identify from the listing of variables those factors they considered had the greatest
influence on property prices/value. There were statistically significant differences of the relative influence on
value for each variable between the two sample groups.
The results indicated that valuers place a greater emphasis on environmental or neighbourhood effects whereas
buyers perceive property variables such as house size and condition to be more important in their purchase
decisions. Valuers also place higher scores on all variables, compared to the buyers. As noted by Diaz: “this
finding not only questions the appropriateness of normative valuation methodologies but challenges our
understanding of value formation”, (Diaz III 1999, p.329).
The question to emerge from these results was whether such difference is reflected in a significant variation
between market price and value. To test this premise, Adair et al. compared 1,079 sales in Belfast in 1993
against the value set by the surveyor. Valuations appeared to be within 10% of price. They concluded that if this
level is professionally acceptable:
…[I]t is of more academic than practical significance that buyers and valuers perceive differently the
influence of an array of variables. However, should valuers wish to improve valuation accuracy levels
vis-a-vis the market, then a greater awareness ought to be shown of the factors that influence the buyers
decision-making process, (ibid., p.34).
9
This provides further support for a behavioural approach to valuation.
Like the above authors, Hardin (1999) recognizes the late acceptance by finance and real estate researchers of
behavioural theory as a paradigm for the study of decision-making and notes that this is in contrast to other
areas of business specialization including marketing, accounting and management. However, he then goes on to
question, within the field of real estate, if one can design studies of stigma, view, or any other market driven
effect. Results from studies by other researchers, outlined next, would suggest that one can.
Conjoint Analysis – An Approach to Help Understand Buyer Behaviour
Conjoint analysis, the survey-based approach adopted for the research reported here, is a multivariate
technique used to study consumer preferences among mutli-attribute alternatives to help understand purchasing
behaviour. Hair et al. (1995, p.379) outline the advantages of conjoint analysis over other multivariate
techniques. They claim that it is an ideal technique to use due to its flexibility and uniqueness, including “(1) its
ability to accommodate either a metric or non-metric dependent variable, (2) the use of categorical predictor
variables, and (3) the quite general assumptions about the relationships of independent variables with the
dependent variable”. Further, it differs from almost all other multivariate techniques in that it has the ability to be
carried out at the individual level so that a separate model can be predicted for each respondent. Other
techniques just take a single measure of preference from the analysis of data from all respondents
(observations).
Very few property-valuation applications of conjoint analysis are reported in the literature. An exception is the
paper by McLean and Mundy (1998). In introducing the conjoint analysis method McLean and Mundy refer to
10
the description provided by the NOAA Final Rule (Federal Register 1996, January 5) that includes support for
use of the approach in valuation, as follows:
Conjoint analysis is a survey procedure that is used to derive the values of particular attributes of goods
or services. Information is collected about individuals' choices between different goods that vary in
terms of their attributes or service levels. With this information, it is possible to derive values for each
particular attribute or service. If price is included as an attribute in the choice scenarios, values can be
derived in terms of dollars, which can be used with the valuation approach.
This description, however, infers the use of conjoint analysis in tandem with the “valuation approach”
(presumably meaning any of the three traditional valuation methods) and not as a replacement for it.
McLean and Mundy (1998) provide only an illustration using a hypothetical example of how the conjoint
analysis can be applied in practice to the valuation of contaminated property. As such, their use of an example
that narrowly defines a residential property in terms of only three researcher-selected contamination-related
attributes could be excusable. This choice of attributes implies that these are the most important to the buyer. It
therefore ignores other property attributes that may be of greater importance such as size, quality of
construction, distance to amenities, views, etc. The application of conjoint analysis, however, requires that the
hypothetical “product” be as realistic as possible and comprising attributes predetermined as most important to
the buyers within the target market, otherwise the results will be biased.
Despite these weaknesses, the paper provides a good explanation of conjoint analysis. The technique is
presented as a complementary approach to the traditional valuation approaches for estimating damages to real
property arising from contamination but one that overcomes the limitations of those approaches.
11
Other property-related applications of conjoint analysis that appear in the literature are reported in the
marketing journals where new product design applications predominate. Examples of these include studies of:
home-owners preferences for suburban land development patterns, including lot size, yard space, view from the
yard, etc. (Knight & Menchik 1974); consumers’ preferences for housing alternatives, focusing on asking price,
number of bathrooms and bedrooms, etc. (Louviere 1979); travellers’ hotel preferences focusing on seven hotel
attributes to help in the design of a new hotel chain for Marriott (Wind, Green, Shifflet, & Scarborough 1989);
industrialists’ location/relocation preferences in terms of cost, location, and premises to help property
professionals provide more competitive market solutions (Levy 1995), and business traveller’s service
preferences (physical environment and personal service) of luxury hotels in Singapore to inform management
decisions (Mattila 1999).
Strub and Herman (1993) used conjoint analysis to survey two distinct respondent groups and found that sales
force judgments bore little resemblance to customer judgments about a new multimedia desktop
telecommunications device. They concluded that new product research should be done with customers. This
was similar to the finding by Adair et al. (1996) that judgements by different respondent groups (valuers and
residents) about the same stimuli (the importance of various housing attributes to price) vary. These differences
highlight the need to survey the respondents making the choices between products. In terms of the research
reported here of buyers’ perceptions of land with a history of contamination, this is the group that should be
surveyed. However, as in the Strub and Herman (1993) study, to test how closely valuers and real estate
agents judgements correspond to those of their customers all three groups of respondents were surveyed. The
next section outlines the research methodology employed.
12
Research Methodology
Introduction
There are many contributing factors that make up the worth of a property from a purchaser’s viewpoint such as
the size of the land, the view obtained, proximity to amenities etc. Trade-offs are made between these various
factors and property sales prices, used by valuers to determine a property’s value, are a weighted summation of
these. It is the valuer’s job to assess the important value-determining factors and the weights prescribed to each
when analysing these prices to estimate value. However, as indicated above, valuers rarely know the relative
contribution of each factor to the overall value of a property. As there are no formal techniques typically used to
achieve this, the valuer uses his/her personal judgement to determine the relative weights.
Conjoint analysis is the technique used to improve the valuation accuracy levels vis-a-vis the market by gaining
a greater awareness of the factors that influence the buyers’ decision-making process. A study of a consumer’s
preference structure explains not only how important each attribute is in the overall decision about a product,
but also how the differing levels within an attribute influence the formation of an overall preference. By knowing
how each attribute contributes to price, valuers are better able to compare the subject property with similar
properties that have sold recently and adjust sale prices for differences between these to arrive at a final value
estimate. This is a more precise method of sale price adjustment than simply basing these adjustments on what
the valuer intuitively believes to be the most important.
It is this aspect of conjoint analysis that will be used in the current study. Rather than predicting overall
preference, the aim of this research is to determine the importance of each land attribute and the value of each
land attribute for a parcel of land. Land attribute importance can be determined from respondents’ overall
13
evaluations of a set of hypothetical land parcels (combinations of selected levels of each attribute of the land
parcel).
Conjoint analysis assumes that consumers evaluate the value or utility of a product (real or hypothetical) by
combining the separate amounts of utility provided by each attribute and that the trade-off decisions made are
revealed through their product choices. An experimental design is used to analyse this behaviour. The
procedure involves asking respondents to provide their overall evaluations of a set of hypothetical products that
combine the possible attributes of that product at various levels. Conjoint analysis is then used to decompose
the set of overall responses to multi-attribute alternatives so that the utility of each attribute level can be inferred
from the respondents’ global evaluations of the alternatives.4 The technique involves a type of analysis of
variance in which the respondents’ overall preferences serve as a dependent variable and the dependent
variable and predictor variables are represented by the various attribute levels making up each alternative
(Green & Tull 1973).
Information integration theory is the main theory underlying conjoint analysis as developed by Anderson (1970).
This theory, as described by Louviere (1988), is about the behaviour of numerical data in response to multiple
pieces of information. The numerical data of interest consist of individual rating (or ranking) responses to
combinations of different attributes (decision variables) of a product or brand. Information integration theory
can therefore be used to study information processing revealed by consumers’ responses to multi-attribute
options.
The basic assumptions of the theory as outlined in Louviere (1988, pp. 13-14) include:
4 Thus, conjoint analysis is termed a decompositional model. Simply by knowing a respondent’s overall preference for an object and what its attributes are, the preference can be decomposed to determine how much is due to each attribute it possesses and each possible value of that attribute.
14
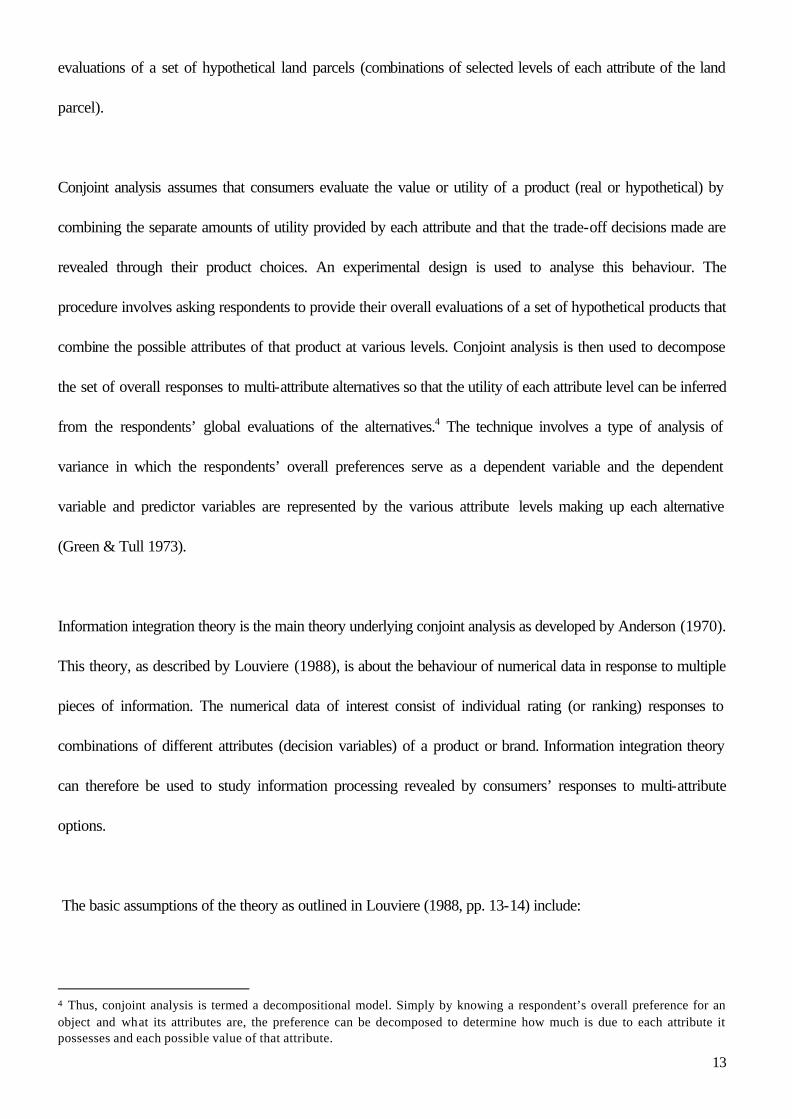
1. The unknown and unobservable overall utility that a consumer has in her mind regarding the j-th brand
is linearly related to a consumer’s response on a category-rating scale. That is,
Uj = a + bRj, + ej,
Where Uj is the overall utility to measure of the j-th brand, Rj is the observed response on a category-
rating scale, and ej, is a normally distributed error term that satisfies the assumptions of analysis of
variance or multiple regression.
2. The category-ranking scale used by a consumer under appropriate experimental instructions and task
conditions approximates an interval scale measurement level.
3. A consumer’s response strategy reveals his decision strategy. The response strategy can be
approximated by algebraic conjoint models amendable to experimental investigation and statistical
parameterisation.
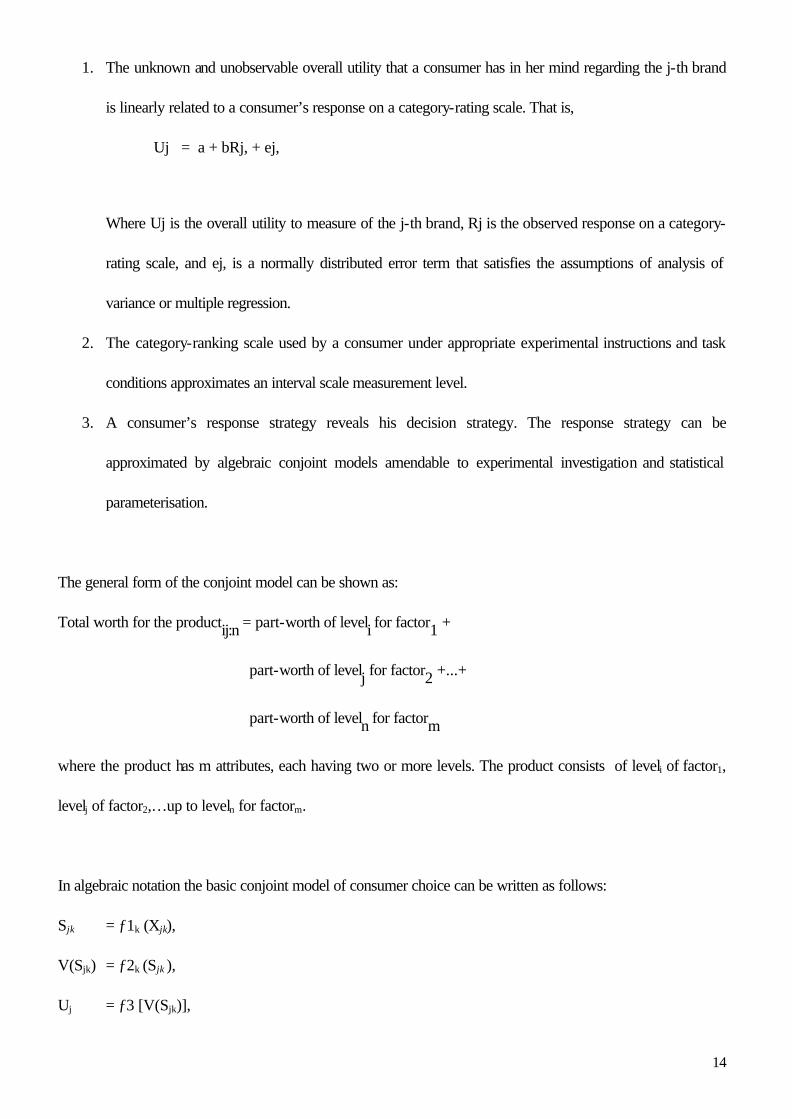
The general form of the conjoint model can be shown as:
Total worth for the productij:n = part-worth of leveli for factor1 +
part-worth of levelj for factor2 +...+
part-worth of leveln for factorm
where the product has m attributes, each having two or more levels. The product consists of leveli of factor1,
levelj of factor2,…up to leveln for factorm.
In algebraic notation the basic conjoint model of consumer choice can be written as follows:
Sjk = ƒ1k (Xjk),
V(Sjk) = ƒ2k (Sjk ),
Uj = ƒ3 [V(Sjk)],

15
P(jA) = ƒ3 (Uj )
Where:
Xjk = a JxK array of physical variables5 (J represents the total number of brands,6 K represents the total
number of attributes) that underlie a consumer’s attribute beliefs.
Sjk = an array of dimension JxK that constitutes the consumer’s beliefs about the level of the k-th attribute
for the j-th brand of interest.
V(Sj,k ) = an array of dimension JxK that contains the measures of the part-worth utilities of every element of
Sjk. It represents the consumer’s opinions regarding the worth of the j-th brand’s position (or ranking)
on the k-th attribute.
Uj = a consumer’s overall utilities or preference for j-th brand.
P(jA) = is the probability of choosing the j-th brand from choice set A, of which j is a member.
Of particular interest to this research is the property contamination attribute and its impact on value.
Contaminated land, even if remediated, is often perceived negatively. People are concerned about the risks
associated with such land when contemplating investment in it. However, valuers are often unclear of the
magnitude of these negative perceptions and how important they are in purchasing decisions.
The levels of the contamination attribute tested in this research include:
§ a clean site but next to a currently contaminated site;
§ a remediated site; and
§ a clean site with no history of contamination.
5 In this case, individual characteristics of each sold property (e.g., lot size, view, sales date, post-remediated site, etc).
6 In this case, brands equate to properties.
16
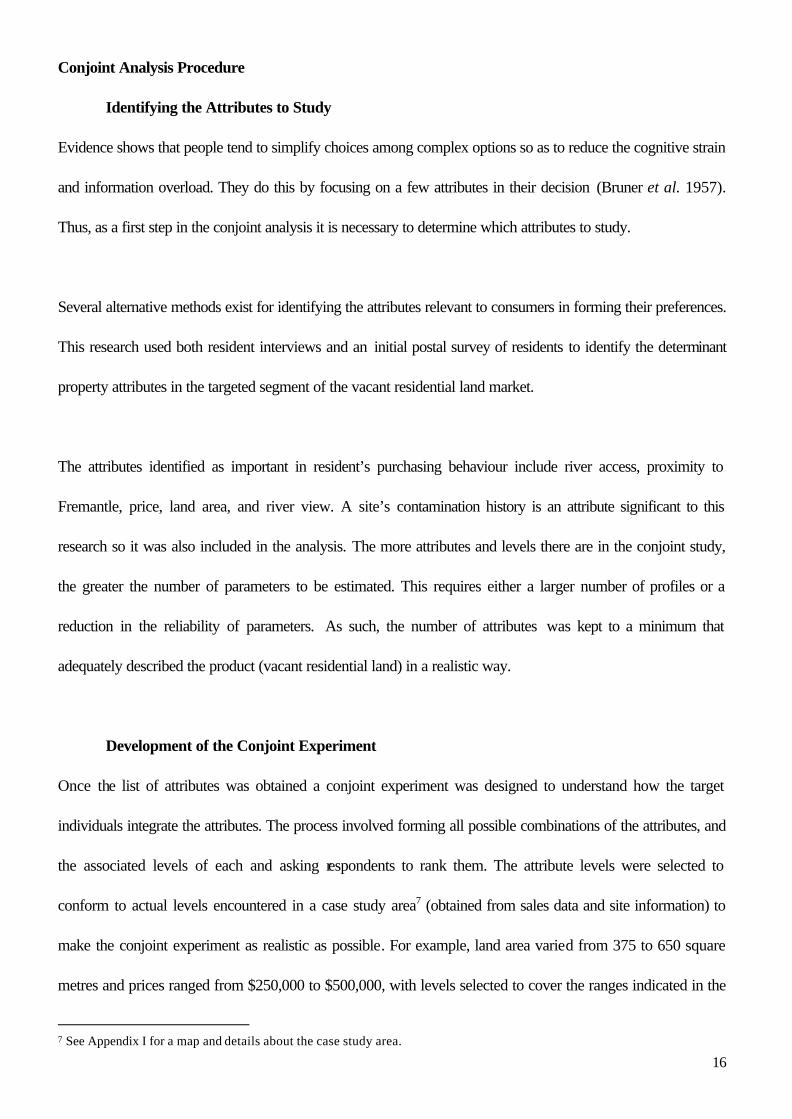
Conjoint Analysis Procedure
Identifying the Attributes to Study
Evidence shows that people tend to simplify choices among complex options so as to reduce the cognitive strain
and information overload. They do this by focusing on a few attributes in their decision (Bruner et al. 1957).
Thus, as a first step in the conjoint analysis it is necessary to determine which attributes to study.
Several alternative methods exist for identifying the attributes relevant to consumers in forming their preferences.
This research used both resident interviews and an initial postal survey of residents to identify the determinant
property attributes in the targeted segment of the vacant residential land market.
The attributes identified as important in resident’s purchasing behaviour include river access, proximity to
Fremantle, price, land area, and river view. A site’s contamination history is an attribute significant to this
research so it was also included in the analysis. The more attributes and levels there are in the conjoint study,
the greater the number of parameters to be estimated. This requires either a larger number of profiles or a
reduction in the reliability of parameters. As such, the number of attributes was kept to a minimum that
adequately described the product (vacant residential land) in a realistic way.
Development of the Conjoint Experiment
Once the list of attributes was obtained a conjoint experiment was designed to understand how the target
individuals integrate the attributes. The process involved forming all possible combinations of the attributes, and
the associated levels of each and asking respondents to rank them. The attribute levels were selected to
conform to actual levels encountered in a case study area7 (obtained from sales data and site information) to
make the conjoint experiment as realistic as possible. For example, land area varied from 375 to 650 square
metres and prices ranged from $250,000 to $500,000, with levels selected to cover the ranges indicated in the
7 See Appendix I for a map and details about the case study area.
17
data. From this it was possible to measure the relative values of the attributes considered jointly by considering
the trade-offs made between attributes.
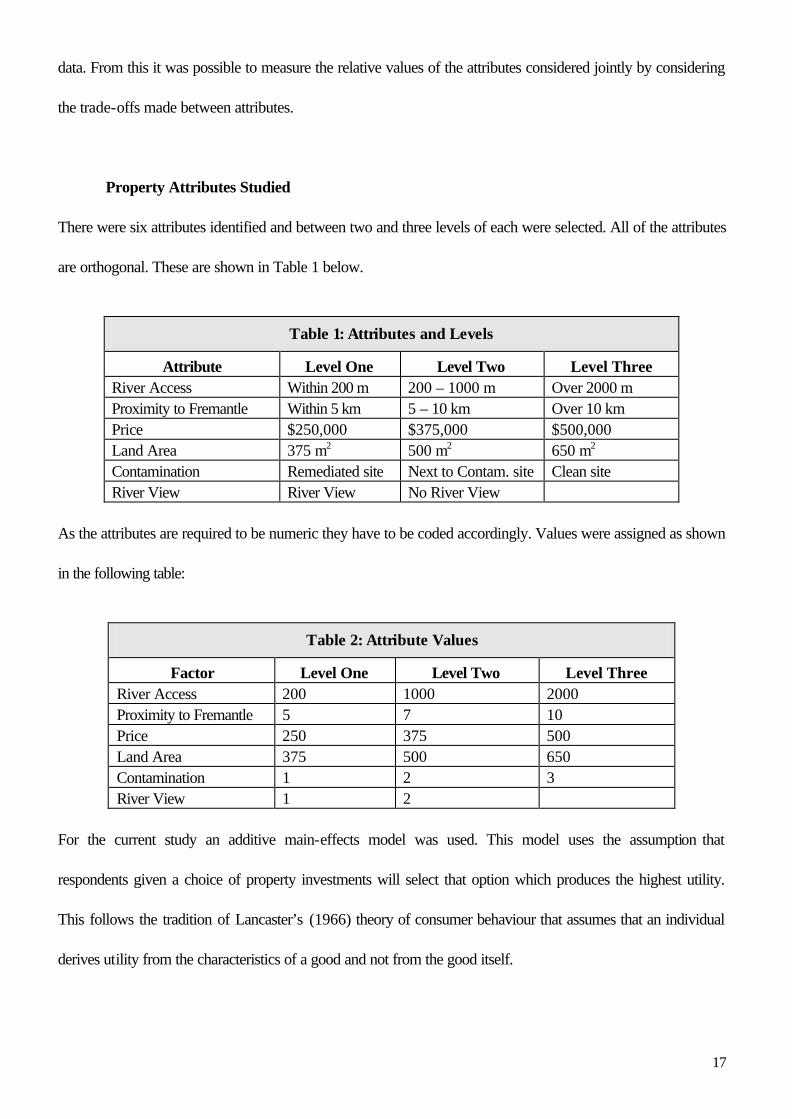
Property Attributes Studied
There were six attributes identified and between two and three levels of each were selected. All of the attributes
are orthogonal. These are shown in Table 1 below.
Table 1: Attributes and Levels
Attribute Level One Level Two Level Three River Access Within 200 m 200 – 1000 m Over 2000 m Proximity to Fremantle Within 5 km 5 – 10 km Over 10 km Price $250,000 $375,000 $500,000 Land Area 375 m2 500 m2 650 m2 Contamination Remediated site Next to Contam. site Clean site River View River View No River View
As the attributes are required to be numeric they have to be coded accordingly. Values were assigned as shown
in the following table:
Table 2: Attribute Values
Factor Level One Level Two Level Three River Access 200 1000 2000 Proximity to Fremantle 5 7 10 Price 250 375 500 Land Area 375 500 650 Contamination 1 2 3 River View 1 2
For the current study an additive main-effects model was used. This model uses the assumption that
respondents given a choice of property investments will select that option which produces the highest utility.
This follows the tradition of Lancaster’s (1966) theory of consumer behaviour that assumes that an individual
derives utility from the characteristics of a good and not from the good itself.
18
The additive composition rule was adopted as it enabled the use of a fractional factorial design, a feature, in
addition to its simplicity, that makes it the most popular compositional rule. This rule assumes that individuals
just “add up” the part-worths to calculate an overall or “total worth” score indicating their preference and that
there are no interactions between attributes.
The advantage of using the fractional factorial is that it avoids the need to evaluate all 486 possible combinations
(2 x 3 x 3 x 3 x 3 x 3) of the six attributes by selecting a smaller number of these alternatives. Using a fraction of
all the possible combinations of the attributes helps to keep the research costs down and avoids respondent
confusion and fatigue. However, when the additive compositional rule is adopted only the main effects for each
factor are estimated.
Another advantage of using the fractional factor design is that the stimuli are created so that the factors are
orthogonal, a requirement to ensure the correct estimation of the main effects.8 The Conjoint software
“Orthoplan” is required to generate this fraction. Orthoplan is available in SPSS and randomly selects the
designs so that a main effects general linear model relating respondent preferences to the six attributes can be
fitted that meets statistical criteria such as efficiency, orthogonality and balance. This process ensures that the
statistical problem of multicollinearity is avoided.9
A model was specified for each attribute to indicate how each attribute’s levels are expected to relate to the
ranks. Models are selected that most accurately represent how consumers actually form overall preference (as
suggested by theoretical or empirical evidence). Conjoint analysis gives the analyst three options to choose
from, ranging from the most restrictive (a linear relationship) to the least restrictive (separate part worths - the
8 Orthogonality is a mathematical constraint that the part-worth estimates be independent of each other. As Hair et al. (1995, p.381) explain “In CA this refers to the ability to measure the effect of changing each attribute level and separate it from the effects of changing other attribute levels and from experimental error”.
9 A stand-alone software package “Trial Run” can also be used that produces more efficient and balanced factorial designs, however, this package was not readily available without incurring significant additional expense.
19
discrete model), with the quadratic model (ideal-point (decreasing preference)/anti-ideal-point (increasing
preference)) falling within this range. “More” and “less” commands for the discrete and linear models are used
to show the direction of the expected relationship. For example, it is expected that river access is linearly
related “less” to rankings so that lower levels of the attribute (shorter distance to the river) will receive lower
(more-preferred) rankings.
The choice of relationship does not affect how the stimuli are created, but it does impact on how and what
types of part-worths are estimated by conjoint analysis. The “more” and “less” commands do not affect the
estimates of the utilities but are used simply to identify subjects whose estimates do not match the expected
outcome. Each attribute had an expected outcome for respondent-preference (with the expected most
preferred options shown in brackets) as follows:
River Access: a shorter distance to the river (200 m).
Proximity to Fremantle: a shorter distance to Fremantle (5 km).
Price: a lower price ($250,000).
Land Area: a larger site size (650 m2).
Contamination: a clean site (coded as “3”).
River View: a river view (coded as “1”).
Data Collection
A full-profile method, that shows all of the attributes (and not just pairs of attributes), was adopted for
presentation of the stimuli as this was considered to be a more realistic, more explicit portrayal of the trade-offs
among attributes than the trade-off method that shows only two attributes at a time. The full-profile approach is
also the most popular method mainly due to its ability to reduce the number of comparisons through use of a
20
fractional factorial design (the trade-off method is unable to employ this design). Further, the approach elicits
fewer judgments, however, each judgment is more complex.
The Orthoplan (stimulus design) procedure generated a set of 18 full-profile descriptions for use in the
experiment allowing for the estimation of the orthogonal main effects of each factor. An instruction sheet was
provided to respondents together with a sheet showing the set of 18 profiles (see Appendix II). Respondents
were asked to rank each profile (stimuli) in order of preference from high to low according to their perception
of how likely a resident would be to purchase the land described by each profile. This involved the respondent
making a trade-off between the various attributes presented. They were requested to enter the number 1 in a
column on the sheet next to the profile they consider they would most likely purchase, and a ranking of 18 next
to the least likely option to be purchased, and then to rank the remaining profiles accordingly.
Sample Selection
As mentioned above, a survey of the residents of affected property was preferable, but due to the small number
of respondents in the initial residents’ survey indicating a willingness to participate in the conjoint study, an
alternative respondent group was sought. Property valuers were identified as an appropriate alternative
respondent group.
The opportunity arose to present a seminar to the Western Australian members of the Australian Property
Institute on the valuation of contaminated land. Using this opportunity to run the survey ensured the required
numbers of respondents10 were present, and that they were valuers with an interest in contaminated land issues.
Due to the finding by Adair et al. (1996) that suggests valuers use imprecise methods to interpret residential
purchasers’ behaviour and as such their interpretations may be a poor proxy of buyers’ behaviour it was
10 Curry (1997) recommends at least 30-50 respondents per market segment.
21
considered worthwhile for comparative purposes to obtain responses from those residents who had shown a
willingness to participate in this survey, despite the limited number of these.
Real estate agents were also identified as a potential respondent group as they are actively involved in marketing
properties and thus have an opportunity to influence purchaser behaviour. As the case study area is located in
the Fremantle Shire, it was considered most appropriate to use a focused respondent group and survey only
those agents listed in the Fremantle area. It was thought that such agents would at least be aware of
contaminated land issues and the controversy that exists surrounding various sites in the area.
Similar to the finding by Adair et al. (1996), Strub and Herman (1993) found that sales force judgments bore
little resemblance to customer judgments. To test how closely valuers and real estate agents judgements
correspond to those of their customers in the current study, results from all three groups of respondents were
compared.
It was preferable to personally distribute the survey and be able to explain the ranking task due to the potential
for it to be perceived as complex. However, due to the number of respondents to be surveyed (85 real estate
agents from 11 agencies, and 9 residents) a self-administered questionnaire was selected as the most
appropriate collection technique for the agent and resident groups. Various techniques were utilised to help
overcome a low responses rate including inclusion of a free-post return envelope, an accompanying letter
ensuring anonymity, and sending of reminder letters.
The residents survey was addressed to the named resident as supplied on the returned questionnaire from an
initial residents’ survey. The real estate agents survey was mailed to individual agents identified from both the
22
Yellow Pages and Real Estate Institute of WA sponsored web site “RealNet” (http://www.realnet.com.au).
Collection was by freepost mail in both instances.
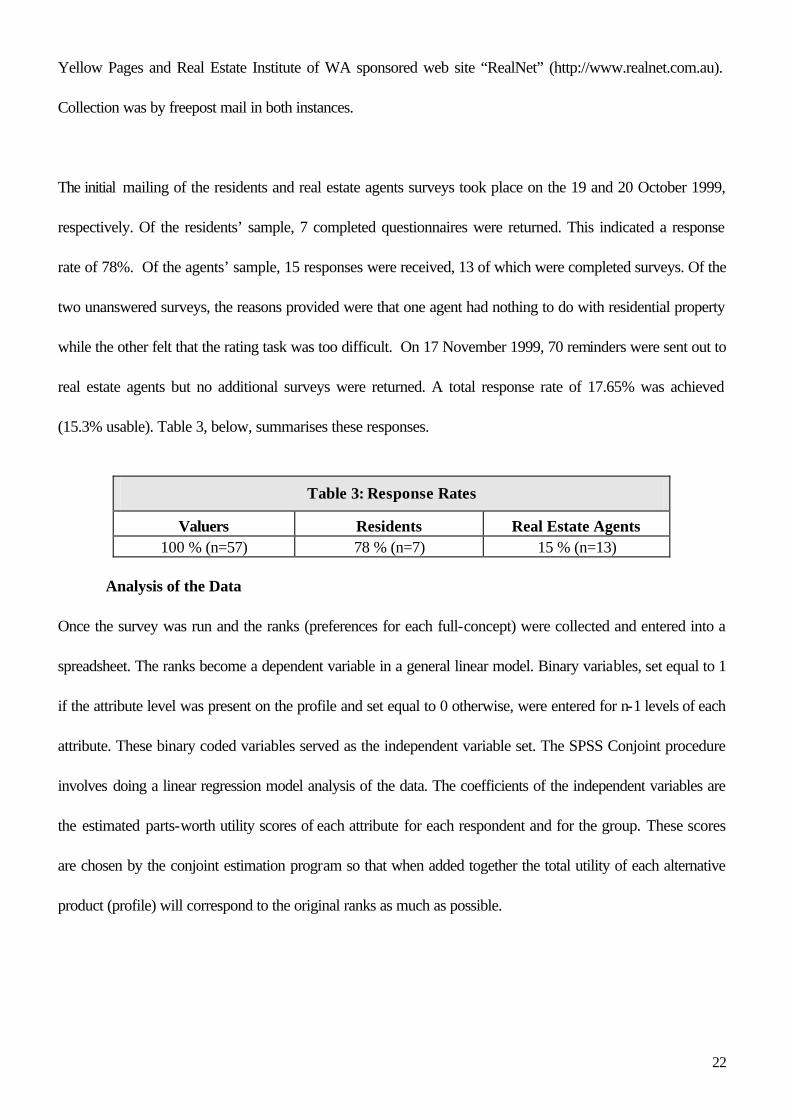
The initial mailing of the residents and real estate agents surveys took place on the 19 and 20 October 1999,
respectively. Of the residents’ sample, 7 completed questionnaires were returned. This indicated a response
rate of 78%. Of the agents’ sample, 15 responses were received, 13 of which were completed surveys. Of the
two unanswered surveys, the reasons provided were that one agent had nothing to do with residential property
while the other felt that the rating task was too difficult. On 17 November 1999, 70 reminders were sent out to
real estate agents but no additional surveys were returned. A total response rate of 17.65% was achieved
(15.3% usable). Table 3, below, summarises these responses.
Table 3: Response Rates
Valuers Residents Real Estate Agents 100 % (n=57) 78 % (n=7) 15 % (n=13)
Analysis of the Data
Once the survey was run and the ranks (preferences for each full-concept) were collected and entered into a
spreadsheet. The ranks become a dependent variable in a general linear model. Binary variables, set equal to 1
if the attribute level was present on the profile and set equal to 0 otherwise, were entered for n-1 levels of each
attribute. These binary coded variables served as the independent variable set. The SPSS Conjoint procedure
involves doing a linear regression model analysis of the data. The coefficients of the independent variables are
the estimated parts-worth utility scores of each attribute for each respondent and for the group. These scores
are chosen by the conjoint estimation program so that when added together the total utility of each alternative
product (profile) will correspond to the original ranks as much as possible.
23
This is the first time that conjoint analysis has been used in this way. While it has been used to analyse the
purchasing behaviour of property owners (see for example Louviere, 1979)11, no studies that the author is
aware of have used conjoint analysis to assess the attributes of property affected by stigma from previous
contamination. As discussed above, it is a valuable tool for valuers wanting to know how each attribute,
including contamination, contributes to the price of a property.
Conjoint Analysis Results
In this section the results from the three respondent groups are presented and compared. While utilities were
estimated for each individual respondent and for the group of all respondents, only the group results will be
presented for each group: the valuers, real estate agents, and residents.
The next section outlines descriptive statistics about the valuer respondents. Similar detailed analysis was not
sought for the other two groups as it was of less relevance in determining the representativeness of the group
responses to those of the target group, the residents, that they are acting as proxies for.
Profile of Valuers’ Membership, Gender, and Age
A profile of the respondents’ membership, gender and age was obtained from the membership database of the
WA Branch of the Australian Property Institute (API) for 54 of the valuers. As the remaining three respondents
were not members of the API this information was not available for them. While the respondents covered the
full range of API membership classifications and age categories, the majority were male (96.3%). Given that
valuers’ responses are being used in this study as proxies for buyer behaviour toward residential vacant land
where the market comprises a more balanced gender mix, this sample has a gender bias that may effect how
representative the results are of the target market.12
11 Louviere (1979) reported two studies of consumers’ preferences for housing alternatives looking at various combinations of housing attributes such as: number of baths and bedrooms, and asking price.
12 The breakdown by gender of the Perth population of 1,244,320 is 49% male, 51% female (1996 Census Data, Australian Bureau of Statistics 2000).
24
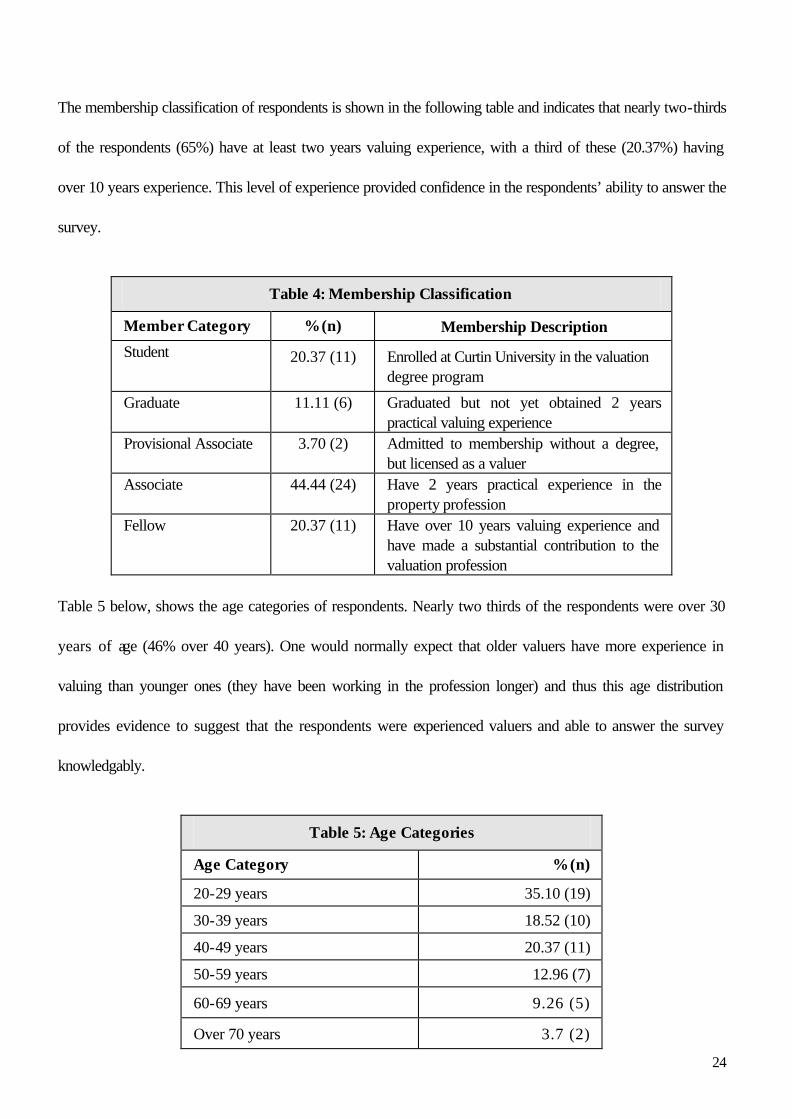
The membership classification of respondents is shown in the following table and indicates that nearly two-thirds
of the respondents (65%) have at least two years valuing experience, with a third of these (20.37%) having
over 10 years experience. This level of experience provided confidence in the respondents’ ability to answer the
survey.
Table 4: Membership Classification
Member Category % (n) Membership Description
Student 20.37 (11) Enrolled at Curtin University in the valuation degree program
Graduate 11.11 (6) Graduated but not yet obtained 2 years practical valuing experience
Provisional Associate 3.70 (2) Admitted to membership without a degree, but licensed as a valuer
Associate 44.44 (24) Have 2 years practical experience in the property profession
Fellow 20.37 (11) Have over 10 years valuing experience and have made a substantial contribution to the valuation profession
Table 5 below, shows the age categories of respondents. Nearly two thirds of the respondents were over 30
years of age (46% over 40 years). One would normally expect that older valuers have more experience in
valuing than younger ones (they have been working in the profession longer) and thus this age distribution
provides evidence to suggest that the respondents were experienced valuers and able to answer the survey
knowledgably.
Table 5: Age Categories
Age Category % (n)
20-29 years 35.10 (19)
30-39 years 18.52 (10)
40-49 years 20.37 (11)
50-59 years 12.96 (7)
60-69 years 9.26 (5)
Over 70 years 3.7 (2)
25
Group (aggregate) Results: Valuers, Real Estate Agents and Residents
The results from each respondent group indicate that each attribute had an expected outcome for respondent-
preference, outlined previously, as follows:
River Access: a shorter distance to the river (200 m).
Proximity to Fremantle: a shorter distance to Fremantle (5 km).
Price: a lower price ($250,000).
Land Area: a larger site size (650 m2).
Contamination: a clean site (coded as “3”).
River View: a river view (coded as “1”).
If different levels of an attribute produce widely different utilities the person is sensitive to the level (i.e., the
attribute is important to them). The graphical interpretation of the results (i.e. the utilities of each attribute)13 in
Appendix III clearly shows the relative importance of each attribute for the attributes and levels tested here.
Table 6 below summarises the results for each respondent group. Both the utilities and averaged importance
figures are shown.14 The attributes are listed in decreasing order of importance for the valuer group and similarly
for the other two groups. However, some attributes are listed out of decreasing order of importance for the real
estate agent and resident groups where the order of importance of the attributes differs from that for the valuer
group. This order is indicated by a superscript next to the averaged importance figure.
As proximity to the river and Fremantle are measured as distance from these amenities (rather than closeness
to) the utilities for the River Access and Proximity to Fremantle attributes are reported as negative numbers.
Similarly, for River View, the associated utility for “no river view” is reported as a negative number, while the
13 The utilities or “part-worth estimates” are relative numbers with no specific unit of measure. These scale values are chosen by the conjoint estimation program so that the when they are added together the total utility of each alternative product will correspond to the original ranks as much as possible.
14 The attribute with the greatest difference in utilities for the different levels of each attribute relative to the utility ranges for
26
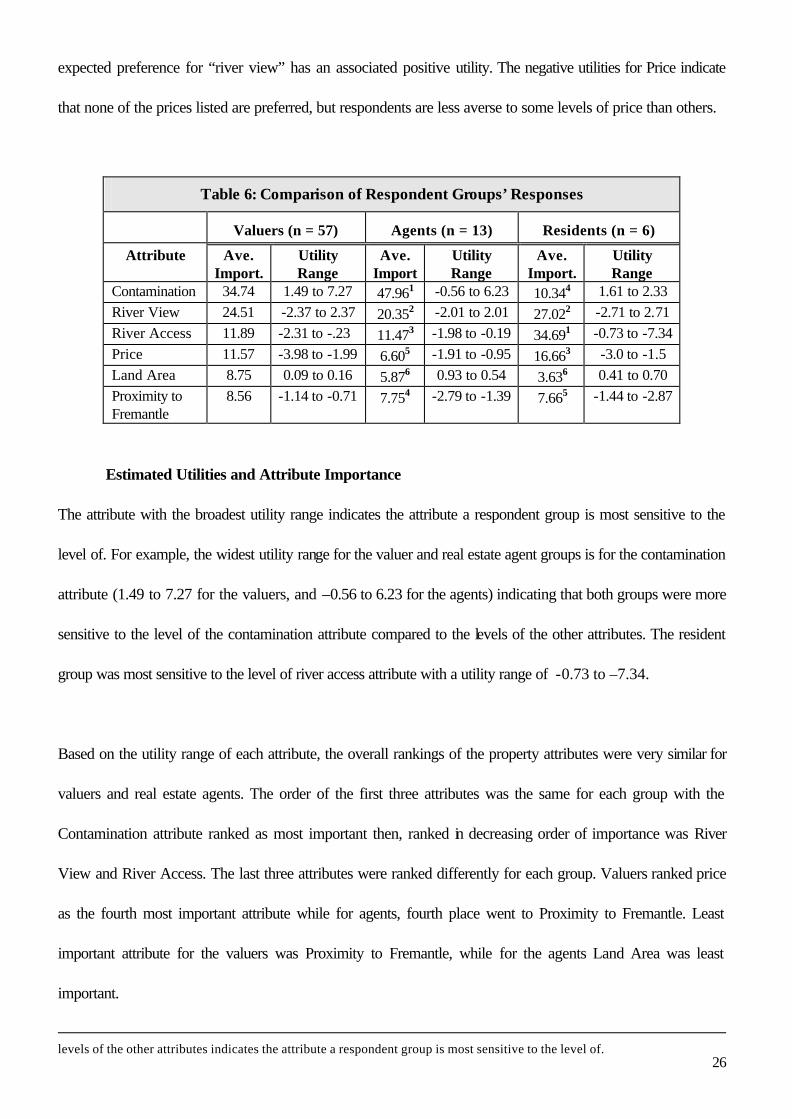
expected preference for “river view” has an associated positive utility. The negative utilities for Price indicate
that none of the prices listed are preferred, but respondents are less averse to some levels of price than others.
Table 6: Comparison of Respondent Groups’ Responses
Valuers (n = 57) Agents (n = 13) Residents (n = 6)
Attribute Ave. Import.
Utility Range
Ave. Import
Utility Range
Ave. Import.
Utility Range
Contamination 34.74 1.49 to 7.27 47.961 -0.56 to 6.23 10.344 1.61 to 2.33 River View 24.51 -2.37 to 2.37 20.352 -2.01 to 2.01 27.022 -2.71 to 2.71 River Access 11.89 -2.31 to -.23 11.473 -1.98 to -0.19 34.691 -0.73 to -7.34 Price 11.57 -3.98 to -1.99 6.605 -1.91 to -0.95 16.663 -3.0 to -1.5 Land Area 8.75 0.09 to 0.16 5.876 0.93 to 0.54 3.636 0.41 to 0.70 Proximity to Fremantle
8.56 -1.14 to -0.71 7.754 -2.79 to -1.39 7.665 -1.44 to -2.87
Estimated Utilities and Attribute Importance
The attribute with the broadest utility range indicates the attribute a respondent group is most sensitive to the
level of. For example, the widest utility range for the valuer and real estate agent groups is for the contamination
attribute (1.49 to 7.27 for the valuers, and –0.56 to 6.23 for the agents) indicating that both groups were more
sensitive to the level of the contamination attribute compared to the levels of the other attributes. The resident
group was most sensitive to the level of river access attribute with a utility range of -0.73 to –7.34.
Based on the utility range of each attribute, the overall rankings of the property attributes were very similar for
valuers and real estate agents. The order of the first three attributes was the same for each group with the
Contamination attribute ranked as most important then, ranked in decreasing order of importance was River
View and River Access. The last three attributes were ranked differently for each group. Valuers ranked price
as the fourth most important attribute while for agents, fourth place went to Proximity to Fremantle. Least
important attribute for the valuers was Proximity to Fremantle, while for the agents Land Area was least
important.
levels of the other attributes indicates the attribute a respondent group is most sensitive to the level of.
27
The averaged importance weight indicates the relative range of utilities for an attribute and provides a quicker
visual tool for determining the most important attribute, than the utility figures do. While both valuers and agents
rank Contamination as the most important attribute, from the importance weights for this attribute it can be seen
that agents are much more sensitive to this attribute than valuers (47.96 versus 34.74). For both respondent
groups similar importance weights were recorded for River View, River Access and Proximity to Fremantle.
However, valuers appear to be more sensitive than the agents to Price (11.57 versus 6.60) and Land Area
(8.75 versus 5.87).
Residents ranked most attributes differently to the ranks of the other two respondent groups. Contamination
ranked lower on a relative basis (fourth most important attribute), equal with the valuers’ and agents’ ranking of
Price. The most important attribute for that group was River Access, ranked as the third most important
attribute for the other two groups. Land Area was ranked as least most important of all the attributes, the same
as the agents’ ranking of this attribute.
The only similarity in results for the three respondent groups was for the River View attribute. Both the
importance weightings and rankings for this attribute were similar for all respondent groups. The importance
weight for the Proximity to Fremantle attribute was similar for all groups yet the ranking of this attribute differed
between the groups.
While this section has discussed the most important attribute for each respondent group, the next section will
outline their most preferred level of each attribute.
Level Preferences for Each Attribute
28
The estimated utilities for both the valuer and real estate agent group indicate that they prefer a clean site to
either a clean site adjoining a contaminated site or a remediated contaminated site, the latter being least
preferred of the three options. A river view is preferred to no river view, and being located within 200 metres of
the river is preferred to being further away from the river, with preference decreasing with increasing distance
from the river. A similar result was recorded for the Proximity to Fremantle attribute, with preference
decreasing with increasing distance to Fremantle. The $250,000 price tag is preferred to the more expensive
alternatives with preference decreasing as price increases. The 650 square metre land area is preferred to
smaller sites, with preference decreasing as size decreases. These preferences followed the expected choice of
preferences for each attribute as indicated by the expected outcomes shown above.
Residents had the same preference for each attribute as the valuers and real estate agents except for the
contamination attribute. Residents preferred a clean site adjoining a contaminated site to a clean site, with a
remediated site being the least preferred of the three options.
Comparison of Group Results
The roles of valuers and real estate agents are similar in that they both are required to model market behaviour.
Real estate agents are responsible for assessing market behaviour and are expected to incorporate it into their
asking prices. Often agents and valuers work closely to share market information. Agents are active in the
market on a day-to-day basis, representing the buyers and sellers to facilitate property transactions and are
aware of sale prices before valuers obtain this market information. Agents tend to be more forward looking in
that they have the ability to set prices, valuers tend to be more focused on the past using historic sales data as
their evidence of value. However, their close association and similarity of roles is the reason it is expected that
their responses to the conjoint analysis exercise would be similar. Generally, the results appear to substantiate
this expectation.
29
While similarities existed between the results from the valuers and agents, the difference in results between these
respondents and those from the residents was somewhat disconcerting, particularly given both valuers and
agents role in the real estate process is to model the behaviour of the residents (the buyers and sellers of
property). However, as valuers use property sales data that are ex post and represent market fact to base their
valuation opinions, two possible explanations for the differences between the valuers’ and residents’ responses
can be given. Either, the reliability of the responses given by the residents to the conjoint analysis exercise is
questionable and not in line with the market sales evidence, or the valuers themselves are interpreting the market
evidence in a way that does not adequately reflect actual purchasing behaviour. This latter explanation would be
in line with the finding by Adair et al. (1996) that valuers view critical property characteristics differently than
market participants.
Another explanation of the difference in the valuers and agents responses compared to those from the residents
is that the resident group surveyed are those that have already purchased in an area with a history of
contamination and may not represent the entire population of potential land purchasers that the valuers and
agents need to consider when carrying out their respective roles. Such residents are, by the very fact that they
have purchased in an area where contamination has been/is an issue, less sensitive to this than might be the case
for the market as a whole.
Alternatively, the residents’ apparent lower sensitivity to the contamination attribute may be due to the possible
affect of cognitive dissonance reduction. In this case, they are not necessarily less sensitive to the contamination
but are unwilling to admit, due to the large amounts of money already paid, that they may have made a poor
purchasing decision to buy a remediated contaminated site and one next to a contaminated site. This would also
help to explain the difference in preference for the level of the attribute contamination between the residents and
30
the other two respondent groups. The former preferred a clean site adjoining a contaminated site to a clean site,
while the latter groups preferred the clean site, as was expected.
The resident group represents a biased sample. Should a wider group of potential residential purchasers have
been surveyed the results may have been more in line with those from the valuer and agent groups. The sample
selection bias was inevitable as the purpose for surveying this specific group of residents was so that the results
of the conjoint analysis could be validly compared to regression results from a parallel study (not reported
here).
Accuracy of the Model
Conjoint analysis derives a model that predicts the total worth of a product by adding up the part-worths of
each level of each attribute. The least squares model produced from the above provide estimates of the part-
worths for each level of each attribute. To assess how accurately the estimated model predicts consumer
preferences correlations based on the actual and the predicted ranks are used (Spearman’s rho and Kendall’s
tau). These correlations are tested for statistical significance. The analysis of the valuers responses had a
Person’s R15 coefficient of 0.977 and a Kendall’s tau-b16 statistic of 0.948. These statistics were 0.977 and
0.941, respectively, for the real estate agents group, and 0.974 and 0.817 for the residents group.
Kendall’s tau-b is the most appropriate statistic for ranked data and indicates a strong positive linear
relationship exists between the predicted and actual ranks and that this correlation was statistically significant at
the 0.05 level. This test indicates that the models are generally very accurate in predicting respondent
preference for vacant residential land in the scenario presented. As would be expected, the most accurate
15 The Pearson’s R or product moment correlation coefficient is a dimensionless index that ranges from -1.0 to 1.0 inclusive and reflects the extent of a linear relationship between the dependent and independent variables, Microsoft (1997).
16 Kendall’s tau-b is a nonparametric measure of correlation for ordinal or ranked variables that take ties into account. The sign of the coefficient indicates the direction of the relationship, and its absolute value indicates the strength, with larger absolute values indicating stronger relationships. Possible values range from -1 to 1, but a value of -1 or +1 can only be
31
model was for the model derived from group with the largest number of respondents, the valuers. Despite the
small sample size of the other two groups the models derived from their responses also show a high level of
accuracy.
Limitations of the Conjoint Analysis Approach and Results
The most serious limitation of the conjoint analysis study was the reliance on a small sample of residential
responses. This limitation was addressed by inclusion of more than one respondent group in the study and a
comparison of the responses from each group. However, despite the use of more than one respondent group,
samples from each were not generated from probability-based methods.
For example, as mentioned previously, sample selection of the resident group was on the basis that they lived in
the case study area and were willing to participate. As such, their responses do not represent those of all
potential residents. Of course, as explained earlier, this sample selection bias was inevitable as the purpose for
surveying this specific group of residents was so that the results of the conjoint analysis could be validly
compared to the regression results from a parallel study (not reported here).
The valuer group sample was similarly biased. It was of those attending a seminar on the valuation of
contamination land. Attendance at this seminar signifies that these valuers have knowledge of, and/or an interest
in, contamination issues and may not be fully representative of all valuers. However, it is expected that valuers
with experience in contaminated land issues would be better able to model buyer behaviour where land
contamination may be an issue than valuers without such experience. As such, this biased sample was an
advantage for this survey where the purpose for obtaining the valuer responses was for use as a proxy for buyer
behaviour.
obtained from square tables, Microsoft (1997).
32
The length of the form and number of profiles to rank (18) may have caused some potential real estate
respondents to discard the questionnaire. Those who completed the form from all three respondent groups may
have done so but have developed respondent fatigue. Both of these problems may have limited the reliability of
the conjoint analysis results by affecting representativeness and limiting the accuracy of the ranking task.
Finally, it is important to note that for all conjoint analysis results reported here, the indicated importance of
each attribute is only relevant for the attributes and levels tested in this study. Should the range of levels of an
attribute being tested change, the relative importance of that attribute is also likely to change.
Summary and Conclusion
The conjoint study has demonstrated that conjoint measurement can be used to validly determine the
importance of vacant residential land attributes to purchasers. The attribute importance and price information is
particularly useful to valuers when valuing property affected by land contamination issues, including stigma.
Knowledge of how each attribute contributes to price will assist with the comparison of the subject property to
similar properties that have sold recently and more precise estimates of adjustments to be made for differences
that exist between them. Adjusting sale prices in this manner provides a more reasoned approach to the analysis
than simply basing adjustments on subjective judgement of what the valuer intuitively believes to be most
important. Thus, with each attribute that contributes to a property’s value correctly weighted a better reasoned
and more realistic value estimate can be achieved. Further, by calculating the dollar worth of each attribute and
using this information in combination with the hedonic prices of each attribute calculated from a regression
analysis can result in a more informed value estimate.
Conjoint analysis is a flexible multivariate technique that is readily accessible through the relevant computer
software to most practitioners in the property field. Further, compared to some of the more recent multivariate
33
techniques advocated, such as discrete choice modelling, it is less complex and therefore more readily
understood and easier to learn. These advantages will likely ensure the continued popularity and use of the
technique in favour of the more recent, complex techniques as a tool for understanding consumer preferences.
Acknowledgements
I would like to offer special thanks to the respondents in the two surveys including residents at Rocky Bay
Estate and valuers attending the WA Australian Property Institutes' "Contaminated Land Valuation" seminar for
without their responses the thesis would not be possible.
34
REFERENCES:
Abelson, P. W. 1979, 'Property prices and amenity values', Journal of Environmental Economics and Management, vol. 6, pp. 11-28. Adair, A., Berry, J. & McGreal, S. 1996, 'Valuation of residential property: analysis of participant behaviour',
Journal of Property Valuation and Investment, vol. 14, no. 1, pp. 20-35. Anderson, N. H. 1970, 'Functional measurement and psychophysical judgement', Psychological Review, vol.
77, pp. 153-170. Australian Bureau of Statistics 1996 'Census of Population and Housing
State of Western Australia', [Online], Available: http://www.abs.gov.au/websitedbs/d3310108.nsf/ASGC/A25E2FA4020761D94A256514001A4D4
7/ [2000, August 16]. Bond, S. G. 1995, 'Residents' perceptions of high voltage overhead transmission lines on property values',
Australian Land Economics Review, vol. 1, no. 1, pp. 25-30. Bruner, J. S., Brunswik, E., Festinger, L., Heider, F., Muenzinger, K. F., Osgood, C. E., & Rapaport, D.
1957, Contemporary approaches to cognition--A report of a symposium at the University of Colorado, May 12-14, 1955, eds Harvard University Press, Cambridge, Mass.
Colwell, P. F. 1990, 'Power lines and land values', Journal of Real Estate Research, vol. 5, no. 1, pp. 117-
27. Curry, J. 1997, 'After the basics', Marketing Research: A Magazine of Management and Application, vol. 9,
no. 1, pp. 6-11. Dale, L., Murdoch, J. C., Thayer, M. A., & Waddell, P. A. 1999, 'Do property values rebound from
environmental stigmas? Evidence from Dallas', Land Economics, vol. 75, no. 2, pp. 311-326. Diaz III, J. 1999, 'The first decade of behavioural research in the discipline of property', Journal of Property
Investment and Finance, vol. 17, no. 4, pp. 326-332. Dixon, J. A., Carpenter, R. A., Fallon, L. A., Sherman, P. B., & Manipomoke, S. 1988, Economic Analysis
of the Environmental Impacts of Development Projects. (2nd ed.), Earthscan Publications in association with The Asian Development Bank, London.
Dotzour, M. 1997, 'Groundwater contamination and residential property values', The Appraisal Journal, vol.
65, no. 3, pp. 279-284. Elliot-Jones, M. (1995, 'Valuation of post-cleanup property: The economic basis of stigma damages', Bureau
of National Affairs Toxics Law Reporter, February 1, p.944-955. Federal-Register, 1996, The Final Rules and Regulations of the Natural Resource Damage Assessment,
January 5, U.S. National Oceanic and Atmospheric Administration, vol. 61, no. 4.
35
Golding, D. 1992, 'A social and programmatic history of risk research', in Social Theories of Risk, eds S. Krimsky & D. Golding, Praeger, Westport, Connecticut, pp. 23-52.
Greaves, M. 1984, 'The determinants of residential values: the hierarchical and statistical approaches', Journal
of Valuation, vol. 3, pp. 5-23. Green, P., & Tull, D. 1973, Research for Marketing Decisions, 4th edn, Prentice-Hall, Englewood Cliffs,
New Jersey: Grissom, T. V. 1991, 'Valuation without comparables', The Appraisal Journal, vol. 59, pp. 370-376. Hair, J. F. J., Anderson, R. E., Tatham, R. L., & Black, W. C. 1995, Multivariate data analysis with
readings, 4th edn, Prentice Hall, Englewood Cliffs, N.J. Hardin, I. W. 1999, 'Behavioural research into heuristics and bias as an academic pursuit', Journal of
Property Investment and Finance, vol. 17, no. 4, pp. 333-352. Kasperson, R. E. 1992, 'The social amplification of risk: progress in developing an integrative framework', in
Social Theories of Risk, eds S. Krimsky & D. Golding, Praeger, Westport, Connecticut, pp. 153-178.
Knight, R. L., & Menchik, M. D. 1974, Conjoint Preference Estimation For Residential Land Use Policy
Evaluation, Research report, Institute for Environmental Studies, University of Wisconsin, Wisconsin.
Krimsky, S., & Golding, D. 1992, 'Reflections', in Social Theories of Risk, eds S. Krimsky & D. Golding,
Praeger, Westport, Connecticut, pp. 355-364. Kunreuther, H. 1992, 'A conceptual framework for managing low-probability events', in Social Theories of
Risk, eds S. Krimsky & D. Golding, Praeger, Westport, Connecticut, pp. 301-320. Lancaster, K. 1966, 'A new approach to consumer theory', Journal of Political Economics, vol. 74, April,
pp. 132-157. Levesque, T. J. 1994, 'Modelling the effects of airport noise on residential housing markets', Journal of
Transport Economics and Policy, vol. 28, May, pp. 199-210. Levy, D.S. 1995, 'Modern marketing research techniques and the property professional', Property
Management, vol. 13, no. 3, pp. 33-40. Louviere, J. J. 1979, 'Modelling individual residential preferences: A totally disaggregate approach',
Transportation Research, vol. 13, A, pp. 374-384. Louviere, J. J. 1988, Analyzing Decision Making: Metric Conjoint Analysis, Sage Publications, Newbury Park. Mattila, A. 1999, 'Consumers' value judgments', Cornell Hotel and Restaurant Administration Quarterly,
vol. 40, no. 1, pp. 40-46. McLean, D. G., & Mundy, B. 1998, 'The addition of contingent valuation and conjoint analysis to the required
body of knowledge for the estimation of environmental damages to real property', Journal of Real Estate Practice and Education, vol. 1, no. 1, pp. 1-19.
36
McCluskey, J.J. & Rausser, G. C. 2000, Stigmatized Asset Values: Is it Temporary or Permanent? Research paper, Department of Agricultural Economics, Washington State University, WA.
Microsoft 1997, SPSS Windows Help Guide (9.0.1), [Onscreen], Microsoft Windows, 24 February. Newell, A., & Simon, H. 1972, Human Problem Solving, Prentice-Hall, Englewood Cliffs, N.J. Priestley, T., & Evans, G. 1990, Perception of a Transmission Line in a Residential Neighbourhood: Results of a
Case Study in Vallejo, California, A report prepared for Southern California Edison Environmental Affairs Division, San Fransisco.
Reichert, A. J. 1997, 'Impact of a toxic waste Superfund site on property values', Appraisal Journal, vol. 65,
no. 4, pp. 381-392. Simons, R. A., Bowen, W., & Sementelli, A. 1997, 'The effect of underground storage tanks on residential
property values in Cuyahoga County, Ohio', Journal of Real Estate Research, vol. 14, no. 1, pp. 29-41.
Slovic, P. 1992, 'Perceptions of risk: Reflections on the psychometric paradigm', in Social Theories of Risk,
eds S. Krimsky & D. Golding, Praeger, Westport, Connecticut, pp. 117-152. Smolen, G. E., Moore, G., & Conway, L. V. 1992, 'Hazardous waste landfills: impacts on local property
values', The Real Estate Appraiser, vol. 58, no. 1, pp. 4-11. Strub, P. J., & Herman, S. J. 1993, 'Can the sales force speak for the customer?', Marketing Research: A
Magazine of Management and Applications, vol. 5, no. 4, pp. 32-35. Wind, J., Green, P. E., Shifflet, D., & Scarborough, M. 1989, 'Courtyard by Marriott: Designing a hotel facility
with consumer-based marketing models', Interfaces, vol. 19, no. 1, pp. 25-47. Zeiss, C., & Atwater, J. 1989, 'Waste facility impacts on residential property values', Journal of Urban
Planning and Development, vol. 115, no. 2, pp. 64-79. Zeiss, C., & Atwater, J. 1990, 'Incinerator impacts on residential property sales: beyond price effects', Journal
of Urban Planning and Development, vol. 116, no. 2, pp. 80-97.

37
Appendix I – Case Study Area: Rocky Bay Estate
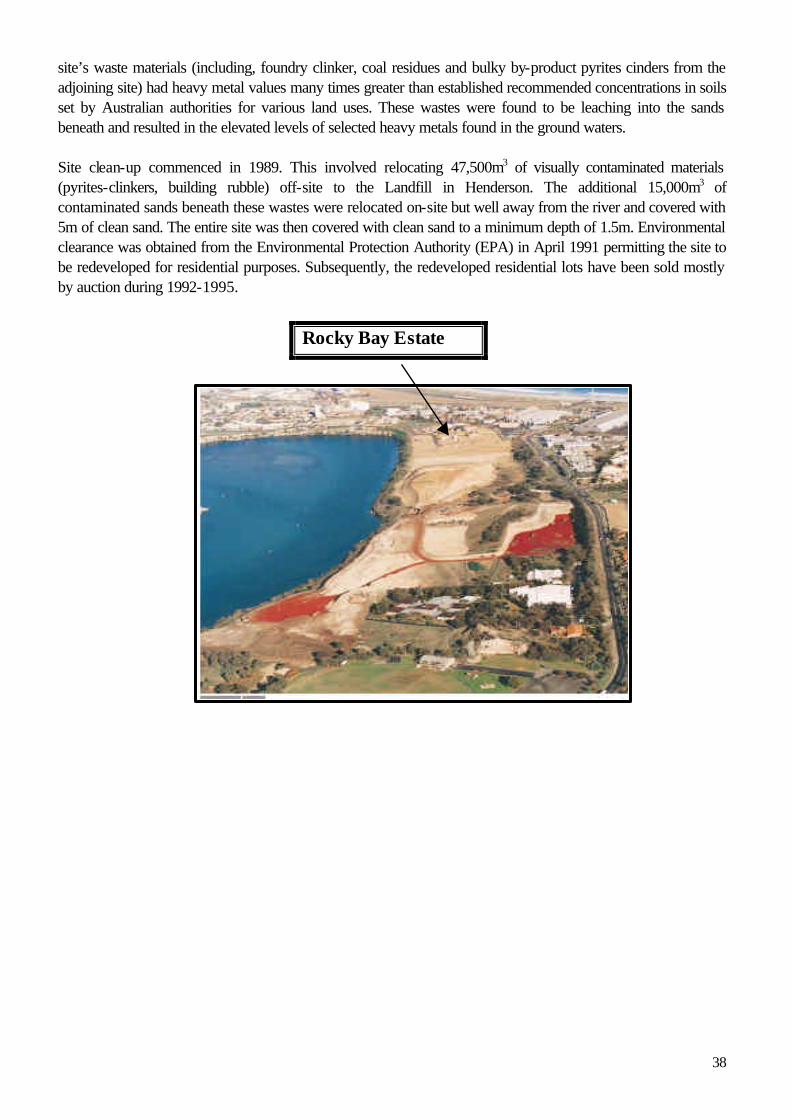
The case study area comprises some 8 hectares of prime riverfront land located on the northern border of North Fremantle. Riverfront property is traditionally the most valuable in Perth. Since Federation much of it has been occupied by the Federal or State governments, which have sporadically released land for private residential development. In 1990-92, the former State Engineering Works site was redeveloped as a high-class, single-family residential suburb, known as Rocky Bay Estate, containing approximately 110 fully serviced sites ranging in size from 249 to 880 m2. The subdivision also includes areas of public open space, in addition to a 9m wide strip of general open space comprised of a cycle path and walkway between the site and the top of the cliff adjacent to the Swan River. The subdivision is bounded by the Swan River to the east and southeast, the Land Corp-owned McCabe Street contaminated site (known as Minim Cove)17 to the northeast with a concentration of light industrial and residential to the west and south. Located above the river, the area obtains views over the river to Preston Point and East Fremantle in the south. The subdivision is conveniently located within walking distance of Leighton Beach, easy commuting distance (5-10 minutes) of both Fremantle and Mosman Park and is within 20 km of Perth’s central business district. Site History and Contamination
The State Engineering Works (SEW) previously occupied the site. Operations commenced at the SEW in the early 1900’s that involved mostly the manufacture of harvesters and ploughs. During World War II the SEW were used for naval repairs and, up until 1986, for metal fabrication (such as casting keels for yachts). The SEW were finally closed down in 1987. In 1988, groundwater test results indicated excessive levels of nitrate and salinity. Additionally, arsenic and cyanide were at the upper limits of safe standards for domestic supply. Results from the tests indicated that the
17 The Minim Cove land was leased in the 1909 by CSBP who built a fertiliser factory to manufacture superphosphate. The factory was closed in 1969. In 1988, it was found that the site was heavily and extensively contaminated with heavy metals, cadmium, lead, cyanide and arsenic and that these had been leaching into the groundwater. Clean-up of the site commenced in 1997 and is ongoing (September, 2000).
Rocky Bay Estate
38
site’s waste materials (including, foundry clinker, coal residues and bulky by-product pyrites cinders from the adjoining site) had heavy metal values many times greater than established recommended concentrations in soils set by Australian authorities for various land uses. These wastes were found to be leaching into the sands beneath and resulted in the elevated levels of selected heavy metals found in the ground waters. Site clean-up commenced in 1989. This involved relocating 47,500m3 of visually contaminated materials (pyrites-clinkers, building rubble) off-site to the Landfill in Henderson. The additional 15,000m3 of contaminated sands beneath these wastes were relocated on-site but well away from the river and covered with 5m of clean sand. The entire site was then covered with clean sand to a minimum depth of 1.5m. Environmental clearance was obtained from the Environmental Protection Authority (EPA) in April 1991 permitting the site to be redeveloped for residential purposes. Subsequently, the redeveloped residential lots have been sold mostly by auction during 1992-1995. Rocky Bay Estate
39
Appendix II
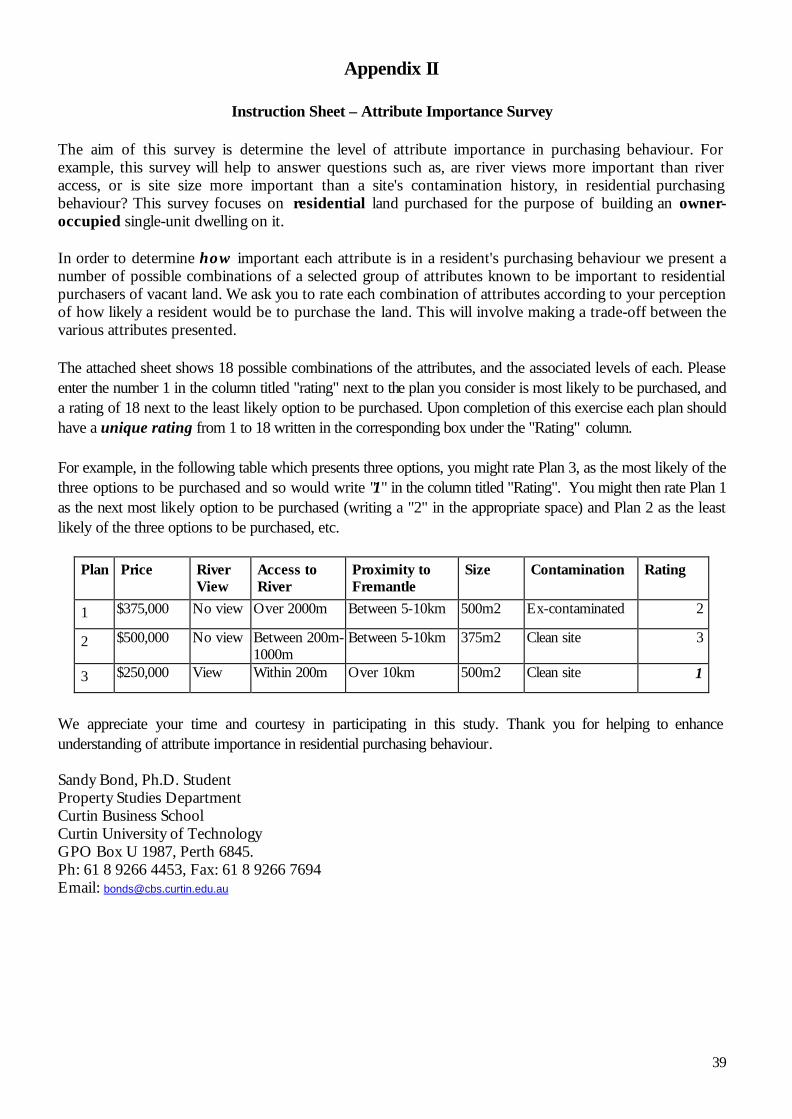
Instruction Sheet – Attribute Importance Survey
The aim of this survey is determine the level of attribute importance in purchasing behaviour. For example, this survey will help to answer questions such as, are river views more important than river access, or is site size more important than a site's contamination history, in residential purchasing behaviour? This survey focuses on residential land purchased for the purpose of building an owner-occupied single-unit dwelling on it. In order to determine how important each attribute is in a resident's purchasing behaviour we present a number of possible combinations of a selected group of attributes known to be important to residential purchasers of vacant land. We ask you to rate each combination of attributes according to your perception of how likely a resident would be to purchase the land. This will involve making a trade-off between the various attributes presented. The attached sheet shows 18 possible combinations of the attributes, and the associated levels of each. Please enter the number 1 in the column titled "rating" next to the plan you consider is most likely to be purchased, and a rating of 18 next to the least likely option to be purchased. Upon completion of this exercise each plan should have a unique rating from 1 to 18 written in the corresponding box under the "Rating" column. For example, in the following table which presents three options, you might rate Plan 3, as the most likely of the three options to be purchased and so would write "1" in the column titled "Rating". You might then rate Plan 1 as the next most likely option to be purchased (writing a "2" in the appropriate space) and Plan 2 as the least likely of the three options to be purchased, etc.
Plan Price River View
Access to River
Proximity to Fremantle
Size Contamination Rating
1 $375,000 No view Over 2000m Between 5-10km 500m2 Ex-contaminated 2
2 $500,000 No view Between 200m-1000m
Between 5-10km 375m2 Clean site 3
3 $250,000 View Within 200m Over 10km 500m2 Clean site 1
We appreciate your time and courtesy in participating in this study. Thank you for helping to enhance understanding of attribute importance in residential purchasing behaviour. Sandy Bond, Ph.D. Student Property Studies Department Curtin Business School Curtin University of Technology GPO Box U 1987, Perth 6845. Ph: 61 8 9266 4453, Fax: 61 8 9266 7694 Email: [email protected]
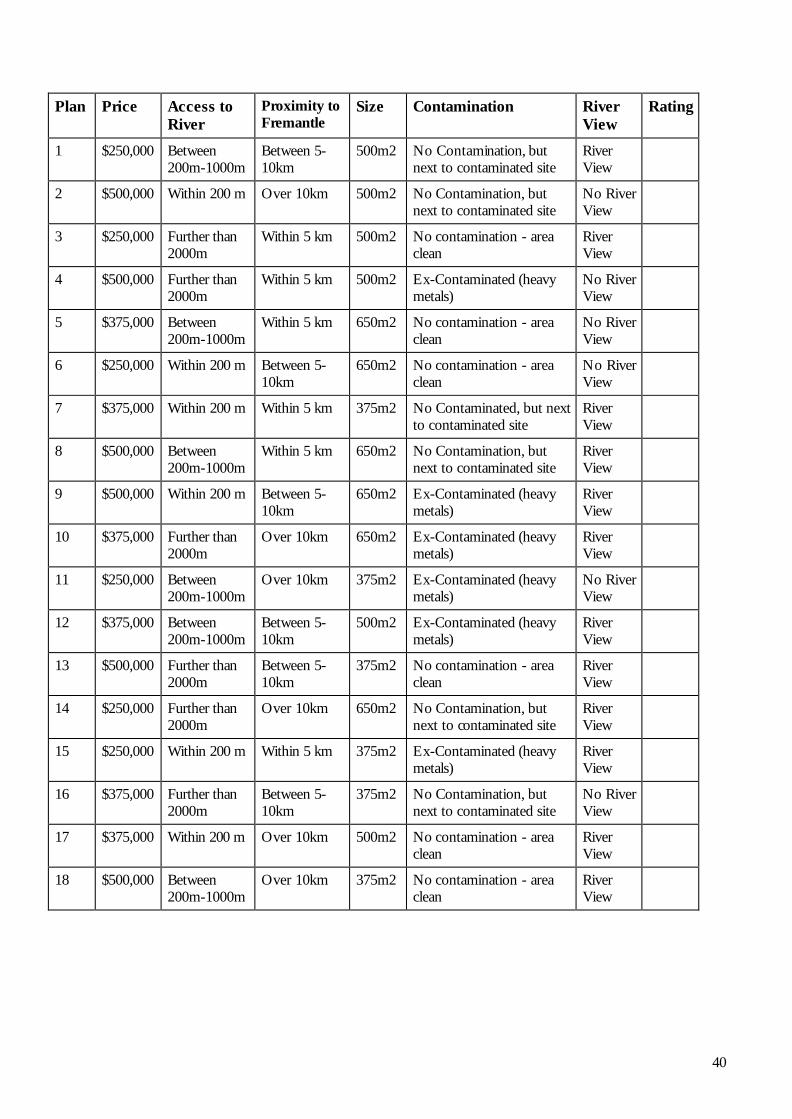
40
Plan Price Access to River
Proximity to Fremantle
Size Contamination River View
Rating
1 $250,000 Between 200m-1000m
Between 5-10km
500m2 No Contamination, but next to contaminated site
River View
2 $500,000 Within 200 m Over 10km 500m2 No Contamination, but next to contaminated site
No River View
3 $250,000 Further than 2000m
Within 5 km 500m2 No contamination - area clean
River View
4 $500,000 Further than 2000m
Within 5 km 500m2 Ex-Contaminated (heavy metals)
No River View
5 $375,000 Between 200m-1000m
Within 5 km 650m2 No contamination - area clean
No River View
6 $250,000 Within 200 m Between 5-10km
650m2 No contamination - area clean
No River View
7 $375,000 Within 200 m Within 5 km 375m2 No Contaminated, but next to contaminated site
River View
8 $500,000 Between 200m-1000m
Within 5 km 650m2 No Contamination, but next to contaminated site
River View
9 $500,000 Within 200 m Between 5-10km
650m2 Ex-Contaminated (heavy metals)
River View
10 $375,000 Further than 2000m
Over 10km 650m2 Ex-Contaminated (heavy metals)
River View
11 $250,000 Between 200m-1000m
Over 10km 375m2 Ex-Contaminated (heavy metals)
No River View
12 $375,000 Between 200m-1000m
Between 5-10km
500m2 Ex-Contaminated (heavy metals)
River View
13 $500,000 Further than 2000m
Between 5-10km
375m2 No contamination - area clean
River View
14 $250,000 Further than 2000m
Over 10km 650m2 No Contamination, but next to contaminated site
River View
15 $250,000 Within 200 m Within 5 km 375m2 Ex-Contaminated (heavy metals)
River View
16 $375,000 Further than 2000m
Between 5-10km
375m2 No Contamination, but next to contaminated site
No River View
17 $375,000 Within 200 m Over 10km 500m2 No contamination - area clean
River View
18 $500,000 Between 200m-1000m
Over 10km 375m2 No contamination - area clean
River View
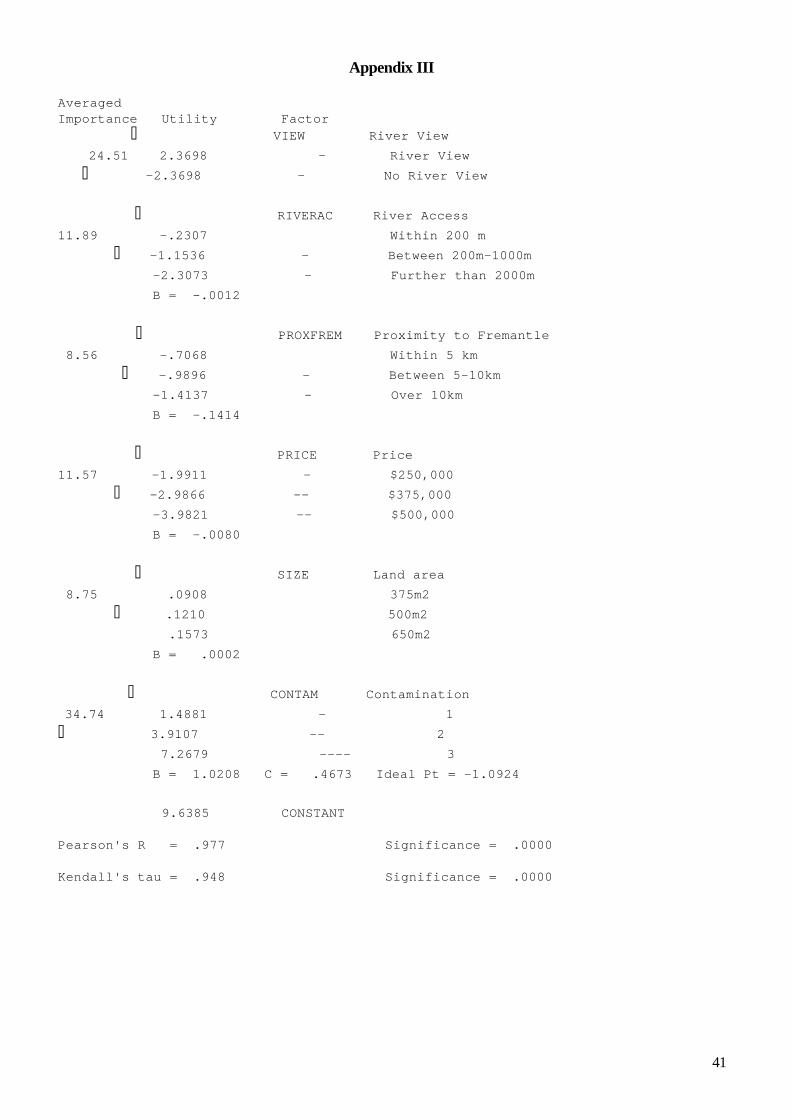
41
Appendix III Averaged Importance Utility Factor öòòòòòòø VIEW River View ó24.51 ó 2.3698 ó- River View õòòòòòò÷ -2.3698 -ó No River View ó öòòø RIVERAC River Access 11.89 ó ó -.2307 ó Within 200 m õòò÷ -1.1536 -ó Between 200m-1000m ó -2.3073 -ó Further than 2000m ó B = -.0012 ó öòø PROXFREM Proximity to Fremantle 8.56 ó ó -.7068 ó Within 5 km õò÷ -.9896 -ó Between 5-10km ó -1.4137 -ó Over 10km ó B = -.1414 ó öòòø PRICE Price 11.57 ó ó -1.9911 -ó $250,000 õòò÷ -2.9866 --ó $375,000 ó -3.9821 --ó $500,000 ó B = -.0080 ó öòòø SIZE Land area 8.75 ó ó .0908 ó 375m2 õòò÷ .1210 ó 500m2 ó .1573 ó 650m2 ó B = .0002 ó öòòòòòòòòòø CONTAM Contamination ó34.74 ó 1.4881 ó- 1 õòòòòòòòòò÷ 3.9107 ó-- 2 ó 7.2679 ó---- 3 ó B = 1.0208 C = .4673 Ideal Pt = -1.0924 ó 9.6385 CONSTANT Pearson's R = .977 Significance = .0000 Kendall's tau = .948 Significance = .0000
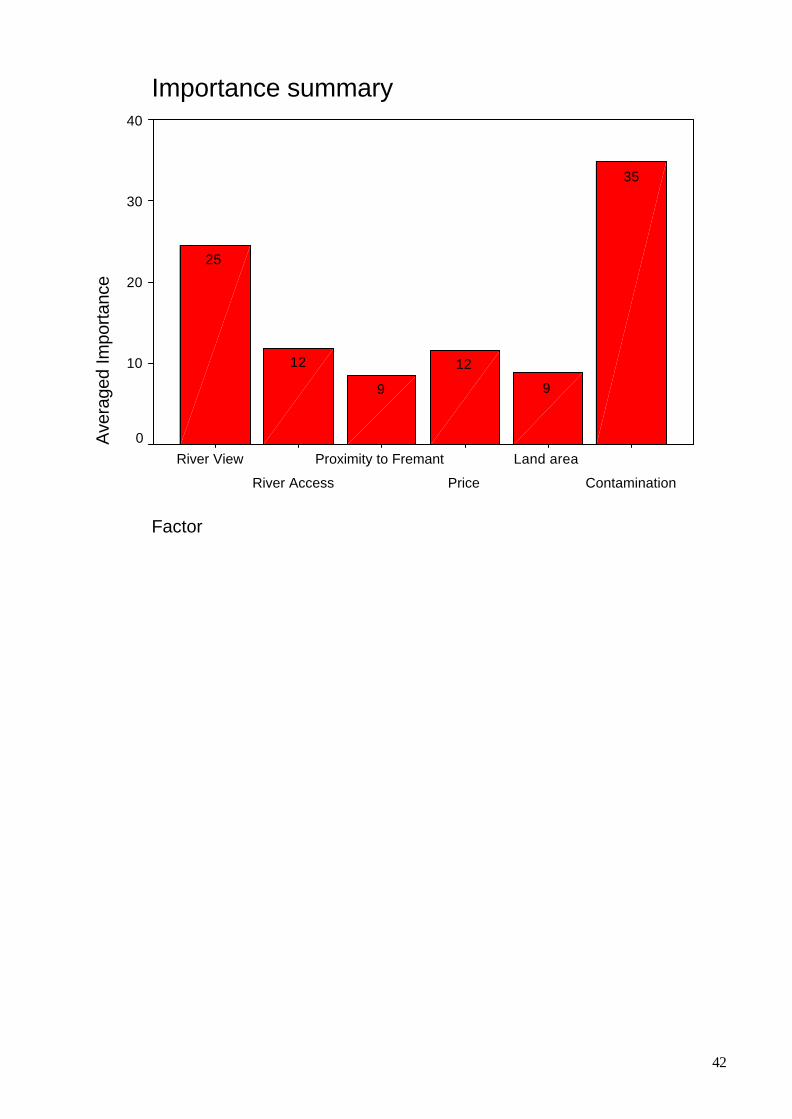
42
Importance summary
Factor
Contamination
Land area
Price
Proximity to Fremant
River Access
River View
Ave
rage
d Im
porta
nce
40
30
20
10
0
35
9
12
9
12
25