Consumers? relative preferences for meat attributes and
114
Consumers relative preferences for meat attributes and the impact of carbon footprint information on consumer choice Economics Master's thesis Laura Koistinen 2010 Department of Economics Aalto University School of Economics
Transcript of Consumers? relative preferences for meat attributes and
Consumers� relative preferences for meat attributes andthe impact of carbon footprint information on consumerchoice
Economics
Master's thesis
Laura Koistinen
2010
Department of EconomicsAalto UniversitySchool of Economics
AALTO UNIVERSITY SCHOOL OF ECONOMICS ABSTRACT Economics, Master’s Thesis 17.12.2010 Laura Koistinen CONSUMERS’ RELATIVE PREFERENCES FOR MEAT ATTRIBUTES AND THE IMPACT OF CARBON FOOTPRINT INFORMATION ON CONSUMER CHOICE
Growing concern over environmental impacts and other credence characteristics of food has resulted in increasing interest in the production methods and other attributes of meat products. According to previous studies especially food safety, domestic origin, organic production and animal welfare have been requested attributes of meat products. Several studies have highlighted the importance of allowing for consumer heterogeneity, but to the best of my knowledge there has been no research on the impact of the carbon footprint information on the choice of a meat product.
The aim of this thesis is to provide information on relative preferences of consumers for minced meat attributes, i.e. the product features that give them the greatest added value. To that end, the study examines whether the meat type (beef, pork, pork-beef), the method of production (conventional, organic, animal welfare-oriented and product safety and health-oriented production), the fat content of the product or the carbon footprint information have an impact on consumers’ choice of minced meat and whether these attributes have interaction effects on the choice. In addition, the heterogeneity of consumer preferences is assessed, in order to define possible consumer groups and to profile them based on their socio-demographic background and attitudes. Finally, this study produces relative willingness to pay estimates for particular products of interest in general and separately for the heterogeneous consumer classes.
The consumer preferences for minced meat attributes were measured through a choice experiment. The data were gathered with an online survey from 1623 consumers representative of Finnish Internet users. The choices were modelled using the conditional logit model and to allow for consumer heterogeneity the latent class model was used.
A low fat percentage was found to have generally a particularly positive effect on the choice of minced meat product. Among the methods of production, organic production had a larger positive effect on the choice compared to animal welfare-oriented as well as product safety and health-oriented production. Minced beef meat was preferred over both pork and mixed beef and pork meat. The carbon footprint had an impact on the meat type-specific consumer preferences: beef products have a larger carbon footprint than pork products and consequently their popularity decreased when the footprint information was presented to the consumers. Six heterogeneous consumer classes were identified from the data: price-conscious consumers (23% of the respondents), fat content-conscious (20%), concerned (17%), indifferent (17%) and beef-preferring consumers (13%), and finally a segment having highly positive preferences for responsible production methods (11%). The consumers were generally willing to pay more for a low fat content, but the relative willingness to pay estimates were largely dependent on the heterogeneous consumer groups. Consumer willingness to pay for carbon footprint information was not especially high, but the matter should be further examined in order to draw decisive conclusions.
Keywords: Consumer preferences, choice experiment, meat, willingness to pay, latent class analysis
AALTO-YLIOPISTON KAUPPAKORKEAKOULU TIIVISTELMÄ Kansantaloustiede, pro gradu – tutkielma 17.12.2010 Laura Koistinen
KULUTTAJIEN SUHTEELLISET PREFERENSSIT LIHATUOTTEIDEN OMINAISUUKSIEN SUHTEEN JA HIILIJALANJÄLKITIEDON VAIKUTUS KULUTTAJIEN VALINTAAN
Kasvanut huolestuneisuus muun muassa ruoan ympäristö- ja terveysvaikutuksista on lisännyt kuluttajien kiinnostusta elintarvikkeiden tuotantomenetelmistä ja muista ominaisuuksista. Aiempien tutkimusten mukaan erityisesti ruoan turvallisuus, luonnonmukainen tuotanto, eläinystävällisyys ja kotimaisuus ovat olleet toivottuja piirteitä lihatuotteilla. Useat tutkimukset ovat korostaneet kuluttajien heterogeenisuuden huomioimisen tärkeyttä, mutta hiilijalanjälkitiedon vaikutusta kuluttajien lihatuotteiden valintaan ei tietääkseni ole tutkittu.
Tämän tutkimuksen tarkoitus on tuottaa tietoa kuluttajien suhteellisista preferensseistä jauhelihatuotteiden ominaisuuksien suhteen, eli paljastaa mitkä tuoteominaisuudet luovat heille eniten lisäarvoa. Tämän tiedon tuottamiseksi tutkin ensinnäkin vaikuttavatko jauhelihan tyyppi (sika, sika-nauta ja nauta), tuotantotapa (tavanomainen, luonnonmukainen, eläinystävällinen ja tuoteturvallisuuteen ja terveyteen panostava), rasvaprosentti ja hiilijalanjälkitieto kuluttajien valintoihin ja onko näillä tuoteominaisuuksilla yhteisvaikutuksia kuluttajan valintahalukkuuteen. Toisekseen tutkin löytyykö kuluttajista preferenssiensä suhteen toisistaan poikkeavia ryhmiä ja miten nämä ryhmät eroavat toisistaan vastaajien taustatietojen (sosio-demografiat, kulutustottumukset, asenteet) perusteella. Viimeisenä tutkin kuinka paljon ominaisuudet vaikuttavat kuluttajan halukkuuteen maksaa erilaisista tuotteista ja kuinka maksuhalukkuus poikkeaa ryhmien välillä.
Kuluttajien suhteellisia preferenssejä mitattiin valintakokeella. Aineisto kerättiin internet- pohjaisella kyselylomakkeella, johon vastasi 1623 suomalaista. Valintoja mallinnettiin ehdollisella logistisella regressiolla (conditional logit model) ja kuluttajien heterogeenisuus huomioitiin käyttämällä latenttia luokkamallia (latent class model).
Matalalla rasvaprosentilla oli erityisen positiivinen vaikutus kuluttajien valintaan. Tuotantomenetelmistä luonnonmukaisella tuotannolla oli suurin positiivinen vaikutus verrattuna eläinystävälliseen, turvallisuuteen ja terveyteen panostavaan ja tavanomaiseen tuotantoon. Naudan jauhelihaa suosittiin enemmän kuin sika-naudan tai sian jauhelihaa. Hiilijalanjälkitiedolla oli selvä vaikutus lihatyypin valintaan: naudan jauhelihalla on suurempi hiilijalanjälki kuin sian jauhelihalla, mikä näkyi naudan jauhelihan suhteellisen suosittuuden pienenemisenä hiilijalanjäljen eksplisiittisen maininnan yhteydessä. Analyysissä paljastui kuusi toisistaan eroavaa kuluttajaluokkaa: hintatietoinen (23% vastaajista), rasvaprosenttitietoinen (20%), huolestunut (17%), indifferentti (17%), naudanlihaa arvostava (13%) ja tuotantotapatietoinen (11%) kuluttajaryhmä. Kuluttajat olivat valmiita maksamaan erityisesti matalasta rasvaprosentista, mutta heidän maksuhalukkuutensa hiilijalanjälkitiedolle ei ollut kovin suuri. Suhteellinen maksuhalukkuus vaihteli kuitenkin huomattavasti kuluttajasegmenttien välillä, ja esimerkiksi hiilijalanjälkitiedon vaikutusta valintoihin ja maksuhalukkuuteen tulisi selvittää vielä tarkemmin tulevissa tutkimuksissa.
Avainsanat: Kuluttajien suhteelliset preferenssit, valintakoe, liha, maksuhalukkuus, latent class – analyysi
TABLE OF CONTENTS
1 INTRODUCTION....................................................................................................................... 1 1.1 Background and motivation......................................................................................................................1 1.2 Aim of the thesis and the research questions.........................................................................................3 1.3 Research methods and key concepts .......................................................................................................3 1.4 Earlier studies on consumer preferences concerning food attributes ................................................5 1.5 Main findings of the thesis ........................................................................................................................7 1.6 Structure of the thesis.................................................................................................................................7
2 THEORETICAL BACKGROUND OF MODELLING CONSUMER CHOICE .....................8 2.1 Random utility model .................................................................................................................................8 2.2 Heterogeneity of consumer preferences ...............................................................................................10
3 STATED PREFERENCES AND ATTRIBUTE-BASED PREFERENCE MODELS ........... 12 3.1 Stated preference methods ......................................................................................................................12 3.2 Attribute-based methods and the choice experiment .........................................................................15
4 THE ECONOMETRIC MODELS ........................................................................................... 17 4.1 Conditional logit model ...........................................................................................................................17 4.2 Latent class model.....................................................................................................................................20 4.3 Model fit .....................................................................................................................................................26 4.4 Willingness to pay .....................................................................................................................................27
5 EMPIRICAL RESULTS FROM EARLIER STUDIES.............................................................28 5.1 Consumer preferences for product attributes of food........................................................................28 5.2 Consumer heterogeneity ..........................................................................................................................33
6 DATA AND EMPIRICAL METHODS..................................................................................... 41 6.1 Data description ........................................................................................................................................41 6.2 Survey design and choice of variables ...................................................................................................45 6.3 Statistical analysis ......................................................................................................................................47 6.3.1. Conditional logit analysis .........................................................................................................................49 6.3.2. Latent class analysis ..................................................................................................................................51 6.3.3. The willingness to pay estimates.............................................................................................................54
7 RESULTS....................................................................................................................................55 7.1 General choice patterns ...........................................................................................................................55 7.2 Consumer preferences for meat attributes............................................................................................57 7.3 Heterogeneous consumer segments ......................................................................................................62 7.4 Consumer willingness to pay for differentiated minced meat products...........................................73
8 DISCUSSION .............................................................................................................................77 8.1 Discussion of the results..........................................................................................................................77 8.2 Limitations of the research......................................................................................................................84
9 CONCLUSIONS ........................................................................................................................87
10 REFERENCES ..........................................................................................................................90
Appendix I Sociodemographic background of the respondents.........................................................................97
Appendix II Examples of the choice experiment sub-samples ...........................................................................99
Appendix III Attribute explanations for the respondents................................................................................. 100 Appendix IV Coding of the attributes and the interactions.............................................................................. 101
Appendix V Covariates and the survey questions............................................................................................... 103 Appendix VI Covariates of the consumer segments and their significances.................................................. 108
TABLES AND FIGURES Figure 1 Meat consumption in Finland 1998-2009 ………………………………………………….…2
Figure 2 Meat production in Finland 1990-2009……………………………………………………….2 Figure 3 Model of consumer choice and latent class membership…………………………………….11
Figure 4 Stated preference methods………………….……………………………………………….14 Figure 5 Product choice classification by the product attributes………………………………………56
Figure 6 Product choice classification by the carbon footprint mention………………………………57
Figure 7 Conditional logit model with and without interactions………………………………………59 Figure 8 Latent class model without interactions……………………………………………………...64
Figure 9 Latent class model with interactions: attribute coefficient plot………………………………67 Figure 10 Latent class model with interactions: interaction coefficient plot…………………………...67
Table 1 Covariates profiling the consumer segments…………………………………………………43 Table 2 Choice experiment…………………………………………………………………………...46
Table 3 Explanations of the attribute levels…………………………………………………………..47 Table 4 Conditional logit model statistics, models with and without interactions…………………….50
Table 5 Optimal conditional logit model statistics, model with interactions…………………………..51
Table 6 Conditional logit model statistics for the sub-sample data separately, model with interactions 51 Table 7 Statistics - Latent class models without interactions………………………………………….51
Table 8 Statistics - Latent class models with interactions …………………………………………….51 Table 9 Comparison of the 5 and 6 class model..……………………………………………………..52
Table 10 General response distribution………………………………………………………………56 Table 11 Conditional logit model without interactions……………………………………………….58
Table 12 Conditional logit model with interactions ………………………………………………….58
Table 13 Conditional logit model: Sub-sample with the carbon footprint level mentioned …………..61 Table 14 Conditional logit model: Sub-sample with the carbon footprint level not mentioned……….61
Table 15 Prediction table – Latent class model without interactions ………………………………....63 Table 16 Prediction table – Latent class model with interactions …………………………………….63
Table 17 Latent class model without interactions……………………………………………………..63
Table 18 Optimal latent class model with interactions.………..…………….…………………….…..65 Table 19 Marginal effects of the product attributes…………………………………………………...74
Table 20 Relative WTP estimates in the case of no carbon footprint information…………………….75 Table 21 Relative WTP estimates in the case of carbon footprint information………………………..77
1
1 Introduction
1.1 Background and motivation
Growing concern over environmental impacts and other credence characteristics of food has
resulted in increasing interest in the production methods, healthiness and other attributes of meat
products. According to previous studies especially food safety, the country of origin, organic
production and animal welfare have been particularly requested attributes for meat. Some of
these have been in the headlines of public discussion in Finland, as for instance certain animal
welfare organizations have published video and photographic material on the poor conditions of
animals in some Finnish pig, poultry and fox farms. Also the carbon footprint, a measure
describing the impact of greenhouse gas emissions on the climate, has become a popular subject.
At the same time, the meat industry in Finland faces an increasingly international and competitive
market, as the imports of meat have steadily increased during recent years
(Elintarviketeollisuusliitto, 2009).
It has been suggested that increased consumer consciousness has divided the food market into
heterogeneous segments as consumers have developed differing tastes and preference rankings
for the product attributes (Loureiro et al. 2006). As meat, in particular, is often sold as an
undifferentiated product (Napolitano, Caporale, Carlucci and Monteleone, 2006), the addition of
supplementary quality cues could be a profitable way for producers to differentiate their offerings
and thus gain a competitive advantage. Some Finnish producers have in fact already started to
promote their products and build their brand image on not using food additives in cold cuts,
which is a rather exceptional act on the market, clearly aiming to create a higher degree of
differentiation.
In order to develop a profitable differentiation strategy producers have to know the differing
needs and expectations of their customers. Several studies have been conducted in order to reveal
the preferences of consumers for food and meat attributes, and many of them have highlighted
the extent of heterogeneity in consumer preferences, as subgroups of consumers have been
found to differ in their valuations of product characteristics. Meat traceability attributes generally
seem to be of growing importance to consumers, who have been willing to pay, for instance, for
an orientation towards food safety and animal welfare in meat production (Cicia & Colantuoni,
2010). The consumers’ willingness to pay (WTP) indeed plays an important role in product
differentiation as production costs may notably increase due to investments in distinct product
attributes. Even providing information on product features is often costly. The modelling of the
2
product life cycle necessary to assess for example the carbon footprint information is very
expensive and resource demanding. Producers must thus have confirmation that consumers are
willing to pay a premium for enhanced traceability, as the price charged for the product must
naturally ensure the profitability of their business.
Meat is an important part of the Finnish diet. However, Finns consume less meat than
consumers in EU-15 countries on average: the annual amount of meat consumed per person in
Finland was 76 kg in 2007, whereas the average for the EU-15 countries was 95 kg. When
compared to the EU-27 countries, Finland was slightly less behind, as the annual average of the
27 countries was 91 kg. (Lihatiedotus, 2010.)
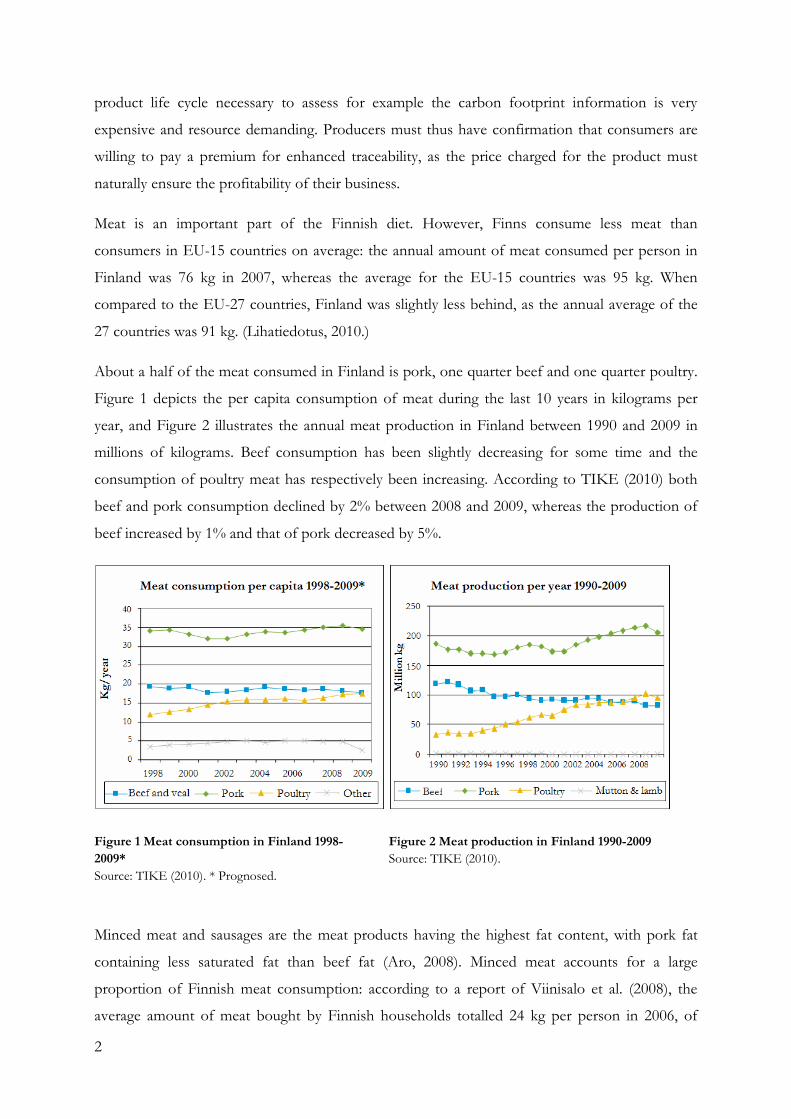
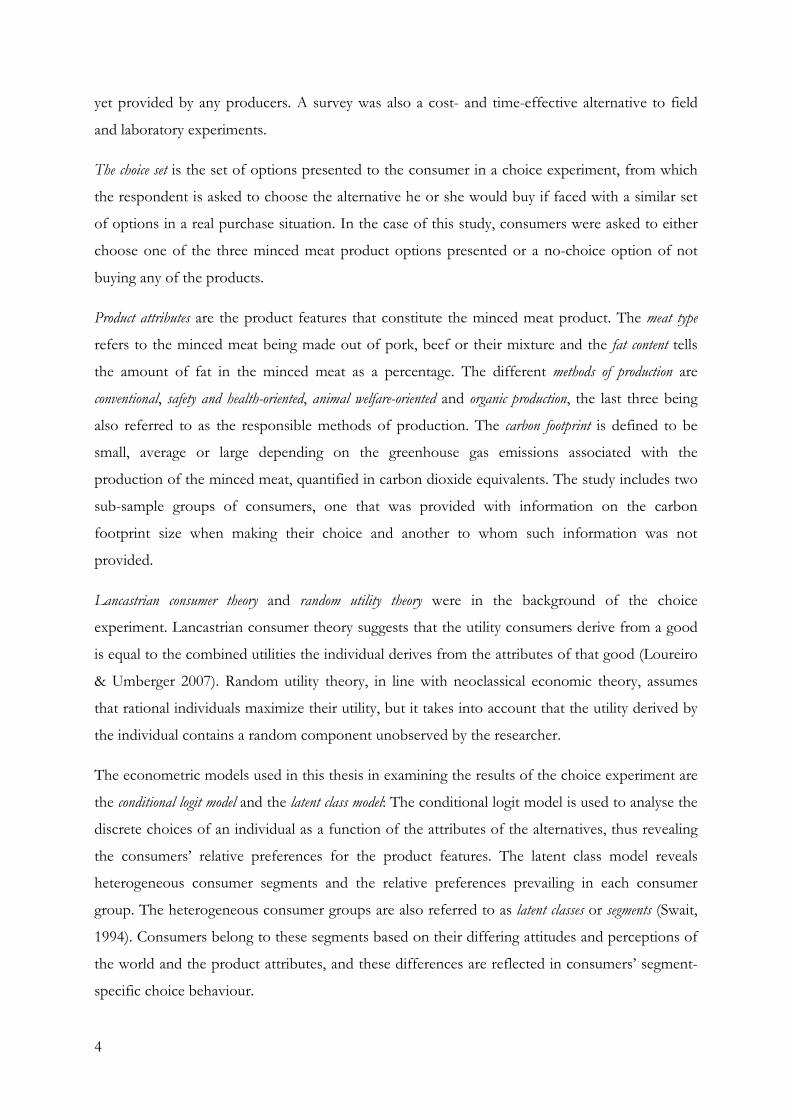
About a half of the meat consumed in Finland is pork, one quarter beef and one quarter poultry.
Figure 1 depicts the per capita consumption of meat during the last 10 years in kilograms per
year, and Figure 2 illustrates the annual meat production in Finland between 1990 and 2009 in
millions of kilograms. Beef consumption has been slightly decreasing for some time and the
consumption of poultry meat has respectively been increasing. According to TIKE (2010) both
beef and pork consumption declined by 2% between 2008 and 2009, whereas the production of
beef increased by 1% and that of pork decreased by 5%.
Figure 1 Meat consumption in Finland 1998-2009* Source: TIKE (2010). * Prognosed.
Figure 2 Meat production in Finland 1990-2009 Source: TIKE (2010).
Minced meat and sausages are the meat products having the highest fat content, with pork fat
containing less saturated fat than beef fat (Aro, 2008). Minced meat accounts for a large
proportion of Finnish meat consumption: according to a report of Viinisalo et al. (2008), the
average amount of meat bought by Finnish households totalled 24 kg per person in 2006, of

3
which 6 kg was minced meat. This represents 24% of all the meat product purchases. For
reference, 25% of purchased meat products consisted of jointed pork meat, 25% poultry meat
and 10% jointed beef meat1. The purchased amounts of minced meat and pork have declined
between 1998 and 2006, while the amounts of poultry, venison and other game meat have
respectively increased. Based on the same report, the consumption of minced meat and poultry
meat does not depend on the age group of the households but remains quite even. However, the
consumption of jointed beef and pork is greater in older age groups. (Viinisalo et al., 2008.)
1.2 Aim of the thesis and the research questions
The aim of this thesis is to provide information on the relative preferences of consumers for
minced meat attributes, i.e. the product features that give them the greatest added value. To that
end, this thesis examines whether the meat type (beef, pork, pork-beef), the method of
production (conventional, organic, animal welfare-oriented and product safety and health-
oriented production), the fat content of the product or information on the carbon footprint size
have an impact on the consumers’ choice of minced meat, and whether these attributes have
interaction effects on the choice. In addition, the heterogeneity of consumer preferences is
investigated in order to define possible consumer groups. These consumer segments are profiled
based on the socio-demographic background and the attitudinal factors of the consumers.
Finally, this study produces relative willingness to pay estimates for particular products of interest
in general and separately for the heterogeneous consumer classes.
By answering the above questions, the objective is to provide meat producers with information
on consumer preferences and on how to adapt and differentiate their production in order to
address to the existing demand in a competitive market.
1.3 Research methods and key concepts
This research is based on a survey modelling consumer preferences through a choice experiment.
The data were gathered with an online survey from 1623 consumers representative of Finnish
Internet users. The study is thus based on stated preferences instead of revealed preferences, as the
respondents answered the survey questions in a hypothetical choice situation and the data were
not based on actually realized purchase decisions. This choice was made due to the limitations in
existing product diversity available to consumers. For instance, few organic minced meat
products are currently available, and information on the carbon footprint of minced meat is not 1 Food eaten outside homes is not included in the figures, as the statistics only cover household purchases, so the
amounts are indicative of total consumption.
4
yet provided by any producers. A survey was also a cost- and time-effective alternative to field
and laboratory experiments.
The choice set is the set of options presented to the consumer in a choice experiment, from which
the respondent is asked to choose the alternative he or she would buy if faced with a similar set
of options in a real purchase situation. In the case of this study, consumers were asked to either
choose one of the three minced meat product options presented or a no-choice option of not
buying any of the products.
Product attributes are the product features that constitute the minced meat product. The meat type
refers to the minced meat being made out of pork, beef or their mixture and the fat content tells
the amount of fat in the minced meat as a percentage. The different methods of production are
conventional, safety and health-oriented, animal welfare-oriented and organic production, the last three being
also referred to as the responsible methods of production. The carbon footprint is defined to be
small, average or large depending on the greenhouse gas emissions associated with the
production of the minced meat, quantified in carbon dioxide equivalents. The study includes two
sub-sample groups of consumers, one that was provided with information on the carbon
footprint size when making their choice and another to whom such information was not
provided.
Lancastrian consumer theory and random utility theory were in the background of the choice
experiment. Lancastrian consumer theory suggests that the utility consumers derive from a good
is equal to the combined utilities the individual derives from the attributes of that good (Loureiro
& Umberger 2007). Random utility theory, in line with neoclassical economic theory, assumes
that rational individuals maximize their utility, but it takes into account that the utility derived by
the individual contains a random component unobserved by the researcher.
The econometric models used in this thesis in examining the results of the choice experiment are
the conditional logit model and the latent class model: The conditional logit model is used to analyse the
discrete choices of an individual as a function of the attributes of the alternatives, thus revealing
the consumers’ relative preferences for the product features. The latent class model reveals
heterogeneous consumer segments and the relative preferences prevailing in each consumer
group. The heterogeneous consumer groups are also referred to as latent classes or segments (Swait,
1994). Consumers belong to these segments based on their differing attitudes and perceptions of
the world and the product attributes, and these differences are reflected in consumers’ segment-
specific choice behaviour.
5
1.4 Earlier studies on consumer preferences concerning food attributes
Choice experiment studies assessing consumer preferences for food attributes have become a
common line of research in recent years in the American and European contexts, but similar
research in the Finnish market is relatively scarce. Foodstuffs that have been examined include
products ranging from bread (Hu et al. 2004) and meat (Becker et al., 2000; Cicia and Colantuoni
2010; Loureiro and Umberger 2007; Lusk et al., 2003; Tonsor et al., 2005) to beverages such as
wine (Mtimet & Albisu, 2006). The product characteristics examined in previous research have
also been diverse. For instance Pouta et al. (2010) conducted a study on Finnish consumer
preferences for broiler fillets focusing on attributes concerning the production methods from
organic production to animal welfare and consumer health-oriented production, as well as the
importance of a country of origin label and of seasoning. They analysed aggregate preferences
with a conditional logit model and accounted for preference heterogeneity by using a latent class
model. The country of origin was found to be the most important product attribute, followed by
animal welfare-oriented production.
Traceability attributes generally seem to be of growing importance to consumers, and food safety
and animal welfare-oriented production methods seem to be highly valued (Cicia & Colantuoni,
2010). The impact of the country of origin on food choice has been widely examined and
revealed to be a relatively dominant attribute. Similarly to the findings of Pouta et al. (2010) the
country of origin was the most important attribute in Schnettler et al. (2009) and Bernués et al.
(2003a), followed by animal welfare-oriented and environmental production. Consumers have
actually been suggested to attach multiple quality cues to the country of origin of food, partly due
to the attribute’s dominant role in consumer choice (Pouta et al., 2010; Becker et al., 2000).
As mentioned above, animal welfare has been revealed to have a positive impact on the
consumer perception of meat products (Cicia and Colantuoni, 2010; Maria, 2006; Napolitano et
al., 2007; Schnettler et al., 2009), although according to some studies consumers were yet not
ready to pay notably more for having information on this product feature, despite their positive
preferences (Maria, 2006; Schnettler at al., 2009). Consumers have also been found to favour
organic production quite highly, but their willingness to pay for it has varied (Pouta et al., 2010;
Teratanavat and Hooker, 2006). There has been little if any research on the impact of carbon
footprint information on the food choice of consuers, although in the context of leisure air travel
consumers have been found to be willing to pay for carbon offsets (MacKerron et al., 2009).
Health-oriented food attributes have been appreciated in several studies focusing on food safety-
oriented production methods and weight control-related features (Gracia and Magistris, 2008;
6
Hearne and Volcan, 2005; Loureiro and Umberger, 2007), although in some studies their
importance has also been lower than that assigned, for example, to animal welfare and organic
production (Pouta et al., 2010). Cicia and Colantuoni (2010) concluded in their meta-analysis that
food safety, on-farm traceability or country of origin, and animal welfare were especially
important meat characteristics.
Many studies have gone beyond the conditional logit model in trying to account for heterogeneity
in consumer preferences, and the latent class model used in this study has been a common means
of analysis. Pouta et al. (2010), also using the latent class model, identified four consumer
segments having different preferences for broiler fillets: The group including the majority of
respondents (62%) had strong preferences for domestic products, whereas another group
comprising 16% of the consumers preferred unseasoned products of both domestic and Danish
origin, and also somewhat highly valued animal welfare-oriented and organic production. One
consumer group containing 12% of the respondents was price-conscious and preferred seasoned
products, and the last group comprising 9% of the consumers was indifferent to the price and the
seasoning, but had highly positive preferences for organic and animal welfare-oriented
production. Nilsson et al. (2006), on the other hand, found three consumer segments in their
study on certified pork chops: the smallest group was concerned with the product attributes or
the environmental, animal welfare-oriented and antibiotic-free certifications. The second largest
group (41% of consumers) was price-conscious and had positive preferences for brand
parameters, and the largest group (43%) consisted of concerned consumers who were interested
in the certifications but bought conventional brand products if the premiums for the
certifications were too high. Roininen et al. (2001) investigated differences in the tastes and health
attitudes of Finnish, Dutch and British consumers in the food choice process, discovering that
Finnish consumers were slightly more health-oriented and had higher positive preferences for
low-fat products than Dutch or British consumers, who placed higher value on pleasure.
Pouta et al. (2010) found that socio-economic factors did not clearly differentiate consumer
segments with gender, age and geographical variables being significant, but that the attitudinal
factors were more descriptive. Gracia and Magistris (2008) also concluded that socio-
demographic characteristics had only a limited impact on the choice of organic food, but that
income seemed to be the main factor limiting a larger expansion of organic demand due to the
higher price of organic products. Consumers’ attitudes generally seem to predict stated behaviour
well (Kornelis at al., 2010; Lindeman & Stark, 1999; Roininen et al., 2010; Teratanavat & Hooker,
7
2006) although sometimes, as in the case of animal welfare orientation, the preferences of
consumers have been revealed to differ from their realized behaviour.
1.5 Main findings of the thesis
The results of this study suggest that especially a low fat content may serve as a good means to
differentiate minced meat products in Finland. Finnish meat processors and producers could
make good use of segmentation, as particular segments are also willing to pay significant
premiums for organic and to some extent animal welfare-oriented production. The product
offerings should probably be kept simple: the results suggest that multiple characteristics might in
some cases erode each others’ impacts on preferences and the premiums consumers are willing to
pay. The carbon footprint was not revealed to be a product feature for which consumers would
have a high WTP, although the results suggest that the footprint information facilitated
consumers’ choice between differing products. The possibilities for differentiation that are
provided by the carbon footprint information should thus be further examined.
The age, gender, income and attitudes of consumers among other factors seemed to explain their
choices to some extent, and the membership of environmental and animal welfare organizations
and living in the metropolitan area could also be used in determining potential market segments
to whom offer differentiated products. However, a concerned consumer group that did not
behave as could have been predicted based on their attitudes and organizational membership was
also found. The discovery of this segment supports earlier findings that the higher price of, for
example, organic goods could be a factor standing between consumers’ attitudes and their
purchase behaviour.
The relatively low importance of price to the consumer segments may be related to hypothetical
bias caused by the theoretical setting of the choice experiment. On the other hand it may also be
a signal that there could be a potential for gains from greater differentiation of minced meat
products than is currently put to use. It would be interesting to run a similar analysis with
revealed preference data in order to examine the scale of the hypothetical bias in the estimates,
and to be able to draw more definitive conclusions on consumer preferences and their
willingness to pay for differentiated minced meat products.
1.6 Structure of the thesis
This thesis is divided into ten chapters, including the references. The first five chapters comprise
the theoretical part of the thesis. Chapter 2 presents the theoretical background of the choice
experiment model, or the random utility model, and the framework behind the idea of
8
heterogeneous consumer preferences and their analysis. Chapter 3 first addresses the issue of
stated preferences in consumer research and then presents the attribute-based consumer
preference models, including the choice experiment method used in this study. Chapter 4
thoroughly examines the econometric models employed in the statistical analysis, namely the
conditional logit and latent class models, their model fit measures and the calculation of the
willingness to pay estimates. Chapter 5 presents some earlier empirical studies carried out on
similar subjects, first reviewing research on general preferences and then on preference
heterogeneity.
Chapter 6 begins the empirical part of the study with a description of the data used in the
analysis, the survey design and the steps in the statistical analysis. Chapter 7 reports the results of
the choice experiment, again starting from the general consumer preferences and moving
forwards to describe the heterogeneous consumer segments and the willingness to pay estimates
for both. The results are discussed in chapter 8, reflecting them in earlier findings, and the
limitations of the study are considered before drawing the final conclusions in chapter 9. Chapter
10 contains the references.
2 Theoretical background of modelling consumer choice
2.1 Random utility model
Consumer demand analysis incorporates models of discrete choice in addition to the more
traditionally examined continuous choices: discrete choice models are common and parsimonious
methods for demand analysis, although they impose some restrictions on behaviour (Berry, 1994;
Hanemann, 1984). Neoclassical economic theory assumes that the utility function of the
individual enables him to rank different alternatives in a consistent manner and to select the
option providing him with the highest utility. Under such an assumption the individual’s
preferences are presumed to be reflexive, complete, transitive, continuous and strongly
monotonic. (Anderson et al., 1992, 13; Burkett 2006, 101-105.) The neoclassic postulations
suggest that individuals have the competence to make discriminating rankings and the capability
to process information flawlessly, which has been criticized as being an unrealistic approach to
modelling human behaviour (Anderson et al., 1992, 17-18). It is, however, acknowledged that
individuals may make decisions that do not maximize their utility: this behaviour may result from
errors in perception resulting from the lack of information or discounting inability, market
failures such as price structures that do not reveal the real costs of production for the society, or
limitations in the set of products available to them (Tiffin et al., 2006). In reality, consumers are
9
influenced by an even larger variety of factors causing inconsistency in their choices and making
them encounter uncertainty. This has created the need for probabilistic choice analysis that treats
consumers as stochastically behaving utility maximizing decision makers (Anderson et al., 1992,
13). The probabilistic approach leads to a model called the random utility model, where the
researcher is assumed to be imperfectly able to model the individual’s utility function.
The economic foundations of attribute-based and choice experiment models are in Lancastrian
consumer theory and random utility theory. Psychological theories, especially on information
processing in judgement and decision making, have also influenced their development (Jaffry et
al. 2004).
Lancastrian consumer theory suggests that the utility consumers derive from a good is actually
equal to the combined utilities the individual derives from the attributes of that good (Loureiro &
Umberger 2007; Lusk et al., 2003). Random utility theory is based on the assumption that rational
individuals select the alternative that yields them the highest utility given the constraints. Based
on these two theories, one can state that the individual’s choice between two or more goods
described by their attributes reveals his relative preferences for these attribute levels.
Random utility theory models the utility the consumer derives from a good by dividing it into a
deterministic and a random component as follows:
Uni = Vni+ eni= βXni + eni, (1)
where Uni is the utility that individual n obtains from good i and Vni is the deterministic and
observable part of this utility, which is related to the attributes of the good (Adamowicz et al.,
1998a). The term eni is the error term, or the random part of the utility, that is unobservable to
the researcher (Bateman et al. 2002, 278-280; Holmes & Adamowitz 2003, 189). It may result,
among others, from measurement errors, misspecification of the utility function, missing
attributes, and inattentiveness or fatigue of the respondent during the choice experiment
(Adamowicz et al. 1998a; Anderson et al. 1992).
The deterministic component Vni of function (1) is further characterised as the vector Xni of the
exogenous attributes times the vector of the coefficients β for the attributes, and is assumed to be
linear in parameters (Adamowicz et al., 1998a; Bateman et al., 2002, 282). Thus, this utility
formulation allows consumers’ choices to reveal their trade-offs between different attributes of
the goods. The interaction effects of the attributes can be added to the model using a term
βkm Xkni Xmni, which captures the impact of interactions through the coefficient vector βkm which
10
now measures the joint effect of attributes k and m for the consumer’s utility. (Holmes &
Adamowitz, 2003, 189.)
A major advantage of the random utility model is that it represents consumer preferences in a
relatively realistic way, as it takes into account the unpredictability of behaviour. Consequently, as
the error term is unobservable to the researcher, the predictions are made with uncertainty. This
leads to the perceiving of utility as a random variable and to performing a probabilistic choice
analysis, where the individual makes a choice between goods i and j depending on the resulting
utility levels (Bateman et al., 2002, 279). The individual chooses good i provided that the
condition
U(i) > U(j) is fulfilled. From the viewpoint of the researcher, the conditional probability that
individual n prefers good i with attributes over j in a choice set B is:
Pn(i) = P i [(Vni + eni) > (Vnj + enj)] = P i [(Vni – Vnj) > (enj - eni)], i, j є B (2)
so the decision depends on whether the difference in the utilities of the deterministic
components is greater than the difference in the stochastic components. (Baltas & Doyle 2001;
Bateman et al., 2002, 279-280; McFadden, 1974.) By making certain assumptions on the error
term distributions this choice probability can be modelled in a logistic form and the econometric
preference analysis can be conducted using the multinomial conditional logit model. This
econometric analysis is described further in chapter 4.
2.2 Heterogeneity of consumer preferences
Consumer preferences are often measured at the aggregate level, as in the conditional logit
model, which assumes the homogeneity of tastes. Incorporation of heterogeneity in the
consumers’ preference structure allows for a more refined and presumably truthful description of
preferences.
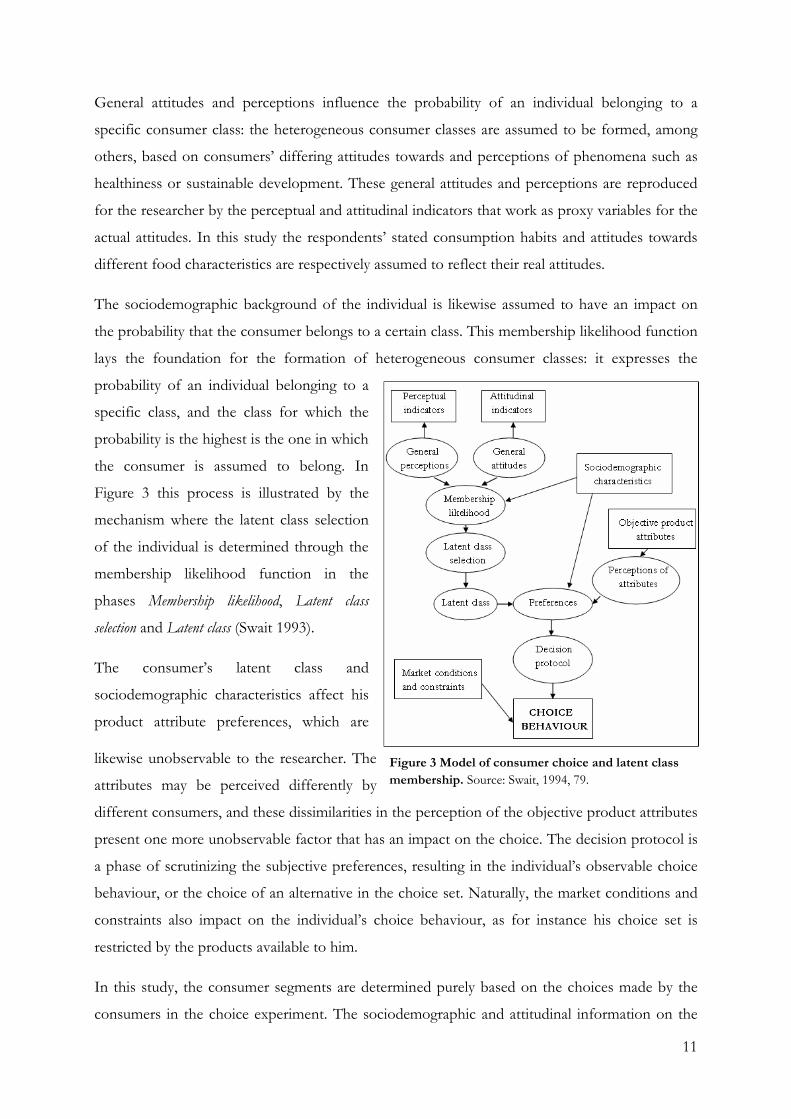
Swait (1994) described the consumer’s choice problem through a framework depicted in Figure 3.
This outline is similar to the framework of the latent class model used in this research to account
for heterogeneity, as it simultaneously considers the preferences of the consumers and the
differing consumer classes that divide the population into heterogeneous groups. The factors in
the rectangles represent the choice variables the researcher is able to observe and the variables in
the ellipses are invisible to the researcher. All of these factors influence the utility the consumer
derives from choosing a particular good.
11
General attitudes and perceptions influence the probability of an individual belonging to a
specific consumer class: the heterogeneous consumer classes are assumed to be formed, among
others, based on consumers’ differing attitudes towards and perceptions of phenomena such as
healthiness or sustainable development. These general attitudes and perceptions are reproduced
for the researcher by the perceptual and attitudinal indicators that work as proxy variables for the
actual attitudes. In this study the respondents’ stated consumption habits and attitudes towards
different food characteristics are respectively assumed to reflect their real attitudes.
The sociodemographic background of the individual is likewise assumed to have an impact on
the probability that the consumer belongs to a certain class. This membership likelihood function
lays the foundation for the formation of heterogeneous consumer classes: it expresses the
probability of an individual belonging to a
specific class, and the class for which the
probability is the highest is the one in which
the consumer is assumed to belong. In
Figure 3 this process is illustrated by the
mechanism where the latent class selection
of the individual is determined through the
membership likelihood function in the
phases Membership likelihood, Latent class
selection and Latent class (Swait 1993).
The consumer’s latent class and
sociodemographic characteristics affect his
product attribute preferences, which are
likewise unobservable to the researcher. The
attributes may be perceived differently by
different consumers, and these dissimilarities in the perception of the objective product attributes
present one more unobservable factor that has an impact on the choice. The decision protocol is
a phase of scrutinizing the subjective preferences, resulting in the individual’s observable choice
behaviour, or the choice of an alternative in the choice set. Naturally, the market conditions and
constraints also impact on the individual’s choice behaviour, as for instance his choice set is
restricted by the products available to him.
In this study, the consumer segments are determined purely based on the choices made by the
consumers in the choice experiment. The sociodemographic and attitudinal information on the
Figure 3 Model of consumer choice and latent class membership. Source: Swait, 1994, 79.
12
consumers is used only posterior to the statistical analysis in order to describe the heterogeneous
consumer classes, although their latent attitudes and perceptions prevail in their stated choice
behaviour in line with this framework.
The above choice process framework illustrates the importance of accounting for heterogeneity
in consumer preference studies, which is a strong tendency in recent research, as described more
thoroughly in chapter 5. A major difference within the approaches incorporating heterogeneity is
their positioning towards the source of heterogeneous preferences. Some statistical models
require consumers to be grouped based on prior assumptions of the reasons for their
heterogeneity, for instance nationality or age, whereas others allow for the source to be
determined during the analysis, based on the choices made by the consumers. The condition to
predetermine the nature of the heterogeneity is very restrictive, as researchers do not always have
sufficient knowledge on the matter.
3 Stated preferences and attribute-based preference models
3.1 Stated preference methods
Stated preference approaches seek to reveal how respondents value goods presented to them in
different hypothetical scenarios (MacKerron et al., 2009). They are very common in the field of
environmental valuation (Birol et al., 2006; Hanley et al., 2001) and other large scale assessments
concerning different social policy issues. Stated preference methods differ from revealed
preference methods in that the choice situations are hypothetical and the data obtained are
expressed preference data, or the individuals’ statements on how they would act in a similar real-
life situation. In revealed preferences methods, however, the data are market or other data
containing observations of actually realized behaviour.
The hypothetical characteristics of stated preference methods give rise to limitations that need to
be carefully considered: many economists have stated their doubts on the capability and
willingness of individuals to give truthful and accurate answers, which leads to questionable
validity of the results. For instance Kemp et al. (2010) undertook a study on the impact of food
miles or product origin on consumers’ purchase decisions by using both stated and revealed
preference methods: they found that the preferences stated by the consumers gave a clearly
biased impression of the actual purchase behaviour recorded in the revealed preferences part of
the research.
13
This effect can, however, be partly avoided by good survey design. For instance, the number of
choice sets presented to the respondent in choice experiments may have a significant effect on
the responses and thus the results (Hanley, Wright and Koop, 2000; Hanley et al., 2001). In
addition the type of method has been found to matter – the results may differ depending on
whether the model used is a choice experiment or a ranking model. The validity of the willingness
to pay estimates can be evaluated by checking whether the results are in line with actual
behavioural observations revealed by other studies (Brown 2003, 103-104). However, in many
types of studies, there might not be reasonable references for revealed preferences if the object of
the preferences is not for instance available at the market place.
According to Adamowicz et al. (1994), stated preference methods would serve as a useful tool in
improving estimates generated in revealed preference studies. Using both stated and revealed
preference methods in a complementary manner would clearly be ideal in consumer studies, as
the scale of the hypothetical bias present in the former would then be tested and the limitations
of the latter would be supplemented with the flexibility of the stated preference methods. Mark
and Swait (2004) conducted a study using both stated and revealed preferences methods in the
context of health economics and physicians’ prescription choices. They concluded that the stated
preference methods would describe actual behaviour somewhat in line with revealed preference
methods, at least in the context of their study. The meta-analysis of Cicia and Colantuoni (2010)
on consumers’ WTP for meat traceability also suggested that the non-hypothetical setting of the
WTP studies did not have a significant impact on the WTP estimates, even though the sign of the
coefficient was negative, suggesting that the influence of non-hypothetical research situations, if
existing, would be negatively proportionate to the WTP premiums (Cicia & Colantuoni, 2010).
However, various studies presenting contradictory findings to Kemp et al. (2010) have also been
published. For instance, Maria (2006) found that consumers’ positive preferences and WTP for
improving animal welfare on the farms were not consistent with actual consumption. Chang et al.
(2009) also concluded that preference estimates based on non-hypothetical settings are better
approximates of real behaviour than hypothetical ones.
The hypothetical setting of a stated preference study nevertheless offers possibilities that are
unachievable with revealed preferences methods, as it enables, for instance, the description and
examination of new products and limiting of the choice set available for the individual (Brown
2003, 100). When the behavioural data available have limitations, as in the case of this study, the
use of stated preference methods is, according to Holmes and Adamowicz (2003, 171), well-
grounded: minced meat products do not yet have carbon footprint labels in the Finnish market,
14
nor are there minced meat products whose production is oriented towards safety and healthiness
or animal welfare. The availability of organic minced meat is also limited in grocery stores.
Stated preference methods can be divided into direct and indirect methods, where the former
include techniques that provide the researcher with estimates of monetary value. The latter
approaches only indicate preferences, including response techniques using ranking, rating and
choice, out of which the monetary valuations can then be derived by including further steps in
the analysis (Brown 2003, p.102). Brown (2003, 101-103) classified the stated preference methods
into contingent valuation, paired comparison and attribute-based methods. The last of these
includes the choice experiment, contingent ranking and contingent rating methods, and is in line
with Holmes and Adamowicz’s (2003, p. 174) categorization. Bateman et al. (2002, 30) and
Hanley et al. (2001) used the header of choice modelling techniques to encompass the paired
comparison, choice experiment, contingent ranking and contingent rating. Combining these two
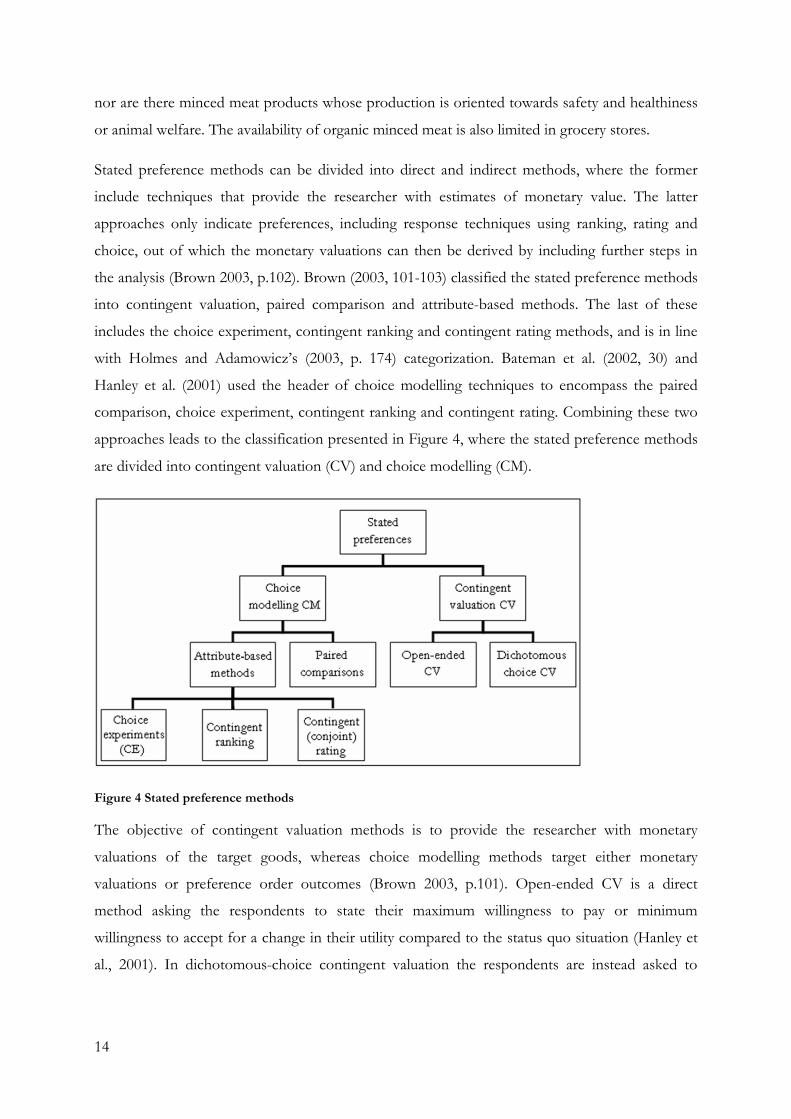
approaches leads to the classification presented in Figure 4, where the stated preference methods
are divided into contingent valuation (CV) and choice modelling (CM).
Figure 4 Stated preference methods
The objective of contingent valuation methods is to provide the researcher with monetary
valuations of the target goods, whereas choice modelling methods target either monetary
valuations or preference order outcomes (Brown 2003, p.101). Open-ended CV is a direct
method asking the respondents to state their maximum willingness to pay or minimum
willingness to accept for a change in their utility compared to the status quo situation (Hanley et
al., 2001). In dichotomous-choice contingent valuation the respondents are instead asked to
15
choose whether they would accept or reject a fixed price for a certain product (MacKerronet al.
2009).
According to Hanley et al. (2001, 436), the open-ended and dichotomous contingent valuation
models have been found to lead to significantly different results. This might indicate that
respondents are tempted to take an “easy way out” solution and agree with paying the values
suggested to them, even though their own suggestions would be lower. On the other hand, open-
ended CV has in particular been accused of causing the respondents a cognitive burden, and
according to Hanley et al. (2001), neither method conforms well to multidimensional changes in
the target goods.
Choice modelling (or conjoint analysis) techniques partly respond to the above-mentioned
problems. In a paired comparison the respondent is asked to choose the preferred good from
two alternatives (Brown 2003, p. 102), whereas the attribute-based methods model consumer
preferences for similar goods that differ in the levels of their common attributes: they allow for
the estimation of the preference order of the attributes as well as welfare measures such as the
willingness to pay for various types of goods. The latter is enabled by adding a price attribute to
the product features and the random utility function. (Brown 2003, 101; Hanley et al. 2001;
Holmes and Adamowicz 2003, 174.) Attribute-based methods are further described in the
following chapter.
3.2 Attribute-based methods and the choice experiment
Attribute-based methods can be either binary or multinomial, meaning that respondents can be
asked to choose between, rank or rate two or multiple items. The choice experiment, in
particular, can be used in survey studies such as this thesis, but it is also utilizable in the context
of laboratory or field experiments.
A choice experiment consists of several choice sets with two or more alternative goods that are
presented to the respondent. The alternatives are typically goods that differ in the levels of their
attributes: for instance their price, fat content or carbon footprint size can be different. The
consumer is then asked to choose one of the alternative goods or a possible no-choice option.
This no-choice option gives the respondent the possibility to choose not to buy any of the goods
presented in the choice set and it improves the realism of the choice situation as the respondents
are not forced to choose any of the options (Hanley et al., 2001; Vermeulen et al., 2008). This
allows choice experiments to be consistent with utility maximization theory, and the welfare
measures and parameter estimates to be consistent with demand theory (Birol et al., 2008). Each
16
respondent faces several choice sets presenting different combinations of different alternatives.
The choices made between the alternatives reveal consumers’ relative implicit preferences for the
particular attributes according to random utility theory.
The cognitive burden faced by the individual is, according to Hanley et al. (2001), the main
disadvantage of attribute-based methods, causing potential increases in the random error terms
compared to CV. The estimation of willingness to pay becomes more difficult if the good being
valued is complex and unfamiliar to the individual (Brown, 2003), and in such cases learning
effects, respondent fatigue and the use of rules of thumb in answering may arise. Complex choice
sets may also lead to the choice of satisfying rather than utility-maximizing options (Hanley et al.,
2001). The problem of hypothetical bias can be seen as being less important for choice
experiments than contingent valuation methods (Bateman et al., 2002, 74) but as few studies have
actually have tested this phenomenon, Hanley et al. (2001) stated that the claim can scarcely be
made – at least not with certainty. According to MacKerron et al. (2009), hypothetical bias also
more probably arises in the case of less knowledgeable respondents or if the monetary valuations
are large instead of small. In the case of minced meat products, this last reason is hardly relevant,
although the issue of hypothetical bias does prevail as long as no money transfers occur.
The respondents may in addition answer strategically, which might bias the resulting coefficients
(Brown, 2003, 105): some might, for instance, favour goods with animal welfare-oriented
production in a dominating way, independently of the price attached to them. They might in such
a cases try to encourage favourable policies through the study, even though, in reality they would
not be willing to pay such sums for products oriented towards animal welfare. Likewise, some
respondents might try to answer in line with socially desirable behaviour and norms, and in such
a manner bend their answers from their true preferences.
The advantages of attribute-based methods and choice experiments include the possibility to
derive a valuation for each attribute level and to present several alternatives to the respondent at
the same time, so the choice situation resembles the one individuals face in real purchase
situations (MacKerron et al. 2009). As attribute-based techniques are multidimensional in that
several attribute levels may be varied simultaneously, they generate a richer portrayal of
preferences than contingent valuation methods (Holmes and Adamowicz 2003, 172). Also, as
choice modelling techniques do not involve explicitly asking for monetary valuations and the
willingness to pay measures are thus derived indirectly, some of the challenges of CV may be
alleviated: the task may be easier for the respondents to understand (Bateman et al. 2002, 74) and,
17
for instance, conformation to the presented option may be lower (Hanley et al. 2001), potentially
reducing the magnitude of hypothetical bias.
4 The econometric models
4.1 Conditional logit model
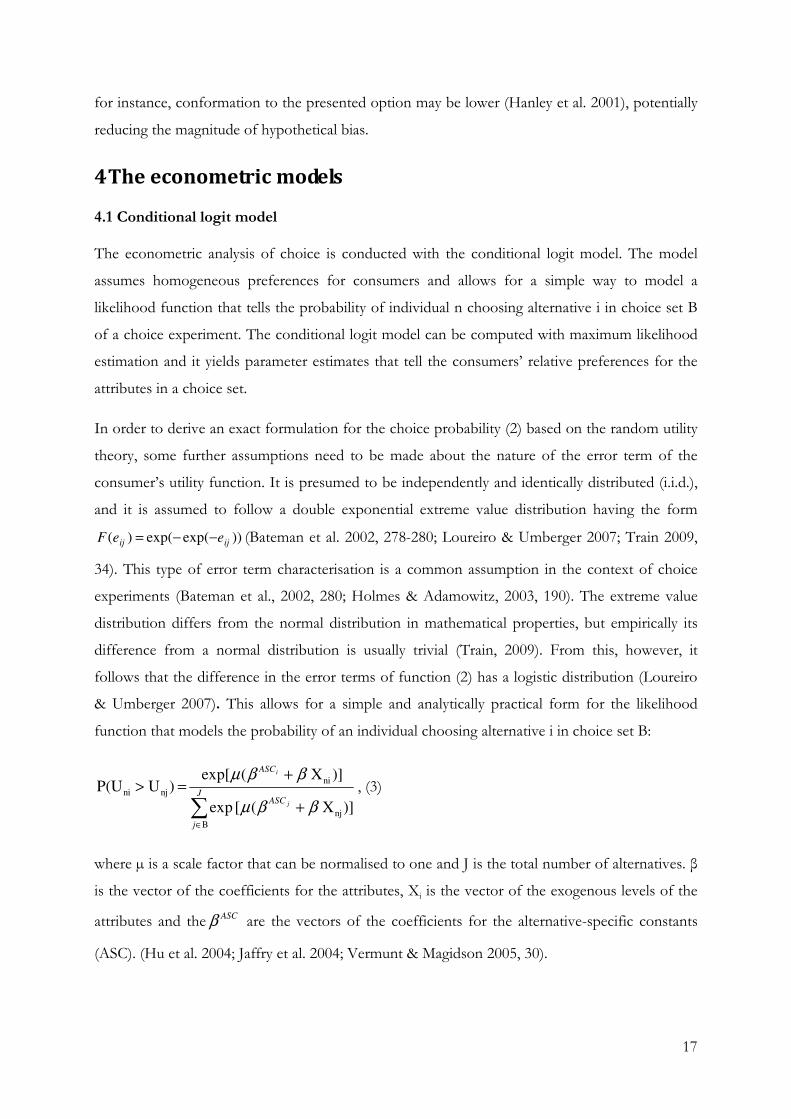
The econometric analysis of choice is conducted with the conditional logit model. The model
assumes homogeneous preferences for consumers and allows for a simple way to model a
likelihood function that tells the probability of individual n choosing alternative i in choice set B
of a choice experiment. The conditional logit model can be computed with maximum likelihood
estimation and it yields parameter estimates that tell the consumers’ relative preferences for the
attributes in a choice set.
In order to derive an exact formulation for the choice probability (2) based on the random utility
theory, some further assumptions need to be made about the nature of the error term of the
consumer’s utility function. It is presumed to be independently and identically distributed (i.i.d.),
and it is assumed to follow a double exponential extreme value distribution having the form
))exp(exp()( ijij eeF −−= (Bateman et al. 2002, 278-280; Loureiro & Umberger 2007; Train 2009,
34). This type of error term characterisation is a common assumption in the context of choice
experiments (Bateman et al., 2002, 280; Holmes & Adamowitz, 2003, 190). The extreme value
distribution differs from the normal distribution in mathematical properties, but empirically its
difference from a normal distribution is usually trivial (Train, 2009). From this, however, it
follows that the difference in the error terms of function (2) has a logistic distribution (Loureiro
& Umberger 2007). This allows for a simple and analytically practical form for the likelihood
function that models the probability of an individual choosing alternative i in choice set B:
∑∈
+
+=>
J
j
ASC
ASC
j
i
B
nj
ni
njni
)]X([ exp
)]X(exp[ )U P(U
ββµ
ββµ, (3)
where µ is a scale factor that can be normalised to one and J is the total number of alternatives. β
is the vector of the coefficients for the attributes, Xi is the vector of the exogenous levels of the
attributes and the ASCβ are the vectors of the coefficients for the alternative-specific constants
(ASC). (Hu et al. 2004; Jaffry et al. 2004; Vermunt & Magidson 2005, 30).
18
The alternative-specific constants are included in the model in order to consider the utility
associated with the no-choice alternative: they indicate the utility derived from the four
alternatives so that there is a constant for each option (Adamowicz et al., 1998b; Mtimet &
Albisu, 2006). In general, the ASCs are used to capture the effect of factors that are left outside
the model but have a systematic impact on the utility (Adamowicz et al. 1998b; Kasenius 2010).
Rather many studies have actually been conducted without including alternative-specific
constants in the model, but this may lead to biased estimates for the other parameters (Hoyos
2010). Adamowicz et al. (1998b) noted that the ASC estimates can be seen as reflecting the status
quo bias or the endowment effect, or for instance doubts in the real-life materialization of the
attribute levels that are promised for the alternatives. The ASCs may also reflect the cognitive
burden of the respondent or uncertainty in the trade-offs between the alternatives.
When the above assumptions hold and the dependent variables take more than two values, the
economic model employed is a multinomial conditional logit model. (Bateman et al. 2002, 278-
280; McFadden 1974.) It is an extension of the general multinomial logit model, which
formulates the expected utilities in terms of the individuals’ characteristics. In the conditional
logit model the expected utilities are instead a function of the attributes k of the alternatives.
(Jaffry et al. 2004.)
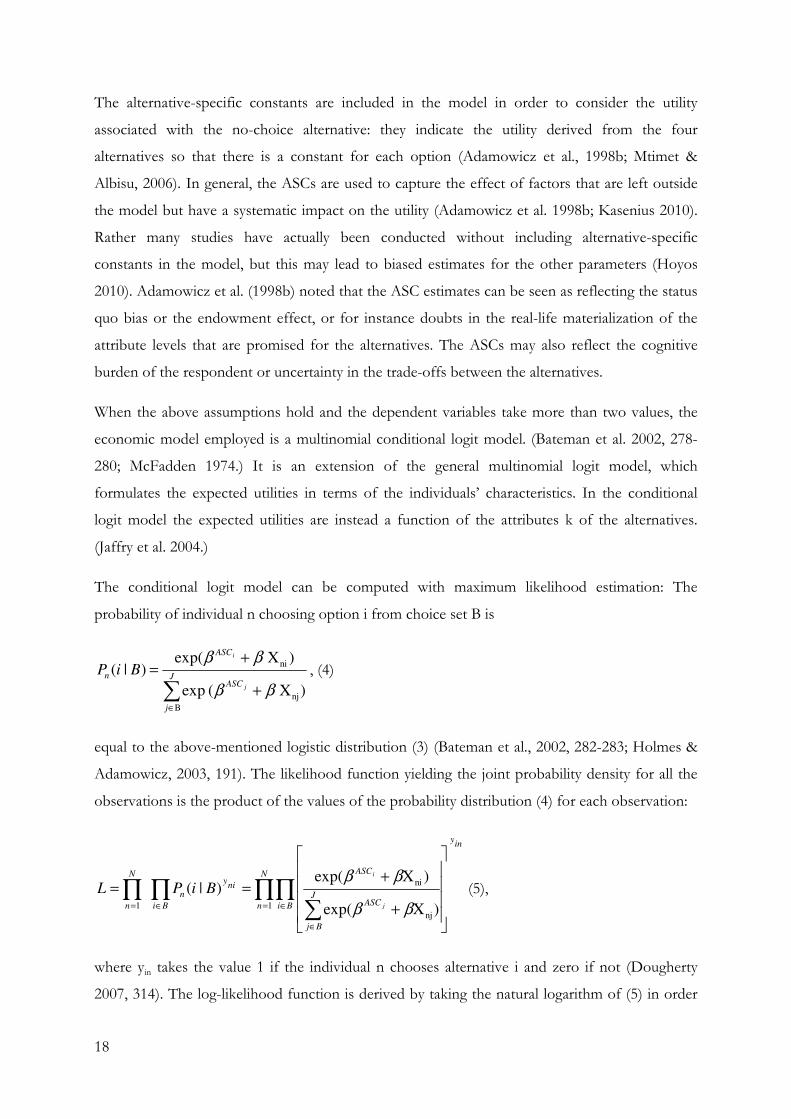
The conditional logit model can be computed with maximum likelihood estimation: The
probability of individual n choosing option i from choice set B is
∑∈
+
+=
J
j
ASC
ASC
n
j
i
BiP
B
nj
ni
)X( exp
)Xexp( )|(
ββ
ββ, (4)
equal to the above-mentioned logistic distribution (3) (Bateman et al., 2002, 282-283; Holmes &
Adamowicz, 2003, 191). The likelihood function yielding the joint probability density for all the
observations is the product of the values of the probability distribution (4) for each observation:
iny
N
n Bi
J
Bj
ASC
ASC
Bi
niy
n
N
n j
i
BiPL ∏∏∑
∏∏= ∈
∈
∈=
+
+==
1nj
ni
1 )Xexp(
)Xexp()|(
ββ
ββ(5),
where yin takes the value 1 if the individual n chooses alternative i and zero if not (Dougherty
2007, 314). The log-likelihood function is derived by taking the natural logarithm of (5) in order
19
0log
=knd
Ld
β
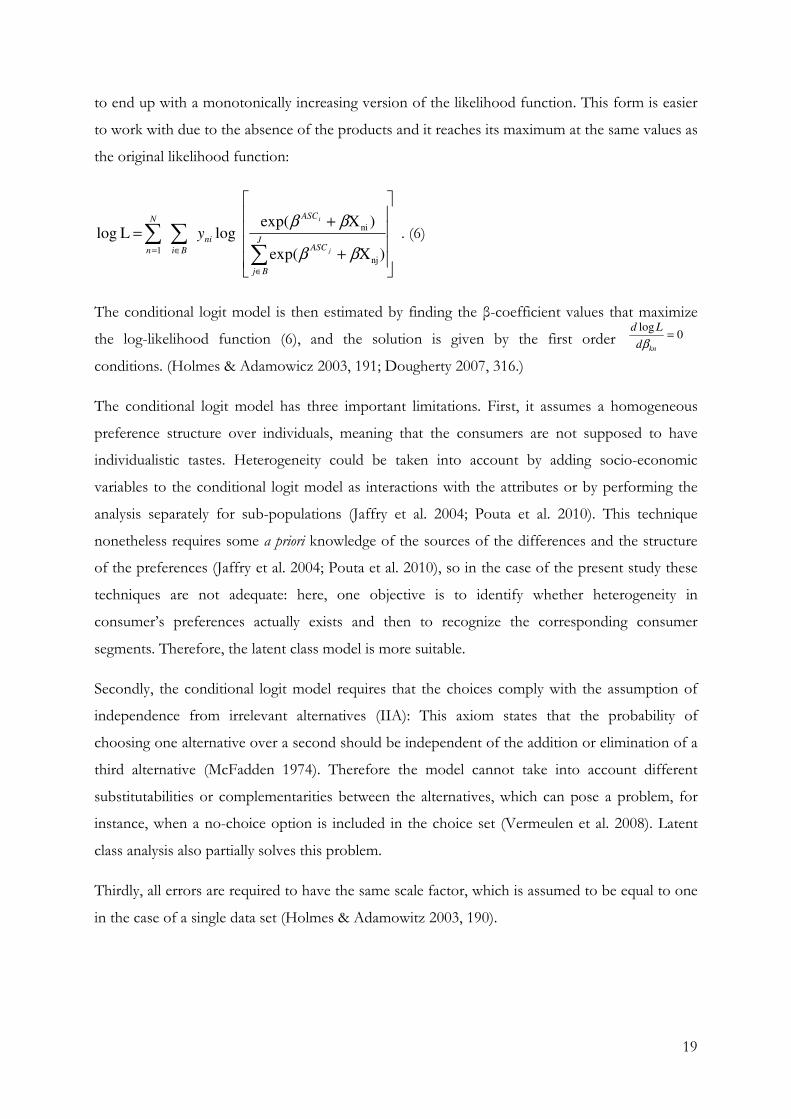
to end up with a monotonically increasing version of the likelihood function. This form is easier
to work with due to the absence of the products and it reaches its maximum at the same values as
the original likelihood function:
yJ
Bj
ASC
ASC
ni
Bi
N
n j
i
+
+=
∑∑∑
∈
∈= )Xexp(
)Xexp(log L log
nj
ni
1 ββ
ββ. (6)
The conditional logit model is then estimated by finding the β-coefficient values that maximize
the log-likelihood function (6), and the solution is given by the first order
conditions. (Holmes & Adamowicz 2003, 191; Dougherty 2007, 316.)
The conditional logit model has three important limitations. First, it assumes a homogeneous
preference structure over individuals, meaning that the consumers are not supposed to have
individualistic tastes. Heterogeneity could be taken into account by adding socio-economic
variables to the conditional logit model as interactions with the attributes or by performing the
analysis separately for sub-populations (Jaffry et al. 2004; Pouta et al. 2010). This technique
nonetheless requires some a priori knowledge of the sources of the differences and the structure
of the preferences (Jaffry et al. 2004; Pouta et al. 2010), so in the case of the present study these
techniques are not adequate: here, one objective is to identify whether heterogeneity in
consumer’s preferences actually exists and then to recognize the corresponding consumer
segments. Therefore, the latent class model is more suitable.
Secondly, the conditional logit model requires that the choices comply with the assumption of
independence from irrelevant alternatives (IIA): This axiom states that the probability of
choosing one alternative over a second should be independent of the addition or elimination of a
third alternative (McFadden 1974). Therefore the model cannot take into account different
substitutabilities or complementarities between the alternatives, which can pose a problem, for
instance, when a no-choice option is included in the choice set (Vermeulen et al. 2008). Latent
class analysis also partially solves this problem.
Thirdly, all errors are required to have the same scale factor, which is assumed to be equal to one
in the case of a single data set (Holmes & Adamowitz 2003, 190).
20
4.2 Latent class model
As the conditional logit model assumes a homogeneous preference structure for individuals, the
model fails to recognize different tastes that prevail in real life. The latent class model assumes
instead heterogeneous consumer preferences and allows for different parameter estimates for
different consumer segments or latent classes, defining the choice probability of the individual as
being conditional on these class probabilities (Hu et al. 2004; Vermunt & Magidson, 2005, 12).
Consumers’ background information, attitudes and their implicit valuations of the attributes are
the latent variables influencing the choices and their latent class membership. I describe next the
general latent class model having active covariates, or in other words basing the segment
membership of the individuals on both their choices and their attitudinal and socioeconomic
background. I then describe how the model is reduced so that only the actual choices made in the
choice experiment serve as the basis for determining the consumer segments and their preference
structures.
In the latent class model, the random utility model is defined with a class-specific subscript s,
representing the class into which respondent n belongs:
e X e V U s|niniss|nis|nis|ni ++=+= ββ iASC
s .
iASC
sβ represents the vector of coefficients of the class-specific alternative-specific constants, βs
the vector of the coefficient of attributes for class s and Xni is the level of the attribute for good i
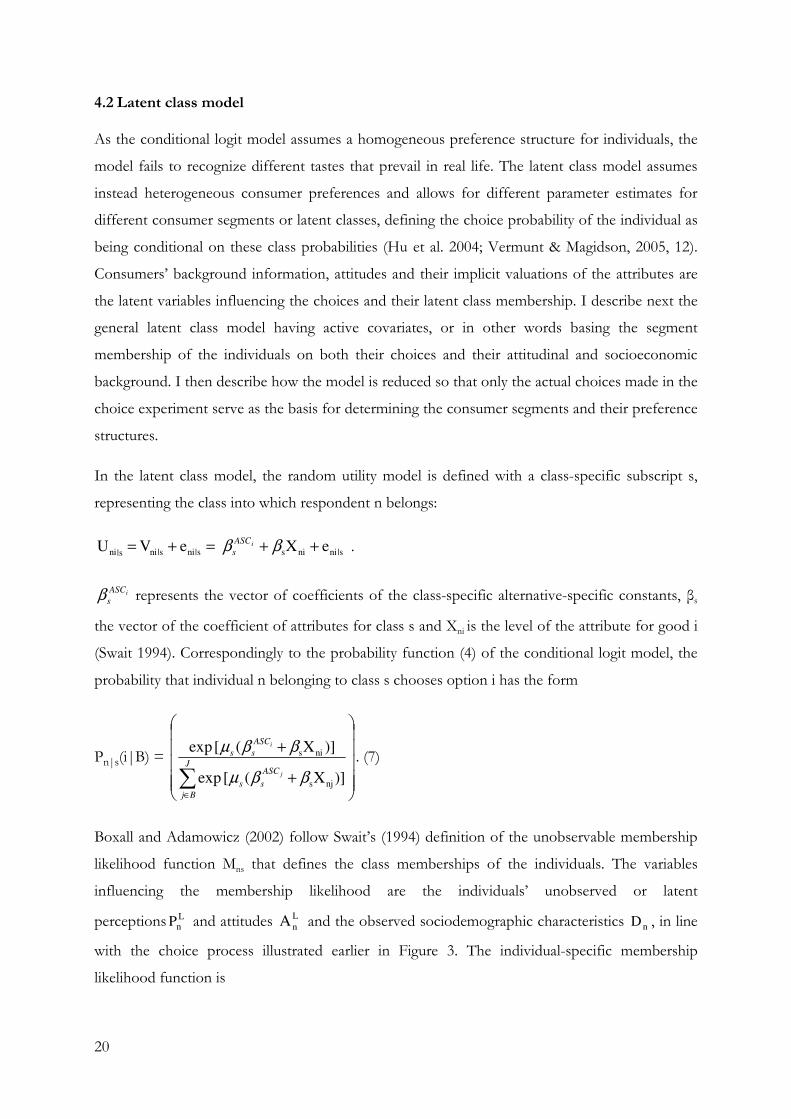
(Swait 1994). Correspondingly to the probability function (4) of the conditional logit model, the
probability that individual n belonging to class s chooses option i has the form
Pn|s(i|B) =
+
+
∑∈
J
Bj
ASC
ss
ASC
ss
j
i
)]X([ exp
)]X([ exp
njs
nis
ββµ
ββµ. (7)
Boxall and Adamowicz (2002) follow Swait’s (1994) definition of the unobservable membership
likelihood function Mns that defines the class memberships of the individuals. The variables
influencing the membership likelihood are the individuals’ unobserved or latent
perceptions P Ln and attitudes AL
n and the observed sociodemographic characteristics nD , in line
with the choice process illustrated earlier in Figure 3. The individual-specific membership
likelihood function is
21
nsnspsas
conD ζλλλλ ++++= PAM L
n
L
ns ns , where pnpsnanas P ζρζρ +=+= Ln
Lnn P andAA . (8)
consλ is the constant related to class s used by Vermunt and Magidson (2005, 20) in the systematic
component of the random utility model. PLn is the vector of the unobservable perceptual
characteristics and A Ln is the respective vector of the attitudinal characteristics. These are both
further defined with the functions of the observable attitudinal and perceptual indicators or
nA and nP , which are termed as functions of the latent variables. nD is the vector of the
observed sociodemographic characteristics of the individual. λ , asρ and psρ are the respective
coefficient vectors and ζ are the error term vectors. Thus, in other words, the membership
likelihood function nsM defines the latent segment for each of the respondents through their
observable sociodemographics and the observed indicators of their attitudes and perceptions.
(Boxall & Adamowicz, 2002; Swait, 1994.) The membership function is a statistical categorization
method rather than a behavioural relation, which according to Boxall and Adamowicz (2002)
enables disregarding the possible correlation in the error terms nsζ and sni|e of the membership
function Mns (8) and the utility function (7).
Following Boxall and Adamowicz (2002) and Swait (1994), the error terms of the membership
function are assumed to be i.i.d. and follow a double exponential extreme value distribution.
Thus the probability of individual n belonging to latent class s can be modelled econometrically
with the multinomial logit, where the class membership is regressed on covariates (Vermunt and
Magidson, 2005, 20):
∑=
+++
+++=
S
s
nspsas
con
nspsas
con
D
D
1
L
n
L
ns
L
n
L
ns
n
)] PA(exp[
)] PA(exp[ (s)P
λλλλα
λλλλα , (9)
where α is a scale parameter that follows according to Swait (1994) from the assumption of the
error term distribution. Swait (1994), however, continues that as the scale factor is unidentifiable,
it can be set to 1 for estimation purposes. Assumptions 1(s)P0 n ≤≤ and 1(s)Pn
S
1s
=∑=
are in the
background of the model (Boxall & Adamowicz, 2002).
The joint probability that individual n belongs to class s and chooses alternative i is equal to the
product of the probability functions (7) and (9). The probability that a random individual n
chooses alternative i is thus (Swait, 1994):

22
Pn(i|B)= ∑=
S
s 1
Pn(s) Pn|s(i|B)
=
+
+
+++
+++
∑∑∑
∈=
=J
Bj
ASC
ss
ASC
ss
S
s
nspsas
con
nspsas
conS
s j
i
D
D
)]X([ exp
)]X([ exp
) PAexp(
) PAexp(
njs
nis
1
L
n
L
ns
L
n
L
ns
1 ββµ
ββµ
λλλλ
λλλλ. (10)
The latent class membership is determined by the principle that the individual is placed into class
s if ngns MM max≥ , or if the membership likelihood of individual n for class s is greater than or
equal to the largest value for the membership function across the classes g (Swait, 1994). This is
mathematically derived by rewriting the first term of equation (10) or the probability of class
membership in terms of expected values, as nspsas
conDλλλλ +++ PA L
n
L
ns is actually the
expectation ]E[M ns of the individual-specific likelihood function Mns presented above.
According to Swait (1994) the expectation of the maximum value of this membership function is
equal to
=
+++= ∑∑
==
)](exp[ln1
)] PA(exp[ln1
][max11
Ln
Lns
S
s
ns
S
s
nspsascon
ns MEDME αα
λλλλαα
,
from which it follows that )](maxexp[)](exp[1
ns
S
s
ns MEME αα =∑=
. (11)
By combining the function (11) with the membership function (9), it is possible to derive the
expectation function that is maximized when determining into which latent class the individual
belongs:
[ ].])[][max(exp)](max)(exp[
)](maxexp[)](exp[)](maxexp[
)](exp[
)] PA(exp[
)] PA(exp[ (s)P
1
Ln
Lns
Ln
Lns
n
nsnsnsns
nsns
ns
ns
S
s
nspsascon
nspsascon
MEMEMEME
MEMEME
ME
D
D
−−=−=
−==
+++
+++=
∑=
ααα
ααα
α
λλλλα
λλλλα
This function shows that the probability of individual n belonging to class s is actually calculated
by an exponential function of the difference between the expected maximum value of the
membership function for individual n across all the classes and the expected value of the

23
membership function for the individual for class s. The probability that an individual n selected at
random chooses i can thus be rewritten in the following form:
[ ]])[][max(exp
)]X([ exp
)]X([ exp)|(
njs
nis
1
nsnsJ
Bj
ASC
ss
ASC
ss
S
s
n MEMEBiPj
i
−−⋅
+
+=
∑∑
∈
=
α
ββµ
ββµ. (12)
The latter term defining the latent class membership is closer to 1 when the difference between
the expected maximum value across classes and the value for the class s is the smallest. Thus the
whole function is maximized when the probability of the class membership is the highest. (Swait,
1994.)
The likelihood function for the latent class model is iny
ns
J
Bj
BiP )|( L N
1n
∏∏∈=
= (13),
and the log-likelihood for individual n choosing alternative i given that he belongs to class S is
maximized:
. (14)
J is the total number of alternatives and factor niy is the observed frequency of individual n
choosing alternative i within a choice set (Swait, 1994), so it is equal to 1 or 0, as in the
conditional logit model. The estimates for sλ and sβ are attained by maximizing the log-
likelihood function.
A potential problem in the maximization is that the log-likelihood function is not concave in the
parameters. According to Swait (1994) and Vermunt and Magidson (2005, 39), this implies that
the maximum meeting the log-likelihood function might be a local one as well as a global one. In
order to prevent the selection of a local optimum, the estimation is run with multiple sets of
starting values that are randomly generated, and within each set the iteration is preformed
multiple times (Vermunt and Magidson, 2005, 39).
[ ]
−−⋅
+
+=
⋅==
∑∑
∑∑
∑∑∑∑∑
=
∈
∈=
=∈=∈=
])[][max(exp
)]X([ exp
)]X([ explog
(s) (i)log)|(log L log
1njs
nis
1
1
s|n
11
nsns
S
s
J
Bj
ASC
ss
ASC
ssni
J
Bj
N
n
S
s
nin
J
Bj
N
n
nni
J
Bj
N
n
MEME y
PP yBi P y
j
i
α
ββµ
ββµ
24
For models having active covariates or models in which the class membership is partially
determined by the socioeconomic, attitudinal and perceptual characteristics of the individuals, the
estimation is performed in the above-mentioned way. As Swait (1994) states, the latent class
model would be equal to the conditional logit model if 0=sλ , ββ =s and µµ =s for all of the
classes.
Nevertheless, in this study the heterogeneous consumer classes are to be formed purely on the
basis of the choices made by the individuals and not their background information. The covariate
effects λs are therefore set to zero by defining the covariates as inactive (Vermunt & Magidson
2005, 55). Consequently, they do not affect the choice model, and the relationship of the
covariate levels and the latent classes is described only a posteriori of the actual estimation. Now
the difference between the conditional logit and the latent class model with inactive covariates is
that the βs coefficients and the scale factors sµ are allowed to vary across classes (Swait, 1994;
Vermunt & Magidson 2005, 13). The inactive covariates method reduces the log-likelihood
model to
∑∑
∑∑=
∈
∈= +
+=
S
sJ
Bj
ASC
s
ASC
sni
J
Bj
N
n j
i
yL1
njs
nis
1 )X( exp
)X( exploglog
ββ
ββ. (15)
All scale factors are set sequal to 1 as they are unidentifiable (Swait 1994), so they can be
eliminated from the model.
The IIA assumption can be interpreted as binding within the consumer classes in the latent class
analysis. Boxall and Adamowicz (2002) explain that the share of the probabilities of selecting
alternatives i and h (16) contains variables including the utilities of the remaining alternatives,
because fewer terms can be subtracted from the model due to the nature of the joint probability
of the class membership and the choice of the alternative:
[ ]
[ ]
B)|(hP (s)P
B)|(iP (s)P
)|(
)|(
1s
s|nn
s|nn
1s
∑
∑
=
==S
S
ns
ns
BhP
BiP, (16)
or in the case of inactive covariates:
25
[ ]
[ ]
+
+
+
+
==
∑∑
∑∑
∑
∑
∈
=
∈
=
=
=
J
Bj
ASC
s
ASC
s
S
s
J
Bj
ASCj
s
ASC
sS
s
S
S
ns
ns
j
h
i
BhP
BiP
)X( exp
)X(exp
)X( exp
)X( exp
B)|(hP
B)|(iP
)|(
)|(
njs
nhs
1
njs
nis
1
1s
sn|
sn|
1s
ββ
ββ
ββ
ββ
. (17)
As the denominator of the choice probabilities B)|(iP s|n and B)|(hP s|n in ratio (17) cannot be
subtracted, Boxall and Adamowicz (2002) continue that the IIA does not have to be assumed
across classes, and that the share probabilities are enhanced by the latent class model. This effect
is illustrated in practice by Magidson et al. (2003) with a simple example.
The IIA assumption is left without further consideration in several studies, including Boxall and
Adamowicz (2002), Hu et al. (2004), Pouta et al. (2010) and Swait (1994), presumably due to the
above-presented reasons. Following these articles, the IIA assumption is not taken into
consideration in the empirical application of the latent class model in chapter 6.3.
In practice, latent class analysis is performed in an iterative way, and the estimation includes three
main steps originally defined by McFadden (1986: see Swait, 1994): First, in the case of active
covariates the parameters for the latent background information, i.e. for the attitudes and
perceptions, are estimated based on the background information on the consumers. This
produces expected values for the background parameters, which are secondly substituted as
unknown variables in a log-likelihood function modelling the joint probability that an individual
belonging to segment s chooses alternative i from the choice set. The log-likelihood function is
maximized with a given number of classes S based on these expected values, in order to produce
information on the segment memberships and segment-specific preferences of the consumers.
The maximization is then rerun by replacing the original expectations with the estimation results.
This iteration is continued until the difference in the log-likelihood is small enough, or the
convergence criteria are met. (Pouta et al., 2010; Swait, 1994; Vermunt & Magidson, 2005, 35-39.)
Thirdly, the iteration is run several times with a different number of consumer classes defined
each time. (Swait 1994.) In the case of inactive covariates the maximum likelihood estimation is
conducted by first estimating the class-specific parameters βs for the attributes and the ASCs for
the alternatives given an exogenous class number S, and secondly searching for the optimal value
of S. The best model is selected by using model fit criteria such as the Bayesian information
criterion (BIC) explained in the following chapter.
26
4.3 Model fit
The fit of the model is considered with prediction statistics, chi-squared statistics, and log-
likelihood statistics.
Prediction statistics illustrate via a prediction table and the pseudo R2 statistic how well the
estimated model predicts the choices. (Dougherty 2007, 320; Vermunt and Magidson 2005, 44-
47; 49.) The R2 statistic used in ordinary least squares estimation is a measure of the explained
variance in the dependent variable with respect to its total variance (Dougherty 2007, 63). In OLS
estimation, where the aim is to minimize the residuals, this figure is a good measure of the
adequacy of the model. However, the parameters in the maximum likelihood estimation of this
study are approximated in order to maximize the log-likelihood function and not to minimize the
variance. Thus the R2 statistic is not an appropriate measure for the goodness of fit and the
pseudo R2 is used instead. (Dougherty 2007, 320-321; Vermunt & Magidson 2005, 51.) The
particular pseudo R2 statistic used in this study is a measure of the reduction of the errors of the
estimated model compared to the errors of a baseline model (Vermunt & Magidson 2005, 51).
The error measures used in the calculation are based on the respondent-specific response
probabilities.
The Bayesian Information Criterion (BIC) measures the fit and the parsimony of the model, and
it is used in determining the number of heterogeneous consumer classes: the lower the BIC is,
the better the fit of the model. The BIC can be calculated based on the log-likelihood values
(Vermunt & Magidson, 2005, 46-47). However, even though the BIC is a good guideline for
determining the best model, it is only suggestive, and the decision is ultimately made by the
researcher, based on the comparison of different models with each other. For instance, if the
change in the BIC statistic between two models is very small, the one with the bigger BIC can
also be chosen (Birol et al., 2006). The choice of the model then involves weighing up the sizes
of the classes, the simplicity of the model and the additional information provided on the
behavioural patterns that the classes represent (Swait, 1994). For this end, the coefficient values
βk|s are tentatively inspected already when comparing the models with different numbers of latent
classes.
The Wald and Wald (=) p-values are used in determining the significance of the coefficients of
the attributes in the conditional and the latent class models. The Wald p-values tell whether the
parameter estimates are significant and the Wald (=) p-values tell whether they differ significantly
from each other across the latent classes, or whether the attribute impacts are class-independent.
27
The standard errors and the z-statistic are used to examine the class-specific significances of the
coefficients.
4.4 Willingness to pay
Willingness to pay (WTP) is a measure for indicating the maximum monetary contribution an
individual is willing to make in order to balance for a rise in his utility. This change in utility is
typically evoked by a change in the level of some or several attributes of a good. The willingness
to accept (WTA) is another measure that models the same phenomenon from a different point of
view: it measures the minimum monetary contribution the individual is willing to accept in order
to balance for a decrease in his utility. WTA estimates tend to be larger than WTP estimates.
(Adamowicz et al., 1998a.)
The β coefficient estimates of the attributes represent the impact of the attributes on consumers’
utility, and they are used in calculating the marginal willingness to pay estimates, or the implicit
prices, for each of the attributes (Loureiro & Umberger, 2007). The marginal willingness to pay
estimates are mathematically derived from the change in the consumer’s utility created by the
change in the attribute level Xni that is compensated by the change in the price of the product pni:
p
MWTPβ
βββ −==⇔=+=
dX
dp 0 dp dX dU p .
Bateman et al. (2002, 283) and Loureiro and Umberger (2007) used this ratio in their
computations, where β is the coefficient associated with the attribute of interest and βp the
coefficient of the price attribute for each consumer class.
Average willingness to pay estimates can be calculated for different products of interest.
Following Boxall and Adamowicz (2002), Hanley et al. (2001) and Pouta (2010) the general rule
for class-specific estimates is:
−
= ∑∑
∈∈ Bi
B
s
Bips
)Xexp(ln)Xexp(ln1
- WTP B
iiss βββ
,
where iX and B
iX represent the attribute levels of the product of interest and a baseline product.
B
sβ is the coefficient for the attribute levels for class s for the baseline product and
sβ respectively for the product of interest. βps is the price coefficient..
28
This WTP measure in fact represents the average value given to a change in the attributes of a
good. By summing up class-specific willingness to pay estimates that are weighted by the class
sizes, it is possible to generate an average WTP measure for the change from the baseline for
each product:
∑ ∑∑= ∈∈
−
=
S
s Bi
B
s
Bips1
B
iis )Xexp(ln)Xexp(ln1
- P(s) WTP βββ
.
P(s) refers here to the estimated marginal latent class probabilities for each segment, or the
overall probability of belonging to class s, and it is thus equal to the class size:
N
yxsP ii
N
n
),|(
P(s) 1
∑== , (Vermunt et Magidson, 2005, 48 & 54).
5 Empirical results from earlier studies
5.1 Consumer preferences for product attributes of food
There exists a large pool of preference studies on food attributes, as the subject matter has
become an important concern for researchers due to the increased interest of consumers as well
as producers. Willingness to pay estimates have often been included in the analysis in order to
provide with more straightforward suggestions on the value placed on product features. Choice
experiments have been used in many studies to model preferences, and the conditional logit
model has been a common means for analyzing choice experiment data when assuming
homogeneous preferences among consumers. For example, Jaffry et al. (2004) studied consumer
preferences for seafood products labeled with quality and sustainability information and Mtimet
and Albisu (2006) assessed the impact of origin, price, age and grape variety on wine
consumption. Lusk et al. (2003) presented a choice experiment analyzing the attributes of steaks
from tenderness to price, and the use of growth hormones and genetically modified corn in
breeding, and Loureiro and Umberger (2007) examined consumer preferences for steak
characteristics such as the country of origin, traceability and food safety.
Choice experiments have additionally been used in assessing consumer preferences for different
kinds of information on the products and contextual factors of the purchase situation. Pouta et
al. (2010) compared the impact of stating particular product information in a label and in written
form, finding that well known labels have a larger positive impact on the choice than the written
29
information whereas unknown labels may negatively impact on the choice. Gracia et al. (2009)
discovered that consumers prefer fact panels containing nutritional information over nutritional
claims, being willing to pay twice as much for having the former than the latter. A well known
brand name was nevertheless valued higher than the nutritional attributes. Jaeger and Rose (2008)
examined the impact of the eating occasion and other contextual effects on fruit purchase
choices. They concluded that besides the product attributes, consumers also consider the
situational and social context in their choices, and emphasized the heterogeneity prevailing in the
impact of these effects across individuals.
Foodstuffs that have been under scrutiny include products ranging from bread (Hu et al., 2004)
to beef (Becker et al., 2000; Cicia and Colantuoni, 2010; Loureiro and Umberger, 2007; Lusk et
al., 2003; Tonsor et al., 2005), poultry meat (Becker et al., 2000; Pouta et al., 2001), seafood
(Jaffry et al., 2004), vegetables and fruits (Chalak et al., 2008; Jaeger & Rose, 2008) and beverages
such as for instance wine (Mtimet & Albisu, 2006). The product characteristics examined in
previous research have also been diverse, and some that can be seen as relevant for this research
are considered below.
The impact of the country of origin on food choice has been widely examined. Pouta et al. (2010)
assessed consumers’ relative preferences for organic, animal welfare-oriented and consumer
health emphasizing methods of production and the country of origin in the context of seasoned
and unseasoned broiler fillets. They used conditional logit modelling to analyse the aggregate
preferences, and latent class modelling to account for heterogeneity, as in the present study, and
found that consumers had the largest positive preferences for domestic broiler fillets. Overall,
culturally closer places of origin were perceived as more positive attributes than culturally distant
places. Among the production methods, animal welfare-oriented production had the largest
positive impact on consumer choice, followed by organic production. Consumers were generally
willing to pay more for animal welfare-oriented than organic production and least for the
consumer health-oriented production method. However, the willingness to pay estimates for
additional attributes revealed no important differences when the product was a domestic one.
Bernués et al. (2003b) investigated the information most requested in product labels for beef and
lamb meat and found that the country of origin and the last consumption date were the most
important informational contents of the labels, the brand name and the cut type being the least
important. In another study examining the extrinsic quality cues for meat Bernués et al. (2003a)
likewise found that the country of origin was, together with animal feeding, a highly important
meat attribute, although environmentally friendly and animal welfare-oriented production were
30
additionally seen as important features. Schnettler et al. (2009) also studied consumer choice and
found that the origin of beef was the most important attribute, followed by information on
animal welfare. Both of these attributes were more important than the price of the product.
Becker et al. (2000) assessed the roles of the country of origin, place of purchase and freshness in
the selection of beef, pork and chicken by means of a survey and a focus group study.
Consumers were asked to rate the attributes in terms of how helpful they were seen when
assessing the quality and the safety of the meat product in the purchasing situation. The
researchers found that for beef the country of origin was the most important attribute in
assessing both quality and safety, followed by the place of purchase. For pork the place of
purchase was the most highly valued attribute in assessing quality, followed by the origin. The
brands and quality assurance labels were seen as less important and price was the least important
quality indicator for both product types. For those consumers who thought that the visual
appearance could also be used as a quality cue, the colour and a low fat content were revealed to
be among the important attributes. When examining the safety assessment of pork and chicken
products, the freshness of the meat was instead an important factor, in contrast to the case of
quality indicators.
As an attribute, the country of origin has been suggested to actually contain multiple quality cues
in consumers’ minds, partly because it has been revealed to often be a dominant factor in food
choice. For instance, Pouta et al. (2010) proposed that people might attach supplementary quality
characteristics to domestic food, and also Becker et al. (2000) argued similarly. Juric and Worsley
(1998) regrouped studies on the country of origin attribute and found that the country’s overall
image influenced the impact of the origin on the product perception among consumers. They
also pointed out that the country stereotypes might not be the same for different product
categories. Luomala (2007) further examined the meanings of food origin to Finnish consumers
and their impact on choice. He divided the meanings into cognitive, affective and normative and
used focus group interviews to examine the connotations consumers assigned to Swedish,
German and French food. Luomala found that the meanings partially overlapped, but that in line
with the findings of Juric and Worsley (1998), relatively clear and different country profiles were
found. Luomala (2007) also studied the choice of domestic, Swedish, German and Dutch Edam
cheese in a laboratory experiment. Before the experiment he either cognitively or affectively
manipulated the concept of domestic origin for two consumer groups, and kept one group as an
uninfluenced control group. Luomala found that the nature of the manipulation did have an
impact on the cheese choice: affective manipulation led to preferring domestic products but
31
cognitive activation to favouring foreign products, as compared to the control group. This
implies that consumers’ choice processes are complicated and the meanings assigned to food
origin are highly unmanageable. The country of origin might thus very well be seen as a
combination of diverse quality cues, not all of them even being relevant in the choice of a specific
product.
Although brand was seen in some of the above studies as a relatively unimportant feature, there
have also been studies suggesting the opposite: Banović et al. (2009) observed the brand to be a
dominant extrinsic quality cue for beef when compared to origin and price. The brand was seen
as influencing the perception of some intrinsic quality cues such as beef cut, colour and fat
content, although the origin was also revealed to be an indicator of overall enhanced quality for
the consumers. Henson and Northern (2000) also reported, as described in the next chapter, that
for some consumers the brand name may indeed serve as a means to judge beef quality.
Animal welfare has additionally been extensively examined in food attribute studies, and the results
have suggested that it has a positive impact on consumers’ perception of meat products (Cicia &
Colantuoni, 2010; Napolitano et al. 2007). Moreover according to Maria (2006), especially
younger female consumers, students and professionals stated that they were increasingly
concerned about animal welfare and that they were willing to pay more for a product to improve
animal welfare. Maria (2006) highlighted that this finding was nevertheless not in line with the
current levels of consumption of “welfare-friendly products”, and that its validity could thus be
questioned. Pouta et al. (2010) found, as already mentioned, that animal welfare-oriented
production had the largest positive impact on the consumer choice out of the available
production methods. Napolitano, Caporale, Carlucci and Monteleone (2006) examined the effect
of animal welfare and nutritional information on beef acceptability and liking in a laboratory
study. They concluded among others that if the meat product had acceptable sensory properties
such as taste, the information on animal welfare-oriented production and nutritional aspects had
a positive effect on the perception and the liking of the product. As mentioned above, Schnettler
at al. (2009) conversely found that information on animal welfare was the second most important
attribute influencing consumer choices. However, even though the researchers revealed that
consumers had positive preferences for animal welfare, they observed in line with Maria (2006)
that consumers were not ready to pay notably more for having information on the product
feature. The researchers thus stated that it would not be possible to compensate for the higher
production costs originating from animal welfare-oriented production methods with elevated
consumer prices. Liljenstolpe (2008) instead found there to be both positive and negative WTP
32
estimates due to consumer heterogeneity in his study on the impact of animal welfare-related
attributes on the consumer choice of pork in Sweden.
Health-oriented food attributes have been highly valued in several studies on food safety-oriented
production methods and weight control-related features among others. As discussed above, the
country of origin has been suggested to reflect food safety related aspects. Loureiro and
Umberger (2007) investigated preferences among US consumers for beef steak attributes such as
food safety, country of origin labelling, tenderness and traceability, employing a conditional logit
model. The food safety attribute was revealed to be the most important product feature, followed
by the country of origin label. Tenderness labelling had the lowest importance for the consumers,
traceability being appreciated slightly more. Loureiro and Umberger (2007) consequently reported
that consumers were willing to pay the highest premium for the food safety attribute of a steak.
This is contrary to the findings of Pouta et al. (2010) reported above, according to which the
WTP for consumer health promoting production was the least important attribute compared to
organic and animal welfare-oriented production methods, and a domestic origin dominated all of
the previous. Loureiro and Umberger (2007) suggested, in line with the reasoning of Pouta et al.
(2010), that the dominant effect of origin revealed in some studies might follow from consumers
attaching safety inspection-related features, among others, to the attribute. Consequently, they
proposed that the safety attribute could actually have the largest influence on consumer choice,
even though this effect is often associated with the country of origin.
Gracia and Magistris (2008) found the main characteristics actually promoting the demand for
organic products to be health and environmental benefits, the former carrying a heavier weight in
the choice of organic foods. They also concluded that sociodemographic characteristics had only
a limited impact on organic food choice, but that income seemed to be the main factor limiting a
larger expansion of organic demand due to the higher price of organic products. In line with
Gracia and Magistis (2008), Napolitano et al. (2010) observed that information on organic
farming, or in their study more precisely animal welfare and nutritional characteristics of beef,
could be important for consumers in determining their liking of the beef product, and that
organic production could be used in differentiating the products from those produced on
traditional farms.
To the best of my knowledge, there has been little research on the impact of carbon footprint
information on consumer food choice. Kemp et al. (2010) conducted a study on the impact of a
concept called “food miles” on purchasing behaviour, the term implying that locally produced
food is more environmentally friendly than food imported from a distant location due to the
33
emissions from transport. This “food miles” notion could be seen as an imperfect proxy for
studying the impact of carbon footprint information, so the researchers’ findings should be
recognized in the context of this study: even though the consumers stated having high valuations
for locally produced products, the aversion to food miles was not reflected in their actual
purchase decisions. On the other hand MacKerron et al. (2009) found evidence in their stated
choice experiment study on certified carbon offsets that consumers would be willing to pay for
certified carbon offsets in the context of leisure air travel.
Finally, before moving on to studies on consumer heterogeneity, the principal results are
introduced from a meta-analysis regrouping studies on consumers’ willingness to pay estimates
for traceable meat attributes. Cicia and Colantuoni (2010) concluded in their recent article that
the traceability attributes of meat are becoming more and more important to consumers. They
observed that food safety, on-farm traceability or country of origin and animal welfare seemed to be
particularly important attributes: consumers had on average been willing to pay a 12% to 16%
premium for a guarantee of food safety and a premium from 11% to 16% for on-farm
traceability. The premium for animal welfare was situated from 7% to 14% with respect to the
base price. Cicia and Colatuoni (2010) additionally found suggestive results that the marginal
WTP would actually be negatively proportional to the increase in the number of the attributes.
The non-hypothetical research design of the WTP studies did not seem to have a significant
impact on the percentage premium of WTP estimates. However, its coefficient was negative, in
line with the expectations of the researchers (Cicia & Colantuoni, 2010).
5.2 Consumer heterogeneity
As the conditional logit model fails in allowing for heterogeneity, many studies have gone beyond
it in trying to account for differences in consumers’ preferences for food attributes. Consumers
have been grouped based on prior assumptions of the source of heterogeneity, such as
purchasing frequency (Mtimet & Albisu, 2008) or nationality (Henson & Northen, 2000; Lusk et
al., 2003, Tonsor et al., 2005). For instance Tonsor et al. (2005), assessed consumer preferences
for beef steak attributes such as on farm-traceability, domestic origin, being hormone-free and
not being genetically manipulated. Their results revealed that consumers from different countries
have differing preferences for these attributes, making it vital to incorporate heterogeneity in the
analysis. However, the researchers do not in all situations have prior knowledge of the cause of
dissimilar preferences. In this case, models such as the latent class model are applied to
endogenously determine the consumer segments.
34
Below, some results are introduced from previous research in which heterogeneous consumer
segments have been recognized. The chapter is organized so that it first presents some studies
based on factor, cluster and similar analysis methods classifying consumers on the basis of their
attitude statements. Choice experiment studies are then introduced in which heterogeneity is
accounted for by random parameter and mixed logit models in which consumers are divided into
subgroups based on their differing countries of origin and sociodemographic background. Finally
the results of studies similar to those of this thesis are considered, in which a latent class (or finite
mixture) model has been applied to choice experiment data.
Attitudinal statements have very commonly been used in analyzing consumer heterogeneity. For
instance, the studies reported below have examined consumer heterogeneity in relation to health
attributes, particularly from the weight control perspective. Based on a factor analysis and a two-way
ANOVA, Roininen et al. (2001) found that Finnish consumers were more health-oriented and
had higher positive preferences for light products than Dutch or British consumers, who valued
pleasure highly. The researchers additionally noted that the health-related attitudes of the
consumers were good predictors of healthy food choices and preference for low-fat products.
Lindeman and Stark (1999) revealed six heterogeneous consumer clusters concerning the food
choices of Finnish middle-aged women and high school girls based on factor and cluster analysis.
They named the clusters gourmets (27% of consumers), indifferents (19%), health fosterers (14%),
ideological eaters (14%), health dieters (7%) and distressed dieters (19%). For example the consumers in
the ideological eaters group mainly chose food based on ideological reasons, and the gourmets
based on pleasure, being however somewhat unsatisfied with their own physical appearance. The
indifferents were not especially keen on ideological food, weight control, health or pleasure
compared to the other groups, although they valued health higher than the other attributes.
Lindeman and Stark found no significant differences in the age or the work status of the clusters,
but some significant differences in attitudinal characteristics were observed: among others
ecological and personal striving to understand the world were found to matter, as well as strivings
for slimness and a better appearance. They additionally concluded that eating habits such as
vegetarianism were the best predictors of ideological food choice, which can often be seen as an
expression of personal identity.
Pieniak et al. (2010) investigated consumers’ health attitudes with respect to fish products,
likewise using factor and cluster analysis. They found four distinct consumer groups, one having a
low interest in eating healthy food and thus fish, a second wanting to maintain their health and a
third wanting to improve their health by eating fish. The fourth consumer group did not feel
35
generally involved with health issues, even though the consumers were relatively interested in
healthy eating. Younger consumers seemed to have a generally lower interest and involvement in
healthy eating than older consumers.
Schnettler et al. (2009), using cluster analysis, identified four heterogeneous consumer classes from
two geographical areas in Chile differing in their preferences for the origin of meat, information
on animal welfare and price, and their sociodemographic background. The largest segment (29%)
in the Bio-Bio area was price-conscious, comprising older consumers belonging to a lower
socioeconomic group. The price-sensitive group in the Araucanìa area was, on the contrary, the
smallest one (11%), mainly including people from the upper and middle income groups. In the
Bio-Bio region there were two groups highly valuing the place of origin: the second largest group
contained 26% of the consumers and was not interested in animal welfare in addition to having
positive preferences for the place of origin. The consumers in this group belonged to the highest
and the two lowest socioeconomic groups, also comprising the highest percentage of people
under 35 or over 55. The second group in Bio-Bio appreciating the place of origin consisted of
23% of the consumers and had a low sensitivity to price. These consumers were middle aged and
belonged to the middle socioeconomic group. In Araucanìa, the clearly largest segment
comprising 51% of the consumers had a high appreciation for origin. On the other hand, there
were two groups in Araucanìa most appreciating the animal welfare orientation, the first
containing 26% of the consumers and being insensitive to price, and the second containing 13%
of the consumers and being insensitive towards origin. In Bio-Bio, a group comprising 22% of
the consumers was most interested in animal welfare and mostly consisted of middle-aged people
in the upper or middle socioeconomic group.
Bernués et al. (2003b), in their study using focus group analysis, principal component analysis and cluster
analysis, revealed four consumer segments based on attitudes towards meat products: The first
and the second of these included quality and safety-oriented consumers, who differed in their
perception of brand name importance: the first group did not see the brand as a guarantee of
quality, whereas the second one did. The third group was a quality-unconcerned or convenience-
driven consumer segment mainly interested in cooking recommendations, and the last one a
traditional consumer group that was origin motivated, rather price-conscious and requested
freshness. In their other study using same methods, Bernués et al. (2003a) also revealed four
consumer types, this time characterized by their preferences for extrinsic beef attributes including
origin, animal welfare, environmental friendliness, animal feeding, breeding, processing and
storage. The socioeconomic profiling of the classes included age, place of residence and
36
nationality. The largest consumer group was not very interested in the origin of the beef, but had
relatively high preferences for the other extrinsic attributes, with nutritional, health and safety-
oriented features of beef being especially more important to this group than the others. The
group mainly consisted of younger Italians living in large cities. The origin was important to the
other three groups, which differed in that for the first the feeding regime of the animal was an
important attribute, in the second the processing and storage of the product were important and
in the last group animal welfare aspects were highly appreciated. Nutritional, health and safety-
oriented features of beef were also somewhat important for consumer group appreciating animal
welfare and origin, which mainly consisted of older people living in the medium sized cities of
Scotland. The group interested in the feeding of the animals comprised middle-aged Spaniards
living in rural areas, and the group interested in processing and storage included people from the
large cities of Scotland.
Henson & Northen (2000) grouped consumers based on their countries of origin, and using a
focus group study and structural equation modelling found that consumers from different countries used
different meat safety indicators when buying meat: The name of the producer and the price were
quite unimportant indicators in all countries, but freshness was the most important safety
indicator in the UK, Sweden, Ireland and Spain, and Italians appreciated information on animal
feed. A brand or a quality label was quite important in Sweden and in the UK, but particularly
unimportant in Germany. One key result was that the consumers felt that their own experience
was an important determinant of their ability to assess meat safety. The researchers thus
suggested that less experienced beef shoppers might trust the brand, but those with more
experience might pay more attention to other features, such as the appearance of the meat. They
concluded that it might not be reasonable to adopt EU-wide strategies in communicating about
and using beef safety indicators, as such strong national differences seemed to prevail.
Random parameter and mixed logit models assume that the parameters or differing tastes are randomly
distributed in the population, and they account for his heterogeneity by estimating the mean
value and the variance for the parameters (Holmes and Adamowicz, 2003). Teratanavat and
Hooker (2006) examined consumer preferences and heterogeneity in relation to functional food
attributes with a choice experiment using a mixed logit model. On average, consumers were found
to be willing to pay a 31% premium for a single health benefit, a 9% premium for multiple health
benefits and a 14% premium for a natural source of nutrients with respect to fortified nutrients,
whereas the WTP for organic production ranged from a premium of -69% to 62%, having on
average a negative value. Consumers were divided into different subgroups based on
37
sociodemographic information and the results of the separate mixed logit models confirmed that
preferences varied between the sociodemographic groups, as described below. Men were a more
homogeneous consumer group than women: they had positive WTP estimates for both types of
health benefits and naturalness, ranging from 13% to 23%, but they were not willing to pay for
organic production. Women also generally had a positive WTP for the health benefits and a
negative one for organic products. Due to greater heterogeneity, however, they were more likely
than men to purchase organic or natural products. Age was found to be negatively proportional
to preferences for organic production, as older consumers had a negative WTP for products
containing organic ingredients, whereas younger consumers had a slightly positive one. A similar
tendency applied to single and multiple health benefits, although with larger standard deviations,
as the younger consumers (under 35 and from 35 to 60 years old) were willing to pay more for
health benefits and were thus more open to the concept of functional foods. However, the
youngest consumers (under 35 years old) had a lower WTP for health benefits than the
consumers between 35 and 60 years old. The elderly consumers (over 60 years old) had the
highest WTP for naturalness. Income and educational level were also found to be directly
proportional to the WTP level of the consumers, and health consciousness and product
familiarity were seen to promote the purchases of functional foods.
Lusk et al. (2003) presented a choice experiment analyzing steak attributes from tenderness to
price and the use of growth-hormones and genetically modified corn in breeding. They
accounted for heterogeneity by means of random parameter logit, comparing US, German, French
and UK residents. The results indicated that European consumers were generally willing to pay
more for beef products that were produced without GM feed than US consumers, and French
consumers were willing to pay more for growth hormone-free beef compared to US consumers.
Valuations of UK and German consumers did not differ significantly from US consumers for the
growth hormone issue. US consumers viewed tenderness as a more important factor than
Europeans, also being slightly more price sensitive. The willingness to pay premiums for GM and
hormone-free beef were seen as being larger than the actually prevailing premiums in the market,
being potentially influenced by hypothetical bias. The researchers nonetheless assumed the bias
to be equal for the different product features and nationalities, and thus stated that the relative
magnitudes of the WTP estimates should be accurate. Where Lusk et al. (2003) did not find
significant heterogeneity among European consumers for GM-free beef, Tonsor et al. (2005)
suggested, following their study that was similarly based on random parameters logit, that
heterogeneity does exist, with German consumers being willing to pay the most for GM- and
hormone-free beef steaks compared to just hormone-free steaks and to UK and French citizens.
38
Conditional logit modelling can also be applied to the analysis of heterogeneous preferences, although
similarly to the above models the reasons for differing tastes have to be assumed a priori to the
analysis. Hearne and Volcan (2005) examined consumer preferences and WTP for certified safety
labelling and certified organic production labelling for vegetables. Their focus group study
revealed that consumers preferred food safety orientation over environmentally friendly
production, and the choice experiment emphasized that food healthiness and environmental
soundness were both appreciated by the consumers: the researchers found a marginal WTP of
20% for a food safety labelling and of 19% for organic certification in addition to the safety
labelling. The appearance and the price of the product also had an impact on the choice, although
a smaller one than the above certifications. The researchers accounted for the heterogeneity by
interacting socioeconomic variables with the certification attributes in the conditional logit model
and revealed that consumers having a higher educational level had greater preferences for both
certifications, but that the other socioeconomic factors did not have significant impacts on the
consumers’ choices.
Latent class or finite mixture modelling provides information on consumer preferences, their segment
membership and the sources of heterogeneity. This approach has been used, among others, by
Pouta et al. (2010) whose research revealed four consumer segments having different preferences
for broiler fillets. The group including the majority of respondents (62%) had strong preferences
for domestic products but was rather indifferent towards seasoning. The members of this group
were mostly older women, whereas another group with 16% of the consumers principally
consisted of men living in southern Finland. This segment preferred unseasoned products of
both domestic and Danish origin, and also somewhat preferred animal welfare-oriented and
organic production. One consumer group was price-conscious and preferred seasoned products.
This group comprised 12% of the respondents, who were mainly younger males living in
southern Finland with a lower than average income. The last group, comprising 9% of the
consumers, was indifferent to the price and the seasoning, but had highly positive preferences for
organic and animal welfare-oriented production. This last group also had an important aversion
to Thai and Brazilian products, and mainly comprised female consumers.
Similarly applying the latent class model, Chalak et al. (2008) examined consumer preferences and
willingness-to-pay for reducing the use of pesticides in food production, separately considering
the environmental and human health-related impacts of pesticides correspondingly for bread and
for fruits and vegetables. The consumers were provided with descriptions of the negative effects
associated with different pesticide types before the choice experiment. However, the researchers
39
found that the consumers seemed to rely on their presumptions of the impacts of the pesticides
instead of basing their decisions on the actual impact descriptions, as the parameter estimates
related to pesticide type did not directly follow their levels of negative effects. For fruits and
vegetables, three segments of consumers existed in both the choice experiment related to the case
of the environmental impacts, and that related to the human health impacts of pesticide use. The
largest segment found in the human health-related choice experiment comprised buyers of
organic food who were less concerned with food safety, and had a moderate willingness to pay
for pesticide reductions. The second largest group included buyers concerned with food safety
and buying organic products, having also the highest WTP for pesticide reductions. The smallest
group of individuals was neither concerned with food safety nor with buying organic products
and was correspondingly unwilling to pay notably more for pesticide reductions. In the case of
the choice experiment related to environmental impacts, the smallest and the largest consumer
groups did not favor organic foods nor care notably more about food safety, and were unwilling
to pay significant amounts for pesticide reductions, the WTP estimates for the smallest group
even being negative. The second largest group favoured organic products and was concerned
with food safety, also having a slightly larger WTP estimates than the others. Overall, Chalak et
al. (2008) concluded that the consumers’ willingness to pay for reducing the negative health
impacts of pesticide use was larger that for reducing the negative environmental impacts.
Nilsson et al. (2006) examined consumers’ WTP for credence certified pork chops using a latent
class model. The certified attributes included standards for environmental soundness, animal
welfare and not using antibiotics. The researchers found three segments: attribute-conscious
consumers (16% of respondents) who had a relatively high WTP for the certification, the price-
conscious consumers (41%) who were less interested in the certification and instead had positive
preferences for brand parameters, and concerned shoppers (43%), who were interested in the
certification attributes, but who would instead buy the conventional brand product in the case of
too high certification premiums. The attribute-conscious consumer group, however, was the only
one whose WTP for animal welfare certification was not significant. Among the groups, the
relative WTP for the attributes ranged from an additional 75% to 300% above the base price of
3.45 dollars, depending on the certification and on whether the product incorporated two or even
all the three credence certifications at once. The two largest segments also had significantly
different WTPs for the certifications, as the premiums for the price-conscious group ranged
between 6 and 19% and the premiums for the concerned shoppers between 37 and 140%. The
preference order of the attributes depended on the consumer segment, the tendency being that
the WTP was generally highest for a certification concerning animal welfare, then antibiotics use,
40
and finally environmental soundness. The researchers concluded that when comparing the WTP
estimates and consumer demand elasticities with the cost estimates of certification, some market
potential could be found for certified pork chops among the attribute-conscious and concerned
segments. They stated that it would, however, be important to examine how other consumers
perceive these kinds of labels, as the majority of the consumers were revealed to have subadditive
preferences, meaning that some might have limited patience to read complicated labels and thus
even be aversive to a large number of certifications.
In the research of Kornelis et al. (2010), health and weight control were important determinants
of food choice in general. However, consumers were found to differ in their motivations to
choose food products, and altogether the researchers identified seven heterogeneous consumer
groups based on their finite mixture or latent class analysis. One segment prioritized health and
appeal as food attributes. Another appreciated health, appeal and also natural ingredients, but did
not perceive convenience as an especially positive feature. The segment highly valuing
convenience contained consumers who were on average younger, had a relatively low income and
the largest number of children, and who were most probably employed. Environmental
friendliness was the major attribute influencing choice for one group that relatively more often
contained women. The group making generally sustainable food choices had a higher educational
level, and relatively many of its consumers were members of environmental or animal welfare
organizations. The ranking of price as a motivation also varied, and some segments were
generally more indifferent than others. Religious motives were, all in all, uncommon.
On the whole, it can be concluded that it is crucial to account for the heterogeneity of consumer
preferences, but that some meat attributes are generally preferred over others. The results of
Cicia and Colatuoni (2010), described in the previous chapter, were somewhat in line with the
findings on consumer heterogeneity: Food safety and health, place of origin and animal welfare
are important meat attributes for some consumers and positive WTPs have been estimated for
them. The effects of health impacts on consumer choice have in some cases been found to
higher than, for instance, those of environmental issues, although in some studies their
importance has been lower than that assigned to animal welfare and organic production. Indeed,
consumers also seem to favour organic production relatively highly, but their willingness to pay
for it varies. These differing results for organic production and the diverse WTP estimates could
be explained by the fact that the concept of organic production and its desirability can be seen as
an ambiguous matter, to some extent dividing both consumers and producers: some parties have
been revealed to have a more negative perception of the impacts of organic production on the
41
environment than traditional production, although consumers and other actors of the food chain
generally have positive attitudes towards the production method. (Sarkkinen et al., 2006.) The
impact of the carbon footprint on consumers’ choice of meat products, on the other hand, has
been a less examined feature, and can be seen as presenting a research gap in the recent literature.
The studies incorporating heterogeneity into the analysis have been various and have measured
the impacts of diverse attributes on consumer choice. Among others, the nationality, age, income
level, attitudes and eating habits have been found to profile different consumer segments, and the
studies have inter alia revealed rather large price-conscious consumer groups. Smaller segments
having highly positive preferences for quality parameters such as responsible methods of
production or a health orientation have also been found, as well as groups that are generally
indifferent, or have high preferences for the origin of meat.
6 Data and empirical methods
6.1 Data description
The meat survey questionnaire was created by MTT Agrifood Research Finland in cooperation
with the National Consumer Research Centre in the spring of 2010. The data were gathered by
Taloustutkimus Oy in March 2010 with an online survey from 1623 consumers representative of
Finnish internet users. This national online consumer panel contains altogether 31 000
consumers who are from 15 to 79 years old.
The survey was tested before the actual study with a pilot of 50 respondents, and the attributes
were discovered to be functional. Taloustutkimus Oy sent a link to the online survey via email to
a representative sample of 4294 consumers out of whom 37,8% responded, yielding a sample size
of 1623 full answers. From the consumers that began answering, 14% dropped out before
finishing the survey.
The sociodemographic and -economic background of the respondents is represented in
Appendix I together with the population level data. The latter were gathered from the online
database of Statistics Finland. The figures show that the distributions of sex and residential
province of the respondents were very close to the population level distribution and that
occupational level distribution also corresponded somewhat to population level figures. Some
dissimilarities existed in the age structure, as the respondents of the survey were older than the
population in general. In addition the educational background, the household size and the gross
income of the households included some deviations from the population distributions, as the
42
respondents tended to be more highly educated and to live more often in households of two
persons and less often in households of one person than Finns in general. The income
distribution of the respondents was more symmetric than the population level income
distribution, which had a larger positive skew: compared to the population, the sample had less
people belonging to the highest and the lowest income group, and but in general the respondents
were wealthier than in the population. Some differences in the shares may result from different
interpretations of the sociodemographic classes. In addition, the comparisons between the survey
sample and population level statistics were based on originally partially different classification
scales, which might also bias the distributions. More explicit notes on the scales can be found
from the side of the figures in the appendix.
All in all, the comparability of the data to the population was at a reasonable level. In addition, as
the aim of this study was to examine the relative preferences of the consumers between product
attribute levels, and not per se to pursue full comparability to the Finnish population, no weights
were used to balance the sociodemographic differences.
Table 1 below illustrates general tendencies of the covariates that are used in explaining the
background of the consumers.
The respondents were slightly more probably women than men and their age distribution was a
little skewed towards the older part of the population. The income distribution was also skewed
to the higher income end of the scale. Around 45% of the respondents seemed to have only a
low educational level meaning that they were at most secondary school graduates. The
educational level should be treated as a suggestive factor, as even though the categorical variable
was significant, the dummy variable for high educational level (Lower- and higher-degree level
tertiary education) was revealed to be insignificant.
A share of 21% of the respondents were managers, entrepreneurs or other higher-level
employees, while 16% were lower-level employees and 18% workers. The mean income level of
the respondents was 20 to 40 thousands of euros a year, and on average the share of people living
in the metropolitan area was 26% while 32% lived in other big cities of over 50 000 citizens.
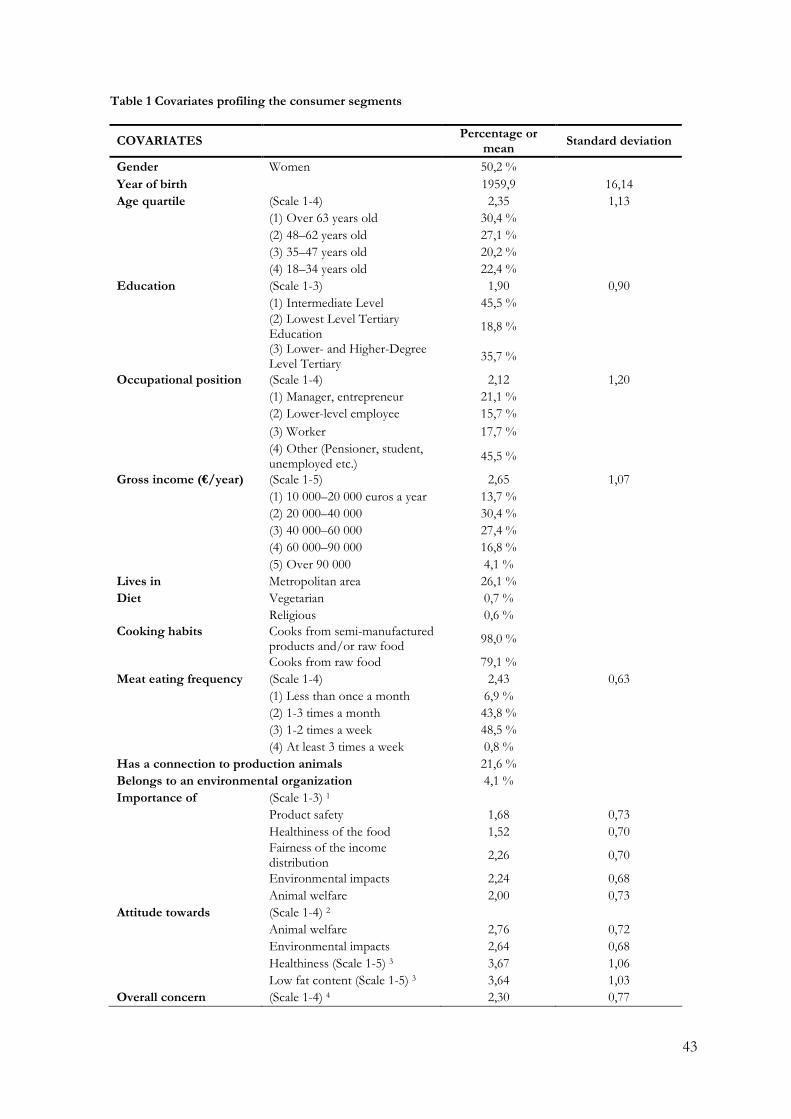
43
Table 1 Covariates profiling the consumer segments
COVARIATES Percentage or
mean Standard deviation
Gender Women 50,2 %
Year of birth 1959,9 16,14 Age quartile (Scale 1-4) 2,35 1,13 (1) Over 63 years old 30,4 % (2) 48–62 years old 27,1 % (3) 35–47 years old 20,2 % (4) 18–34 years old 22,4 % Education (Scale 1-3) 1,90 0,90 (1) Intermediate Level 45,5 %
(2) Lowest Level Tertiary Education
18,8 %
(3) Lower- and Higher-Degree Level Tertiary
35,7 %
Occupational position (Scale 1-4) 2,12 1,20 (1) Manager, entrepreneur 21,1 % (2) Lower-level employee 15,7 %
(3) Worker 17,7 %
(4) Other (Pensioner, student, unemployed etc.)
45,5 %
Gross income (€/year) (Scale 1-5) 2,65 1,07 (1) 10 000–20 000 euros a year 13,7 % (2) 20 000–40 000 30,4 % (3) 40 000–60 000 27,4 % (4) 60 000–90 000 16,8 % (5) Over 90 000 4,1 % Lives in Metropolitan area 26,1 % Diet Vegetarian 0,7 % Religious 0,6 % Cooking habits Cooks from semi-manufactured
products and/or raw food 98,0 %
Cooks from raw food 79,1 % Meat eating frequency (Scale 1-4) 2,43 0,63
(1) Less than once a month 6,9 % (2) 1-3 times a month 43,8 % (3) 1-2 times a week 48,5 % (4) At least 3 times a week 0,8 %
Has a connection to production animals 21,6 % Belongs to an environmental organization 4,1 % Importance of (Scale 1-3) 1 Product safety 1,68 0,73 Healthiness of the food 1,52 0,70
Fairness of the income distribution
2,26 0,70
Environmental impacts 2,24 0,68 Animal welfare 2,00 0,73 Attitude towards (Scale 1-4) 2 Animal welfare 2,76 0,72 Environmental impacts 2,64 0,68 Healthiness (Scale 1-5) 3 3,67 1,06 Low fat content (Scale 1-5) 3 3,64 1,03 Overall concern (Scale 1-4) 4 2,30 0,77

44
Votes for The Centre Party 11,5 % The Green League 11,2 %
1) 1= most important, 3 = least important; 2) 1 = indifferent or not important, 4= positive or important; 3) 1 = indifferent or not important, 5= positive or important 4) 1 = indifferent, 4 = concerned or important;
Vegetarians comprised 0,7% of the whole sample and 0,6% followed a diet for religious reasons.
Cooking was very common among the respondents: 98% cooked mainly from semi-
manufactured food products or raw food, and 79% mainly from raw food. The meat eating
frequency was an average calculated based on several meat type –specific frequencies: if the
respondent belonged to the class (4) At least 3 times a week he had responded to most of the five
meat type –specific frequency questions “at least 3 times a week”, resulting to at least 15 meals
including meat a week. The meat types included beef, pork, poultry, game and mutton meat. This
explains the skew of the distribution towards the occasional end of the scale.
Over 20% of the respondents had or had had a connection to breeding production animals or to
meat production, the range in the segments being from 15% to 27%. 4% of the respondents
belonged to an environmental or an animal protection organization. Some differences prevailed
also between the segments, the shares ranging from 1,4% to 8%.
The importance covariate was generated by asking the consumers to rank the different product
features of the food chain in the order of importance. Table 1 above reveals that in general
healthiness of the food was seen as the most important feature, followed by food safety and
animal wellbeing. Environmental impacts and fair income distribution between the members of
the food chain were ranked as the least important features by the respondents.
Consumers’ attitudes towards animal welfare, environment friendly production, healthiness and
low fat content were in general positive, most of these variables being by and large perceived as
somewhat important or quite important. For instance the higher the value of the covariate
environmental attitude, the more the respondent cared for environmentally sound products.
Most respondents also stated being quite or somewhat concerned over issues related to food
production and its future developments. On average 11,5% of the respondents voted for the
Centre Party and 11,2% for the Green league, these two parties being the only ones significantly
explaining the latent class membership of the consumes.
45
6.2 Survey design and choice of variables
The survey contained several question series studying different aspects of consumers’ attitudes
towards meat products and production. The survey included questions about the
sociodemographics of the respondents, their diet, and their eating and purchasing habits. For
example some questions asked whether the respondents have felt that their habits have been
influenced by factors like animal diseases or environmental effects of the products and some
questions asked to rate how important different aspects of product safety, healthiness, local
production and such are to them. Questions were posed on the information the respondents
would want to have when making purchase decisions, and on how good certain means like labels,
actually are perceived to be in communicating this information to them. One section of the
survey focused on the respondent’s willingness to purchase native breed meat, and one series of
questions mapped the level of concern of the respondents, regarding the recent or potential
future development of the food industry. These questions were used in describing the
heterogeneous consumer classes by forming variables describing the socioeconomic, attitudinal
and other characteristics of the respondents. These variables and the questions that were in the
background of the variables at issue are listed in Appendix V.
The choice experiment analysed in this study was situated somewhat at the end of the survey.
The other questions were utilized to describe the background of the respondents and in the latent
class model as inactive covariates, in order to profile the heterogeneous consumer classes.
The choice experiment contained two sub-samples: the choice sets in the first one were
presented without information on the carbon footprint, having thus only three attributes for each
product, whereas the choice sets in the second sub-sample had information on the size of the
carbon footprint as a fourth product attribute. The sub-samples were created with the intention
of testing whether the information on the carbon footprint had an impact on the consumer’s
choice of minced meat: The carbon footprint level follows directly the meat product type, beef
products having a largefootprint and pork products having a small one. The only difference
between the goods presented to the sub-samples was therefore the extent of information
provided - the goods per se were identical.
Each respondent faced altogether six choice sets. The experimental design of the choice sets, or
the combination of the attribute levels into different choice scenarios was determined using
balanced overlap design and the Sawtooth software. This makes it possible to include interactions
of the attributes into the choice analysis to test the efficiency of the choice set and to let the
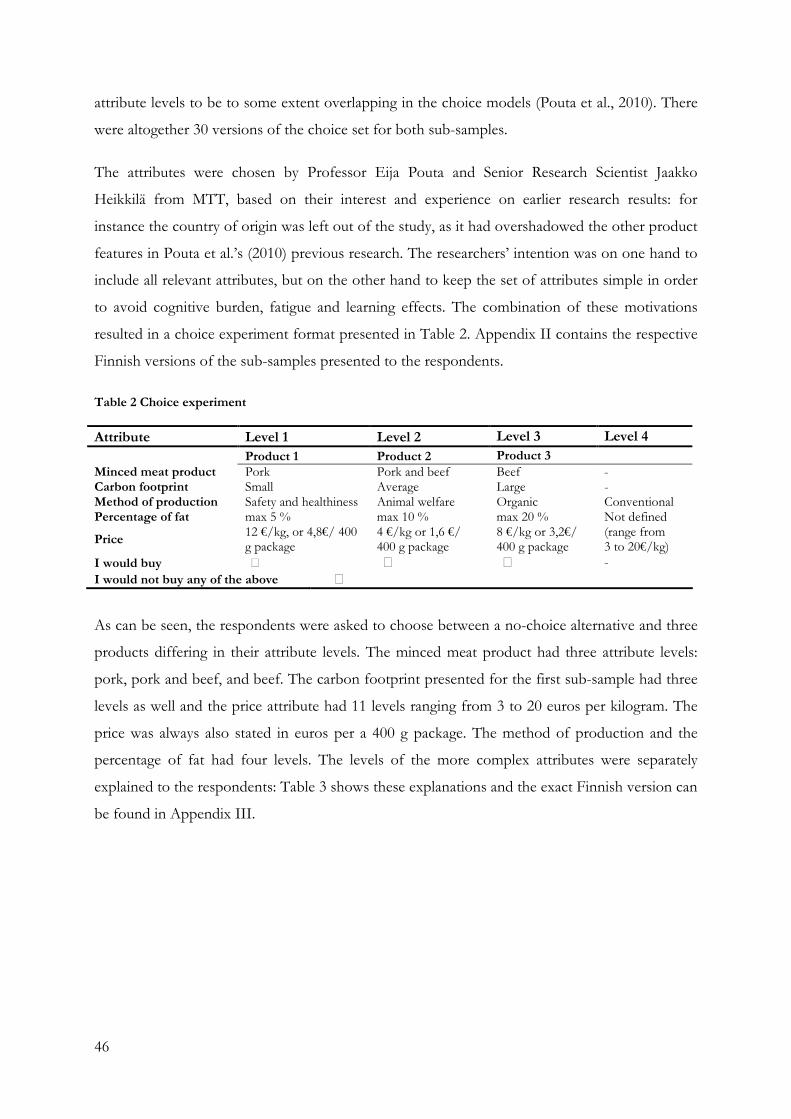
46
attribute levels to be to some extent overlapping in the choice models (Pouta et al., 2010). There
were altogether 30 versions of the choice set for both sub-samples.
The attributes were chosen by Professor Eija Pouta and Senior Research Scientist Jaakko
Heikkilä from MTT, based on their interest and experience on earlier research results: for
instance the country of origin was left out of the study, as it had overshadowed the other product
features in Pouta et al.’s (2010) previous research. The researchers’ intention was on one hand to
include all relevant attributes, but on the other hand to keep the set of attributes simple in order
to avoid cognitive burden, fatigue and learning effects. The combination of these motivations
resulted in a choice experiment format presented in Table 2. Appendix II contains the respective
Finnish versions of the sub-samples presented to the respondents.
Table 2 Choice experiment
Attribute Level 1 Level 2 Level 3 Level 4 Product 1 Product 2 Product 3 Minced meat product Pork Pork and beef Beef - Carbon footprint Small Average Large - Method of production Safety and healthiness Animal welfare Organic Conventional Percentage of fat max 5 % max 10 % max 20 % Not defined
Price 12 €/kg, or 4,8€/ 400 g package
4 €/kg or 1,6 €/ 400 g package
8 €/kg or 3,2€/ 400 g package
(range from 3 to 20€/kg)
I would buy 䦋 䦋 䦋 -
I would not buy any of the above D
As can be seen, the respondents were asked to choose between a no-choice alternative and three
products differing in their attribute levels. The minced meat product had three attribute levels:
pork, pork and beef, and beef. The carbon footprint presented for the first sub-sample had three
levels as well and the price attribute had 11 levels ranging from 3 to 20 euros per kilogram. The
price was always also stated in euros per a 400 g package. The method of production and the
percentage of fat had four levels. The levels of the more complex attributes were separately
explained to the respondents: Table 3 shows these explanations and the exact Finnish version can
be found in Appendix III.
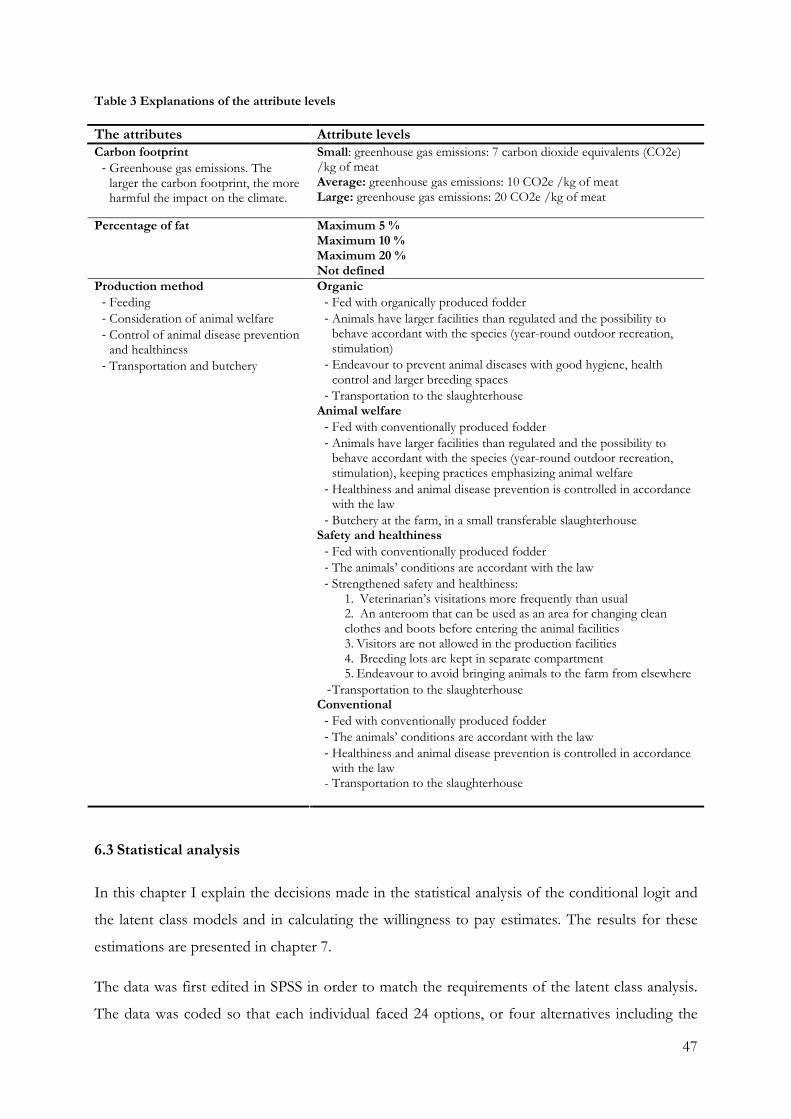
47
Table 3 Explanations of the attribute levels
The attributes Attribute levels Carbon footprint - Greenhouse gas emissions. The larger the carbon footprint, the more harmful the impact on the climate.
Small: greenhouse gas emissions: 7 carbon dioxide equivalents (CO2e) /kg of meat Average: greenhouse gas emissions: 10 CO2e /kg of meat Large: greenhouse gas emissions: 20 CO2e /kg of meat
Maximum 5 % Maximum 10 % Maximum 20 %
Percentage of fat
Not defined Organic - Fed with organically produced fodder - Animals have larger facilities than regulated and the possibility to behave accordant with the species (year-round outdoor recreation, stimulation)
- Endeavour to prevent animal diseases with good hygiene, health control and larger breeding spaces
- Transportation to the slaughterhouse Animal welfare - Fed with conventionally produced fodder - Animals have larger facilities than regulated and the possibility to behave accordant with the species (year-round outdoor recreation, stimulation), keeping practices emphasizing animal welfare
- Healthiness and animal disease prevention is controlled in accordance with the law
- Butchery at the farm, in a small transferable slaughterhouse Safety and healthiness - Fed with conventionally produced fodder - The animals’ conditions are accordant with the law - Strengthened safety and healthiness:
1. Veterinarian’s visitations more frequently than usual 2. An anteroom that can be used as an area for changing clean clothes and boots before entering the animal facilities 3. Visitors are not allowed in the production facilities 4. Breeding lots are kept in separate compartment 5. Endeavour to avoid bringing animals to the farm from elsewhere
- Transportation to the slaughterhouse
Production method - Feeding - Consideration of animal welfare - Control of animal disease prevention and healthiness
- Transportation and butchery
Conventional - Fed with conventionally produced fodder - The animals’ conditions are accordant with the law - Healthiness and animal disease prevention is controlled in accordance with the law
- Transportation to the slaughterhouse
6.3 Statistical analysis
In this chapter I explain the decisions made in the statistical analysis of the conditional logit and
the latent class models and in calculating the willingness to pay estimates. The results for these
estimations are presented in chapter 7.
The data was first edited in SPSS in order to match the requirements of the latent class analysis.
The data was coded so that each individual faced 24 options, or four alternatives including the
48
no-choice option for each of the 6 choice sets. It was then exported to Latent GOLD Choice®.
The dependent variable in the model was the choice probability of alternative i from the choice
set, explained by the attribute levels of the alternatives. The null hypothesis for the conditional
logit and latent class models was thus that the attribute levels do not have an impact on the
product choice probability, and additionally for the latent class model that the class-specific
parameters do not differ from one another. The choice was coded as a dummy variable being
equal to one if the alternative had been chosen and zero if not. Price was treated as a continuous
variable and the other attributes were coded as dummy variables, taking either the value 0 or 1.
For every dummy attribute one level was defined as a reference level and it was left out of the
model to avoid perfect multicollinearity. Some of the attribute levels were interacted with each
other in order to find out whether significant interaction effects exist. The attributes were
assigned to have zero values in the case of the fourth (no-choice) option of each choice set as in
Vermeulen at al. (2008). The adequacy of this decision was tested by running a tentative
estimation also with a row of missing values for the no-choice alternatives, and the parameter
estimates were found to be equal for both versions.
The choice of the interactions was based on the researchers’ perception of the potential of having
significant impacts. The interactions having price as the other variable were coded as continuous
and the ones based on two dummies as dummy variables. The alternative-specific constants were
included in the model in order to capture the systematic bias that might have otherwise
influenced the parameters, and to be able to examine respondents’ preferences for the no-choice
option.
Appendix IV contains detailed information on the coding of the attributes and the interactions
that were included in the iterative search of the optimal conditional logit and latent class models.
The tables in chapter 7 that report the results of the estimations show the variables eventually
used in the optimal conditional logit and latent class models.
The conditional logit and latent class analyses were performed for the joint data containing both
sub-samples, and the impact of mentioning the carbon footprint was taken into account by
interacting a product type variable with a variable revealing the membership of the sub-sample.
As reported later in chapter 7 this interaction showed that a joint impact was present, so the
conditional logit analysis was run also separately for the two sub-samples to see whether other
interesting differences would arise.
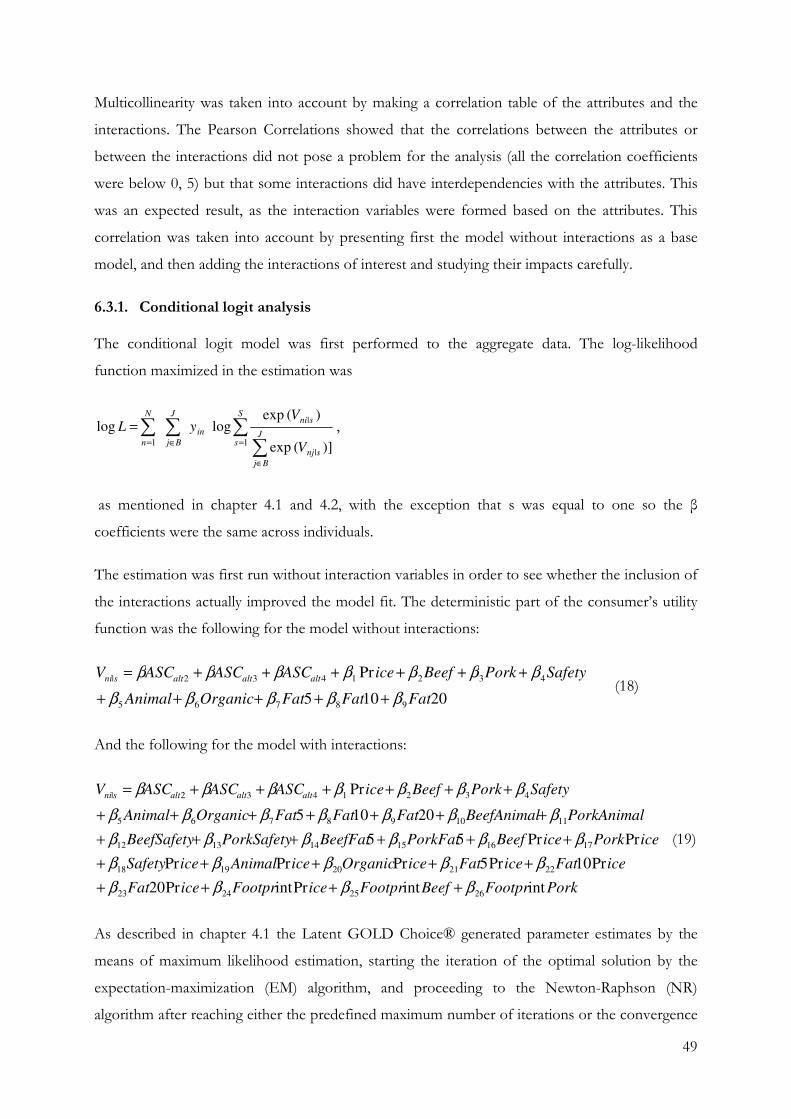
49
Multicollinearity was taken into account by making a correlation table of the attributes and the
interactions. The Pearson Correlations showed that the correlations between the attributes or
between the interactions did not pose a problem for the analysis (all the correlation coefficients
were below 0, 5) but that some interactions did have interdependencies with the attributes. This
was an expected result, as the interaction variables were formed based on the attributes. This
correlation was taken into account by presenting first the model without interactions as a base
model, and then adding the interactions of interest and studying their impacts carefully.
6.3.1. Conditional logit analysis
The conditional logit model was first performed to the aggregate data. The log-likelihood
function maximized in the estimation was
∑∑
∑∑=
∈
∈=
=S
sJ
Bj
snj
sni
in
J
Bj
N
n V
V yL
1|
|
1 )]( exp
)( exploglog ,
as mentioned in chapter 4.1 and 4.2, with the exception that s was equal to one so the β
coefficients were the same across individuals.
The estimation was first run without interaction variables in order to see whether the inclusion of
the interactions actually improved the model fit. The deterministic part of the consumer’s utility
function was the following for the model without interactions:
20105
Pr
98765
4321432|
FatFatFatOrganicAnimal
SafetyPorkBeeficeASCASCASCV altaltaltsni
βββββ
βββββββ
+++++
++++++= (18)
And the following for the model with interactions:
PorkFootprBeefFootpriceFootpriceFat
iceFaticeFaticeOrganiciceAnimaliceSafety
icePorkiceBeefPorkFatBeefFatPorkSafetyBeefSafety
PorkAnimalBeefAnimalFatFatFatOrganicAnimal
SafetyPorkBeeficeASCASCASCV altaltaltsni
intintPrintPr20
Pr10Pr5PrPrPr
PrPr55
20105
Pr
26252423
2221201918
171615141312
111098765
4321432|
ββββ
βββββ
ββββββ
βββββββ
βββββββ
++++
+++++
++++++
+++++++
++++++=
(19)
As described in chapter 4.1 the Latent GOLD Choice® generated parameter estimates by the
means of maximum likelihood estimation, starting the iteration of the optimal solution by the
expectation-maximization (EM) algorithm, and proceeding to the Newton-Raphson (NR)
algorithm after reaching either the predefined maximum number of iterations or the convergence
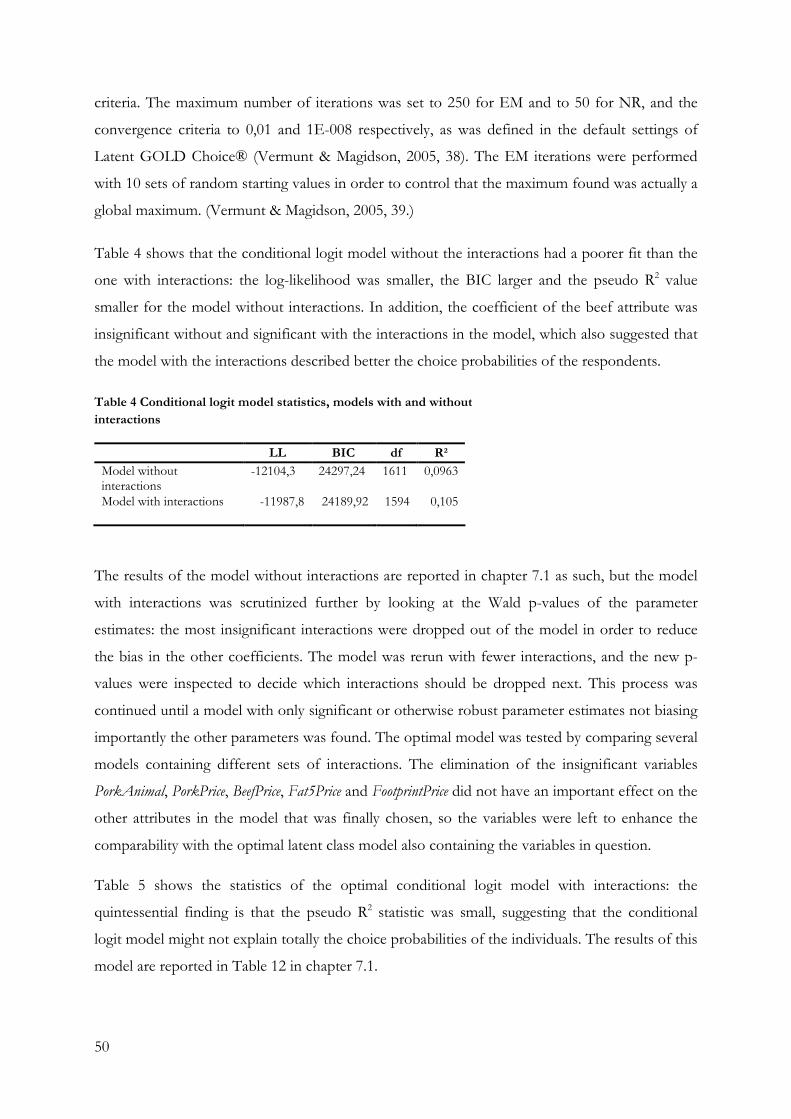
50
criteria. The maximum number of iterations was set to 250 for EM and to 50 for NR, and the
convergence criteria to 0,01 and 1E-008 respectively, as was defined in the default settings of
Latent GOLD Choice® (Vermunt & Magidson, 2005, 38). The EM iterations were performed
with 10 sets of random starting values in order to control that the maximum found was actually a
global maximum. (Vermunt & Magidson, 2005, 39.)
Table 4 shows that the conditional logit model without the interactions had a poorer fit than the
one with interactions: the log-likelihood was smaller, the BIC larger and the pseudo R2 value
smaller for the model without interactions. In addition, the coefficient of the beef attribute was
insignificant without and significant with the interactions in the model, which also suggested that
the model with the interactions described better the choice probabilities of the respondents.
Table 4 Conditional logit model statistics, models with and without interactions
LL BIC df R²
Model without interactions
-12104,3 24297,24 1611 0,0963
Model with interactions -11987,8 24189,92 1594 0,105
The results of the model without interactions are reported in chapter 7.1 as such, but the model
with interactions was scrutinized further by looking at the Wald p-values of the parameter
estimates: the most insignificant interactions were dropped out of the model in order to reduce
the bias in the other coefficients. The model was rerun with fewer interactions, and the new p-
values were inspected to decide which interactions should be dropped next. This process was
continued until a model with only significant or otherwise robust parameter estimates not biasing
importantly the other parameters was found. The optimal model was tested by comparing several
models containing different sets of interactions. The elimination of the insignificant variables
PorkAnimal, PorkPrice, BeefPrice, Fat5Price and FootprintPrice did not have an important effect on the
other attributes in the model that was finally chosen, so the variables were left to enhance the
comparability with the optimal latent class model also containing the variables in question.
Table 5 shows the statistics of the optimal conditional logit model with interactions: the
quintessential finding is that the pseudo R2 statistic was small, suggesting that the conditional
logit model might not explain totally the choice probabilities of the individuals. The results of this
model are reported in Table 12 in chapter 7.1.
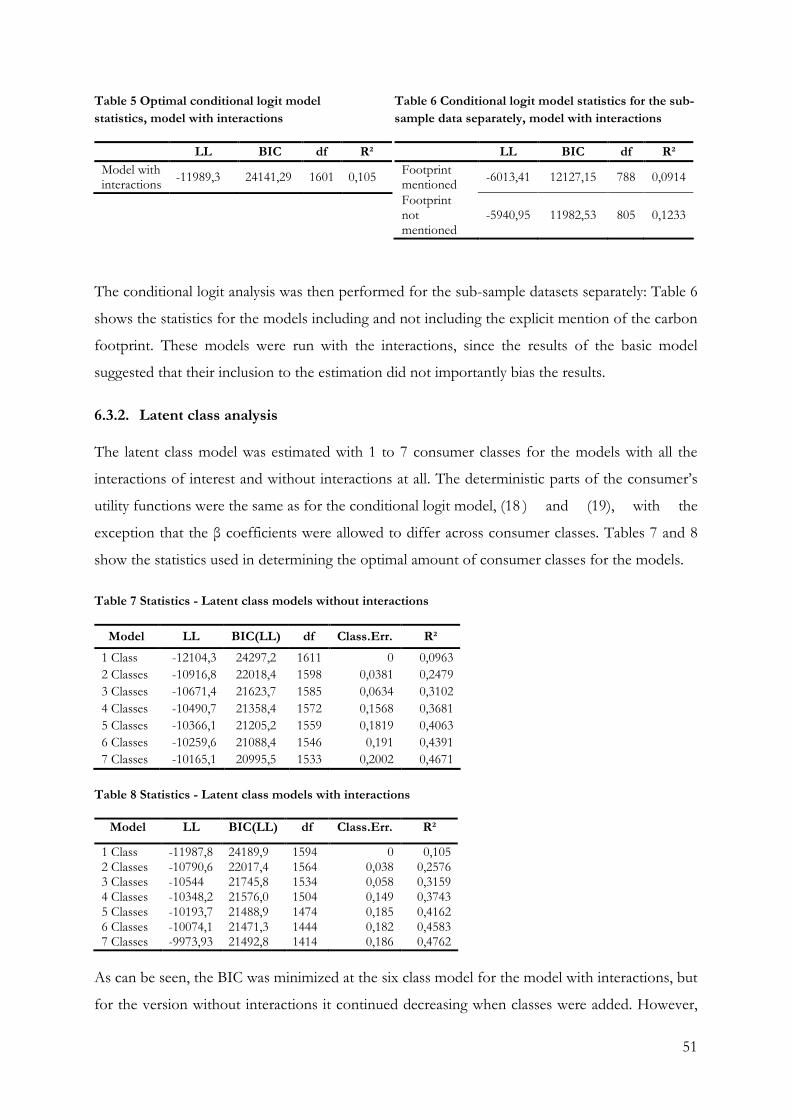
51
Table 5 Optimal conditional logit model statistics, model with interactions
LL BIC df R²
Model with interactions
-11989,3 24141,29 1601 0,105
Table 6 Conditional logit model statistics for the sub- sample data separately, model with interactions
LL BIC df R²
Footprint mentioned
-6013,41 12127,15 788 0,0914
Footprint not mentioned
-5940,95 11982,53 805 0,1233
The conditional logit analysis was then performed for the sub-sample datasets separately: Table 6
shows the statistics for the models including and not including the explicit mention of the carbon
footprint. These models were run with the interactions, since the results of the basic model
suggested that their inclusion to the estimation did not importantly bias the results.
6.3.2. Latent class analysis
The latent class model was estimated with 1 to 7 consumer classes for the models with all the
interactions of interest and without interactions at all. The deterministic parts of the consumer’s
utility functions were the same as for the conditional logit model, (18 ) and (19), with the
exception that the β coefficients were allowed to differ across consumer classes. Tables 7 and 8
show the statistics used in determining the optimal amount of consumer classes for the models.
Table 7 Statistics - Latent class models without interactions
Model LL BIC(LL) df Class.Err. R²
1 Class -12104,3 24297,2 1611 0 0,0963 2 Classes -10916,8 22018,4 1598 0,0381 0,2479 3 Classes -10671,4 21623,7 1585 0,0634 0,3102 4 Classes -10490,7 21358,4 1572 0,1568 0,3681 5 Classes -10366,1 21205,2 1559 0,1819 0,4063 6 Classes -10259,6 21088,4 1546 0,191 0,4391 7 Classes -10165,1 20995,5 1533 0,2002 0,4671
Table 8 Statistics - Latent class models with interactions
Model LL BIC(LL) df Class.Err. R²
1 Class -11987,8 24189,9 1594 0 0,105 2 Classes -10790,6 22017,4 1564 0,038 0,2576 3 Classes -10544 21745,8 1534 0,058 0,3159 4 Classes -10348,2 21576,0 1504 0,149 0,3743 5 Classes -10193,7 21488,9 1474 0,185 0,4162 6 Classes -10074,1 21471,3 1444 0,182 0,4583 7 Classes -9973,93 21492,8 1414 0,186 0,4762
As can be seen, the BIC was minimized at the six class model for the model with interactions, but
for the version without interactions it continued decreasing when classes were added. However,
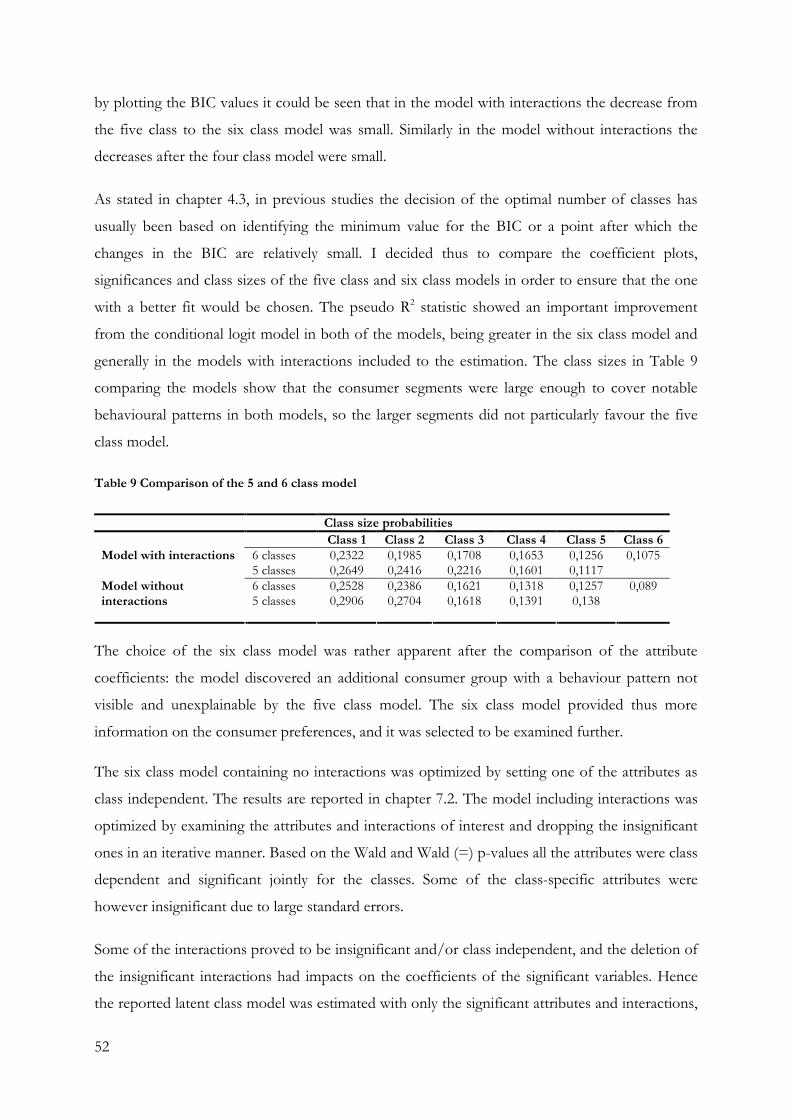
52
by plotting the BIC values it could be seen that in the model with interactions the decrease from
the five class to the six class model was small. Similarly in the model without interactions the
decreases after the four class model were small.
As stated in chapter 4.3, in previous studies the decision of the optimal number of classes has
usually been based on identifying the minimum value for the BIC or a point after which the
changes in the BIC are relatively small. I decided thus to compare the coefficient plots,
significances and class sizes of the five class and six class models in order to ensure that the one
with a better fit would be chosen. The pseudo R2 statistic showed an important improvement
from the conditional logit model in both of the models, being greater in the six class model and
generally in the models with interactions included to the estimation. The class sizes in Table 9
comparing the models show that the consumer segments were large enough to cover notable
behavioural patterns in both models, so the larger segments did not particularly favour the five
class model.
Table 9 Comparison of the 5 and 6 class model
The choice of the six class model was rather apparent after the comparison of the attribute
coefficients: the model discovered an additional consumer group with a behaviour pattern not
visible and unexplainable by the five class model. The six class model provided thus more
information on the consumer preferences, and it was selected to be examined further.
The six class model containing no interactions was optimized by setting one of the attributes as
class independent. The results are reported in chapter 7.2. The model including interactions was
optimized by examining the attributes and interactions of interest and dropping the insignificant
ones in an iterative manner. Based on the Wald and Wald (=) p-values all the attributes were class
dependent and significant jointly for the classes. Some of the class-specific attributes were
however insignificant due to large standard errors.
Some of the interactions proved to be insignificant and/or class independent, and the deletion of
the insignificant interactions had impacts on the coefficients of the significant variables. Hence
the reported latent class model was estimated with only the significant attributes and interactions,
Class size probabilities Class 1 Class 2 Class 3 Class 4 Class 5 Class 6
6 classes 0,2322 0,1985 0,1708 0,1653 0,1256 0,1075 Model with interactions 5 classes 0,2649 0,2416 0,2216 0,1601 0,1117 6 classes 0,2528 0,2386 0,1621 0,1318 0,1257 0,089 Model without
interactions 5 classes 0,2906 0,2704 0,1618 0,1391 0,138
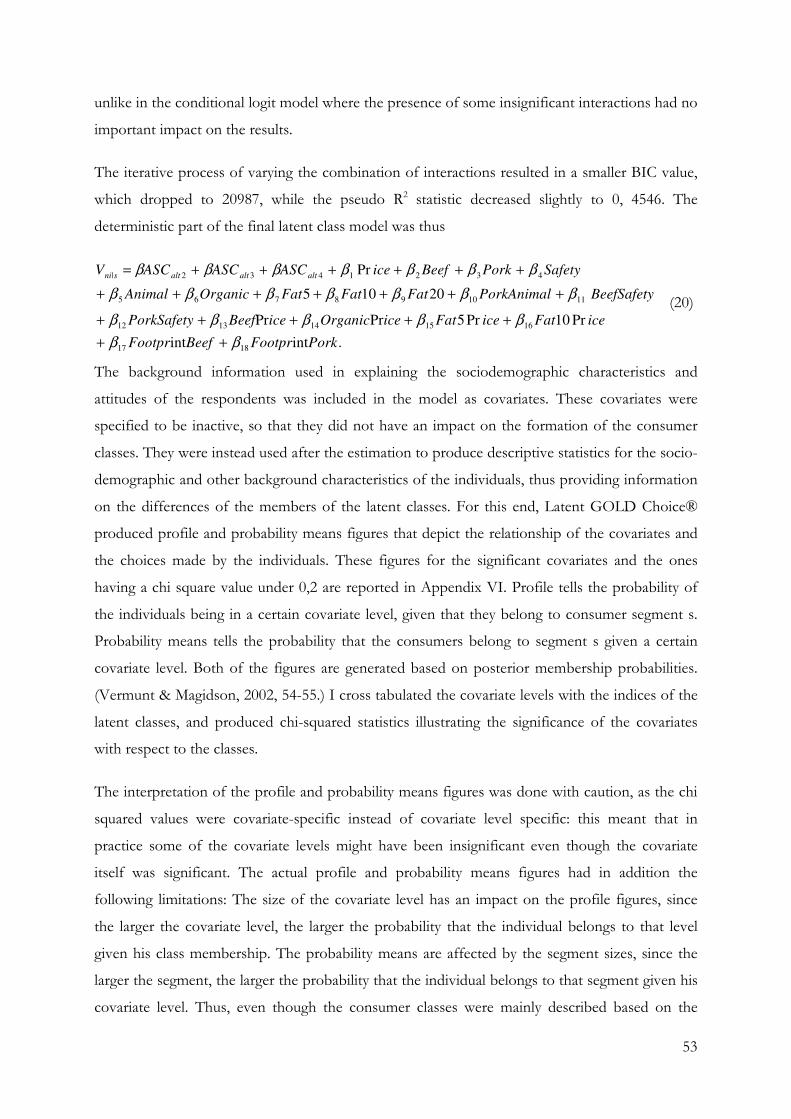
53
unlike in the conditional logit model where the presence of some insignificant interactions had no
important impact on the results.
The iterative process of varying the combination of interactions resulted in a smaller BIC value,
which dropped to 20987, while the pseudo R2 statistic decreased slightly to 0, 4546. The
deterministic part of the final latent class model was thus
.intint
Pr10Pr5PrPr
20105
Pr
1817
1615141312
111098765
4321432|
PorkFootprBeefFootpr
iceFaticeFaticeOrganiciceBeefPorkSafety
BeefSafetyPorkAnimalFatFatFatOrganicAnimal
SafetyPorkBeeficeASCASCASCV altaltaltsni
ββ
βββββ
βββββββ
βββββββ
++
+++++
+++++++
++++++=
(20)
The background information used in explaining the sociodemographic characteristics and
attitudes of the respondents was included in the model as covariates. These covariates were
specified to be inactive, so that they did not have an impact on the formation of the consumer
classes. They were instead used after the estimation to produce descriptive statistics for the socio-
demographic and other background characteristics of the individuals, thus providing information
on the differences of the members of the latent classes. For this end, Latent GOLD Choice®
produced profile and probability means figures that depict the relationship of the covariates and
the choices made by the individuals. These figures for the significant covariates and the ones
having a chi square value under 0,2 are reported in Appendix VI. Profile tells the probability of
the individuals being in a certain covariate level, given that they belong to consumer segment s.
Probability means tells the probability that the consumers belong to segment s given a certain
covariate level. Both of the figures are generated based on posterior membership probabilities.
(Vermunt & Magidson, 2002, 54-55.) I cross tabulated the covariate levels with the indices of the
latent classes, and produced chi-squared statistics illustrating the significance of the covariates
with respect to the classes.
The interpretation of the profile and probability means figures was done with caution, as the chi
squared values were covariate-specific instead of covariate level specific: this meant that in
practice some of the covariate levels might have been insignificant even though the covariate
itself was significant. The actual profile and probability means figures had in addition the
following limitations: The size of the covariate level has an impact on the profile figures, since
the larger the covariate level, the larger the probability that the individual belongs to that level
given his class membership. The probability means are affected by the segment sizes, since the
larger the segment, the larger the probability that the individual belongs to that segment given his
covariate level. Thus, even though the consumer classes were mainly described based on the

54
profile figures, the probability means (probmeans) figures were included Appendix VI in order to
be able to some extent account for the impact of the covariate level sizes.
A more precise analysis of the covariates could have been done by estimating a multinomial logit
model having the class memberships of the individuals as the dependent variable, and the
covariates as the independent variables explaining the segment membership. I however left this
to be realized in further research, as the current precision of the results was seen as being
sufficient for the scope of this study.
The covariates were coded partly as dummies and partly as continuous variables, depending on
the formulation of the corresponding questions in the survey: Some variables were taken directly
from the survey and some were rescaled to have fewer categories. Some covariates were formed
by calculating an average for variables describing similar kinds of phenomenon, which resulted in
one covariate containing the aggregated information of all these answers. The internal
consistency or the ability of this kind of averaged variables to describe the same phenomena was
tested with a reliability coefficient named the Cronbach’s Alpha: when the Alpha was above 0, 6,
the aggregated variables were able to describe together the phenomenon in a consistent way.
(Malhotra & Birks, 2006.)
6.3.3. The willingness to pay estimates
The marginal impacts or the implicit prices for particular attributes were calculated by
s
s
price
levelattribute
)(
)( - MWTPs
β
β= .
They tell how much consumers are willing to pay for product attributes in absolute terms. In
order to generate product specific WTP estimates, I decided first on the particular products that I
wanted to examine and used then the following formulation presented in chapter 4.4 to compute
the product-specific willingness to pay estimates relative to a baseline product:
−
= ∑∑
∈∈ Bi
B
s
Bis
leveltcoefficienleveltcoefficienprice
)exp(ln)exp(ln)(
1 - WTP B
iissβ
.
The attribute level was equal to 1 for the attributes related to the product and 0 for the features
not present, since all the attributes expect for the price had been coded as dummies. For example
the exponential function of a beef product produced in a conventional manner, having a fat
content of 5% and belonging to the sub-sample where the footprint was mentioned was equal to
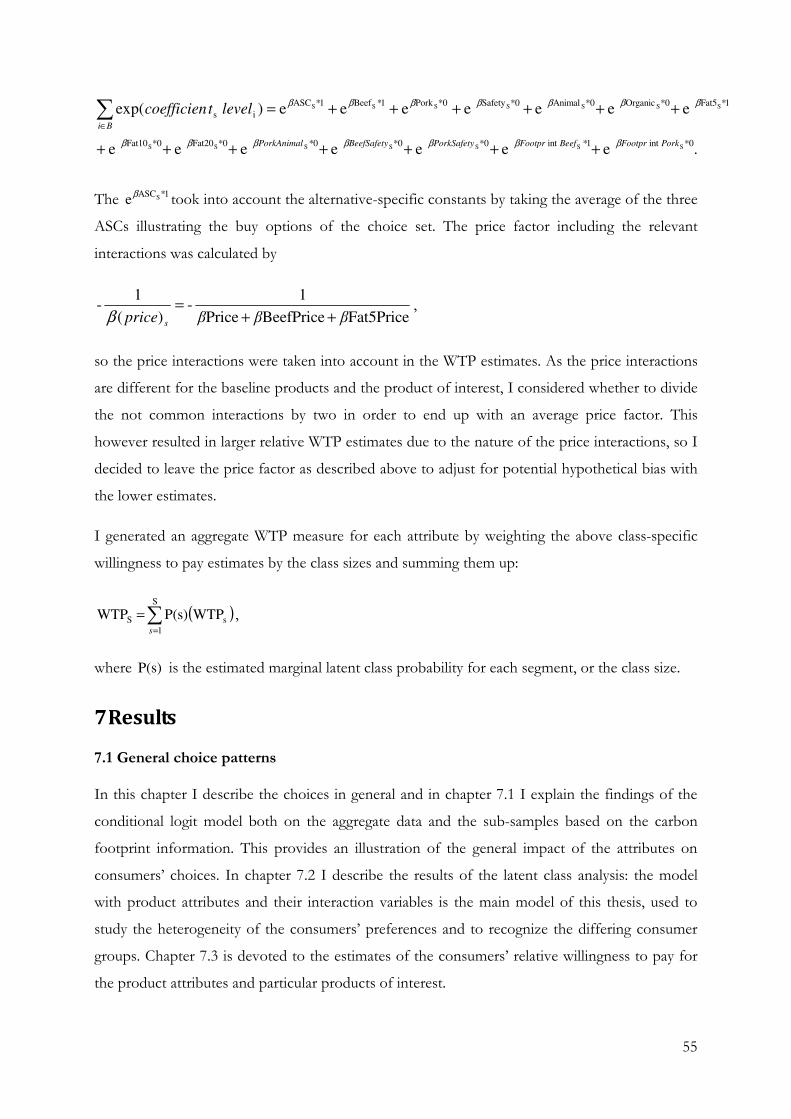
55
. e e e e e e e
e e e ee ee)exp(
0*int1*int0*0*0*0*Fat200*Fat10
1*Fat50*Organic0*Animal 0*Safety0*Pork1*Beef1*ASC
is
SSSSSSS
SSSSSSS
PorkFootprBeefFootprPorkSafetyBeefSafetyPorkAnimal
Bi
leveltcoefficien
βββββββ
βββββββ
+++++++
++++++=∑∈
The 1*ASCSeβ took into account the alternative-specific constants by taking the average of the three
ASCs illustrating the buy options of the choice set. The price factor including the relevant
interactions was calculated by
Fat5PriceBeefPricePrice
1 -
)(
1 -
βββprice s ++=
β,
so the price interactions were taken into account in the WTP estimates. As the price interactions
are different for the baseline products and the product of interest, I considered whether to divide
the not common interactions by two in order to end up with an average price factor. This
however resulted in larger relative WTP estimates due to the nature of the price interactions, so I
decided to leave the price factor as described above to adjust for potential hypothetical bias with
the lower estimates.
I generated an aggregate WTP measure for each attribute by weighting the above class-specific
willingness to pay estimates by the class sizes and summing them up:
( )∑=
=S
1
sS WTPP(s) WTPs
,
where P(s) is the estimated marginal latent class probability for each segment, or the class size.
7 Results
7.1 General choice patterns
In this chapter I describe the choices in general and in chapter 7.1 I explain the findings of the
conditional logit model both on the aggregate data and the sub-samples based on the carbon
footprint information. This provides an illustration of the general impact of the attributes on
consumers’ choices. In chapter 7.2 I describe the results of the latent class analysis: the model
with product attributes and their interaction variables is the main model of this thesis, used to
study the heterogeneity of the consumers’ preferences and to recognize the differing consumer
groups. Chapter 7.3 is devoted to the estimates of the consumers’ relative willingness to pay for
the product attributes and particular products of interest.
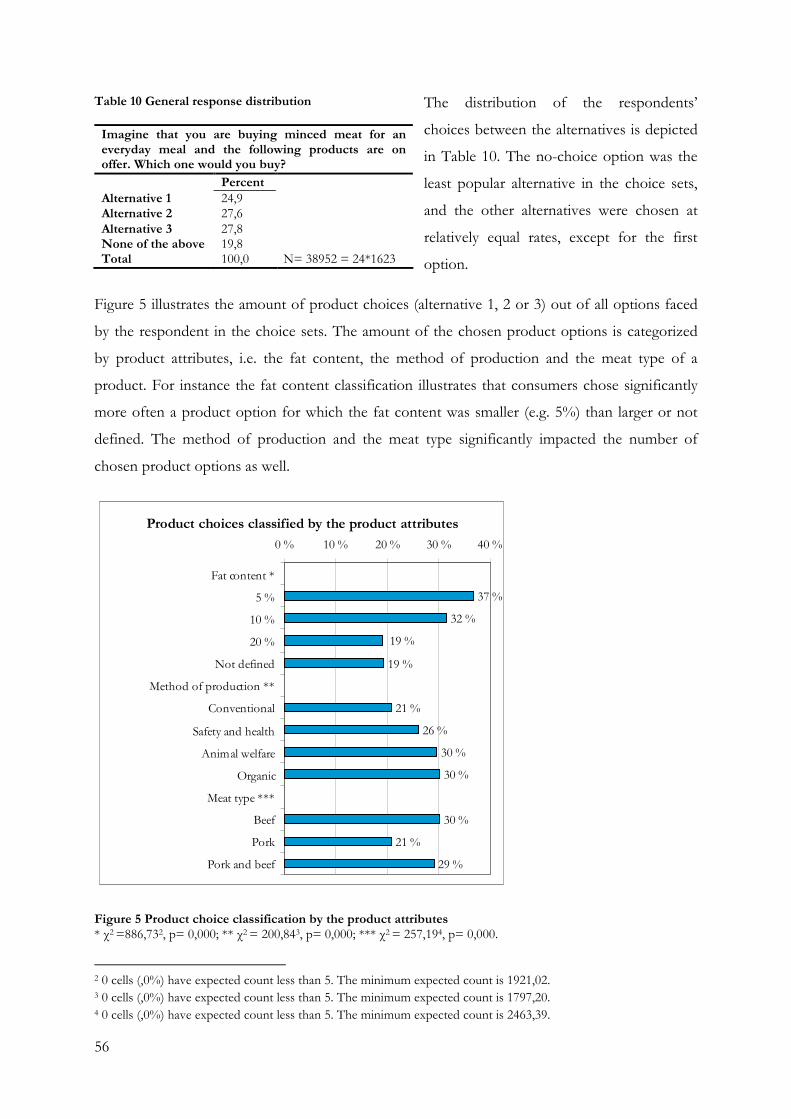
56
The distribution of the respondents’
choices between the alternatives is depicted
in Table 10. The no-choice option was the
least popular alternative in the choice sets,
and the other alternatives were chosen at
relatively equal rates, except for the first
option.
Figure 5 illustrates the amount of product choices (alternative 1, 2 or 3) out of all options faced
by the respondent in the choice sets. The amount of the chosen product options is categorized
by product attributes, i.e. the fat content, the method of production and the meat type of a
product. For instance the fat content classification illustrates that consumers chose significantly
more often a product option for which the fat content was smaller (e.g. 5%) than larger or not
defined. The method of production and the meat type significantly impacted the number of
chosen product options as well.
Product choices classified by the product attributes
37 %
32 %
19 %
21 %
26 %
30 %
30 %
30 %
21 %
29 %
19 %
0 % 10 % 20 % 30 % 40 %
Fat content *
5 %
10 %
20 %
Not defined
Method of production **
Conventional
Safety and health
Animal welfare
Organic
Meat type ***
Beef
Pork
Pork and beef
Figure 5 Product choice classification by the product attributes * χ2 =886,732, p= 0,000; ** χ2 = 200,843, p= 0,000; *** χ2 = 257,194, p= 0,000.
2 0 cells (,0%) have expected count less than 5. The minimum expected count is 1921,02. 3 0 cells (,0%) have expected count less than 5. The minimum expected count is 1797,20. 4 0 cells (,0%) have expected count less than 5. The minimum expected count is 2463,39.
Table 10 General response distribution
Imagine that you are buying minced meat for an everyday meal and the following products are on offer. Which one would you buy?
Percent Alternative 1 24,9 Alternative 2 27,6 Alternative 3 27,8 None of the above 19,8 Total 100,0 N= 38952 = 24*1623
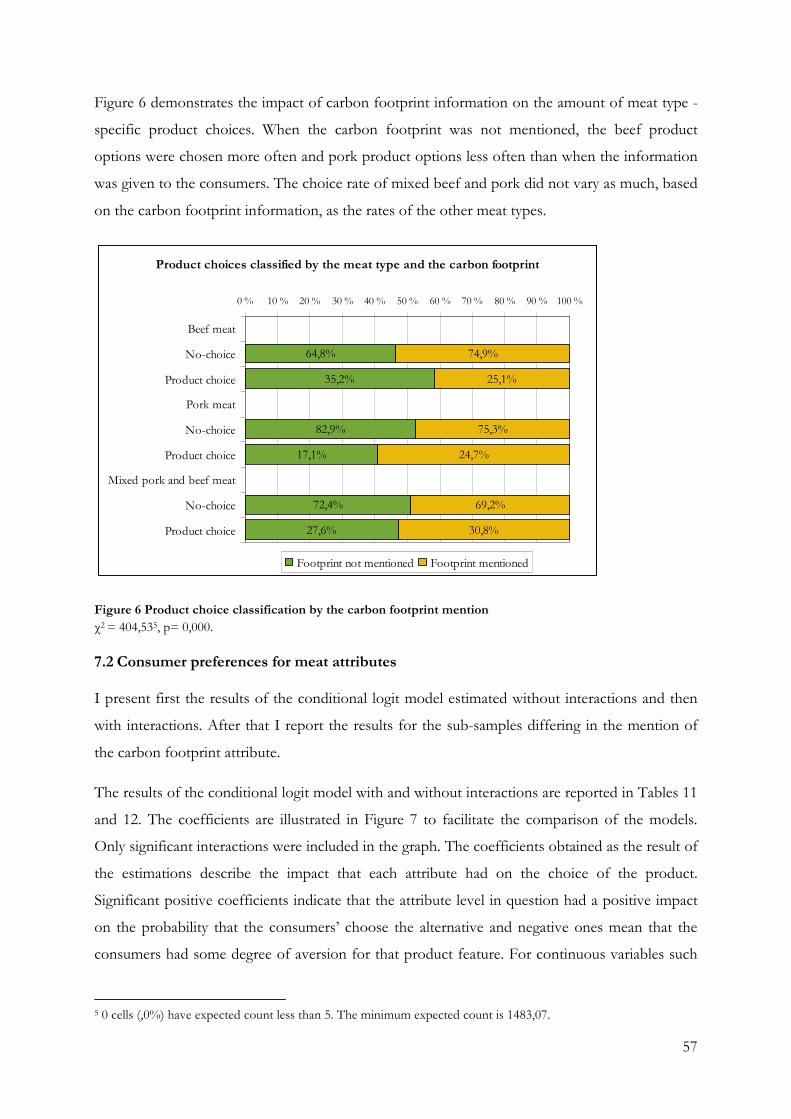
57
Figure 6 demonstrates the impact of carbon footprint information on the amount of meat type -
specific product choices. When the carbon footprint was not mentioned, the beef product
options were chosen more often and pork product options less often than when the information
was given to the consumers. The choice rate of mixed beef and pork did not vary as much, based
on the carbon footprint information, as the rates of the other meat types.
Product choices classified by the meat type and the carbon footprint
64,8%
35,2%
82,9%
17,1%
72,4%
27,6%
74,9%
25,1%
75,3%
24,7%
69,2%
30,8%
0 % 10 % 20 % 30 % 40 % 50 % 60 % 70 % 80 % 90 % 100 %
Beef meat
No-choice
Product choice
Pork meat
No-choice
Product choice
Mixed pork and beef meat
No-choice
Product choice
Footprint not mentioned Footprint mentioned
Figure 6 Product choice classification by the carbon footprint mention χ2 = 404,535, p= 0,000.
7.2 Consumer preferences for meat attributes
I present first the results of the conditional logit model estimated without interactions and then
with interactions. After that I report the results for the sub-samples differing in the mention of
the carbon footprint attribute.
The results of the conditional logit model with and without interactions are reported in Tables 11
and 12. The coefficients are illustrated in Figure 7 to facilitate the comparison of the models.
Only significant interactions were included in the graph. The coefficients obtained as the result of
the estimations describe the impact that each attribute had on the choice of the product.
Significant positive coefficients indicate that the attribute level in question had a positive impact
on the probability that the consumers’ choose the alternative and negative ones mean that the
consumers had some degree of aversion for that product feature. For continuous variables such
5 0 cells (,0%) have expected count less than 5. The minimum expected count is 1483,07.

58
as the price a negative coefficient means that the smaller variable value the larger the utility
derived from the alternative and the probability to select it. A coefficient value near zero implies
that the consumers were indifferent for the product feature.
The pseudo R2 values were fairly low for both models, implying that the results explain only a
limited proportion of the choices. The coefficient-specific p-values were however significant for
all attribute levels except for the fat percentage of 20% in both models and the beef product type
in the model without interactions. The models were in general very similar, which suggests that
including the interaction variables did not bias the estimates much.
Table 11 Conditional logit model without interactions
MODEL FOR CHOICES
Overall
R² 0,0963
ATTRIBUTES
Coefficient s.e. Wald p-value Constants
1 0,00 . 0,00 2 0,10 0,03 3 0,03 0,03 4 -0,22 0,06
Price -0,10 0,00 0,00 Beef 0,05 0,03 0,11 Pork -0,50 0,04 0,00 Safety 0,45 0,04 0,00 Animal 0,61 0,04 0,00 Organic 0,70 0,04 0,00 Fat5 1,11 0,04 0,00 Fat10 0,90 0,04 0,00 Fat20 0,05 0,04 0,27
Table 12 Conditional logit model with interactions
MODEL FOR CHOICES
Overall R² 0,105
ATTRIBUTES & INTERACTIONS
Cofficient s.e. Wald p-value Constants
1 0,00 . 0,00 2 0,10 0,03 3 0,03 0,03 4 -0,16 0,08
Price -0,09 0,01 0,00 Beef 0,32 0,08 0,00 Pork -0,76 0,08 0,00 Safety 0,46 0,04 0,00 Animal 0,67 0,06 0,00 Organic 0,79 0,07 0,00 Fat5 1,15 0,07 0,00 Fat10 1,05 0,07 0,00 Fat20 0,05 0,04 0,29 PorkAnimal -0,04 0,08 0,62 BeefAnimal -0,14 0,08 0,07 PorkPrice 0,00 0,01 0,56 BeefPrice 0,01 0,01 0,32 OrganicPrice -0,01 0,01 0,09 Fat5Price -0,01 0,01 0,36 Fat10Price -0,02 0,01 0,02 FootprintPrice 0,00 0,00 0,70 FootprintBeef -0,59 0,06 0,00 FootprintPork 0,44 0,06 0,00
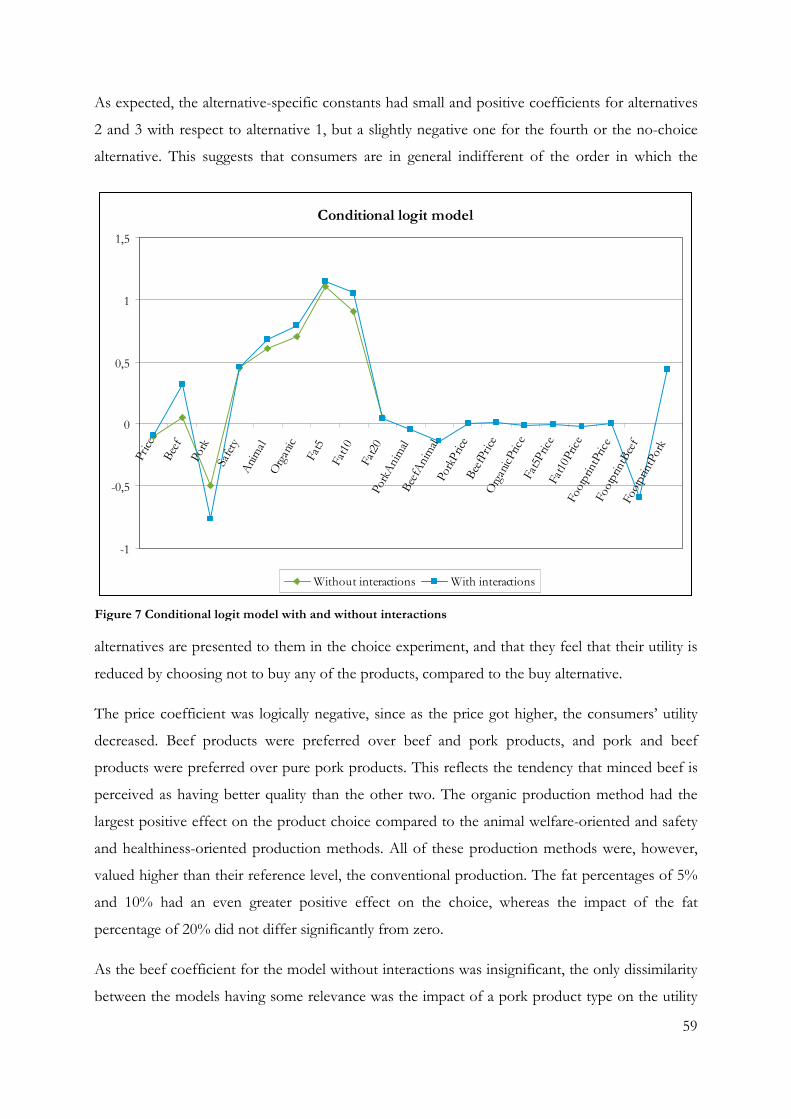
59
As expected, the alternative-specific constants had small and positive coefficients for alternatives
2 and 3 with respect to alternative 1, but a slightly negative one for the fourth or the no-choice
alternative. This suggests that consumers are in general indifferent of the order in which the
alternatives are presented to them in the choice experiment, and that they feel that their utility is
reduced by choosing not to buy any of the products, compared to the buy alternative.
The price coefficient was logically negative, since as the price got higher, the consumers’ utility
decreased. Beef products were preferred over beef and pork products, and pork and beef
products were preferred over pure pork products. This reflects the tendency that minced beef is
perceived as having better quality than the other two. The organic production method had the
largest positive effect on the product choice compared to the animal welfare-oriented and safety
and healthiness-oriented production methods. All of these production methods were, however,
valued higher than their reference level, the conventional production. The fat percentages of 5%
and 10% had an even greater positive effect on the choice, whereas the impact of the fat
percentage of 20% did not differ significantly from zero.
As the beef coefficient for the model without interactions was insignificant, the only dissimilarity
between the models having some relevance was the impact of a pork product type on the utility
Conditional logit model
-1
-0,5
0
0,5
1
1,5
Price
Beef
Pork
Safety
Animal
Organic
Fat5
Fat10
Fat20
PorkAnimal
BeefAnimal
PorkPrice
BeefPrice
OrganicPrice
Fat5Price
Fat10Price
FootprintPrice
FootprintBeef
FootprintPork
Without interactions With interactions
Figure 7 Conditional logit model with and without interactions
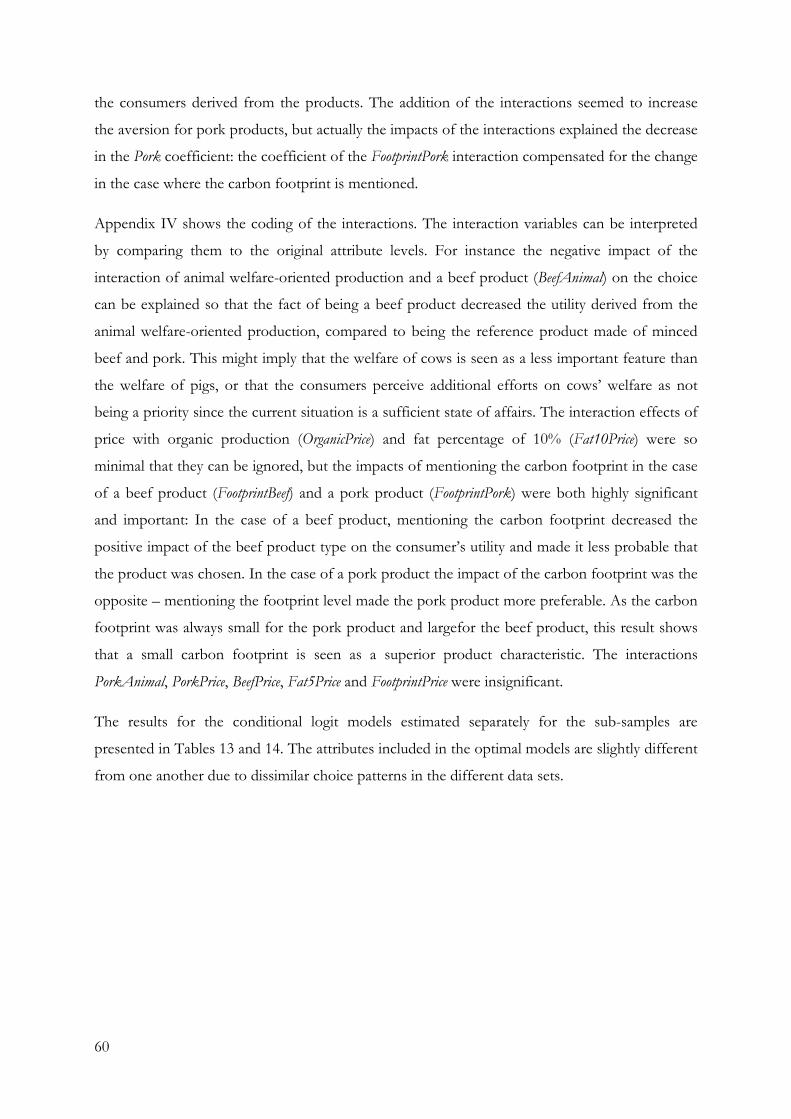
60
the consumers derived from the products. The addition of the interactions seemed to increase
the aversion for pork products, but actually the impacts of the interactions explained the decrease
in the Pork coefficient: the coefficient of the FootprintPork interaction compensated for the change
in the case where the carbon footprint is mentioned.
Appendix IV shows the coding of the interactions. The interaction variables can be interpreted
by comparing them to the original attribute levels. For instance the negative impact of the
interaction of animal welfare-oriented production and a beef product (BeefAnimal) on the choice
can be explained so that the fact of being a beef product decreased the utility derived from the
animal welfare-oriented production, compared to being the reference product made of minced
beef and pork. This might imply that the welfare of cows is seen as a less important feature than
the welfare of pigs, or that the consumers perceive additional efforts on cows’ welfare as not
being a priority since the current situation is a sufficient state of affairs. The interaction effects of
price with organic production (OrganicPrice) and fat percentage of 10% (Fat10Price) were so
minimal that they can be ignored, but the impacts of mentioning the carbon footprint in the case
of a beef product (FootprintBeef) and a pork product (FootprintPork) were both highly significant
and important: In the case of a beef product, mentioning the carbon footprint decreased the
positive impact of the beef product type on the consumer’s utility and made it less probable that
the product was chosen. In the case of a pork product the impact of the carbon footprint was the
opposite – mentioning the footprint level made the pork product more preferable. As the carbon
footprint was always small for the pork product and largefor the beef product, this result shows
that a small carbon footprint is seen as a superior product characteristic. The interactions
PorkAnimal, PorkPrice, BeefPrice, Fat5Price and FootprintPrice were insignificant.
The results for the conditional logit models estimated separately for the sub-samples are
presented in Tables 13 and 14. The attributes included in the optimal models are slightly different
from one another due to dissimilar choice patterns in the different data sets.
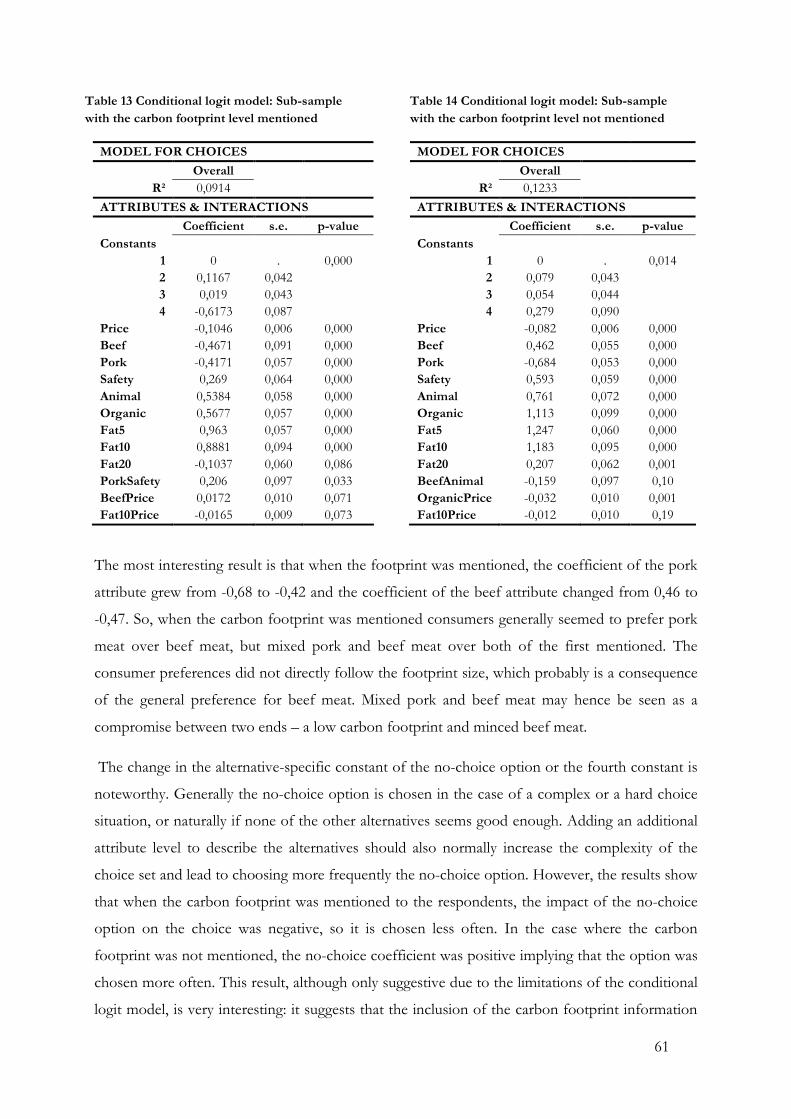
61
Table 13 Conditional logit model: Sub-sample with the carbon footprint level mentioned
MODEL FOR CHOICES
Overall R² 0,0914
ATTRIBUTES & INTERACTIONS
Coefficient s.e. p-value Constants
1 0 . 0,000 2 0,1167 0,042 3 0,019 0,043 4 -0,6173 0,087
Price -0,1046 0,006 0,000 Beef -0,4671 0,091 0,000 Pork -0,4171 0,057 0,000 Safety 0,269 0,064 0,000 Animal 0,5384 0,058 0,000 Organic 0,5677 0,057 0,000 Fat5 0,963 0,057 0,000 Fat10 0,8881 0,094 0,000 Fat20 -0,1037 0,060 0,086 PorkSafety 0,206 0,097 0,033 BeefPrice 0,0172 0,010 0,071 Fat10Price -0,0165 0,009 0,073
Table 14 Conditional logit model: Sub-sample with the carbon footprint level not mentioned
MODEL FOR CHOICES
Overall R² 0,1233
ATTRIBUTES & INTERACTIONS
Coefficient s.e. p-value Constants
1 0 . 0,014 2 0,079 0,043 3 0,054 0,044 4 0,279 0,090
Price -0,082 0,006 0,000 Beef 0,462 0,055 0,000 Pork -0,684 0,053 0,000 Safety 0,593 0,059 0,000 Animal 0,761 0,072 0,000 Organic 1,113 0,099 0,000 Fat5 1,247 0,060 0,000 Fat10 1,183 0,095 0,000 Fat20 0,207 0,062 0,001 BeefAnimal -0,159 0,097 0,10 OrganicPrice -0,032 0,010 0,001 Fat10Price -0,012 0,010 0,19
The most interesting result is that when the footprint was mentioned, the coefficient of the pork
attribute grew from -0,68 to -0,42 and the coefficient of the beef attribute changed from 0,46 to
-0,47. So, when the carbon footprint was mentioned consumers generally seemed to prefer pork
meat over beef meat, but mixed pork and beef meat over both of the first mentioned. The
consumer preferences did not directly follow the footprint size, which probably is a consequence
of the general preference for beef meat. Mixed pork and beef meat may hence be seen as a
compromise between two ends – a low carbon footprint and minced beef meat.
The change in the alternative-specific constant of the no-choice option or the fourth constant is
noteworthy. Generally the no-choice option is chosen in the case of a complex or a hard choice
situation, or naturally if none of the other alternatives seems good enough. Adding an additional
attribute level to describe the alternatives should also normally increase the complexity of the
choice set and lead to choosing more frequently the no-choice option. However, the results show
that when the carbon footprint was mentioned to the respondents, the impact of the no-choice
option on the choice was negative, so it is chosen less often. In the case where the carbon
footprint was not mentioned, the no-choice coefficient was positive implying that the option was
chosen more often. This result, although only suggestive due to the limitations of the conditional
logit model, is very interesting: it suggests that the inclusion of the carbon footprint information
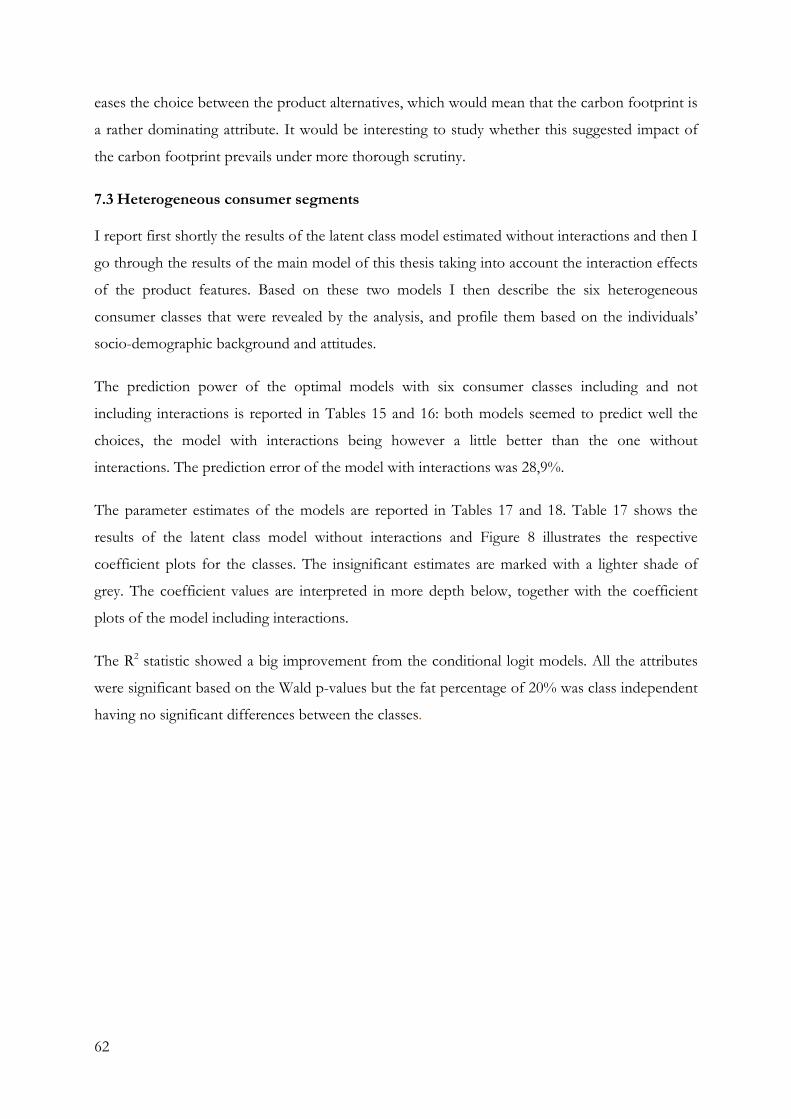
62
eases the choice between the product alternatives, which would mean that the carbon footprint is
a rather dominating attribute. It would be interesting to study whether this suggested impact of
the carbon footprint prevails under more thorough scrutiny.
7.3 Heterogeneous consumer segments
I report first shortly the results of the latent class model estimated without interactions and then I
go through the results of the main model of this thesis taking into account the interaction effects
of the product features. Based on these two models I then describe the six heterogeneous
consumer classes that were revealed by the analysis, and profile them based on the individuals’
socio-demographic background and attitudes.
The prediction power of the optimal models with six consumer classes including and not
including interactions is reported in Tables 15 and 16: both models seemed to predict well the
choices, the model with interactions being however a little better than the one without
interactions. The prediction error of the model with interactions was 28,9%.
The parameter estimates of the models are reported in Tables 17 and 18. Table 17 shows the
results of the latent class model without interactions and Figure 8 illustrates the respective
coefficient plots for the classes. The insignificant estimates are marked with a lighter shade of
grey. The coefficient values are interpreted in more depth below, together with the coefficient
plots of the model including interactions.
The R2 statistic showed a big improvement from the conditional logit models. All the attributes
were significant based on the Wald p-values but the fat percentage of 20% was class independent
having no significant differences between the classes.
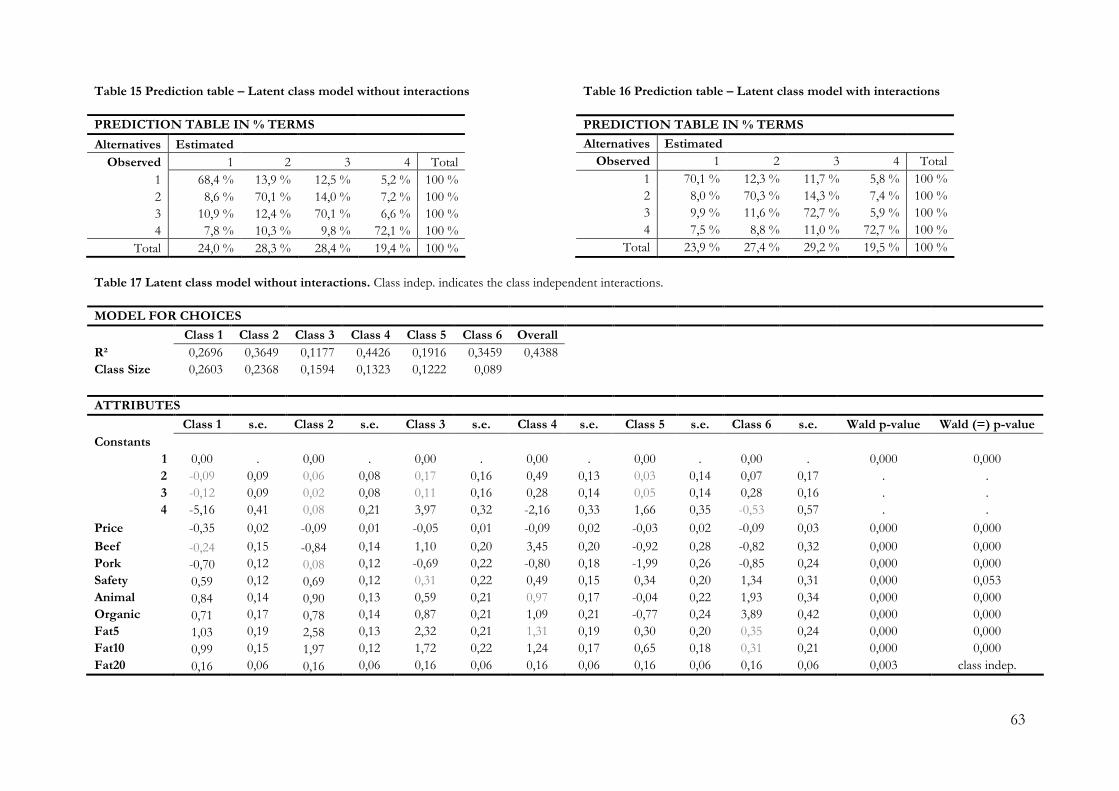
63
Table 15 Prediction table – Latent class model without interactions
PREDICTION TABLE IN % TERMS
Alternatives Estimated
Observed 1 2 3 4 Total
1 68,4 % 13,9 % 12,5 % 5,2 % 100 % 2 8,6 % 70,1 % 14,0 % 7,2 % 100 % 3 10,9 % 12,4 % 70,1 % 6,6 % 100 % 4 7,8 % 10,3 % 9,8 % 72,1 % 100 %
Total 24,0 % 28,3 % 28,4 % 19,4 % 100 %
Table 16 Prediction table – Latent class model with interactions
Table 17 Latent class model without interactions. Class indep. indicates the class independent interactions.
MODEL FOR CHOICES
Class 1 Class 2 Class 3 Class 4 Class 5 Class 6 Overall
R² 0,2696 0,3649 0,1177 0,4426 0,1916 0,3459 0,4388 Class Size 0,2603 0,2368 0,1594 0,1323 0,1222 0,089
ATTRIBUTES
Class 1 s.e. Class 2 s.e. Class 3 s.e. Class 4 s.e. Class 5 s.e. Class 6 s.e. Wald p-value Wald (=) p-value Constants
1 0,00 . 0,00 . 0,00 . 0,00 . 0,00 . 0,00 . 0,000 0,000 2 -0,09 0,09 0,06 0,08 0,17 0,16 0,49 0,13 0,03 0,14 0,07 0,17 . . 3 -0,12 0,09 0,02 0,08 0,11 0,16 0,28 0,14 0,05 0,14 0,28 0,16 . . 4 -5,16 0,41 0,08 0,21 3,97 0,32 -2,16 0,33 1,66 0,35 -0,53 0,57 . .
Price -0,35 0,02 -0,09 0,01 -0,05 0,01 -0,09 0,02 -0,03 0,02 -0,09 0,03 0,000 0,000
Beef -0,24 0,15 -0,84 0,14 1,10 0,20 3,45 0,20 -0,92 0,28 -0,82 0,32 0,000 0,000 Pork -0,70 0,12 0,08 0,12 -0,69 0,22 -0,80 0,18 -1,99 0,26 -0,85 0,24 0,000 0,000 Safety 0,59 0,12 0,69 0,12 0,31 0,22 0,49 0,15 0,34 0,20 1,34 0,31 0,000 0,053 Animal 0,84 0,14 0,90 0,13 0,59 0,21 0,97 0,17 -0,04 0,22 1,93 0,34 0,000 0,000 Organic 0,71 0,17 0,78 0,14 0,87 0,21 1,09 0,21 -0,77 0,24 3,89 0,42 0,000 0,000 Fat5 1,03 0,19 2,58 0,13 2,32 0,21 1,31 0,19 0,30 0,20 0,35 0,24 0,000 0,000 Fat10 0,99 0,15 1,97 0,12 1,72 0,22 1,24 0,17 0,65 0,18 0,31 0,21 0,000 0,000 Fat20 0,16 0,06 0,16 0,06 0,16 0,06 0,16 0,06 0,16 0,06 0,16 0,06 0,003 class indep.
PREDICTION TABLE IN % TERMS
Alternatives Estimated
Observed 1 2 3 4 Total
1 70,1 % 12,3 % 11,7 % 5,8 % 100 % 2 8,0 % 70,3 % 14,3 % 7,4 % 100 % 3 9,9 % 11,6 % 72,7 % 5,9 % 100 % 4 7,5 % 8,8 % 11,0 % 72,7 % 100 %
Total 23,9 % 27,4 % 29,2 % 19,5 % 100 %
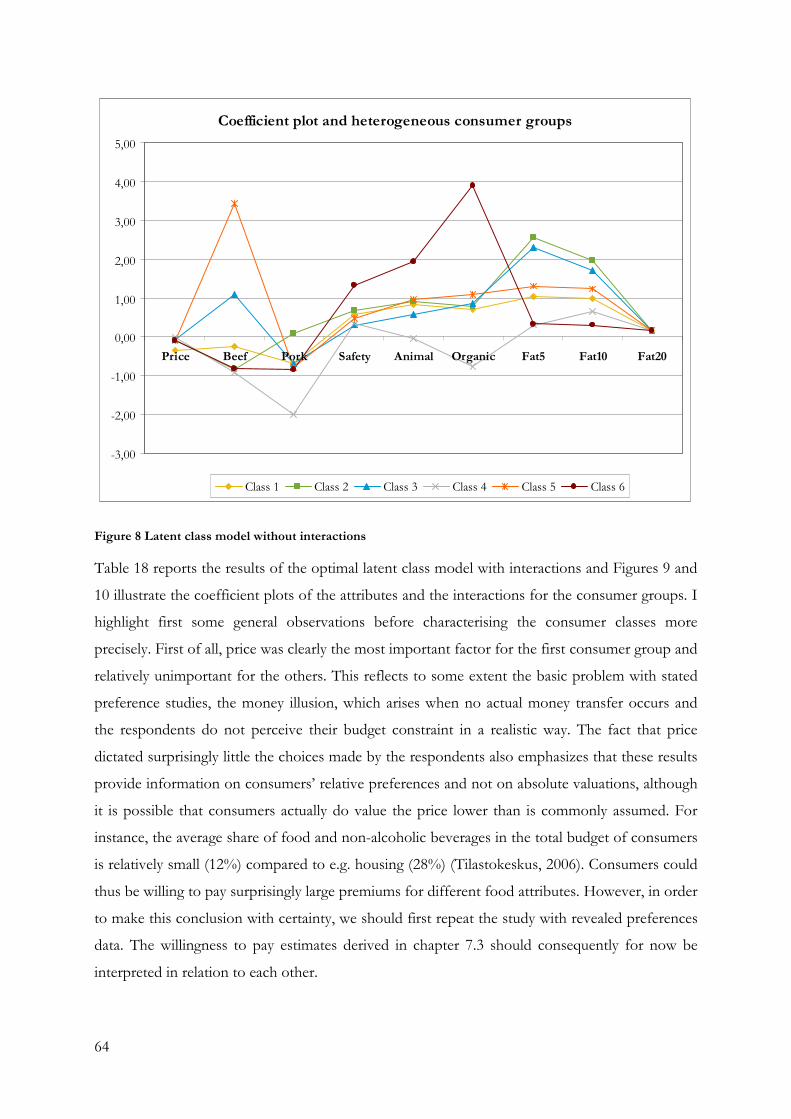
64
Coefficient plot and heterogeneous consumer groups
-3,00
-2,00
-1,00
0,00
1,00
2,00
3,00
4,00
5,00
Price Beef Pork Safety Animal Organic Fat5 Fat10 Fat20
Class 1 Class 2 Class 3 Class 4 Class 5 Class 6
Figure 8 Latent class model without interactions
Table 18 reports the results of the optimal latent class model with interactions and Figures 9 and
10 illustrate the coefficient plots of the attributes and the interactions for the consumer groups. I
highlight first some general observations before characterising the consumer classes more
precisely. First of all, price was clearly the most important factor for the first consumer group and
relatively unimportant for the others. This reflects to some extent the basic problem with stated
preference studies, the money illusion, which arises when no actual money transfer occurs and
the respondents do not perceive their budget constraint in a realistic way. The fact that price
dictated surprisingly little the choices made by the respondents also emphasizes that these results
provide information on consumers’ relative preferences and not on absolute valuations, although
it is possible that consumers actually do value the price lower than is commonly assumed. For
instance, the average share of food and non-alcoholic beverages in the total budget of consumers
is relatively small (12%) compared to e.g. housing (28%) (Tilastokeskus, 2006). Consumers could
thus be willing to pay surprisingly large premiums for different food attributes. However, in order
to make this conclusion with certainty, we should first repeat the study with revealed preferences
data. The willingness to pay estimates derived in chapter 7.3 should consequently for now be
interpreted in relation to each other.
65
Table 18 Optimal latent class model with interactions. Class indep. indicates the class independent interactions.
MODEL FOR CHOICES
Class 1 Class 2 Class 3 Class 4 Class 5 Class 6 Overall
R² 0,3721 0,3639 0,1427 0,1797 0,4575 0,3598 0,4546
Class Size 0,2322 0,1985 0,1708 0,1653 0,1256 0,1075
ATTRIBUTES & INTERACTIONS
Class 1 (s.e.) Class 2 (s.e.) Class 3 (s.e.) Class 4 (s.e.) Class 5 (s.e.) Class 6 (s.e.) Wald p-value Wald(=) p-value Constants
1 0,00 . 0,00 . 0,00 . 0,00 . 0,00 . 0,00 . 0,00 0,00 2 -0,10 (0,09) 0,05 0,11 0,18 0,15 0,41 0,11 0,11 0,15 0,09 0,15 3 -0,11 (0,09) -0,08 0,11 0,11 0,15 0,25 0,11 0,04 0,15 0,25 0,15 4 -5,26 (0,39) 0,92 0,31 3,89 0,36 -1,67 0,27 2,27 0,39 -0,65 0,52
Price -0,35 (0,03) -0,06 0,01 -0,04 0,02 -0,02 0,02 -0,03 0,02 -0,09 0,02 0,00 0,00 Beef -0,66 (0,27) -0,16 0,27 1,36 0,30 -0,73 0,30 4,57 0,45 -0,09 0,38 0,00 0,00 Pork -1,07 (0,17) -0,37 0,17 -1,21 0,29 -1,55 0,22 -0,79 0,35 -1,50 0,28 0,00 0,00 Safety 0,45 (0,13) 0,77 0,16 0,32 0,21 0,31 0,13 0,25 0,23 1,16 0,27 0,00 0,02 Animal 0,63 (0,15) 1,13 0,20 0,62 0,21 0,34 0,18 0,87 0,24 1,78 0,34 0,00 0,00 Organic 0,84 (0,17) 1,44 0,20 1,35 0,21 -0,17 0,19 1,30 0,24 4,08 0,44 0,00 0,00 Fat5 1,23 (0,19) 3,59 0,28 2,27 0,24 0,64 0,21 1,79 0,25 0,45 0,24 0,00 0,00 Fat10 1,17 (0,16) 2,89 0,26 1,78 0,24 0,91 0,18 1,77 0,24 0,74 0,24 0,00 0,00 Fat20 0,16 (0,13) 0,70 0,21 -0,23 (0,30) -0,29 0,16 0,44 0,21 0,11 0,20 0,00 0,01 PorkAnimal 0,63 (0,23) 0,00 0,26 0,59 0,36 -0,95 0,31 -0,03 0,43 0,40 0,37 0,00 0,00 BeefAnimal - - - - - - - - PorkSafety 0,20 (0,11) 0,20 0,11 0,20 0,11 0,20 0,11 0,20 0,11 0,20 0,11 0,07 class indep. BeefSafety 0,20 (0,10 0,20 0,10 0,20 0,10 0,20 0,10 0,20 0,10 0,20 0,10 0,05 class indep. BeefPrice 0,07 (0,03) 0,01 0,02 0,02 0,03 -0,02 0,02 -0,06 0,03 0,00 0,03 0,04 0,02 PorkPrice - - - - - - . - - OrganicPrice -0,04 (0,01) -0,04 0,01 -0,04 0,01 -0,04 0,01 -0,04 0,01 -0,04 0,01 0,00 class indep. Fat5Price -0,02 (0,01) -0,02 0,01 -0,02 0,01 -0,02 0,01 -0,02 0,01 -0,02 0,01 0,04 class indep. Fat10Price -0,03 (0,01) -0,03 0,01 -0,03 0,01 -0,03 0,01 -0,03 0,01 -0,03 0,01 0,00 class indep. FootprintPrice - - . - . - - - - - FootprintBeef -0,25 (0,24) -1,77 0,31 -1,19 0,21 -0,44 0,29 -0,77 0,35 -1,49 0,39 0,00 0,00
FootprintPork 0,38 (0,22) 1,09 0,26 0,95 0,32 -0,06 0,25 0,25 0,42 1,23 0,38 0,00 0,01
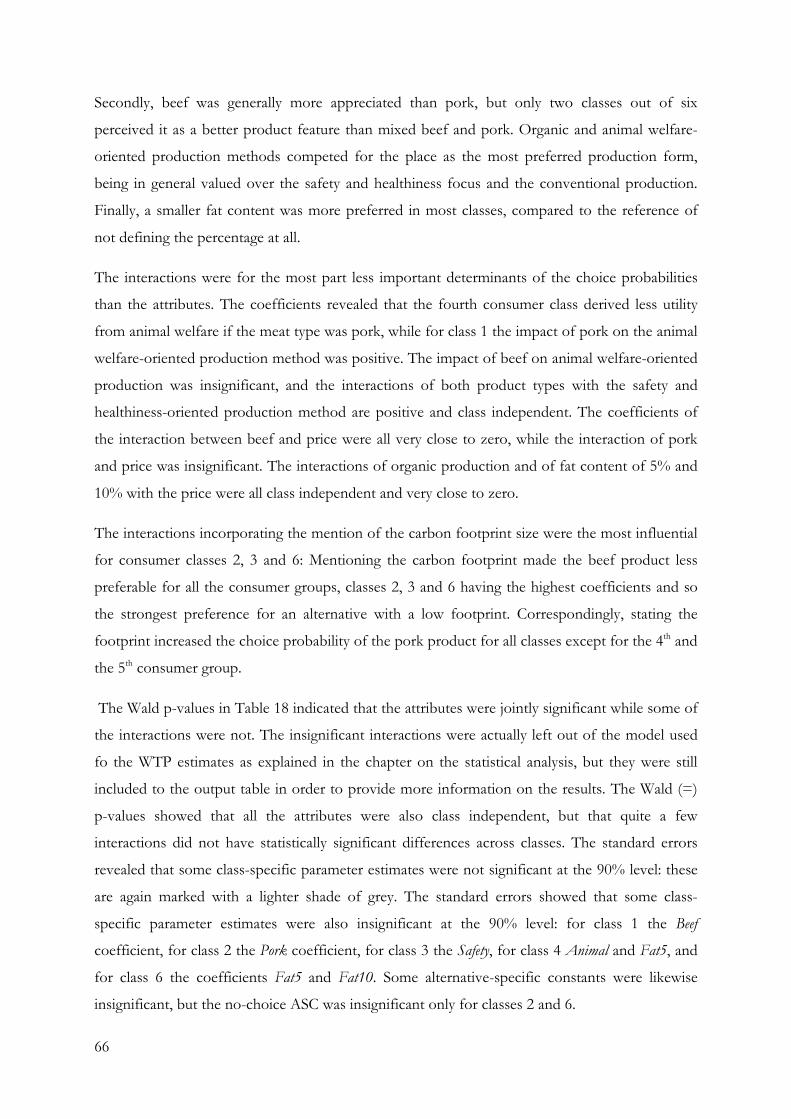
66
Secondly, beef was generally more appreciated than pork, but only two classes out of six
perceived it as a better product feature than mixed beef and pork. Organic and animal welfare-
oriented production methods competed for the place as the most preferred production form,
being in general valued over the safety and healthiness focus and the conventional production.
Finally, a smaller fat content was more preferred in most classes, compared to the reference of
not defining the percentage at all.
The interactions were for the most part less important determinants of the choice probabilities
than the attributes. The coefficients revealed that the fourth consumer class derived less utility
from animal welfare if the meat type was pork, while for class 1 the impact of pork on the animal
welfare-oriented production method was positive. The impact of beef on animal welfare-oriented
production was insignificant, and the interactions of both product types with the safety and
healthiness-oriented production method are positive and class independent. The coefficients of
the interaction between beef and price were all very close to zero, while the interaction of pork
and price was insignificant. The interactions of organic production and of fat content of 5% and
10% with the price were all class independent and very close to zero.
The interactions incorporating the mention of the carbon footprint size were the most influential
for consumer classes 2, 3 and 6: Mentioning the carbon footprint made the beef product less
preferable for all the consumer groups, classes 2, 3 and 6 having the highest coefficients and so
the strongest preference for an alternative with a low footprint. Correspondingly, stating the
footprint increased the choice probability of the pork product for all classes except for the 4th and
the 5th consumer group.
The Wald p-values in Table 18 indicated that the attributes were jointly significant while some of
the interactions were not. The insignificant interactions were actually left out of the model used
fo the WTP estimates as explained in the chapter on the statistical analysis, but they were still
included to the output table in order to provide more information on the results. The Wald (=)
p-values showed that all the attributes were also class independent, but that quite a few
interactions did not have statistically significant differences across classes. The standard errors
revealed that some class-specific parameter estimates were not significant at the 90% level: these
are again marked with a lighter shade of grey. The standard errors showed that some class-
specific parameter estimates were also insignificant at the 90% level: for class 1 the Beef
coefficient, for class 2 the Pork coefficient, for class 3 the Safety, for class 4 Animal and Fat5, and
for class 6 the coefficients Fat5 and Fat10. Some alternative-specific constants were likewise
insignificant, but the no-choice ASC was insignificant only for classes 2 and 6.
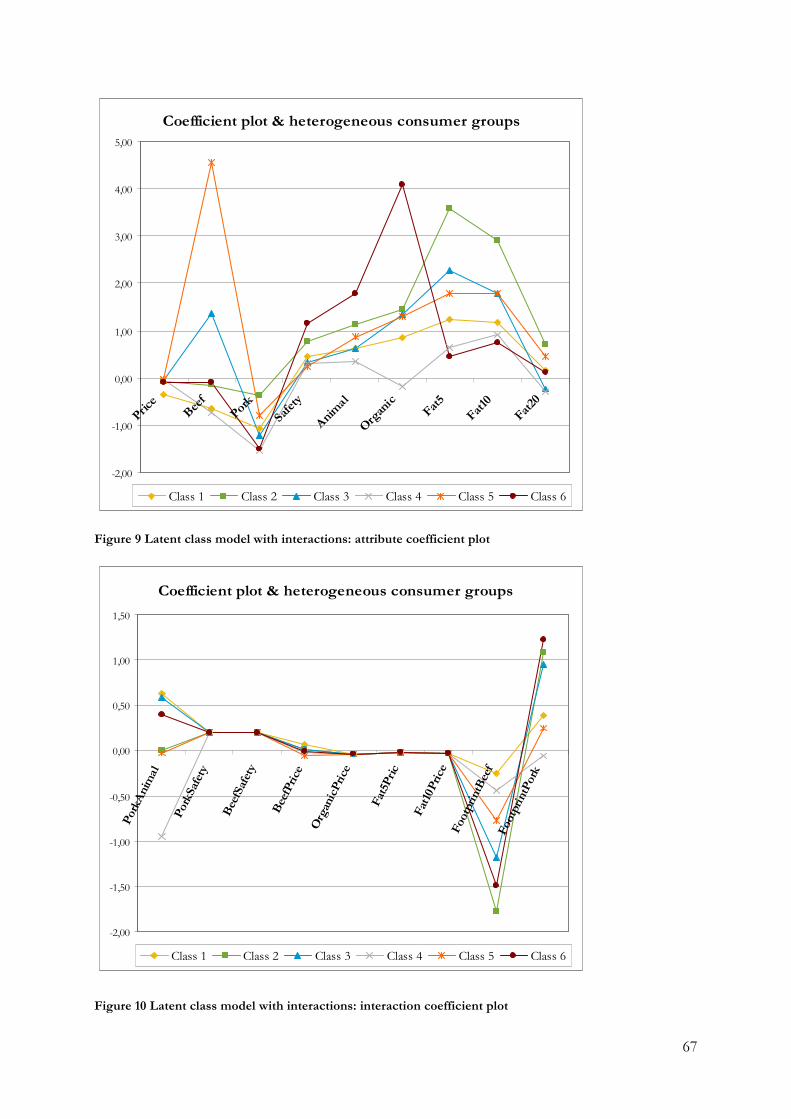
67
Coefficient plot & heterogeneous consumer groups
-2,00
-1,00
0,00
1,00
2,00
3,00
4,00
5,00
Price Be
efPork
Safety
Animal
Organic
Fat5
Fat10
Fat20
Class 1 Class 2 Class 3 Class 4 Class 5 Class 6
Figure 9 Latent class model with interactions: attribute coefficient plot
Coefficient plot & heterogeneous consumer groups
-2,00
-1,50
-1,00
-0,50
0,00
0,50
1,00
1,50
PorkAnimal
PorkSafety
BeefSafety
BeefPrice
OrganicPrice
Fat5Pric
Fat10Price
FootprintBeef
FootprintPork
Class 1 Class 2 Class 3 Class 4 Class 5 Class 6
Figure 10 Latent class model with interactions: interaction coefficient plot
68
The most relevant differences between the model without interactions and the one including the
interaction effects concerned the beef product, pork product and organic method of production
attributes. These impacts are taken into account and considered in the following descriptions of
the consumer classes. The model with interactions was however chosen to be the primary model
to be interpreted, based on its higher R2 values and its better prediction power. The
heterogeneous classes are described below based on the behavioural patterns that arised from the
models. The reported class sizes are based on the model with interactions.
Class 1: The price-conscious consumer class was the largest segment with 23,2% of the
respondents. Besides the negative impact of the price on the choice probability, this group
derived relatively little utility from any of the other attributes, the preference pattern of the group
being however generally similar to the major tendencies of the other groups. The preferred meat
type was mixed pork and beef and this group valued animal welfare-oriented production
relatively highly when the product type was pork. When accounting for both the PorkAnimal
interaction and the coefficient for animal welfare-oriented production, it can be seen that this
group favoured animal welfare over organically produced minced meat. The FootprintBeef
interaction was insignificant, which might relate to the importance of the price attribute. The
significant FootprintPork interaction tells that the information on the carbon footprint increased
the probability of buying pork minced meat. The group was named as the price-conscious
consumer segment.
Class 2: The consumer class having the strongest preferences for a low fat percentage derived
relatively high utility from the responsible methods of production as well. The results for this
group were affected by the inclusion of the interactions: without interactions in the model, the
group preferred animal welfare-oriented production over organic production, but with
interactions the results were the opposite. The group included 19,8% of the respondents and was
thus the second largest consumer segment. The consumers in this group were relatively
indifferent with the product type being beef, pork or their mixture, but the impacts of
mentioning the carbon footprint were very large, telling that in the case of having the footprint
information the group no longer was indifferent between the products: then, products made out
of pork were preferred over mixed pork and beef, and the latter was preferred over beef. So,
compared to the price-conscious consumer group, the information on carbon footprint was
highly appreciated. This segment was named as the fat content-conscious consumer group.
Class 3: The preference structure of the third group containing 17,1% of the respondents was the
closest to the results of the conditional logit model: beef was preferred over pork and mixed pork
69
and beef, organic production was favoured over the animal welfare-oriented method of
production, and a small fat percentage was preferred over a not defined one. As depicted in
Figures 8, 9 and 10, this group did not have the strongest preferences for any of the attributes
compared to the other groups, but it can be noted that it was with the beef preferring consumer
group the only one having a positive coefficient for the beef attribute. In addition, the preference
for a low fat percentage was a feature qualifying the group, as was the somewhat high preference
for organic products. As these preference patterns did not give a clear idea on the core
characteristics that describe the consumers of this segment compared to the others, the
background information was used in naming the segment as the concerned consumers.
Class 4: The fourth consumer group stood out as being the only group that was indifferent for
organic production, having even a slightly negative attitude towards the method. Also the other
attributes concerning the fat content and the other methods of production were relatively
unimportant to the consumers. Compared to the others, this group derived the highest utility
from the mixed beef and pork, having also the highest aversion towards pork. The coefficient for
the interaction of the animal welfare-oriented production and the pork product was highly
negative, implying that the product type lowered the utility derived from the production method,
or just underlining the dislike of pork products in general. The impact of carbon footprint
information was insignificant similarly to the price coefficient. This group including 16,5% of the
respondents was named as the indifferent consumers.
Class 5: The beef preferring consumer group contained 12,6% of the respondents and stood out
from the others in its clearly greatest preference for beef products in general. The price
coefficient was insignificant, but this group followed somewhat the average of the consumer
groups in its other preferences. Information on the carbon footprint size reduced reasonably the
consumers’ probability to choose a beef product, but the impact of the footprint information on
a pork product was insignificant. The group was named as the beef preferring consumers.
Class 6: The sixth and the smallest consumer segment grouping 10,8% of the respondents could
be distinguished by its members’ high valuation for the methods of production deviating from
the conventional: the most preferred method of production was clearly the organic production.
The fat percentage was rather unimportant for the segment. The behaviour of this consumer
class was clearly affected by the mention of the carbon footprint: it decreased importantly the
utility derived from a beef product and increased the one derived from a pork product. The
segment was named as the consumers aware of the methods of production.
70
The footprint information did not in general change the direction of the impact of a specific meat
type on consumers’ choice probability: this happened only for the 2nd consumer segment as the
FootprintPork interaction had such a large magnitude that it turned the impact of pork meat on the
choice probability from negative to positive when the carbon footprint was mentioned.
I describe next the segments based on the consumers’ sociodemographic and attitudinal
background. All the covariates that were included as explanatory variables to the analysis are
listed in Appendix V together with the precise survey questions on which the covariates were
based. Appendix VI presents the profile and the probability means figures used in examining the
differences between the consumer groups. The Pearson Chi-Squares report the statistical
significance of the covariates jointly for all the classes. The segment-specific profiling and
comparison of the importance rankings concentrates on the differences between the groups
relative to each other and not on absolute rankings, the latter of which were described in chapter
6.1. The consumer classes are profiled below:
Class 1: The price-conscious consumers
The consumers in the price-conscious segment were most probably men (62,2%) being younger
than average and slightly less wealthy than the average: 31% of them were under 35 years old and
relative to the other groups, they belonged most probably to the lowest income group earning
under 20 000 euros per year. The educational level of this group seemed to be the lowest, 51% of
the consumers being at most secondary school graduates.
The consumers in this group cooked least from raw food and their meat eating frequency was
above average. Compared to the other consumer groups this group was indifferent towards
animal welfare, environmental impacts, health effects and the low fat content of food. The group
was also less concerned on the overall developments of the food industry than others. The
fairness of income distribution in the food chain and food safety issues however were relatively
more important to this group than the others. Only 8% or the second smallest share of
consumers voted for the Green League.
Class 2: The fat content-conscious consumers
The consumers belonging to class 2 were more probably women (57,7%) than men and they
belonged most often to the older age groups of people, over 63% of them being over 48 years
old. The consumers were wealthier than consumers in classes 1, 3, 4 and 6. Their education level
71
seemed to be higher than average, although not as high as in classes 3 and 5. 27,8% of the
respondents lived in the metropolitan area, which was more than the average.
The consumers did not cook as much as the members of the other groups in average. Their
positive perception of a low fat content and healthiness stood however out from the other
groups but their overall concern on the developments in the food sector was rather average. The
respondents saw product features like animal welfare, environmental impact and safety as being
in general important, although their attitudes were not the especially pronounced. This group
contained in addition the second largest amount of people that vote for the Centre Party (12, 4%)
and a quite large share of persons (24,3%) having or having had a connection to breeding
production animals or to meat production.
Class 3: The concerned consumers
Most of the respondents belonging to the group were women (61%) and 37% of the consumers
were over 63 and only 34% under 35 years old. This group was thus with consumer class 4 the
oldest segment. The respondents belonged most probably to the lower or middle level income
groups, with 45% of them earning up to 40 000 euros per year. The consumers seemed to have
the highest education level and the largest share of them (35%) lived in the metropolitan area of
Finland relative to the other groups. This group included also the largest share of vegetarians
(3%) and of individuals eating only a little meat.
They cooked most often both in general and from raw food. The largest share of these
respondents saw safety and issues related to the fairness of income distribution between the
members of the food chain as the least important attributes, when compared to other groups: a
low fat content and healthy food were instead seen as the most important factors, animal welfare
and environmental issues being as well important features determining their food consumption.
These consumers were also generally more concerned on food production and future
developments on the sector than the other groups. They were the least probable consumer group
to have a connection to breeding production animals or to meat production and to vote for the
Centre Party, but the second most probable to belong to an environmental organization and the
most probable to vote for the Green League (19,4%).
Class 4: The indifferent consumers
The consumers in class four were men (56%) and this group was with class 3 the oldest
consumer segment: 67% of the consumers were over 48 years old while 16% were under 35. The
72
consumers were centred in the income classes earning from 20 000 to 40 000 € a year earning
thus around the same as the average of the sample. The consumers lived least probably in the
metropolitan area of Finland (only 20%) and they seemed to have an educational level lower than
average. They cooked relatively often from raw food and in general and their meat eating
frequency was average.
The consumers perceived food safety, healthiness and a low fat content as to some extent
important features. They were however indifferent in what comes to animal welfare and
environmental friendliness compared to the other groups, and they were not overall concerned in
the developments of the food sector. This was the group having the largest share (27%) of
people that have or have had a connection to breeding animals or meat production, including
most consumers that have voted for the Centre Party (16,4%) and least for the Green League
(4,4%).
Class 5: The beef preferring consumers
The gender distribution was the most even in this group with 51,4% of the consumers being men
and 48,6% women. Also the age structure was more even than in the other groups even though it
was slightly biased to the older end like on the average in the sample. This was the wealthiest
consumer group, 55% earning over 40 000 euros out of whom 25% over 60 000 euros per year.
The educational level of the group seemed also to be slightly higher than average. In this group
there were 2,2% of consumers following a diet for religious reasons. A relatively large share of
the consumers cooked from semi manufactured ingredients although only an average amount of
people cooked regularly from raw food. The meat eating frequency of the group was also quite
average.
The group perceived animal welfare, environmental friendliness and healthiness in an average
manner, not standing importantly out from the crowd and food safety and healthiness were
ranked as being the most important features compared to the other food attributes within the
class. The group was not especially concerned with the general developments of the food
industry. An average number of the respondents had a connection to breeding animals and
belonged to environmental or animal welfare organizations, and also their voting behaviour was
quite average.
73
Class 6: The consumers aware of the method of production
The sixth consumer class was the youngest consumer segment together with the first class: 31%
of the consumers were under 35 and only 49% were over 48 years old. Most of the consumers
(57%) were women. Their educational level seemed to be a little lower than average, their income
level being quite average, although there could be seen a slight bias towards the lower earnings
with 15,6% of the consumers earning under 20 000 euros per year. The consumers belonging to
the segment cooked in general less often than the other groups but the share of them cooking
from raw food was average. Their meat eating frequency was a little above average, even though
the class had also the second largest share of vegetarians and people eating only a little meat
(10%).
The consumers were overall concerned on issues related to food production and they perceived
animal welfare and environmental production as being very important factors compared to the
other groups. This was in line with 8% of them belonging to environmental or animal welfare
related organizations, which was the largest share across the groups. They had however less often
than average a connection to breeding animals and meat production. Compared to the other
groups, their attitude to safety issues and healthiness was quite average, being slightly biased to
the indifferent end of the scale. The consumers were also the second most frequent partisans of
the Green League, with 16% of them having voted for the party.
7.4 Consumer willingness to pay for differentiated minced meat products
Table 19 shows the marginal effects or the marginal willingness to pay (MWTP) estimates for the
attributes and the interactions based on both the conditional logit and the latent class models.
Tables 20 and 21 present the relative willingness to pay estimates for the products of interest, the
first one without carbon footprint information and the second one with information on the
footprint size. The latter illustrates also the impact of the carbon footprint information on the
WTP for baseline beef and pork products, relative to the baseline products without the footprint
mention.
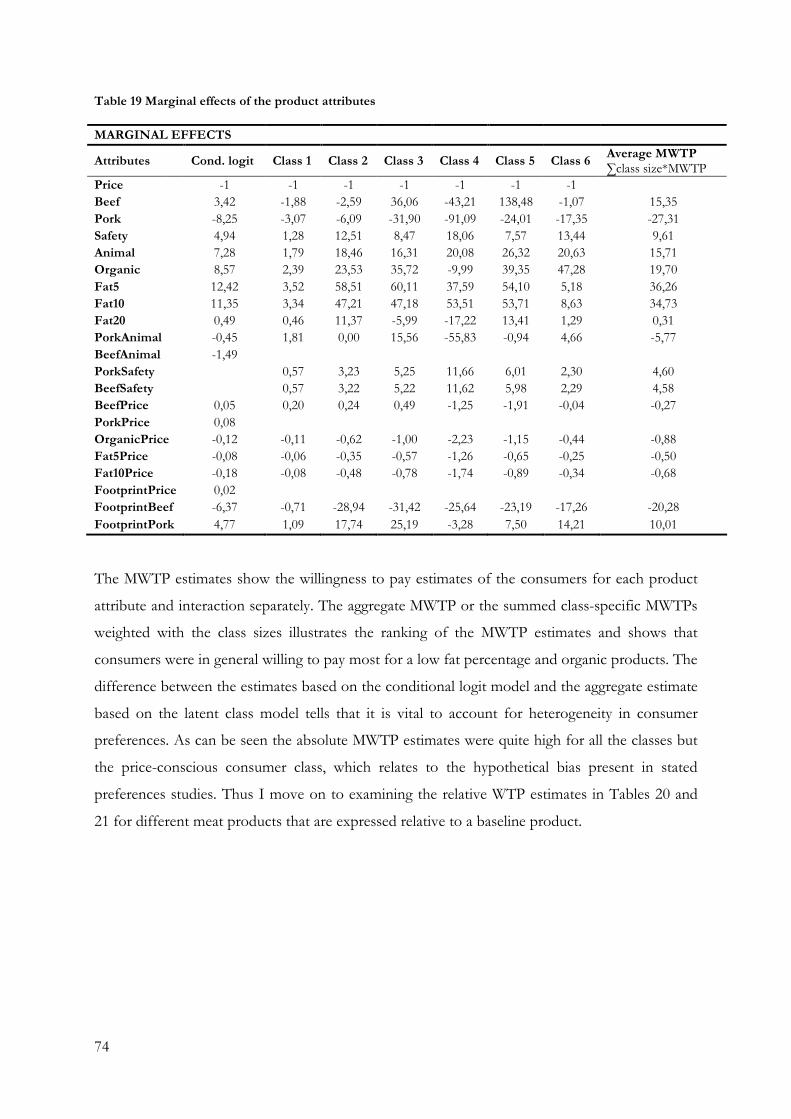
74
Table 19 Marginal effects of the product attributes
MARGINAL EFFECTS
Attributes Cond. logit Class 1 Class 2 Class 3 Class 4 Class 5 Class 6 Average MWTP ∑class size*MWTP
Price -1 -1 -1 -1 -1 -1 -1 Beef 3,42 -1,88 -2,59 36,06 -43,21 138,48 -1,07 15,35 Pork -8,25 -3,07 -6,09 -31,90 -91,09 -24,01 -17,35 -27,31 Safety 4,94 1,28 12,51 8,47 18,06 7,57 13,44 9,61 Animal 7,28 1,79 18,46 16,31 20,08 26,32 20,63 15,71 Organic 8,57 2,39 23,53 35,72 -9,99 39,35 47,28 19,70 Fat5 12,42 3,52 58,51 60,11 37,59 54,10 5,18 36,26 Fat10 11,35 3,34 47,21 47,18 53,51 53,71 8,63 34,73 Fat20 0,49 0,46 11,37 -5,99 -17,22 13,41 1,29 0,31 PorkAnimal -0,45 1,81 0,00 15,56 -55,83 -0,94 4,66 -5,77 BeefAnimal -1,49 PorkSafety 0,57 3,23 5,25 11,66 6,01 2,30 4,60 BeefSafety 0,57 3,22 5,22 11,62 5,98 2,29 4,58 BeefPrice 0,05 0,20 0,24 0,49 -1,25 -1,91 -0,04 -0,27 PorkPrice 0,08 OrganicPrice -0,12 -0,11 -0,62 -1,00 -2,23 -1,15 -0,44 -0,88 Fat5Price -0,08 -0,06 -0,35 -0,57 -1,26 -0,65 -0,25 -0,50 Fat10Price -0,18 -0,08 -0,48 -0,78 -1,74 -0,89 -0,34 -0,68 FootprintPrice 0,02 FootprintBeef -6,37 -0,71 -28,94 -31,42 -25,64 -23,19 -17,26 -20,28
FootprintPork 4,77 1,09 17,74 25,19 -3,28 7,50 14,21 10,01
The MWTP estimates show the willingness to pay estimates of the consumers for each product
attribute and interaction separately. The aggregate MWTP or the summed class-specific MWTPs
weighted with the class sizes illustrates the ranking of the MWTP estimates and shows that
consumers were in general willing to pay most for a low fat percentage and organic products. The
difference between the estimates based on the conditional logit model and the aggregate estimate
based on the latent class model tells that it is vital to account for heterogeneity in consumer
preferences. As can be seen the absolute MWTP estimates were quite high for all the classes but
the price-conscious consumer class, which relates to the hypothetical bias present in stated
preferences studies. Thus I move on to examining the relative WTP estimates in Tables 20 and
21 for different meat products that are expressed relative to a baseline product.
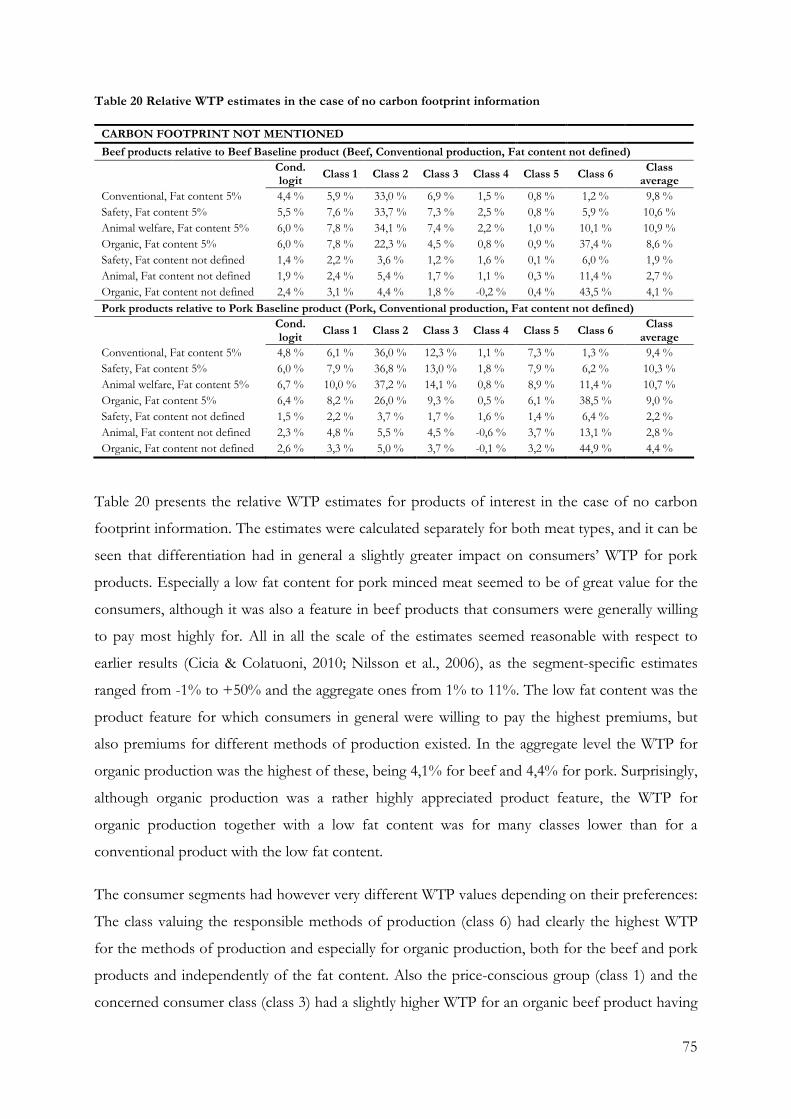
75
Table 20 Relative WTP estimates in the case of no carbon footprint information
CARBON FOOTPRINT NOT MENTIONED
Beef products relative to Beef Baseline product (Beef, Conventional production, Fat content not defined)
Cond. logit
Class 1 Class 2 Class 3 Class 4 Class 5 Class 6 Class average
Conventional, Fat content 5% 4,4 % 5,9 % 33,0 % 6,9 % 1,5 % 0,8 % 1,2 % 9,8 %
Safety, Fat content 5% 5,5 % 7,6 % 33,7 % 7,3 % 2,5 % 0,8 % 5,9 % 10,6 %
Animal welfare, Fat content 5% 6,0 % 7,8 % 34,1 % 7,4 % 2,2 % 1,0 % 10,1 % 10,9 %
Organic, Fat content 5% 6,0 % 7,8 % 22,3 % 4,5 % 0,8 % 0,9 % 37,4 % 8,6 %
Safety, Fat content not defined 1,4 % 2,2 % 3,6 % 1,2 % 1,6 % 0,1 % 6,0 % 1,9 %
Animal, Fat content not defined 1,9 % 2,4 % 5,4 % 1,7 % 1,1 % 0,3 % 11,4 % 2,7 %
Organic, Fat content not defined 2,4 % 3,1 % 4,4 % 1,8 % -0,2 % 0,4 % 43,5 % 4,1 %
Pork products relative to Pork Baseline product (Pork, Conventional production, Fat content not defined)
Cond. logit
Class 1 Class 2 Class 3 Class 4 Class 5 Class 6 Class average
Conventional, Fat content 5% 4,8 % 6,1 % 36,0 % 12,3 % 1,1 % 7,3 % 1,3 % 9,4 %
Safety, Fat content 5% 6,0 % 7,9 % 36,8 % 13,0 % 1,8 % 7,9 % 6,2 % 10,3 %
Animal welfare, Fat content 5% 6,7 % 10,0 % 37,2 % 14,1 % 0,8 % 8,9 % 11,4 % 10,7 %
Organic, Fat content 5% 6,4 % 8,2 % 26,0 % 9,3 % 0,5 % 6,1 % 38,5 % 9,0 %
Safety, Fat content not defined 1,5 % 2,2 % 3,7 % 1,7 % 1,6 % 1,4 % 6,4 % 2,2 %
Animal, Fat content not defined 2,3 % 4,8 % 5,5 % 4,5 % -0,6 % 3,7 % 13,1 % 2,8 %
Organic, Fat content not defined 2,6 % 3,3 % 5,0 % 3,7 % -0,1 % 3,2 % 44,9 % 4,4 %
Table 20 presents the relative WTP estimates for products of interest in the case of no carbon
footprint information. The estimates were calculated separately for both meat types, and it can be
seen that differentiation had in general a slightly greater impact on consumers’ WTP for pork
products. Especially a low fat content for pork minced meat seemed to be of great value for the
consumers, although it was also a feature in beef products that consumers were generally willing
to pay most highly for. All in all the scale of the estimates seemed reasonable with respect to
earlier results (Cicia & Colatuoni, 2010; Nilsson et al., 2006), as the segment-specific estimates
ranged from -1% to +50% and the aggregate ones from 1% to 11%. The low fat content was the
product feature for which consumers in general were willing to pay the highest premiums, but
also premiums for different methods of production existed. In the aggregate level the WTP for
organic production was the highest of these, being 4,1% for beef and 4,4% for pork. Surprisingly,
although organic production was a rather highly appreciated product feature, the WTP for
organic production together with a low fat content was for many classes lower than for a
conventional product with the low fat content.
The consumer segments had however very different WTP values depending on their preferences:
The class valuing the responsible methods of production (class 6) had clearly the highest WTP
for the methods of production and especially for organic production, both for the beef and pork
products and independently of the fat content. Also the price-conscious group (class 1) and the
concerned consumer class (class 3) had a slightly higher WTP for an organic beef product having
76
a low fat content compared to other production methods. In case of pork products the WTP
estimates for animal welfare orientation were higher. The health-conscious consumer class (class
2) was generally willing to pay the most for a low fat content, and had a higher WTP for animal
welfare than for organic production for both meat types. The concerned consumer class (class 3)
had in general an average relative WTP compared to other groups, although its’ premiums for the
beef products were surprisingly lower than the ones of e.g. the price-conscious group. The
tendency was however mainly non-existent for pork products. This can be explained by the
group’s relatively high preferences and WTP for the baseline beef product that results in a lower
relative WTP for the other attributes. The indifferent consumer group (class 4) had in general
relatively low WTP estimates for the additive attributes of beef products and only class 5, the
consumer group appreciating beef products, was similarly not willing to pay notable premiums on
the beef product attributes. Class 5 however had higher relative WTP estimates in case of pork
products, being somewhat similar to the price-conscious group, as in the case of a less preferable
pork product the additional attributes were more valuable. The indifferent consumer group (class
4) had the lowest WTP estimates for pork products, which underlines the impassive attitudes its’
members had on food characteristics.
Table 21 shows the relative WTP premiums for the beef and pork products when the carbon
footprint is mentioned. The bottom of the table illustrates the WTP estimates for baseline beef
and pork products having the carbon footprint information relative to products that do not have
it mentioned. Starting with the upper tables, the relative WTP estimates for pork products were
logically slightly smaller than in the previous table, as the baseline product was now more
favourable than when the footprint information was not provided. Respectively the estimates
were slightly larger for beef products, as the baseline product was now less preferable than in the
context of no footprint information. The impact of the footprint information was clearly the
smallest for the indifferent and the beef preferring consumer classes (4 and 5), and a relatively
more modest one for the price-conscious class (class 1) too. All in all the change compared to not
providing the carbon footprint information seemed to be larger for the pork products. Also the
bottom table containing the relative WTP estimates for the baseline products with respect to the
carbon footprint information illustrates this observation. The change in the WTPs was larger for
the pork products, for which consumers were in general willing to pay more when informed
about the footprint size. The fat content-conscious, the concerned and the method of
production-conscious consumer groups were the ones influenced the most by the carbon
footprint mention.
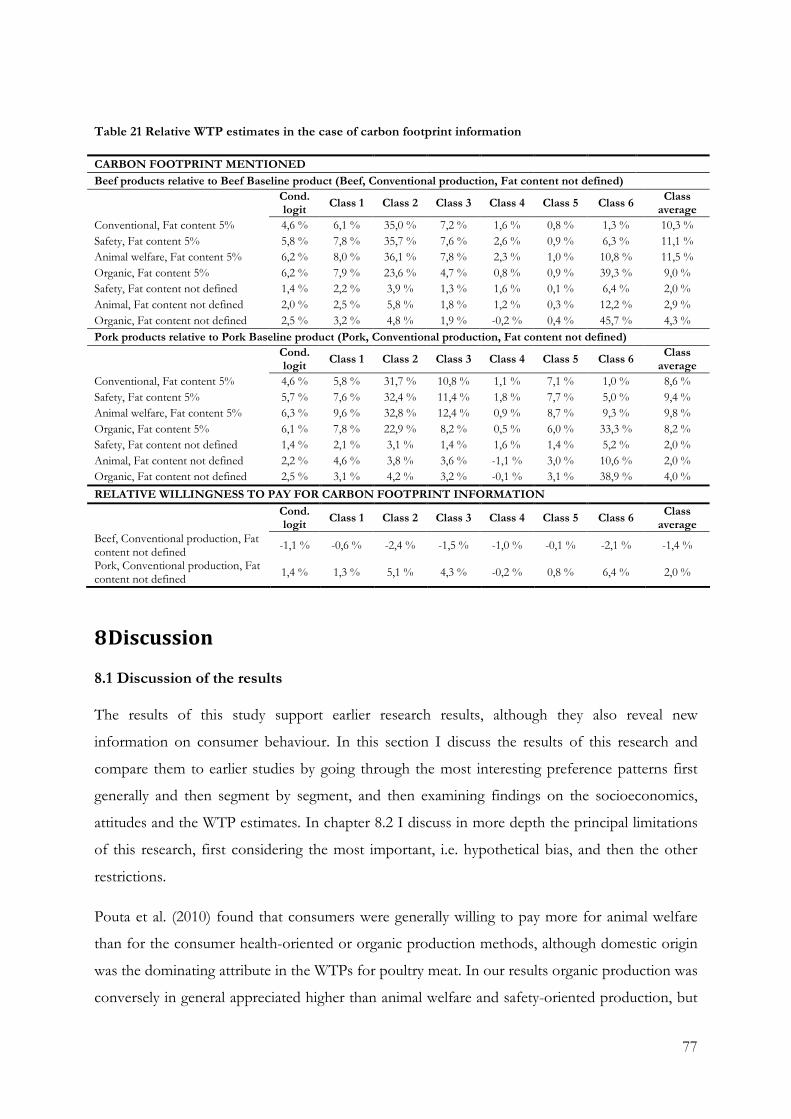
77
Table 21 Relative WTP estimates in the case of carbon footprint information
CARBON FOOTPRINT MENTIONED
Beef products relative to Beef Baseline product (Beef, Conventional production, Fat content not defined)
Cond. logit
Class 1 Class 2 Class 3 Class 4 Class 5 Class 6 Class average
Conventional, Fat content 5% 4,6 % 6,1 % 35,0 % 7,2 % 1,6 % 0,8 % 1,3 % 10,3 %
Safety, Fat content 5% 5,8 % 7,8 % 35,7 % 7,6 % 2,6 % 0,9 % 6,3 % 11,1 %
Animal welfare, Fat content 5% 6,2 % 8,0 % 36,1 % 7,8 % 2,3 % 1,0 % 10,8 % 11,5 %
Organic, Fat content 5% 6,2 % 7,9 % 23,6 % 4,7 % 0,8 % 0,9 % 39,3 % 9,0 %
Safety, Fat content not defined 1,4 % 2,2 % 3,9 % 1,3 % 1,6 % 0,1 % 6,4 % 2,0 %
Animal, Fat content not defined 2,0 % 2,5 % 5,8 % 1,8 % 1,2 % 0,3 % 12,2 % 2,9 %
Organic, Fat content not defined 2,5 % 3,2 % 4,8 % 1,9 % -0,2 % 0,4 % 45,7 % 4,3 %
Pork products relative to Pork Baseline product (Pork, Conventional production, Fat content not defined)
Cond. logit
Class 1 Class 2 Class 3 Class 4 Class 5 Class 6 Class average
Conventional, Fat content 5% 4,6 % 5,8 % 31,7 % 10,8 % 1,1 % 7,1 % 1,0 % 8,6 %
Safety, Fat content 5% 5,7 % 7,6 % 32,4 % 11,4 % 1,8 % 7,7 % 5,0 % 9,4 %
Animal welfare, Fat content 5% 6,3 % 9,6 % 32,8 % 12,4 % 0,9 % 8,7 % 9,3 % 9,8 %
Organic, Fat content 5% 6,1 % 7,8 % 22,9 % 8,2 % 0,5 % 6,0 % 33,3 % 8,2 %
Safety, Fat content not defined 1,4 % 2,1 % 3,1 % 1,4 % 1,6 % 1,4 % 5,2 % 2,0 %
Animal, Fat content not defined 2,2 % 4,6 % 3,8 % 3,6 % -1,1 % 3,0 % 10,6 % 2,0 %
Organic, Fat content not defined 2,5 % 3,1 % 4,2 % 3,2 % -0,1 % 3,1 % 38,9 % 4,0 %
RELATIVE WILLINGNESS TO PAY FOR CARBON FOOTPRINT INFORMATION
Cond. logit
Class 1 Class 2 Class 3 Class 4 Class 5 Class 6 Class average
Beef, Conventional production, Fat content not defined
-1,1 % -0,6 % -2,4 % -1,5 % -1,0 % -0,1 % -2,1 % -1,4 %
Pork, Conventional production, Fat content not defined
1,4 % 1,3 % 5,1 % 4,3 % -0,2 % 0,8 % 6,4 % 2,0 %
8 Discussion
8.1 Discussion of the results
The results of this study support earlier research results, although they also reveal new
information on consumer behaviour. In this section I discuss the results of this research and
compare them to earlier studies by going through the most interesting preference patterns first
generally and then segment by segment, and then examining findings on the socioeconomics,
attitudes and the WTP estimates. In chapter 8.2 I discuss in more depth the principal limitations
of this research, first considering the most important, i.e. hypothetical bias, and then the other
restrictions.
Pouta et al. (2010) found that consumers were generally willing to pay more for animal welfare
than for the consumer health-oriented or organic production methods, although domestic origin
was the dominating attribute in the WTPs for poultry meat. In our results organic production was
conversely in general appreciated higher than animal welfare and safety-oriented production, but

78
the WTP estimates for organic production were quite varying and influenced by the inclusion of
a low fat content on the products. The WTP for organic production has been varying also in
other studies, as often there has been a certain share of consumers who are willing to pay for the
method of production but a majority of them who are not. The negative OrganicPrice interaction
can be interpreted so that even though organic production would have been a preferable form of
production, the consumers considered the price they were willing to pay even more carefully in
the case of organic products. This supports in part the suggestion of Gracia and Magistris (2008)
that economic reasons are an important motive limiting a larger expansion of organic demand.
One explanation for the generally low WTP for organic production could also be that the true
meaning of the concept is still ambiguous for the majority of the consumers: for instance animal
welfare can be more straightforward for them to understand, and it may at the same time be
unclear that organic production covers nutritional and environmental aspects in addition to some
animal welfare-oriented features. On the other hand Cicia and Colatuoni (2010) discovered
suggestive results that the marginal WTP would actually be negatively proportional to the
increase in the number of attributes assigned to the product. Teratanavat and Hooker (2006) and
Nilsson et al. (2006) found equally proof that consumers’ marginal WTP for multiple
certifications may be decreasing and their preferences could be subadditive. This phenomenon
could be extrapolated also to organic production as it is a kind of bundle of the above mentioned
product features. However, one explanation for the partially low WTP estimates for organic
production is simply that consumers are sometimes willing to pay more for animal welfare and
safety-oriented, or even conventional production, especially if combined with a low fat
percentage.
Environmental aspects have often been found to be less important to consumers than health
impacts of food (Chalak et al., 2008; Nilsson et al., 2006) and all in all consumers’ preferences for
environmental production have been studied mainly in the context of organic food. Also the
WTP estimates derived in this study for the carbon footprint information would suggest that
consumers are willing to pay more for a low fat content than a low carbon footprint, even though
their meat-type-specific preferences were influenced by the carbon footprint information.
However, a reason for further research on this matter was raised by the changes in the no-choice
ASCs of the sub-sample-specific conditional logit models, which suggested that the consumers’
choice task could be importantly eased by the carbon footprint information. A latent class
analysis should be performed separately to the sub-samples in order to examine more thoroughly
the impact of the carbon footprint on choices.
79
The largest share of the consumers (23%) belonged to a price-conscious group being rather
indifferent towards other product attributes, although consumers in general were not notably
conscious of the price. It is common that one price-conscious consumer group is recognized in
preference studies (Nilsson et al., 2006; Pouta et al., 2010; Schnettler et al., 2009; etc.). This may
be related to the issue of hypothetical bias, as it can be questioned whether there exists
commonly only one group, although a large one, caring notably for the price of the product even
though differences in consumers’ price sensitivity naturally do prevail. On the other hand this
may be a signal that price does not matter relatively as much to consumers as it has maybe at
some point mattered or as is commonly assumed in the retail trade sector: there could thus be a
potential for larger differentiation of meat products.
The second largest segment was characterised as being conscious of the fat content and the low
fat content was the most highly preferred minced meat feature also in general, raising notably the
WTP estimates. Health impacts have been recognized to be very important also in earlier studies
(Chalak et al., 2008; Teratanavat & Hooker, 2006) and their influence on consumer choice has
been found to be larger than for instance the one of environmental issues (Gracia and Magistris,
2008). Roininen et al.’s (2001) results suggest that this tendency prevails especially in the case of a
Finnish sample, as in their study Finns were found to be more health-oriented than Dutch or
British consumers. Also Europeans in general have been found to be more driven by health
related attributes than US citizens (Lusk et al., 2003). Pouta et al. (2010) however discovered that
in the context of broiler fillets consumers had moderate and partly even indifferent preferences
towards health emphasizing production. The researchers suggested this may have been related to
the general perception of broiler fillets being already itself a healthier option than e.g. beef or
pork. In addition the result may be explained by the fact that this study used a more explicit
formulation of the health attribute as a low fat content, whereas the term used in Pouta et al.
(2010) was a vaguer “consumer health“ orientation. The product safety and health attribute that
was an option in the method of production category of this study, was similarly to Pouta et al.’s
(2010) results a moderately valued meat feature: consumers might perceive product safety to be
already at a sufficient level in Finland and the impact of the healthiness component in the safety
and health attribute was probably weakened by the separate fat content attribute. The results
suggest that a low fat content may serve as a good means to differentiate minced meat products
from the competitors especially in Finland, but its impact might be less important in other market
areas.
80
This study revealed a concerned consumer segment that was to some extent similar to the one
Nilsson et al. (2006) found in their study: their concerned consumers were as well interested in
environmental soundness, animal welfare and food healthiness, the latter of which was
represented in their study by the preference for not using antibiotics to the breeding animals. The
segment, however, had the tendency to buy conventional products if the premium for the
certifications rose too high. The discovery of the concerned consumer group in this study
underpins that it is not enough to the consumers to be concerned and have an ideological or
health-oriented identity, but that there has to be a stronger incentive that promotes buying
responsible and healthy food.
Indifference towards practically all the meat attributes was peculiar to the fourth consumer group
discovered in this study. Lindeman and Stark (1999) found equally an indifferent consumer group
and Bernués et al. (2003b) discovered a convenience-driven consumer group that was relatively
indifferent towards safety, origin, nutritional information and traceability, but had relatively high
preferences for brand name and cooking recommendations. The indifferent consumers of our
study cooked also relatively often but based on our results assumptions on them being more
convenience-oriented than the others cannot be directly made.
The consumers of the second smallest segment were distinguished from the others based on their
highest positive preferences for beef minced meat, which were however reduced in case the
carbon footprint information was offered to the consumers. The groups’ preferences for the
other product features were average. Partially due to the choice experiment design, similar groups
have not been found earlier. The preferences of this group might relate to the tendency of beef
minced meat having in general a reputation of being better quality minced meat.
The smallest consumer group revealed from the data was a segment having a rather high WTP
for the responsible methods of production and being highly affected with information on carbon
footprint. Pouta et al. (2010) discovered quite a similar consumer group as well, as their smallest
segment had highly positive preferences for organic and animal welfare-oriented production.
Nilsson et al. (2006) found equally a segment containing 16% of the consumers that was willing
to pay relatively high premiums for certification of environmentally friendly, animal welfare-
oriented and antibiotics-free production. Bernués et al. (2003a) concluded similarly that the
ethical considerations of consumers were reflected in their preferences, as consumer groups
appreciating animal welfare and environmental soundness were found. They, however, raised the
question whether the stated concerns mean that consumer behaviour is affected respectively.
Their question seems highly relevant as it parallels the results of some earlier studies having
81
concluded that consumers being favourable towerds e.g. animal welfare are however not willing
to pay to improve the conditions or to receive information on the product feature (María, 2006;
Schnettler et al., 2009).
Pieniak et al. (2010) discovered that the younger consumers seemed to be in general less
interested in healthy eating than older ones. Teratanavat and Hooker (2006) found likewise in the
context of functional foods that younger consumers had a lower WTP for health benefits than
middle aged consumers and a higher WTP for organic production. A similar tendency is
detectable in our results, as the price-conscious and the production method-conscious groups
were the youngest ones, the fat content-conscious, the indifferent and the concerned groups
being the oldest.
Women were in general more concerned and willing to pay for different food attributes, as they
formed the majority of the fat-conscious, concerned and method of production-conscious
consumer groups. Men, respectively, were more price-conscious and indifferent for the other
product attributes, even though also the price-conscious group had reasonable willingness to pay
for low fat products and the methods of production. The tendency of women to favour and be
willing to pay more for responsible production methods is in line with Pouta et al. (2010) and
Maria (2006), who found respectively that women had strong positive preferences for animal
welfare-oriented and organic production, and that younger female consumers had a higher WTP
for animal welfare orientation than men in general. Moreover Sarkkinen at al. (2006) discovered
that the most frequent buyers of organic products were women having middle level incomes.
Women have also been recognized to have more notable health concerns than men in earlier
studies (Harvey et al., 2001; see Pouta et al., 2010). Pouta et al.’s (2010) results were in addition
similar to the ones of the present study in that the consumers in their price-conscious consumer
group were most probably younger men having a relatively low income level.
Gracia and Magistris (2008) concluded that income seems to be the main reason limiting the
demand for organic products, and also based on our results income can be seen to explain the
consumer choices to a degree. The wealthiest consumer group favoured dominantly the generally
most expensive meat type beef, and the group willing to pay the highest amounts for products
with a low fat content was the second wealthiest group in the sample. The concerned and the
indifferent consumer groups belonged to the middle income groups, whereas the consumer
group willing to pay for responsible production methods contained in general people having
mainly average but partly also lower income levels. The price-conscious consumers were the ones
having the lowest income level. Income can thus be seen as having a logical impact on the WTP
82
of the consumers, although it is not always a consumer characteristic influencing choices the
most. Consumers belonging to the production method-conscious group were willing to pay large
premiums for e.g. organic production, although they earned less than many of the other groups.
For instance the concerned consumers had lower premiums, even though they were concerned
and had ideological attitudes. Influencing consumers’ attitudes and their involvement in making
responsible food choices might thus for some be a more important factor promoting responsible
products than lowering the prices. As the educational level covariate was partially insignificant, I
do not discuss the tendencies on the matter further, and leave it to further research to clarify its
importance.
Consumers’ meat eating frequency could be seen as explaining heterogeneity, at least in the case
of responsible attitudes and choices: the concerned and the production method-conscious
consumer groups had the largest share of vegetarians and people eating only a little meat. This is
in line with Lindeman and Stark’s (1999) suggestion that eating habits like vegetarianism and
other identity shaping characteristics are good predictors of ideological food choice. Consumers’
attitudes seem to predict well behaviour, as discovered also in earlier studies (Kornelis at al.,
2010; Lindeman & Stark, 1999; Roininen et al., 2010; Teratanavat & Hooker, 2006). The price-
conscious group was not especially concerned on the development of the food industry and was
rather indifferent towards animal welfare, environmental impacts and other such issues. The fat
content-conscious consumer group stood out by its health-oriented attitudes but the indifferent
consumer group was all in all rather uninterested in the food characteristics. The group preferring
beef products but having a low WTP for additional features had rather average attitudes, and the
smallest consumer group favouring responsible production methods was overall concerned and
perceived animal welfare and environmental production as being very important factors. This was
in line with the fact that the group had a largest share of people belonging to environmental or
animal welfare related organizations. One exception was however found: The concerned
consumers were literally concerned on the different dimensions of food characteristics and they
had the second largest share of people belonging to an environmental or animal welfare
organization and eating only little meat. In addition, the segment was the most probable to vote
for the Green League. These characteristics communicating of an ideological identity were
however not projected in the group’s stated choices or in their WTPs similarly to the other
groups.
Finally, the fat content-conscious and indifferent consumer groups were the ones having most
probably a connection to breeding animals and meat production, the least probable being the

83
concerned and the method of production-conscious groups. This suggests that consumers being
the most concerned on animal welfare and environmental issues are in general the ones being
least intimate with farming and agriculture. The information on the residential area of the
consumers supports this proposition to some extent and the voting behaviour quite substantially,
if stereotypical Finnish voting behaviour is assumed to hold true: the same consumer segments
had voted respectively for the Centre Party seen as being popular in the rural areas of Finland,
and for the Green League, the latter of which is often perceived to be the choice of the
ecologically oriented urban population. Also Bernués et al. (2003a) found a connection between
the appreciation of animal welfare and environmentally oriented production and consumers
living in big or medium sized cities.
Our WTP estimates for safety-oriented production were in general smaller than the ones found
by Hearne and Volcan (2005), and also clearly more moderate than those of Cicia and Colantuoni
(2010), who discovered that in earlier WTP studies consumers had been willing to pay a 12% to
16% premium on average for a food safety guarantee. Cicia and Colantuoni’s (2010) research, a
meta-analysis on earlier research results on consumers’ willingness to pay for meat attributes,
revealed also that in general consumers have been willing to pay a premium of 7% to 14% for
animal welfare with respect to the base price. This contrasts the results of this study, as in the
case of our minced meat products the WTP estimates for animal welfare were in general larger
than those for safety-oriented production, ranging from 0% to 12% for beef and from -1% to
13% for pork. Our WTP estimates were equally more moderate than the ones derived for pork
chops by Nilsson et al. (2006): an attribute-conscious consumer group containing 16% of the
consumers had according to the authors a relative WTP from 75% to 300% for an environmental
certification, animal welfare certification and a certification for not using antibiotics, depending
on the attribute at stake and on the amount of attributes present in the same product. Their
price-conscious group containing 41% of the consumers had relative WTPs ranging from 6% to
19%. Teratanavat and Hooker ‘s (2006) estimate for a single health benefit in functional foods
seems to be somewhat in line with the estimates of this study, as it matches the premiums of the
fat content-conscious consumer group (class 2). However, at the aggregate level Teratanavat and
Hooker’s (2006) estimates were equally larger and the WTP range for organic production was
narrower than the one revealed in this study, containing slightly negative values only in the case
of one consumer group.
84
In the light of these results the WTP estimates of this study seem rather reasonable, although it
should be kept in mind that minced meat products may also differ from other meat products in a
way that decreases consumers’ willingness to pay for different additional features.
8.2 Limitations of the research
Many researchers have questioned whether WTP estimates that are based on stated preferences
can be trusted to provide accurate and truthful measures. As already discussed in chapter 3.2 the
principal limitation of this study is indeed the use of stated preferences data instead of revealed
preferences: the respondents were aware that no actual money transfers would take place when
choosing between the minced meat products, which increases the potential of having
hypothetical bias in the results. This limitation is reduced because the monies in question when
buying minced meat are small, unlike for instance in the case of environmental valuation. Also
using a choice experiment instead of contingent valuation or open-ended questions may decrease
the importance of the bias in the estimates. The results of this study, especially concerning the
WTP, must however be interpreted with caution, as the estimates for the impact of price on the
choice may be biased downwards. In the latent class model with interactions the price parameter
had a notable impact only for the first or the price-conscious group. Apart from the hypothetical
bias, the insignificance was partly due to the inclusion of the price interactions: these variables
captured a part of the price impact, and the combined effect of the price attribute and the price
interactions was thus larger than the one assigned to the price parameter alone. The impact of the
interactions was included in the willingness to pay estimates, so they should not be biased due to
the partly insignificant price parameters.
The level of hypothetical bias could have potentially been alleviated with a simple trick like the
one used by Tonsor et al. (2005) in their consumer preference study on beef steak attributes: The
respondents were told that after having answered to the survey, they would be asked to buy one
of the products they had chosen in one of the choice sets. The choice set in question was said to
be selected randomly, so that the consumers were not able to know which of their purchase
decisions would come true after having answered to the choice experiment. Tonsor et al. (2005)
did not finally make the respondents buy the meat as the actual purchase was not necessary for
the hypothetical bias to be reduced. Although it can be seen as dubious to mislead the subjects of
experiment, this kind of an approach could be recommendable in further study in case a stated
choice experiment should be realized.
85
It would nonetheless be interesting to run a similar analysis with revealed preference data in order
to examine the scale of the hypothetical bias in the estimates. These data could be either data on
realized purchases from a retail chain, having naturally the limitation of being restricted to
existing products, or data obtained from a laboratory or a field study. A field study would enable
the circumstances to resemble more a natural shopping situation, especially if the data were
gathered by simply observing the targets. A laboratory experiment on the other hand would allow
for a stricter control over the environment and the product attributes, but lose in the natural
circumstances. When individuals know they are being studied, they most probably adapt their
behaviour to some extent: even though the hypothetical bias related to money transfer would no
longer persist, this potential bias of e.g. wanting to please the interviewer remains in most
laboratory and field studies. However, both a field study and a laboratory experiment would
increase the reliability of the results compared to a stated preferences study, and a natural field
experiment would eliminate any bias following from the knowledge of being surveyed. This kind
of an experiment could for instance be realized by setting up a special campaign with a product
demonstrator for minced meat products at a grocery store. The demonstrator and the campaign
materials could promote the product features of three optional minced meat products and their
price. The consumers contacted by the demonstrator would with certain exclusions choose one
of the products or the no-buy option from the sample. In line with Adamowicz et al. (1994) an
intriguing option would also be to form some kind of a joint model for estimating stated and
revealed preference data together or just by combining the results of studies realized with a
survey and in the market. The presence of some correlation between the stated preferences and
the realized purchases would support the conclusions on this stated preferences study.
Adamowicz et al. (2008a, 9) mention that the identification of the correct product characteristics
is crucial in order to produce accurate results in this kind of choice experiments. The attributes
used in this study were proven to be for the most part significant, but there might have been
unenclosed meat characteristics that would as well have had an impact on consumer choice. The
alternative-specific constants were included in the model in order to account for this kind of
systematic bias, but still the absence of some essential factors might have influenced the
meanings that respondents assigned for the remainder of the attributes.
One factor that would have been interesting to include in the study is the appearance of the
minced meat. For instance Kennedy, Stewart-Knox, Mitchell and Thurnham (2004, 126) found in
their focus group study that appearance was the most important sign of quality for poultry meat,
seen as reflecting among others its taste and healthiness. Becker et al. (2000) discovered equally
86
that a share of the consumers thought that visual characteristics like the colour and the leanness
of meat could be used as quality cues for beef, pork and poultry meat.
The country of origin was left out of the attribute repertoire for one because it had been
speculated to include more meanings than just the place of origin of the meat. It is worth asking
whether some other attributes might also have different meanings than their true definition or if
the meanings differ between consumers. As already discussed above, for example organic
production might be an unclear concept to consumers and it could be perceived differently by
different individuals, as it is to some part unclear whether the production method e.g. has
positive or negative environmental impacts. Consumers could likewise have different perceptions
of the accuracy and the credibility of the information provided to them: some respondents might
have questioned whether the measurement of the carbon footprint can actually be accurate. Also
the elementary knowledge of the consumers could have differed and influenced their perception
of the product attributes. These issues should be lessened by providing the respondents with
detailed descriptions of the methods of production, the fat percentage and the carbon footprint
before they took the choice experiment. However, the degree to which these descriptions have an
influence is unclear, as Chalak et al. (2008) discovered that consumers chose products mainly
based on their presumptions on the product features and not based on the description provided
to them before answering the survey. This effect could have occurred in our choice experiment
as well: even though detailed descriptions of the methods of production was provided to the
respondents, the impact of the new information could have been small and the consumers could
have answered based on their old gut feelings.
An interesting concern is in addition the impact of the meat cut on consumer choice. Minced
meat is further processed meat than e.g. steaks and this might have an influence on consumers’
perception of the importance of animal welfare or organic production: the closest association of
packaged minced meat could be meatballs instead of the cow or the pig living at the farm. Cicia
and Colatuoni (2010, 686) found however in their meta-analysis that the meat cut type except for
steak cut type did not influence significantly consumers’ WTP. In addition the steak cut type
surprisingly affected negatively consumers’ WTP with respect to other more processed meat
types like ground meat and sausages. This result however is not in line with the prices of meat
types generally prevailing in food stores, and can thus be questioned. In any case, cut type should
be kept in mind when comparing the results to other meat preference studies, although studies
on similar minced meat products should be comparable without exceptions.
87
9 Conclusions
Consumers are increasingly conscious and concerned on environmental impacts and other
credence characteristics of food. The meat industry is additionally faced with pressure from
international competitors, as the amount of meat imports has increased during the last years. The
aim of this study was to provide meat producers with means for product differentiation. This was
done by providing them with information on consumers’ relative preferences for minced meat
attributes, i.e. the product features that give them the greatest added value, and by revealing
whether there exist heterogeneous consumer segments. In addition the impact of the carbon
footprint information on consumer choice was examined.
The choice experiment on consumers’ relative preferences revealed that low fat percentage had a
particularly positive effect on the choice of a minced meat product. Minced beef meat was
generally preferred over pork and mixed beef and pork. Among the methods of production,
organic production had a larger positive effect on the choice than animal welfare-oriented and
product safety and health-oriented production, although consumers had stated product safety to
be a more important food attribute than animal welfare or environmental production before
taking the choice experiment. This suggests that safety and healthiness are seen as important food
features, but as they do not impact choices respectively they might be seen to be generally at a
sufficient level. The willingness to pay estimates revealed, however, that even though consumers
were in general willing to pay more for organic production than animal welfare and food safety,
their WTP for organic products was decreased importantly if the minced meat had a low fat
content – even below their WTP for conventional production.
There was nonetheless significant heterogeneity in consumer preferences, and the six consumer
segments discovered by this analysis differed notably from each other in their preferences. The
six classes included in size order a price-conscious, a fat content-conscious, and a concerned
consumer group, a group of indifferent individuals, a group preferring beef products and a group
that was conscious for the different methods of production.
In the light of earlier studies the WTP estimates seemed rather realistic and reasonable, although
also the cut type being minced meat could impact their scale. The price-conscious segment was
for instance willing to pay a 5,9% premium for minced beef meat having a fat content of 5
percentage, a 3,1% premium for organic production and a 2,4% premium for animal welfare-
oriented production, compared to a baseline minced meat product being produced in a
conventional manner and having a not defined fat content. The fat content-conscious consumer
88
group however was willing to pay a 33% premium for minced beef meat having a 5% fat content
and the method of production-conscious segment a 43,5% premium for organically produced
minced beef meat.
Information on carbon footprint had in general a significant impact on consumer choice,
influencing meat type -specific consumer preferences: beef products have a larger carbon
footprint than pork products and consequently their popularity decreased when footprint
information was presented to the consumers. This positive impact on the WTP estimates of pork
products was the highest for the segment preferring the responsible methods of production, the
fat content-conscious and the concerned consumer segments, ranging all in all from a 6,4%
premium of the first mentioned to a -0,2% premium for the indifferent consumer group. The
respective negative impact of the carbon footprint information on minced beef meat was smaller,
ranging from -2,4% to -0,1%. Results also suggested that the carbon footprint could be a
relatively dominating product attribute, although probably only subordinately to the fat content,
as the choice task seemed to have been easier for the sub-sample having information on the
footprint than for the sub-sample to which the information was not presented.
Women were in general more concerned and willing to pay for a low fat content and responsible
methods of production. Income was discovered to have a logical impact on the WTP of the
consumers, although it is not always a characteristic influencing choices the most. Consumers’
attitudes seemed to predict well behaviour, as discovered also in earlier studies, although
exceptions to the rule were also revealed: the concerned consumers’ attitudes were not reflected
in the choices in the same extent as for the other groups. An interesting result was also the
finding that the consumers being the most concerned on animal welfare and environmental
aspects were in general the ones being least intimate with farming and agriculture.
Influencing consumers’ attitudes and their involvement in making responsible food choices could
thus, besides to lower prices, be an effective way to promote e.g. demand for organic production.
The concerned consumers might nonetheless represent a group that would be willing to buy
responsible products only if they were less expensive, similarly to Nilsson et al.’s (2006) results.
The discovery of this concerned consumer group underpins that it is not enough for the
consumers to be concerned and have ideological or health-oriented attitudes: there has to be
stronger incentives that promote buying responsible and healthy food in order to actually affect
consumer choice.
89
The relatively low importance of price for the consumer segments may be related to hypothetical
bias being caused by the hypothetical setting of the choice experiment. On the other hand this
may also be a signal that price does not matter relatively as much to the consumers as is
commonly assumed. There can thus be greater potential for gains from differentiating minced
meat products than what is currently put to use. It would, however, be interesting to run a similar
analysis with revealed preference data in order to examine the scale of the hypothetical bias in the
estimates.
All things considered, the results of this study suggest that especially a low fat content may well
serve as a means to differentiate minced meat products in Finland, but its impact might be less
important in other market areas. The Finnish meat processors and producers could make good
use of segmentation, as particular consumer groups were willing to pay significant premiums for
especially organic and to some extent animal welfare-oriented production. The product offers
should possibly be kept simple: multiple characteristics might erode each others’ impacts on the
premiums. The carbon footprint was not revealed to be a product feature for which consumers
would have high WTP, although the results suggested that footprint information could to some
extent facilitate consumers’ choice between differing products. The possibilities for
differentiation that are provided by carbon footprint information should thus be further
examined before making definite conclusions. Although providing information on the footprint
size had an impact on the stated choices of consumers in this study, increasing environmental
consciousness may in the future itself induce similar choice patterns even without explicit carbon
footprint information on the products. This would increase the demand for minced pork on the
expense of beef, potentially favouring also mixed pork and beef. The latter could be seen as a
compromise between two preferred but conflicting ends – on one hand favouring beef as a meat
type and on the other hand buying products with smaller negative environmental impacts.
90
10 References
Adamowicz, Louviere & Swait, 1998a. Introduction to attribute-based stated choice methods,
Final Report submitted to Resource Valuation Branch, Damage Assesment Center, NOAA, Edmonton.
Adamowicz, Louviere & Williams, 1994. Combining revealed and stated preference methods for
valuing environmental amenities, Journal of Environmental Economics and Management, Vol. 26 (3),
Pages 271-292.
Adamowicz, Boxall, Williams & Louviere, 1998b. Stated preference approaches for measuring
passive use values: choice experiments and contingent valuation, American Journal of Agricultural
Economics, Vol. 80, 64-75
Anderson, de Palma & Thisse, 1992. Discrete choice theory of product differentiation, The MIT Press.
Baltas & Doyle, 2001. Random utility models in marketing research: a survey, Journal of Business
Research 51 (2001) 115-125
Banović, Grunert, Barreira & Fontes, 2009. Beef quality perception at the point of purchase: a
study from Portugal, Food Quality and Preference, Vol. 20 (4) 2009, 335-342
Bateman, Carson, Day, Hanemann, Hanley, Hett, Jones-Lee, Loomes, Mourato, Özdemiroglu,
Pearce, Sugden & Swanson, 2002. Economic valuation with stated preference techniques: a manual, Edward
Elgar Publishing, Inc.
Becker, Benner & Glitsch, 2000. Consumer perception of fresh meat quality in Germany, British
Food Journal, Vol. 102 (3), 246 – 266.
Bernués, Olaizola & Corcoran, 2003a. Extrinsic attributes of red meat as indicators of quality in
Europe: an application for market segmentation, Food Quality and Preference, Vol. 14 (4), 265-276.
Bernués, Olaizola & Corcoran, 2003b. Labelling information demanded by European consumers
and relationships with purchasing motives, quality and safety of meat, Meat Science 65 (3), 1095-
1106.
Berry, 1994. Estimating discrete-choice models of product differentiation, The RAND Journal of
Economics, Vol. 25, (2), 242-262.
91
Boxall & Adamowicz, 2002. Understanding heterogeneous preferences in random utility models:
a latent class approach, Environmental and Resource Economics 23: 421–446, 2002.
Birol, Karousakis & Koundouri, 2006. Using a choice experiment to account for preference
heterogeneity in wetland attributes: The case of Cheimaditida wetland in Greece, Ecological
Economics 60(2006) 145-156.
Brown, 2003. Introduction to stated preference methods. In Bateman (Ed.) 2003, A primer on
nonmarket valuation - the economics of non-market goods and resources, Kluwer Academic Publishers,
Chapter 4, 99-110.
Burkett, 2006. Microeconomics: Optimization, Experiments, and Behavior, Oxford University Press.
Chang, Lusk & Norwood, 2009. How closely do hypothetical surveys and laboratory experiments
predict field behaviour?, American Journal of Agricultural Economics, Vol. 91 (2), 518-534.
Cicia & Colantuoni, 2010. WTP for traceable meat attributes: a meta-analysis, International Journal
on Food System Dynamics, Vol. 1 (3), 252-263.
Dougherty, 2007. Introduction to econometrics, Third Edition, Oxford University Press.
Gracia, Loureiro & Nayga 2009. Consumers’ valuation of nutritional information: a choice
experiment study, Food quality and preference, Vol. 20 (7), 463-471.
Gracia & Magistris, 2008. The demand for organic foods in the South of Italy: A discrete choice
model, Food Policy, Vol. 33 (5), 386-398.
Jaffry, Pickering, Ghulam, Whitmarsh & Wattage, 2004. Consumer choices for quality and
sustainability labelled seafood products in the UK, Food Policy, Vol. 29 (3) 215–228.
Hanemann, 1984. Discrete /continuous models of consumer demand, Econometrica, Vol. 52 (3),
541-562.
Hanley, Mourato & Wright, 2001. Choice modelling approaches: a superior alternative for
environmental valuatioin?, Journal of Economic Surveys, Vol.15 (3), Pages 435 – 462.
Harvey, Erdos, Challinor, Drew, Taylor, Ash, et al. (2001). The relationship between attitudes,
demographic factors and perceived consumption of meats and other proteins in relation to the
BSE crisis: A regional study in the United Kingdom, Health Risk and Society, Vol 3., 181-197.
92
Hearne & Volcan (2005) The use of choice experiments to analyze consumer preferences for
ecolabeled and organic produce in Costa Rica, Quarterly Journal of International Agriculture, Vol. 44
(4), 381-397.
Holmes & Adamowicz, 2003. Attribute-based methods, in Bateman (Ed.), 2003. A primer on
nonmarket valuation - the economics of non-market goods and resources, Kluwer Academic Publishers,
Chapter 4, 99-110.
Hoyos, 2010. The state of the art of environmental valuation with discrete choice experiments,
Ecological Economics, Vol. 69 (2010) 1595-1603.
Hu, Hünnemeyer, Veeman, Adamowicz & Srivastava, 2004. Trading off health, environmental
and genetic modification attributes in food, European Review of Agricultural Economics, Vol. 31 (3),
pp. 389-408.
Juric & Worsley, 1998. Consumers’ attitudes towards imported food products, Food Quality and
Preference, Vol. 9 (6), 431-441.
Kasenius, 2010. Valuation of reduced eutrophication in the Gulf of Finland: choice experiment
with attention to heterogeneous and discontinuous preferences and respondent uncertainty,
Academic Dissertation, Department of Economics and Management, University of Helsinki.
Kemp, Insch, Holdsworth & Knight, 2010. Food miles: do UK consumers actually care? Food
Policy, Vol. 35 (6), 504-513
Kennedy, Stewart-Knox, Mitchell & Thurnham, 2004. Consumer perceptions of poultry meat: a
qualitative analysis, Nutrition & Food Science, Vol. 34 (3), 122-129.
Kornelis, Herpena, van der Lansa & Aramyana, 2010. Using non-food information to identify
food-choice segment membership, Food Quality and Preference, Vol. 21 (5), 2010, 512-520.
Lancaster, 1966. A new approach to consumer theory, The Journal of Political Economy, Vol. 74 (2) ,
132-157, The University Chicago Press.
Lindeman & Stark, 1999. Pleasure, pursuit of health or negotiation of identity? Personality
correlates of food choice motives among young and middle-aged women. Appetite, Vol. 33, 141-
161.
93
Loureiro & Umberger, 2007. A choice experiment model for beef: What US consumer responses
tell us about relative preferences for food safety, country-of-origin labeling and traceability, Food
Policy, Vol. 32 (4), 496-514
Lusk, Roosen & Fox, 2003. Demand for beef from cattle administered growth hormones or fed
genetically modified corn: a comparison of consumers in France, Germany, the United Kingdom,
and the United States, American Journal of Agricultural Economics, Vol. 85 (1), 16–29, American
Agricultural Economics Association.
MacKerron, Egerton, Gaskell, Parpia, & Mourato 2009. Willingness to pay for carbon offset
certification and co-benefits among (high-)flying young adults in the UK, Energy Policy, Vol. 37
(4), 1372-1381.
Magidson, Eagle & Vermunt, 2003. New developments in latent class choice models, Sawtooth
Software Conference Proceedings, 89-112.
Malhotra & Birks, 2006. Marketing research: an applied approach (European Edition), Second edition,
Prentice Hall, Inc. a Pearson Education Company.
Maria, 2006. Public perception of farm animal welfare in Spain, Livestock Science, Vol. 103, 250-
256.
Mark & Swait, 2004. Using stated preference and revealed preference modelling to evaluate
prescribing decisions, Health Economics, Vol. 13 (6), 563–573.
McFadden, 1974. Conditional Logit Analysis of qualitative choice behavior, in P. Zarembka (ed.),
Frontiers in econometrics, 105-142, Academic Press: New York, 1974.
Mtimet & Albisu, 2006. Spanish wine consumer behavior: a choice experiment approach,
Agribusiness, Vol. 22 (3), 343-362.
Napolitano, Braghieri, Piasentier, Favotto, Naspetti & Zanoli 2010. Effect of information about
organic production on beef liking and consumer willingness to pay, Food Quality and Preference, Vol.
21 (2), 207-212.
Napolitano, Caporale, Carlucci & Monteleone 2007. Effect of information about animal welfare
and product nutritional properties on acceptability of meat from Podolian cattle, Food Quality and
Preference, Vol. 18, 305-312.
94
Nilsson, Foster & Lusk, 2006. Marketing opportunities for certified pork chops, Canadian Journal
of Agricultural Economics, Vol. 54 (4), 567-583.
Pieniak, Verbeke, Ottar Olsen, Birch Hansen & Brunsø 2010. Health-related attitudes as a basis
for segmenting European fish consumers, Food Policy, Vol. 35 (5), 448-455.
Pouta, Heikkilä, Forsman-Hugg, Isoniemi & Mäkelä 2010. Consumer choice of broiler meat: the
effects of country of origin and production methods. Food Quality and Preferences, Vol. 21 (5), 539–
546.
Roininen, Tuorila, Zandstra, Graaf, Vehkalahti, Stubenitsky & Mela, 2001. Differences in health
and taste attitudes and reported behavior among Finnish, Dutch and British consumers: a cross-
national validation of the Health and Taste Asttitude Scales (HTAS), Appetite, Vol. 37, 33-45.
Sarkkinen, Jakosuo, Aakkula, Forsman-Hugg, Kottila & Rönni, 2006. Elintarvikeketjun
toimijoiden ja kuluttajien käsityksiä luomutuotannosta ja luomuruoasta, MTT:n selvityksiä 124,
Maa- ja elintarviketalouden tutkimuskeskus.
Schnettler, Vidal, Silva, Vallejos & Sepúlveda, 2009. Utility to consumers and consumer
acceptance of information on beef kabels in Southern Chile, Chilean Journal of Agricultural Research,
Vol. 69 (3), 373-382.
Swait, 1994. A structural equation model of latent segmentation and product choice for cross-
sectional revealed preference choice data, Journal of Retailing and Consumer Services, Vol 1, 77–89.
Teratanavat & Hooker, 2006. Consumers valuations and preference: heterogeneity for a novel
functional food, Journal of Food Science, Vol. 71 (7), 533-541.
Tiffin, Traill & Mortimer, 2006. Food choice in an interdisciplinary context, Journal of Agricultural
Economics, Vol. 57 (2), 213-220.
Tonsor, Schroeder, Fox & Biere 2005. European preferences for beef steak attributes, Journal of
Agricultural and Resource Economics, Vol. 30 (2), 367-380, 2005, Western Agricultural Economics
Association
Train, 2009. Discrete choice methods with simulation, Cambridge University Press, Second edition.
95
Vermeulen, Goos & Vandebroek, 2008. Models and optimal designs for conjoint choice
experiments including a no-choice option, International Journal of Research in Marketing, Vol. 25 (2),
94-103.
Vermunt & Magidson, 2005. Latent GOLD® Choice 4.0 User's Manual, Copyright © 2005 by
Statistical Innovations, Inc.
Viinisalo, Nikkilä & Varjonen, 2008. Elintarvikkeiden kulutusmuutokset kotitalouksissa vuosina
1966–2006, Kuluttajatutkimuskeskus, julkaisuja 7, 2008.
Online resources:
Aro, 2008. Liha ruokavaliossa, 100 kysymystä ravinnosta, Terveyskirjasto, Kustannus Oy
Duodecim.
http://www.terveyskirjasto.fi/terveyskirjasto/tk.koti?p_artikkeli=skr00071, 15.10.2010.
Elintarviketeollisuusliitto, 2009. Elintarvikkeiden tuonti 1995, 2000 ja 2005 – 2009, Vienti- ja
tuontitilastot, Elintarviketeollisuusliitto ETL.
http://www.etl.fi/www/fi/tilastot/vienti-_ja_tuontitilastot.php, 15.10.2010.
Lihatiedotus, 2010. Lihan kulutus EU-maissa kg/hlö, Lihan kulutus euroopassa, Tilastot.
http://www.lihatiedotus.fi/www/fi/tilastot/lihan_kulutus_euroopassa.php, 15.10.2010.
Online database of Statistics Finland, http://www.stat.fi/index.html:
Tilastokeskus, 2010. Väestö iän (1-v.) ja sukupuolen mukaan alueittain 1980 – 2009.
http://pxweb2.stat.fi/database/StatFin/vrm/vaerak/vaerak_fi.asp, 14.5.2010.
Tilastokeskus, 2009. Väestöntiheys alueittain 1.1.2009.
http://pxweb2.stat.fi/database/StatFin/vrm/vaerak/vaerak_fi.asp, 14.5.2010.
Tilastokeskus, 2010. Väestön koulutusrakenne 1998–2009.
http://pxweb2.stat.fi/database/StatFin/kou/vkour/vkour_fi.asp, 14.5.2010.
Tilastokeskus, 2007. Väestö/työlliset, 2007.
Tilastokeskus, 2010. Kotitalouksien tulot kotitalouden elinvaiheen mukaan, 2007.
http://pxweb2.stat.fi/Database/StatFin/tul/tjt/tjt_fi.asp, 14.5.2010.
Tilastokeskus, 2010. Kotitalouksien tulot aikuisten ja lasten lukumäärän mukaan, 2007.
http://pxweb2.stat.fi/Database/StatFin/tul/tjt/tjt_fi.asp, 14.5.2010.
Tilastokeskus, 2009. Tulonjakotilasto 2007, Liitetaulukko 6. Kotitalouksien tulojen rakenne
tuloluokittain 2007. Tuloluokat muodostettu bruttotulojen perusteella.

96
http://www.stat.fi/til/tjt/2007/tjt_2007_2009-05-20_tau_007_fi.html, 14.5.2010.
Tilastokeskus, 2009. Taulukko 6. Kotitalouksien kulutusmenojen rakenne kotitalouden
viitehenkilön sosioekonomisen aseman mukaan 2006 (%), 12.
http://www.stat.fi/til/ktutk/2006/ktutk_2006_2009-06-08_fi.pdf, 15.10.2010.
TIKE, 2010. Lihan kulutus Suomessa, Elintarvikkeiden kulutus henkeä kohden vuosina 2008 ja
2009, Ravintotase, ennakko 2009, Tike, Maa- ja metsätalousministeriön tietopalvelukeskus.
http://www.maataloustilastot.fi/ravintotase-2009-ennakko_fi, 20.10.2010.
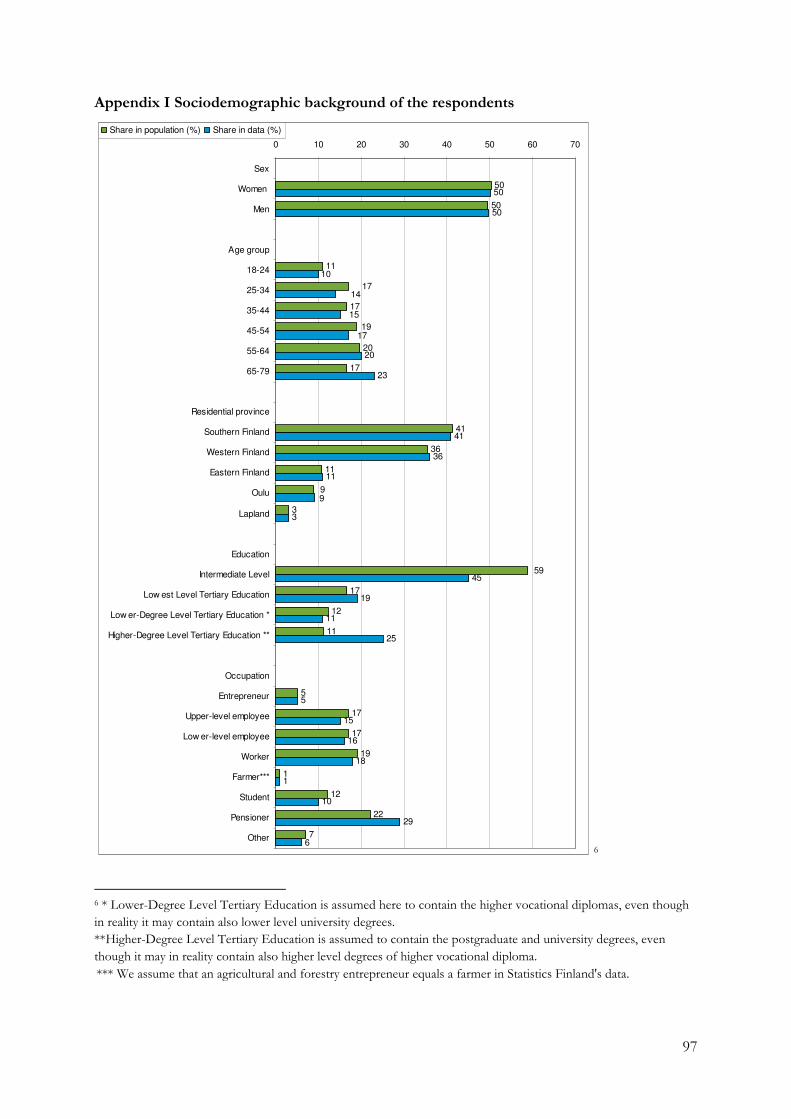
97
Appendix I Sociodemographic background of the respondents
50
50
17
20
17
41
36
11
3
17
12
11
5
17
17
19
1
12
22
7
50
50
20
23
41
36
11
3
45
19
11
25
5
15
16
18
1
10
29
59
9
19
11
17
6
9
17
15
10
14
0 10 20 30 40 50 60 70
Sex
Women
Men
Age group
18-24
25-34
35-44
45-54
55-64
65-79
Residential province
Southern Finland
Western Finland
Eastern Finland
Oulu
Lapland
Education
Intermediate Level
Low est Level Tertiary Education
Low er-Degree Level Tertiary Education *
Higher-Degree Level Tertiary Education **
Occupation
Entrepreneur
Upper-level employee
Low er-level employee
Worker
Farmer***
Student
Pensioner
Other
Share in population (%) Share in data (%)
6
6 * Lower-Degree Level Tertiary Education is assumed here to contain the higher vocational diplomas, even though
in reality it may contain also lower level university degrees. **Higher-Degree Level Tertiary Education is assumed to contain the postgraduate and university degrees, even
though it may in reality contain also higher level degrees of higher vocational diploma. *** We assume that an agricultural and forestry entrepreneur equals a farmer in Statistics Finland's data.
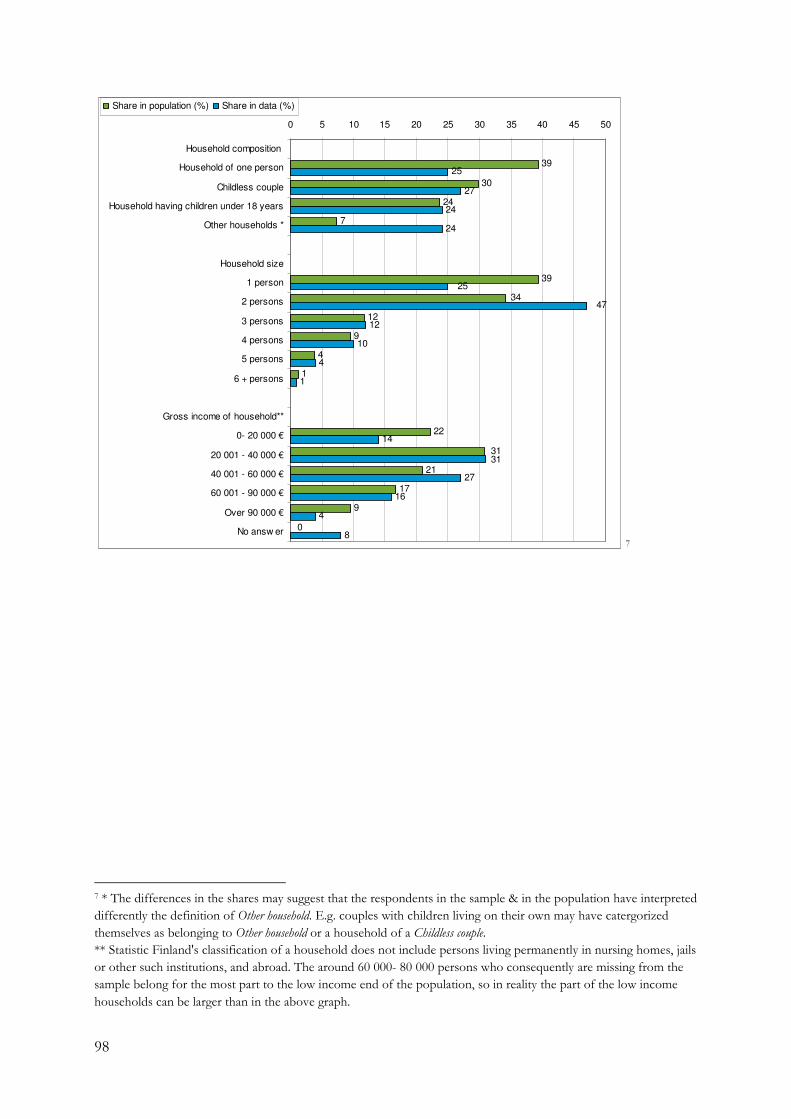
98
39
30
24
7
39
12
9
4
1
22
21
17
9
25
27
24
24
12
10
4
1
14
27
16
4
8
34
31
0
25
47
31
0 5 10 15 20 25 30 35 40 45 50
Household composition
Household of one person
Childless couple
Household having children under 18 years
Other households *
Household size
1 person
2 persons
3 persons
4 persons
5 persons
6 + persons
Gross income of household**
0- 20 000 €
20 001 - 40 000 €
40 001 - 60 000 €
60 001 - 90 000 €
Over 90 000 €
No answ er
Share in population (%) Share in data (%)
7
7 * The differences in the shares may suggest that the respondents in the sample & in the population have interpreted
differently the definition of Other household. E.g. couples with children living on their own may have catergorized
themselves as belonging to Other household or a household of a Childless couple. ** Statistic Finland's classification of a household does not include persons living permanently in nursing homes, jails
or other such institutions, and abroad. The around 60 000- 80 000 persons who consequently are missing from the
sample belong for the most part to the low income end of the population, so in reality the part of the low income
households can be larger than in the above graph.
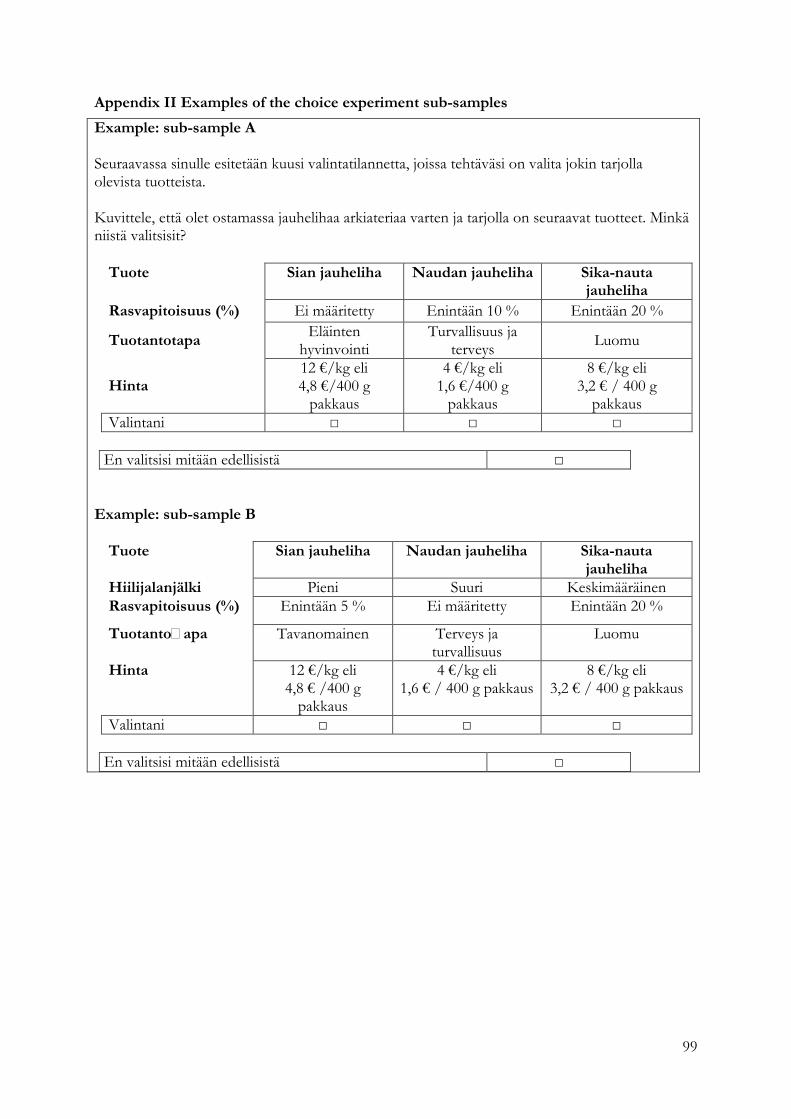
99
Appendix II Examples of the choice experiment sub-samples
Example: sub-sample A Seuraavassa sinulle esitetään kuusi valintatilannetta, joissa tehtäväsi on valita jokin tarjolla olevista tuotteista. Kuvittele, että olet ostamassa jauhelihaa arkiateriaa varten ja tarjolla on seuraavat tuotteet. Minkä niistä valitsisit?
Tuote Sian jauheliha Naudan jauheliha Sika-nauta jauheliha
Rasvapitoisuus (%) Ei määritetty Enintään 10 % Enintään 20 %
Tuotantotapa Eläinten
hyvinvointi Turvallisuus ja
terveys Luomu
Hinta 12 €/kg eli 4,8 €/400 g pakkaus
4 €/kg eli 1,6 €/400 g pakkaus
8 €/kg eli 3,2 € / 400 g pakkaus
Valintani □ □ □ En valitsisi mitään edellisistä □
Example: sub-sample B Tuote Sian jauheliha Naudan jauheliha Sika-nauta
jauheliha Hiilijalanjälki Pieni Suuri Keskimääräinen Rasvapitoisuus (%) Enintään 5 % Ei määritetty Enintään 20 %
TuotantoDapa Tavanomainen Terveys ja turvallisuus
Luomu
Hinta 12 €/kg eli 4,8 € /400 g pakkaus
4 €/kg eli 1,6 € / 400 g pakkaus
8 €/kg eli 3,2 € / 400 g pakkaus
Valintani □ □ □ En valitsisi mitään edellisistä □
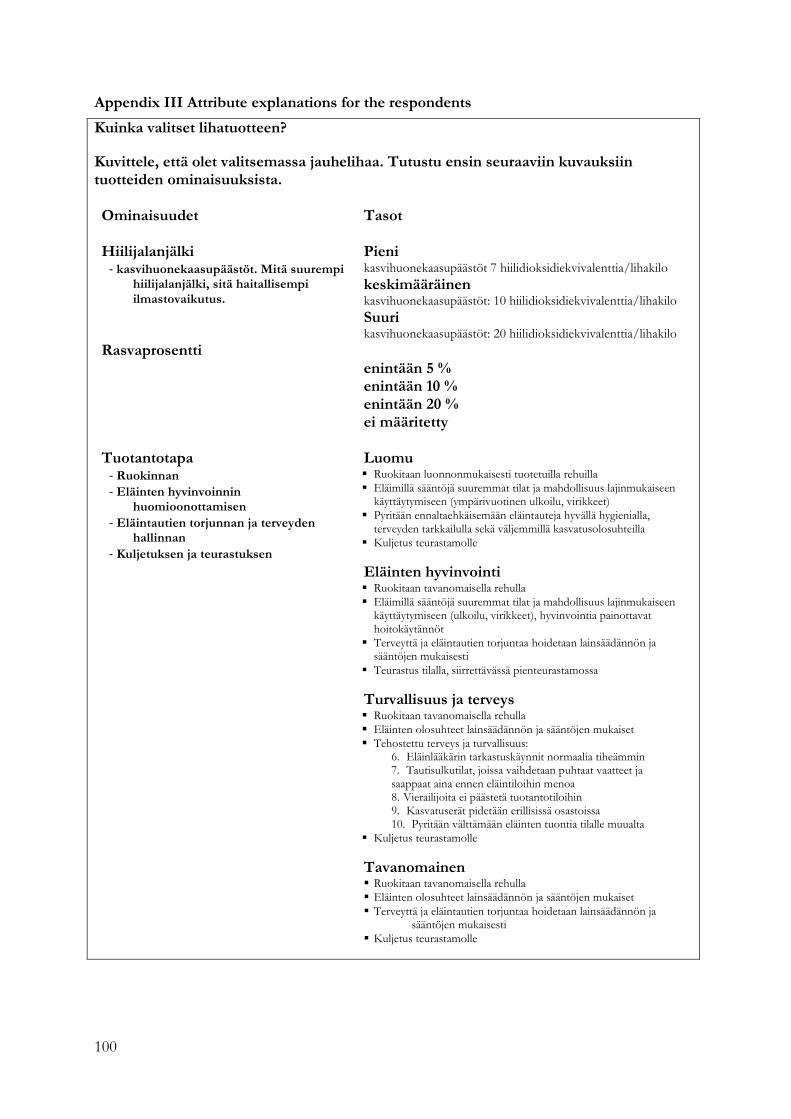
100
Appendix III Attribute explanations for the respondents
Kuinka valitset lihatuotteen?
Kuvittele, että olet valitsemassa jauhelihaa. Tutustu ensin seuraaviin kuvauksiin tuotteiden ominaisuuksista. Ominaisuudet Tasot
Pieni kasvihuonekaasupäästöt 7 hiilidioksidiekvivalenttia/lihakilo
keskimääräinen kasvihuonekaasupäästöt: 10 hiilidioksidiekvivalenttia/lihakilo
Hiilijalanjälki - kasvihuonekaasupäästöt. Mitä suurempi
hiilijalanjälki, sitä haitallisempi ilmastovaikutus.
Suuri kasvihuonekaasupäästöt: 20 hiilidioksidiekvivalenttia/lihakilo
enintään 5 % enintään 10 % enintään 20 %
Rasvaprosentti
ei määritetty Luomu � Ruokitaan luonnonmukaisesti tuotetuilla rehuilla � Eläimillä sääntöjä suuremmat tilat ja mahdollisuus lajinmukaiseen
käyttäytymiseen (ympärivuotinen ulkoilu, virikkeet) � Pyritään ennaltaehkäisemään eläintauteja hyvällä hygienialla,
terveyden tarkkailulla sekä väljemmillä kasvatusolosuhteilla � Kuljetus teurastamolle
Eläinten hyvinvointi � Ruokitaan tavanomaisella rehulla � Eläimillä sääntöjä suuremmat tilat ja mahdollisuus lajinmukaiseen
käyttäytymiseen (ulkoilu, virikkeet), hyvinvointia painottavat hoitokäytännöt
� Terveyttä ja eläintautien torjuntaa hoidetaan lainsäädännön ja sääntöjen mukaisesti
� Teurastus tilalla, siirrettävässä pienteurastamossa
Turvallisuus ja terveys � Ruokitaan tavanomaisella rehulla � Eläinten olosuhteet lainsäädännön ja sääntöjen mukaiset � Tehostettu terveys ja turvallisuus:
6. Eläinlääkärin tarkastuskäynnit normaalia tiheämmin 7. Tautisulkutilat, joissa vaihdetaan puhtaat vaatteet ja saappaat aina ennen eläintiloihin menoa 8. Vierailijoita ei päästetä tuotantotiloihin 9. Kasvatuserät pidetään erillisissä osastoissa 10. Pyritään välttämään eläinten tuontia tilalle muualta
� Kuljetus teurastamolle
Tuotantotapa - Ruokinnan - Eläinten hyvinvoinnin
huomioonottamisen - Eläintautien torjunnan ja terveyden
hallinnan - Kuljetuksen ja teurastuksen
Tavanomainen � Ruokitaan tavanomaisella rehulla � Eläinten olosuhteet lainsäädännön ja sääntöjen mukaiset � Terveyttä ja eläintautien torjuntaa hoidetaan lainsäädännön ja
sääntöjen mukaisesti � Kuljetus teurastamolle
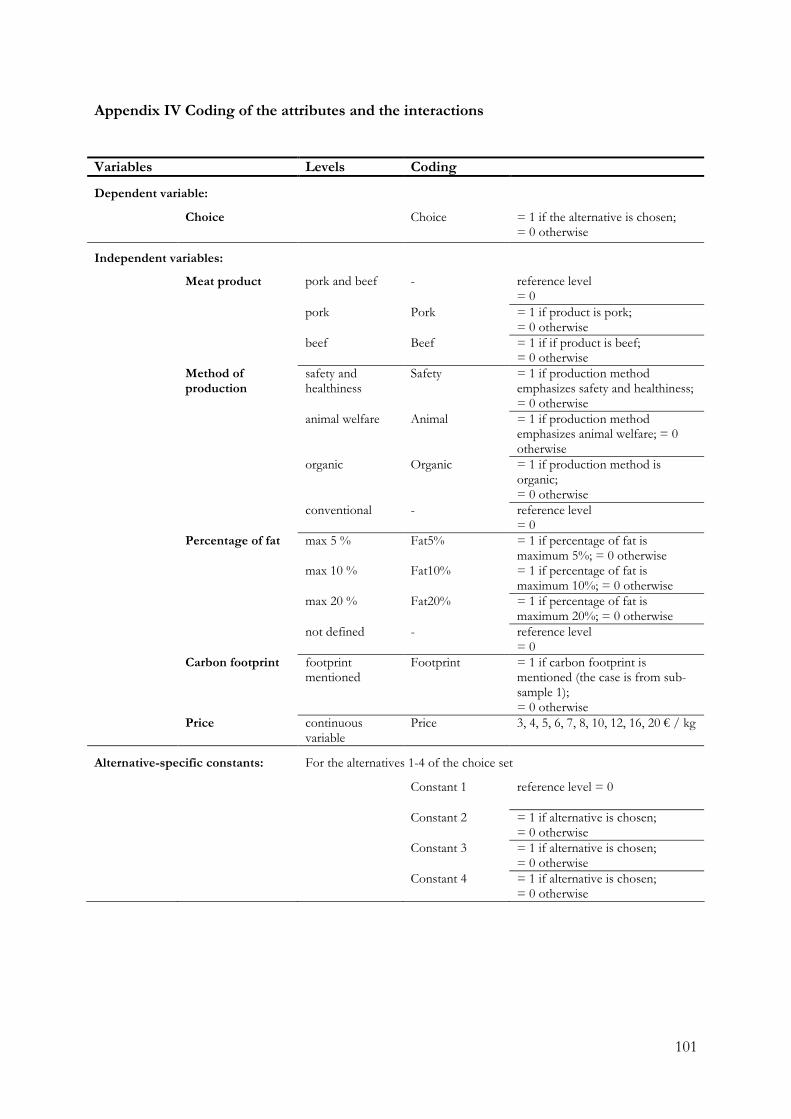
101
Appendix IV Coding of the attributes and the interactions
Variables Levels Coding
Dependent variable:
Choice Choice = 1 if the alternative is chosen; = 0 otherwise
Independent variables:
Meat product pork and beef - reference level
= 0
pork Pork = 1 if product is pork;
= 0 otherwise
beef Beef = 1 if if product is beef;
= 0 otherwise
Method of production
safety and healthiness
Safety = 1 if production method emphasizes safety and healthiness; = 0 otherwise
animal welfare Animal = 1 if production method
emphasizes animal welfare; = 0 otherwise
organic Organic = 1 if production method is
organic; = 0 otherwise
conventional - reference level
= 0
Percentage of fat max 5 % Fat5% = 1 if percentage of fat is
maximum 5%; = 0 otherwise
max 10 % Fat10% = 1 if percentage of fat is
maximum 10%; = 0 otherwise
max 20 % Fat20% = 1 if percentage of fat is
maximum 20%; = 0 otherwise
not defined - reference level
= 0
Carbon footprint
footprint mentioned
Footprint = 1 if carbon footprint is mentioned (the case is from sub-sample 1); = 0 otherwise
Price continuous
variable Price 3, 4, 5, 6, 7, 8, 10, 12, 16, 20 € / kg
Alternative-specific constants: For the alternatives 1-4 of the choice set
Constant 1 reference level = 0
Constant 2 = 1 if alternative is chosen;
= 0 otherwise
Constant 3 = 1 if alternative is chosen;
= 0 otherwise
Constant 4 = 1 if alternative is chosen;
= 0 otherwise
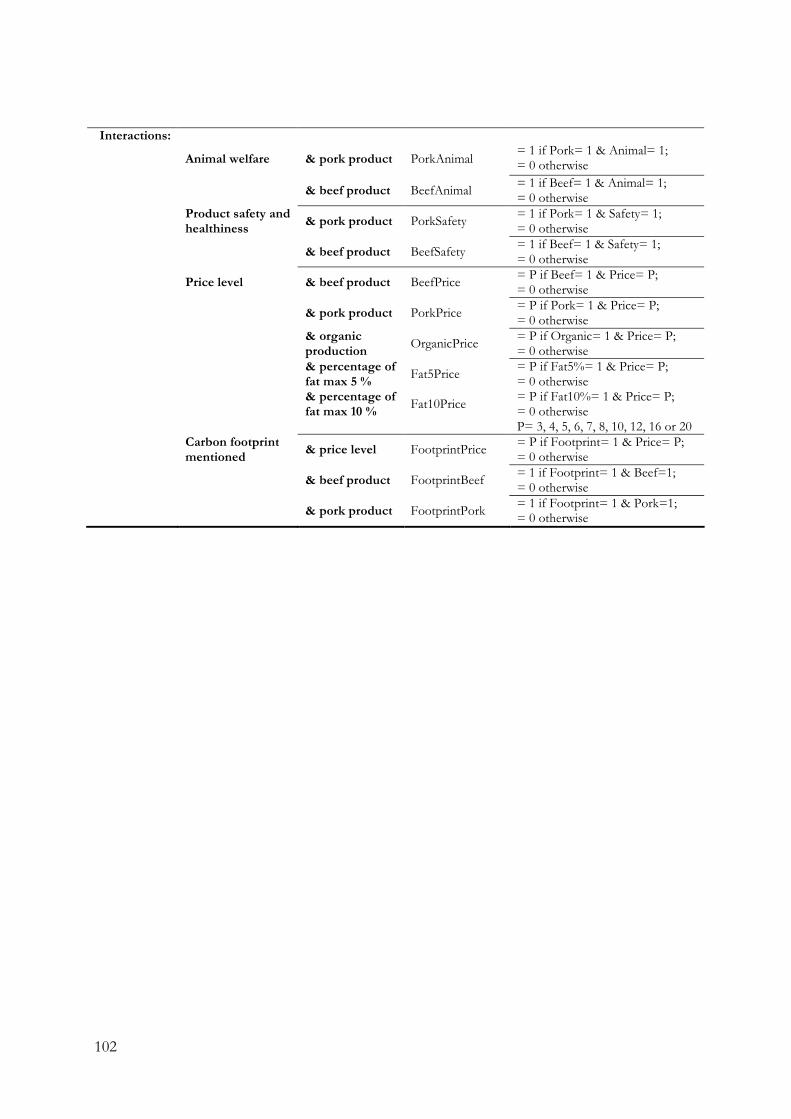
102
Interactions:
Animal welfare & pork product PorkAnimal = 1 if Pork= 1 & Animal= 1; = 0 otherwise
& beef product BeefAnimal = 1 if Beef= 1 & Animal= 1; = 0 otherwise
Product safety and healthiness
& pork product PorkSafety = 1 if Pork= 1 & Safety= 1; = 0 otherwise
& beef product BeefSafety = 1 if Beef= 1 & Safety= 1; = 0 otherwise
Price level & beef product BeefPrice = P if Beef= 1 & Price= P; = 0 otherwise
& pork product PorkPrice = P if Pork= 1 & Price= P; = 0 otherwise
& organic production
OrganicPrice = P if Organic= 1 & Price= P; = 0 otherwise
& percentage of fat max 5 %
Fat5Price = P if Fat5%= 1 & Price= P; = 0 otherwise
& percentage of fat max 10 %
Fat10Price = P if Fat10%= 1 & Price= P; = 0 otherwise
P= 3, 4, 5, 6, 7, 8, 10, 12, 16 or 20
Carbon footprint mentioned
& price level FootprintPrice = P if Footprint= 1 & Price= P; = 0 otherwise
& beef product FootprintBeef = 1 if Footprint= 1 & Beef=1; = 0 otherwise
& pork product FootprintPork = 1 if Footprint= 1 & Pork=1; = 0 otherwise
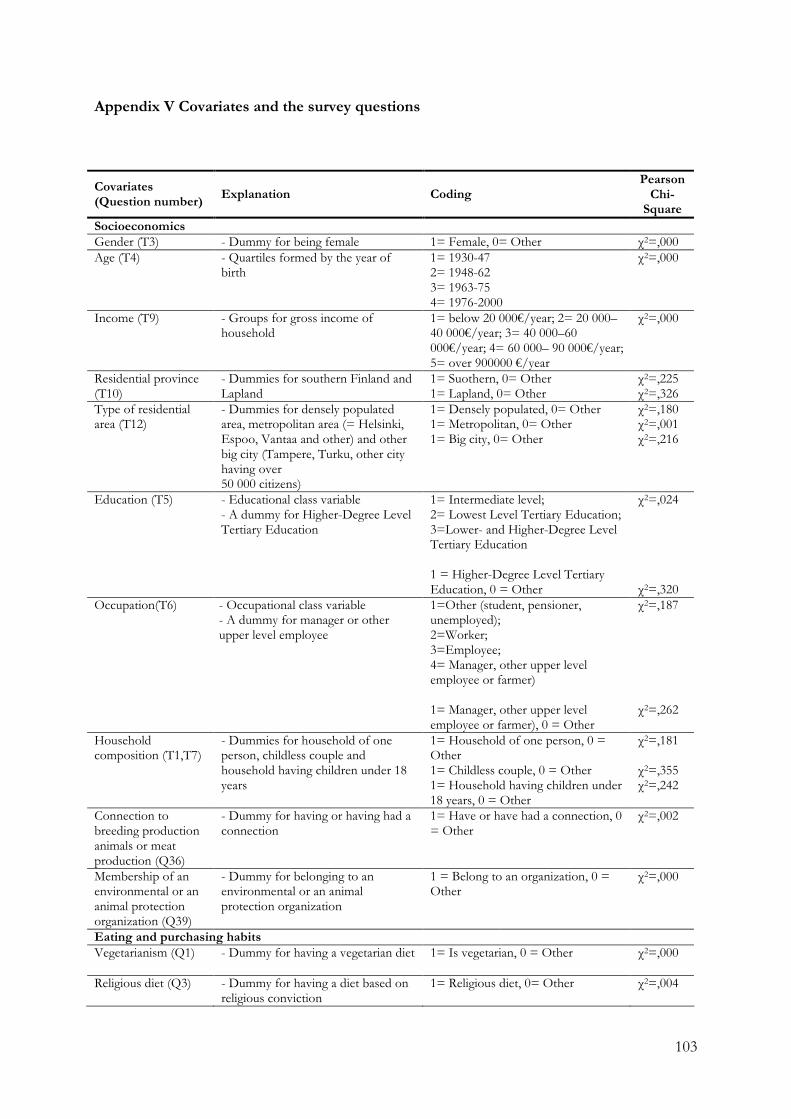
103
Appendix V Covariates and the survey questions
Covariates (Question number)
Explanation Coding Pearson Chi-Square
Socioeconomics Gender (T3) - Dummy for being female 1= Female, 0= Other χ2=,000 Age (T4) - Quartiles formed by the year of
birth 1= 1930-47 2= 1948-62 3= 1963-75 4= 1976-2000
χ2=,000
Income (T9)
- Groups for gross income of household
1= below 20 000€/year; 2= 20 000–40 000€/year; 3= 40 000–60 000€/year; 4= 60 000– 90 000€/year; 5= over 900000 €/year
χ2=,000
Residential province (T10)
- Dummies for southern Finland and Lapland
1= Suothern, 0= Other 1= Lapland, 0= Other
χ2=,225 χ2=,326
Type of residential area (T12)
- Dummies for densely populated area, metropolitan area (= Helsinki, Espoo, Vantaa and other) and other big city (Tampere, Turku, other city having over 50 000 citizens)
1= Densely populated, 0= Other 1= Metropolitan, 0= Other 1= Big city, 0= Other
χ2=,180 χ2=,001 χ2=,216
Education (T5) - Educational class variable - A dummy for Higher-Degree Level Tertiary Education
1= Intermediate level; 2= Lowest Level Tertiary Education; 3=Lower- and Higher-Degree Level Tertiary Education 1 = Higher-Degree Level Tertiary Education, 0 = Other
χ2=,024 χ2=,320
Occupation(T6) - Occupational class variable - A dummy for manager or other upper level employee
1=Other (student, pensioner, unemployed); 2=Worker; 3=Employee; 4= Manager, other upper level employee or farmer) 1= Manager, other upper level employee or farmer), 0 = Other
χ2=,187 χ2=,262
Household composition (T1,T7)
- Dummies for household of one person, childless couple and household having children under 18 years
1= Household of one person, 0 = Other 1= Childless couple, 0 = Other 1= Household having children under 18 years, 0 = Other
χ2=,181 χ2=,355 χ2=,242
Connection to breeding production animals or meat production (Q36)
- Dummy for having or having had a connection
1= Have or have had a connection, 0 = Other
χ2=,002
Membership of an environmental or an animal protection organization (Q39)
- Dummy for belonging to an environmental or an animal protection organization
1 = Belong to an organization, 0 = Other
χ2=,000
Eating and purchasing habits Vegetarianism (Q1) - Dummy for having a vegetarian diet 1= Is vegetarian, 0 = Other χ2=,000
Religious diet (Q3) - Dummy for having a diet based on
religious conviction 1= Religious diet, 0= Other χ2=,004
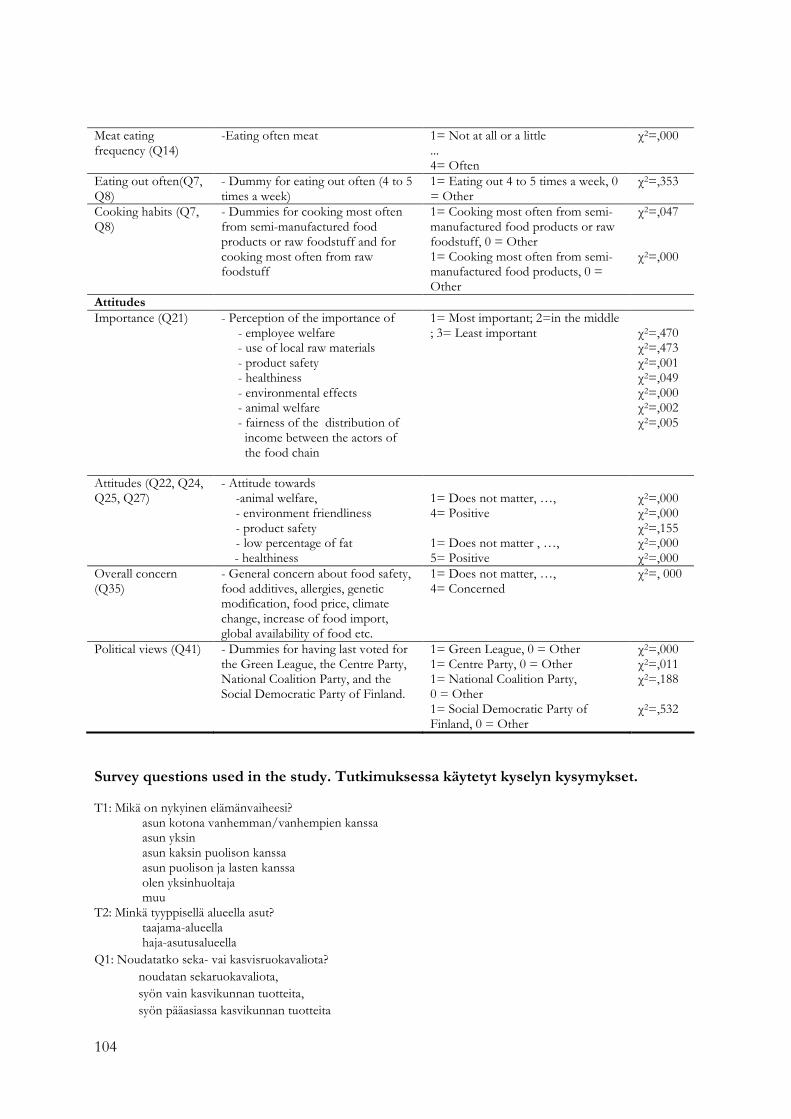
104
Survey questions used in the study. Tutkimuksessa käytetyt kyselyn kysymykset. T1: Mikä on nykyinen elämänvaiheesi?
asun kotona vanhemman/vanhempien kanssa asun yksin asun kaksin puolison kanssa asun puolison ja lasten kanssa olen yksinhuoltaja muu
T2: Minkä tyyppisellä alueella asut? taajama-alueella haja-asutusalueella
Q1: Noudatatko seka- vai kasvisruokavaliota? noudatan sekaruokavaliota, syön vain kasvikunnan tuotteita, syön pääasiassa kasvikunnan tuotteita
Meat eating frequency (Q14)
-Eating often meat
1= Not at all or a little ... 4= Often
χ2=,000
Eating out often(Q7, Q8)
- Dummy for eating out often (4 to 5 times a week)
1= Eating out 4 to 5 times a week, 0 = Other
χ2=,353
Cooking habits (Q7, Q8)
- Dummies for cooking most often from semi-manufactured food products or raw foodstuff and for cooking most often from raw foodstuff
1= Cooking most often from semi-manufactured food products or raw foodstuff, 0 = Other 1= Cooking most often from semi-manufactured food products, 0 = Other
χ2=,047 χ2=,000
Attitudes Importance (Q21) - Perception of the importance of
- employee welfare - use of local raw materials - product safety - healthiness - environmental effects - animal welfare - fairness of the distribution of income between the actors of the food chain
1= Most important; 2=in the middle ; 3= Least important
χ2=,470 χ2=,473 χ2=,001 χ2=,049 χ2=,000 χ2=,002 χ2=,005
Attitudes (Q22, Q24, Q25, Q27)
- Attitude towards -animal welfare, - environment friendliness - product safety - low percentage of fat
- healthiness
1= Does not matter, …, 4= Positive 1= Does not matter , …, 5= Positive
χ2=,000 χ2=,000 χ2=,155 χ2=,000 χ2=,000
Overall concern (Q35)
- General concern about food safety, food additives, allergies, genetic modification, food price, climate change, increase of food import, global availability of food etc.
1= Does not matter, …, 4= Concerned
χ2=, 000
Political views (Q41) - Dummies for having last voted for the Green League, the Centre Party, National Coalition Party, and the Social Democratic Party of Finland.
1= Green League, 0 = Other 1= Centre Party, 0 = Other 1= National Coalition Party, 0 = Other 1= Social Democratic Party of Finland, 0 = Other
χ2=,000 χ2=,011 χ2=,188 χ2=,532

105
Q3: Millaista ruokavaliota muuten noudatat? Voit valita useamman kuin yhden vaihtoehdon en noudata mitään erityistä ruokavaliota vähälaktoosinen tai laktoositon vähärasvainen vähähiilihydraattinen vähäsuolainen tai suolaton gluteeniton allergian vuoksi en syö tiettyjä ruoka-aineita (esim. pähkinä, kala) uskonnon vuoksi en syö tiettyjä ruoka-aineita muu
Q7: Mikä seuraavista kuvaa parhaiten taloutesi tapaa valmistaa aterioita arkena? tehdään pääosin itse (raaka-aineista asti tai lämmitetään aikaisemmin itse tehtyjä) käytetään usein puolivalmisteita (esimerkiksi marinoidut lihasuikaleet tai kasvispakasteet) ostetaan valmisruokia (esimerkiksi mikroateriat tai einekset) syödään pääasiassa kodin ulkopuolella (ja kotona syödään lähinnä välipaloja)
Q8: Mikä seuraavista kuvaa parhaiten taloutesi tapaa valmistaa aterioita viikonloppuna? tehdään pääosin itse (raaka-aineista asti tai lämmitetään aikaisemmin itse tehtyjä) käytetään usein puolivalmisteita (esimerkiksi marinoidut lihasuikaleet tai kasvispakasteet) ostetaan valmisruokia (esimerkiksi mikroateriat tai einekset) syödään pääasiassa kodin ulkopuolella (ja kotona syödään lähinnä välipaloja)
Q14: Kuinka usein syöt seuraavia ruokia pääruokana kotona tai kodin ulkopuolella? Naudanliharuoka
3 kertaa viikossa tai useammin 1-2 kertaa viikossa 1-3 kertaa kuukaudessa harvemmin kuin kerran kuukaudessa en koskaan
Sianliharuoka 3 kertaa viikossa tai useammin 1-2 kertaa viikossa 1-3 kertaa kuukaudessa harvemmin kuin kerran kuukaudessa en koskaan
Broileriruoka 3 kertaa viikossa tai useammin 1-2 kertaa viikossa 1-3 kertaa kuukaudessa harvemmin kuin kerran kuukaudessa en koskaan
Riistaruoka 3 kertaa viikossa tai useammin 1-2 kertaa viikossa 1-3 kertaa kuukaudessa harvemmin kuin kerran kuukaudessa en koskaan
Lampaanliharuoka 3 kertaa viikossa tai useammin 1-2 kertaa viikossa 1-3 kertaa kuukaudessa harvemmin kuin kerran kuukaudessa en koskaan
Q21: Ajattele koko ruokaketjua maataloudesta aina kauppaan asti. Arvioi, kuinka tärkeinä pidät, että seuraaviin asioihin panostetaan ruokaketjun toiminnassa.
Työntekijöiden työhyvinvointi Paikallisten raaka-aineiden käyttö Tuoteturvallisuus Ruoan terveellisyys Tuotannon ympäristövaikutukset Eläinten hyvinvointi Tulonjaon oikeudenmukaisuus
106
Q22: Seuraavaksi pyydämme sinua ottamaan kantaa alla esitettyihin väittämiin eläinten hyvinvoinnista. Vastaa jokaisen väittämän kohdalla, oletko samaa vai eri mieltä. (1=Täysin samaa mieltä; 2=Jokseenkin samaa mieltä; 3=Ei samaa eikä eri mieltä; 4=Jokseenkin eri mieltä; 5=Täysin eri mieltä)
- En ajattele eläinten hyvinvointia valitessani ruokaa kaupassa - Eläinten hyvinvoinnista huolehtiminen parantaa lihan laatua - Tuotantoeläimillä täytyy olla oikeus lajinmukaiseen käyttäytymiseen - Eläinsuojelusäädöksiä on tiukennettava nykyisestä - Ihmisillä ei ole oikeutta tappaa eläimiä ruoaksi - Jos ajattelen, että syömäni liha on ollut elävä eläin, nautin lihasta vähemmän - Suomessa tuotantoeläimiä kohdellaan huonosti - Haluan, että voin lihaa ostaessani varmistua tuotemerkinnän avulla, että eläimiä on kohdeltu hyvin - Olen valmis maksamaan lihan hinnassa eläinten hyvinvoinnin lisäämisestä
Q24: Seuraavassa on väittämiä tuotteiden turvallisuudesta. Vastaa jokaisen väittämän kohdalla, oletko samaa vai eri mieltä.
- Kaupan tuoretiskiltä ostettu pakkaamaton liha on turvallista - Suomalaisilla tiloilla käytetty rehu ei sisällä taudinaiheuttajia - Suomalaisilla tiloilla ollaan eläintautien välttämiseksi tarkempia kuin muualla Euroopassa - Tuotteiden turvallisuus on kaupalle tärkeämpää kuin taloudellinen tulos - Teollisuuden etujen mukaista on varmistaa, että kuluttajille päätyy vain turvallisia tuotteita - Ravintolassa syödessäni luotan, että tarjoiltu liha on turvallista - En välitä kohonneesta tautiriskistä, jos saan lihatuotteen edullisemmin
Q25: Seuraavassa on väittämiä ravitsemukseen, ruoan terveellisyyteen ja makuun liittyen. Vastaa jokaisen väittämän kohdalla, oletko samaa vai eri mieltä.
- Minulle on tärkeää, että päivittäin syömäni ruoka on vähärasvaista - Ruoan terveellisyys ei kovin paljon vaikuta siihen, mitä ruokaa valmistan
Q27: Seuraavassa on ympäristövaikutuksiin liittyviä väittämiä. Vastaa jokaisen väittämän kohdalla, oletko samaa vai eri mieltä.
- Ostan luomuruokaa aina kun mahdollista. - Vältän ruoka-aineita, joiden tuotanto aiheuttaa paljon kasvihuonekaasupäästöjä. - Pyrin ostamaan ruokaa mahdollisimman kevyesti pakattuna. - Vältän kasvihuoneessa kasvatettuja kasviksia. - En kierrätä enkä lajittele ruoka- ja pakkausjätteitä - Vältän tonnikalaa ja muita harvinaistuvia eläinlajeja ruokavalinnoissani. - Heitän usein ruokaa pois - Elintarvikkeille, joiden ympäristövaikutukset ovat suuret, pitäisi asettaa lisävero - Pyrin syömään vähemmän lihaa ilmastomuutoksen hidastamiseksi
Q35: Pidätkö seuraavia ruokaan tai ruoantuotantoon liittyviä asioita yhteiskunnan kannalta ongelmina? Jos koet ne ongelmiksi, kuinka huolestuttavia ne mielestäsi ovat?
Ruokamyrkytykset (esim. salmonella) Geeniteknologian käyttö ruoantuotannossa Eläinten hyvinvointi Torjunta-aineet Lisäaineet, kuten säilöntä- tai väriaineet Ruoka-aineallergiat Epäterveelliset ruokailutottumukset Ruoan hinta Luonnon monimuotoisuuden väheneminen maatalouden vuoksi Ravintokasvien käyttö bioenergiaksi Ilmastonmuutoksen vaikutus ruoantuotannon edellytyksiin eri puolilla maailmaa Ruoantuotannon vaikutukset ilmastonmuutokseen Ruoan riittävyys maailmanlaajuisesti Elintarviketuonnin lisääntyminen Ruoan saatavuus kriisi- ja poikkeustilanteessa
Q36: Onko sinulla itselläsi tällä hetkellä tai aikaisemmin ollut yhteyksiä tuotantoeläinten kasvatukseen tai lihantuotantoon?
ei kyllä, asun/olen asunut maatilalla, jolla kasvatetaan tuotantoeläimiä maidon- tai lihantuotantoon kyllä, työskentelen/olen työskennellyt teurastamossa tai lihaa jalostavassa elintarviketeollisuudessa kyllä, muu yhteys
Q39: Toimitko jossakin eläinsuojelu- tai ympäristöjärjestössä? kyllä, toimin aktiivisesti kyllä, olen jäsen

107
en
Q41: Mitä puoluetta äänestit viime eduskuntavaaleissa vuonna 2007? Taustatiedot T3: Sukupuoli
Mies Nainen
T4: Ikä 18-24 v 25-34 v 35-44 v 45-54 v 55-64 v 65-79 v
T5: Koulutus Perus-/kansakoulu Ammatti/tekninen/kauppakoulu Ylioppilas/lukio Opisto Ammattikorkeakoulu Yliopisto/korkeakoulu
T6: Ammatti/asema Yksityisyrittäjä Johtava asema Muu ylempi toimihenk./asiantuntija Toimihenkilö Työntekijä Maanviljelijä Opiskelija/koululainen Eläkeläinen Kotiäiti/-isä Työtön
T7: Talouden rakenne Yksinäistalous Lapseton pari Muu aikuistalous On alle 18-vuotiaita lapsia
T8: Talouden koko T9: Talouden bruttotulot
Alle 10 000 euroa 10 000 - 20 000 euroa 20 001 - 30 000 euroa 30 001 - 40 000 euroa 40 001 - 50 000 euroa 50 001 - 60 000 euroa 60 001 - 70 000 euroa 70 001 - 80 000 euroa 80 001 - 90 000 euroa Yli 90 000 euroa Ei vastausta
T10: Asuinlääni T12: Asuinpaikkakunta
Helsinki Espoo/Kauniainen/Vantaa Muu pääkaupunkiseutu Turku Tampere Muu yli 50 000 asukkaan kaupunki Muu kaupunki Muu kunta
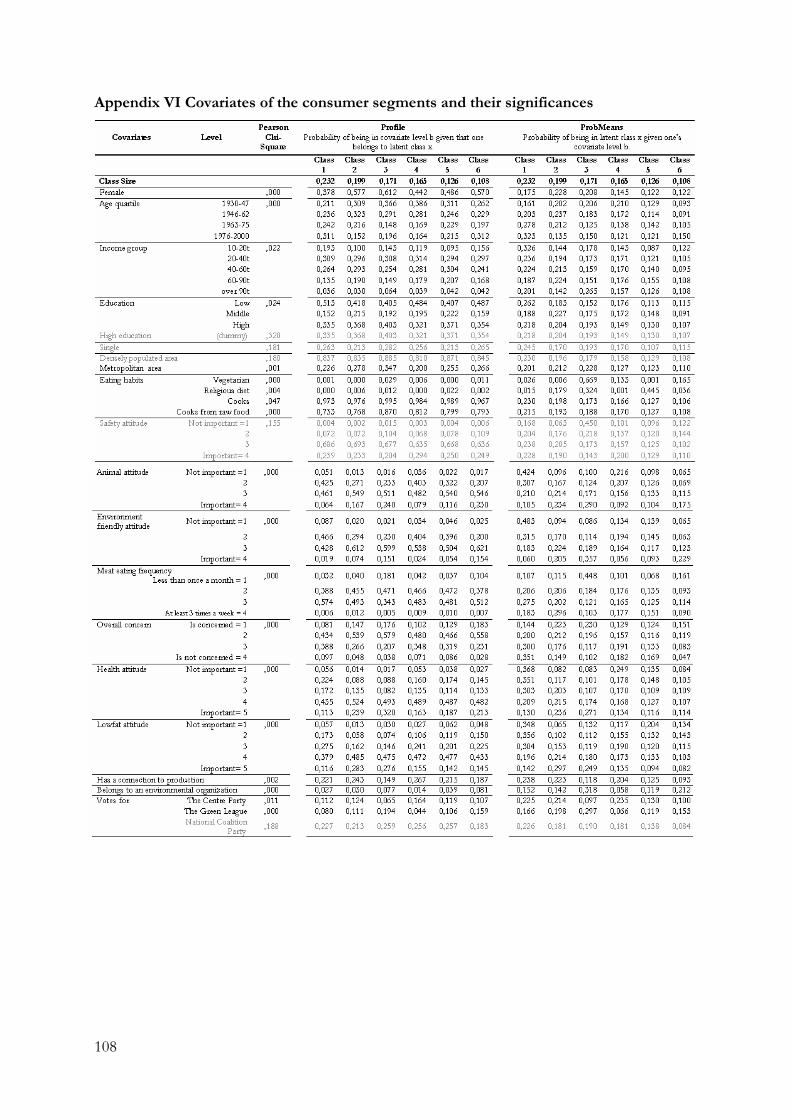
108
Appendix VI Covariates of the consumer segments and their significances

109