
Valuing Food Attributes: Experimental Auctions and Sensory Analysis

Journal of Agricultural and Resource Economics 43(2):251–273 ISSN 1068-5502Copyright 2018 Western Agricultural Economics Association
Consumer Valuation of Health Attributes in Food
Sinne Smed and Lars Gårn Hansen
We estimate a model that allows consumers’ food demand to depend on both the health effectsand the consumption experience generated by the consumption of nutrients contained in food.We use home scan data of food purchases from approximately 2,500 Danish consumers enrichedwith nutrient content information. More-educated consumers have healthier diets than those withless education, and we find that this is explained by differences in how these groups value theconsumption experience associated with nutrients, not by differences in their health valuation ofnutrients.
Key words: food consumption, hedonic model, taste
Introduction
Unhealthy diets can lead to a variety of health problems—including cancer, cardiovascular disease,diabetes, osteoporosis, and obesity (World Health Organization, 2015)—many of which have seendramatic growth worldwide (OECD, 2011). There seems to be a tradeoff between the immediateconsumption experience associated with consuming fatty, salty, and sweet foods and the associatedlong-term health consequences of consuming those foods. One pressing question is how this tradeoffaffects consumers’ valuations of and demand for different food products. A social bias has beenobserved in the Western world: diet-related health problems are more prevalent among less-educatedand low-income population groups (Marmot, 2005; Brønnum-Hansen and Baadsgaard, 2008, 2012;Hoffmann, 2011; Majer et al., 2011; Mackenbach, 2012; Marmot et al., 2012). They also have lesshealthy diets with larger intake of unhealthy nutrients such as saturated fat and sugar (Darmon andDrewnowski, 2008; Beenackers et al., 2012; Hiscock et al., 2012; Pechey et al., 2013; Demarestet al., 2014; Gallo et al., 2012; Groth et al., 2014). One possible explanation for the disparity isthat more-educated consumers may be better informed than less-educated consumers and thereforemore aware of the health implications of their diets (e.g., Grunert and Wills, 2007; Grunert et al.,2010; Pampel, Krueger, and Denney, 2010; Johnston et al., 2015). If this is the case, informationcampaigns focusing on increasing health awareness and education among less-educated consumersmay be effective.
However, food taste preferences are developed in early childhood and are an importantdetermining factor of what individuals consume (Drewnowski, 1997; Birch, 1999; Wright,Nancarrow, and Kwok, 2001). Therefore, another possible explanation for the observed social biasin diets may be differences in how groups value the immediate consumption experience associatedwith, for example, saturated fat or sugar in different types of foods. If consumers care about healtheffects but still choose an unhealthy diet because they have strong preferences for the consumptionexperience of unhealthy nutrients, then information campaigns that focus on health awareness may
Lars Gårn Hansen is a professor and Sinne Smed is an associate professor in the Department of Food and Resource Economicsat the University of Copenhagen.We are very grateful to two referees and the editor for comments. We also thank GfK Consumerscan for the use of their data.This research was supported by the Danish Council for Independent Research and the OPUS project, which is supported bya grant from the Nordea Foundation.
Review coordinated by Tian Xia.

252 May 2018 Journal of Agricultural and Resource Economics
not be effective. Instead, policies focusing on changing the habits and social norms that form thesepreferences may be more effective.
In this study, we differentiate consumers based on education, but it is important to stress that thegroups we compare also differ in other important dimensions, such as income. We do not attemptto determine which social background characteristics drive observed differences in dietary health.Instead, we focus on whether consumers’ valuation of health effects or valuation of the consumptionexperience can explain the difference. We utilize a unique panel dataset with observations fromapproximately 2,500 Danish consumers provided by GfK Panel Services Scandinavia. Table 1compares the consumption of different nutrients for consumers with no education or vocationaleducation (hereafter abbreviated to less-educated), consumers with a short, nonvocational education(hereafter abbreviated to medium-educated) as well as consumers with a medium or long tertiaryeducation (hereafter abbreviated to more-educated). On average, all groups eat more sugar andsaturated fat and less fiber than recommended by the Danish official dietary recommendations,but deviations from the recommended diet are largest among less-educated consumers and smallestamong more-educated consumers, as observed in most other studies (e.g., Darmon and Drewnowski,2008; Groth et al., 2013, 2014; Pechey et al., 2013).
Our panel data are unusual in that they cover all components of a household’s diet, including allnutrients and seven aggregate food groups (i.e., meat; dairy; flour, bread, and cereals; fish; fruit andvegetables; fats; and biscuits, cakes, spreads, and ice cream) over a long period.1 The granularityof these data allows us to disentangle consumers’ valuation of health from consuming a givennutrient from their valuation of the consumption experience associated with the presence of the samenutrient in different types of foods. More specifically, we model health and consumption experiencevaluations of unsaturated and saturated fat, sugar, carbohydrates, fiber, and protein contained inthe seven food groups. The key identifying assumptions we make are that the consumer’s healthvaluation of a given nutrient depends on his or her total consumption of that nutrient, while thevaluation of the consumption experience associated with consuming the same nutrient is food-specific.
Our methodological starting point is the hedonic price model, which originates from thecharacteristic model in which consumers derive utility or satisfaction from the characteristics thatgoods contain rather than from the good itself (Lancaster, 1966; Rosen, 1974; Lucas, 1975; Laddand Martin, 1976; Ladd and Suvannunt, 1976). A key implication of this model is that the price paidby a consumer for a good must equal the sum of his marginal valuations of all the characteristicscontained in the product. Based on this, hedonic pricing models are used to decompose revealedconsumer preferences for specific foods into implied valuations of the characteristics contained inthose foods. The literature covers the valuation of search goods (e.g., convenience: Ahmad andAnders, 2012; Vickner, 2015) and credence goods (e.g., organic: Huang and Lin, 2007; Schulz,Schroeder, and White, 2012; Schröck, 2014), as well as the valuation of other attributes such asnutrients (Stanley and Tschirhart, 1991; Shongwe et al., 2007; Thunström, 2007; Drescher et al.,2008; Drescher, Thiele, and Weiss, 2008; Thunström and Rausser, 2008; Ward, Lusk, and Dutton,2008; Richards, Mancino, and Nganje, 2012; Carlucci et al., 2013). However, most of these studiesonly consider a few related food items simultaneously, while the estimated valuations of nutrients,such as saturated fat, contained in different foods differ substantially. This is not surprising, sincenutrients, in addition to having health implications in many cases, also have important effects ontaste and texture that are relevant to the immediate experience of consuming the food. If the effectof a given nutrient on this experience varies among goods, so will its total marginal utility value.However, to the best of our knowledge, no studies have attempted to decompose consumer valuationsof different nutrients into a marginal valuation that originates from its health effects and a marginalvaluation that originates from associated consumption experiences.
1 For a description of the composition the aggregated food groups, see Appendix A.

Smed and Hansen Valuation of Health Attributes 253
We find that more-educated consumers value the health effects of nutrients the same as or lowerthan less-educated consumers, which implies that their healthier diets are explained by differencesin valuations of the consumption experience. While stronger health preferences may partly explainwhy medium-educated consumers have healthier diets than less-educated consumers, we find thatdifferences in valuations of the consumption experience are again important. These results mayhave important implications for the design and role of information campaigns and labeling schemesthat are a key nutrition policy instrument in many countries. If the consumption experience is thedetermining factor for diet composition, information campaigns and labeling should focus on theconsumption experience or taste instead of the health effects of consuming a given food or nutrient.
Characteristics Model of Food Demand
We model the consumption of a vector of different foods, qqq = (q1, . . .qi, . . .qJ). We assumethat consumers derive utility from the immediate experience of consuming these foods,u(q1, . . . , qi, . . .qJ), from different long-term health effects of consuming the same vector offoods, v(q1, . . . , qi, . . .qJ), and from the utility of consuming other goods, Z. We assume additiveseparability between the consumption experience, each of the health effects, and consumption ofother goods to facilitate estimation of the model:
(1) U = u(q1, . . .q j, . . .qJ) +I
∑i=1
vi(q1, . . .q j, . . .qJ) + Z.
In the classical characteristics model, utility is derived directly from the consumption ofcharacteristics such as the nutrients contained in foods, implying that a given nutrient in one foodis a perfect substitute for the same nutrient in another food. This assumption seems reasonablewhen considering the health implications of nutrient consumption, since the health implications ofconsuming, for example, unsaturated fats in milk and in spareribs are equivalent. However, sincewe model consumer choice covering the entire food basket, this assumption may be problematicwhen considering the immediate experience associated with consuming nutrients in differentfoods. It seems obvious that the corresponding implications for the consumption experience canvary substantially between different foods (e.g., the taste of saturated fat may vary considerablybetween milk and spareribs, and the effect that fiber or carbohydrates have on texture mayvary substantially between bread and vegetables). Therefore, we explicitly model the health andconsumption experience effects of nutrient consumption on the consumer’s utility, which allows usto apply a more reasonable assumption than perfect substitution.2
We consider a household consuming a vector of JJJ (running index j) different foods. Followingthe traditional characteristics model approach (e.g., used by Ladd and Zober, 1977; Lenz,Mittelhammer, and Shi, 1994; Shi and Price, 1998; Ranney and McNamara, 2002), we assumethat each food consists of a number of nutritional characteristics and a number of non-nutritionalcharacteristics. The amount of nutrient i contained in 1 unit of food j is given by a technologymatrix, AAA:
2 Note that the perfect substitutability assumption may be reasonable when modeling consumption experience implicationsof nutrients in similar goods (such as different milk variants or different breakfast cereals), which is the approach applied inthe majority of studies in the literature.

254 May 2018 Journal of Agricultural and Resource Economics
(2)
nutrient characteristics︷ ︸︸ ︷1 . . . i . . . I
A≡ goods
1...
j...
J
a11 . . . a1i . . . a1I...
. . .... . .
. ...
a j1 . . . a ji . . . a jI... . .
. .... . .
...
aJ1 . . . aJi . . . aJI
In the same way, the amount of non-nutrient characteristic m contained in 1 unit of food j is
given by a similar technology matrix, BBB. It follows that the total amounts of each of the I nutritionalcharacteristics (given by vector hhh = (h1, . . .hi, . . .hI)) consumed by the household is:
(3) hhh = AAA′qqq,
where qqq = (q1, . . .q j, . . .qJ) is the vector of quantities of consumed foods. The total amountof each of the M non-nutritional characteristics consumed in food j (given by vectorggg j = (g j1, . . .g jm, . . .g jM)) is:
(4) ggg j = q jbbb j,
where bbb j is the relevant vector of per unit nutrient characteristics from the technology matrix BBB.When a household purchases a vector of foods, it is assumed to derive utility from the experience ofconsuming the vector of foods. This utility is assumed to be produced in a two-step process: First,in the lower nest, characteristics contained in each food j are combined to produce the consumptionexperience subutility for this food:
(5) x j = k j(hhh j,ggg j),
where hhh j = aaa jq j is the vector of quantities of nutrients consumed in good j (aaa j is the relevant vectorof per unit nutrient characteristics from the technology matrix AAA, that is, the content of saturated fat,sugar, etc. in good j). In the same way, ggg j, defined in equation (4), is the vector of non-nutritionalcharacteristics consumed in good j. We assume homogeneity of the production of the consumptionexperience so that x j = q jk j(aaa j,bbb j), which allows us to interpret k j(aaa j,bbb j) as a quality measure forgood j.3 Essentially, the quality of the consumption experience of a unit of good j depends on itscontent of characteristics. For example, a pound of beef may have a higher “taste” quality when itcontains 20% fat than when it contains 10% or 30% fat. This valuation is not affected by the amountof beef consumed, which seems a natural and intuitive interpretation.
In the second step, utility is produced by combining the good-specific subutilities of theconsumption experience derived from each good:
(6) u(x1, . . . ,xJ).
This is a traditional model of consumption, in which (as we have formulated it) the quality of eachgood is a function of its characteristics. When a household purchases a vector of foods, it is, inaddition to the utility derived from the consumption experience, assumed to derive health utilitydepending on the total amount of each nutritional characteristic, hi, contained in the diet:
(7) vi(hi).
3 Note that this model is synonymous with a characteristics model of production of consumption experience fromaggregate goods when homogeneity of subutility production is assumed (e.g., Lenz, Mittelhammer, and Shi, 1994). Thedifference between Lenz et al. and others and our study is that we allow nutritional characteristics to influence theconsumption experience.

Smed and Hansen Valuation of Health Attributes 255
We assume that consumers’ total utility is the sum of utility derived from the consumptionexperience, the different health characteristics, and the expenditure on a numeraire good thatrepresents the consumption of nonfood goods. Expenditure on the numeraire is equal to incomeY minus expenditure on the J different foods, ∑
Jj=1 C j, so that the consumer’s utility (corresponding
to equation 1 above) becomes4
(8) U = u(x1, . . . ,xJ) +I
∑i=1
vi(hi) + Y −J
∑j=1
C j.
Thus, we assume additive separability of utility from health, from the consumption experience, andfrom consumption of the numeraire good. Furthermore, we assume that each of the J goods can bebought in different qualities on the market, depending on the per unit characteristics they contain.
Given the prices of different qualities on the market, p j(aaa j,bbb j), the consumer chooses both thequantity and quality of each good to maximize normalized utility:
(9) maxq,AAA,BBB
U = u(x1, . . . ,xJ) +I
∑i=1
vi(hi) + Y −J
∑j=1
p j(aaa jjj,bbb jjj)q j,
where x j = k j(hhh j,ggg j). For ease of exposition, we have limited the consumer’s choice to only onequality for each good. However, it is easy to demonstrate that this is always implied by the optimalsolution since different qualities of a given good are perfect substitutes.5
The resulting first-order condition for the optimal choice of quality and quantity of good jstemming from all the first-order conditions is
(10) p j(aaa j,bbb j) = u′j
(M
∑m=1
dk j(hhh j,ggg j)
dg jmb jm +
I
∑i=1
dk j(hhh j,ggg j)
dh jia ji
)+
I
∑i=1
v′i(h j)a ji.
Thus, the marginal utility value of the consumption experience derived from good j, in general,depends on the consumption of other goods in a complicated way (marginal values of theconsumption experience of foods depend on the consumption of other goods: u′j(x1, . . .xJ)).However, the separability implied by our model of the quality of the consumption experience impliesthat this quality function only depends on the characteristics contained in the specific good.6 Further,the marginal health utility value of nutrients is assumed to only depend on the aggregate consumptionof this nutrient due to the assumed separability structure. These two assumptions are what allowus identification in the empirical model. Multiplying equation (10) by the quantities of each foodconsumed, q j, gives us
(11) C j = u′j
(M
∑m=1
dk j(hhh j,ggg j)
dg jmg jm +
I
∑i=1
dk j(hhh j,ggg j)
dh jih ji
)+
I
∑i=1
v′i(h j)h ji,
where Ck is total expenditure on good j and h ji is the total amount of nutrient i in good j. This is thefirst-order condition that we estimate empirically. We assume that the quality of the consumption
4 We assume the price of the numeraire good is unity so that the quantity consumed (from which utility is derived) equalsexpenditure.
5 When different qualities of the same good are perfect substitutes, it is optimal to consume the quality that, at thegiven market price, gives the consumer the largest amount of quality-adjusted units per monetary unit: k j(aaa j,bbb j) +
∑Ii=1 v′i(hi)a ji)/p j(aaa j,bbb j). Note again that this is synonymous with the aggregate-good model, assuming homogeneity of
subutility production (e.g., Lenz, Mittelhammer, and Shi, 1994). To see this, let different qualities be defined as aggregategoods that differ regarding their composition of the same set of underlying goods. Under homogeneity, the optimal aggregategood composition is independent of the consumed quantity of the aggregate good.
6 One could imagine nonseparable relationships in which a particular quality of a certain food goes especially well with thespecific qualities of other foods (e.g., sweet wine with sweet desserts). We have ruled out these types of complex substitutionalrelationships.
256 May 2018 Journal of Agricultural and Resource Economics
experience is linear in non-nutritional characteristics:
(12)dk j(hhh j,ggg j)
dg jm= δ jm.
These are proportions of meat or vegetable types with a clear preference ranking (e.g., a greaterproportion of roast beef may imply greater quality). For the nutritional characteristics, we allow thequadratic form, which accounts for the fact that the quality of, for example, top-quality beef of acertain fat content will decrease both with lower and higher per unit contents so that
(13)dk j(hhh j,ggg j)
dh ji= α ji + β ji[h ji/q j],
where the marginal value depends on the per unit content (concentration) of the nutrient. Note thatthis satisfies the assumed homogeneity of the consumption experience. Finally, we allow the samequadratic form for the health utility of nutrients:
(14) v′i(hi) = γi + ϕi[hi].
We allow u′j to vary over time to account for the fact that the vector of consumed food goodschanges over time and because of the assumed separability quality- and health-utility parameters areconstant over time. Technically, we do this by including time- and good-specific marginal utilities,u′jt , for each representative household that we model so that the regression equations that we estimatebecome
(15) [C jt ] = [u′jt ]
(M
∑m=1
δ jm[g jmt ] +I
∑i=1
α ji[h jit ] +I
∑i=1
β ji[h2jit/q jt ]
)+
I
∑i=1
(γi[h jit ] + ϕi[hith jit ])
for each good j, where square brackets indicate the observed variables in our dataset with a t addedto indicate time-varying variables. C jt is observed total expenditure on good j at time t, u′jt isrepresented via time and food specific dummies, g jmt (the non-nutritional characteristics) is theobserved quantities of different subtypes of food m for good j (i.e., beef, pork etc.), g jmt capturesunobserved characteristics contained in this particular food,7 h jit is the total amount of nutrient iin specific good j, and hit is the total amount of nutrient i consumed at time t. Table 1 providesdescriptive statistics for the consumption of goods and nutrients. We see that the second-orderconsumption experience and the health effects of nutrients (β ji and ϕi, respectively) in equation (15)are identified through our assumptions about their dependence on the nutrients contained in thegiven food and the total amount of consumed nutrients, respectively. The separation of the first-order consumption experience and the health effects (α ji and γi) is based on our assumption that theconsumption experience varies over time and between foods, while health effects do not.
Data and Model Structure
We use monthly self-reported purchase data from a Danish consumer panel maintained by GfK PanelServices Scandinavia. The panel contains a monthly average of approximately 2,500 households thatreport quantity, price, and detailed product characteristics of all food purchases. In principle, thediary is filled in by the diary keeper immediately after each shopping trip and is sent to GfK weekly.As well as the purchase data, the individual who is mainly responsible for shopping in the householdfills out an annual questionnaire concerning a number of background variables that characterize thehousehold. We aggregate the purchase data to monthly observations, covering the entire period of
7 However, characteristics such as store, package size, and brand are left out. This has implications for the value ofproducts. However, as we consider the diet as a whole, it is not possible to include these factors in any meaningful sense.

Smed and Hansen Valuation of Health Attributes 257
Table 1. Consumption of Nutrients and Food, Number of Households, and Observations byEducation Level
LessEducation
MediumEducation
MoreEducation
Number of households 2,355 651 862
Number of observations 28,630 6,428 9,084
Average length of panel 15.5 12.7 13.9membership (months) Test (p value Student’s t-test)
µless = µmed µmed = µmore µless = µmore
Value of food consumed(DKK/person/month)
865.48 913.49 969.04 0.0052 0.0000 0.0000
Amt. of food consumed(kg/person/month)
37.75 38.35 39.89 0.0000 0.0000 0.0000
Fish 2.22 2.22 2.25 0.9465 0.2128 0.1928Meat 5.61 5.53 5.02 0.0866 0.0000 0.0000Fruit and vegetables 7.93 9.20 10.60 0.0000 0.0000 0.0000Dairy 8.73 8.86 9.50 0.0660 0.0000 0.0000Biscuits, etc.a 3.89 3.64 3.67 0.0000 0.6306 0.0000Fats 1.14 0.99 0.92 0.0000 0.0000 0.0000Flour, etc.b 8.23 7.91 7.94 0.0000 0.6467 0.0000
Nutrients (g/person/month)Fiber 513 520 555 0.0366 0.0000 0.0000Carbohydrates 7,335 7,132 7,470 0.0002 0.0000 0.1556Sugar 1,047 920 903 0.0000 0.2522 0.0000Total fat 5,192 4,856 4,399 0.0000 0.0000 0.0000Unsaturated fat 1,569 1,496 1,462 0.0000 0.0001 0.0000Saturated fat 1,218 1,157 1,124 0.0000 0.0001 0.0000Protein 2,972 3,009 3,045 0.0830 0.8906 0.1726
Notes: a Includes biscuits, cakes, spreads, and ice cream.b Includes flour, bread, and cereals.
2003 and 2004. For many foods, the level of detail in the purchase data is close to barcode level. Thepurchase data are merged with nutrition matrices from the Food Composition Databank providedby the Danish Institute for Food and Veterinary Research.8 The nutrition database provides detailedinformation about the content of macronutrients (e.g., protein, fats, carbohydrates and fiber) in 1,032different foods.9 As all values are given per 100 g edible part in the nutrient matrices, it is possibleto calculate the total amount of various macronutrients purchased by the households by matchingthe nutrition matrices with the purchase data. For each type of food, the match is performed atthe most detailed level possible. For example, it is possible to separate the purchased quantity ofmilk into different types of milk (e.g., butter milk, whole milk, semi-skimmed milk, skimmed milk,and flavored milk) and to match each type with a nutrition matrix that describes the exact contentof nutrients in the particular type of milk. This results in a panel dataset at the household level inwhich the nutritional composition of purchases is measured together with prices and expenditure. Weestimate the model for seven aggregate food types in which the quantities of different subfood typesare used as an approximation of non-nutrient characteristics. For meat, for example, the amount of
8 For more on the nutrition database, see http://www.foodcomp.dk/v7/fvdb_search.asp.9 The database covered 1,032 different foods in 2005 and is continuously being improved.

258 May 2018 Journal of Agricultural and Resource Economics
Table 2. Average Content of Nutrients in Each of the Food Categories (g/kg)
Dairy Meat FatsFruits andVegetables
Biscuits,etc.a Fish
Flour,etc.b
Added sugar (g/kg) 2.82 2.95 0.00 0.00 212.96 0.00 2.49
(2.9%) (1.8%) (0.0%) (0.0%) (93.0%) (0.0%) (2.3%)
Carbohydrates 42.60 17.11 5.00 91.88 296.60 104.52 462.45
(g/kg) (5.9%) (1.5%) (0.1%) (12.5%) (17.7%) (3.6%) (58.7%)
Fiber (g/kg) 0.42 0.95 0.00 19.34 3.98 0.70 32.24
(0.8%) (1.1%) (0.0%) (36.9%) (3.3%) (0.3%) (57.5%)
Protein (g/kg) 54.96 207.08 4.88 11.76 17.96 144.62 61.09
(18.7%) (43.3%) (0.2%) (3.9%) (2.6%) (12.3%) (19.0%)
Saturated fat (g/kg) 25.21 61.46 314.48 1.24 14.99 18.02 3.70
(21.7%) (32.5%) (32.5%) (1.0%) (5.5%) (3.9%) (2.9%)
Unsaturated fat 11.63 92.51 388.77 0.18 14.90 75.90 9.95
(g/kg) (7.8%) (37.9%) (31.2%) (0.1%) (4.3%) (12.7%) (6.1%)
Notes: The contribution (in percentage) of the nutrient from this food group to total consumption of the nutrient in question.Figures in bold indicate variables included in the model.a Includes biscuits, cakes, spreads, and ice cream.b Includes flour, bread, and cereals.
beef consumed would constitute the amount of one non-nutrient characteristic consumed, while theamount of pork consumed would constitute the amount of another non-nutrient characteristic.
We use purchase data to reflect the consumption experience and health effects of foodconsumption. Despite the bias that may arise due to interpreting purchase data as consumption data,the purchase data have the advantage in that they contain prices and total outlay on food, whichwould not have been available had we used 24-hour recall data. Furthermore, Appelhans et al. (2017)find that food purchases yield an unbiased and reasonably accurate estimate of overall diet qualitymeasured by 24-hour recall data. It is, however, less accurate for characterizing the dietary intakeof specific nutrients. We also consider aggregating the data to monthly observations to decrease themismatch between the time of purchase of an item and the time of consumption. In Table 1, we showkey values for the dataset after normalizing for household size and omitted reporting weeks.10
From Table 1, we see the same differences in our Danish panel as have been found in a numberof other studies. More-educated consumers spend more money on food and consume more fruit andvegetables, less meat, and fewer sugary products and fats compared to less-educated consumers.Looking at nutrients, the more educated consumers consume more fiber and less saturated fat andsugar compared to less-educated consumers. We then follow the approach from Lenz, Mittelhammer,and Shi (1994) and construct 32 aggregate food “qualities,” each of which consists of a number ofunderlying subqualities.11 These 32 aggregated food qualities constitute the quality of each of theseven main foods described in equation (4); hence, they are the elements in the BBB matrix. The AAAmatrix is constructed based on the per unit content of nutrients in each type of food. Not all goodscontain all types of nutrients. Table 2 shows the amount of each of the nutrients in g/kg in each ofthe j food categories (e.g., dairy products contain, on average, 54.96 g of protein in 1 kg and 2.60 gof added sugars). To facilitate model estimation, we exclude nutrients from the model of a specificfood category if the contribution from this food to total nutrient consumption is insignificant (lessthan 2% of total consumption). For example, we only include protein, unsaturated fat, and saturatedfat from meat in the model since carbohydrates, fiber and added sugars from meat all account forless than 2% of total consumption of the respective nutrient.
10 Unreported weeks are assumed to have consumption equal to the mean of reported weeks in the current month.11 Appendix A lists the 32 food qualities and their relationships with the seven main food groups.

Smed and Hansen Valuation of Health Attributes 259
Tabl
e3.
Para
met
erVa
lues
,the
Hea
lthA
ttri
bute A
llH
ouse
hold
sL
essE
duca
tion
Med
ium
Edu
catio
nM
ore
Edu
catio
nC
oeff
.St
d.E
rr.
Coe
ff.
Std.
Err
.C
oeff
.St
d.E
rr.
Coe
ff.
Std.
Err
.H
ealth
utili
ty,γ
i
Add
edsu
gars
5.76
E−
080.
0049
−0.
0060
−5.
11E−
08−
0.02
40∗∗
0.00
996.
39E−
110.
0134
Car
bohy
drat
es−
0.00
180.
0031
2.61
E−
032.
98E−
030.
0387∗∗∗
0.00
86−
0.02
35∗∗∗
0.00
56Fi
ber
0.11
19∗∗∗
0.03
590.
1334∗∗∗
0.03
610.
4095∗∗∗
0.05
040.
1616∗∗
0.06
47Pr
otei
n0.
1211∗∗∗
0.00
860.
0804∗∗∗
0.01
120.
0200
0.02
000.
2740∗∗∗
0.01
15Sa
tura
ted
fat
3.34
E−
090.
0154
2.82
E−
092.
41E−
02−
2.74
E−
090.
0472
6.12
E−
110.
0226
Uns
atur
ated
fat
0.18
62∗∗∗
0.01
200.
2027∗∗∗
0.01
680.
1461∗∗∗
0.03
590.
0309∗
0.01
67
Hea
lthut
ility
,qua
drat
ic,ϕ
i
Add
edsu
gars
−7.
7E−
08∗∗∗
−2.
94E−
08−
2.70
E−
09−
0.05
00−
1.11
E−
077.
30E−
08−
6.05
E−
11−
9.19
E−
08C
arbo
hydr
ates
−5.
04E−
08∗∗∗−
9.29
E−
09−
1.81
E−
07∗∗∗−
1.08
E−
08−
5.99
E−
123.
04E−
08−
1.79
E−
07∗∗∗−
2.84
E−
08Fi
ber
−1.
9E−
05∗∗∗
−1.
20E−
06−
2.43
E−
08−
1.38
E−
06−
6.64
E−
05∗∗∗
4.18
E−
06−
2.69
E−
05∗∗∗−
4.90
E−
06Pr
otei
n−
1.57
E−
06∗∗∗−
6.17
E−
08−
1.48
E−
06∗∗∗−
7.60
E−
08−
1.63
E−
06∗∗∗
2.40
E−
07−
2.10
E−
06∗∗∗−
1.43
E−
07Sa
tura
ted
fat
−1.
81E−
06∗∗∗−
9.42
E−
08−
2.17
E−
06∗∗∗−
1.36
E−
07−
5.88
E−
07∗∗∗
7.56
E−
08−
2.13
E−
06∗∗∗−
2.29
E−
07U
nsat
urat
edfa
t−
1.81
E−
06∗∗∗−
9.42
E−
08−
2.17
E−
06∗∗∗−
1.36
E−
07−
5.88
E−
077.
56E−
07−
2.13
E−
06∗∗∗−
2.29
E−
07
Not
es:S
ingl
e,do
uble
,and
trip
leas
teri
sks
(*,*
*,**
*)in
dica
tesi
gnifi
canc
eat
the
10%
,5%
,and
1%le
vel.
Inth
em
odel
fora
llho
useh
olds
,we
test
edw
heth
erth
equ
adra
ticte
rms
fors
atur
ated
and
unsa
tura
ted
fatw
ere
equa
l.T
hatc
ould
notb
ere
ject
ed,s
ow
ese
tthe
para
met
ers
tobe
equa
lin
the
estim
atio
nfo
rdiff
eren
tedu
catio
nalg
roup
sfo
reas
eof
estim
atio
n(t
heva
riab
les
are
heav
ilyco
rrel
ated
,cau
sing
prob
lem
sw
ithco
nver
genc
e).

260 May 2018 Journal of Agricultural and Resource Economics
Figure 1. Marginal Health Valuation of Nutrients
Estimation and Results
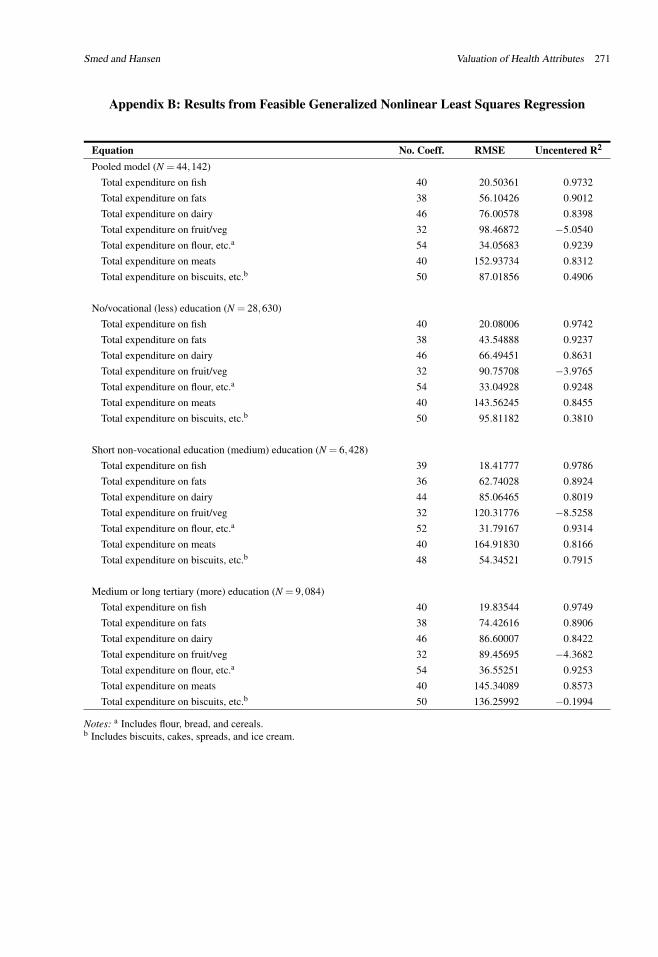
We estimate the model specified in equation (15) using monthly food purchases per person for theseven main food groups as a system of seven nonlinear regression equations using the NLSURcommand in Stata 10. We chose the SUR estimation technique to reflect the dependence ofparameters across equations and the dependency of the random errors between equations. The modelis estimated independently for three different educational groups, where households are allocatedaccording to the educational status of the individual who is mainly responsible for shopping:less-educated (no education or a vocational education), medium-educated (short nonvocationaleducation), and more-educated (medium or long tertiary education). We also estimate a pooledmodel for all consumers to validate our model results. Summary statistics for these models arepresented in Appendix B.
The pooled model uses a quadratic representation of the nutrient consumption experiencevariables for all nutrients. In the estimations for educational groups, we dropped the quadraticspecification in favor of a linear representation whenever the quadratic component was notsignificant in the pooled model. Excluding insignificant quadratic parameters facilitates ourestimation of models for the three education groups, where the number of observations is reducedcompared to the full model. Table 3 shows parameter values for the health attributes of nutrients,both for the model estimated on all households and for each of the educational groups. Many of theparameters are highly significant. All quadratic parameters have the expected negative sign (or areinsignificant), indicating decreasing (nonincreasing) marginal health utility of nutrients with a netpositive health valuation and increasing (nondecreasing) marginal disutility of nutrients with a netnegative health valuation. Combining the parameters, all nutrients also have the expected marginalvaluation signs (positive net valuation of fiber, protein, and unsaturated fat and negative net valuationof sugar, saturated fat, and carbohydrates) within the value span covered by our data (see Figure 1).
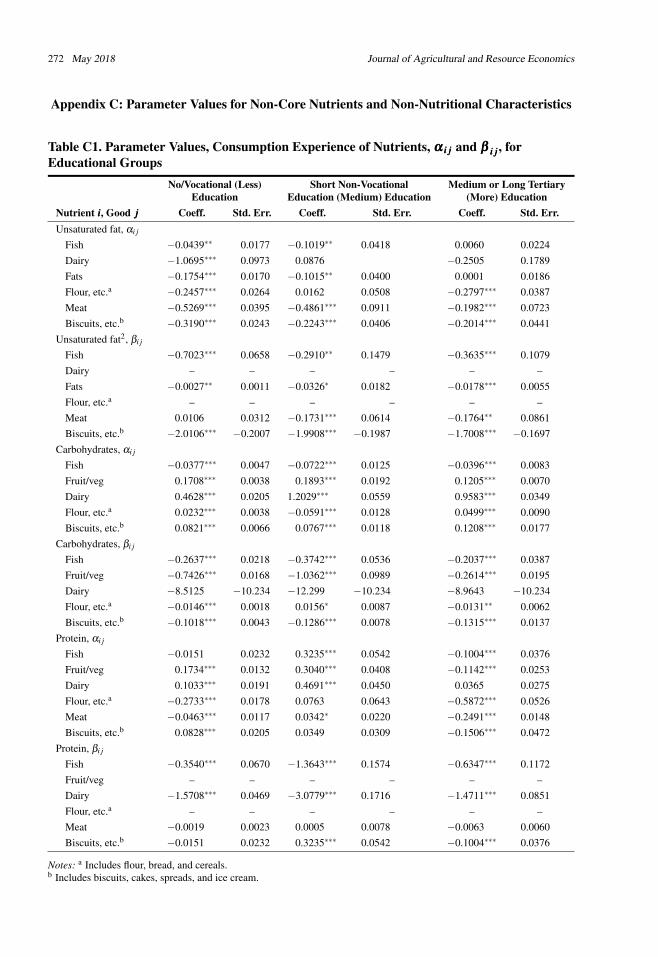
Table 4 shows the parameter values for the consumption experience of saturated fat, added sugar,and fiber (the nutrients of main interest) for each of the educational groups; Appendix Tables C1 andC2 show the (numerous) parameters for the three other nutrients as well as non-nutritional attributes.Generally, the consumption experience of fiber is negatively valued, but mostly among less-educatedconsumers. Added sugar is positively valued in dairy products and, in general, negatively valued inother products. However, more-educated consumers consistently have the lowest taste valuations for

Smed and Hansen Valuation of Health Attributes 261
Table 4. Parameter Values, Consumption Experience, ααα iii jjj and βββ iii jjj for Educational Groups
Less Education Medium Education More EducationNutrient iii, Good jjj Coeff. Std. Err. Coeff. Std. Err. Coeff. Std. Err.Added sugar, αi j
Dairy 0.5989∗∗∗ 0.0252 0.1540∗∗ 0.0683 0.0165 0.0456Flour, etc.a −0.0305∗∗∗ 0.0095 0.1105∗∗∗ 0.0208 −0.0907∗∗∗ 0.0216Biscuits, etc.b −0.0918∗∗∗ 0.0079 −0.0533∗∗∗ 0.0120 −0.1260∗∗∗ 0.0197
Added sugar, squared, βi j
Dairy OmittedFlour, etc.a −1.73E−01∗ 0.1054 −0.7696∗∗∗ 0.3045 −1.31E−09 0.2804Biscuits, etc.b 0.0668∗∗∗ 0.0039 0.0895∗∗∗ 0.0067 0.0863∗∗∗ 0.0121
Fiber, αi j
Fruit/veg −0.1814∗∗∗ 0.0322 −0.5429∗∗∗ 0.0675 −0.0496 0.0621Flour, etc.a −0.0862∗∗ 0.0387 −0.2672∗∗∗ 0.0576 −0.0257 0.0680Biscuits, etc.b −0.6211∗∗∗ 0.0794 −0.4693∗∗∗ 0.1105 −0.2441 0.1951
Fiber, squared, βi j
Fruit/veg OmittedFlour, etc.a −0.9126∗∗∗ 0.0964 −1.0673∗∗∗ 0.2551 −0.8433∗∗∗ 0.0000Biscuits, etc.b Omitted
Saturated fat, αi j
Fish −0.1801∗∗∗ 0.0258 −0.2883∗∗∗ 0.0586 −0.0919∗∗∗ 0.0334Dairy 0.1797∗∗∗ 0.0453 −0.4807∗∗∗ 0.0562 0.0081 0.0778Fats −0.0968∗∗∗ 0.0276 −0.1613∗∗ 0.0747 −0.0536 0.0373Flour, etc.a −0.0967∗∗∗ 0.0262 −0.2222∗∗∗ 0.0523 −0.1322∗∗∗ 0.0269Meat 0.2224∗∗∗ 0.0559 0.1053 0.1330 −0.0661 0.1084Biscuits, etc.b 0.1202∗∗∗ 0.0271 0.0502 0.0479 0.1339∗∗∗ 0.0404
Saturated fat, squared, βi j
Fish OmittedDairy 1.0200∗∗∗ 0.0866 3.2306∗∗∗ 0.2802 0.6701∗∗∗ 0.1276Fats −0.0904∗∗∗ 0.0187 −0.0518 0.0741 −0.1200∗∗∗ 0.0397Flour, etc.a OmittedMeat 0.1410∗ 0.0754 0.6580∗∗∗ 0.1366 0.5784∗∗∗ 0.1896Biscuits, etc.b 0.2158∗∗∗ 0.0404 −0.2011∗∗ 0.0999 −0.0335 0.1481
Notes: Single, double, and triple asterisks (*, **, ***) indicate [statistical] significance at the 10%, 5%, and 1% level.a Includes flour, bread, and cereals.b Includes biscuits, cakes, spreads, and ice cream.
sugar. Among less-educated consumers, saturated fat is positively valued in meat, sugar products,and dairy products and negatively valued in fats and flour, bread, and cereals.
Discussion of Results
Health Preferences
Inserting the estimated parameters from the aggregated model (all consumers) into equation (13), wecalculate the marginal health valuations of each nutrient as a function of monthly per capita nutrient

262 May 2018 Journal of Agricultural and Resource Economics
consumption. These are illustrated for six nutrients in Figure 1, where each arrow indicates healthvalues between the 5th percentile and the 95th percentile of monthly per capita nutrient consumptionobserved in our data period.12 Our estimation indicates positive health valuations for unsaturatedfat, protein, and fiber and negative health valuations for sugar, saturated fat, and carbohydrates.These valuations are aligned with the official Danish dietary recommendations from 2003–2004,13,which indicate that sugar and saturated fat are unhealthy while fiber, protein, carbohydrates, andunsaturated fat are healthy. Since most Danish consumers are aware of these recommendations,it is not unreasonable to validate our model results against them. The only real inconsistency isthat consumers have a negative valuation of carbohydrates in our estimation, despite the positiveevaluation in the official dietary recommendations. This inconsistency may be because the officialcarbohydrate recommendation was questioned in the popular press and in various popular diets (e.g.,the Atkins and South Beach diets) during our data period. In addition, the focus of authorities duringthis period was on communicating warnings about the negative health consequences of consumingsaturated fat and, to some extent, sugar and providing positive recommendations about fiber in thediet.
Figure 2 presents marginal health valuations for the three educational groups, calculated fromequation (13) using parameter estimates from each of the three subgroup models. In each subfigure,the arrows indicate health values between the 5th percentile and the 95th percentile of observationfor the indicated education subgroup. We only present and discuss the most important nutrients;added sugar, fiber, and saturated fat.
Figure 2a illustrates health valuations of added sugar. The marginal health valuations are almostconstant for all three groups across the consumption variation indicated by our data. It is also clearthat medium-educated consumers have a substantially more negative evaluation of sugar than less-and more-educated consumers (these two groups’ health valuations do not statistically differ from0).
Figure 2b presents the marginal health valuations for fiber. All three groups have significantpositive valuations, while these decrease notably with aggregate fiber consumption for the medium-educated group (which has the highest valuation). Thus, it seems that, within this group, consumersnot only realize that fiber is healthy but also that the marginal benefits decrease with consumption.Medium-educated consumers again deviate from the other groups by having a substantially morepositive health valuation across the entire 90% span of values in our data.
Figure 2 represents the marginal health valuations for saturated fat. All three groups havesignificant negative marginal health valuations that increase substantially (numerically) withaggregated saturated fat consumption. Therefore, it seems that consumers in all three groups not onlyrealize that saturated fat is unhealthy but also that it is more important to reduce consumption if youeat a lot of saturated fat in the first place. However, for saturated fat, we find that medium-educatedconsumers are the least concerned about health compared to less- and more-educated consumersacross the entire 90% span of values in our data.
In conclusion, the first noticeable valuation pattern is that consumers generally seem tounderstand and appreciate the documented health effects of nutrients, but only in relation to fiberand saturated fat do they appear to appreciate that these health effects are closely related to theamount of nutrient consumed. The second noticeable valuation pattern is that the less- and more-educated consumers have similar marginal health valuations; the medium-educated group stands out
12 Fiber consumption is 117–914 g/person/month, protein 956–5,132 g/person/month, carbohydrates 2,290–11,785g/person/month, saturated fat 292–2,136 g/person/month, unsaturated fat 381–2,887 g/person/month and sugar 0–317g/person/month.
13 These recommended a maximum of 30% of total energy intake from fat and 10% from saturated fat (morerefined recommendations suggest minimum requirements from unsaturated fat consumption, namely 10%–15% frommonounsaturated fat and 5%–10% from polyunsaturated fat), 10%–15% of energy intake from protein, and 55%–60%from carbohydrates. Minimum fiber intake should be 3 g/MJ (about 2.4% of total energy intake), while intake of fruit andvegetables should be at least 600 g/day and intake of fish 200–300 g/week (Becker et al., 2004). The recommendations wereupdated in 2013

Smed and Hansen Valuation of Health Attributes 263
(a) Added Sugar
(b) Fiber
(c) Saturated Fat
Figure 2. Marginal Health Valuations

264 May 2018 Journal of Agricultural and Resource Economics
for having stronger health preferences for two of three nutrients examined. This contrasts with thedifferences in healthiness of the three groups’ diet composition (Table 1), where the more-educatedgroup stood out for having the healthiest diet in all three nutrition dimensions.
Preferences for Consumption Experience
We now turn to consumers’ preferences for consumption experiences. Figure 3 compares theconsumption experience valuation of the three core nutrients we consider in our model containedin the seven aggregated foods calculated at the average nutrient content level from Table 2.
All educational groups like (or are neutral about) the consumption experience of sugar in dairybut dislike (or are neutral about) sugar in sugar products, which is the origin of most of the addedsugar in the diet. More-educated consumers dislike sugar most. All groups dislike (or are neutralabout) the consumption experience of fiber, but more-educated consumers dislike it least. Thevaluations of the consumption experience of saturated fat are more mixed. However, for the threefood groups that contribute the majority of the saturated fat in the diet (fats, meat and dairy), less-educated consumers have mostly positive valuations of the consumption experience, while more-educated consumers have negative or neutral valuations.
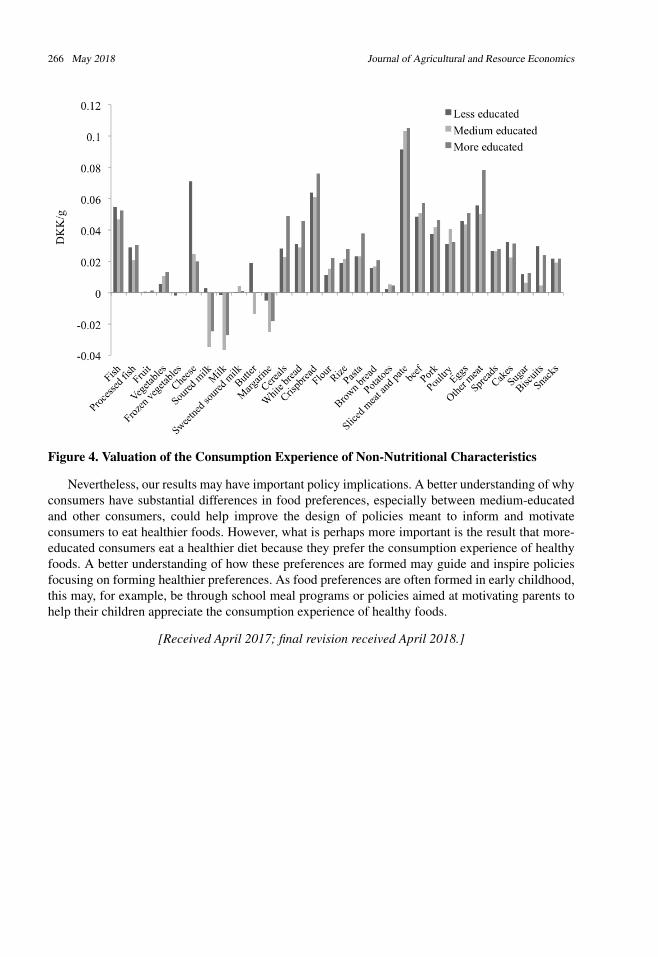
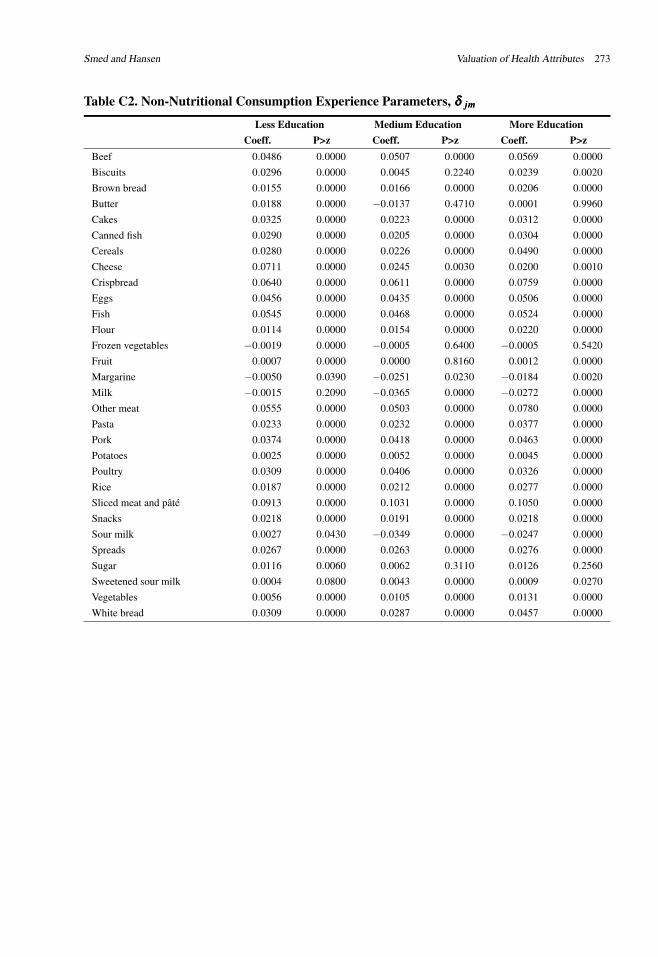
To complete the picture, Figure 4 shows the valuation of non-nutritional characteristics of food(i.e., the 32 aggregated quality variants).14 These reflect the consumption experience that is notassociated with the nutritional content of the products. For example, more beef may increase theconsumption experience within the meat category independent of the nutrient content. Less-educatedconsumers have a valuation of 48.6 Danish crowns (DKK)/kg to have beef within the meat category,while medium- and more-educated consumers have valuations of 50.7 DKK/kg and 56.9 DKK/kg,respectively, indicating that preference for beef increases with education.
Conclusion
Most hedonic studies only model a few related food items simultaneously. Furthermore, whencomparing estimated valuations of nutrients (e.g., saturated fat or added sugar) contained indifferent foods from these studies, they are found to differ substantially. This is not surprising sincethese nutrients, in addition to having health implications, may also have important effects on theconsumption experience of consuming the food (i.e., taste, texture). If the effect of a given nutrienton this experience varies among goods, so will its total marginal utility values. In this paper, wedevelop a hedonic characteristics model that makes it possible to disentangle the health values ofa given nutrient from the consumption experience under the key identifying assumptions that thehealth value of a given nutrient in a consumer’s diet depends on his or her total consumption ofthis nutrient, while the consumption experience only depends on the consumption of the nutrientcontained in the given type of food.
We compare the three groups of consumers differentiated by education. Our results suggestthat consumers generally understand and appreciate the documented health effects of nutrients, butonly in relation to saturated fat and, to some extent, fiber do they appreciate that these effects areclosely related to the amount of the nutrient consumed. Our results also indicate that more-educatedconsumers have healthier diets than the less-educated, but this is not because of a greater preferencefor health. Rather, more-educated consumers have preferences for the consumption experiences ofhealthy food. In contrast, differences in health preferences may partly explain why medium-educatedconsumers have healthier diets than the less-educated. It should be stressed that, while our resultsshow that these differences are correlated with education, they do not show any causal relationshipbetween valuations and education.
14 Parameter values for the remaining nutrients as well as non-nutritional consumption experience parameters are shownin Appendix C.

Smed and Hansen Valuation of Health Attributes 265
(a) Added Sugar
(b) Fiber
(c) Saturated Fat
Figure 3. Marginal Consumption Experience ValuationsNotes: a Includes flour, bread, and cereals.b Includes biscuits, cakes, spreads, and ice cream.
266 May 2018 Journal of Agricultural and Resource Economics
Figure 4. Valuation of the Consumption Experience of Non-Nutritional Characteristics
Nevertheless, our results may have important policy implications. A better understanding of whyconsumers have substantial differences in food preferences, especially between medium-educatedand other consumers, could help improve the design of policies meant to inform and motivateconsumers to eat healthier foods. However, what is perhaps more important is the result that more-educated consumers eat a healthier diet because they prefer the consumption experience of healthyfoods. A better understanding of how these preferences are formed may guide and inspire policiesfocusing on forming healthier preferences. As food preferences are often formed in early childhood,this may, for example, be through school meal programs or policies aimed at motivating parents tohelp their children appreciate the consumption experience of healthy foods.
[Received April 2017; final revision received April 2018.]
Smed and Hansen Valuation of Health Attributes 267
References
Ahmad, W., and S. Anders. “The Value of Brand and Convenience Attributes in HighlyProcessed Food Products.” Canadian Journal of Agricultural Economics 60(2012):113–133. doi:10.1111/j.1744-7976.2011.01234.x.
Appelhans, B. M., S. A. French, C. C. Tangney, L. M. Powell, and Y. Wang. “To What Extent DoFood Purchases Reflect Shoppers’ Diet Quality and Nutrient Intake?” International Journal ofBehavioral Nutrition and Physical Activity 14(2017):46–55. doi: 10.1186/s12966-017-0502-2.
Becker, W., N. Lyhne, A. N. Pedersen, A. Aro, M. Fogelholm, I. Phorsdottir, J. Alexander, S. A.Anderssen, H. M. Meltzer, and J. I. Pedersen. “Nordic Nutrition Recommendations 2004 —Integrating Nutrition and Physical Activity.” Scandinavian Journal of Nutrition 48(2004):178–187. doi: 10.1080/1102680410003794.
Beenackers, M. A., C. B. Kamphuis, K. Giskes, J. Brug, A. E. Kunst, A. Burdorf, and F. J. vanLenthe. “Socioeconomic Inequalities in Occupational, Leisure-Time, and Transport RelatedPhysical Activity among European Adults: A Systematic Review.” International Journal ofBehavioral Nutrition and Physical Activity 9(2012):116–138. doi: 10.1186/1479-5868-9-116.
Birch, L. L. “Development of Food Preferences.” Annual Review of Nutrition 19(1999):41–62. doi:10.1146/annurev.nutr.19.1.41.
Brønnum-Hansen, H., and M. Baadsgaard. “Increase in Social Inequality in Health Expectancyin Denmark.” Scandinavian Journal of Public Health 36(2008):44–51. doi: 10.1177/1403494807085193.
———. “Widening Social Inequality in Life Expectancy in Denmark. A Register-Based Studyon Social Composition and Mortality Trends for the Danish Population.” BMC Public Health12(2012):994–1000. doi: 10.1186/1471-2458-12-994.
Carlucci, D., A. Stasi, G. Nardone, and A. Seccia. “Explaining Price Variability in the Italian YogurtMarket: A Hedonic Analysis.” Agribusiness 29(2013):194–206. doi: 10.1002/agr.21332.
Darmon, N., and A. Drewnowski. “Does Social Class Predict Diet Quality?” American Journal ofClinical Nutrition 87(2008):1107–1117. doi: 10.1093/ajcn/87.5.1107.
Demarest, S., H. Van Oyen, A.-J. Roskam, B. Cox, E. Regidor, J. P. Mackenbach, and A. E. Kunst.“Educational Inequalities in Leisure-Time Physical Activity in 15 European Countries.” EuropeanJournal of Public Health 24(2014):199–204. doi: 10.1093/eurpub/ckt061.
Drescher, L., S. Thiele, and C. R. Weiss. “The Taste for Variety: A Hedonic Analysis.” EconomicsLetters 101(2008):66–68. doi: 10.1016/j.econlet.2008.04.005.
Drescher, L. S., J. Roosen, S. Thiele, G. B. M. Mensink, S. V. Cramon-Taubadel, and J.-P. Loy. “Quantification of a Diet’s Value Using Hedonic Analysis: Integrating a HealthAspect.” Acta Agriculturae Scandinavica, Section C — Food Economics 5(2008):164–177. doi:10.1080/16507540902899508.
Drewnowski, A. “Taste Preferences and Food Intake.” Annual Review of Nutrition 17(1997):237–253. doi: 10.1146/annurev.nutr.17.1.237.
Gallo, V., J. P. Mackenbach, M. Ezzati, G. Menvielle, A. E. Kunst, S. Rohrmann, R. Kaaks,B. Teucher, H. Boeing, M. M. Bergmann, A. Tjonneland, S. O. Dalton, K. Overvad, M.-L.Redondo, A. Agudo, A. Daponte, L. Arriola, C. Navarro, A. B. Gurrea, K.-T. Khaw, N. Wareham,T. Key, A. Naska, A. Trichopoulou, D. Trichopoulos, G. Masala, S. Panico, P. Contiero,R. Tumino, H. B. Bueno-de Mesquita, P. D. Siersema, P. P. Peeters, S. Zackrisson, M. Almquist,S. Eriksson, G. Hallmans, G. Skeie, T. Braaten, E. Lund, A.-K. Illner, T. Mouw, E. Riboli, andP. Vineis. “Social Inequalities and Mortality in Europe – Results from a Large Multi-NationalCohort.” PLoS ONE 7(2012):e39,013. doi: 10.1371/journal.pone.0039013.
Groth, M. V., L. M. Christensen, V. K. Knudsen, M. R. Sorensen, S. Fagt, M. Ege, and J. Matthiessen.Sociale Forskelle i Born og Voksnes Kostvaner. Morkhoj, Denmark: Fodevareinstituttet, 2013.Available online at http://maaltidspartnerskabet.dk/projekt/sociale-forskelle-i-born-og-voksnes-kostvaner/.

268 May 2018 Journal of Agricultural and Resource Economics
Groth, M. V., M. R. Sorensen, J. Matthiessen, S. Fagt, N. Landvad, and V. K. Knudsen. “Disparitiesin Dietary Habits and Physical Activity in Denmark and Trends from 1995 to 2008.” ScandinavianJournal of Public Health 42(2014):611–620. doi: 10.1177/1403494814547668.
Grunert, K. G., L. Fernández-Celemín, J. M. Wills, S. Storcksdieck genannt Bonsmann, andL. Nureeva. “Use and Understanding of Nutrition Information on Food Labels in Six EuropeanCountries.” Zeitschrift Fur Gesundheitswissenschaften 18(2010):261–277. doi: 10.1007/s10389-009-0307-0.
Grunert, K. G., and J. M. Wills. “A Review of European Research on Consumer Response toNutrition Information on Food Labels.” Journal of Public Health 15(2007):385–399. doi:10.1007/s10389-007-0101-9.
Hiscock, R., L. Bauld, A. Amos, J. A. Fidler, and M. Munafò. “Socioeconomic Status andSmoking: A Review.” Annals of the New York Academy of Sciences 1248(2012):107–123. doi:10.1111/j.1749-6632.2011.06202.x.
Hoffmann, R. “Socioeconomic Inequalities in Old-Age Mortality: A Comparison ofDenmark and the USA.” Social Science & Medicine 72(2011):1986–1992. doi:10.1016/j.socscimed.2011.04.019.
Huang, C. L., and B.-H. Lin. “A Hedonic Analysis of Fresh Tomato Prices among RegionalMarkets.” Applied Economic Perspectives and Policy 29(2007):783–800. doi: 10.1111/j.1467-9353.2007.00387.x.
Johnston, D. W., G. Lordan, M. A. Shields, and A. Suziedelyte. “Education and Health Knowledge:Evidence from UK Compulsory Schooling Reform.” Social Science & Medicine 127(2015):92–100. doi: 10.1016/j.socscimed.2014.10.026.
Ladd, G. W., and M. B. Martin. “Prices and Demands for Input Characteristics.” American Journalof Agricultural Economics 58(1976):21–30. doi: 10.2307/1238573.
Ladd, G. W., and V. Suvannunt. “A Model of Consumer Goods Characteristics.” American Journalof Agricultural Economics 58(1976):504–510. doi: 10.2307/1239267.
Ladd, G. W., and M. Zober. “Model of Consumer Reaction to Product Characteristics.” Journal ofConsumer Research 4(1977):89–101. doi: 10.1086/208684.
Lancaster, K. J. “A New Approach to Consumer Theory.” Journal of Political Economy74(1966):132–157. doi: 10.1086/259131.
Lenz, J. E., R. C. Mittelhammer, and H. Shi. “Retail-Level Hedonics and the Valuation of MilkComponents.” American Journal of Agricultural Economics 76(1994):492–503. doi: 10.2307/1243660.
Lucas, R. E. B. “Hedonic Price Functions.” Economic Inquiry 13(1975):157–178. doi:10.1111/j.1465-7295.1975.tb00985.x.
Mackenbach, J. P. “The Persistence of Health Inequalities in Modern Welfare States: TheExplanation of a Paradox.” Social Science & Medicine 75(2012):761–769. doi: 10.1016/j.socscimed.2012.02.031.
Majer, I. M., W. J. Nusselder, J. P. Mackenbach, and A. E. Kunst. “Socioeconomic Inequalitiesin Life and Health Expectancies around Official Retirement Age in 10 Western-EuropeanCountries.” Journal of Epidemiology & Community Health 65(2011):972–979. doi: 10.1136/jech.2010.111492.
Marmot, M. “Social Determinants of Health Inequalities.” Lancet 365(2005):1099–1104. doi:10.1016/S0140-6736(05)71146-6.
Marmot, M., J. Allen, R. Bell, E. Bloomer, and P. Goldblatt. “WHO European Review ofSocial Determinants of Health and the Health Divide.” Lancet 380(2012):1011–1029. doi:10.1016/S0140-6736(12)61228-8.
OECD. “Health Data.” 2011. Available online at http://www.oecd.org/document/30/0,3746,en_2649_33929_12968734_1_1_1_1,00.html.
Pampel, F. C., P. M. Krueger, and J. T. Denney. “Socioeconomic Disparities in Health Behaviors.”Annual Review of Sociology 36(2010):349–370. doi: 10.1146/annurev.soc.012809.102529.
Smed and Hansen Valuation of Health Attributes 269
Pechey, R., S. A. Jebb, M. P. Kelly, E. Almiron-Roig, S. Conde, R. Nakamura, I. Shemilt,M. Suhrcke, and T. M. Marteau. “Socioeconomic Differences in Purchases of More vs. LessHealthy Foods and Beverages: Analysis of over 25,000 British Households in 2010.” SocialScience & Medicine 92(2013):22–26. doi: 10.1016/j.socscimed.2013.05.012.
Ranney, C. K., and P. E. McNamara. “Do Healthier Diets Cost More?” 2002. Paper presented at theannual meeting of the American Agricultural Economics Association, July 28–31, Long Beach,CA.
Richards, T. J., L. Mancino, and W. Nganje. “Nutrient Demand in Food Away from Home.” Forumfor Health Economics & Policy 15(2012):n.p. doi: 10.1515/1558-9544.1246.
Rosen, S. “Hedonic Prices and Implicit Markets: Product Differentiation in Pure Competition.”Journal of Political Economy 82(1974):34–55. doi: 10.1086/260169.
Schröck, R. “Valuing Country of Origin and Organic Claim: A Hedonic Analysis of CheesePurchases of German Households.” British Food Journal 116(2014):1070–1091. doi: 10.1108/BFJ-12-2012-0308.
Schulz, L. L., T. C. Schroeder, and K. L. White. “Value of Beef Steak Branding: Hedonic Analysisof Retail Scanner Data.” Agricultural and Resource Economics Review 41(2012):260–273. doi:10.1017/S1068280500003397.
Shi, H., and D. W. Price. “Impacts of Sociodemographic Variables on the Implicit Valuesof Breakfast Cereal Characteristics.” Journal of Agricultural and Resource Economics23(1998):126–139.
Shongwe, M. A., A. Jooste, A. Hugo, Z. G. Alemu, and A. Pelser. “Will Consumers Pay for LessFat on Beef Cuts? The Case in Bloemfontein, South Africa.” Agrekon 46(2007):475–493. doi:10.1080/03031853.2007.9523782.
Stanley, L. R., and J. Tschirhart. “Hedonic Prices for a Nondurable Good: The Case of BreakfastCereals.” Review of Economics and Statistics 73(1991):537–541. doi: 10.2307/2109582.
Thunström, L. “The Marginal Willingness-to-Pay for Health Related Food Characteristics.” UmeåEconomic Studies 724, Umeå University, Department of Economics, Umeå, Sweden, 2007.
Thunström, L., and G. Rausser. “The Marginal Willingness to Pay for Health-Related FoodCharacteristics.” Acta Agriculturae Scandinavica, Section C — Food Economics 5(2008):194–206. doi: 10.1080/16507540903064235.
Vickner, S. S. “Estimating the Implicit Price of Convenience: A Hedonic Analysis of theUS Breakfast Sausage Market: Estimating the Impicit Price of Convenience.” Agribusiness31(2015):281–292. doi: 10.1002/agr.21404.
Ward, C. E., J. L. Lusk, and J. M. Dutton. “Implicit Value of Retail Beef Product Attributes.” Journalof Agricultural and Resource Economics 33(2008):364–381.
World Health Organization. Noncommunicable Diseases. 2015. Available online athttp://www.who.int/mediacentre/factsheets/fs355/en/.
Wright, L. T., C. Nancarrow, and P. M. H. Kwok. “Food Taste Preferences and Cultural Influenceson Consumption.” British Food Journal 103(2001):348–357. doi: 10.1108/00070700110396321.

270 May 2018 Journal of Agricultural and Resource Economics
Appendix A: Aggregating Foods into Goods
Original Grouping in Data Quality Variants of Foods Main Food GroupProcessed fish Processed fish FishFish Fish
Processed meat for bread Processed meat MeatLiver pâtéBrawn and pâtéRissoleBaconSausagesBeef and other meat Beef
Other meatPork PorkPoultry PoultryEggs Eggs
Butter Butter FatsOil OilMargarine MargarinePizza DishesDishes with rice and pasta
Chocolate (for bread) Spreads Biscuits, cakes, spreads, and ice creamMarmaladeBiscuits BiscuitsIce cream Ice creamSugar SugarCake CakesCookies
Fruit Fruit Fruit and vegetablesVegetables VegetablesFrozen vegetables Frozen vegetables
Potatoes Potatoes Flour, bread, and cerealsCereals CerealsWhite bread White breadBrown bread Brown breadFlour FlourCrisp bread Crisp breadRice RicePasta Pasta
Speciality cheese Cheese DairyOrdinary cheeseMilk MilkYogurt Yogurt
Smed and Hansen Valuation of Health Attributes 271
Appendix B: Results from Feasible Generalized Nonlinear Least Squares Regression
Equation No. Coeff. RMSE Uncentered R222
Pooled model (N = 44,142)Total expenditure on fish 40 20.50361 0.9732Total expenditure on fats 38 56.10426 0.9012Total expenditure on dairy 46 76.00578 0.8398Total expenditure on fruit/veg 32 98.46872 −5.0540Total expenditure on flour, etc.a 54 34.05683 0.9239Total expenditure on meats 40 152.93734 0.8312Total expenditure on biscuits, etc.b 50 87.01856 0.4906
No/vocational (less) education (N = 28,630)Total expenditure on fish 40 20.08006 0.9742Total expenditure on fats 38 43.54888 0.9237Total expenditure on dairy 46 66.49451 0.8631Total expenditure on fruit/veg 32 90.75708 −3.9765Total expenditure on flour, etc.a 54 33.04928 0.9248Total expenditure on meats 40 143.56245 0.8455Total expenditure on biscuits, etc.b 50 95.81182 0.3810
Short non-vocational education (medium) education (N = 6,428)Total expenditure on fish 39 18.41777 0.9786Total expenditure on fats 36 62.74028 0.8924Total expenditure on dairy 44 85.06465 0.8019Total expenditure on fruit/veg 32 120.31776 −8.5258Total expenditure on flour, etc.a 52 31.79167 0.9314Total expenditure on meats 40 164.91830 0.8166Total expenditure on biscuits, etc.b 48 54.34521 0.7915
Medium or long tertiary (more) education (N = 9,084)Total expenditure on fish 40 19.83544 0.9749Total expenditure on fats 38 74.42616 0.8906Total expenditure on dairy 46 86.60007 0.8422Total expenditure on fruit/veg 32 89.45695 −4.3682Total expenditure on flour, etc.a 54 36.55251 0.9253Total expenditure on meats 40 145.34089 0.8573Total expenditure on biscuits, etc.b 50 136.25992 −0.1994
Notes: a Includes flour, bread, and cereals.b Includes biscuits, cakes, spreads, and ice cream.
272 May 2018 Journal of Agricultural and Resource Economics
Appendix C: Parameter Values for Non-Core Nutrients and Non-Nutritional Characteristics
Table C1. Parameter Values, Consumption Experience of Nutrients, ααα iii jjj and βββ iii jjj, forEducational Groups
No/Vocational (Less)Education
Short Non-VocationalEducation (Medium) Education
Medium or Long Tertiary(More) Education
Nutrient iii, Good jjj Coeff. Std. Err. Coeff. Std. Err. Coeff. Std. Err.Unsaturated fat, αi j
Fish −0.0439∗∗ 0.0177 −0.1019∗∗ 0.0418 0.0060 0.0224Dairy −1.0695∗∗∗ 0.0973 0.0876 −0.2505 0.1789Fats −0.1754∗∗∗ 0.0170 −0.1015∗∗ 0.0400 0.0001 0.0186Flour, etc.a −0.2457∗∗∗ 0.0264 0.0162 0.0508 −0.2797∗∗∗ 0.0387Meat −0.5269∗∗∗ 0.0395 −0.4861∗∗∗ 0.0911 −0.1982∗∗∗ 0.0723Biscuits, etc.b −0.3190∗∗∗ 0.0243 −0.2243∗∗∗ 0.0406 −0.2014∗∗∗ 0.0441
Unsaturated fat2, βi j
Fish −0.7023∗∗∗ 0.0658 −0.2910∗∗ 0.1479 −0.3635∗∗∗ 0.1079Dairy – – – – – –Fats −0.0027∗∗ 0.0011 −0.0326∗ 0.0182 −0.0178∗∗∗ 0.0055Flour, etc.a – – – – – –Meat 0.0106 0.0312 −0.1731∗∗∗ 0.0614 −0.1764∗∗ 0.0861Biscuits, etc.b −2.0106∗∗∗ −0.2007 −1.9908∗∗∗ −0.1987 −1.7008∗∗∗ −0.1697
Carbohydrates, αi j
Fish −0.0377∗∗∗ 0.0047 −0.0722∗∗∗ 0.0125 −0.0396∗∗∗ 0.0083Fruit/veg 0.1708∗∗∗ 0.0038 0.1893∗∗∗ 0.0192 0.1205∗∗∗ 0.0070Dairy 0.4628∗∗∗ 0.0205 1.2029∗∗∗ 0.0559 0.9583∗∗∗ 0.0349Flour, etc.a 0.0232∗∗∗ 0.0038 −0.0591∗∗∗ 0.0128 0.0499∗∗∗ 0.0090Biscuits, etc.b 0.0821∗∗∗ 0.0066 0.0767∗∗∗ 0.0118 0.1208∗∗∗ 0.0177
Carbohydrates, βi j
Fish −0.2637∗∗∗ 0.0218 −0.3742∗∗∗ 0.0536 −0.2037∗∗∗ 0.0387Fruit/veg −0.7426∗∗∗ 0.0168 −1.0362∗∗∗ 0.0989 −0.2614∗∗∗ 0.0195Dairy −8.5125 −10.234 −12.299 −10.234 −8.9643 −10.234Flour, etc.a −0.0146∗∗∗ 0.0018 0.0156∗ 0.0087 −0.0131∗∗ 0.0062Biscuits, etc.b −0.1018∗∗∗ 0.0043 −0.1286∗∗∗ 0.0078 −0.1315∗∗∗ 0.0137
Protein, αi j
Fish −0.0151 0.0232 0.3235∗∗∗ 0.0542 −0.1004∗∗∗ 0.0376Fruit/veg 0.1734∗∗∗ 0.0132 0.3040∗∗∗ 0.0408 −0.1142∗∗∗ 0.0253Dairy 0.1033∗∗∗ 0.0191 0.4691∗∗∗ 0.0450 0.0365 0.0275Flour, etc.a −0.2733∗∗∗ 0.0178 0.0763 0.0643 −0.5872∗∗∗ 0.0526Meat −0.0463∗∗∗ 0.0117 0.0342∗ 0.0220 −0.2491∗∗∗ 0.0148Biscuits, etc.b 0.0828∗∗∗ 0.0205 0.0349 0.0309 −0.1506∗∗∗ 0.0472
Protein, βi j
Fish −0.3540∗∗∗ 0.0670 −1.3643∗∗∗ 0.1574 −0.6347∗∗∗ 0.1172Fruit/veg – – – – – –Dairy −1.5708∗∗∗ 0.0469 −3.0779∗∗∗ 0.1716 −1.4711∗∗∗ 0.0851Flour, etc.a – – – – – –Meat −0.0019 0.0023 0.0005 0.0078 −0.0063 0.0060Biscuits, etc.b −0.0151 0.0232 0.3235∗∗∗ 0.0542 −0.1004∗∗∗ 0.0376
Notes: a Includes flour, bread, and cereals.b Includes biscuits, cakes, spreads, and ice cream.
Smed and Hansen Valuation of Health Attributes 273
Table C2. Non-Nutritional Consumption Experience Parameters, δδδ jjjmmm
Less Education Medium Education More EducationCoeff. P>z Coeff. P>z Coeff. P>z
Beef 0.0486 0.0000 0.0507 0.0000 0.0569 0.0000Biscuits 0.0296 0.0000 0.0045 0.2240 0.0239 0.0020Brown bread 0.0155 0.0000 0.0166 0.0000 0.0206 0.0000Butter 0.0188 0.0000 −0.0137 0.4710 0.0001 0.9960Cakes 0.0325 0.0000 0.0223 0.0000 0.0312 0.0000Canned fish 0.0290 0.0000 0.0205 0.0000 0.0304 0.0000Cereals 0.0280 0.0000 0.0226 0.0000 0.0490 0.0000Cheese 0.0711 0.0000 0.0245 0.0030 0.0200 0.0010Crispbread 0.0640 0.0000 0.0611 0.0000 0.0759 0.0000Eggs 0.0456 0.0000 0.0435 0.0000 0.0506 0.0000Fish 0.0545 0.0000 0.0468 0.0000 0.0524 0.0000Flour 0.0114 0.0000 0.0154 0.0000 0.0220 0.0000Frozen vegetables −0.0019 0.0000 −0.0005 0.6400 −0.0005 0.5420Fruit 0.0007 0.0000 0.0000 0.8160 0.0012 0.0000Margarine −0.0050 0.0390 −0.0251 0.0230 −0.0184 0.0020Milk −0.0015 0.2090 −0.0365 0.0000 −0.0272 0.0000Other meat 0.0555 0.0000 0.0503 0.0000 0.0780 0.0000Pasta 0.0233 0.0000 0.0232 0.0000 0.0377 0.0000Pork 0.0374 0.0000 0.0418 0.0000 0.0463 0.0000Potatoes 0.0025 0.0000 0.0052 0.0000 0.0045 0.0000Poultry 0.0309 0.0000 0.0406 0.0000 0.0326 0.0000Rice 0.0187 0.0000 0.0212 0.0000 0.0277 0.0000Sliced meat and pâté 0.0913 0.0000 0.1031 0.0000 0.1050 0.0000Snacks 0.0218 0.0000 0.0191 0.0000 0.0218 0.0000Sour milk 0.0027 0.0430 −0.0349 0.0000 −0.0247 0.0000Spreads 0.0267 0.0000 0.0263 0.0000 0.0276 0.0000Sugar 0.0116 0.0060 0.0062 0.3110 0.0126 0.2560Sweetened sour milk 0.0004 0.0800 0.0043 0.0000 0.0009 0.0270Vegetables 0.0056 0.0000 0.0105 0.0000 0.0131 0.0000White bread 0.0309 0.0000 0.0287 0.0000 0.0457 0.0000