Bolton Council abc
33
Assessment of Town Centre Vitality and Viability 2007 Update abc Bolton Council July 2007
Transcript of Bolton Council abc

Ass es s men t o f Tow n C en t re V i t a l i t y and V iab i l i t y
2007 U pda te
abc B o l t o n C o u n c i l
J u l y 2 0 0 7

Bolton Council
abc
Contents
Page
1 Introduction.................................................................................................................................................. 1
2 Demographic Context.................................................................................................................................. 2 2.1 Retail Catchment ........................................................................................................................................................ 2 2.2 Demographic Comparison.......................................................................................................................................... 3 2.3 Retail Catchment – Expenditure................................................................................................................................. 5
3 Vitality and Viability Update........................................................................................................................ 7 3.1 Bolton and the Retail Hierarchy.................................................................................................................................. 7 3.2 Current Provision........................................................................................................................................................ 7 3.3 Prime Rents and Yields ............................................................................................................................................ 10 3.4 Retailer Demand....................................................................................................................................................... 11 3.5 Development Context ............................................................................................................................................... 12
4 Conclusions ............................................................................................................................................... 13 Appendix A: Glossary of Terms Appendix B: Data Set

abc 1
1 Introduction
1.1 Jones Lang LaSalle has been instructed by Bolton Council to provide an updated assessment of Bolton’s town centre vitality and viability in accordance with the requirements of ‘Planning Policy Statement (PPS) 6. This is the 11th update, from 1995 until 2006 CB Richard Ellis have conducted this exercise.
1.2 This report monitors Bolton Town Centres recent performance compared to competing centres. The key variations since the last report are the main focus of this document. This document also provides commentary on the demographic context of the area. Where this report updates information previously provided by CBRE, any differences in the sources used are clearly referenced and any disparities explored.
Report Structure 1.3 The report is structured as follows:
1.4 Chapter 2 establishes the geographical catchment of Bolton’s retail market and the demographic makeup of its population. It then states Bolton’s retail market position within the Regional hierarchy. In order to understand the comparative position and progress of Bolton town centre it is vital to understand the status of a number of competing centres. To establish this we have agreed with the Council to use the following comparators;
• Manchester City Centre (excluding district centres and Trafford Centre); • Preston; • Southport; • Stockport; • Blackburn; • Bury; and • Wigan.
1.5 Having established a context to the study, Chapter 3 explores a number of key indicators to determine the current vitality and viability of the town centre. The report uses the following criteria to assess the condition of the town centre, all indicators which are consistent with the previous CBRE exercise and PPS 6 criteria:
• Profile of retail floor space including proportion of comparison, convenience and vacant; • Size of current provision; • Zone A rents; • Prime shopping centre investment yields; and • Retailer requirements / demand;
1.6 Chapter 3 then comments on development activity and the pipeline supply that will help satisfy occupiers’ requirements. This is likely to have a major bearing on the future vitality and viability of the town centre.
1.7 The final chapter details Jones Lang LaSalle’s professional view on the current state of Bolton’s retail market based on the evidence presented and our own insight on the regional market. This concluding section makes a number of recommendations for the Council’s consideration to ensure that Bolton can improve its position in the Regional hierarchy and encourage ongoing vitality and viability.

abc 2
2 Demographic Context
2.1 Retail Catchment 2.1.1 The following diagram illustrates the extent of Bolton’s retail catchment as determined by CACI in 2007.
Bolton’s catchment spreads north into Blackburn but, as expected, is curtailed to the south by Manchester. Appendix A provides a glossary of terms for all of the demographic and catchment data.
Figure 1. Source : CACI 2007
See Appendix A for CACI Gravity Model : Defines Catchment Area Methodology
2.1.2 Bolton’s catchment population is projected by CACI to grow by 1.4% and 3% over the next 5 and 10
years. This proportion is relatively low when compared with the UK average population growth rates of 2.2% and 4.6% respectively over the next 5 and 10 years.
2.1.3 As illustrated in Figure 2, Bolton has a reasonably strong core catchment with a 41% market share. The outer catchment is weak in comparison with just a 2% market share. Bolton has a 7% share of the total catchment.

abc 3
Catchment Shopper Population Total Population Share of Catchment
Bolton : Primary Catchment 75,955 134,845 56%
Bolton : Secondary Catchment
36,400 140,470 26%
Bolton : Tertiary Catchment 21,374 279,854 8%
Bolton : Quarternary Catchment
14,682 1,463,396 1%
Overall Total 150,631 2,069,460 7% Total Inner Catchment 2 112,355 275,315 41%
Total Outer Catchment 36,056 1,726,034 2%
Overall Total 148,411 2,001,349 7% Retail Centre Inner Catchment Outer Catchment Total Catchment
Manchester 24% 3% 9%
Preston 67% 5% 17%
Southport 72% 3% 9%
Stockport 20% 2% 6%
Bolton 41% 2% 7%
Blackburn 47% 3% 10%
Bury 18% 1% 4%
Wigan 36% 2% 8 %
Figure 2. Source : CACI 2007 (utilising 2001 Census data and projecting to current levels)
2.2 Demographic Comparison 2.2.1 As Figure 3 below demonstrates, Bolton has a population that is slightly younger than the profile of
bench mark centres with 18.9% of the population in the 0 to 14 years age category. As a result, Bolton has fewer adults in the 45 – 54 year age category compared with the comparable areas.
2.2.2 The population growth projected for the town and its catchment over the period 2006 to 2016 is slightly higher than the benchmark centre average at 2.9%, as illustrated in Figure 4.
2.2.3 Figure 5 details a catchment population with Bolton that, in comparison to competing centres is skewed towards the lower Acorn Categories. The proportion of wealthy achievers is comparable with Bury, Wigan and Blackburn but someway behind Manchester and Southport. The Hard Pressed proportion of the population is the second highest of all the comparable centres.

abc 4
Population by Age Profile
0%
10%
20%
30%
40%
0 -14 15-34 35 - 44 45 - 54 55 - 64 65 +Age Groups
% P
opup
lation
Manchester Bolton Wigan BurySouthport Preston Blackburn
Figure 3. Source : CACI 2007 (utilising 2001 Census data and projecting to current levels)
Bolton Benchmark Centres Average
Population Growth 2006 - 2011
1.4% 1.4%
Population Growth 2006-2016
2.9% 2.8%
Figure 4. Source : CACI 2007 (utilising 2001 Census data and projecting to current levels)
Population by Acorn Category
01020304050
WealthyAchievers
UrbanProsperity
ComfortablyOff
ModerateMeans
HardPressed
Acorn Category
% P
opul
atio
n
Manchester Bolton Wigan BurySouthport Preston Blackburn
Figure 5. Source : CACI 2007 (utilising 2001 Census data and projecting to current levels)
2.2.4 The Bolton population in the AB social grade (higher and intermediate managerial, administrative and professional) category is just below most of the benchmark centres at 21.5% and also below the national average of 22.7%, as illustrated in Figure 6. There is a slight bias towards the D and E social grades (semi and unskilled manual workers and state pensioners) with 31.9% of the working population in this category compared to the benchmark centre average of 29.4%.
2.2.5 In terms of family income, 39.7% of households earn over £30,000 per annum compared to the benchmark centres average of 44.4%, as illustrated in Figure 7.

abc 5
Population by Social Grade
05
101520253035
AB C1 C2 D ESocial Grade
% P
opul
atio
nManchester Bolton Wigan BurySouthport Preston Blackburn
Figure 6. Source : CACI 2007 (utilising 2001 Census data and projecting to current levels)
Gross Family Income
0%5%
10%15%20%25%
0 - 15 15 -20
20 -25
25 -30
30 -35
35 -40
40 -45
45 -50
50 -55
55 -60
60 +
Salary (£ 000's)
% P
opula
tion
Manchester BoltonWigan BurySouthport PrestonBlackburn
Figure 7. Source : CACI 2007 (utilising 2001 Census data and projecting to current levels)
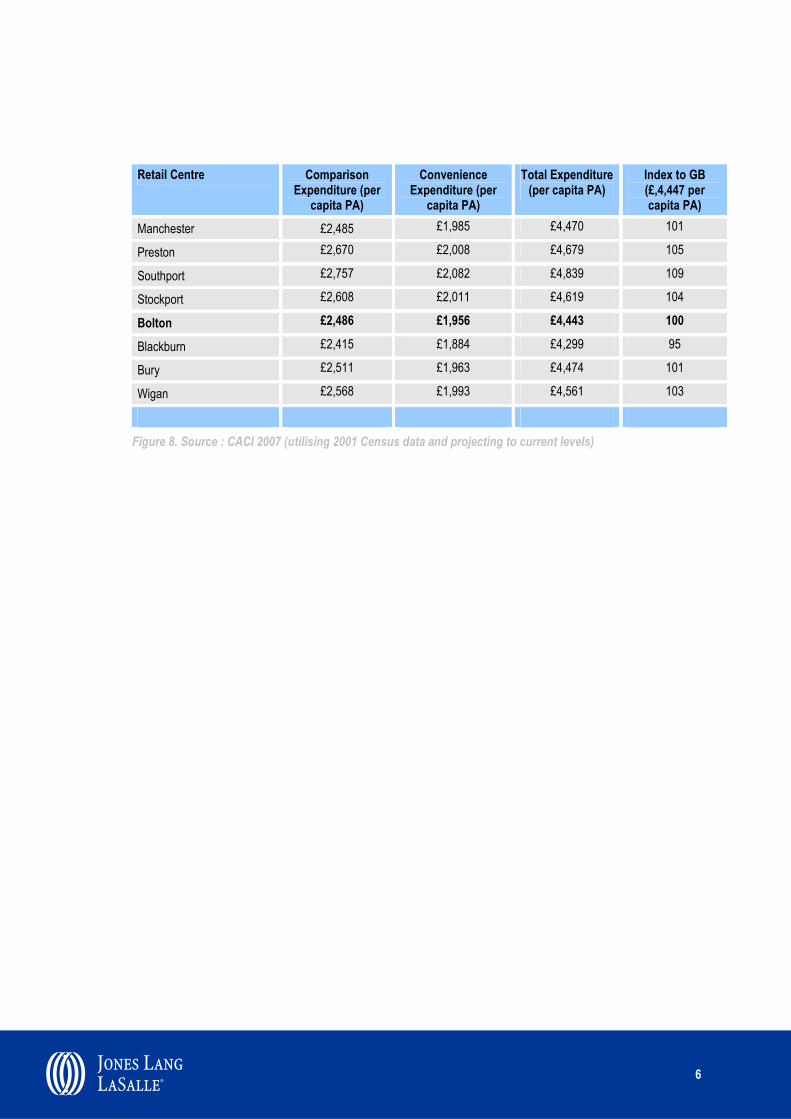
2.3 Retail Catchment – Expenditure 2.3.1 Having explored the demographic makeup of Bolton, of particular relevance to the success of the retail
market is the catchment population’s expenditure on goods. This is provided by CACI who utilise spend on standard comparison (including bulky, electrical and white goods) and convenience goods (including food retailing) to calculate the total expenditure figures.
2.3.2 Figure 8 illustrates that total expenditure in the Bolton catchment is comparable with the UK average. However, all the benchmark centres have a higher retail spend, with the exception of Blackburn.
abc 6
Retail Centre Comparison Expenditure (per
capita PA)
Convenience Expenditure (per
capita PA)
Total Expenditure (per capita PA)
Index to GB (£,4,447 per capita PA)
Manchester £2,485 £1,985 £4,470 101
Preston £2,670 £2,008 £4,679 105
Southport £2,757 £2,082 £4,839 109
Stockport £2,608 £2,011 £4,619 104
Bolton £2,486 £1,956 £4,443 100
Blackburn £2,415 £1,884 £4,299 95
Bury £2,511 £1,963 £4,474 101
Wigan £2,568 £1,993 £4,561 103
Figure 8. Source : CACI 2007 (utilising 2001 Census data and projecting to current levels)

abc 7
3 Vitality and Viability Update
3.1 Bolton and the Retail Hierarchy 3.1.1 Before analysing the key indicators, it is useful to set Bolton within the regional retail hierarchy by
utilising Venuescore data (2006) in relation to the comparator centres. This indicator provides an up-to-date ranking of UK shopping venues across a number of key indicators including; scale, market, positioning, fashionability and age positioning of the retail offer. This information will provide a useful indicator to monitor Bolton’s performance against competing retail locations. See Appendix A for Venuescore methodology.
3.1.2 Bolton is classified as a regional centre, with a Venuescore of 153. Centres with a similar score in the region include Warrington (155) and St Helens (148). When the scores are ranked, Bolton is 97th (as shown in Figure 9), sitting ahead of competing Blackburn (124), Bury (130) and Wigan (154) but still someway behind neighbouring Preston (37). Bolton’s current rank represents a downturn from 2005, indeed only Bury has improved its retail ranking during this period. This is considered due to the impact of the Trafford Centre’s scale and quality of retail offer. The Trafford Centre is excluded from the calculation of Manchester’s score.
Venue Location Grade Rank Movement Since 2005
Manchester Major City 4 ↓
Preston Major Regional 37 ↓
Southport Regional 64 ↓
Stockport Regional 83 ↓
Bolton Regional 97 ↓
Blackburn Regional 124 ↓
Bury Regional 130 ↑
Wigan Sub-Regional 154 ↓
Figure 9. Source : Javelin Group, VENUESCORE 2006. (1 = Highest retail ranking)
3.2 Current Provision 3.2.1 The Goad database, complied by Experian, is a retail property stock database and mapping system.
This source details a comprehensive survey of the current retail supply. Most town and city centres in the UK are included in the database. It is updated regularly with site surveys and discussions with occupiers and landlords. The following discussion provides a picture of the current retail stock in Bolton, detailing size and type of units and tenants represented and absent from the occupier profile.
Retail Type 3.2.2 The Experian database details around 1,434,400 sq ft of retail floorspace within Bolton town centre.
Figure 10 shows the current floorspace provision for a number of regional towns. Whilst Bolton has a greater than average quantum of comparison goods provision (801,300 sq ft) as a proportion of the total

abc 8
stock, at 58%, this level is low when compared with competing centres (this is detailed in Figure 10 with further information in Appendix B). In contrast the proportion of convenience retail, at 22%, is the second highest of all the comparator centres.
Current Floorspace Provision
0
10
20
30
40
50
60
70
80
Man
ches
ter
Presto
n
Southp
ort
Stock
port
Bolton
Blackbu
rnBur
y
Wiga
n
Town
%
Comparison % Convenience %Retail Service % Vacant Retail %
Figure 10. Source : Experian Goad 2007 – see appendix B for full data set.
Unit Size 3.2.3 The data on unit size and availability in Bolton and competing centres is also sourced from Experian
Goad data and details the proportion in number of each type of unit. As a means of comparison, it is most appropriate to comment on the portion of total units within each size bracket.
3.2.4 Figure 11 illustrates that smaller (sub-optimal) retail units dominate the existing retail stock in Bolton, with just under 80% of units under 2,500 sq ft. This is largely typical of the competing centres. However, Bolton has the highest number of units over 5,000 sq ft, which are more likely to accommodate the modern requirements of retailers.
Vacancy 3.2.5 With regards to vacancy, the previous updates undertaken by CBRE used the same data source,
allowing a direct comparison to be made in this report. In 2006 the study noted vacancy rates of 13% compared to 12% or (157,200 sq ft) in 2007, which represents a slight decrease as a percentage of the total provision.
3.2.6 When comparing the proportion of vacant stock, at 12%, Bolton has lower vacancy rating than Manchester (13%), Preston (19%), Southport (16%) and Wigan (15%). However, when looking at the total quantum of vacancy of 119,200 sq ft, Bolton has the third highest amount of vacant stock behind Manchester and Preston.

abc 9
Size of units (sq. ft)
0%
10%
20%
30%
40%
50%
60%
Bolton Bury Stockport Preston Manchester Wigan Southport Blackburn
Town
0-1000 1001-2500 2501-5000 5000+
Figure 11. Source : Experian Goad 2007 – see appendix B for full data set.
Occupier Profile 3.2.7 Figure 12 details predominately higher end fashion retailers and department stores in Bolton and
enables a comparison alongside the comparator centres. Such occupiers are considered to be indicative of the ‘quality’ component in the retail rankings. The notable absentees from Bolton’s occupiers are clothing retailer Mango and French Connection. This is a common position within a number of competing centres, however, it is encouraging to note the inclusion of Zara and H&M, who have been confirmed as pre-lets within The Market Place Shopping Centre redevelopment.
.
Figure 12. Source : Experian Goad 2007

abc 10
3.2.8 Figure 12 details current occupiers. However, pipeline development will impact on the profile of occupiers in the comparators centre and this is discussed further in point 3.5. The major changes noted were in Preston, where John Lewis will anchor the 230,000 sq ft Tithebarn development. In Blackburn, the extension of The Mall Shopping Centre will accommodate new units for existing occupiers New Look and Primark. The full regional development pipeline is included in Appendix B.
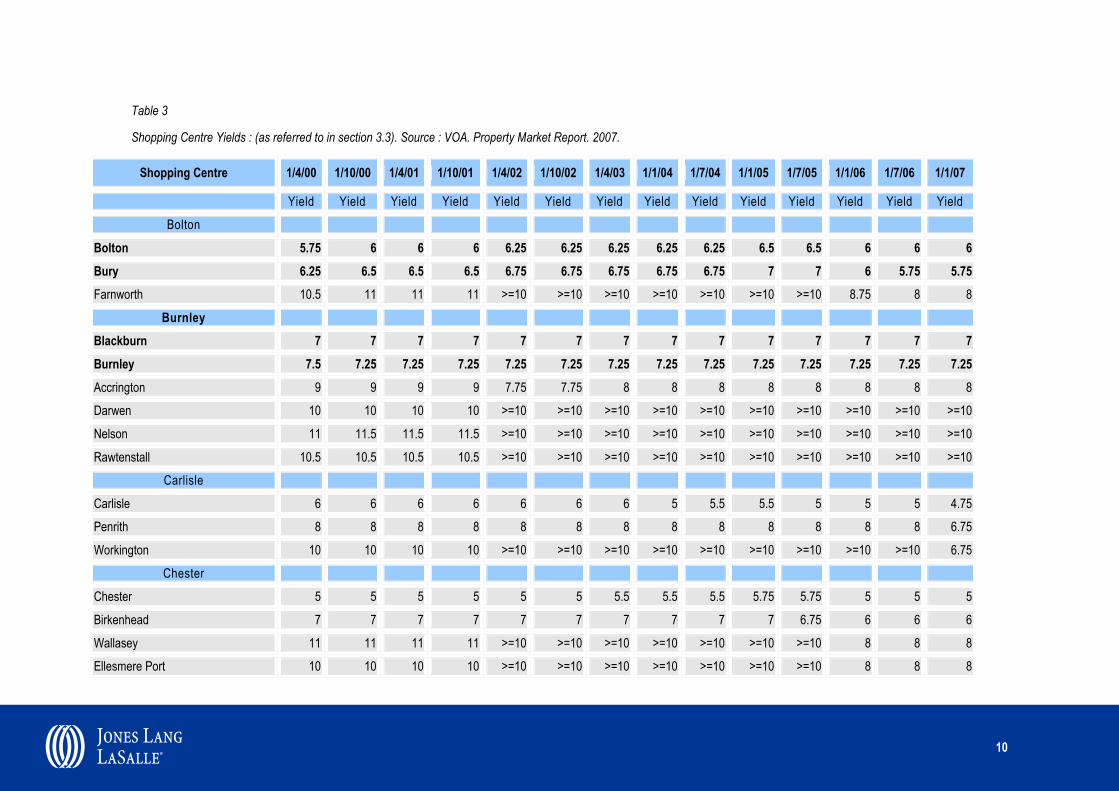
3.3 Prime Rents and Yields 3.3.1 A key requirement of PPS 6 in assessing vitality and viability of town centres is to examine trends in
rents and yields over time to inform the current position. As the CBRE data was taken from an internal database, we have sought to establish a neutral data source to reflect historic trends. The Valuation Office Agency (VOA) holds data for shopping rents and yields. It is collated twice yearly and sourced from surveys with occupiers, research with agents and web based sources which record property deals from, for example, egi, Focus and Promis. Unfortunately, data relating to rents was not avalible for Southport or Bury, as detailed in the full data set in Appendix B.
3.3.2 We have also provided Jones Lang LaSalle’s view on current values, reflecting the information from the data sources identified above but supplemented with the experience of our agency colleagues who have active knowledge of the market.
3.3.3 A definition of an investment yield has been provided in Appendix A.
Prime Rents 3.3.4 Jones Lang LaSalle and CBRE have both recorded prime rents in Bolton have remained stable at £150
per sq ft over the period between November 2005 and January 2007. The VOA also notes stability during this period, however, the rate is recorded as being slightly higher at £156 per sq ft.
3.3.5 This disparity in the data could be a result of the way in which the data is collated. Consultancies such as Jones Lang LaSalle and CBRE are likely to have a more commercial view on rents and yields from their experience in the market which, in this case, may have provided a more realistic view of rental levels. The VOA data is also likely to encompass a larger sample and may reflect smaller spaces let which typically reflect a higher rent, therefore inflating the average rent.
3.3.6 The key point to note is that rents have remained stable in Bolton from January 2006 until January 2007. In future updates we would suggest a similar approach, utilising VOA data to reflect past trends supported by the view of an agency staff in a commercial practice to detail current rental values. Over time the commercial data, using the same sources, can be used to comment on trends.
3.3.7 With regards to the regional rental hierarchy, Bolton has the third highest values of all the competing centres behind Stockport and Manchester, a position which is common in Jones Lang LaSalle and VOA data.
3.3.8 Within the last six months the VOA data details rents in all centres as remaining stable.
Prime Yields 3.3.9 Jones Lang LaSalle data (July 2007) notes prime yields of 4.75% in Bolton; the same level recorded by
CBRE in November 2007.
3.3.10 However disparities in yields between VOA and Jones Lang LaSalle / CBRE data is noted. The VOA data records yields at the higher rate of 6% as of January 2007. This higher rate, which would reflect a less attractive investment rate (see definition Appendix A), could again be explained in the way in which the VOA and commercial practices collect data.

abc 11
3.3.11 The VOA data sees yields remaining stable from January 2006 to January 2007. This trend is mirrored in the majority of comparator centres with the exception of Manchester City Centre which saw a 0.25% drop in this period.
3.4 Retailer Demand 3.5 The Prefect Information Property data source details around 37 current requirements for Bolton in July,
2007; totalling 170,000 sq ft. Town Centre requirements (by sq ft) account for 75% of total retail demand in Bolton. This source is an industry recognised retail requirements database and sources data independently. The full list of occupier requirements is included in Appendix B.
No Requirements
Total Requirements
(sq ft) % of
Requirements
Total Town Centre 37 175,350 75% OOT 7 57,000 25% 232,350 100% Figure 13. Source : PiP, July 2007
3.6 These requirements can be further analysed where Bolton is specific target town, (Bolton Specific Requirements), and those which are targeting Bolton alongside a number of other centre, (Non-Specific Bolton Requirements). The latter group could include, for example, occupiers targeting UK wide or the North West locations, with Bolton as a named target alongside other locations. These are illustrated in Figures 14 and 15.
No Requirements
Total Requirements
(sq ft) % of
Requirements
Town Centre No. 17 47,950 57% OOT Totals 3 36,000 43% Total 20 83,950 100% Figure 14. Bolton Specific Requirements. Source : PiP, July 2007
No
Requirements Total
Requirements (sq ft)
% of Requirements
Town Centre No. 20 127,400 86% OOT 4 21,000 14% Total 24 148,400 100% Figure 15. Non-Specfic Bolton Requirements. Source : PiP, July 2007
3.7 The Bolton Specific Requirements for the High Street range from 700 sq ft to 4,500 sq ft with the majority being lower market fashion retailers and other budget retailers as illustrated in Appendix B. Starbucks have a requirement on the database for a 700 – 1,800 sq ft High Street unit.
3.8 A similar content is seen in the Non-Specific Bolton Requirements which range from 600 – 24,000 sq ft. There are also a number of A3 occupiers within this list as well as convenience and food operators including Tesco Express, Somerfield and United Co-op.

abc 12
3.9 Development Context 3.10 To analyse the development context, the Council provided a development schedule detailing the major retail
warehouse sites with planning permission or under construction. A full list of competing schemes in the comparator centres is included in Appendix B. This schedule was analysed to provide an indication of the total quantum of development in the pipeline. All major development where a development area has been provided and where the individual additions are over 465 sq m (5,000 sq ft) were totalled indicating 342,356 sq m (3,685,086 sq ft) of development in the pipeline.
3.11 Bolton Council’s Town Centre team identified the major retail schemes within the development pipeline which will have a significant impact on the town’s retail standing in the future. These include the following:
• Market Hall -This Warner Estates scheme totals 9,000 sq m (96,875 sq ft) of space, 80% of which is currently pre-let to tenants including H&M and Zara. Units typically range from 1,200 – 4,500 sq ft. This scheme is under construction and currently within the programme for completion in October 2008.
• Central Street - This Wilson Bowden scheme comprises 33,394 square metres (360,000 sq ft) of retail floorspace and briefly includes:
• an anchor food store/department store (Class A1 food or non-food retail use) extending to 7,973 sq m together with an additional 2,800 sq m mezzanine floorspace (116,000 sq ft total);
• new shop units, primarily Class A1 retail use though also including other retail units, comprising a small number of potential food and drink uses
• An extension and associated refurbishments to Victorian Hall, a Grade II Listed Building including replacement community facility;
• 150 residential rooftop apartments; • New streets, squares, pedestrian and other transport linkages; and • 810 space basement car park with associated servicing and highway infrastructure works. In order to achieve the comprehensive redevelopment of the area for which outline planning permission has been granted, the Council will consider promoting a compulsory purchase order to consolidate ownership of the land should one be required. Subject to all necessary approvals, the current anticipated start date for the development is January 2010.
• Church Wharf – The council has recently appointed Ask Developments and Bluemantle, to jointly carry out the Church Wharf scheme on the 13-acre site. Work is expected to start in mid-2009.
3.12 Proposals for the £2 million re vamp include a multi-screen cinema, restaurants, cafés, a hotel, offices and around 600 new homes. The scheme, which is still in its initial stages, could create up to 1500 jobs.

abc 13
4 Conclusions
Key Findings 4.1.1 There are a number of key conclusions:
• Analysis of the retail rankings shows that Bolton has experienced a downturn in its retail ranking from 2005 to 2006 (ranking for 2007 not yet available). This was, however, a common trend amongst its regional competitors and is likely to be attributed to the impact of the Trafford Centre’s scale and quality of retail offer.
• Rents, yields and vacancy rates have remained relatively stable since the last update. • There appears to be a higher than average proportion of larger units (over 5,000 sq ft) within Bolton.
This fact, along with the influx of modern space forthcoming in the area’s pipeline supply, will enable the town to compete with neighbouring centres for a number of outstanding requirements.
• There are 37 current requirements for the Town Centre. Three quarters of the Bolton specific requirements have requested space within the Town Centre. The make-up of these requirements includes lower grade fashion and budget comparison retailers, A3 occupiers and a number of food retailers.
• There is a lack of the mid market / higher end fashion retailers within the current requirements profile which, if accommodated, would add to the quality and variety of offer in the Town Centre. The confirmation of Zara and H&M in the town centre does, however, suggest that if appropriate space is provided the occupiers may follow.
• The development proposals in place would appear to provide Bolton with a head start on a number of competing locations. The progress made at Market Hall, with 80% of the space pre-let to tenants such as Zara and H&M, is encouraging. It is these mid market / higher end fashion retailers that the competing centre will be looking to attract to raise the quality of the town centre.
• Proposals at Church Warf, with the appointment of Bluemantle and Ask, will provide further confidence to the investment and development market.
Conclusions and Recommendations 4.1.2 There is a clear need to sustain activity and provide a different offer within the Town Centre. The
reconfiguration of the dated Crompton Place, and the improvement of linkages to the Interchange, Bradshawgate and Victoria Square will be critical in maintaining and diversifying the offer.
4.1.3 Serious consideration will need to be given to the scope for, location of and configuration of any additional requirement for retail floorspace in the town centre beyond the completion of the Central Street scheme.
4.1.4 The imminent works to the Market Hall and the Central Street development will help to recapture lost ground in the retail ranking. However, the key opportunity in the retail sector lies in exploiting further the potential position in the sub-region of Bolton as a shopping destination. There is potential scope for the creation of a policy framework whether informal or formal to direct any similar new retail provision to areas of the Town Centre which appear most appropriate or in need and to form a niche area for distinguishing retail speciality amongst comparators.
4.1.5 The quality and condition of Newport Street, and the underlying issues that have led to the degeneration of the street, detract from the shopping experience as well as the quality of the civic space in Victoria

abc 14
Square. Similarly the dated design of Crompton Place, and the corresponding vacant units, which have been the result of a shift in shopping patterns north has only added to this problem. This has led to the southern portion of the shopping offer being of a lower quality, particularly in built form, but increasingly in the quality and range of shops. There is an opportunity here to plan a comprehensive redevelopment of the town centre, which will serve as a lynch pin to uplift all sectors. This will critically provide new uses, and an offer appropriate to the growing residential and business population. It will create an overall unique selling point to the retail sector.
4.1.6 An increase in the number of town centre residents; the revitalisation of the retail offer; and the development of the planned Cultural Quarter, will create a substantial platform for both inward and residual investment. Increased growth in business and residential footfall in the area will encourage operators of bars and restaurants to look at opportunities where currently this provision is lacking.
4.1.7 The number of requirements for premises in the town centre shown as ‘live’ does not include the independent operators that are likely to take advantage of burgeoning regeneration proposals for the town centre. As with the other sectors, attracting further market interest in Bolton will be secured through the promotion of the entire location, supported by the provision of appropriate floorspace/product.
4.1.8 Restaurant operators will invest in locations that have sufficient footfall, parking and an attractive environment. Any masterplanning and or redevelopment opportunities should focus on the potential for incorporating A3 uses at ground floor level to capture market share in the most appropriate locations.
4.1.9 Whilst the town centre remains one of the principal retail locations in the sub region, there is an ongoing need to modernise and diversify the offer. The competing offer, from neighbouring market towns, Manchester and indeed Middlebrook is significant. The challenge going forward is to build on the renewed confidence of investors and coordinate activity in the retail sector providing space which meets with size and specification requirements of modern retailers.

abc 15
COPYRIGHT © JONES LANG LASALLE IP, INC. 2007 This publication is the sole property of Jones Lang LaSalle IP, Inc. and must not be copied, reproduced or transmitted in any form or by any means, either in whole or in part, without the prior written consent of Jones Lang LaSalle IP, Inc. The information contained in this publication has been obtained from sources generally regarded to be reliable. However, no representation is made, or warranty given, in respect of the accuracy of this information. We would like to be informed of any inaccuracies so that we may correct them. Jones Lang LaSalle does not accept any liability in negligence or otherwise for any loss or damage suffered by any party resulting from reliance on this publication.

abc 1
Appendix A : Glossary of Terms
1. CACI – Retail Gravity Model / Catchment Definitions The CACI model takes into account the relative attraction or “pull” of the retail centre relative to the other retail centres in the vicinity and the accessibility of the centre to the surrounding population. Each multiple retailer present in the town is scored according to their overall attractiveness (e.g. John Lewis = 34, HMV = 9, Clinton Cards = 3).
The gravity model is for Comparison Goods shopping centres in Great Britain and incorporates the following elements:-
1.) “Retail attraction score” quantifies the relative attraction of the centre
The score is based on a count of retailers within each centre, with weightings according to the strength of the retailer (e.g. Selfridges West End = 55 points, WHSmith = 6 points).
i.e. A large high street shopping centre will have a greater “pulling power” than a smaller suburban centre
2.) Overlapping Catchment Areas
The catchment area is divided into trade areas:
• Primary – At least 50% of the trade of a centre
• Secondary – At least 75% of trade of a centre
• Tertiary – At least 90% of trade of a centre
• Quaternary – The remaining trade of a centre.
• Total Catchement = sum of all the above.
• Inner Ctachment = Primary + Secondary
• Outer Ctachment = Tertiary + Quaternary
3.) Shopper Population
The model calculates a “shopper population” for each retail centre based upon the principles that:
• People are more likely to visit larger, more attractive centres
• People are more likely to visit centres that are easily accessible to them (based on a combination of distance and drive time).
The “shopper population” refers to the number of people who will use the centre regularly for comparison shopping (it does not equal footfall as it does not take account of frequency of visit).
4.) Modelling Changes to the retail offer
• The gravity model is also used to show the impact of changes to the supply of retail in centres. As developments make centres more attractive, the model can reflect this by improving the “retail attraction score”.
• The methodology followed is to calculate the net addition of retail units using the list of target retailers from the tenant mix plan wherever possible. If this detail is not yet available for a development, we use the stated increase in floorspace to represent the increase in attraction. There is a close relationship between floorspace and the RD score.

abc 2
2. ACORN Classifications Acorn is a UK residential population classification system which categorises the UK population into five main groups according to affluence and behaviour.
AGMA authorities also have Acorn Data which is held and analysed at BMBC by the Planning Research Team.
1) Wealthy Executives
These are some of the most affluent people in the UK. They live in wealthy, high status suburban, rural and semi-rural areas of the country. Houses tend to be large and detached with four or more bedrooms. Many are owned outright.
Households are a mix of middle-aged families, empty nesters and wealthy retired. They are very well-educated individuals with high levels of academic qualifications. Most are employed in senior managerial and professional occupations or are running their own businesses.
Car ownership is very high with most households having two or more cars, one of which is likely to be a high value company car.
Unsurprisingly, given their education and occupations, incomes are high as are levels of savings and investments. These consumers are financially sophisticated and purchase a wide range of financial products. They read the quality broadsheets and are likely to take two or more holidays a year.
In short, these are consumers with the money and the space to enjoy very comfortable lifestyles.
2) Urban Prosperity These are well educated people living in our major towns and cities. They include both older wealthy people living in the most exclusive parts of London and other cities, and highly educated younger professionals moving up the corporate ladder. This category also includes some well educated but less affluent individuals, such as students and graduates in their first job.
The wealthier people tend to be in senior managerial or professional careers, and often live in large terraced or detached houses with four or more bedrooms. Some of the younger professionals may be buying or renting flats. The less affluent will be privately renting.
These people have a cosmopolitan outlook and enjoy their urban lifestyle. They like to eat out in restaurants, go to the theatre and cinema and make the most of the culture and nightlife of the big city.
3) Comfortably Off This category contains much of ‘middle-of-the-road’ Britain. Most people are comfortably off. They may not be wealthy, but they have few major financial worries.
All life stages are represented in this category. Younger singles and couples, just starting out on their careers, are the dominant group in some areas. Other areas have mostly stable families and empty nesters, especially in suburban or semi-rural locations. Comfortably off pensioners, living in retirement areas around the coast or in the countryside, form the other main group in this category.
Most people own their own home, with owner occupation exceeding 80%. Most houses are semi-detached or detached. Employment is in a mix of professional and managerial, clerical and skilled occupations. Educational qualifications tend to be in line with the national average.
This category incorporates the home-owning, stable and fairly comfortable backbone

abc 3
4) Moderate Means This category contains much of what used to be the country’s industrial heartlands. Many people are still employed in traditional, blue-collar occupations. Others have become employed in service and retail jobs as the employment landscape had changed.
In the better off areas, incomes are in line with the national average and people have reasonable standards of living. However, in other areas, where levels of qualifications are low, incomes can fall below the national average. There are also some isolated pockets of unemployment and long-term illness.
This category also includes some neighbourhoods with very high concentrations of Asian families on low incomes.
Most housing is terraced, with two or three bedrooms, and largely owner occupied. It includes many former council houses, bought by their tenants in the 1980s.
Overall, the people in this category have modest lifestyles, but are able to get by.
5) Hard-Pressed This category contains the poorest areas of the UK. Unemployment is well above the national average. Levels of qualifications are low and those in work are likely to be employed in unskilled occupations. Household incomes are low and there are high levels of long-term illness in some areas.
Housing is a mix of low-rise estates, with terraced or semi-detached houses, and purpose built flats, including high-rise blocks. Properties tend to be small and there is much overcrowding. Over 50% of the housing is rented from the local council or a housing association.
There are a large number of single adult households, including many single pensioners and lone parents. In some neighbourhoods, there are high numbers of black and Asian residents.
These people are experiencing the most difficult social and economic conditions in the whole country, and appear to have limited opportunity to improve their circumstances.
3. Total Population / Shopper Population The total population is the number of people who live in the retail catchment area of a town or city. Shopper population is the number of people who regularly use a centre as a shopping destination ie. the numerical difference between total population and shopper population is the number of people who do not use a centre regularly for their shopping needs.
4. Retail Expenditure Data Data is provided by CACI, based on the Family Expenditure Survey.
The GB average figure for retail expenditure is £4,447.
• An index of 100 represents a retail spend comparable with the national average. • An index over 100 represents a retail spend greater than the national average • An index of less than 100 represents a retail spend less than the national average

abc 4
5. Retail Catchment Area Is the CACI gravity modelled retail catchment (based on the principles that: 1. People are more likely to visit larger, more attractive centres and 2. People are more likely to visit centres that are easily accessible to them (based on a combination of distance and drive time).
The retail catchment area is divided into trade areas:
• Primary – At least 50% of the trade of a centre • Secondary – At least 75% of trade of a centre • Tertiary – At least 90% of trade of a centre • Quaternary – The remaining trade of a centre.
6. VENUESCORE : Methodology We assess the retail offer of each shopping venue in the UK using a straightforward scoring system which takes account of the presence in each location of multiple retailers – including anchor stores, fashion operators and non-fashion multiples.
The score attached to each operator is weighted to reflect their overall impact on shopping patterns. For example, anchor stores such as John Lewis, Marks & Spencer and Debenhams receive a higher score than other unit store. The resulting aggregate score for each venue is called is VENUESCORE.
In addition to its VENUSCORE, each location is also assessed in terms of:-
• Market positioning (ie. is the offer aspirational or down-market?) • Age focus (ie. is the offer targeting younger or older consumers?) • Fashionability of its offer (ie. is the offer traditional or progressive?) • Shopping centre vs. high street dominated

abc 5
These location characteristics are described later in this introductory section.
The VENUSCORE reflects the presence and importance of the multiple retailers trading in each venue. These scores generally correlate quite closely with the actual market sizes of these shopping venues.
However, there are some notable exceptions. For example, the mega-malls such as Bluewater and Meadowhall generate market spending levels that are well in excess of their actual VENUESCORE. The same is true of several London venues, including Oxford Street as the most notable “outlier” to this rule.
7. Yield – as defined by VOA The yields quoted in the tables are ‘all risk yields’ calculated by dividing the annual rent, as though it had been received as a single sum at the year end, by the capital value or sale price of the property. The ‘all risks yield’ is a simple benchmark which the property market uses to assess the comparative attractiveness of different shopping centres. It is the ratio of rental income to capital value and is expressed in terms of the open market rent of a property as percentage of the capital value.
There has been considerable debate within the surveying profession concerning valuation methodology, and how valuation techniques reflect the timing of receipt of rental income. The historic approach was to assume that rents were received annually in arrears, a situation which rarely exists in today’s property market. Valuations and analysis of specific transactions should reflect the market and the way income is received. When this approach is adopted the resulting yield is called the true equivalent yield. The true equivalent yield reflects when rental income is actually received and is now being adopted by the surveying profession when preparing valuations.
This does not make the ‘all risks yield’ any less of a useful tool where it is being used as a simple benchmark to establish general market levels, as opposed to detailed analysis and valuations. The Shopping Centre Yields tables published in this report are there as benchmarks to provide a consistent basis for understanding how the property market assesses the comparative attractiveness of shop investments in different locations across the country.
In basic terms the lower the yield as discussed in Section 3.3 of the report, the more attractive the investment from the perspective of an investors and reflects the relationship between annual rent and capital value.

abc 6
Appendix B : Data Set
Table 1 Current Provision
Retail Type (as referred to in section 3.2 / Figure). Source : Experian Goad 2007
Figures provided in Sq. Ft.
Manchester Preston Southport Stockport Bolton Blackburn Bury Wigan
Comparison 1,650,400 873,600 668,600 873,900 801,300 443,200 692,600 552,700
Convenience 192,700 114,000 169,500 172,800 308,000 206,000 195,100 116,700
Vacant Retail 502,600 230,000 212,300 157,000 157,200 60,400 105,900 139,600
Retail Service 556,600 159,300 109,400 51,300 119,200 73,900 110,800 49,600
Total Retail 2,902,300 1,376,900 1,159,800 1,255,000 1,385,700 783,500 1,104,400 858,600
Comparison % 57 63 58 70 58 57 63 64
Convenience % 7 8 15 14 22 26 18 14
Retail Service % 4 12 9 4 9 9 10 6
Vacant Retail % 13 19 16 8 12 9 10 15

abc 7
Sq ft Bolton Bury Stockport Preston Manchester Wigan Southport Blackburn
0-1000 113 78 107 163 117 127 158 88
1001-2500 114 94 89 144 135 86 148 102
2501-5000 26 24 29 42 48 22 44 22
5000+ 35 15 30 31 30 23 26 19
Total: 288 211 255 380 330 258 376 231
0-1000 39% 37% 42% 43% 35% 49% 42% 38%
1001-2500 40% 45% 35% 38% 41% 33% 39% 44%
2501-5000 9% 11% 11% 11% 15% 9% 12% 10%
5000+ 12% 7% 12% 8% 9% 9% 7% 8%

abc 8
Table 2 Development Schedule
As referred to in 3.2 & 3.5. Source : Jones Lang LaSalle
Town Scheme Developer Net add retail Flsp – 000s sq ft gross
Stage Type Comments
Market Place Shopping Centre
Warner Estates, Agora 96 FPPG SC Redevelopment of market hall to provide 96,416 sq ft of additional floorspace – H&M and Zara have both taken pre-lets
Bolton Central Street Wilson Bowden 300 OPPG SC 300k Shopping centre to include 80K sq ft superstore. Public
enquiry decision pending.
The Rock Thornfield Properties 369 FPPG SC Large mixed use scheme on fringe of existing TC including retail, leisure, residential, community uses. Debenhams signed as anchor. Bury
Hornby Buildings Thornfield Properties 24 FPPG UNI Retail and leisure scheme including nightclub
Mill Gate Shopping Centre Scottish Widows 377 Pre-appl SC Proposed 377K sq ft extension to shopping centre, no application; SC acquired by Scottish Widows, plans on hold
3 Piccadilly Place Argent Group 27 U/C UNI Hotel, offices and retail – near Piccadilly Station
Amethyst House, ‘Forty Spring Gardens’
Langtree Group 13 U/C UNI Redevelopment for offices & ground floor retail near King Street East
Piccadilly Plaza Ph B aka City Tower
Bruntwood Estates U/C SC 2nd phase of redevelopment/refurbishment of 1960’s office & retail, to give total 124K sq ft refurbished retail floorspace, new units at u/c at base of office tower
Manchester
Royal Exchange Quintain Estates U/C SC Redevelopment on 2 levels to create 15 retail units, restaurant and spa

abc 9
Town Scheme Developer Net add retail Flsp – 000s sq ft gross
Stage Type Comments
Spinningfields Central Site Allied London Properties
36 FPPG UNI Office & Hotel scheme, incl. retail on part of Spinningfield site
Preston Fishergate Centre Warner Estate Holdings 180 FPPG SC 180K sq ft extension to shopping centre to provide retail/A3/leisure
outlets – CPO to be initiated
Tithebarn Preston City Council,
Grosvenor Estate 700 Pre-appl SC Major shopping centre development to be anchored 230K sq ft
John Lewis department store. TPA expected late 2007
Stockport Bridgefield Regeneration Project
Stockport MBC, Lend Lease
659 Pre-appl SC Major regeneration project to extend town centre to provide 1m sq ft retail – development agreement signed
Blackburn
Blackburn Shopping Centre
The Mall Corporation 104 OPPG SC 104,000 sq ft retail extension to include 20 new stores. Start planned early 2007. 30K pre-let to Primark and 70K pre-let to Blackburn markets
Wigan
Grand Arcade Wigan Metropolitan Borough Council
484 On-site SC Planned opening 2007. Anchor stores include Debenhams, BHS, and M&S. Further residential, leisure and hotel phases are proposed
abc 10
Table 3
Shopping Centre Yields : (as referred to in section 3.3). Source : VOA. Property Market Report. 2007.
Shopping Centre 1/4/00 1/10/00 1/4/01 1/10/01 1/4/02 1/10/02 1/4/03 1/1/04 1/7/04 1/1/05 1/7/05 1/1/06 1/7/06 1/1/07
Yield Yield Yield Yield Yield Yield Yield Yield Yield Yield Yield Yield Yield Yield
Bolton
Bolton 5.75 6 6 6 6.25 6.25 6.25 6.25 6.25 6.5 6.5 6 6 6 Bury 6.25 6.5 6.5 6.5 6.75 6.75 6.75 6.75 6.75 7 7 6 5.75 5.75 Farnworth 10.5 11 11 11 >=10 >=10 >=10 >=10 >=10 >=10 >=10 8.75 8 8
Burnley Blackburn 7 7 7 7 7 7 7 7 7 7 7 7 7 7 Burnley 7.5 7.25 7.25 7.25 7.25 7.25 7.25 7.25 7.25 7.25 7.25 7.25 7.25 7.25 Accrington 9 9 9 9 7.75 7.75 8 8 8 8 8 8 8 8
Darwen 10 10 10 10 >=10 >=10 >=10 >=10 >=10 >=10 >=10 >=10 >=10 >=10
Nelson 11 11.5 11.5 11.5 >=10 >=10 >=10 >=10 >=10 >=10 >=10 >=10 >=10 >=10
Rawtenstall 10.5 10.5 10.5 10.5 >=10 >=10 >=10 >=10 >=10 >=10 >=10 >=10 >=10 >=10
Carlisle
Carlisle 6 6 6 6 6 6 6 5 5.5 5.5 5 5 5 4.75
Penrith 8 8 8 8 8 8 8 8 8 8 8 8 8 6.75
Workington 10 10 10 10 >=10 >=10 >=10 >=10 >=10 >=10 >=10 >=10 >=10 6.75
Chester
Chester 5 5 5 5 5 5 5.5 5.5 5.5 5.75 5.75 5 5 5
Birkenhead 7 7 7 7 7 7 7 7 7 7 6.75 6 6 6
Wallasey 11 11 11 11 >=10 >=10 >=10 >=10 >=10 >=10 >=10 8 8 8
Ellesmere Port 10 10 10 10 >=10 >=10 >=10 >=10 >=10 >=10 >=10 8 8 8

abc 11
Shopping Centre 1/4/00 1/10/00 1/4/01 1/10/01 1/4/02 1/10/02 1/4/03 1/1/04 1/7/04 1/1/05 1/7/05 1/1/06 1/7/06 1/1/07
Heswall 10.5 10.5 10.5 10.5 >=10 >=10 >=10 >=10 >=10 >=10 >=10 8 8 8
Crewe
Crewe 8 9 8 8 8 7.75 7.5 7.5 7.5 7.5 7.5 6.75 6.75 6.50
Wilmslow 8.5 8.75 9 8.5 8 7.5 7.5 7.5 7.5 7.5 7.5 6.75 6.5 6.00
Macclesfield 7 8 7.75 7.75 7.75 7.5 7.5 7.5 7.5 7.5 7.5 6.75 6.5 6.00
Northwich 9.5 9.5 9.5 9 8.75 8.75 8.5 8.5 8.5 8.5 7.5 6.75 6.75 6.25
Nantwich 8.5 9 9 8.5 8.5 8.5 8.5 8.5 8.5 8.5 7.5 6.75 6.75 6.25
Knutsford 8 8 8 8 8 8 8 8 8 8 7.5 6.75 6.5 6.00
Congleton 8.5 8.5 8.5 9 9 9 9 9 9 9 8 6.75 6.75 6.25
Winsford 9 9 9 9 9 9 9 9 9 9 7.5 6.75 6.75 6.25
Lancaster
Blackpool - Central 5.75 5.75 5.75 5.75 5.75 6 6 6 6 6 6 5 5 5
Lancaster 6.5 6.5 6.5 6.5 6.5 6.5 6.5 6.5 6.5 6.5 5.5 5.5 5.5 5.5
Lytham St Annes 9 9 9 9 9 >=10 >=10 9 9 8 8 8 8 8
Morecambe 13 13 13 13 >=10 >=10 >=10 >=10 >=10 >=10 >=10 >=10 >=10 >=10
Fleetwood 14 14 14 14 >=10 >=10 >=10 >=10 >=10 >=10 >=10 >=10 >=10 >=10
Cleveleys 8.5 8.5 8.5 8.5 8.5 8.5 8.5 8.5 8.5 8.5 8.5 8.5 8.5 8.5
Liverpool
Liverpool - City 5.25 5.25 5.25 5.25 5.25 5.25 5.25 5.25 5.25 5.25 5.25 4.75 4.75 4.75
Southport 6.25 6.25 6.25 6.25 6.25 7 7 7 7 7 7 6.25 6.25 6.25 Bootle 8.5 8.5 8.5 8.5 8.5 8.5 8.5 8.5 8.5 8.5 8.5 7.25 7.25 7.25
Liverpool - Allerton Road 11 11 11 11 >=10 >=10 >=10 >=10 >=10 >=10 >=10 8.5 8 8
Liverpool - Walton Vale 10 10 10 10 >=10 >=10 >=10 >=10 >=10 >=10 >=10 8.5 8 8
Liverpool - Waterloo 13.5 13.5 13.5 13.5 >=10 >=10 >=10 >=10 >=10 >=10 >=10 9 8.5 8.5

abc 12
Shopping Centre 1/4/00 1/10/00 1/4/01 1/10/01 1/4/02 1/10/02 1/4/03 1/1/04 1/7/04 1/1/05 1/7/05 1/1/06 1/7/06 1/1/07
Liverpool - Belle Vale 12 12 12 12 >=10 >=10 >=10 >=10 >=10 >=10 >=10 9 8.5 8.5
Manchester Manchester - City 4.25 4.25 4.25 4.25 4.25 4.25 5.5 5.5 5.5 6 6 4.5 4.5 4.25 Wythenshawe 13.5 13.5 13.5 14 >=10 >=10 >=10 >=10 >=10 >=10 >=10 9 9 9
Rochdale 6.75 6.75 6.75 6.75 7.5 7.5 7.5 7.5 7.5 7.5 7.5 6.5 6 6
Oldham 6.75 6.75 6.75 6.75 7.5 7.5 7.5 7.5 7.5 7.5 7.5 6.5 6 6
Preston Preston 5.5 5.5 5.5 5.5 5.5 6.5 6 6 6 6 6 6 6 6 Ormskirk 7 7 7 7 7 7 7 7 7 7 7 7 7 7
Chorley 7 7 7 7 7 7 7 7 7 7 7 7 7 7
Skelmersdale 9 9 9 9 9 9 9 9 9 9 9 9 9 9
Salford Altrincham 7.5 8 8 8 8 8 8 8 8 8.25 8.5 6.5 6.5 6.25
Stretford 10 10 11 11 >=10 >=10 >=10 >=10 >=10 >=10 >=10 8 7.75 7.75
Salford 10 10 10 10 >=10 >=10 >=10 >=10 >=10 >=10 >=10 8 8 8
Eccles 12 12 12 12 >=10 >=10 >=10 >=10 >=10 >=10 >=10 7.5 7 7
Sale 9 9 9 9 >=10 9 9 9 9 9 9 6.5 6.5 6.5
Stockport
Stockport 5.5 5.5 5.5 5.5 5.5 5.5 5.5 5.5 5.5 6 6 5.5 5.5 5.5 Ashton Under Lyne 7 7 7 7 7 7 7 7 7 7 7.5 6.25 6.25 6.25
Hyde 7.5 7.5 7.5 7.5 7 7 7 7 7 7 7.5 6.75 6.5 6.5
Warrington Warrington 6.5 6.5 6.5 6.5 6.5 6.5 6.5 6.5 6.5 6.25 6.25 5.75 5.75 5.75
St Helens 7 7 7 7 7 7 7 7 7 7 7 6.5 6.5 6.25

abc 13
Shopping Centre 1/4/00 1/10/00 1/4/01 1/10/01 1/4/02 1/10/02 1/4/03 1/1/04 1/7/04 1/1/05 1/7/05 1/1/06 1/7/06 1/1/07
Wigan 7 7 7 7 7 7 7 7 7 7 7 7 6 6 Runcorn 11.5 11.5 11.5 11.5 >=10 >=10 >=10 >=10 >=10 >=10 >=10 8 8 8
Widnes 8.5 8.5 8.5 8.5 8.5 8.5 8.5 8.5 8.5 8.5 8.5 7.25 7.25 7.25
Leigh 7.5 7.5 8 8 8 8 8 8 8 8 8 7.5 7.5 7.5
Ulverston Kendal 7.5 7.5 7.5 7.5 7.5 7.5 6.5 7 7 7 6 6 6 8
Barrow-in-Furness 8 8 8 8.75 8.75 8.75 8 9 9 9 8 7.5 7.5 7.5
Whitehaven 9.5 9.5 9.5 10 >=10 >=10 >=10 >=10 >=10 10 8 7.5 7.5 7.5
Ulverston 9.5 9.5 9.5 9.5 9.5 9.5 9 >=10 >=10 10 >=10 >=10 >=10 >=10
Table 4
Shopping Rents: (as referred to in section 3.3). Source : VOA. Property Market Report. 2007.
Shopping Centre 04/01 10/01 04/02 10/02 04/03 01/03 01/04 07/04 01/05 07/05 01/06 07/06 01/07
Bolton £ Zone A Rents*
£ Zone A Rents*
£ Zone A Rents*
£ Zone A Rents*
£ Zone A Rents*
£ Zone A Rents*
£ Zone A Rents*
£ Zone A Rents*
£ Zone A Rents*
£ Zone A Rents*
£ Zone A Rents*
£ Zone A Rents*
£ Zone A Rents*
Bolton 139.36 139.36 139.36 139.36 148.65 n/a 148.65 148.65 148.65 148.65 155.61 155.61 155.61 Manchester 278.71 292.65 292.65 292.65 315.87 n/a 325.16 325.16 325.16 325.16 325.16 278.71 278.71
Stockport 185.81 185.81 195.10 199.74 199.74 n/a 199.74 199.74 199.74 199.74 209.03 209.03 209.03
Blackburn 120.77 120.77 120.77 120.77 130.06 n/a 130.06 130.06 130.06 130.06 130.06 130.06 130.06
Preston 123.10 123.10 123.10 123.10 130.06 n/a 130.06 130.06 130.06 130.06 130.06 130.06 130.06
Wigan 74.32 74.32 74.32 74.32 74.32 n/a 83.61 83.61 92.90 92.90 92.90 88.26 88.26
Southport n/a n/a n/a n/a n/a n/a n/a n/a n/a n/a n/a n/a n/a
Bury n/a n/a n/a n/a n/a n/a n/a n/a n/a n/a n/a n/a n/a

abc 14
Table 5
Prime Rents : (as referred to in section 3.3). Source : Jones Lang LaSalle, 2007 .
Town Zone A Prime Yield
Manchester £300 4.20% Preston £130 4.75% Southport £100 4.75% Stockport £190 4.75% Bolton £150 4.75% Blackburn £130 5.00% Bury £125 5.00% Wigan £120 5.00%

abc 15
Table 6
Bolton Specfic Requirements
Min (sq ft)
Max (sq ft) Description Bolton Specific High St /OOT Date
1,000 4,500 Outerwear Yes High St Unknown 700 1,500 Maternity and babies Yes High St Unknown
1,000 1,400 Footwear Yes High St Unknown 1,000 2,800 Homewear Yes High St Unknown 1,000 3,000 High-street fashion Yes High St Unknown
500 2,500 Footwear Yes High St Unknown 700 1,800 Coffee house Yes High St Unknown
2,000 4,000 Lifestyle retailer Yes High St May-07 1,500 3,000 Entertainment Yes High St Apr-07
650 650 Audio & Video Yes High St Apr-07 1,000 1,800 Fast Food Yes High St Apr-07 2,000 3,000 Frozen food Yes High St Apr-07 2,500 6,000 Discount Yes High St Feb-07 1,200 2,000 E-bay goods Yes High St Feb-07 2,500 4,000 Fast food Yes High St Jan-07 2,000 2,000 Men's formal wear Yes High St Nov-07 3,000 4,000 High St Fashion Yes High St Oct-07
15,000 20,000 Cash & Carry Yes Out-of-Town Feb-07 3,000 6,000 Tiles Yes Out-of-Town Mar-07
10,000 10,000 Yes Out-of-Town Jan-07
abc 16
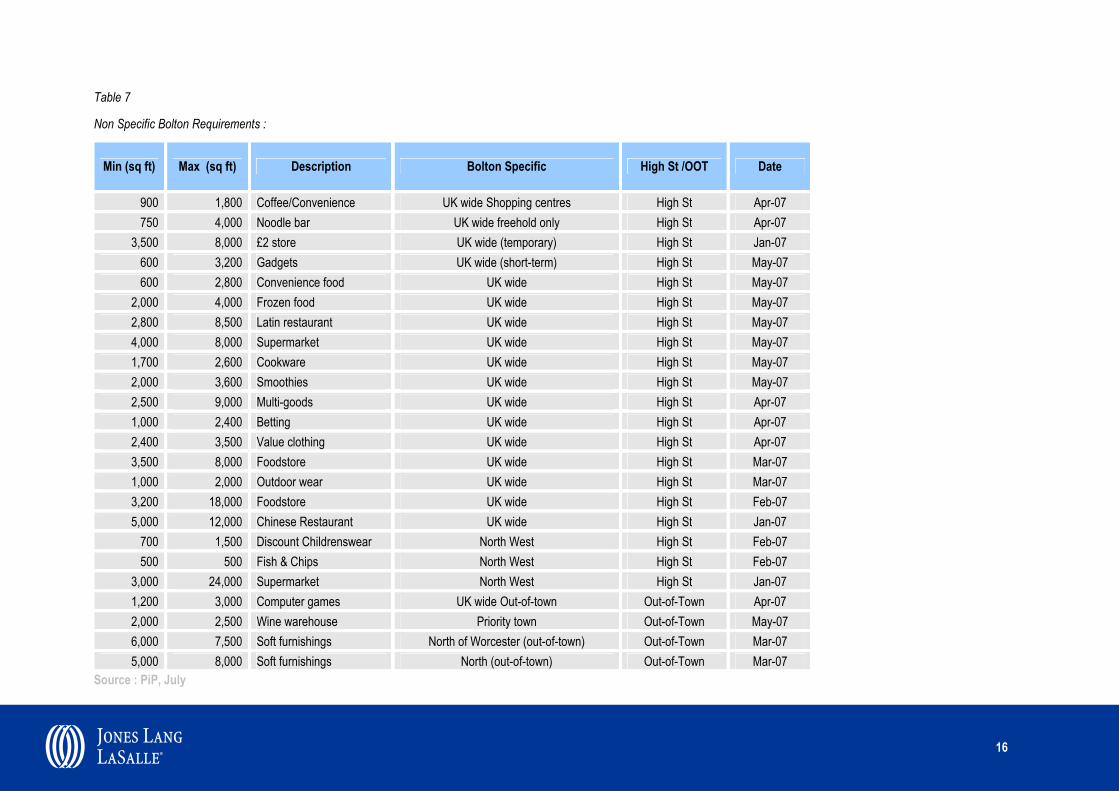
Table 7
Non Specific Bolton Requirements :
Min (sq ft) Max (sq ft) Description Bolton Specific High St /OOT Date
900 1,800 Coffee/Convenience UK wide Shopping centres High St Apr-07 750 4,000 Noodle bar UK wide freehold only High St Apr-07
3,500 8,000 £2 store UK wide (temporary) High St Jan-07 600 3,200 Gadgets UK wide (short-term) High St May-07 600 2,800 Convenience food UK wide High St May-07
2,000 4,000 Frozen food UK wide High St May-07 2,800 8,500 Latin restaurant UK wide High St May-07 4,000 8,000 Supermarket UK wide High St May-07 1,700 2,600 Cookware UK wide High St May-07 2,000 3,600 Smoothies UK wide High St May-07 2,500 9,000 Multi-goods UK wide High St Apr-07 1,000 2,400 Betting UK wide High St Apr-07 2,400 3,500 Value clothing UK wide High St Apr-07 3,500 8,000 Foodstore UK wide High St Mar-07 1,000 2,000 Outdoor wear UK wide High St Mar-07 3,200 18,000 Foodstore UK wide High St Feb-07 5,000 12,000 Chinese Restaurant UK wide High St Jan-07
700 1,500 Discount Childrenswear North West High St Feb-07 500 500 Fish & Chips North West High St Feb-07
3,000 24,000 Supermarket North West High St Jan-07 1,200 3,000 Computer games UK wide Out-of-town Out-of-Town Apr-07 2,000 2,500 Wine warehouse Priority town Out-of-Town May-07 6,000 7,500 Soft furnishings North of Worcester (out-of-town) Out-of-Town Mar-07 5,000 8,000 Soft furnishings North (out-of-town) Out-of-Town Mar-07
Source : PiP, July