BMI-1 Expression Heterogeneity in Endometriosis-Related ...
14
International Journal of Molecular Sciences Article BMI-1 Expression Heterogeneity in Endometriosis-Related and Non-Endometriotic Ovarian Carcinoma Ludmila Lozneanu 1,2,† , Raluca Anca Balan 1,3,† , Ioana Păvăleanu 4 , Simona Eliza Giu¸ scă 1,5 , Irina-Draga Căruntu 1,5, * and Cornelia Amalinei 1,6 Citation: Lozneanu, L.; Balan, R.A.; P˘ av˘ aleanu, I.; Giu¸ sc˘ a, S.E.; C ˘ aruntu, I.-D.; Amalinei, C. BMI-1 Expression Heterogeneity in Endometriosis-Related and Non-Endometriotic Ovarian Carcinoma. Int. J. Mol. Sci. 2021, 22, 6082. https://doi.org/10.3390/ ijms22116082 Academic Editor: Antonio Simone Laganà Received: 26 April 2021 Accepted: 30 May 2021 Published: 4 June 2021 Publisher’s Note: MDPI stays neutral with regard to jurisdictional claims in published maps and institutional affil- iations. Copyright: © 2021 by the authors. Licensee MDPI, Basel, Switzerland. This article is an open access article distributed under the terms and conditions of the Creative Commons Attribution (CC BY) license (https:// creativecommons.org/licenses/by/ 4.0/). 1 Department of Morpho-Functional Sciences I–Histology, Pathology, “Grigore T. Popa” University of Medicine and Pharmacy, 700115 Iasi, Romania; ludmila.lozneanu@umfiasi.ro (L.L.); raluca.balan@umfiasi.ro (R.A.B.); [email protected] (S.E.G.); cornelia.amalinei@umfiasi.ro (C.A.) 2 Department of Pathology, “Sf. Spiridon” County Clinical Emergency Hospital, 700111 Iasi, Romania 3 Department of Pathology, “Elena Doamna” Obstetrics and Gynecological Hospital, 700398 Iasi, Romania 4 Department of Mother and Child Medicine, “Grigore T. Popa” University of Medicine and Pharmacy, 700115 Ia¸ si, Romania; [email protected] 5 Department of Pathology, “Dr. C. I. Parhon” University Hospital, 700503 Iasi, Romania 6 Department of Histopathology, Institute of Legal Medicine, 700455 Iasi, Romania * Correspondence: [email protected] † These authors contributed equally to this work. Abstract: BMI-1 is a key component of stem cells, which are essential for normal organ development and cell phenotype maintenance. BMI-1 expression is deregulated in cancer, resulting in the alteration of chromatin and gene transcription repression. The cellular signaling pathway that governs BMI-1 action in the ovarian carcinogenesis sequences is incompletely deciphered. In this study, we set out to analyze the immunohistochemical (IHC) BMI-1 expression in two different groups: endometriosis- related ovarian carcinoma (EOC) and non-endometriotic ovarian carcinoma (NEOC), aiming to identify the differences in its tissue profile. Methods: BMI-1 IHC expression has been individually quantified in epithelial and in stromal components by using adapted scores systems. Statistical analysis was performed to analyze the relationship between BMI-1 epithelial and stromal profile in each group and between groups and its correlation with classical clinicopathological characteristics. Results: BMI-1 expression in epithelial tumor cells was mostly low or negative in the EOC group, and predominantly positive in the NEOC group. Moreover, the stromal BMI-1 expression was variable in the EOC group, whereas in the NEOC group, stromal BMI-1 expression was mainly strong. We noted statistically significant differences between the epithelial and stromal BMI-1 profiles in each group and between the two ovarian carcinoma (OC) groups. Conclusions: Our study provides solid evidence for a different BMI-1 expression in EOC and NEOC, corresponding to the differences in their etiopathogeny. The reported differences in the BMI-1 expression of EOC and NEOC need to be further validated in a larger and homogenous cohort of study. Keywords: ovarian cancer; endometriosis; BMI-1; epithelial tumor cells; stroma 1. Introduction Ovarian cancer (OC) is a gynecological malignancy that commonly originates from the ovaries, fallopian tubes, and peritoneum [1] and is considered as the most lethal malignancy with a high rate of chemoresistance and relapses. Regarding their histology, 90% of ovarian tumors are of the epithelial type [2]. Endometriosis represents a precursor lesion for certain types of epithelial OC, be- ing related to microenvironment changes (such as estrogen production and dependency, progesterone resistance, and inflammation), which lead to genetic alterations and/or ge- netic susceptibilities that favour endometriosis-associated ovarian carcinogenesis [2–4]. It has been demonstrated that ovarian endometriosis, ovarian atypical endometriosis, and Int. J. Mol. Sci. 2021, 22, 6082. https://doi.org/10.3390/ijms22116082 https://www.mdpi.com/journal/ijms
Transcript of BMI-1 Expression Heterogeneity in Endometriosis-Related ...

International Journal of
Molecular Sciences
Article
BMI-1 Expression Heterogeneity in Endometriosis-Related andNon-Endometriotic Ovarian Carcinoma
Ludmila Lozneanu 1,2,†, Raluca Anca Balan 1,3,† , Ioana Păvăleanu 4, Simona Eliza Giuscă 1,5 ,Irina-Draga Căruntu 1,5,* and Cornelia Amalinei 1,6
�����������������
Citation: Lozneanu, L.; Balan, R.A.;
Pavaleanu, I.; Giusca, S.E.; Caruntu,
I.-D.; Amalinei, C. BMI-1 Expression
Heterogeneity in Endometriosis-Related
and Non-Endometriotic Ovarian
Carcinoma. Int. J. Mol. Sci. 2021, 22,
6082. https://doi.org/10.3390/
ijms22116082
Academic Editor: Antonio Simone
Laganà
Received: 26 April 2021
Accepted: 30 May 2021
Published: 4 June 2021
Publisher’s Note: MDPI stays neutral
with regard to jurisdictional claims in
published maps and institutional affil-
iations.
Copyright: © 2021 by the authors.
Licensee MDPI, Basel, Switzerland.
This article is an open access article
distributed under the terms and
conditions of the Creative Commons
Attribution (CC BY) license (https://
creativecommons.org/licenses/by/
4.0/).
1 Department of Morpho-Functional Sciences I–Histology, Pathology,“Grigore T. Popa” University of Medicine and Pharmacy, 700115 Iasi, Romania;[email protected] (L.L.); [email protected] (R.A.B.); [email protected] (S.E.G.);[email protected] (C.A.)
2 Department of Pathology, “Sf. Spiridon” County Clinical Emergency Hospital, 700111 Iasi, Romania3 Department of Pathology, “Elena Doamna” Obstetrics and Gynecological Hospital, 700398 Iasi, Romania4 Department of Mother and Child Medicine, “Grigore T. Popa” University of Medicine and Pharmacy,
700115 Iasi, Romania; [email protected] Department of Pathology, “Dr. C. I. Parhon” University Hospital, 700503 Iasi, Romania6 Department of Histopathology, Institute of Legal Medicine, 700455 Iasi, Romania* Correspondence: [email protected]† These authors contributed equally to this work.
Abstract: BMI-1 is a key component of stem cells, which are essential for normal organ developmentand cell phenotype maintenance. BMI-1 expression is deregulated in cancer, resulting in the alterationof chromatin and gene transcription repression. The cellular signaling pathway that governs BMI-1action in the ovarian carcinogenesis sequences is incompletely deciphered. In this study, we set outto analyze the immunohistochemical (IHC) BMI-1 expression in two different groups: endometriosis-related ovarian carcinoma (EOC) and non-endometriotic ovarian carcinoma (NEOC), aiming toidentify the differences in its tissue profile. Methods: BMI-1 IHC expression has been individuallyquantified in epithelial and in stromal components by using adapted scores systems. Statisticalanalysis was performed to analyze the relationship between BMI-1 epithelial and stromal profile ineach group and between groups and its correlation with classical clinicopathological characteristics.Results: BMI-1 expression in epithelial tumor cells was mostly low or negative in the EOC group, andpredominantly positive in the NEOC group. Moreover, the stromal BMI-1 expression was variablein the EOC group, whereas in the NEOC group, stromal BMI-1 expression was mainly strong. Wenoted statistically significant differences between the epithelial and stromal BMI-1 profiles in eachgroup and between the two ovarian carcinoma (OC) groups. Conclusions: Our study provides solidevidence for a different BMI-1 expression in EOC and NEOC, corresponding to the differences intheir etiopathogeny. The reported differences in the BMI-1 expression of EOC and NEOC need to befurther validated in a larger and homogenous cohort of study.
Keywords: ovarian cancer; endometriosis; BMI-1; epithelial tumor cells; stroma
1. Introduction
Ovarian cancer (OC) is a gynecological malignancy that commonly originates from theovaries, fallopian tubes, and peritoneum [1] and is considered as the most lethal malignancywith a high rate of chemoresistance and relapses. Regarding their histology, 90% of ovariantumors are of the epithelial type [2].
Endometriosis represents a precursor lesion for certain types of epithelial OC, be-ing related to microenvironment changes (such as estrogen production and dependency,progesterone resistance, and inflammation), which lead to genetic alterations and/or ge-netic susceptibilities that favour endometriosis-associated ovarian carcinogenesis [2–4]. Ithas been demonstrated that ovarian endometriosis, ovarian atypical endometriosis, and
Int. J. Mol. Sci. 2021, 22, 6082. https://doi.org/10.3390/ijms22116082 https://www.mdpi.com/journal/ijms

Int. J. Mol. Sci. 2021, 22, 6082 2 of 14
endometriosis-related OC (EOC) share the same genetic alterations and express clonality,while the ovarian malignant endometriosis-associated phenotype is promoted by chronicinflammation, which provides permanent mutations and nonpermanent cytokine pro-duction [2]. The different clinicopathological features and distinct mutational statusesjustify the classification of OC into EOC, represented mainly by clear cell and endometrioidsubtypes, and non-endometriotic OC (NEOC) [5].
OC is commonly diagnosed in advanced stages III and IV when the tumor has ahigh potential of metastasis [6]. Therefore, the early detection of OC by using differentbiomarkers is an important clinical desideration. Concomitantly, the researchers’ interestis directed towards a deep insight into the genetic and molecular substrate of ovariancarcinogenesis, aiming not only to understand the sequence of carcinogenic events, butalso to identify new potential prognostic factors and therapeutic targets. The exclusiverecent list of potential candidate biomarkers includes molecules expressed by the cancerstem and stem-like cells [7], BMI-1 protein being one of them [8,9]. BMI-1 protein, a stem-like marker, represents a homologue of the Drosophila polycomb group of proteins, andits role is the regulation of homeotic genes expression by transcription repression [10].The BMI-1 gene has been initially isolated as an oncogene, which cooperates with c-Myc in lymphoma experimental models [11]. It belongs to the Polycomb-group (PcG) ofproteins, which are involved in axial pattern establishment, hematopoiesis, cementogenesis,and senescence [11].
Considering BMI-1’s involvement in cellular proliferation and tumor progression, this genehas been identified, as expected, in a large variety of human tumors, such as: lymphoma [12–14],brain [15], prostate [16], oropharynx and nasopharynx [10,17,18], breast [19,20], bladder [11],gastric [21], pancreas [22], esophagus [23], lungs [24,25], head and neck cancers [26],malignant melanoma [27], pleomorphic adenoma [28], and also displaying a prognosisvalue in mielodysplastic syndromes [29] and in gallbladder cancer [30]. Although its actionhas been initially thought to be achieved by p16 suppressor gene repression, subsequentstudies have demonstrated another specific mechanism of action by intercellular adhesionpathway modulation [31].
Limited information is available about BMI-1 in OC, as few studies address this topic,mainly providing experimental evidences [10,32–41]. BMI-1 increased expression mirrorsan early and maybe reversible event in carcinogenesis [10], suggestive for an invasive andaggressive phenotype during tumor development [10,42]. It is demonstrated that BMI-1regulates cell cycle and promotes cell proliferation, which has self-renewal and differentia-tion potential [9], acts as a potential modulator of cellular adhesion in endometriotic tumorcells, and alters endometrial stromal cells by changing microenvironment interactions inOC [43]. Several results support its potential value as an independent predictor for pooroutcomes [39] and as a possible new therapeutic target in chemoresistant OC [7,9,33,40,41].
Currently, there is a high interest in a better understanding and characterization ofEOC, in an attempt to provide a different clinical and therapeutic management comparedto that of NEOC. In this regard, the purpose of our study was to evaluate the immunohisto-chemical (IHC) BMI-1 expression in two different groups of OC (associated or not withendometriosis), aiming to identify the differences in its tissue profile. The novelty of thisresearch consisted in a double assessment of BMI-1, in tumor epithelial cells and stromalcells, following the potentiation relationship of these two cell types in tumor progression.Nevertheless, the BMI-1 expression was correlated with clinicopathological data that offera solid functional image of the tumor progression.
2. Results2.1. BMI-1 Expression—Qualitative Assessment
The qualitative evaluation showed, at a glance, a heterogeneous expression in bothgroups, without a specific pattern for each group.
A double BMI-1 staining was found: a nuclear and cytoplasmic/membrane immu-noexpression in EOC group. Strong expression of epithelial cells was observed in cases

Int. J. Mol. Sci. 2021, 22, 6082 3 of 14
with poor prognosis, such as high-grade serous and endometrioid carcinomas (HGSCsand HGECs), as well in clear cell ovarian carcinomas (COCs). A negative BMI-1 stromaexpression in the endometrioid phenotype of EOC group was found, while positive stromawas dominant in the serous phenotype, clear cell and mixed subtypes. Relevant aspects ofBMI-1 expression in EOC are presented in Figure 1.
In the NEOC group, the intensity of BMI-1 was predominantly moderate or strongin epithelial (nuclear or cytoplasmic/membrane immunoexpression) and stromal cells.Moderate and strong nuclear expression and weaker cytoplasmic expression was observedin cases with a serous phenotype and a more aggressive course, such as HGSC, whilethe endometrioid phenotype preserved a strong, diffuse, membrane BMI-1 staining. Inundifferentiated carcinomas, BMI-1 expression was heterogeneous, displaying a weakcytoplasmic staining. Differences between BMI-1 expression in variable types of NEOC areillustrated in Figure 2.
We also noted the lack of BMI-1 expression in normal ovary or ovarian surface, andits positivity in the normal tubal surface epithelium.
2.2. BMI Expression—Semi-Quantitative Assessment
In the whole group of study, without division into EOC and NEOC categories, the BMI-1 semi-quantitative assessment showed the following: a high expression in 31 cases (65.96%)and a low expression in 16 cases (34.04%), in tumor cells, along with immunopositivityin 34 cases (72.34%), and immunonegativity in 13 cases (27.65%) in tumor stroma. Thestatistical analysis revealed significant correlations between BMI-1 expression in epithelialtumor cells (low/high) versus tumor stroma (negative/positive) (p = 0.01).
Int. J. Mol. Sci. 2021, 22, x FOR PEER REVIEW 3 of 15
The qualitative evaluation showed, at a glance, a heterogeneous expression in both groups, without a specific pattern for each group.
A double BMI-1 staining was found: a nuclear and cytoplasmic/membrane immunoexpression in EOC group. Strong expression of epithelial cells was observed in cases with poor prognosis, such as high-grade serous and endometrioid carcinomas (HGSCs and HGECs), as well in clear cell ovarian carcinomas (COCs). A negative BMI-1 stroma expression in the endometrioid phenotype of EOC group was found, while positive stroma was dominant in the serous phenotype, clear cell and mixed subtypes. Relevant aspects of BMI-1 expression in EOC are presented in Figure 1.
In the NEOC group, the intensity of BMI-1 was predominantly moderate or strong in epithelial (nuclear or cytoplasmic/membrane immunoexpression) and stromal cells. Moderate and strong nuclear expression and weaker cytoplasmic expression was observed in cases with a serous phenotype and a more aggressive course, such as HGSC, while the endometrioid phenotype preserved a strong, diffuse, membrane BMI-1 staining. In undifferentiated carcinomas, BMI-1 expression was heterogeneous, displaying a weak cytoplasmic staining. Differences between BMI-1 expression in variable types of NEOC are illustrated in Figure 2.
We also noted the lack of BMI-1 expression in normal ovary or ovarian surface, and its positivity in the normal tubal surface epithelium.
(a) (b)
(c) (d)
Figure 1. Cont.

Int. J. Mol. Sci. 2021, 22, 6082 4 of 14
1
(e) (f)
Figure 1. (a–f) Histologic features and BMI-1 expression in EOC group in different ovarian tumor subtypes: (a,b) HGSC:(a) papillary growth, enlarged and irregular nuclei, prominent nucleoli, high cellular size and shape (hematoxylin andeosin–H&E, magnification 10×), (b) strong BMI-1 nuclear staining in epithelial tumor cells of HGSC (magnification10×); (c,d) HGEC: (c) crowded back-to-back glands, lined by atypical columnar epithelium, and smooth luminal borders(H&E, magnification 10×), (d) weak BMI-1 cytoplasmic staining in epithelial tumor cells of HGEC (magnification 10×);(e,f) COC: (e) papillary and tubulocystic pattern, combined with clear and eosinophilic cells and stromal hyalinization(H&E, magnification 10×), (f) strong BMI-1 cytoplasmic staining of tumor cells and stroma in COC (magnification 10×).
Int. J. Mol. Sci. 2021, 22, x FOR PEER REVIEW 4 of 15
(e) (f)
Figure 1. (a–f) Histologic features and BMI-1 expression in EOC group in different ovarian tumor subtypes: (a,b) HGSC: (a) papillary growth, enlarged and irregular nuclei, prominent nucleoli, high cellular size and shape (hematoxylin and eosin–H&E, magnification 10×), (b) strong BMI-1 nuclear staining in epithelial tumor cells of HGSC (magnification 10×); (c,d) HGEC: (c) crowded back-to-back glands, lined by atypical columnar epithelium, and smooth luminal borders (H&E, magnification 10×), (d) weak BMI-1 cytoplasmic staining in epithelial tumor cells of HGEC (magnification 10×); (e,f) COC: (e) papillary and tubulocystic pattern, combined with clear and eosinophilic cells and stromal hyalinization (H&E, magnification 10×), (f) strong BMI-1 cytoplasmic staining of tumor cells and stroma in COC (magnification 10×).
(a) (b)
(c) (d)
Figure 2. Cont.

Int. J. Mol. Sci. 2021, 22, 6082 5 of 14Int. J. Mol. Sci. 2021, 22, x FOR PEER REVIEW 5 of 15
(e) (f)
(g) (h)
Figure 2. (a–h) Histologic features and BMI-1 expression in NEOC group in different ovarian tumor subtypes: (a,b) MOC: (a) atypical mucin-producing tumor cells with an infiltrative pattern of invasion (H&E, magnification 10×), (b) negative BMI-1 staining in tumor stroma of MOC (magnification 10x); (c,d) HGSC: (c) variation in cellular size and shape, marked nuclear atypia, dense fibrous stroma, and inflammation around the tumor nests (H&E, magnification 10×), (d) strong BMI-1 cytoplasmic staining of tumor stroma in HGSC (magnification 10×); (e,f) LGSC: (e) micropapillary growth with minimal nuclear atypia in LGSC (H&E, magnification 10×), (f) moderate BMI-1 cytoplasmic staining of tumor cells and stroma in LGSC (magnification 10×); (g,h) LGEC: (g) papillary and glandular differentiation in LGEC (H&E, magnification 10×), (h) strong BMI-1 cytoplasmic staining of tumor cells and stroma in LGEC (magnification 10×).
2.2. BMI Expression—Semi-Quantitative Assessment In the whole group of study, without division into EOC and NEOC categories, the
BMI-1 semi-quantitative assessment showed the following: a high expression in 31 cases (65.96%) and a low expression in 16 cases (34.04%), in tumor cells, along with immunopositivity in 34 cases (72.34%), and immunonegativity in 13 cases (27.65%) in tumor stroma. The statistical analysis revealed significant correlations between BMI-1 expression in epithelial tumor cells (low/high) versus tumor stroma (negative/positive) (p = 0.01).
The semi-quantitative expression of BMI-1 showed a different profile in the two analyzed groups.
BMI-1 expression in epithelial tumor cells was mostly low or negative in the EOC group and predominantly positive in NEOC group. On the other hand, the cases of the EOC group expressed positive and negative stromal BMI-1 immunoreactions approximately equally, whereas the stromal BMI-1 expression was mainly strong in the NEOC group (Table 1). We noted statistically significant differences between the BMI-1 epithelial and stromal profiles in each group (Table 1)
Comparing the epithelial and stromal BMI-1 expressions between the EOC and NEOC groups, we obtained statistically significant differences only for the epithelial component (p = 0.0002), not for the stromal one (p = 0.06).
Figure 2. (a–h) Histologic features and BMI-1 expression in NEOC group in different ovarian tumor subtypes: (a,b) MOC:(a) atypical mucin-producing tumor cells with an infiltrative pattern of invasion (H&E, magnification 10×), (b) negativeBMI-1 staining in tumor stroma of MOC (magnification 10x); (c,d) HGSC: (c) variation in cellular size and shape, markednuclear atypia, dense fibrous stroma, and inflammation around the tumor nests (H&E, magnification 10×), (d) strong BMI-1cytoplasmic staining of tumor stroma in HGSC (magnification 10×); (e,f) LGSC: (e) micropapillary growth with minimalnuclear atypia in LGSC (H&E, magnification 10×), (f) moderate BMI-1 cytoplasmic staining of tumor cells and stroma inLGSC (magnification 10×); (g,h) LGEC: (g) papillary and glandular differentiation in LGEC (H&E, magnification 10×),(h) strong BMI-1 cytoplasmic staining of tumor cells and stroma in LGEC (magnification 10×).
The semi-quantitative expression of BMI-1 showed a different profile in the twoanalyzed groups.
BMI-1 expression in epithelial tumor cells was mostly low or negative in the EOCgroup and predominantly positive in NEOC group. On the other hand, the cases of the EOCgroup expressed positive and negative stromal BMI-1 immunoreactions approximatelyequally, whereas the stromal BMI-1 expression was mainly strong in the NEOC group(Table 1). We noted statistically significant differences between the BMI-1 epithelial andstromal profiles in each group (Table 1).
Comparing the epithelial and stromal BMI-1 expressions between the EOC and NEOCgroups, we obtained statistically significant differences only for the epithelial component(p = 0.0002), not for the stromal one (p = 0.06).
2.3. Relationship between BMI-1 Epithelial and Stromal Expression, and ClinicopathologicalParameters in EOC
The results of the statistical analysis revealed a significant relationship between BMI-1expression in tumor cells (low/high) and tumor grade (well and moderately differentiatedversus poorly differentiated) (p = 0.04). On the other hand, stromal BMI-1 expression wassignificantly correlated with the median value of cancer antigen 125 (CA 125) (p = 0.03).No other significant differences were registered (Table 2).

Int. J. Mol. Sci. 2021, 22, 6082 6 of 14
Table 1. Correlations between the epithelial and stromal BMI-1 expression in the EOC and the NEOC groups.
BMI-1
EOC NEOC
High Score/Positive Reaction
Low Score/Negative Reaction p Value High Score/
Positive ReactionLow Score/
Negative Reaction p Value
Epithelialtumor cells 5 (26.31%) 14 (73.68%)
0.0426 (92.85%) 2 (7.14%)
0.001
Stromal cells 11 (57.89%) 8 (42.10%) 23 (82.14%) 5 (17.85%)
Table 2. Correlations between BMI-1 expression in tumoral cells and clinicopathological parameters—EOC group.
ClinicopathologicalCharacteristics #
Tumor Cells BMI-1
p Value
Stromal BMI-1
p ValueLow Score High Score NegativeReaction
PositiveReaction
# % # % # % # %
Age
<55 age 8 5 62.5 3 37.50.34
4 50 4 500.55
≥55 age 11 9 81.82 2 18.18 4 36.36 7 63.64
Tumor stage
1 4 4 100 0 0
0.48
1 25 3 75
0.552 6 4 66.66 2 33.33 3 50 3 50
3 8 5 62.50 3 37.50 3 37.50 5 62.50
4 1 1 100 0 0 1 100 0 0
Tumor grade
I/II 7 7 100 0 00.04
4 57.14 3 42.850.31
III 12 7 58.33 5 41.66 4 33.33 8 66.66
Histological subtype
LGSC 0 0 0 0 0
0.78
0 0 0 0
0.93
LGEC 0 0 0 0 0 0 0 0 0
COC 4 3 75 1 25 1 25 3 75
MOC 0 0 0 0 0 0 0 0 0
HGSC 3 1 33.33 2 66.66 1 33.33 2 66.66
HGEC 8 6 75 2 25 5 62.50 3 37.50
Undifferentiated 0 0 0 0 0 0 0 0 0
Mixed 4 4 100 0 0 1 25 3 75
Type
Type I 4 3 75 1 250.94
1 25 3 750.57
Type II 15 11 73.33 4 26.67 7 46.67 8 53.33
Residual disease
NED/<1 cm 6 5 83.33 1 16.670.51
2 33.33 4 66.670.59
≥1 cm 13 9 69.23 4 30.77 6 46.15 7 53.85
CA 125—median value
<1201.5 U/mL 10 8 80 2 200.51
2 20 8 800.03
≥1201.5 U/mL 9 6 66.67 3 33.33 6 66.67 3 33.33
LGSC (low-grade serous carcinoma); LGEC (low-grade endometrioid carcinoma); COC (clear cell ovarian carcinoma); MOC (mucinousovarian carcinoma); HGSC (high-grade serous carcinoma); HGEC (high-grade endometrioid carcinoma); NED (no evident data aboutresidual tumor).

Int. J. Mol. Sci. 2021, 22, 6082 7 of 14
2.4. Relationship between BMI-1 Epithelial and Stromal Expression and ClinicopathologicalParameters in NEOC
The statistical analysis showed significant correlations between BMI-1 expression inthe tumor cells (low/high), the stroma (negative/positive), and the tumor histologicalsubtypes (p = 0.002 and p = 0.04, respectively) (Table 3). No associations were found for theother clinical clinicopathological parameters.
Table 3. Correlations between BMI-1 expression in tumor stroma and clinicopathological parameters—NEOC group.
ClinicopathologicalCharacteristics #
Tumor Cells BMI-1
p Value
Stromal BMI-1
p ValueLow Score High Score NegativeReaction
PositiveReaction
# % # % # % # %
Age
<55 age 14 1 7.14 13 92.860.30
2 14.29 12 85.710.62
≥55 age 14 1 7.14 13 92.86 3 21.43 11 78.57
Tumor stage
1 13 1 7.69 12 92.30
0.91
3 23.07 10 76.92
0.712 5 0 0 5 100 0 0 5 100
3 10 1 10 9 90 2 20 8 80
4 0 0 0 0 0 0 0 0 0
Tumor grade
I/II 15 0 0 15 1000.11
3 20 12 800.75
III 13 2 15.38 11 84.61 2 15.38 11 84.61
Histological subtype
LGSC 4 0 0 4 100
0.002
0 0 4 100
0.04
LGEC 5 0 0 5 100 3 60 2 40
COC 5 0 0 5 100 0 0 5 100
MOC 5 1 20 4 80 1 20 4 80
HGSC 5 0 0 5 100 0 0 5 100
HGEC 3 0 0 3 100 0 0 3 100
Undifferentiated 1 1 100 0 0 1 100 0 0
Mixed 0 0 0 0 0 0 0 0 0
Type
Type I 19 1 5.26 18 94.740.57
4 21.05 15 78.950.43
Type II 9 1 11.11 8 88.89 0 0 9 100
Residual disease
NED/<1 cm 16 1 6.25 15 93.750.83
2 12.5 14 87.50.72
≥1 cm 12 1 8.33 11 91.67 1 8.33 11 91.67
CA 125—median value
<101 14 1 7.14 13 92.861
4 28.57 10 71.430.13
≥101 14 1 7.14 13 92.30 1 7.14 13 92.86
LGSC (low-grade serous carcinoma); LGEC (low-grade endometrioid carcinoma); COC (clear cell ovarian carcinoma); MOC (mucinousovarian carcinoma); HGSC (high-grade serous carcinoma); HGEC (high-grade endometrioid carcinoma); NED (no evident data aboutresidual tumor).

Int. J. Mol. Sci. 2021, 22, 6082 8 of 14
3. Discussion
Numerous hypotheses regarding the mechanisms involved in OC etiopathogenesishave been proposed over time as attempts to explain the multiple tumor phenotypes, poorprognosis, and chemoresistance. Endometriosis represents a precursor lesion for certaintypes of epithelial OC, since the identification of the same genetic alterations in both dis-eases are demonstrated [3,4,31]. Accordingly, the corroboration of specific clinicopathologi-cal findings with specific mutations led to the EOC and NEOC categories distinction [44].
The BMI-1 protein, involved in homeotic genes regulation by transcription inhibi-tion [10], represents a survival factor of malignant stem cells [10], and is correlated tohormonal receptor expression, and is considered as a prognosis factor surrogate [44,45].
BMI-1 has been identified in experimental studies of OC (cell lines, clone derivation,and animal experiments) [32–38], both in protein and the protein-coding gene [39], andin human ovarian tumors or ascites fluid samples [10,32,34,36,39,46,47]. Despite thesereported results, BMI-1 expression is not fully established in OC. The review of the literatureshows that less than 10 studies have addressed BMI-1’s involvement in OC, most ofthem highlighting the molecular action and potential therapeutic value of this protein.A positive correlation between BMI-1 positive expression in human epithelial OC andelevated telomerase activity was demonstrated [46,47]. Another study, based on humanspecimens and ovarian cancer cells, showed that BMI-1 expression is downregulatedby MiR-15a or MiR-16 underexpression, with subsequent significant decreases in cellproliferation and clonal growth [40]. Therefore, BMI-1 seems to be a potential target inOC therapy. Eloquent evidences in this direction are provided in recent papers that havedemonstrated the therapeutic activity of PTC-028 as a novel inhibitor of BMI-1 function inOC [37] and the role of MiR-132 in cisplatin resistance and OC metastasis by the targetedregulation of BMI-1 [41]. In terms of the number of human OC samples, the studies onBMI-1 have been generally performed on small groups, with a median number of researchsample of 41 (range 5–179) [10,32,34,36,40,46,47]. These samples were collected from tumortissue [10,32,34,36,39,40,46,47], fresh ascites [34], and frozen ovarian tissues [47].
The reported data target only BMI-1 in epithelial tumor cells, showing a high ex-pression in 80.9% of OC and its relationship with tumor aggressiveness [46]. Moreover, apositive correlation between BMI-1 expression and advanced International Federation ofGynecology and Obstetrics (FIGO) stages, bilaterality, higher tumor grades, and serousmorphology [42,47], and a progressive incremental number of BMI-1-positive cases inaccordance with the increase of tumor grade and stage were demonstrated, while increasedBMI-1 expression was associated with reduced patient survival [39].
This short review of data concerning the correlation between BMI-1 and OC showsthat the current knowledge is predominantly based on experimental data as the firstlevel of evidence regarding its role in carcinogenesis, while the results obtained by theinvestigation of BMI-1 in human tissues is very scarce. Within this general context, ourstudy complements the knowledge on BMI-1 in OC by doing research that translatesthe evidences level from the experimental area to the clinical domain by reference to theclinicopathological characteristics of OC with different parameters for EOC and NEOC.
Our work has demonstrated high BMI-1 expression levels in the epithelial tumor cellsin 66% of OC (26% in EOC and 93% in NEOC). Moreover, our study provides valuable dataon BMI-1 profile in OC, bringing to the foreground the relationship of OC with endometrio-sis, and the differences between the epithelial and stromal expression. This endeavorwas possible by consistent differences in the design of the patient’s cohort, comprising47 cases of OC separated in two different tumor groups: EOC and NEOC. Thus, we havedemonstrated, for the first time, the possible correlations between epithelial and stromalBMI-1 profiles in EOC and NEOC and several classical clinicopathological parameters.
The segregation into EOC and NEOC has been justified by the findings that certainhistological types of EOC, mainly endometrioid and clear cell carcinomas, have differentclinical features, such as younger age at diagnosis, unilaterality, identification at an earlierstage, and a better survival rate, compared to the counterpart entities of NEOC [5]. Our
Int. J. Mol. Sci. 2021, 22, 6082 9 of 14
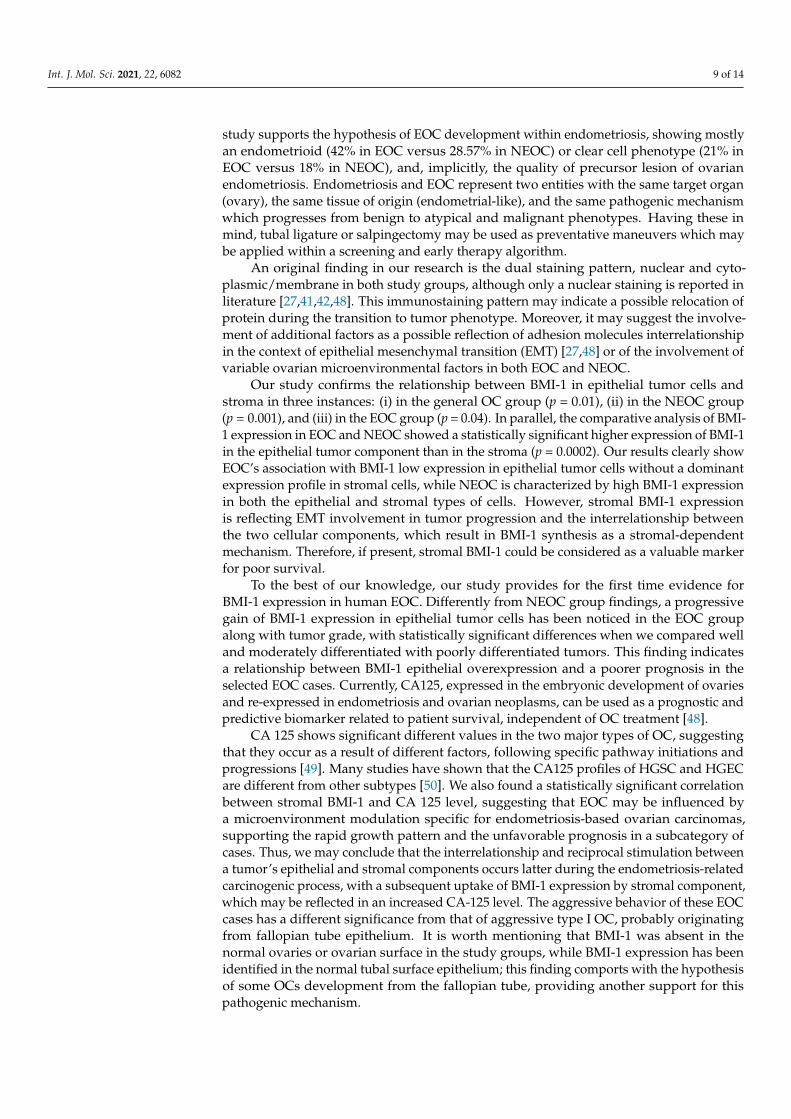
study supports the hypothesis of EOC development within endometriosis, showing mostlyan endometrioid (42% in EOC versus 28.57% in NEOC) or clear cell phenotype (21% inEOC versus 18% in NEOC), and, implicitly, the quality of precursor lesion of ovarianendometriosis. Endometriosis and EOC represent two entities with the same target organ(ovary), the same tissue of origin (endometrial-like), and the same pathogenic mechanismwhich progresses from benign to atypical and malignant phenotypes. Having these inmind, tubal ligature or salpingectomy may be used as preventative maneuvers which maybe applied within a screening and early therapy algorithm.
An original finding in our research is the dual staining pattern, nuclear and cyto-plasmic/membrane in both study groups, although only a nuclear staining is reported inliterature [27,41,42,48]. This immunostaining pattern may indicate a possible relocation ofprotein during the transition to tumor phenotype. Moreover, it may suggest the involve-ment of additional factors as a possible reflection of adhesion molecules interrelationshipin the context of epithelial mesenchymal transition (EMT) [27,48] or of the involvement ofvariable ovarian microenvironmental factors in both EOC and NEOC.
Our study confirms the relationship between BMI-1 in epithelial tumor cells andstroma in three instances: (i) in the general OC group (p = 0.01), (ii) in the NEOC group(p = 0.001), and (iii) in the EOC group (p = 0.04). In parallel, the comparative analysis of BMI-1 expression in EOC and NEOC showed a statistically significant higher expression of BMI-1in the epithelial tumor component than in the stroma (p = 0.0002). Our results clearly showEOC’s association with BMI-1 low expression in epithelial tumor cells without a dominantexpression profile in stromal cells, while NEOC is characterized by high BMI-1 expressionin both the epithelial and stromal types of cells. However, stromal BMI-1 expressionis reflecting EMT involvement in tumor progression and the interrelationship betweenthe two cellular components, which result in BMI-1 synthesis as a stromal-dependentmechanism. Therefore, if present, stromal BMI-1 could be considered as a valuable markerfor poor survival.
To the best of our knowledge, our study provides for the first time evidence forBMI-1 expression in human EOC. Differently from NEOC group findings, a progressivegain of BMI-1 expression in epithelial tumor cells has been noticed in the EOC groupalong with tumor grade, with statistically significant differences when we compared welland moderately differentiated with poorly differentiated tumors. This finding indicatesa relationship between BMI-1 epithelial overexpression and a poorer prognosis in theselected EOC cases. Currently, CA125, expressed in the embryonic development of ovariesand re-expressed in endometriosis and ovarian neoplasms, can be used as a prognostic andpredictive biomarker related to patient survival, independent of OC treatment [48].
CA 125 shows significant different values in the two major types of OC, suggestingthat they occur as a result of different factors, following specific pathway initiations andprogressions [49]. Many studies have shown that the CA125 profiles of HGSC and HGECare different from other subtypes [50]. We also found a statistically significant correlationbetween stromal BMI-1 and CA 125 level, suggesting that EOC may be influenced bya microenvironment modulation specific for endometriosis-based ovarian carcinomas,supporting the rapid growth pattern and the unfavorable prognosis in a subcategory ofcases. Thus, we may conclude that the interrelationship and reciprocal stimulation betweena tumor’s epithelial and stromal components occurs latter during the endometriosis-relatedcarcinogenic process, with a subsequent uptake of BMI-1 expression by stromal component,which may be reflected in an increased CA-125 level. The aggressive behavior of these EOCcases has a different significance from that of aggressive type I OC, probably originatingfrom fallopian tube epithelium. It is worth mentioning that BMI-1 was absent in thenormal ovaries or ovarian surface in the study groups, while BMI-1 expression has beenidentified in the normal tubal surface epithelium; this finding comports with the hypothesisof some OCs development from the fallopian tube, providing another support for thispathogenic mechanism.

Int. J. Mol. Sci. 2021, 22, 6082 10 of 14
On the other hand, in the NEOC group, we have shown statistically significantdifferences between BMI-1 immunopositivity in the tumor’s epithelial cells, stromal cells,and histological subtypes. In our opinion, these results may be considered as solid evidencefor the association of BMI-1 with high grade OC phenotypes and, consequently, withtumor aggressiveness.
Overall, our study reveals a different BMI-1 profile in the EOC an NEOC groups, thusunderlying the differences in their etiopathogeny. We are aware of the limitations of ourstudy due to the small size of the study groups and their heterogeneity in histological types,as the selection criteria have been strictly applied. Despite these limitations, our resultsopen promising perspectives for differentiation of EOC from NEOC that need to be furthervalidated in a larger and homogenous cohort of study. An interesting research item can bedirected to the high-grade serous phenotype of OC that may be further subdivided intosubcategories according to their affiliation to the EOC or to NEOC groups.
4. Materials and Methods4.1. Patients
Our study group included 47 cases of OC, diagnosed between 2006 and 2017 andtreated in several hospitals of Iasi, Romania: “Sf. Spiridon” County Clinical EmergencyHospital, “Cuza Vodă” and “Elena Doamna” Obstetrics and Gynecological Hospitals,and Oncology Regional Institute. All cases were histopathologically reassessed by twopathologists to ascertain the OC histological subtype and then divided into two groups:EOC and NEOC. The study has been approved by the Ethics Committee of “GrigoreT. Popa” University of Medicine and Pharmacy, Iasi, based on the patients’ informedconsent (12378/June 2015). All subjects who provided ovarian tissue had given writtenand informed consent prior the surgery.
4.1.1. Clinicopathological and Tumor Serum Marker Profile of the Study Cohort
At the time of the diagnosis, the age of the patients ranged between 37 and 76 yearsold: 22 patients were younger (<55 years old) and 25 patients were older (≥55 years old).
Based on the standards of the FIGO staging, 17 cases were staged as FIGO stage I,11 cases as FIGO stage II, 18 cases as FIGO stage III, and 1 case FIGO stage IV. Accordingto tumor grade, 13 cases were graded as G1 (well differentiated), 9 cases as G2 (moder-ately differentiated), and 25 cases as G3 (poorly differentiated or undifferentiated). Thedistribution of OC histological variants was as follows: LGSC—4 cases; LGEC—5 cases;COC—9 cases; MOC—5 cases; HGSC—8 cases; HGEC—11 cases; undifferentiated—1 case;and mixed tumor (serous, endometrioid, and clear cells phenotypes)—4 cases. Accordingto the pathogenic classification, the cases have been divided in low-grade (type I; 23 cases)and high-grade (type II; 24 cases). The histopathological exam revealed the tumor extension(residual tumor after primary surgery) in 25 cases (residual tumor≥ 1 cm), with 13 patientsdiagnosed with a residual tumor < 1 cm and 9 cases without evident data about a residualtumor. Preoperatory CA125 levels higher than 35 U/mL were found in all cases comprisedin the study group, ranging between 46–4163 U/mL.
4.1.2. Clinicopathological and Tumor Serum Marker Profile of the EOC and NEOC Groups
In the whole group, 19 of 47 (40%) patients belonged to the EOC group and 28 patients(60%) belonged to the NEOC group.
Cases included in the EOC group were characterized by the presence of associateendometriotic lesions consisting of the endometriosis area in the form of an endometrioticcyst lined with endometrial epithelium and endometrial stroma, as well as evidence ofhemosiderin deposits and chronic hemorrhage or proliferative endometriosis foci with awell-developed glandular profile.
The mean age of patients was 59.10 ± 8.66 years in the EOC group and 56.57 ± 2.64 yearsin the NEOC group. The EOC group comprised the following histological types: COC—4 cases;HGSC—3 cases; HGEC—8 cases; mixed tumors—4 cases; and none of LGSC, LGEC, MOC,

Int. J. Mol. Sci. 2021, 22, 6082 11 of 14
or undifferentiated carcinoma cases were classified as EOC. The histological types in NEOCgroup were: LGSC—4 cases; LGEC—5 cases; COC—5 cases; HGEC—3 cases; MOC—5cases; HGSC—5 cases; and undifferentiated—1 case. The median value of the preoperatoryCA 125 level in the EOC group was 1201.5 U/mL, while a median value of 101 U/mL wasfound in the NEOC group.
4.2. Immunohistochemistry (IHC)
The immunohistochemical staining for the identification of Antigens has been achievedusing BenchMark XT automatic system (Ventana Medical System, Inc., Tucson, AZ, USA),according to protocols that needed standardization for different types of antibodies. Thesections obtained from the selected paraffin-embedded blocks were dewaxed in xylene,rehydrated in ethanol, and rinsed in distillated water. The antigen retrieval was madeby using the Heat-Induced Epitope Retrieval (HIER) procedure, with an antigen retrievalsolution of pH 9 using CC1 solution (Ventana Medical System, Tucson, AZ, USA), consist-ing of a combination of ethylenediaminetetraacetic and boric acid diluted in Tris bufferfor 30—60 minutes. After the endogenous peroxidase blocking with 3% hydrogen per-oxide and treatment with normal goat serum 10%, used to block the non-specific proteinbonds, the sections were incubated with the primary antibody BMI-1 (clone F6/ABCAM,1/50 dilution, Abcam, Cambridge, MA, USA). Consequently, the incubation with Ultra-Vision Quanto Detection System Horseradish peroxidase (HRP) (Igs; Ventana MedicalSystems) has been performed. Antigen-antibody reaction has been visualized using 3,3′-Diaminobenzidine as a chromogen (UltraView, Ventana Medical Systems, Tucson, AZ,USA). The counterstaining of the sections was done with Mayer’s Hematoxylin. Aftercounterstaining, the slides have been washed with liquid soap in order to eliminate theoily film, they have been rinsed with taping water and have been also bathed twice in dis-tilled water. Negative controls have been used for results interpretation, in which primaryantibodies have been skipped and replaced with distilled water and positive controls havebeen considered as endothelial cells and stromal fibroblasts immunostaining.
4.3. Semi-Quantitative Assessment
BMI-1 expression has been individually quantified in the epithelial and in the stromalcomponents. The semi-quantitative assessment of the BMI-1 in tumor cells was doneby using adapted scores based on literature reports [27,51] that took into account thestaining intensity (I) and the percentage of positive cells (P). BMI-1 showed a doubleimmunostaining, nuclear, and cytoplasmic/membrane [27,51]. The intensity of BMI-1immunoreaction was scored as: 0—absent, 1—weak, 2—moderate, and 3—strong. Thepercentage of BMI-1 positive cells was scored as follows: 1—< 10%, 2—10–50%, 3—> 50%.The final BMI-1 score was obtained by multiplying P by I. BMI-1 score values < 3 wereconsidered as a low score, and score values ≥ 3 were considered as a high score.
For the semi-quantitative assessment of stromal BMI-1, we used a standard 2-pointscale scoring system. The immunoreaction was considered negative when ≤ 10% of the tu-mor stromal area had a positive immunostaining of BMI-1, and positive when > 10% of thestromal area showed BMI-1 immunostaining, regardless of the level of staining intensity.
BMI-1 expression has been independently evaluated and scored by three histopatholo-gists with experience in immunohistochemistry interpretation and scoring differences havebeen revised in the evaluation panel in order to reach a consensus.
4.4. Statistical Analysis
Statistical analysis was carried out with Statistical Package for the Social Sciences(SPSS) v. 19 program (SPSS Inc., IBM Corporation, Chicago, IL, USA). A Chi-square (χ2)test was performed to analyze the differences in BMI-1 epithelial and stromal profile ineach group and between groups, and its relationship with classical clinicopathologicalcharacteristics (age, tumor stage, grade, histological subtype, tumorigenic dualistic tumortypes, residual disease, and preoperatory CA 125 level). Yates’ correction was applied

Int. J. Mol. Sci. 2021, 22, 6082 12 of 14
when the number of cases in a subgroup was lower than five. Statistical significance wasconsidered when p < 0.05.
5. Conclusions
Our study provides solid evidence for a different BMI-1 expression in EOC andNEOC, corresponding to the differences in their etiopathogeny. The EOCs were largelycharacterized by a low BMI-1 expression in epithelial tumor cells, without a dominantexpression profile in stromal cells. Epithelial BMI-1 is progressively increased alongside thetumor grade and strong stromal BMI-1 may be correlated to microenvironment modulation,supporting the rapid growth pattern and the recognized poor prognosis in a subcategory ofEOC cases. The NEOCs were characterized by high BMI-1 expression in both the epithelialand stromal types of cells; therefore, BMI-1 expression could be regarded as an indicatorof aggressiveness of this type of malignancies in general, and for HGSC in particular.Additionally, BMI-1 expression limited to the normal tubal surface epithelium and its lackin normal germinal/surface ovarian epithelium may support the hypothesis that manyOCs are originating from the fallopian tube epithelium.
Nevertheless, the reported differences in BMI-1 expression in EOC and NEOC need tobe further validated in a larger and homogenous cohort of study.
Author Contributions: Conceptualization, L.L., C.A. and I.-D.C.; methodology, L.L., R.A.B. andS.E.G.; software, R.A.B.; validation, L.L., C.A., S.E.G. and R.A.B.; investigation, L.L., R.A.B. and I.P.;writing—original draft preparation, L.L. and R.A.B.; writing—review and editing, C.A.; supervision,I.-D.C. All authors have read and agreed to the published version of the manuscript.
Funding: No funding was received for this study.
Institutional Review Board Statement: The study was conducted according to the guidelines of theDeclaration of Helsinki, and approved by the Ethics Committee of the “Grigore T. Popa” Universityof Medicine and Pharmacy, Iasi (12378/June 2015).
Informed Consent Statement: Informed consent was obtained from all subjects involved in the study.
Data Availability Statement: The data used to support the findings of this study are available uponrequest to the authors.
Conflicts of Interest: The authors declare no conflict of interest.
References1. Bray, F.; Ferlay, J.; Soerjomataram, I.; Siegel, R.L.; Torre, L.A.; Jemal, A. Global Cancer Statistics 2018: GLOBOCAN Estimates of
Incidence and Mortality Worldwide for 36 Cancers in 185 Countries. CA Cancer J. Clin. 2018, 68, 394–424. [CrossRef]2. Wei, J.-J.; William, J.; Bulun, S. Endometriosis and Ovarian Cancer: A Review of Clinical, Pathologic, and Molecular Aspects. Int.
J. Gynecol. Pathol. 2011, 30, 553–568. [CrossRef] [PubMed]3. Laganà, A.S.; Vitale, S.G.; Salmeri, F.M.; Triolo, O.; Ban Frangež, H.; Vrtacnik-Bokal, E.; Stojanovska, L.; Apostolopoulos, V.;
Granese, R.; Sofo, V. Unus pro Omnibus, Omnes pro Uno: A Novel, Evidence-Based, Unifying Theory for the Pathogenesis ofEndometriosis. Med. Hypotheses 2017, 103, 10–20. [CrossRef]
4. Herreros-Villanueva, M.; Chen, C.-C.; Tsai, E.-M.; Er, T.-K. Endometriosis-Associated Ovarian Cancer: What Have We Learned soFar? Clin. Chim. Acta 2019, 493, 63–72. [CrossRef] [PubMed]
5. Brilhante, A.; Augusto, K.; Portela, M.; Sucupira, L.C.; Oliveira, L.A.; Pouchaim, A.J.; Mesquita Nóbrega, L.R.; de Magalhães, T.F.;Sobreira, L.R. Endometriosis and Ovarian Cancer: An Integrative Review (Endometriosis and Ovarian Cancer). APJCP 2017, 18.[CrossRef]
6. Vargas, A.N. Natural History of Ovarian Cancer. Ecancermedicalscience 2014, 8, 465. [CrossRef] [PubMed]7. Motohara, T.; Yoshida, G.J.; Katabuchi, H. The Hallmarks of Ovarian Cancer Stem Cells and Niches: Exploring Their Harmonious
Interplay in Therapy Resistance. Semin. Cancer Biol. 2021, S1044579X21000997. [CrossRef]8. Pieterse, Z.; Amaya-Padilla, M.A.; Singomat, T.; Binju, M.; Madjid, B.D.; Yu, Y.; Kaur, P. Ovarian Cancer Stem Cells and Their Role
in Drug Resistance. Int. J. Biochem. Cell Biol. 2019, 106, 117–126. [CrossRef]9. Muinao, T.; Deka Boruah, H.P.; Pal, M. Diagnostic and Prognostic Biomarkers in Ovarian Cancer and the Potential Roles of
Cancer Stem Cells—An Updated Review. Exp. Cell Res. 2018, 362, 1–10. [CrossRef]10. Honig, A.; Weidler, C.; Häusler, S.; Krockenberger, M.; Buchholz, S.; Köster, F.; Segerer, S.E.; Dietl, J.; Engel, J.B. Over-
expression of Polycomb Protein BMI-1 in Human Specimens of Breast, Ovarian, Endometrial and Cervical Cancer.Anticancer Res. 2010, 30, 1559–1564.

Int. J. Mol. Sci. 2021, 22, 6082 13 of 14
11. Qin, Z.-K.; Yang, J.-A.; Ye, Y.-L.; Zhang, X.; Xu, L.-H.; Zhou, F.-J.; Han, H.; Liu, Z.-W.; Song, L.-B.; Zeng, M.-S. Expression of Bmi-1Is a Prognostic Marker in Bladder Cancer. BMC Cancer 2009, 9, 61. [CrossRef] [PubMed]
12. Beà, S.; Tort, F.; Pinyol, M.; Puig, X.; Hernández, L.; Hernández, S.; Fernandez, P.L.; van Lohuizen, M.; Colomer, D.; Campo, E.BMI-1 Gene Amplification and Overexpression in Hematological Malignancies Occur Mainly in Mantle Cell Lymphomas. CancerRes. 2001, 61, 2409–2412. [PubMed]
13. van Kemenade, F.J.; Raaphorst, F.M.; Blokzijl, T.; Fieret, E.; Hamer, K.M.; Satijn, D.P.; Otte, A.P.; Meijer, C.J. Coexpression ofBMI-1 and EZH2 Polycomb-Group Proteins Is Associated with Cycling Cells and Degree of Malignancy in B-Cell Non-HodgkinLymphoma. Blood 2001, 97, 3896–3901. [CrossRef] [PubMed]
14. Raaphorst, F.M. Deregulated Expression of Polycomb-Group Oncogenes in Human Malignant Lymphomas and Epithelial Tumors.Hum. Mol. Genet. 2005, 14 (Suppl. 1), R93–R100. [CrossRef] [PubMed]
15. Cui, H.; Hu, B.; Li, T.; Ma, J.; Alam, G.; Gunning, W.T.; Ding, H.-F. Bmi-1 Is Essential for the Tumorigenicity of NeuroblastomaCells. Am. J. Pathol. 2007, 170, 1370–1378. [CrossRef]
16. Crea, F.; Duhagon Serrat, M.A.; Hurt, E.M.; Thomas, S.B.; Danesi, R.; Farrar, W.L. BMI1 Silencing Enhances Docetaxel Activityand Impairs Antioxidant Response in Prostate Cancer. Int. J. Cancer 2011, 128, 1946–1954. [CrossRef] [PubMed]
17. Huber, G.F.; Albinger-Hegyi, A.; Soltermann, A.; Roessle, M.; Graf, N.; Haerle, S.K.; Holzmann, D.; Moch, H.; Hegyi, I. ExpressionPatterns of Bmi-1 and P16 Significantly Correlate with Overall, Disease-Specific, and Recurrence-Free Survival in OropharyngealSquamous Cell Carcinoma. Cancer 2011, 117, 4659–4670. [CrossRef]
18. Song, L.-B.; Zeng, M.-S.; Liao, W.-T.; Zhang, L.; Mo, H.-Y.; Liu, W.-L.; Shao, J.-Y.; Wu, Q.-L.; Li, M.-Z.; Xia, Y.-F.; et al. Bmi-1Is a Novel Molecular Marker of Nasopharyngeal Carcinoma Progression and Immortalizes Primary Human NasopharyngealEpithelial Cells. Cancer Res. 2006, 66, 6225–6232. [CrossRef]
19. Kim, J.H.; Yoon, S.Y.; Jeong, S.-H.; Kim, S.Y.; Moon, S.K.; Joo, J.H.; Lee, Y.; Choe, I.S.; Kim, J.W. Overexpression of Bmi-1Oncoprotein Correlates with Axillary Lymph Node Metastases in Invasive Ductal Breast Cancer. Breast 2004, 13, 383–388.[CrossRef]
20. Guo, B.-H.; Feng, Y.; Zhang, R.; Xu, L.-H.; Li, M.-Z.; Kung, H.-F.; Song, L.-B.; Zeng, M.-S. Bmi-1 Promotes Invasion and Metastasis,and Its Elevated Expression Is Correlated with an Advanced Stage of Breast Cancer. Mol. Cancer 2011, 10, 10. [CrossRef]
21. Lu, Y.-W.; Li, J.; Guo, W.-J. Expression and Clinicopathological Significance of Mel-18 and Bmi-1 MRNA in Gastric Carcinoma. J.Exp. Clin. Cancer Res. 2010, 29, 143. [CrossRef]
22. Proctor, E.; Waghray, M.; Lee, C.J.; Heidt, D.G.; Yalamanchili, M.; Li, C.; Bednar, F.; Simeone, D.M. Bmi1 Enhances Tumorigenicityand Cancer Stem Cell Function in Pancreatic Adenocarcinoma. PLoS ONE 2013, 8, e55820. [CrossRef]
23. Yoshikawa, R.; Tsujimura, T.; Tao, L.; Kamikonya, N.; Fujiwara, Y. The Oncoprotein and Stem Cell Renewal Factor BMI1Associates with Poor Clinical Outcome in Oesophageal Cancer Patients Undergoing Preoperative Chemoradiotherapy. BMCCancer 2012, 12, 461. [CrossRef] [PubMed]
24. Vonlanthen, S.; Heighway, J.; Altermatt, H.J.; Gugger, M.; Kappeler, A.; Borner, M.M.; van Lohuizen, M.; Betticher, D.C. The Bmi-1Oncoprotein Is Differentially Expressed in Non-Small Cell Lung Cancer and Correlates with INK4A-ARF Locus Expression. Br. J.Cancer 2001, 84, 1372–1376. [CrossRef]
25. Breuer, R.H.J.; Snijders, P.J.F.; Sutedja, G.T.; Sewalt, R.G.A.B.; Otte, A.P.; Postmus, P.E.; Meijer, C.J.L.M.; Raaphorst, F.M.; Smit, E.F.Expression of the P16(INK4a) Gene Product, Methylation of the P16(INK4a) Promoter Region and Expression of the Polycomb-Group Gene BMI-1 in Squamous Cell Lung Carcinoma and Premalignant Endobronchial Lesions. Lung Cancer 2005, 48, 299–306.[CrossRef] [PubMed]
26. Elkashty, O.A.; Ashry, R.; Tran, S.D. Head and Neck Cancer Management and Cancer Stem Cells Implication. Saudi Dent. J.2019, 31, 395–416. [CrossRef] [PubMed]
27. Bachmann, I.M.; Puntervoll, H.E.; Otte, A.P.; Akslen, L.A. Loss of BMI-1 Expression Is Associated with Clinical Progress ofMalignant Melanoma. Mod. Pathol. 2008, 21, 583–590. [CrossRef]
28. Sedassari, B.T.; Rodrigues, M.F.S.D.; Mariano, F.V.; Altemani, A.; Nunes, F.D.; Sousa, S. The Stem Cell Marker Bmi-1 Is Sensitivein Identifying Early Lesions of Carcinoma Ex Pleomorphic Adenoma. Medicine 2015, 94, e1035. [CrossRef]
29. Mihara, K.; Chowdhury, M.; Nakaju, N.; Hidani, S.; Ihara, A.; Hyodo, H.; Yasunaga, S.; Takihara, Y.; Kimura, A. Bmi-1 IsUseful as a Novel Molecular Marker for Predicting Progression of Myelodysplastic Syndrome and Patient Prognosis. Blood2006, 107, 305–308. [CrossRef]
30. Jiao, K.; Jiang, W.; Zhao, C.; Su, D.; Zhang, H. Bmi-1 in Gallbladder Carcinoma: Clinicopathology and Mechanism of Regulationof Human Gallbladder Carcinoma Proliferation. Oncol. Lett. 2019, 18, 1365–1371. [CrossRef]
31. Douglas, D.; Hsu, J.H.-R.; Hung, L.; Cooper, A.; Abdueva, D.; van Doorninck, J.; Peng, G.; Shimada, H.; Triche, T.J.; Lawlor,E.R. BMI-1 Promotes Ewing Sarcoma Tumorigenicity Independent of CDKN2A Repression. Cancer Res. 2008, 68, 6507–6515.[CrossRef]
32. Zhang, S.; Balch, C.; Chan, M.W.; Lai, H.-C.; Matei, D.; Schilder, J.M.; Yan, P.S.; Huang, T.H.-M.; Nephew, K.P. Identification andCharacterization of Ovarian Cancer-Initiating Cells from Primary Human Tumors. Cancer Res. 2008, 68, 4311–4320. [CrossRef][PubMed]
33. Wang, E.; Bhattacharyya, S.; Szabolcs, A.; Rodriguez-Aguayo, C.; Jennings, N.B.; Lopez-Berestein, G.; Mukherjee, P.; Sood,A.K.; Bhattacharya, R. Enhancing Chemotherapy Response with Bmi-1 Silencing in Ovarian Cancer. PLoS ONE 2011, 6, e17918.[CrossRef] [PubMed]

Int. J. Mol. Sci. 2021, 22, 6082 14 of 14
34. Vathipadiekal, V.; Saxena, D.; Mok, S.C.; Hauschka, P.V.; Ozbun, L.; Birrer, M.J. Identification of a Potential Ovarian Cancer StemCell Gene Expression Profile from Advanced Stage Papillary Serous Ovarian Cancer. PLoS ONE 2012, 7, e29079. [CrossRef][PubMed]
35. Xin, T.; Zhang, F.B.; Sui, G.J.; Jin, X.M. Bmi-1 SiRNA Inhibited Ovarian Cancer Cell Line Growth and Decreased TelomeraseActivity. Br. J. Biomed. Sci. 2012, 69, 62–66. [CrossRef] [PubMed]
36. He, Q.-Z.; Luo, X.-Z.; Wang, K.; Zhou, Q.; Ao, H.; Yang, Y.; Li, S.-X.; Li, Y.; Zhu, H.-T.; Duan, T. Isolation and Characterization ofCancer Stem Cells from High-Grade Serous Ovarian Carcinomas. Cell Physiol. Biochem. 2014, 33, 173–184. [CrossRef]
37. Dey, A.; Xiong, X.; Crim, A.; Dwivedi, S.K.D.; Mustafi, S.B.; Mukherjee, P.; Cao, L.; Sydorenko, N.; Baiazitov, R.; Moon, Y.-C.; et al.Evaluating the Mechanism and Therapeutic Potential of PTC-028, a Novel Inhibitor of BMI-1 Function in Ovarian Cancer. Mol.Cancer Ther. 2018, 17, 39–49. [CrossRef]
38. Shishido, A.; Mori, S.; Yokoyama, Y.; Hamada, Y.; Minami, K.; Qian, Y.; Wang, J.; Hirose, H.; Wu, X.; Kawaguchi, N.; et al.Mesothelial Cells Facilitate Cancer Stem-like Properties in Spheroids of Ovarian Cancer Cells. Oncol. Rep. 2018, 40, 2105–2114.[CrossRef] [PubMed]
39. Yang, G.-F.; He, W.-P.; Cai, M.-Y.; He, L.-R.; Luo, J.-H.; Deng, H.-X.; Guan, X.-Y.; Zeng, M.-S.; Zeng, Y.-X.; Xie, D. IntensiveExpression of Bmi-1 Is a New Independent Predictor of Poor Outcome in Patients with Ovarian Carcinoma. BMC Cancer2010, 10, 133. [CrossRef]
40. Bhattacharya, R.; Nicoloso, M.; Arvizo, R.; Wang, E.; Cortez, A.; Rossi, S.; Calin, G.A.; Mukherjee, P. MiR-15a and MiR-16 ControlBmi-1 Expression in Ovarian Cancer. Cancer Res. 2009, 69, 9090–9095. [CrossRef]
41. Zhang, X.-L.; Sun, B.-L.; Tian, S.-X.; Li, L.; Zhao, Y.-C.; Shi, P.-P. MicroRNA-132 Reverses Cisplatin Resistance and Metastasis inOvarian Cancer by the Targeted Regulation on Bmi-1. Eur. Rev. Med. Pharmacol. Sci. 2019, 23, 3635–3644. [CrossRef] [PubMed]
42. Abd El hafez, A.; El-Hadaad, H.A. Immunohistochemical Expression and Prognostic Relevance of Bmi-1, a Stem Cell Factor, inEpithelial Ovarian Cancer. Ann. Diagn. Pathol. 2014, 18, 58–62. [CrossRef] [PubMed]
43. Horie, K.; Iseki, C.; Kikuchi, M.; Miyakawa, K.; Yoshizaki, M.; Yoshioka, H.; Watanabe, J. Bmi-1 Immunohistochemical Expressionin Endometrial Carcinoma Is Correlated with Prognostic Activity. Medicina 2020, 56, 72. [CrossRef]
44. Silva, J.; García, V.; García, J.M.; Peña, C.; Domínguez, G.; Díaz, R.; Lorenzo, Y.; Hurtado, A.; Sánchez, A.; Bonilla, F. CirculatingBmi-1 MRNA as a Possible Prognostic Factor for Advanced Breast Cancer Patients. Breast Cancer Res. 2007, 9, R55. [CrossRef]
45. Choi, Y.J.; Choi, Y.L.; Cho, E.Y.; Shin, Y.K.; Sung, K.W.; Hwang, Y.K.; Lee, S.J.; Kong, G.; Lee, J.E.; Kim, J.S.; et al. Expressionof Bmi-1 Protein in Tumor Tissues Is Associated with Favorable Prognosis in Breast Cancer Patients. Breast Cancer Res. Treat.2009, 113, 83–93. [CrossRef]
46. Zhang, F.; Sui, L.; Xin, T. Correlations of BMI-1 Expression and Telomerase Activity in Ovarian Cancer Tissues. Exp. Oncol.2008, 30, 70–74.
47. Zhang, F.B.; Sui, L.H.; Xin, T. Correlation of Bmi-1 Expression and Telomerase Activity in Human Ovarian Cancer. Br. J. Biomed.Sci. 2008, 65, 172–177. [CrossRef]
48. Zhang, H.; Yang, Y.; Wang, Y.; Gao, X.; Wang, W.; Liu, H.; He, H.; Liang, Y.; Pan, K.; Wu, H.; et al. Relationship of Tumor MarkerCA125 and Ovarian Tumor Stem Cells: Preliminary Identification. J. Ovarian Res. 2015, 8, 19. [CrossRef]
49. Charkhchi, P.; Cybulski, C.; Gronwald, J.; Wong, F.O.; Narod, S.A.; Akbari, M.R. CA125 and Ovarian Cancer: A ComprehensiveReview. Cancers 2020, 12, 3730. [CrossRef] [PubMed]
50. Köbel, M.; Kalloger, S.E.; Boyd, N.; McKinney, S.; Mehl, E.; Palmer, C.; Leung, S.; Bowen, N.J.; Ionescu, D.N.; Rajput, A.; et al.Ovarian Carcinoma Subtypes Are Different Diseases: Implications for Biomarker Studies. PLoS Med. 2008, 5, e232. [CrossRef][PubMed]
51. Bachmann, I.M.; Halvorsen, O.J.; Collett, K.; Stefansson, I.M.; Straume, O.; Haukaas, S.A.; Salvesen, H.B.; Otte, A.P.; Akslen, L.A.EZH2 Expression Is Associated with High Proliferation Rate and Aggressive Tumor Subgroups in Cutaneous Melanoma andCancers of the Endometrium, Prostate, and Breast. J. Clin. Oncol. 2006, 24, 268–273. [CrossRef] [PubMed]