Biogeochernistry of the Sediments of the Pamlico and Neuse River ...
116
Biogeochernistry of the Sediments of the Pamlico and Neuse River Estuaries, North Carolina Ernest A. Matson Mark M. Brinson D. Dawn Cahoon Graham J. Davis Department of Bi 01ogy East Carolina University Greenvi 1 l e , North Carol ina 27834 The work upon which this publication is based was supported in part by funds provided by the United States Department of the Interior, Washington, D.C., through the Water Resources Research Institute of The University of North Carolina as authorized by the Water Research and Development Act of 1978. Project No. B-143-NC Agreement No. 14-34-0001 -1256 May 1983
Transcript of Biogeochernistry of the Sediments of the Pamlico and Neuse River ...

Biogeochernistry of the Sediments of the Pamlico and Neuse River Estuaries, North Carolina
Ernest A. Matson
Mark M. Brinson
D. Dawn Cahoon
Graham J . Davis
Department of Bi 01 ogy East Carolina University
Greenvi 1 l e , North Carol ina 27834
The work upon which this publication i s based was supported i n part by funds provided by the United States Department of the Interior, Washington, D . C . , through the Water Resources Research Inst i tute of The University of North Carolina as authorized by the Water Research and Development Act of 1978.
Project No. B-143-NC
Agreement No. 14-34-0001 -1256
May 1983

ACKNOULEDGEMENTS
Many people assisted us in ways that made our lab and f ie ld work much more enjoyable. In the fie1 d, Grace Mordecai , Marston Youngblood, Dan Kornegay , Loede Harper, Pat Daniels, Steve Cabaniss, Dan Albert, Kevin McJunken, John Starnes, Ed Kuenzler, and Judy Heath a l l helped in many ways. In the lab, Grace Mordecai, Marston Youngblood, Sharon Keaton, Pat Daniels, and John Starnes were invai uable, often during consecutively long days and nights. Martha N . Jones continues her excellent and conscientious direction of the E . C . U . Centralized Water Quality Laboratory, and, without whom, we would be los t . Jerry Freeman contributed greatly t o equipment supply and repair. Don Stanley gave freely of his time, data, and knowledge of these estuaries. Laddie Crisp made fine prints of figures prepared by Jerry Beckman. We especially thank those a t the Pam1 ico Estuarine Laborat0ry:Roberta Kinchloe (and her pets Darth and Elmo), John Starnes, John Foster, and Randy Rouse, for generous gif ts and loans of forgotten equipment, tools, and beer.
This report has been substantially improved af ter fine critiques by Bob Christian, Don Stanley, Larry Benninger, Ed Kuenzler, Martha Jones, Steve Cabaniss, Dan Albert, and Greg Allgood. Barbara James did an excel lent j o b of typing and editing the final manuscript.
This research was supported in part by the Department of Biology and the University Research Council of East Carolina University. Major funding was provided through the University of North Carol ina Water Resources Research Inst i tute with federal funds from the U.S.Department of the Interior. We thank James Stewart, Acting Director, and Linda Kiger, Administrative Officer, of UNC-WRRI for their pleasant help and support.
DISCLAIMER STATEMENT
Contents of this pub9 ication do n o t necessarily ref lect the views and policies of the U.S. Department of the Interior, nor does mention o f trade names or com- mercial products constitute their endorsement or recommendation for use by the U.S. Government.

ABSTRACT
We completed the f i r s t general survey of the composition, distribution, and sources of surface sediments in the Pamlico ( P R E ) and Neuse River Estuaries ( N R E ) . The in ters t i t ia l (pore) waters of the sediments were also studied t o estimate the decomposition stoichiometry of or anic matter and the diffusive 9 flux of NHdf, FRP ( f i 1 terable reactive P ) , SO4 -, Si , DIC (dissolved inorganic carbon), and C1- . These data were obtained monthly in the PRE and occasion- al ly in the NRE a t six stations on downriver transects from the freshwater- saltwater transition zone t o the mouth of each estuary a t Pam1 ico Sound.
With few exceptions, the sediments of the two estuaries were quite simi- l a r . Mud deposits (>go% s i l t + clay) covered -90% of the area of b o t h , and the remainder was sandy sediments near shore or upriver of the transition zone. Sandy sediments were more widespread in the NRE than the PRE. Mud sed- iments t o 10 cm depth contained ( i n pmol g-1 dry mass) from 2560 t o 5135 total organic carbon (TOC), 282 t o 448 total Kjeldahl nitrogen (TKN), and 22 to 73 total phosphorus ( T P ) . There was a progressive decrease in TOC and TP concen- trations downriver, b u t the TKN concentrations did not change. The PRE muds appeared to be relatively enriched in TP as compared w i t h those of the NRE. The contents of these fractions (per m2) in muds were 1.3 t o 5.4 times greater than those of sands, and are equivalent t o the amounts of carbon, nitrogen and phosphorus that phytoplankton take up from the water column i n 1 t o 4 years. TP a t the head of both estuaries was almost wholly composed of an acid ex- tractable phosphorus ( E P ) fraction. EP decreased downriver suggesting that progressively more of the TP was associated with organic matter downriver. Exchangeable ammonium represented only 0.5% t o 2% of the TKN pool
Stable carbon isotope data indicate that deposition of estuarine phyto- plankton carbon governs the organic chemistry of the top meter of sediments in the lower two thirds of the estuaries, while in lower-salinity upriver areas, freshwater carbon i s evident. After deposition and burial, there i s l i t t l e alteration of 61% of organic matter, although higher isotope ratios of the DIC i n pore waters suggested that methanogens and other autotrophic bacteria are active. S p r i n g phytoplankton blooms associated w i t h nutrient- rich runoff provide a significant input of organic carbon t o the sediments.
Total annual diffusional f l u x of N H ~ + and RP from the sediments a t a l l stations in the PRE averaged 369 and 38 mnol m respectively, and repre- sents 7.7 and 5.4% of average annual phytoplankton N and P uptake i n surface waters. Bioturbation and advection of pore waters, as well as large pulsed nutrient fluxes from anoxic bottom waters, could increase these estimates al- most 5 fold. During high wintertime runoff, nutrient inputs from the water- shed supplement phytoplankton N and P requirements by an amount similar to that from the sediments i n summer. Earlier reports and some of our data sup- port Hargrave's (1973) model of increased importance of nutrient recycl i n g within the water column a t the expense of sedimentation and subsequent benthic metabolism as water depth increases. However, because only about half of the calculated N and P of phytoplankton sedimentation i s returned t o the water column, storage and recycling within the sediments must occur. Evidence for
I
iii

ABSTRACT, cont . nutrient recycling in the sediments nay be inferred from: ( 1 ) substantial enrichments in the ~ 0 ~ 2 - / C 1 - ratio in the waters of both estuaries due t o autotrophic bacteria(5ufficient samples were taken in the PRE t o identify a seas~nal cycle of enrichment and depletion), (2 ) summertime blooms of S oxidizing bacteria i n the N R E and PRE a f te r the S O ~ ~ - / C I - ra t io returned to i t s conservative value, and (3) uti l ization and fractionation of pore water DIC by autotrophs i n the sediments.
Our sedimentary TOC and DIC data have been combined ~ i t h an ear l ie r se t I o f data from the water column t o update a carbon budget for the PRE. Major
components of the budget, such as exchange of materials with Pamlico Sound and autotrophy in the sediments need to be studied. Biochemical mediation of parts of the sulfur cycle appears t o be potentially important t o carbon and energy reserves of this system and much more research i s required t o determine the role of sulfur cycl ing in estuarine productivity.

TABLE OF CONTENTS
ACKNOWLEDGEMENTS . . . . . . . . . . . . . . . . . . . . . . . . . . . . . i i ABSTRACT . . . . . . . . . . . . . . . . . . . . . . . . . . . . . . . . . i i i
LIST OF FIGURES . . . . . . . . . . . . . . . . . . . . . . . . . . . . . . vi i
LISTOFTABLES . . . . . . . . . . . . . . . . . . . . . . . . . . . . . . ix
CONCLUSIONS AND RECOMMENDATIONS . . . . . . . . . . . . . . . . . . . . . . xi
INTRODUCTION . . . . . . . . . . . . . . . . . . . . . . . . . . . . . . . 1 Organic Carbon Turnover in Sediments . . . . . . . . . . . . . . . . . 4 Chemistry of Sedimentary Pore Waters . . . . . . . . . . . . . . . . . . 6 Sedimentary Biogeochemistry and the Benthic-Pelagic Feedback System . . 8 Study Objectives . . . . . . . . . . . . . . . . . . . . . . . . . . . 10
MATERIALS AND METHODS . . . . . . . . . . . . . . . . . . . . . . . . . . . 11 Study Area . . . . . . . . . . . . . . . . . . . . . . . . . . . . . . . 11 Sediment Sampl ing . . . . . . . . . . . . . . . . . . . . . . . . . . . . 14 Water Sampling . . . . . . . . . . . . . . . . . . . . . . . . . . . . . 14 In Situ Pore Water Sampling . . . . . . . . . . . . . . . . . . . . . . 14 -- Carbon Isotope Sample Storage and Analysis . . . . . . . . . . . . . . . 16 Sectioning of Sediment Cores . . . . . . . . . . . . . . . . . . . . . . 16 Estimation of Diffusion Coefficients . . . . . . . . . . . . . . . . . . 17 . . . . . . . . . . Diffusional Flux Across the Sediment-Uater Interface 18 Nutrient Analyses . . . . . . . . . . . . . . . . . . . . . . . . . . . 18 Variation in Sediment Grain Size and Nutrient Content . . . . . . . . . 20 Sediment Metabolism . . . . . . . . . . . . . . . . . . . . . . . . . . . 20 Definitions . . . . . . . . . . . . . . . . . . . . . . . . . . . . . . 21
RESULTS AND DISCUSSION . . . . . . . . . . . . . . . . . . . . . . . . . . 23 . . . . . . . . . . . . . Composition and Distribution of the Sediments 23 Upper 10 cm of Sand and Mud . . . . . . . . . . . . . . . . . . . . . 23 Flocculent Surface Layer . . . . . . . . . . . . . . . . . . . . . . 30
Carbon Isotopes . . . . . . . . . . . . . . . . . . . . . . . . . . . . 35 . . . 61% of Sediment and Seston . . . . . . . . . . . . . . . . . 35 . . . . . . . . . . . . . Relationship of C/N Ratios and 61% Values 37 . . . . . . . . . Effect of High Runoff to the Pamlico River Estuary 41 Pore Water Fractions and the Deeper Sediments . . . . . . . . . . . . 43 Evaluation of Organic Carbon Sources . . . . . . . . . . . . . . . . 45
Chemistry of the In ters t i t ia l Pore Waters . . . . . . . . . . . . . . . 46 Solute Flux Across the Sediment-Water Interface . . . . . . . . . . . . 58 The Stoichiometry of Decomposition . . . . . . . . . . . . . . . . . . . 68 Estimates of Benthic Metabolism and Nutrient Regeneration . . . . . . . 76 Sulfate Cycling in the Neuse and Pamlico River Estuaries . . . . . . . . 80 Organic Carbon Flux in the Pam1 ico River Estuary:An Update . . . . . . . 91
LITERATURE CITED . . . . . . . . . . . . . . . . . . . . . . . . . . . . . 93
v


LIST OF FIGURES
. . . . . 1 . The Neuse and Pam1 i co River Estuary study sections C through H 5
2 . ( a ) Freshwater discharge of the Tar River a t Tarboro . . . . 1 2 ( b ) Downriver increase in conductivity of the Neuse and Pamlico Ri ver Estuaries . . . . . 12
3 . Sediment and pore water samplers . . . . . 15
4 . Paml i co and Neuse River Estuary variation study data . . . .26. 27
5 . Surface sediment chemistry of Stas . D and G in the Pamlico River Estuary. 1981 . . . . . 31
6 . Monthly variation i n the C/N/P ratios of the surface sediments of the Pam1 ico River Estuary. 1981 . . . . . 32
7 . si3c values of POC in the Neuse and Pamlico River Estuaries.1981 . . . . 36
8 . s13c values of POC the Paml ico River Estuary and i t s tr ibutaries i n October. 1981 . . . . . 38
9 . Relationship between the 6 I 3 c and C/N ratios in the surface sediments of the Neuse and Pam1 ico River Estuaries. 1981 . . . . . 38
10 . (a) Relationship between the 613c values and sa l in i ty i n the Pamli o River Estuary in the spring of 1981 and 1982 . . . . . F 42 (b) s 3~ values of the surface and bottom water seston in the Pamlico River Estuary in May. 1982 . . . . . 42
11 . 613c values of the POC. DOC. and DIC in subsurface sediments of the Pamlico River Estuary. 1981 . . . . . 44
12 . Pam1 i co River Estuary pore water data. 1981 : (a ) N H + . . . . 49 . . . . (b) F R ~ 50 ( c ) C1' . . . . 51
13 . Neuse and Paml ico River Estuary pore water data from Stas . D and G . (a ) March. 1982 . . . . 52 . . . . ( b ) summer. 1982 53
14 . Pore water data from Stas . D and G in the Pamlico River Estuary. 1982 . . . . . 54
15 . Pore water N H ' and FRP in the Neuse and Paml ico River Estuaries in June. 1981 . . . . . 57
16 . Pore water flux data for the Pam1 i co River Estuary. 1981 . . . . . 64

LIST O F FIGURES, cont.
17 . Pore water nu t r i en t f l ux a t S tas . D and G in the Paml ico River Estuary from January, 1981 through August, 1982. . . . .
18. Relationships between N H ~ + and FRP and A S O ~ ~ ' a t S t a s . D and G in the Parnlico River Estuary, 1981. . . . .
19. Pamlico River Estuary pore water r e l a t i onsh ips a t S tas . D and G in 1982. . . . .
20. Linear regression data f o r pore water so lu t e s a t S t a s . D and G in the Pam1 i co River Estuary 1981 - 1982. . . . .
21. ASO 2' ( % ) i n t he waters of the Neuse and Paml i co River Estuaries in June, 1981. . * . .
22. S t r a t i f i c a t i o n and bottom water anoxia in the Pam1 ico River Estuary, 14 Ju ly , 1989. . . . .
23. A S O ~ ~ - , (1) i n the bottom waters of the Paml ico River Estuary, 1981. . . 24. ASO 2- i n the bottom and pore waters of the Pamlico River Estuary
a t h a s . D and 6, 1981 - 1982. . . . .
25. O2 in t he waters of the Pamlico River Estuary, 1981. * . . * 87
26. A S O ~ ~ - and N H ~ and FRP i n t he waters of the Neuse and Pamlico River Es tuar ies i n June, 1981, . . . . 88

LIST OF TABLES
1 . Characteristics of the Neuse and Pamlico River watersheds and es tuari es . . . . . 13
2 . Analytical methods and re1 a t i ve precision of analyses . . . . . 19
3 . Pamlico River Estuary variation study data . . . . . 24
4 . Neuse River Estuary variation study data . . . . . 25
5 . Mudlsand ratios for the amounts of nutrients and carbon m-2 ( t o a depth of 10 cm) in the variation study cores from the Neuse and Pam1 i co Ri ver Es tuari es . . . . . 28
6 . Calculated turnover rates for particulate C . N . and P i n the top 10 cm of sediment i n the Pamlico River Estuary . . . . . 28
7A . 1981 Pam1 ico River Estuary surface sediment chemistry . . . . . 33
7B.Comparison of the chemistry of the surface and 10 cm muds . . . . . 33
8 . Summary of 613C values for freshwater and marine sources . . . . . 39
9 . Nitrogen fractions i n the upper 10 cm of mud sediment in the Pam1 i co Ri ver Estuary . 1981 . . . . . 39
10 . Pamlico and Neuse River Estuary water chemistry data.June. 1981 . . . . 48
11 . Regression equations of concentrations of N H + and FRP on O2 in the bottom waters of the Pamlico River ~ s t u a ? ~ . 1981 . . . . 60
12 . Diffusional flux data for the Neuse River Estuary . . . . 60 13 . Increase i n N H ~ ' . FRP and Si concentrations of the waters in
the Neuse River Estuary due t o flux from the sediments . . . . 61 14 . First order summary of nutrient fluxes t o and within the
Neuse River Estuary . . . . . 62
15 . Diffusional flux of s i l i ca from the pore waters of the Pam1 i co Ri ver Estuary . 1981 . . . . 66
16 . Total annual diffusional flux and nutrient uptake by phyto- plankton i n the Pamlico River Estuary . . . . . 66
17 . 1982 Pam1 i co River Estuary pore water regression equations . . . . . 72
18 . Flux and production of DICy N H ~ + . and FRP in three cores from Indian Island. August. 1982 . . . . . 72

LIST OF TABLES, cont.
Respiration, fluxes , decomposition, and nutrient regeneration i n sediments of the Pam1 ico River Estuary. . . . . 78
20. Enrichments of 5 0 ~ ~ - in the surface and bottom waters d u r i n g a transect study of sectors D , E , F , and G ( F i g . 1 ) i n the Pam1 i co River Estuary, 74 July, 1981 . . . . . 83
21. Measured rates of sop2- f lux in the Pam1 ico River Estuary. . . . e 83
22. Chemosynthesis and photosynthesis i n the Pam1 ico River Estuary . . . . 9 0
23. Preliminary organic carbon budget fo r the Pam1 ico River Estuary. . . . 90

CONCLUSIONS AND RECOMMENDATIONS
1. We extend some ear l ie r descriptions of the upper, 01 igohaline (or Zone 1 ) areas of the Neuse and Pamlico River Estuaries and the lower two-thirds (mesohaline Zone 2) t o include differences between these zones in sediment grain size, origin and biogeochemistry of sedimentary organic matter, and downriver gradients in biological processes in the sediments. Zone 1 i s in- fluenced by the seasonal runoff of nutrients, carbon, and detr i ta l clay min- erals from major freshwater tr ibutaries. Some of these materials persist in the deeper sediments and can be distinguished from Zone 2 sediments by higher organic carbon/total nitrogen ratios and lower 61% values. The lower two- thirds (Zone 2 ) of these estuaries are more dependent upon phytoplankton and also on potential inputs of organic matter from Pam1 ico Sound and i t s eroding shoreline peats.
The f i r s t year that we studied these estuaries (1981) was exceptionally dry, and i n this extreme case, a third zone near the mouth of each estuary can be identified that differs from the other two. In the second, or middle, of these three nones, concentrations of nitrogen and phosphorus in and fluxes from the sediments are lower than those in Zone 1 ( the migrating freshwater/ seawater interface) and higher than i n the t h i r d zone near Pamlico Sound. Zone 3 appears to be more continuously affected by bioturbation and water column turbulence. Zone 2 sediments do not exhibit strong downriver gradients such as those between Zones 1 and 2 or Zones 2 and 3. These zones correspond t o our study sections C and D (Zone I ) , sections E y F , and G (Zone 21 , and section H (Zone 3) . Zone 3 may have close a f f in i t ies w i t h the unstudied sed- iments of Pamlico Sound.
2. Previous studies of the Pamlico and Neuse River Estuaries have shown that nutrient demands of phytoplankton could be met by recycling within the water column. Also, during high wintertime runoff, nutrients from the watersheds supplement those which are recycled i n the estuaries. Nitrogen flux from the sediments during summer and fa1 1 (when runoff i s low) i s similar i n magnitude t o that from the watershed during winter.
Nutrients in the sediments are ultimately derived from sedimentation of phytoplankton and other particulates. Also, of the calculated amount of ni- trogen and phosphorus in sedimenting material, only about half i s subsequently returned to the water column by diffusion. There appears to be significant amounts of nutrient recycling withjn the sediments as we9 1 as i n the waters, including autotrophic fixation of CO2 in the dark by several types of chemo- l i thotrophic bacteria. Previous studies have emphasized 1 i ght-dependent C02 fixation i n the water column t o the exclusion of dark sediment processes. More work i s needed on sedimentary nutrient cycling to establish the magnitude of i t s contribution to food webs.
3. Estuaries are subject t o dramatic short- and long-term variations. Hydro- logic differences between 1981 (very dry, low runoff) and 1982 (normal rates

of freshwater runoff) gave very different impressions of the importance of di iferent carbon sources in these estuaries. Short-term (monthly) studies should consider these variations when projecting results that have long-term implications. Short-term events, such as freshwater runoff i n winter and phytoplankton blooms in upriver areas, are often abrupt and may be missed by routine monitoring. Nonetheless, t h o contribution of organic carbon by these short-duration blooms i s vital t o the benthic community of commercially valuable food webs.
4. Although Pamlico Sound i s by f a r the largest estuary in North Carolina and one of the largest bar-built estuaries in the world, i t has received min- imal research attention. Aside from ongoing studies of commercially impor- tant fish and shellfish and a few studies in the 1960s and early 1970s on bathymetry, sal ini ty distribution, sediment grain size and organic matter con- ten t , and phosphorus concentrations in the water column (one transect), l i t t l e i s known about th is vast region. Much more research i s needed on (1) the ex- change of carbon and other nutrients between the Sound and the estuaries, and (2 ) the effects of sa l t wedge formation and migration on nutrient cycles with- i n the estuaries.
5 . Depletion of dissolved oxygen (anoxia) due t o thermohal ine s t r a t i f ieation i s a common and natural occurrence in bottom waters of these and many other estuaries. Some consequences of anoxia, such as f ish and shellfish mortality, have received widespread publ i c attention during the past decade. F i sh ki 19 s have also resulted from phenomena apparently unrelated to bottom water anoxia, such as viruses and toxic excretions from certain algae. As these estuaries receive more attention and use for recreation and fishing, i t i s recommended that the publ i c be made aware that many perceived problems of estuaries are normal ecological functions. Other consequences of bottom water anoxia in- clude rapid recycl i n g of nitrogen and phosphorus to surface water phytopl ankton, and enhanced mobilization of less oxidized forms sf iron, sulfur, and nitrogen which are then available t o support CO2 fixation into biomass of autotrophic organisms other than just phytoplankton. The importance of these pathways i s just beginning to unfold for these and other estuaries.
Standards for nutrient loading and chlorophyll a concentrations that apply to lakes are not necessari ly appl i cable t o estcaries. Scientific studies on estuarine processes i n North Carolina can be valuable i n resolving differences between manageable (such as f e r t i 1 izer runoff) and unmanageable (such as bottom water anoxia) aspects of estuarine function. We need to pro- vide a conceptual framework for the value and direction of further studies and for education of the public on the ecological value of these resources.

INTRODUCTI
A11 estuaries contain inorganic and organic sediment which i s supplied from up1 and rivers, the adjacent ocean, peripheral marshes, and autochthonous production. When sediments are delivered t o and resuspended i n the water column, they become an active, integral part of the biogeochemistry of the estuary (Biggs, 1970). The relative importance of each source of sediment varies with the river sediment load and flow rat io , ambient t idal velocity, area of marsh, and the autochthonous productivity of the estuary. Of these, the flow rat io (13 h freshwater inflow/ti dal prism volume) largely determines the amount of freshwater organic matter relative t o that from marine sources.
Of equal importance, although rarely discussed, i s the transformation of imported dissolved materials into deposited particulate matter. For example, dissolved inorganic carbon (DIC, as either CO or HC03-) i s "imported" from rivers, the atmosphere, and the ocean, as we1 ? as being actively recycled via decomposition of a1 lochthonous organic matter. This DIC i s converted t o par- t i culate autotrophic biomass--the phytoplankton, macroal gae, and other material which often dominate the annual organic input t o an estuary (Davis e t a l . , 1978; Kuenzler e t a l . , 1979; Matson, 1982). Further, a substantialamount of this organic ma-ei's biochemically oxidized by dissolved ~ 0 ~ 2 - that i s i m - ported with t idal waters (Jorgensen, 1977a, Indrebg4 e t a1 . , Howarth and Teal, 1979). The resulting ~ 2 - often precipitates w i t h ~ e ~ ' ( a n d forms the familiar black colored muds of estuaries) and subsequently matures into relatively re- fractory pyrite which may account for a significant amount of the weight of sediments (Berner, 1971 ; A1 le r , 1980a). Also, partial ~ 2 - oxidation products such as So have been shown t o account for an important ercentage of bulk density i n some sediments (Troelsen and Jorgensen, 1982 7 .
The inorganic fraction of estuarine sediments i s by f a r the largest and accounts for 80 to >90% of the weight. In temperate estuaries, i t occurs pri- mari ly as detri tal quartz sand and a1 umino-si 1 i cate clay minerals. Patches of biogenic CaC03 occur in mollusc habitats. Dobbins e t al . (1 970) and Hartness (1977) studied the distribution of common cla~m%ierals (kaolini t e , i l l i t e , montmorillonite, and chlorite) i n the Pamlico River Estuary (PRE).
The i n p u t from rivers i s of obvious importance, especially to biogeo- chemical cycles i n estuaries during post-deposi tional a1 terations (diagenesi s) of the sedimentary material. kiverborne clay minerals undergo significant morphological and chemical changes when the s a l t content approaches 0.5 O/oo (Berner, 1971 ) . These changes include shrinkage, swell ing, and complexation wi h dissolved (DOM) and coa ulation with particulate organic matter (POM), 9 FeSi, S i , phosphate, and NH4 (Upchurch e t d. , 1974; Eckert and Shol kovi t z , 1977; Boyle e t a l . , 1977; Shol kovitz -- e t x., 1978; Eaton, 1979; Rosenfeld, 1979; Morris e t fl. , 1981). These processes, including precipitation reac- tions not invxving clay minerals, result in the rapid deposition and accumu- lation of Fe, P, POM, and Si in the low sal ini ty portions of estuaries. Re- cycling of Fe, P , and Si back into the surface waters, together with large inputs of NO3- from freshwater during la te winter and spring may stimulate the frequent phytoplankton blooms i n the PRE (Hobbie, 1974; Kuenzler e t a1 . , 1979).

Material imported from adjacent s a l t i e r waters i s a l so q u i t e important. Kuenzler e t a1 . (1979) ca lcu la ted t h a t 85 and 70% of t h e gross annual D I C and TOC, r e s p E t F e l y , imported t o the PRE comes from Paml ico Sound. Conversely, Davis e t a1. (1978) concluded t h a t Paml ico Sound was a ne t s ink of OM from the es tuary , and accounted f o r a l o s s of 20% o f the annual f reshwater and auto- chthonous organic carbon load. These i n t e r p r e t a t i o n s merely conf irm t h e d i f - f i c u l t y invoived i n attempts t o measure (Heinle and Flemer, 1976; Woodwell e t a1 . , 1977) and model (Head, 1976; Nixon, 1978) e s tua r ine carbon f lux . --
Organic matter i n t he sediments i s t h e l a r g e s t s i n g l e energy r e se rvo i r f o r microbial a c t i v i t y and the associated d e t r i t a l food webs of e s t u a r i e s (Fenchel and Jorgensen, 1977; Haines and Montague, 1979; S ibe r t and Naiman, 1979). I t maintains redox gradients which a r e important i n es tab7ishing chemical equi 1 i b r i a (Berner, 1974, l98O), cont r ibu tes t o ion sorpt ion capaci ty (Rashid, 1969; Mu1 l e r , 1977; Rosenfeld, 1979), and undergoes decomposition t o inorganic nu t r i en t s (Hale, 1975; Nixon, 1981). In view of these r o l e s , t he source and f a t e of this material must be iden t i f i ed t o a t l e a s t i n i t i a l l y evaluate t he dependence of e s tua r ine food webs on autochthonous organic mat te r in comparison with t h a t imported from adjacent land and water.
I
Undoubtedly, t h e hydrographic and geomorphic s e t t i n g of a p a r t i c u l a r es tu- I
ary wi 1 I influence t h e r e l a t i v e importance of each carbon source (We1 sh e t a1. , 1982). One of the approaches t o t h i s problem involves t he ana lys is of s S b F ~ carbon isotope d i s t r i bu t ion (Sacket t , 1964; Degens, 1969; Haines, 1976). Ter- I
I
r e s t r i a l vascular p lan ts contain organic carbon which i s i so top ica l ly 1 i g h t e r than t h a t f ixed by es tuar ine and marine p lan ts (Smith and Epstein, 1971 ; McMillan e t a l . , 1980). Changes in t he isotope r a t i o i n space and time within an estuary can provide evidence f o r the r e l a t i v e importance f d i f f e r e n t car-
15' bon sources. I so topica l ly l i g h t e r organic carbon ( w i t h a 6 C more negat ive than ca.-24 O/oo) would predominate where t e r r e s t r i a l p l an t s suppl ied most of t he o E a n i c matter and heavier carbon (6I3c more pos i t i ve than ca.-99 O/oo) would e x i s t i n areas where estuarine/marine sources dominate. E g n i n (unique t o higher t e r r e s t r i a l p l an t s ) and s t a b l e carbon isotope data from e s t u a r i n e sediments repeatedly show t h a t , w i t h d i s tance from freshwater runoff , a de- creasing proportion of the organic carbon i s t e r r e s t r i a l 1y derived (Sackett and Thompson, 1963; Hedges and Parker, 1976; Pocklington, 1976; Shul tz and Calder, 1976; Naiman and S i b e r t , 1978; Rashid and Reinson, 1979; Tan and S t r a i n , 1979). A downriver increase in t he s t a b l e isotope r a t i o of the or- ganic carbon may indica te t h a t t h e marine/freshwater organic carbon input r a t i o i s increasing. However, t h e d is tance over which t h i s occurs i n t h e Mississ ippi River i s surpr i s ingly s h o r t considering i t s high discharge (Shul t z and Calder, 19961, even when low s a l i n i t y (c5 O/oo) f loccula t ion reac t ions a r e taken i n t o account (Shol kovitz, 1976; Morris e t a1 . , 1978). The models on which these conclusions a r e based include only t e r r e s t r i a l and marine carbon sources and of ten exclude poten t ia l input from autochthonous production of or- ganic carbon. I f the es tuar ine waters have a long residence time (weeks t o months), endemic phytoplankton wi l l make subs t an t i a l cont r ibu t ions t o t h e sr- ganic carbon 01 of the sediments (Davis e t a l . , 1978. Kuenzler e t a l . , 19791. 95 -- Because the 6 C of DIC var ies w i t h s a l i n i t y , a lgal 61% values wi l l vary cor- respondingly, assuming constant f r ac t iona t ion during photosynthesis (Spiker

and Schemel, 1979). Therefore, changes in the isotope ratio of sediments may only reflect the results of an increase in the isotope ratio of CDIC and pro- duction of organic carbon by estuarine a1 gae.
However, the structural materi a1 of te r res t r i a1 plants i s often consider- ed t o be more resistant t o decomposition than phytoplankton, and, i n spi te of high rates of autochthonous production, we thought that te r res t r i a1 carbon might be the major residual (undecomposed) pool i n these sediments. Several observations made i n the PRE support this hypothesis.
1 ) The average residence time of estuarine waters i s approximately 3 months: estuarine volume of 9 .6 X 108 m3 divided by tributary runoff of 39 X lo8 m3 yr-l = 0.246 years. However, since 70% of runoff occurs between January and April, average freshwater residence time i s closer t o 1 month. In any case, sufficient time i s available for deposition of freshwater carbon.
2 ) Total annua runoff of organic carbon from tributaries i s 8.6 X lo8 mol POC yr'] and 23 X 108 mol DOC yr-l (Davis e t a1. , lW8), and, assuming that 5% of the DOC flocculates into P E E r sedi enta ion (Schol kovitz, 1976), an estimated total of 3.4 mol POC rn'y yr-! i s potential ly available for sedimentation.
3) Phytoplankton production ranges between 21 and 42 mol OC m-2 yr-1 (Davis - e t -* a1 3 1978; Kuenzler e t a1 . , 1979) or up t o 8.1 times the POC input and about 4 times t h e t o t a l OC i n p u t from land. However, estimates of respiration i n the water column are sufficient t o account for the decomposition for most of phytoplankton production (Davis e t a1 . , 1978). --
Thus, suppl ies of the isotopically 1 ighter te r res t r ia l carbon are 1 arge and, i f i t i s refractory material, i t should accumulate fas te r than the more labi le carbon produced by autochthonous phytoplankton. These two carbon sources fortunately differ i n another distinguishing characteristic: the structural material of terrestr ia l plants has a much higher molar C/N ra t io (20 to ,200 than phytoplankton, which averages 5 t o 10 in the PRE (Kuenzler e t a1 . , 1979 -- Submersed macrophytes contribute only a minor portion of the organic carbon in the P R E (Davis and Brinson, 1976). Terrestrial plants are therefore the major known source of organic carbon w i t h a h i g h C/N ratio. The unmeasured i n p u t from Pamlico Sound, which may be significant (Kuenzler e t a l . , 1979) and con- tain a h i g h concentration of eroded marsh materials (Be7i-i-et a l . , 1975), could c use serious interpretation problems. Some marsh material has a very B light 6 3~ rat io and most of i t has a high C/N ratio. In any case, previous workers have concluded that phytoplankton carbon i s the most important source i n the PRE. The particulate matter suspended i n the water column (seston) and that freshly deposited on the bottom downriver of freshwater deposition zones should therefore reflect the isotopic and stoichiometric composition of phytoplankton and i t s decomposition products, especi a1 1y between May and October when runoff i s negligible. The residual permanent sediments below the upper 20 cm bioturbation zone should have an isotopic composition similar t o that of refractory organic carbon which has been hypothesized t o consist of terrestr ia l debris. This scenario i s complicated by i n s i t u , postdepositonal --

( i .e. , diageneti c ) formation of potential ly refractory humic material in mFrTne sediments (Nissenbaum and Kaplan, 1 9 7 2 ) . These workers further showed that the "authigenic" humates (presumably synthesized from phytoplankton de- composition products) had a much higher N and S content than those of ter- restr i a1 origin. Therefore, no unequivocal index or characteristic of carbon isotopes or stoichiometric ratios exists for explicit identification of the source of residual , sedimentary carbon.
This in i t i a l investigation of the sediment in the PRE and Neuse River Estuary ( N R E ) therefore included analyses of both the stable isotope di s t r i - bution, and the C/N and C/P ratios of the recently deposited flocculent sur- face sediments as well as of the deeper residua1 sediments. We also analyzed the isotope ratios of other potential carbon sources such as woody debris, leaves, seston and DOC in freshwaters, peripheral peat and plants from marshes, and ocean water and beach carbon from the Outer Banks.
Organic Carbon Turnover in Sediments
The actual chemical composition of sediments i s controlled by several in- teracting, sequential, and recycling processes (Berner, 1980). F i rs t , the or- ganic matter of the surface sediments should reflect the stoichiometry of the source material, i t s decomposition residue, plus the biosynthetic products of heterotrophic consumers (Haines and Montague, 1979). If organic matter decom- position in sediments i s the only biochemical process which affects i t s con- centration, then sediments should become less organic w i t h depth below the zone of bioturbati on. Refractory materials should accumulate relative t o the total organic pool which, i n turn, should decrease i n s ize- Unfortunately, very l i t t l e i s known about the nature of edimentary organic matter other than i t ( a ) accumulates, ( b ) often has "old" l&-carbon, and (c) doesn't disappear as fas t as metabolic rate data predict (Davies, 1975; Heinle and Flemer, 1975; Hartwig, 9976; Jo i r i s , 1977).
We do know that the total annual organic input i s often equivalent t o 7 0 4 0 % of the content of the upper 10-20 cm. Thus, average organic carbon turnover time i s 21 year and incomplete or partial decomposition i s implied since organic matter does accumulate (e.2. Turekian e t a l . , 1980). A very 1 abi 1 e fraction a t the sediment-water Tnterface presEany decomposes much faster than material in deeper sediments bu t th i s may merely ref lect the dis- tribution of oxidants and consumers. All who have previously studied the nutrient dynamics in the water column of North Carolina estuaries have imp1 i - cated the sediments as a major factor in nutrient cycling and productivity (Hobbie, 1974; Davis e t a l . , 1978; Kuenzler e t a l . , 1979; Stanley and Hobbie, 1981). Fisher e t al.71982a) have provided K e f i r s t direct estimates of nu- t r i en t flux a c r E s t h e sediment surface in brackish North Carolina waters. They showed that about half of the water column N demand of phytoplankton near our NRE Sta. G (Fig. 1 ) could be met by NHqS flux from the sediments. In the Chowan River, N . C . , Kuenzler e t a l . (1982) found that the sediments only sup- plied a maximum of 20 and 2% of gross N and P demand of phytoplankton, re- spectively.

NORTH CAROLINA 1
Fig. 1. The Neuse and Pamlico River Estuary study sections C through H . Our 6 routine Stas. were located within these sections.

We therefore included studies of bulk sediment chemistry, especially that of the active surface layer, in our experimental design t o t e s t the hypothesis tha t , as elsewhere (Nixon, 1981 ; Cal lendar and Hammond, l982), sedimentary nu- t r i en t exchange with the water column of the PRE and NRE i s an important part of their geochemistry. Presumably, the particulate organic sediments are the materials which, af ter complete or partial decomposition, appear in the dis- solved phase in the in te rs t i t ia l (pore) waters. Some of these solutes are subsequently transported by a variety of mechanisms t o overlying waters. There, they may be exported from the estuary or resynthesized into organic matter and redeposited in the sediments. Also, chemical reactions a t the sediment/water interface may prevent movement of pore water solutes into over- lying waters (A1 le r , 1980a;Berner, 1980).
Chemistry of Sedimentary Pore Waters
Relative t o the solid phase of sediments, pore waters contain very l i t t l e C, N , P , Fe, and S. These solutes do accumulate, however, and concentrations may exceed those in the overlying surface waters by several orders of magni- tude. Only when there i s a chemical or biochemical sink in the sediments, a phase change, or abrupt change i n sa l ini ty do pore waters have lower concen- trations than overlying waters. Examples are 02 and ~042- which are reduced during respiration; overlying waters then become a net source to the pore waters.
Diffusion of solutes across the sediment-water interface and mass move- ment of pore water fluids are the major mechanisms for recycling nutrients and other chemicals t o the water column (Berner, 1980). This benthic boundary layer i s a dynamic and poorly understood interface and has been the subject of many discussions (e.2. , McCave, 1976). Particulate organic materials are "remineralized" t o dissolved constituents via interacting chemical and bio- .- chemical processes. Some soluble inorganic materials are simultaneously con- verted t o the particulate form; g.g . , FRP to Fe-P-complexes i n oxidized sedi- ments and S2- to FeS in reduced ones. The reverse i s also true; many con- sti tuents are solubilized under anoxia and become much more mobile in the pore waters ; e.2. ~ n 2 + , ~ e 3 + - ~ + F ~ ~ + + F R P . A substantial amount of research has been done i n recent years on the characteristics , mechanisms , rates , causer, and consequences of pore water solute exchange with the particulate phase (Rittenberg e t a1 . , 1955; Vanderborght e t a1 . , 1977; Rosenfeld, 1979; Krom and Berner, 'l980a) and w i t h the overlying waters (Hartwig, 1976; Hale, 1975; Rowe -- e t a l . , 1975; Aller, 1978). Berner (1980) has provided a concise, thorough review.
Biogeochemical species of interest i n our flux studies include DOC, DIC, SO$-, C1-, NHq+, FRP, and Si. C , N , P , and Si are deposited on the sediments 1 argely as parti cul ate organic matter. In the anoxi c sediments, bacterial de- composition of OM produces DIC, N H ~ + , FRP, and Si as we1 1 as bacterial biomass and the reduced form of the oxidant. The DIC may precipitate w i t h ~ a 2 + d u r i n g shell growth and during authigenic formation of calci te , dolomite, and ara- gonite. I t may also be refixed into (CHZO)~ by bacteria and other autotrophs,

or diffuse or bubble o u t of the sediment depending on pE. The N H ~ ' may bind t o cation exchange s i tes on organic matter or clay, although these s i t e s may be saturated prior t o deposition in the sediment depending upon sal ini ty changes. Rosenfeld (1979) showed that there was twice as much N H ~ ' bound t o cation exchange s i tes as was present in the pore water of Long Island Sound sediments. Potassium may displace :ome N H ~ ' from these exchange s i t e s when pore water salinity increases. NH4 may also diffuse upwards through the pore waters and be oxidized t o NOz' and NO3' by nitrifying bacteria or be taken up for anabol i sm a t the sediment surface. A1 though struvi t e (MgNH4PO4-6H20) formation i s often thermodynamical ly favored (Berner, 1980) , there i s only indirect evidence for i t s occurrence in estuarine sediments (Martens e t a l . , 1978; Berner, 1980). Struvite formation has been suggested or observed in 1 aboratory studies of decomposition of nitrogen-ri ch organic matter (Malone and Towe, l97O), during a r t i f i cia1 additions of orthophosphate t o rich seawater (Handschuh and Orgel , 1973), and in cultures of ~ ~ $ - - r e d u c i n ~ bacteria (Hal 1 berg, 1972).
Phosphorus as reactive ( R P ) or f i l te rable reactive P (FRP) i s subject to similar processes. Phosphate i s taken up for anabolic purposes (ATP formation and membrane synthesis) and intracellular P pools often reach mM levels
e l l e , 1975). I t may, in the oxidized surface sediments, precipitate with L:g+ (Upchurch e t a l . , 1974) or bind t o anion exchange s i tes . Authigenic formation 'of a p z i c (Cag(P04)3(OH)), which requires CaC03 nucleation s i t e s (Berner, 1974 ; Martens e t a1 . , 1978) and viviani t e (Fe3(P04)2 *8~2O) (Bray e t a l . , 1973) are also frequently predictable. However, as for s t ruvi te , -- formation of these minerals in sediments has not b eh widely demonstrated, 5 although they seem t o occur i n sediments where SO4 ' i s depleted (Martens e t a1 . , 1978). In the PRE, Upchurch e t a1 . (1974) found a substantial amount - of K e P associated with Fe. Strom a z m g s (19821 showed that downriver gradients and concentration of total phosphorus (TP) were significantly cor- related w i t h sa l ini ty ( r = -O.81), Fe ( r = +O.gZ), A1 ( r = +O.86), percent sand ( r = -0.57), CaC03 ( r = -0.63), and percent organic matter ( r = +O 54) in the Delaware River Estuary. In anoxic sediments, upward diffusion of 52- may displace RP from Fe complexes and cause the precipitation of FeS and the re- lease of RP into solution (Krom and Berner, l98Oaj. This may be one of the most important mechanisms for delivery of RP back t o the surface sediments and waters. Anoxic conditions in the upper sediments and bottom waters re- cycle vast quantities of P (Cabaniss, 1982; Nixon and Roques, 1982) for re- synthesis i n t o biomass and redeposition in the sediments. The continuous sup- pl of ~e~~ from rivers and of 02 - via turbulence (for oxidation of FeS t o ~ e j + + Soxid jzed) prevents the permanent burial of P in deeper sediments by causing seasonal accumulation of FeP a t the sediment surface. Virtually nothing i s known of biochemical P processes in sediments or pore waters, other than that labile P i s often preferentially released from organic matter.
Hydrologic properties of estuaries have a profound effect on the chemistry of pore waters. Turbulence by wind, t ides , large boat t r a f f i c , and internal seiches often serves to flush the upper pore fluids and surface sediments into the water column. Because surface waters are then adjacent t o nutrient-rich, deeper pore waters, the already large concentration gradient between residual

Dore f l ui ds and overlying waters becomes steeper. The steeper gradient results in more rapid diffusion and may stimulate infaunal irrigation t o avoid anoxia (Aller, 1980b; Waslenchuk e t a l . , 1983). The result i s probably an in i t i a l ly rapid, physically inducedTix., turbulent) decrease in pore water concentra- tions in the surface f loc, and a more rapid depletion of the previously deeper pore waters which are now adjacent t o the sediment surface.
The gradual movement of the s a l t wedge also helps regulate pore water chemistry. In the broad, shallow, coastal plain estuaries of the mid-Atlantic, bottom waters often become anoxi c due t o strong thermohal ine s t ra t i f ica t ion . This process moves the redox discontinuity layer up into the water column and away from the sol id phase materials that react with pore water solutes a t the normally oxidized sediment surface.
Sedimentary Biochemistry and the Benthi c-Pelagi c Feedback System
The teleological appeal of the processes just discussed becomes apparent when the chemistry of the pore waters i s related to the bioenergetics of heterotrophy and autotrophy. Simply stated, anoxia may have a positive feed- back effect on a1 1 functional aspects of estuarine ecosystem energetics. Most of t h ore water constituents exist in their reduced s ta te (~~3.. N H ~ + , 5, DOC, Fez+! which i s energetically advantageous t o those organisms whit? ut i l ize them in anabolism. For example, $stuarine algae will take up N H q , the most reduced form of N, when both N H 4 and NO3- are present (McCarthy e t a l . , 1977; Kuenzler e t a l . , 1979). Anoxia i n the bottom waters and surface -I sed~ments (especially a t t h e sediment/water interface) i s associated with the accumulation of biochemically essential elements, Those materials, such as N H ~ ' , DIC, and Si which do n o t accumulate preferentially a t the sediment/water interface i n the particulate phase, are transported directly into the over- lying waters and become immediately available for rapid uptake. Other mate- r i a l s in th i s category include CH4, Hz, and some DOC, although the l a t t e r often coagulates with Fe and FRP. Thus, anoxia and diffusion provide f ~r re- cycl ing of energeti ca9 ly preferable material t o the surface sediments and over- lying waters where the bulk sf metabolism occurs. Synergistic chemical a d biochemical e ents, such as the abiotic chemical reduction of ~e~~ and Mn 3 a+ by biogenic S ' (and subsequent release o f upwardly mobile RP) also resul t in del ivery of energetically eff ic ient reduced material to producers in the system.
These sequences may be directly responsible for the apparently high pro- ductivi ty of estuaries. Hydro1 ogi c and other physical factors ( including de- position of carbon) virtual ly ensure the existence and maintenance o f anoxia. In spi te of naive objections pertaining t o aesthetics and commercial impacts, anoxia in the sediments i s a normal and vital part of estuarine structure and function. Fish k i l l s (sometimes attributable to intermittent anoxia in the bottom waters) may merely serve t o recycle material back t o ecologically im- portant components of the estuarine food web.
Estuaries are traps for nutrients and organic matter. Organic sediments

which contain and recycle nutrients back t o the water column accumulate under relatively quiescent hydrologic regimes. Thus, another positive feedback mechanism helps t o control estuarine productivity; much of the sediment ac- cumulates under highly productive waters which then redeliver organic material directly back t o the bottom. However, the relative importance of th i s benthic- pelagic coupling appears t o be a function of water depth (Hargrave, 1973). Deep water a1 lows for more decomposition of organic matter before i t has time t o s e t t l e t o the bottom. Conversely, shallow waters w i t h an illuminated sub- stratum often have a h i g h percentage of benthic photosynthesis directly ad- jacent t o the nutrient-rich pore waters. The PRE and NRE apparently have minor amounts of benthic photosynthesis (Stanley, 1971; Davis and Brinson, 1976; Kuenzler e t a1. , 1979). Further, most organic matter in these estuaries i s apparently produced and consumed in the water column by the planktonic com- munity (Davis -- e t a l . , 1978; Kuenzler e t a l . , 1979), b u t benthic metabolism -- has only been studied a t one station in either estuary (Fisher e t a l . , f982a). All who have studied these systems conclude that recycling wi th insra ther than a1 lochthonous delivery of inorganic nitrogen and phosphorus, was by f a r the most significant process affecting phytoplankton productivity (Harrison and Hobbie, 1974; Kuenzler -- e t a l . , 1979). Davis e t a l . (1978) concluded that bottom water anoxia was primarily responsible for high rates of summer photo- synthesis. Thus i t appears that these estuaries are shallow enough for a sub- stantial amount of benthic-pelagic coupling.
Simply stated, Hargrave's (1973) model predicts that as waters become deeper, total productivity and metabolism per u n i t area decrease within cer- tain limits. The fraction of total metabolism which i s benthic also decreases since deeper water allows for more decomposition i n the water column and thereby reduces sedimentation (Oviatt and Nixon, 1975). If Hargrave's model applies to the admittedly small changes in depth of these estuaries ( 2 t o 7 m ) , then we should see a downriver decrease in production, sedimentation, and benthic metabolism. Those who have studied the Pam1 i co and Neuse intensively have frequently observed algal blooms during winter and summer in the upper and middle reaches. If rapid nutrient recycling in the water column i s indeed the major mechanism which supports productivity, then there should be minor differences between up- and downriver rates of photosynthesis. However, the data on photosynthetic gradients downriver are conflicting, perhaps due t o differences in the methods (Davis e t a l . , 1978; Kuenzler e t a1 1979). - , Since nutrient limitation is n o t severe and N and P are rarely, i f ever, de- pleted, i t may be that sunlight, grazing, and/or DIC limit photosynthesis i n these estuaries. Obviously, tes t s of any nutrient coupling model should factor out seasonal f l ux of nutrient-ri ch waters from the tributaries which stimulate winter blooms. These blooms are important and may contribute nearly a third of annual photosynthetic production (Kuenzler e t a1 . , 1979).
To t e s t Hargrave's water depth model, we estimated diffusional flux of , FRP, DIC, S i , and 5 0 ~ 2 - along a downriver transect in both the NRE and a t s ix previously occupied stations (Davis e t a!. , 1978; Kuenzler e t a1 . ,
1979). These estimates are then compared w i t h published rates of allochth- onous nutrient input, -- i n v i t r o uptake, and recycling within the water column in order t o determine the relative importance of nutrient flux from the

sediments t o photosynthesis in the water col umn.
We will describe in la ter sections that our estimates of flux do n o t in- clude the effects of water movement by the physical forces of winds and t ides . Further, the flux models only predict the transport across the sediment-water interface without the effects of phase change events which occur a t the inter- face. As stated earl i e r , the reduct~cl ine (or reaox discontinui t 1 ayer, RDL) dramatically affects the speciation and solubili ty of Fe, RP, SO(-, e t c . , and these alterations, when they occur a t the interface, are not ref ected in flux estimates. Direct measurements of flux with the use of enclosures over the sediment may provide more rea l i s t ic data, b u t they also res t r ic t water move- ment and are d i f f icu l t t o manipulate underwater without a1 tering the integrity of the sediment surface. Comparisons between the two types of methods show that in s i tu rates observed in chambers are often several fold higher than t h o s e p r x t e d by diffusion models (McCaffrey e t a l . , 1980; Klump and Martens, 1981 ; Ca1 lendar and Hammond, 1982; Cabaniss, 1 9 Z ) T The difference i s a t t r ib- uted t o the activity of benthos (e.9. Aller, 1978), water turbulence (Vanderborght e t a l . , 1977; Berner, 1980), and bubble tubes (Klump and Martens, 1980).
Study Objectives
The sediments of shallow estuaries are cr i t ical features that affect nutrient and metabolic cycling act ivi t ies i n the water column. Past studies on the PRE and NRE have focused almost exclusively on the water column. This work represents an in i t i a l attempt t o characterize the sediments of the two estuaries i n re1 ationshi p t o overall biogeochemi cal processes. Our objectives were t o :
7 ) describe the physical properties and nutrient chemistry of the sediments,
2) identify the relative amounts of terrestr ia l and other organic carbon in the sediments using stable ca rb~n isotope rat ios ,
3) estimate nutrient regeneration i n and f lux from the surface sediments and pore waters, and
4) compare these results with those from previous studies of organic carbon flux and nutrient uptake and recycling for a more thorough understanding of the biogeschemistry 06 the Neuse and Pamlico River Estuaries.

MATERIALS AND METHODS
Study Area
The watersheds of the Pamlico ( P R E ) and Neuse ( N R E ) River Estuaries begin in the central Piedmont and extend through the f l a t Coastal Plain t o the edge of Pamlico Sound behind the Outer Banks of North Carolina (Fig. 1 ) . Most of the land in the watershed and adjacent t o the estuaries i s forest and agri- cultural with tobacco, soybeans, and corn being important crops. Along the lower reaches of the estuaries there are we1 1 established s a l t marshes con- sist ing of Spartina spp. and Juncus roemerianus.
B o t h estuaries begin about 60 km upriver from the i r mouths and have a sea- sonally migrating freshwater-seawater interface. A t low runoff rates in the NRE, this interface begins near a pulp and paper mill about 15 km upriver of the U.S. Rte. 1 7 bridge in New Bern (the western boundary of our study section). Aerial photographs and chemical data taken during high runoff show that sedi- ment-laden freshwater overlays a s a l t wedge as f a r downstream as the eastern boundary of section E of both estuaries (Fig. 1 ) . In the Tar River and PRE, th is depositional area and freshwater-seawater interface i s almost always up- river of our study section C. During the exceptionally dry water year of 1981 (Fig. 2a) s a l t water near the bottom was detectable about 20 km u p the Tar River a t Grimesland.
The estuaries have about the same average depth which gradually increases downriver from 2 t o 7 rn, b u t our defined study area of the NRE i s about 11% greater than that of the PRE (Table 1 ) . The difference in w i d t h (hence, volume) would account for the more rapid increase in sal ini ty observed in the NRE below the U.S. Rte. 17 bridge (Fig. 2b, Giese e t a l . , 1979). Average annual sal ini ty a t the mouth of the NRE i s about 2 7 7 0 0 higher than a t the
[mouth of the PRE (Schwartz and Chestnut, 1972; Will iams - e t -* a1 9 1973). B o t h estuaries have been described as natural, temperate, oligo- t o mesohaline drowned river valleys (Hobbie, 1974; Hobbie and Smith, 1975). Salinity ranges between 0 O/oo and 20 O/oo depending on freshwater runoff and s a l t wedge migration. The barrier islands (Outer Banks) and river runoff dampen the astronomical tides t o about 10 t o 20 cm. However, wind-driven water accumula- tion and depletion can cause 1 m tides a t the extreme.
Studies of the biology and chemistry of the waters and sediments of b o t h estuaries are continuing, b u t the PRE has been more extensively examined. A nutrient chemistry monitoring program on the PRE began in the 1960s by N . C. State University with support from Texasgulf Chemicals, Inc. , WRRI , and other agencies. This work i s being continued by the Inst i tute for Coastal and Marine Resources, East Carol ina University , wi t h support from Texasgulf Chemicals, Inc. Early work concentrated on the distribution of nutrients and phytoplankton due to concern over eutrophication from agricultural , municipal, and industrial sources. A thorough review of th is early work on the water column i s in preparation (Hobbie and Peterson).

N E E RVER
W L I C O RIVER 0.38uhos w
Fig. 2 . ( a ) Freshwater d i scha rge o f t h e Tar River 79 km u p r i v e r o f t h e U.S. Rte, 17 br idge over t h e Pamlico River Estuary . Discharge a t t h e b r i d g e is ca. 2 t imes t h a t a t Tarboro (U.S.G.S., 1981). (b)- ownr river i n c r e a s e i n c o n d u c t i v i t y averaged over t h e 10-year per- iod 1957-67 and e x t r a p o l a t e d towards observed c o n d u c t i v i t i e s a t t h e mouth (Revised from Giese e t a1 ., 1979).

Table 1 . C h a r a c t e r i s t i c s of the Neuse and Pamlico River watersheds and e s t u a r i e s .
PAM1 I CO NEUSE
Watershed Area ( km2) Total Upriver of U.S. Rte 17 br idge
Surface Area of Estuary ( h 2 )
Depth (m)a Mean f 1 S.D. Range
Sal i n i t y Maximum (o/oo)
Mater Temperature ("C)
P r e c i p i t a t i o n (an)
Population (1970)
Land Use (%I Farming & Disturbed Fores t Undisturbed Fores t Urban
300,000 709,900 (40% urban) (mostly urban)
aDepth da ta f o r our s i x r o u t i n e s t a t i o n s C-H.
b ~ r o m U.S. D.A. Soi 1 Conservation Serv ice (1977).

Sediment Sampl ing
Samples for a11 dissolved and particulate nutrients were obtained by divers using precut polyvinyl chl ori de ( P V C ) core l iners and rubber stoppers or plastic caps (Fig. 3a). All core 1 iner material had been previously scrubbed clean and soaked in estuary water for several days. On station, a core l iner was slowly inserted in the sediment, stoppers or caps (with small holes for supernatant water escape) were placed on the core l iner , and then the core was l i f ted out of the sediment by pushing upwards on the stoppered lower end of the core. This method minimized changes in pressure and pore fluid movement within the core and allowed for more accurate measurements of wet bulk density. The cores were handed t o a person in the boat who imrnedi- ately p u t the core i n a bucket fu l l of mud obtained from the f i r s t station. The bucket was shaded from sunlight and the cores were thereby maintained a t in s i tu temperatures and near darkness. PRE cores were transported by boat -- t o the Pamlico Estuarine Laboratory ( P E L ) a t Aurora (1-3 h ) and the NRE cores were transported by boat t o a launch s i t e ( u p t o 6 h) and driven to PEL ca. 2 h ) . L
Some samples of surface sediment flocculent layer for 6% analysis were obtained by divers who manually resuspended this material and entrapped i t in acid-cleaned 500 ml 1 inear polyethylene ( L P E ) bottles. The f i r s t set (March, 1981) of sediment samples from the NRE were obtained with an Ekman dredge. In th is c se, the top (brown) layer was scraped off with a spoon and p u t in a 8 Whirl-Pac bag.
Water Sampling
In the f i e ld , standard hydrocast data were obtained with meters made by Ye1 low Springs Instrument Company. A Heathkit Model MI-1 9 fathometer was used t o measure water depth, Surface and bottom waters were a11 obtained in acid cleaned LPE bottles a t 0.2 m below the surface and 0.7 m above the bottom by divers. All samples were kept a t i n s i t u temperatures and returned to the laboratory where they were either T l Z d processed imediately or re- frigerated. Surface and bottom waters for , FRP, and C1- analyses were f i l te red through Gelman type A/E (ca. pm pore s ize) which had been rinsed with several small volumes of f j j i l e prior to saving the l a s t f i l t r a t e for nutrient analysis. Fi l ters for 6 C and $ 0 ~ 2 - analyses were precombusted a t 450°C for a t least 9 h . Suspended material on f i l t e r s was dried fo r a t least 4 h a t 85°C.
In S i t u Pore Water Sampling
Porous ceramic cups (Soil Moisture ~ o r p . ) were soaked i n acid, thoroughly rinsed, and soaked in estuary water for several days prior t o installatjon in the sediment. On s ta t ion, the samplers (Fig. 3b) were f i l l ed w i t h ambient bottom water, pushed into the sediment between 2 and 30 cm deep, and l e f t i n s i t u for up t o 3 mo. Inl'tial and final samples of bottom and sediment p o r r -

- WTbIN WITH SCUBA a
- PLbCE IN H I 0 W W T --FORT TO LbB
\ -OECIUIT+U.ERNATM
man CORE
m LmER fi€ASEEYBLEf
llTn BLACK TAPE
WATER TWOUH ACID-
CLEIUED BfF IYX,
CO-&JO ml I W N S - W I P CAP W U R W F l L U 14 RUBBER STOPPER - FIIEELE S E U Y N T - W E D I A T E L I ((14h)
ANALIZE COIE W A m K
Fig. 3 . Sediment and pore water samplers. (a) PVC coring device with a flow chart of procedures for obtaining pore waters under N2. (b) Soil Moisture Samplers that were l e f t i n s i t u for pore water -- sampl ing. Subsampl ing containers and Npf i 11 ed syringes shown t o i l lustrate maintenance o f anoxia.

water (described below) were obtained t o calculate rates of ~ 0 ~ ~ - reduction and C1' migration through the sediment. This was done by comparing the rate of change of the S O ~ ~ - / C I ' ra t io i n the samplers with that i n cores taken
I
from adjacent sediment a f te r correction for differential diffusion (see below) of the two ions. Samples were obtained in s i tu by withdrawing the contents -- with a syringe while replacing sample volume w ~ t h N2 from another syringe ( F i g . 3 b ) . Waters which flowed into the samplers from the surrounding sediment were used for analysis of dissolved organic carbon ( D O C ) and the isotope ratios in DOC and dissolved inorganic carbon (cDIC, "C02").
Carbon Isotope Sample Storage and Analysis
Subsamples of sediment, pore water, suspended material, marsh peat. and plants, beach sand, ocean water, t ree leaves, macrodetritus on the river bot- tom, twigs, logs, and worms were imneaiately preserved for shipment by over- night a i r freight t o Coastal Sciences Laboratories, Port Aransas (now located in Austin), Texas for stable carbon isotope analysis by mass spectrometry. Suspended material, mud, sand, leaves, worms, a d marsh materials were dried a t 85-"C and stored i n a desiccator in Whirl-Pa d bags prior t o shipment, while some mud samples were shipped frozen. Water samples for DOC and DIC a alysis were kept i n acid cleaned LPE bottles completely wrapped w i t h Paraf i l& and ei ther refrigerated (2°C) or frozen (DOC only) until shipment. Large par- t iculate materials were dried as above, ground in a Wiley Mill, and kept i n whirl-pa& bags i n a desiccator.
A t Coastal Science Laboratories, dried sediment and seston samples were treated with HC1 t o remove carbonates prior to analysis. Collection of C02 from oxidized sediment and seston followed Sofer (1980). Water samples f o r DOC analysis were acidified t o convert DIC t o C02 and sparged w i t h N2 to re- move the Cop. When DIC was analyzed for 61% in these samples, the sparged C02 was trapped and analyzed. DOC was oxidized w i t h KMn04 and the generated C02 was handled as above. All 61% values are relative t o the Chicago PBB standard, where
9 1 3 ~ = 1 3 ~ / 1 2 ~ sample , 1000. 1 3 ~ / % standard
Precision was 20.2 O/oo for particulate and 9 . 5 O/oo for dissolved carbon (K. Winters, Coastal Science Laboratories, personal cornmuni catjon) .
Sectioning of Sediment Cores
A t the Aurora lab, cores were kept near ambient temperature in the mud buckets for 1 to 24 h prior to sectioning. In winter, the mud buckets were placed outdoors or i n the refrigerator. During summer, the buckets were stored outdoors in the shade or in the laboratory.
All cores for pore water analysis were sectioned in N2-filled glove bags

( I2R Industries). Super-dry, hospital grade N2 was obtained from a local con- tractor and no precautions were taken against possible trace 02. All materials in the glove bag were completely flushed w i t h N2 prior to putting the core in the bag. Once inside the bag, the precut, 2 cm sections were sequentially untaped from the top and funneled into acid cleaned 250 cm3 poly- propylene centrifuge bottles. Six sections were routinely taken from each core a t depths of 2, 4, 6, 8, and 18 cm below the top surface section (Fig. 3a). The depth of this surface section varied between -0.2 and 3.0 cm depending on the depth of the oxidized zone. The six sections were centri- fuged a t 4,000 x g for 20-30 min and either f i l te red immediately in a glove bag or refrigerated. A11 pore waters were decanted from the centrifuge bo t - t l e s into acid cleaned Mil 1 ipore f i l t e r funnels containing acid cleaned 0.3 vm pore size Gelman A / E glass f iber f i l t e r s . The f i l t r a t e was decanted in the glove bag into acid cleaned, N2-flushed, LPE bottles and were either analyzed immediately for NH4+, FRP, and Si or were wrapped with ~ a r a f i l * and refrigerated for up t o 24 h . For cDIC analysis, subsamples of the pore waters from the centrifuge bottles were obtai ed in the glove bag prior to f i l t ra t ion and were pipetted into small, Parafil b covered, sample vials. The vials were refrigerated for up t o 24 h prior t o cDIC analysis on an IR-C02 detector.
Estimation of Diffusion Coefficients
To calculate the flux of solutes into or o u t of the pore waters, we had t o determine the empirical, bulk, diffusion coefficient, D 6, where sd refers t o an empirically integrated factor which describes the effects of sediment porosity, tortuosity, grain size, and other sedimentary characteristics. For most marine and estuarine sediments 6 ranges between 0.5 and 1 .O (Berner, 1980). The units of DS6 are cm~*s-I and this coefficient i s multiplied by the observed solute concentration gradient dC/dz, where dC = difference i n solute concentration (mM = vmol cm-3) between two adjacent samples and dz = distance (cm) between the two samples measured positively downward.
We chose t o evaluate DSd directly on a suite of intact , undisturbed cores so as t o mimic the natural sediment structure better than by using homogenized s lurr ies (Krom and Berner, 1980b). A se t of 26 4.35-cm diameter cores was ob- tained using SCUBA within a 1-m radius a t a single station (Hickory Point) midway down the PRE between stations F and G a t bottom water temperatures of 25°C. The cores were sealed as described above, placed in mud buckets, and returned t o the PEL. Two cores were immediately sectioned and centrifuged t o obtain pore waters for analyses of NaS, C1-, and so42-. The C1' concentration i n the bottom water was measured on a sample obtained d u r i n g coring. The supernatant waters from a l l the cores were removed by aspiration and pooled w i t h the bottom water sample. Three 150 m1 aliquots were treated w i t h 1.5, 2.0, and 3.0 times ambient concentrations of NaCl (Fisher Reagent Grade). Twenty ml of these spiked solutions were placed on each of 18 cores by gently pipetting into the edge of a t i l t ed core. In a l l , there were three treatments of spiked sa l t s plus controls, with six cores per treatment. The supernatants of a l l remaining cores were analyzed for C1- a t 0 , 13, 19, 61, 72, and 139 h . Duplicate cores were sectioned a t 1 cm intervals a f te r 19, 61, and 139 h and

centrifuged t o obtain pore waters which were then f i l te red and stored in acid cleaned glass vials prior t o analysis. Empirical, bulk diffusion coefficients were cal cul ated from measured concentration changes in the supernatants and a t depth in each 1 cm core section by calculating (a) the rate of ion disap- pearance from the supernatant waters, and ( b ) the rate of increase in pore waters. A simple Fickian diffusion model was used (Berner, 1980) and rear- ranged t o solve for DS$:
where J equals the measured flux of ~ a + , I , and ~ 0 ~ ~ - (~mol ~ m - ~ s - l ) .
We will show la te r that there are small differences among the bulk density and dry/wet ratios of the sediments in the N R E and PRE relative t o the large variabi 1 i ty in pore water solute concentrations. Since density, percent water, bioturbation, and other physical factors largely determine the value of DSdY we used the DS@ values from Hickory Point cores for a l l flux calculations with N R E and P R E pore waters. We believe this procedure does not affect the flux values obtained relative t o the larger errors associated w i t h normal variations in pore water concentrations ( i .e. , diurnal and weekly variations between our monthly sampling) or the biochZmYca1 reactions which occur a t the sediment- water interface. These l a t t e r processes are of major importance i n regulating actual, rather than predicted, diffusive flux.
Diffusional F1 ux Across the Sediment-Water Interface
The bottom and pore water data from the NRE and PRE were inspected for the maximum concentration gradient, dC/dz (usually w i t h i n the top 2-4 an), for the solutes of interest and used t o calculate flux in units of mmol m-2 d-1 using the Fickian model shown above. Temperature corrections i n Berner (1980) were used, and the DS value reported therein for FRP (in pro- t portion t o our C1' value) was calcu ated and assumed to be the same for S i . Our D 6 values (25O C ; X I O - ~ cmz-s-1) for C1- N H ~ ' , So62-, FRP, and Si were 7 . 3 , 7 .1 , 3.6, 2.6, and 2.6, respectiveiy. The calculated iffusive flux d a t a were compared with ambient bottom and surface water concentrations t o calculate turnover times, and w i t h prior estimates of nutrient uptake and turnover rates i n the water column.
Nutrient Analyses
A summary o f analytical procedures and techniques appears i n Table 2 . Surface and bottom water concentrations were measured on u n d i 1 uted samples (except for S i ) , and, except for zDIC, SO$-, and C1-, the pore waters were diluted up t o 40-fold w i t h the same d is t i l led deionized water used to prepare reagents, blanks, and standards. Tests showed that these a1 tered sa l in i t ies had no effect on N H ~ ' , FRP, and Si analyses. All pore waters for N H ~ + , FRP, S i , and cDIC were kept anoxic and stored a t ca. 2°C prior t o analysis (always within 24 h ) . In the case of FRP, final addnion of the combined ascorbic/

Table 2. Analyt ica l metnods and r e l a t i v e p r e c i s i o n of ana lyses . a
R e l a t i v e Analys is Method P r e c i s ion
Tota l Organic Carbon (TOC) Dissolved Organic Carbon (DOC) To ta l Inorganic Carbon (DIC) To ta l Kjel dahl Nitrogen (TKN) Exchangeable N H ~ + (EN) Dissolved N H ~ + To ta l Phosphorus (TP) F i l t e r a b l e React ive P (FRP) E x t r a c t a b l e FRP Non-pyri t e Fe E x t r a c t a b l e Fe P y r i t e Fe D i s so lved ~ 0 4 2 - Dissolved C1- Dissolved S i Conduct iv i ty Temperature Dissolved 02 Grain S i z e S t a b l e I so topes
Carbon : P a r t i c u l a t e Dissolved
S u l f u r 3 5 ~ 0 4 2 - Reduction
Leco Combustion - + 2 .7% Menzel and Vaccaro (1964) 5.5% Beckman IR-CO 2.5% Bremner ( 1 965f 5.5% Rosenfel d (1979) undetermined Sol orazano ( 1 969) 14.6% Allen e t a l . (1974) 5 .9% MolybdateTStainton e t a1 . , 1974) 9.2% Krom and Berner ( 1 9 8 E ) - undetermined Aspi la e t a l . (1976) 7.0% H o w a r t h T l v 9 ) undetermined Allen e t a l . (1974) 2.02 BaS04 T.~H.A. e t a1 . , 1975) 2 . O % Automated Ag ( B u x l e r / C o t l ove) 0 .9% Molybdate /Tar t ra te ( S t a i n t o n ,l.c. ) 7.5% Y .S. I . Model 33 SCT meter 5.0%
I I II I t 11 0.5"C Y.S.I. Model 54 meter 10.0% Fol k (1 968) undetermined Mass S ~ e c t r o m e t r v ( ~ o a s t a l Sci enc; Laboratory) Austin, TX)
0.5:/00 0.5 /oo
Howarth and Teal (1 979) u n d e t e m i ned
a R e l a t i v e p r e c i s i o n is expressed a s t h e c o e f f i c i e n t of v a r i a t i o n determined f o r a t l e a s t 20 s t a n d a r d s w i t h i n t h e range of observed concen t ra t ions ex- ce rp ted a t random from t e c h n i c i a n ' s notebooks. For t h e s t ab1 e i s o t o p e s , p r e c i s i o n da ta a r e expressed a s p a r t s p e r thousand r e l a t i v e t o a p p r o p r i a t e s t andards and were supp l i ed by t h e c o n t r a c t o r .

molybdate reagent was delayed until a1 1 traces of H2S had disappeared from the acigified sample (DeJonge and Yillerius, 1980). Pore waters for C 1 - and S04-' analysis were stored in t ightly seciled LPE bottles in the dark a t 2°C for 2 t o 14 days prior t o analysis. The Bas04 precipitate from pore waters frequently contained a yellow hue which persisted or turned faint ly brown af ter combustion a t 450°C for 1 h . The yellow color was extractable with benzene and not with acetone. We interpret this as presumptive evidence of the existence of colloidal So in the pore waters (Berner, 1971). This posi- t ive interference was generally less than 5%. Variable amounts of time be- tween f i l te r ing the pore waters and measuring ~ 0 ~ 2 - concentration did not ap- pear t o affect either the presence or intensity of the yellow color.
Concentrations of TOC ( to ta l organic carbon), TKN ( total Kjeldahl nitro- gen) and TP ( total phosphorus) were measured on frozen samples of either whole sediment or the pellet obtained from pore water centrifu ation. The amounts of exchangeable N H ' ( 2 . 0 M K C 1 for 1 h ; Rosenfeld, 19793 and extractable P and Fe (1.0 N HCl $or 16 h ; Krom and Berner, 1980a) were obtained from fresh sediment within 2 d. Total HC1-extractable Fe does n o t include that fraction associated with pyrite or humates and therefore underestimates total Fe. I t does, however, provide an estimate of "labile" Fe available for complexation with P, Si , and organic matter, as we1 1 as that sub'ect t o precipitation with 52-. Units of pmol C , N , P , and Fe g dry sediment-1 were converted t o mol m-2 using b u l k density data obtained from cores examined during the variation studies, described be1 ow.
Variation in Sediment Grain Size and Nutrient Content
A t least 10 cores were taken i n each of the s ix study areas of the PRE (1981) and NRE (1982) shown i n Fig. 1 . The day af te r sampling, each core (4.71 cm diameter) was extruded t o obtain the t o p 10 cm, weighed, homogenized w i t h a spatula, stored on ice or refrigerated, subsampled for immediate anal- ysis of extractable P and exchangeable N H 4 + , dried for dry bulk density, dry/ wet rat io , TOC, TP, and TFe analyses, and stored under refrigeration for sub- sequent analysis of grain size distribution. A99 analyses for TOC, TKN, YP, and TFe were done a t least i n duplicate on sediment that had been stored frozen. Large shells (Ran ia spp . ) and other macrodebris were infrequently encountered and discarde -?- Bulk density data were obtained by weighing the 10 cm core (174.35 cm3), and dry/wet ratios were obtained on samples dried a t 85-90°C for 24 h. Grain size analysis was performed by wet seiving and grav- itimetri c/sedimentation techniques described by F o l k (1968).
Sediment Metabolism
Several grams of fresh sediment from cores that were taken a t Sparrow Bay and Indian Island a t 0" and 20°C were suspended i n rep1 icate 300 m1 bot- t l e s with 02 saturated bottom waters (2 10 mM NaN3 to distinguish Biological Oxygen Demand ( B O D ) ) . 02 concentration was monitored (YSI meters) fo r hours t o days a t -- in s i tu temperatures.

After each experiment, the total 02 uptake was divided by the moun t of wet mud in each flask for estimates of umol O2 g wet sediment-] h-? or d-1 and converted to area units w i t h bulk density data.
I n August of 1982, with cooperation of Judy Heath and Robert Christian ( E C U Biology Dept. ) , we obtained three adjacent cores from our Indian Island s i t e for detailed metabolic studies. Two of the corfs were l e f t in mud buckets in the dark a t 25°C and we measured flux of DIC, NH4 , and FRP into the core supernatants over 1 day. On the third core, we obtained pore water data, and measured the reduction of 35~042- (Howarth and Teal, 1979; modified for more accurate analysis of pyrite 3%, R , R . Christian, unpublished). From concen- trations in bottom and pore waters, we estimated the diffusional flux of SO~Z- , 1 , NH$, FRP, and Si .
Definitions
Operational definitions are often used t o classify the chemistry of sedi- ments. Thus, TOC i s often defined as that material which, af ter treatment with acid t o remove carbonates, produces C02 or loss of weight a f te r chemical oxidation or combustion a t temperatyes >450°C. Similarly, sedimentary N i s quantified by acid digestion to NH4 by the Kjeldahl process, and TP i s that FRP which appears in solution af ter combustion and HC1 extraction. Other operationally defined forms of N and P include exchangeable-NH~* and ex- tractable-P, described above. These operationally defined forms may have l i t t l e relationship t o their biological and geochemical activity. Most spe- c i f i c chemical identification has been done on materials in the pore waters, b u t the amount in these fluids i s a small fraction of that i n bulk wet sedi- ment.


RESULTS AND DISCUSSION
Composition and Distribution of Sediments
Upper 10 cm of Sand and Mud
The sediments of both estuaries contain two distinct sediment size classes rather than gradual changes from one type t o another (Tables 3 and 4; Tenore, 1972). This implies high sorting in b o t h erosional and depositional environ- ments. Almost a1 1 sandy sediments in both estuaries contain a t least 87% sand, and are generally restricted t o water <2-3 rn deep and where fetch i s greatest. Muddy sediments occur in over 90% of the area of bo th estuaries and most contain more than 95% s i l t and clay sized particles. In some areas, such as study section E in the Pamlico River Estuary (PRE) and parts of study sec- tions G and H in the Neuse River Estuary (NRE), sandy sediments are overlain by several cm of mud. Whether this i s a transient condition i s unknown.
The TOC, TKN, and TP concentrations (per g dry weight) are 10-20x higher in muds than in sands in both estuaries (Tables 3 and 4 ) . However, the lower percent water and higher bu1 k density of sands result i n a similar nutrient content under a m2 of bottom (Table 5) . Nonetheless, because mud sediments cover >90% of these bottoms and contain more organic and inorganic nutrients, our subsequent discussions wi 11 emphasize muds.
Concentrations of exchangeable N H ~ + ( E N ) in both estuaries are relatively constant downriver and are up to 6OX greater i n the muds than in sands (Tables 3 and 4) . Because the mud/sand TOC concentration rat io i s only about 10-20, we speculate that EN must occur mostly on the exchange s i t e s of clay minerals and t o a lesser extent on organic matter. Rosenfeld (1979) concluded that most of the EN i n shallow water sediments of Long Island Sound was associated w i t h organic matter, b u t those sediments contain nearly equal mixtures of sand, s i l t , and clay, and also have less organic matter than i n the PRE or N R E .
Organic matter as well as redox and mineral forms of Fe appear t o control the amounts of extractable phosphorus ( E P ) i n both sands and muds. The mud/ sand concentration rat io of the EP fraction i s similar to that for TOC. How- ever, greater than 40% of the TP i s in the "labile" EP fraction, as compared w i t h <2% for EN/TKN (Fig. 4a). Both TP and EP decrease downriver in both estuaries (note that TKN and EN do n o t ; f i g . 46 and c ) , although EP decreases greater than TP. If th i s "labile" E P fraction i s associated with ~ e ~ + and/or organic matter complexes which precipitate a t the head of the estuaries, then this downriver decrease i n EP i s t o be expected. Upchurch e t a l . (1974) ob- served downriver TP decreases in the PRE and into Pamlico sound, and about 75% of the variance in TP was significantly and directly related to Fe. Likewise, Strom and Biggs (1982) showed that both labi le (EP and citrate-dithionite- bicarbonate extractable-P) and TP were significantly related t o downriver de- creases in Fe and t o increases in sal ini ty of the Delaware River Estuary. Therefore, we would expect that our EP fraction might be associated with HC1- extractable Fe. However, the few (winter 1983) sets of total sedimentary iron data we have (including pyrite (Howarth, 1979)) indicate that HC1-extractable

Table 3. Pamlico River Estuary var iat ion study dataea
C D E F G 14 I tem Blounts Bay Sparrow Bay Durham Creek Texas Gulf Indian Is land Pamlico Light
Bulk Density$ M 1.22+0.053 g wet cm-3 S 1.953.078
Dry/ Wet M 0.25%3.006 S 0.78F0.037 -
pmol g dry sediment-1 Exch. NHq+ M 3.8+0.43 4.1+0.41 2.5t0.13 3.2t1.3
N A S 0.098~0.086 0.046%.025 - 0.049Tb.014 - O.14+8.033 -
Extr . P M 41+3.4 29+8.9 22t6.2 23+3.4 15t3.4 11t1.4 s 1.9~1.~ - 1.5F6.0 - 1.6a.43 - 1.4T2.5 - 0.54b.20 - 0.61r0.30 -
TOC M 3260+ 87 3270+290 2624t315 321 7+135 27934- 196 2975-1-204 S 2747 - 911 148F - 22 117r - 31 1687 - 68 135r - 42 967 - 58
Mud Ratios C/N 16 15 15 8.5 9.7 7.9 c/ p 6 7 70 85 82 96 114 N/P 4.2 4.6 5.6 9.7 10 '9 4
aMean - +1 S.D. N(mud) = 5,5,7,5,6, and 6; N(sand) = 5,5,5,5,4, and 4 a t Stas. C,D,E,F,G, and H.

. CI
0 u L o .
ln 7 . m
mc, + I v,
Q) s-c , m a m al m T C m


Table 5 . Mud/sand r a t i o s f o r the amounts of nu t r i en t s and carbon rn" ( t o a depth of 10 cm) in the var ia t ion study cores from the Neuse and Pam1 i co River Estuaries . a
EN TKN E P TP TOC
Pam1 i co S ta . C
D E F G H
Neuse Sta . C
D E F G H
a Abbreviations as in Raterial s and Methods. Ratios cal culated from averages o f data i n Tables 3 and 4.
Table 6. Calculated turnover r a t e s f o r pa r t i cu la t e C , N , and P in the top 10 cm of sediment in the Pamlico River Estuary.
Phytopl ankton Sediment Turnover El emen t Up t a ke Storage r a t e
mol m-2 year-1 mol m-2 years
Carbon (a s DIC) 20a- 4ob 78 (TOC) 1.9 - 3.9
Nitrogen ( a s DIN) 4 - 9.gb 8.1(TKN) 0.8 - 2.0
Phosphorus (as FRP) 0.25 - 0.63b 0.83(TP) 1.3 - 3.3
a Davis -- e t a1 . (1 978) Kuentl e r -- e t a1 . (1 979)

Fe i s more concentrated in the surface ( t o p 2 cm) sediments a t a l l s ta t ions, b u t there i s no significant decrease in total Fe downriver or with depth in 10 cm cores. We therefore speculated that there was a downriver increase in the proportion of total Fe that was in pyrite and which i s presumably n o t available for complexation with P . No differences of sufficient magnitude were found i n the pyriteltotal Fe rat io . Therefore, EP does n o t appear t o be significantly associated with HC1 -soluble Fe.
Certainly, some of the "excess" upriver EP i n the PRE may be attributed t o upriver transport of bottom materials, especially from the effluent of the phosphate mine (near Sta. F ) . Net upriver transport of bottom materials i s commonly observed in estuaries and regulates the distribution of many elements (Burton, 1976; Liss, 1976). The effluent of the phosphate mine contributes an amount of P equal t o that from a l l other PRE sources (Lauria and O'Melia, 1980), including Pam1 ico Sound (Kuenzler -- e t a1 . , 1979), and effectively doubles the annual P load t o the PRE.
The mass (content) of nutrients under each m2 of bottom t o a depth of 10 cm i s shown in Figs. 4b and 4c. While the gradients and contents are somewhat simi 1 a r , there are differences between the two estuaries. Contents of TOC, TP, and EP decrease downriver while those of EN and TKN do not. TOC and TKN are higher in the N R E than the PRE a t the f i r s t four upriver stations, whereas TP contents are about 1.5X higher a t the two upriver stations of the PRE.
The absolute amounts of TOC and TKN i n these estuaries are diff icul t t o explain. In subsequent sections, we present stabl e carbon isotope data which suggest that the source and composition of organic carbon i n both these estu- aries i s similar. For now, we can explain the higher concentrations of TOC and TKN i n the NRE by invoking morphometric factors. The f reshwater-seawater interface i s further downstream (relative t o our stations) in the NRE than the PRE. Recognizable te r res t r ia l debris often occurs on and i n the section C, D, and E sediments of the NRE, and essential 1y a l l the P i n these sections i s i n the extractable form (Fig. 4a), presumably precipitated w i t h Fe-Si- organic complexes. The T rent River, a moderately sized tributary, also dis- charges i n t o study section C of the NRE. The increased width near station D in the NRE causes heavy deposition of both te r res t r ia l and estuarine organic matter in th is area. We think t h a t many of the upriver differences between estuaries are due t o the funneling effect on seawater a t the narrow river area between sections C and D in the NRE (Fig. 1 ) . This occurs in the Pamlico as we1 I , b u t the s i t e i s further upriver than our study sector C. Aerial obser- vations during high runoff and velocities encountered while diving support these conclusions. However, some anomalous stabl e isotope ratios (discussed below) in surface sediment particulate matter of obviously terrestr ia l origin a t Neuse River stations C , D, and E may require a more complex and tenuous explanation.
The downriver decreases in TOC and TP (Fig. 4c) are not unexpected. Terrestrial carbon may accumulate in the upriver deposition zone and add t o the pool of plankton carbon (Davis e t a1 . , 1978). Also, deeper water down- river may allow for more remineraliZKtion of seston i n the water column and

less net seston deposition t o the sediments. Phosphorus may accumulate up- I
river due t o sal ini ty induced flocculation, upriver transport of mine ef- fluent in bottom waters, or the existence of a more dynamic Fe and S regime in the upriver sediments.
The elemental ratios (Fia. 4d ) describe two general phenomena. F i rs t , the low and gradually increasing TOC/TP ra t io in the PRE ref lects the upriver TP enrichment described above rather than a relative depletion in TOC. TP in the two upriver PRE stations i s much higher than in the NRE (although the l a t t e r has highly variable concentrations; see Table 4) b u t TOC i s only about 20% higher in the N R E . The NRE TOC/TP ra t io of 110-130 i s characteristic of either live phytoplankton (Kuenzler e t a l . , 1979) or of a combination of te r - restr ia l debris and decomposing phytT1zkton. Further elaboration of th is appears in the carbon isotope section. Second, the TOC/TKN and TKN/TP ratios reflect enrichments in N and P rather than TOC depletion. Later, we will show that monthly variations in TOC i n the PRE are generally less than those of TKN and TP (Figs. 5a and b ) . The higher N and P levels in the NRE may be due t o agricultural , municipal, and industrial sources, b u t the concentrations sf these materials and their ratios t o each other are within the range of sther estuarine and ner i t ic marine sediments (Aller, 1980a; Strom and Biggs, 1982).
There are not large amounts of carbon, nitrogen, and phosphorus i n the sediments when their contents are compared to the amount of time i t takes phytoplankton t o assimilate these quantities from the water column (Table 6 ) . The average storage (mol m-2 in the top 10 cm, where ~ 9 0 % of benthic biologi- cal activity takes place) in PRE muds i s equivalent to that assimulated by a1 gae i n the water column in 9 to 4 years. For example, the average YKN storage, i f i t were available for phytoplankton uptake, would be sufficient for only -0.8 years of demand, assuming no allochthonous inputs or recycling. Similar comparisons for P show that the ratio between phytoplankton uptake and sediment storage i s similar t o that for carbon, probably due t o the high P levels in the estuary. A shorter apparent turnover time for N i s typical of many aquatic systems (Harrison and Hobbie, I974;Al l e r , 198Oa;McCaffrey e t al . , 1980;Nixon, 1981 ) and may be parti a1 ly a result of chemical and -- physical factors such as greater solubili ty and ~ o b i l i ty of N H ~ ' relative t o FRP and partially a result of denitrification.
Flocculent Surface Layer
We obtained monthly samples of the f iocculent surface sediments (section A , or top < 2 cm of cores) a t a l l s ix stations in the PRE for a year. Dis- t inct f luc~uat ions in the concentrations of C, N , and P occurred a t a l l stations (Figs. 5 and 6 ) . Further, these surface sediments contain more C, N , and P per gram of dry sediment than the underlying 10 cm muds (Table 7b). Higher surface sediment TOC concentrations in winter may ref1 ect deposition of winter algal blooms (Fig. 5b) with subsequent decomposition in spring prior t o the summer maximum in photosynthesis ( ~ a v i s e t a l . , 1978). The decrease i n TOC during spring may also be due t o resuspension and redistribu- tion d u r i n g turbulent weather. However, the relatively low variation among the carbon data (Table 7a; except for the heterogeneous sandy muds a t Durham

SURFACE SEDIMENT CHEMISTRY
a
PAMLlCO RIVER STA. G-INDIAN ISLAND
F ig . 5. Monthly v a r i a t i o n i n concentrat ions o f TOC ( C ) , TKN (N), and TP (P) i n the sur face (sec t ion A) sediments a t (a) Sparrow Bay and ( b ) I nd ian Is land .

SURFACE
4 DURHAM +7JT/-q CREEK
SEDIMENT
TKN/TP
RATIOS
Ffg. 6. Monthly variation i n the TOC/TKN, TKN/TP, and TOC/TP ratios i n the sur- face (section A ) sediments a t a l l s ix routine study stations in the Pam1 i co River Estuary. Note scale changes.

Table 7A. 1981 Pam1 i c o River Estuary sediment chemist ry: Organic carbon, t o t a l Kjeldahl n i t r o g e n , and t o t a l phosphorus in t h e s u r f a c e sediments (Sec t ion A , t h e t o p '2 cm).
S t a t i o n TOC T KN TP C/N N/P C/N/P
umol .g dry mudm1 ( 2 C.V.)a Bl ounts Bay (C) 4200f9.5% 352211% 73234% 1 2+8.3% 4 . 9 2 2 % 63/4.9/1
Sparrow B a y ( D ) 437024.9% 448226% 6428.0% 1 121 4% 7.0231 % 77/7,: 0/1
Durham Creek(E) 3590218% 353?18% 46248% 1 029.3% 7.6226% 83/7.6/1
Texas Gu1 f ( F ) 41 00?10% 414?15% 5321 9% 1 Of 1 0% 7.9t22% 79/7.9/1
Indian Is1 and(G) 3840t9.1% 414t10% 4421 8% 9.3i8.83 1 0 223% 93/10/1
Paml i co Light(H) 324027.9% 34821 6% 3426.2% 9.4f11% 1 0 . 6 5 8 % 100/10.6/1
a Monthly samples o f t h e top-2 cm of cores t aken f o r pore water a n a l y s i s . N = l O t o 1 2 ; ? C.V. is 1 s t andard dev ia t ion expressed a s c o e f f i c i e n t o f v a r i a t i o n .
Table 7B. 1981 Pamlico River Estuary sediment chemist ry: Comparison of t h e s u r f a c e mud chemistry w i t h t h a t of t h e 10 cm v a r i a t i o n cores .
Ratio o f Average Concentra t ions S t a t i o n TO C TKN TP C/N N/P
Sec t ion A/10 cm Cores Sec. A 1 0 c m Sec. A 1 0 c m -- -- Blounts Bay (C) 1 . 3 1 .7 1 .5 12 16 4.9 4.2 Sparrow
Creek(E) 1 .4 Texas Gul f ( F) Indi an Is land(G) I .4 1 .4 1 . 5 9.3 9.7 1 0 1 0 Paml i co L i ght (H) 9.1 0.93 1 . 3 9.4 8.1 11 15

Creek; Sta. C ) suggest tha t , wi t n o u t direct estimates of sedimentation, causes of the apparent trends ( F i g . 5 ) may be diff icul t t o identify. Relative to N a n d P , carbon concentrations do n o t change much.
Some data are clearly indicative of chemical and physical effects of s t rat i f icat ion and anoxia, rather than of predominantly biochemical p r cesses. For instance, TP a t Sparrow Bay (Sta. D) increased t o about 70 lmol g'? in May and decreased t o 40 umol g'l in June ( F i g . 5a). The bottom waters i n spring were generally oxidized b u t turned anoxic during June s t rat i f icat ion. The spring increases may have been due t o accumulation of Fe-P complexes a t the sediment-water interface a f te r high runoff and turbulent winter flushing of the surface sediments. Subsequent anoxia in June may have released the RP i n t o the water column for a large net flux out of the sediment. Some June bottom water FRP concentrations were as h i g h as 16 pM (discussed below).
The seasonal cycles a t Indian Island (Sta. G; Fig. 5b) are suggestive of biological mediation such as deposition of phytoplankton. The TOC and TP concentrations fluctuate biphasically and are out o f phase w i t h TKN concen- trations. The elemental ratio cycles i n Fig. 6 also suggest similar biological mediation. Particularly, the C/N rat io decreased to about 8 during both the early spring and la te summer and the N/P ra t io increased to levels also i n - dicative of phytoplankton biomass (Kuenzler e t a l . , 1979).
These changes i n surface sediment (section A) elemental ra t ios ref lect a dynamic system, with larger fluctuations in the stormy and productive winter- spring months and smaller fluctuations dur ing the calm periods i n summer and f a l l . The tendency for ratios to be higher prior to June a t many stations probably represents deposition of algal blooms.
The surface sediments presumably contain the most biogeochemical ly active organic carbon and are believed t o be composed of freshly deposited material. However, some freshly deposited material may have been recently resuspended from elsewhere and infauna eomonly rework the upper sediments and redeposit material from depth onto the surface (Frankenberg e t a., 1967; Rhsads, 1967; Davis, 1974; Featherstone and Risk, 1977; ~ a s l e n c h x e t a1 . , 9983). We have observed dense patches of fecal pellet mounds throughout bo th estuaries b u t cannot comment on the feeding types of the infauna. Protozoa have not been examined, b u t dominant macrofauna include Polychaeta (Nereis, Heteromastus) and Mollusca (Rangia, Maeoma) i n the PRE (Tenore, 1972),iofauna are the most abundant mu1 t i celfularheterotrophi c eucaryotes and 1 arge pspul ations of nematodes and harpacticoid copepods exist (Reid, 1978). Shal lower sandy sub- s t ra ta generally had higher densities and biomass of both groups i n b o t h studies. Both workers concluded that periodic bottom water anoxia i n the mud- dier sediments of deeper regions of the PRE interfered with reproductive cycles and growth.
The major findings from th is study on C , ti, and P i n bulk sediments are that:
1 ) approximately 90% sf the bottom area o f the estuaries i s fine-grained

mud; the remainder i s sandy and i s usually restricted t o shallow margins, TOC, TP, and EP decrease downriver in bo th estuaries, b u t TKN and EN are relatively constant; TOC and TKN i n the upper four stations are higher in the NRE than the PRE, while TP i s higher a t the t w o upriver stations of the P R E , and t h e flocculent surface layer (top < 2 cm) of sediment is enriched i n TOC, TKN, and TP concentrations rerative t o the underlying 10 cm; larger variations in concentration of th is surface layer during the f i r s t half of the year may be related t o phytoplankton bloams and resuspension by turbulence.
Carbon Isotopes
The following material i s divided into sections on: (1) downriver trends in the 61% of seston and sediment, ( 2 ) paired analyses of the C/N ratios and 6 1 3 ~ values of sediments, (3) seasonal variations in the 6 1 3 ~ value of seston and sediment associated with high runoff, (4) the 613c values i n deeper sedi- ments and pore waters, and ( 5 ) an evaluation of the carbon sources t o the estuaries.
6I3c of Sediment and Seston
Surface sediment samples collected in the Neuse River Estuary ( N R E in March and September of 1981 were progressively enriched in the heavier 1% from -27.0 O/oo at the U.S. Rte. 17 bridge to -23.1 O/oo a t lon 60 (Sta. H ) ' ( F i g . 7 a ) . We had anticipated a normal h drologic year so we could obtain samples during high runoff periods (March 7 and during high sal ini ty periods (September) when phytoplankton woul d be more important. However, the 6 months preceding March, 1981 were unusually dry and calendar year 1981 had only 50% of the 53 year average cumulative runoff (Fig. 2a) Thus, we were not able to distinguish these two data sets , and present them as typical of a conser- vative mix of two end member sources, from which erroneous eonclusions may be drawn (shown below).
Seston i n the bottom waters a t ive NRE stations in September, 1981 showed a more variable trend o f downriver 15C enrichment than that of the surface sediments ( F i g . 7a). , Seston carbon was generally isotopically heavier than OC i n the underlying sediments a t the same station. If th i s seston were the sole source of BC for underlying sediments, a mechanism for post-depositional increase i n l ighter C i s necessary t o explain the observed sediment values. Further resolution of seston-sediment differences i s explained below.
In the Pamlico River Estuary ( P R E ) , samples collected during May, 1981 a t f ive stations showed a downriver trend of enrichment (Fig. 7b) very simi- la r t o that of the NRE. A t a l l b u t Sta. km 28 (Sta. E ) , seston OC from bottom water and manually resuspended surface sediment was isotopically heav- i e r than or similar to the OC from underlying surface sediments. These obser- vations are likely due t o dominance of resuspended sediment by recently

Fig .
SEDIMENT. MARCH '81
SEPT. '81
SESTON 0 SEPT '81
4 ' -2e ,, , . /k
-36 G 10 20 30 40 50 60 120 NEUSE RIVER 4 KM DOWNRIVER
MAY 1981 SEDIMENT 0 SESTON 0 RESUSPENDED C3
SEDIMENT
-30 0 IQ 20 3b 40 PAMLICO RIVER KM DOWNRIVER
50 6'0 120
6I3c values of POC i n seston (water column), surface sediments A ) , and suspended sediment (manually resuspended surface f l o c ) ( a ) Neuse and ( b ) Pam1 ico River Estuaries, 1981.
(section i n the

deposited and isotopically heavier phytoplankton carbon. Thus, the sediment- water interface is a transition zone from isotopically heavier seston OC in bottom water t o lighter OC just below the sediment surface. The reverse oc- curred a t km 28 (Sta. E ) where 10 cm of s i l t -c lay sediment i s underlain by a predominantly sandy base. Other biogeocherni cal data from th is station are equally anomalous (see Sta. E data in Figs. 4a-d).
Surface sediment samples col lected in October, 1981 from lateral tributary mouths down the length of the PRE were examined to see i f t e r res t r ia l runoff t o these s i t e s would cause the 61% values to be isotopically l ighter than sediment sampled from the main channel (Fig. 8 ) . Except for three upriver samples between km 5 and 15, the paired values from the main channel and from lateral ly adjacent tr ibutaries were simil ar. Greater differences had been expected between these paired samples further downriver where extensive peri - pheral marshes exis t , b u t n o distinctions can be made. In spi te of the short distance from the te r res t r i a1 sources i n these 1 ateral tr ibutaries , they drain less than 2% of the total basin and local effects on isotope ratios were negligible.
The averages of a1 1 61% values of freshwater and marine carbon are in Table 8. In the freshwater reaches of the Tar River (which becomes the PRE a t km 0) , sediment, seston , and DOC averaged -27.3 o/oo, -25.1 O/oo, and -25.5 O/oo, respectively. In the freshwater reaches of the Neuse River a t Kinston, sediment was similar to that of the Tar River, while the seston was about 1 O/oo lighter. The sediment a t ocean beaches on the Outer Banks (-21.0 o/oo) was about 6 O/oo more enriched in 1% than river sediment, while marine seston a t the Outer Banks was about 9 O/oo more enriched than fresh- water seston. Thus, the difference between seston and sediment OC was much more pronounced in the marine samples.
Relationship between C/N and 613c Ratios
Terrestrial plants normal ly have C/N ratios >20 while phytoplankton tend t o have ratios closer t o 6 - 7 (Redfield, 1958; Kuenzler e t a1 . , 1979; Fisher e t a1 . , 1982b). Paired analyses of C/N and 61% on sedimex Z l lected i n the - sprFg of 1981 helped identify the location of terrestr ia l influence (Fig. 9 ) . (Our reference t o " terrestr i a1 'I may a1 so include freshwater r i verine phyto- plankton that becomes incorporated in sediments near the ca. 1 O/oo sa l in i ty zone. ) Samples from the NRE separate particularly we1 1 bxween those up and downriver of km 19. High C/N ratios and isotopically l ight C for samples a t krn 0 and 5 preclude any significant estuarine or marine input. As stated ear l ie r , the te r res t r ia l deposition zone i s further downriver relative t o our stations in the NRE than in the PRE and upriver stations of the PRE have slightly higher C/N ra t ios than those of the NRE (Fig. 4d). Either these dif- ferences or an ar t i fac t of sampling may have caused the relatively higher C/N ratio of the PRE sediments. The NRE samples came from the top few mm of sedi- ment, while those of the PRE were up t o 2 an in thickness. Therefore, dif- ferences in C/N ratios may partly be attributable t o the fac t that the floc- culent surface sediments have a C/N ra t io which i s often lower than that of deeper ( u p to 10 cm) muds (Table 7b). The sample from the sewage treatment

-231 OCTOBER 1981 Oe Fig. 8 SURFACE SEDIMENTS FROM : A (10
MAIN CHANNEL
TRIBUTARY MOUTH 0 0 0
0 0" di3c= 0 . 0 5 7 k m - 26.4
-271 a * r = + 0.97 n = 15 (MAIN CHANNEL ONLY) - - .
PAMLICO RIVER KM DOWNRIVER ,->
PAMLICO-MAY 81
0 NEUSE- MARCH 81
Fig. 8. 613t values of POC i n surface sediments of the Tar River (-20 t o 0 km) and i n the main channel and l a te ra l t r ibu ta r ies of the Pamlico River Estuary in October, 1981.
Fig. 9. Relationship between the 61% values and the TOC/TKN (C/N) r a t i o s i n the sediments s f the Pam1 ico and Neuse River Estuaries, 1981. Kilometers downriver of the U.S. Rte. 17 bridge and the STP (-3 km) are indicated within the data points.

Table 8. Summary of 613c values f o r f reshwate r (Tar and Neuse Rivers ) and marine sources .
613c (PDB) O/oo Sample Tar River Neuse River Marine
- Sediment POC X -27.3 -27.2 -21 . O
S E - 0.15 - 0.16 - 1 . 3 N 4 5 2 -
Seston POC X -25.1 -26.2 -1 6.6 S E - 0.26 - 1.2 - 0.5 N 6 4 2
Inorganic carbona SE N
a ~ i s s o l v e d inorgan ic carbon from r i v e r water and p a r t i c u l a t e sediment carbonate from Outer Banks beaches.
Table 9. Nitrogen f r a c t i o n s i n t h e upper 10 cm of mud sediment i n t h e Paml i c o River Estuary, 1981.
Kjeldahl Exchangeabl e Pore Water S t a t i o n Nitrogen Amnon i urn Ammoni urn
Blounts Bay(C) Sparrow Bay(D) Durham Creek(E) Texas Gul f ( F) Indian Is1 and(G) Paml i c o Light(H)
Bl ounts Bay(C) Sparrow Bay( D) Durham Creek(E) Texas Gul f ( F) Indian Is1 and(G) Pamlico Light(H)
umol N c K 3 sediment b7 0.32 63 1.2 5 7
0.40 0.83 0.28
87 0.74 0.36 81 0.94 9 0
0.36 0.40 0.097
Ratios o f Nitrogen 1 90 3.5 1 1 58 3.0 1 205 3.0 241
1 2.0
226 1
2.6 1 928 4.1 1

plant (STP) outfall a t km -3 had a terrestr ia l 6136 signature while i t s low C/N ratio was apparently an influence of wastewater enrichment by bacteria. Botello -- e t a1. (1980) report even lighter 613c values for sediments from lagoons i n the Gulf of Mexico that receive industrial and sewage wastes.
To complicate matters even more, some material we collected in June,l98l from the surface of cores a t km 2 , 1 2 , and 20 in the NRE were obviously of terrestr ia l origin: they were pieces of leaves, woody stems, and bark. Pre- sumably, they had been deposited on the surface of the sediments during runoff within the previous few weeks or months. We expected that the i r 61% values would be similar t o that of terrestr ia l material and t o each other. However, their values were -27.4, -26.8, and -26.1 0100 a t the three downriver s i t e s , respectively. These three points l i e on a line with a slope equal t o that i n Fig. l a , b u t each i s significantly l ighter ( i . e . , - - the Y axis intercept i s more negative). If we assume a common origin for the material, i t had been in the sediment for equal amounts of time,and i t had the same original 61% value, then we can suggest only two mechanisms which would result in th is progressive downriver, diageni c enri chment. Either (1 ) isotopic exchange occurred physi - cal l y , or (2) biochemical enrichment occurred during the accumulation of sap- rophytic biomass within and upon the material while i t lay on the sediment surface. The f i r s t possi bil i t y i s rather remote considering that the material had been recently deposited; i t was found on the surface of the cores and was not covered with more recently deposited material. The second possibil i ty requires that th i s a1 legedly refractory material actually became rapidly and extensively colonized with sufficient microbial biomass (Sieburth, 1975) to a l t e r i t s original stable isotope ratio so that i t resembles heavier deposits of "estuarine" origin. That the original isotope values were identical i n a l l three samples i s the weakest of our assumptions (see Table 81, but i t i s not as unrealistic as suggesting that the values for the three samples were a con- sequence of chance encounter. These observations and those reported below in the section on pore water and deeper sediment carbon indicate that carbon de- composition i s rapid and sedimentary recycl i n g i s an important mechanism whi ch requires extensive study.
Although C/N ratios >I5 are suggested here as indicative of te r res t r ia l influence, the rat io by i t s e l f , as above, cannot be regarded as a universal or unequivocal indicator of OC source. Post-depositional alteration of marine phytoplankton carbon may result i n authigenic humic acid formation i n marine sediments (Nissenbaum and Kaplan, 1972; Jackson, 1975). The C/N ra t io of humates also increases w i t h depth i n some marine sediments (Brown e t a l . , 1972) to values approaching lower ratios of terrestr ia l organic matter. The C/N ra t io of terrestr ia l plant material may decrease to G. 15 during decom- position (Brinson, 1977) as a resul t of nitrogen immobilization and formation of condensation products w i t h humic and amino acids (Rice, 1982). Without simultaneous use of other tracers of te r res t r ia l organic matter such as lignin (Hedges -- e t al . , 1982), the C/N ra t io by i t se l f would rovide l i t t l e informa- 9 tion relevant t o our questions. When coupled with 61 C values, the distinction between phytoplankton and terrestr ia l carbon i s improved (Rashid and Reinson, 1979; Tan and Strain, 1979).

Effect of High Runoff t o the Pamlico River Estuary
Normal rates of runoff in 1982 reduced sa l in i t ies in the PRE a t krn 48 t o 5 . 7 O/oo i n April as compared with a minimum of 15 O/oo i n February during the exceptionally dry period of 1981. Winter-spring runoff to the PRE in- troduces water rich in NOg- , ~e'3, S i , as we1 1 as TOC. Phytoplankton blooms, often dominated by Heterocapsa triquetra, normally occur during this time and have been related t o inflows of these waters (Kuenzler -- e t a1 . , 1979). Con- centrations of up t o 50 VM NO3' are encountered during this period in the head- waters, b u t the drought conditions of 1981 resulted i n much lower concentra- tions than during the normal runoff year 1982 ( D . W. Stanley, personal commun- ication). During the summer and f a l l , concentrations of ca. typical (Hobbie -- e t a1 . , 1972; Hobbie, 1974). ~ c c o r d i n g l y ~ c h l I uM rophy No?- 1 2 are con- 9 centrations during the drier winter remained low (<5 pg l i t e r ' ) although a few higher values occurred a t upstream s i t e s during a minor bloom. In 1982 however, winter concentrations of chlorophyll a were often as high as 100 pg 1 i ter-1, especially during March ( D . W. ~ t a n l e y , personal communication).
While i t was ex ected that normal runoff i n 1982 would result i n more P negative ( l ighter) 6 3~ values, just the opposite occurred. The unexpected enrichment by isotopically heavier 1% in both seston and sediment (Fig. 10a) may have resulted from rapid D I C fixation in algal blooms and consequently less isotope fractionation. Degens (1969) showed that minimum fractionation by phytoplankton occurs when pH and water temperature are high; the former re- sul ts in low partial pressures of C02(aq) and the l a t t e r stimulates fixation. We have no diurnal pH data from these w~nter water samples, b u t cDIC, as well as C 0 2 ~ ~ 1, might become limiting within about 2 days i f calm weather inhibited atmosphe% c reaeration and verti ca1 mixing. Maximum rates of primary produc- tion i n the PRE are as h i g h as 0.4 mmol C l i ter-1 d-1 (Davis e t a l . , 1978; Kuenzler e t a1 . , 19791, so about 2.5 days are required t o deplete the ambient 1 rnM T D I C T O ~ , and perhaps hours t o deplete the COppq) pool a t pH 8. Paerl and Ustach (1982) have suggested the possibility of 02( 1 imitation d u r i n g surface blooms of cyansbacteria in other North Carolina es aq2 uaries. Other causes of the anomalous ratios include a species effect associated with the carboxylati on reaction (Fontugne and Duplessy, 1981 ) or an unresolved effect associated with photosynthesis in nutrient rich waters, such as that observed by Gearing and Gearing (1982). They were able t o produce phytoplankton bio- mass i n nutrient amended microcosms that was 4 t o 5 o/oo heavier than i n un- amended controls. A similar isotopic difference was observed in surface ses- ton between 1981 and 1982, which were low and high nutrient regimes, respec- tively (Fig. 10a).
Surface and botto water seston collected approximately 1 month l a t e r i n May, 1982 showed that gT3c values were higher i n the surface than in bottom waters and had a1 so decreased below the h i g h values of the revious month (Fig. lob). Explanations for the s t rat i f icat ion include (1 7 more contribution by resuspended and isotopically lighter sediments t o the bottom waters, (2) less fractionation during DIC fixation by autotrophs (hence, heavier biomass O C ) in bottom (and perhaps DIC-enriched) waters, or (3 ) equal fractionation by autotrophs i n both water masses, b u t of a l ighter DIC pool i n the surface

MAY 81 Am 82 i I ' SESTON 0 0
1982 \, SEDIMENT I
/
1' MAY 3 8 5,1982
0 SURFACE WATER SESTON
BOTTOM WATER SESTON
I I I I I
0 I
20 I
40 60 PAMLlCO KM DOWNRIVER +
Fig. 10. (a) 613c values of POC in seston and sediments vs. sa l in i ty in the spring of two years in the Pamlico River Estuary. Inset numbers refer to km downriver s f the U.S. Rte. 17 bridge. (b ) sI3c values of POC in surface and bottom water seston of the Pam- 1 ico River Estuary in May, 1982.
waters of lower sal ini ty . Clear?y more work i s required t o resolve these dif- ferences.
On a 1 rger scale, the correspondence between the changes in seston and 13 sediment 6 C values of 1982 with sal ini ty and distance i s surprisingly good
(Fig. 10a). The fact that 1982 sediments a t and downriver of km 20 were up t o 3 O/oo heavier than bo th sediment and seston values of the previous dry year (except km 60) clearly demonstrates that seasonal variations in seston carbon source affects the 1% content of the surface sediments. Furthermore, con- stant photosynthetic fractionation of DIC cannot be assumed i n these waters. The data also suggest that phytoplankton carbon was a more important estuarine carbon source for sediments even during the wetter year. Therefore, the de- position of terrestr ia l OC occurred further upriver than a conservative mixing regime, based on sal ini ty , would indicate.
Pore Water and Deeper Sediment Carbon
The 61% values of subsurface sediment OC, DOC, and cDIC was determined a t two s i tes (Fig. l l a ) and two longer cores were obtained for 61% analysis of sediment OC only a t two other s i t e s ( F i g . 116). In the f i r s t pair of cores (Fig. 1 l a ) , there was a slight bu t significant difference between the sediment OC and DOC. However, the isotope values of pore water cDIC were considerably higher than either the DOC or POC. If most of the DIC had been derived from non-discrimin tory heterotrophic oxidation of sediment O C , the observed en- richment i n & may have resulted from subsequent autotrophic DIC uptake and discrimination against the heavier isotope, such as during methanogenesis [Nissenbaum e t a l . , 1972; Whelan, 1974). Diffusional or bioturbated flux of this heavierrecdual zDIC pool t o the bottom and surface waters (ca. 5 t o 50 mmol m-2 d-1; discussed below) i s an important recycling mechanEm which maintains an ambient isotope rat io w i t h i n the range of values for the ter- restr ia l and'marine end members.
Analysis of deeper sediments showed no significant net change in the 61% of POC as sediments are buried (Fig. I lb) . If the isotope ratios of source material had resulted from a mixture of labile plankton carbon and re- fractory terrestr ia l carbon (Hedges and Parker, 1976; Pock1 ington, 1976) , the rat io i n the two cores would be expected t o cogverge on a 61% equal to that of the "refractory" Tar River seston: ca.-25.9 /oo. Clearly th is does n o t occur, so major changes are 1 imited t o 7 k physically active seston, resus- pended sediments, and surface sediments less than 2 m deep ( F i g . ?a). Sea- sonal or annual fluctuations in the 613c of surface sediments may be masked by bioturbational mixing of the upper ca. 10 cm as i n other nearby sediments ( L . K. Benninger , personal communi c x i on). Thus, the residual buried sediments appear t o reflect the isotopic rat io of the surface sediment and seston that normally occur in the same region of the estuary. Terrestrial material either does not reach these downriver s i t e s or i s decomposed and recycled i n s i tu with a subsequent enrichment i n the heavier isotope. The gain of h Z v F c by the leaves, stems, and bark encountered in the NRE cores indicates that biochemical a1 teration of th is a1 legedly refractory material does indeed occur. However, we do not have a data pool sufficient t o determine whether these


deeper sediments ( F i g . 11 b ) actual ly do contain terrestr ia l material that has been a1 tered.
Evaluation of Organic Carbon Sources
Imports of seston from the marine end member are an unlikely source of O C t o these estuarine sediments. The pathway of delivery would be indirect a t best because seston would have to travel 60 km through relatively slow moving Pamlico Sound waters t o the estuary mouths (Fig. 1 ) . This would involve many sequences of fixation, sedimentation, resuspension, decomposition and refix- ation which would gradually mask any isotope signature of seston unique t o the original marine source. In any case, substantial marine contributions are not required t o explain the 6 1 3 ~ values encountered in the PRE and NRE.
Eroding marsh peat i s another potential source of OC t o these estuaries and deserves consideration, especial ly since Schell (1983) showed that essen- t i a l l y "fossil" peat was an important part of some freshwater food webs in Alaska. In North Carolina, ancient and recent peat deposits are extensive, especially near the mouths of the NRE and PRE. We obtained six samples of t h i s material from surface and sub-surface peat banks a t the water's edge a t the mouth of the PRE. Three samples from the eroding top surfaces had 613c values of -16.2, -16.6, and -22.1 O / / e o , and the f i r s t two were probably influenced by Spartina c nosuroides Cq plant (Smith and Epstein, 1971) with a 613c of
+' a -12.3 o/oo ( 1ve p ants from PRE) . This species favors marsh edge habitat, and, as shoreline' erosion progresses, appears to grow over areas once occupied by Juncus roemerianus, a C3 species that dominates interior portions of i r - r e g m f 1 ooded marshes 7 n the region. Sampl es co1 1 ected from exposed sub- surface peat on the vertical banks a t the same s i t e s had 61% values of -24.8, -25.7, and -27.0 O/oo. The origin of th is material was probably pre- viously buried J . roemerianus (613~ of -25.9 O/oo in 1 ive plants from the PRE) . AlternatEly, inland bogs in the Albemarle Peninsula area [north of the mouth of the PRE) cover large areas less than 1 m in elevation and the peat i s derived from evergreen shrub bogs dominated by C3 plants, which have a 61% value similar t o that of 3. roemerianus.
Under the influence of rising sealevel and landward shoreline migration, these peats are now exposed to estuarine erosion and transport. Bellis -- e t a l . (1975) estimated annual shoreline erosion rates ranging between 1 m (pro- tected) and 7 m (exposed). Assuming a 2 m yr-1 erosion rate , a peat depth of 2 m , 40 km of erodable shoreline, a bulk density of 150 kg m-3, 60% OC Otte
this would account for about 16 t o 33% of the net annual phytoplankton 1 and Ingram, 1980), and that a l l of t h i s i s deposited i n the PRE (346 krn ) ,
ductivity (Davis e t a1 . , 1978; Kuenzler e t a1 . , 1979), or 6.9 mol OC m' !r&l . Without know1 edgeTfThe rates of decompzition of peat or phytoplankton prior t o sedimentation, we cannot evaluate the importance of these sources to PRE sediments. Nonetheless, lateral peat bank erosion i s a potentially large addition t o the estuarine carbon pool and requires further investigation.
On the basis of results presented here, we conclude that estuarine phytoplankton i s the dominant OC source to the sediments in the lower two

thirds of these estuaries. Our conclusions are based principally on the fol- lowing three observations.
1 ) Seasonal changes in the 61% of seston, associated with spring pulses of phytoplankton production, produce corresponding changes in the 61% of surface sediment (Fig. 10a). Although strong cou- pling of benthic-pelagic carbon flux has been described for other estuaries Hargrave, 1973; Graf e t a l . , 1982), the evidence pro- vi ded by 61% values in the PRE 5 p r t i cularly provocative
2 ) The lack of a terrestr ia l 61% signature in the mouths of tkibutaries between krn 20 and 60 i s probably a consequence of dominance by main channel sources over lateral inputs where the estuary widens (Fig. 8) Combined effects of phytoplankton deposition and sediment redis t r i - bution from the main channel by turbulence and sal t-wedge transport apparently mask a1 teration of 61% values i n these t r ibutar ies by localized terrestr ia l inputs.
3) C/N ra t ios , in combination with 6 1 3 ~ values, have a dis t inct ter- restr ia l signature only in the upper 10 krn of these estuaries (Fig. 9) .
We are not suggesting that sediments in the lower reaches of these estu- aries are devoid of terrestr ia l and marine OC. Rather, inputs from these sources are either t o o low t o significantly a l te r 6 1 3 ~ values or the stable carbon isotope ratios change much more rapidly than we suspected. However, the evidence i s much stronger that phytoplankton production and carbon re- cycl ing within the estuaries are the prevalent mechanisms that control organic matter distribution in sediments of the PRE and NRE.
Chemistry of the In ters t i t ia l Pore Waters
As mentioned ear l ie r , the pore waters contain relatively small amounts of nutrients i n comparison with the bulk particulate sediments, per u n i t volume of whole sediment. For example, the data i n Table 9 shew that , fo r the N fractions other than Np, pore water N H ~ ' i s always less than 1% of'total Kjeldahl N and i s approximately 1/4 t o 1/2 of the exchangeable N H q ( E N ) that i s sorbed to sediment particles. However, the E N , EP, and pore water NHqS and FRP fractions are more physically and biochemically active and therefore influence the chemistry of the bottom and surface waters over shorter time periods than do the TOC, TKN, and TP fractions. The concentrations in and fluxes from the sedimentary pore waters are discussed here i n terms of daily and monthly changes rather than i n long-term sedimentary chronology.
We collected several types of pore water data for different purposes. Firs t , we collected sediment cores by hand with SCUBA (Fig. 3a) a t Stas. C through H i n the Pamlico River Estuary ( P R E ) every month for a year (1981) and continued monthly sampling a t Stas. D and G (Sparrow Bay and Indian Island) until August of 198%. Second, we collected a similar sui te of six cores in the Neuse River Estuary (NRE) , Stas. C through H in June, 1981 and March, 9982 for simultaneous comparison w i t h the PRE cores. A third set of cores from the NRE

was obtained in July, 1982 for comparison with the August cores taken from the PRE a t Indian Island. Third, i n the spring of 1981 we installed i n s i tu pore -- water samplers (Fig. 3b) a t s i tes near our PRE Stas. C , E , and G t o study time series changes a t the same s i t e .
The 1981 PRE pore water N H ~ ' , FRP, and C1' data are in Figs. 12a, b , and c , respectively. Table 10 contains the June, 1981 NRE and PRE pore water data, while the March and July, 1982 N R E data are in Figs. 13a and 6. The 1982 pore water data from Sparrow Bay and Indian Island are i n Figs. 14a and b. We began measuring pore and bottom water ~042- a t a few stations i n March, 1981 and data were routinely obtained from a l l six stations beginning in June, 1981. Regular analysis of cDIC began i n January of 1982, b u t no cDIC data were col- lected from either set of 1982 NRE cores due t o technical diff icul t ies .
Generally, concentrations of N H q + , FRP, and Si were h i g h and increased with depth in the sediments t o maxima a t about 10 t o 20 cm below the sediment surface. In some cases, such as a t Pamlico Light (Sta. H , Figs. 12a and 12b), abundant macrofauna have reworked the upper sediments and irrigated the surface sediments so that increases in pore water NHq+ and FRP did n o t appear until depths of about 10 cm. Below this bioturbation zone, NHq+ and FRP increase in the same manner as a t the other stations where bioturbation was not evident. These general trends due t o bioturbation, or the lack of i t , have been ob- served frequently elsewhere (Berner, 1980).
The highest concentrations of pore water NHq+ and FRP were observed a t Sparrow Bay (Sta. D) and the lowest were observed downriver, usually a t Pamlico Light (Sta. H, Figs. 12a and 12b). The accumulations of cDIC and depletions i n ~042- also f i t these trends (Fig. 14). The two mid-estuary Stas. E and F ( imediately up- and downriver of the Texasgulf Chemicals, Inc. plant) were quite similar, while Blounts Bay (Sta. C ) had the second highest concen- trations of NHqS and FRP. The upriver areas receive the combined loads of terrestr ia l debris and dense winter and summer algal blooms, so that downriver areas may have significantly lower rates of organic matter deposition and sub- sequent remineral ization activity. However, the downriver areas may receive substantial inputs of organic matter from peripheral marshes and Pamlico Sound, as well as from dense algal blooms. Because the waters are deeper downriver, much of this material may be decomposed i n the water column and result in less organic deposition i n the sediments than a t upriver stations. This hypotheti- cal scenario would explain why there i s a genera1 decrease i n ~ 0 4 2 - depletion, and lower accumulations 0% N H q + , F R P y and cDIC downriver.
The pore water concentration E. depth curves for N H ~ ' and FRP f a l l into three main categories: they are either curvilinear, l inear, or irregular (Figs. 12a and 126). This variation in shape indicates that the sediments are somewhat physical ly mixed and that there are spatial heterogeneities i n rates of solute accumulation. Consistently curvilinear profiles would indicate the maintenance of a more simple regime of organic deposition, partial remineral - ization, and compaction and diffusion under the control of constant sedimen- tation rate with l i t t l e stratigraphic alteration due t o physical mixing (Berner, 1971 ; 1980). Obviously, t h i s i s rarely the case. Profiles of FRP, for

Table 10 . Pamlico and Neuse River Estuary surface (SW), bottom (BW), and pore water (sections A-F) chemical data: June, 1981 .
Sampl e l S t a . C S t a . D S t a . E S t a . F S t a . G S t a . H Sec t ion NRE PRE NRE PRE NRE PRE NRTE N R f - E m E
uM FRP 4 .4 -- 3.8 -- 0.1 -- 0.3 -- 0.8 -- 0.6 --


Fl lTERABLE REACTIVE PHOSPHATE rnM
m 0
J A N FEB M A R APR MAY JUN JUL AUG SEPT OCT NOV DEC
Fig . 12. (b ) Pamlico River Estuary pore water data from 1981. FRP (mM) a t a l l s i x s ta t ions .


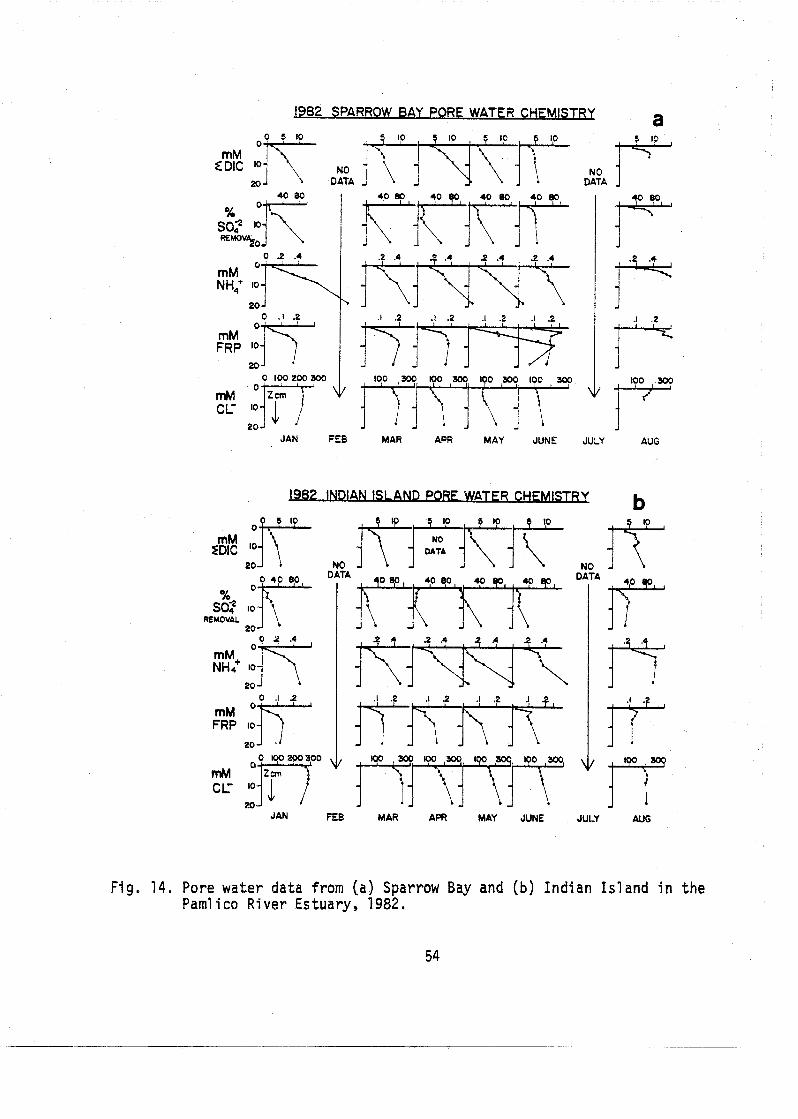
1982 SPARROW BAY PORE WATER CHEMISTRY a
EDIC 10
20 DATA DATA
0 mM FRP lo
2 0
2 0 JAN FEB MAR APR MAY JUNE JULY AUG
1982 INDIAN IS1 AND PORF WATER CHEMISTRY b
REMOVAL J \ 20
0 2 .4
NO DATA
NO DATA IT-
-- JAN FEB MAR APR MAY JUNE JULY AUG
Fig. 14. Pore wa te r da t a from (a ) Sparrow Bay and (b) Ind ian I s l a n d i n the Pam1 i co R i ver Es tuary , 1982.

example, would rarely f i t any simple mathematical form without invoking several diagenetic processes. The rapid, imedi a te increases in FRP during the warmer months a f t e r May are l ikely due t o the combined effects of increased biological ac t iv i ty and a s h i f t from respiratory 02 t o ~ 0 ~ 2 - reduction by the mi crobi a 1 commun i ty . The interactions between 0~/Fe3*, S O ~ ~ - / S ~ - , F ~ ~ + / F R P , and Fe2+/~2- resul t in the accumulation of FeP complexes a t the oxidized sedi- ment/water interface due t o ~ 0 4 2 - reduction, diffusion of FRP and 52- from anoxic sediments below, and to 02 a t the redox discontinuity layer. Reduction of ~ 0 4 2 - produces ~ 2 - t h a t , a f t e r movement to oxidized sediments, quantita- t ively s t r ip s FRP from ~ e 3 + complexes. The familiar black color of the muds are due t o the simultaneous precipitation of FeS (monosulfide i ron) . Geologic or biochemical (Howarth, 1979) maturation of FeS resul ts i n the s l a t e grey colored FeS2 (pyr i te ) which i s common during winter and in deep sediments. Thus, the disproportionate increase in FRP re lat ive t o N H ~ + (see stoichio- metric discussions below) i s due more t o dissolution of preexisting Fe-P com- plexes than t o remineralization of freshly deposited organic matter. The parabolic FRP curves, such as those a t Sparrow Bay in the f a l l (Fig. 12b), are frequently observed i n n e r i t i c anoxic sediments and are often explained by authigenic mineral formation (Martens - e t -- a1 1978; Krom and Berner, 1980a) as well as ( fo r NO3') by subsurface i r r igat ion by macrofauna (Grundmanis and Murray, 1977). However, since the concentration curve inflections only occur with FRP in these sediments, macrofaunal i r r igat ion i s not the cause of these changes.
The profiles of N H ~ + and Si are more amenable to mathematical modeling than those for FRP because these species interact with fewer other soluble and particulate phases. N H ~ + accumulates in the pore waters a t depth (Figs. 12a, 13, 14) due t o recent decomposition of organic matter and equilibration among the TKN, EN and dissolved N H ~ + phases. Si increases (Fig. 13b, Table 10) due t o partial solubil ization of de t r i ta l alumino-sil i ca te clay minerals and con- tinual dissolution of buried diatom t e s t s (Berner, 1971 ; Cal lendar and Hammond, 1982). Asymptotic behavior of the NHq+ and Si curves a t about 10 cm in most cores can be at t r ibuted t o the combined effects of (1) decreased metabol i c ac t iv i ty and ( 2 ) decreased rates of diffusion due to compactive dewatering of the sediment and a reduced concentration gradient which minimizes diffusive flux. The lower concentrations near the sediment surface are due t o the opposite effects : surface sediments are more flocculent, contain a pre- sumably more active microbial f lo ra , and are more easi ly resuspended up into the water column by physical mixing. Other studies show tha t extensive bio- turbation of surface sediments generally resul ts in low solute concentrations and an increase similar t o our data, b u t below the bioturbation none (Aller, 198Ob; Berner, 1980). A t typical summer rates of NHqS regeneration from or- ganic matter (ca. 1 to 10 mmol NHq+ m-2 d-1, presented l a t e r ) , N H ~ + profiles would become nearly vertical a t the higher concentration w i t h i n a few days i f water movement and diffusion did not occur.
The seasonal trends clearly f i t a model of summertime thermal stimulation of remineralization ac t iv i ty and wintertime turbulent mixing of the surface sediments. The rates of production are s l ight ly less t h a n those of removal (by diffusion and mixing) in more turbulent winter conditions (lower

concentration maxima a t depth) and are s l ight ly greater than removal rates in the calmer summer periods (higher concentration maxima a t depth). Some pro- f i l e s are clearly indicative of sampling "hot spots" where a large organism may have recently died (e.3. FRP a t Sparrow Bay in May, Fig. 14a) and others indicate that the core was taken in a dense patch of actively bioturbating worms (e .2. - f a l l data a t Pamlico Light, Fig. 12b, 12c).
June,1981 pore water N H q + and FRP data from the NRE and PRE are compared in Fig. 15. The pore water NH@/FRP ra t io i s almost 50% higher in the PRE. However, both the TKN/TP and the EN/EP ra t ios are higher in the NRE than the PRE (Figs. 4a and 4d). If equi 1 ibrium between pore water and exchangeable forms occurs, the pore water ra t ios in the NRE should be higher than those of the PRE. As th i s i s not the case, there are two possible explanations: (1) The rat ios are not s ignif icant ly different between the two estuar ies . However, in sp i t e of the absence of random sampling (which precludes rigorous parametric s t a t i s t i c a l t e s t s ) , consistent trends downriver and between estu- a r i e s occur repeatedly. ( 2 ) Subtle difference in exchangeable forms may affect pore water-exchangeable ion equi l ibr ia . A higher TOC content of NRE sediments (Fig. 4c) may provide more exchange s i t e s t o sorb a re la t ive excess of EN (Fig. 4b) , thus effectively lowering pore water NHq+ concentrations.
Continued monitoring into 1982 a t the Sparrow Bay and Indian Island s i t e s and additional analyses provided a be t te r pi cture of relationships among pore water constituents. The two s ta t ions were chosen because of obvious biogeo- chemical differences as well as differences in depth, width, fe tch, ra tes ~f water column photosynthesis, 1 arge boat t r a f f i c (barges from the phosphate plant frequently destrat i fy the water column a t Stas. F and G ) , and the sources of organic matter t o the sediments. For example, because the waters a t the Indian Island s i t e are twice as deep, we would expect more remineral- ization of organic matter in the water column than upriver a t Sparrow Bay. This would resu l t i n less net sedimentation and consequently less TOC i n the absolute sense (Table 3) and less l ab i l e TOC in a re la t ive sence. On the other hand, Indian Island sediments contain s ignif icant ly more TKN i n the top 90 m t h a n those a t Sparrow Bay (Table 31 but the l a t t e r has much higher TKN levels in the upper < 2 cm (Table 7b). The lower C/N r a t io a t Indian Island i s prob- ably a resu9t-of deposition of ropsrtionately more l ab i l e OC ( i .e. , phyto- S plankton). The mud sediment 61 C data presented above (Fig. 9)sKow tha t Sparrow Bay receives a greater percentage of t e r r e s t r i a l material and t h a t Indian Island receives almost exclusively phytoplankton debris. Further, the temporal changes in section A sediment chemistry a t these two s ta t ions (Figs. 5a and b) are very different with lower concentrations of C , N , and P as well as a d i s t inc t seasonal cycle of enrichment downriver.
In conclusion, the pore waters of these estuaries contain concentrations of NHq+, FRP, and Si tha t are typical of ne r i t i c deposition zones (e.3. Berner, 1974; A1 l e r , 1980a; McCaffrey e t a b ? 1980; Waslenchuk e t a1. , 1983r. The solutes accumulate due t o decomposition of organic matter under a relat ively quiescent hydrologic regime. Although the pore water concentrations are high in comparison with those in the overlying waters, they represent only a minor fraction of the total in the part iculate sediments. Concentrations a re

* PAMLICO RIVER SLOPE
RIVER
-2.13
PORE WATER NUTRIENTS JUNE 1981
FILTERABLE REACTIVE PHOSPHATE-F: yM
Fig. 15. Relationship between N H ~ + and FRP i n t he pore waters of the s i x study s t a t i o n s C through H in the Neuse and Pamlico River Estuaries during June, 1981. Data from Table 10.

higher in the summer t h a n in winter because of a general increase i n bio- logical activity and a decrease in the amount of turbulent mixing during storms. However, calm summer weather a1 so often results in bottom water anoxia that further increases pore water concentrations because bioturbation and irrigation of the upper sediments i s prevented. In the following sections, we present flux d a t a for and stoichiometric relationships among pore water constituents t o further describe biogeochemical cycl ing in these estuaries.
Solute Flux Across the Sediment/Water Interface
Here we discuss the estimates of solute flux made using the thermodynamic approach of diffusion down a concentration gradient between adjacent water samples. These estimates are considered t o be the lowest rates attainable without the kinetic effects of bioturbation, advection, and water turbulence. Other factors also affect solute flux such t h a t predicted and observed fluxes are often quite different (Callendar and Hammond, 1982). For example, high concentration gradients of FRP predict t h a t , without subsequent uptake, high bottom water FRP concentrations should exist , b u t th is i s only observed a f te r s trat if icat ion and bottom water anoxia. After diffusion from the anoxic pore waters, FRP may precipitate with ~ e 3 + and OM, which are a t least 20 fold in excess of FRP. Also, N H ~ ' may n o t appear i n bottom waters (or benthic flux chambers) because of sorption onto freshly deposited cationic exchange s i t e s on organic matter and clay minerals. Some Si may flocculate w i t h organic mat- t e r and w i t h FeP complexes. In any case, the net effect i s migration t o and accumulation of nutrient elements within the redox discontinuity layer (RBL) of the surface sediments. In this respect, the surface sediments receive substantial inputs from both overlying surface waters and the underlying an- oxic sediments. This physical and chemical interface is an extremely active and essential p a r t of the structure and function of aquatic systems. I t i s diff icult t o sample ( i t i s poorly defined, f l occulent, heterogeneous, and small) and, t o date, even more diff icult t o study directly. Isolating this interface from i t s immediate environment for study affects i t s integrity by severing i t s connections w i t h the driving forces from above and below. Mast of the known and suspected processes within the RDb depend upon the proximity of more oxidized and homogeneous surface waters and more reduced and hetero- geneous underlying sediments.
Accordingly, high rates of flux across the interface are stimulated by anoxia i n the bottom waters because many oxidation and precipitation reactions (several of which occur only i n oxidized environments) are prevented during anoxia (Berner, 1980). Anoxia results in the migration of the RDL up i n t o the water column away from the nutrient rich sediment surface. Aerobic oxida- tion of NH4+ t o NO3- and precipitation of FRP with ~ e 3 + will not occur under anoxia, and, since the RDL has moved upwards from the NHq+ and FRP rich sur- face sediments, large fluxes of FRP and N H q + are observed (Waslenchuk e t a t . , 1983). In most cases, predicted and observed f 1 ux data agree we1 1 when the bottom waters become anoxic (Cabaniss, 1982; Waslenchuk -- e t a1 . , 1983) because anoxia inhibits bioturbation and i s associated with calm water regimes. None- theless, large fluxes are frequently observed in the warm summer months re-

regardless of bottom water anoxia. The bottom water concentrations increase dramatically (Table 10) and subsequent mixing events d is t r ibute the nutrients throughout the water column. After several days of calm summer weather, winds across Blounts Bay produce upwelling of nutrient rich bottom waters in upwind areas. Therefore, with reduced bioturbation and advection in calm anoxic waters, our summertime predicted diffusional flux estimates are closer to ac- tual flux.
The relationships between nutrients and 02 in the' PRE bottom waters (Table 11 ) clearly show tha t (1 ) nutrient enrichment i s s ignif icant ly associated with 02 depletion, ( 2 ) there are substantial differences between s ta t ions , and (3) about 60% of the variance i n bottom water FRP and NHqt concentrations i s n o t associated with 02 depletion ( i . e . , - - 100-~2 for 02).
The flux estimates fo r N R E sediments are given in Table 12 and are simi- l a r t o those from the PRE (discussed below). The lowest values f o r NHqS, FRP, and Si flux t o the bottom waters were 0.20, 0.029, and 0.35 and the highest rates were 3.5, 0.5, and 1.9 mmol m-2 d-1, respectively. Accordingly, during thermohal ine s t r a t i f i ca t ion , the bottom waters general ly have higher nutrient concentrations than the photosynthetically active surface waters (Table 12). During calm weather, some phytoplankton may migrate t o NHq+-ri ch bottom waters to balance the daytime luxury uptake of FRP in the surface waters (Kuenzler e t a1 1979; Fisher e t a1 . , l982b). We have calculated pore water flux as a - - 3 -- percentage of bottom and surface water concentrations fo r a f i r s t order e s t i - mate of the potential dependence of phytoplankton on nutrient flux from the sediment (Table 13). These data also represent the percent increase per day in the concentrations of NHqS, FRP, and Si throughout the en t i re water column using e i ther the bottom CBW) or surface (SW) water concentrations. A t tem- peratures greater than 13"C, f l u e s of NH4+, FRP, and Si can increase the average water column concentrations by up t o 57, 6.4, and 0.93% per day, re- spectively, u s i n g BW concentrations, and by 5 7 , 102, and 0.93% using the SW concentrations. The percentages f o r S i are relat ively low because ambient water concentrations are rarely less than 20 pM and diatoms do not appear t o affect the Si concentration s ignif icant ly.
I Averaged over the en t i re year, calculated diffusive f lux of N H ~ + and FRP from N R E muds (Table 12) are equal to and about 10% of, respectively, total dissolved inorganic N and P flux from freshwater NR discharge (Table 14). Recycling of N and P within the water column, based on the difference between phytoplankton uptake (Fisher e t a l . , 1982b) and flux from Sta. G sediments (Fisher e t a l . , 1982a) could l%? T t o 4 times greater than sedimentary flux. Further,av=age daily N H ~ + uptake by phytoplankton in NRE waters near Sta. G i s about 1/2 of the average amount in the en t i re water column (Fisher e t a l . , l982b). Therefore, recycling times during the active months must average about 2 days and/or diffusive flux from the sediments must be augmented by bioturbation, advection , and turbulence in order fo r nutrient 1 imitation to be avoided. The average in s i t u direct f lux data obtained during 1978 by
7- Fisher e t a l . (l982a), u s i n g chambers instal led near our Sta. G , were 5.5 and 0.34 mmx m4+ and FRP, respectively, m-2 d-1. Our summer diffusive f lux estimates (June and July, 1981 averages, Table 12) from t h i s s i t e were 2.6

Table 11. Regression equations ,of concent ra t ions of NH~' and FRP on O2 in t h e bottom waters of t h e Pamlico River Estuary, 1981.a
S t a t i o n Y N R R Sl ope B
Blounts Bay (C) FRP N H ~ +
Sparrow Bay ( D ) FRP NH4+
Indian I s l . (G) FRP N H +
All 6 S t a t i o n s FR? N H ~ +
a In t h e general form Y = M - X + B, where X = mM 02, M = Slope , and B = Y i n t e r c e p t . A11 in mM and s i g n i f i c a n t a t P = 0.05.
Table 12. Diffusional f l u x da ta f o r t h e Neuse River Estuary, 1981-1982.~
Date/ S t a t i o n C I - sod2- N H ~ + FRP s i N/P
June, 1981:28° C C (3 .0 m ) D ( 3 .3 rnj E (3.9 m) F (5.3 rn) G (5 .7 m) H (6.3 m)
March, 1982: 130 C C D
mmol rn-2 d" (+ = i n t o ; - = ou t of mud) - 61 +2.27 - 4 -0.23 -8.38 5.0
a Numbers i n parentheses a f t e r s t a t i o n s a r e water depths. N/P i s t h e r a t i o of NH4+/ FRP f 1 ux .

Table 13. Percent increase per day of NH~', FRP, and Si in the bottom (BN) and surface (SW) waters of the Neuse River Estuary due t o f lux from the ~ e d i r n e n t s . ~
Date/ S t a t i o n NHq+ FRP S i
June 1981 Temp. = 28
March 1982 Temp. = 1 3
Ju ly 1982 Temp. = 28
2.8 3 . 3 1.7 1.2 No S i l i c a Data 1 0 7.0 3 . 4 1.1 11
11 --- 2.7 --- I t
2 0 2 0 4.8 5.7 11
9.5 4.6 1 . 8 1 . 4 I t
7.7 11 1 .6 2.0 II
No S W
Data I1
Ns sw
Data I t
No SW
Data I t
I t
I 1
a Flux data (Table 12) d iv ided by depth i n m div ided i n t o BW and SW concen t r a t i ons (mmol m-3) X 100.

Table 14. F i r s t o r d e r summary of n u t r i e n t f i u x e s t o and wi th in t h e Neuse River Estuary.
Nutri e n t Source o r S torage Reference
Flux Rates : averaae mmol mw2 d'l
From t h e watershed
From t h e sediments Di f f u s i o n model In situ chambers --
Phytoplankton Uptake
Recycl i ng in water col umn
Import from Paml i co Sound
S to rage i n The Estuary: mol K2
Water Col umn
Sediments Long Term (TKN and TP) t~ 1 cm deep t o 1 0 cm deep
Shor t Term (EN and EP) to 1 cm deep t o 10 cm deep
2 * 1 N.C.D.E.M.
0.25 Th i s s tudy 0.34245% F i she r e t a1.(1982a)
? ( 0 . 6 9 ) ~ F i she r et a1 .(1982b) -- ? ( 0 . 5 6 ) ~ F isher e t a1.(1982b) --
?
6.4 This s t u d y
11 5 This s t u d y 1150 II
N and P f l u x from watershed a s t o t a l d i s so lved inorganic n i t rogen and phosphorus (North Carol ina Department o f Environmental Management). Other f l u x d a t a a r e f o r N H ~ * and FRP only.
b Phytoplankton uptake and r ecyc l ing i n water column P e s t i m a t e s assume an N/P r a t i o o f 16 and i s probably a cons ide rab l e ove re s t ima te because Paml ico River Estuary r a t i o s range between 0.69 and 13.9 (Table 1 6 ) . F i sher e t a1 (1 9822) -- d i d no t r e p o r t P .uptake d a t a , but t h e i r 1982 f l u x da ta show an NIP r a t i o o f 16 averaged over t h e yea r .

and 0.18 mmol m-2 d-1, o r about ha l f of the va lues observed by F i she r -- e t a l . ( l 9 8 2 a ) . Thus, water motion (by any mechanism) i n c r e a s e s NRE S t a . G f l u x by 100%, reduces water column recyc l ing t imes by h a l f , and i n c r e a s e s t h e impor- t ance of sediments r e l a t i v e t o f r e shwa te r i npu t .
Nut r ien t - r ich f r e s h waters a r e only important during t h e winter and e a r l y sp r ing blooms, which amount t o about 30% of annual phytoplankton product ion i n t h e PRE. Otherwi se, t h e NO3- in f reshwater runoff d i sappears exponent ia l l y wi th d i s t a n c e ( s a l i n i t y ) downriver a s a r e s u l t of r ap id uptake by phytoplankton (Kuenzler e t a l . , 1979) . Actua l ly , Kuenzler e t a1. ( l 9 7 9 ) , S t an l ey and Hobbie (1981)Fand Paerl and Ustach (1982) r a r e l y , if e v e r , observed deple- t i o n of N o r P from waters of t h e PRE, Chowan, o r NRE. This may be a t t r i b u t - a b l e t o storms t h a t resuspend t h e n u t r i e n t - r i c h s u r f a c e sediments i n t o t h e water column and r e l e a s e o r o therwise make a v a i l a b l e some of t h e l a b i l e EN and EP. These f r a c t i o n s i n t h e t op 1 cm a r e s u f f i c i e n t f o r an average of 1 and 12 days of NHqS and FRP uptake by phytoplankton, r e s p e c t i v e l y (Table 1 4 ) .
Our most complete da ta set i s from t h e PRE. Ind iv idua l e s t i m a t e s and annual t o t a l s of c a l c u l a t e d d i f f u s i v e f l u x e s a r e given i n Figs . 16a, 166, and 17. For t h e P R E Y t h e h ighes t d i f f u s i v e f l u x e s of N H f , FRP, and S i ( s e e Table 15 f o r Si d a t a ) were 6 .1 , 1 .0 , and 1 .6 mnol m- d-I- This i s about 42% and 6.3% of t h e h ighes t observed r a t e s of -- i n v i t r o NHq+ and FRP uptake, re- s p e c t i v e l y (Kuenzler e t a1 . , 1979). In t h e downriver d i r e c t i o n , average annual NH4+/FRP f l u x ratio increased from 7.1 t o 15.5 whi le average phyto- plankton uptake r a t i o s increased from 0.69 t o 13.9 (Table 1 6 ) . Thus, t h e up- r i v e r phytoplankton community would appear t o be N 1 imi ted based on those r a t i o s . However, f r e shwa te r runoff during win t e r and s p r i n g s u p p l i e s l a r g e amounts of NHq+ and NOS- and N and P are r a r e l y dep le t ed from t h e s e waters (see above). All e s t i m a t e s of f l u x from t h e sediments averaged f o r t h e e n t i r e y e a r amounted t o 7.7 and 2.5% of t h e t o t a l phytoplankton uptake of NHq+ and FRP, r e s p e c t i v e l y , r epo r t ed by Kuenzler e t a1 . Cl979). Augmentation o f d i f - f u s i v e f l u x by t h e f a c t o r of 2 from t h e m ~ S t a . G da ta (d i scussed above) i n - c r ea se s t h e s e percentages t o about 15 and 5%. Other da t a we obta ined from our s t a t i o n s in t h e PRE i n d i c a t e t h a t advec t ive o r t u r b u l e n t mixing of waters i nc reases ac tua l f l u x t o about 4 X g r e a t e r than d i f f u s i v e f l u x , f o r percent - ages of uptake c l o s e r t o 30 and 10% of p o t e n t i a l phytoplankton demand, These da ta w i l l be d iscussed f u r t h e r below, bu t f o r now we can conclude t h a t , s i n c e f l u x from pore waters is <30% of uptake i n water column, r ecyc l ing wi th in t h e water column i s probably t h e major phytoplankton n u t r i e n t conserva t ion mech- anism over s h o r t per iods of time. Fur the r , t h e p a r t i c u l a t e sediments a c t a s a major r e s e r v o i r t h a t g r adua l ly r e l e a s e s n u t r i e n t s over longer t ime per iods .
L a t e r , we d i scus s ou r c a l c u l a t e d r a t e of o rganic m a t t e r depos i t i on t o t h e sediments i n t h e PRE (9 mol OC m-2 y r -1 ) bu t use i t here t o show t h a t t h e r a t e s o f inorganic n u t r i e n t r e t u r n t o t h e water column a r e less than t h e depo- s i t i o n r a t e s . A t annual average C/N/P r a t i o s of 113/16/1 i n s e s ton (Kuenzler e t c., 1979) o r of 94/9.8/1 i n t h e sediments (Table 6 ) , N H an FRP f l u x T o m t h e sediments should be a t l e a s t 0.94 and 0.096 mol m-f:r-f i n s t e a d o f 0.37 and 0.038, r e s p e c t i v e l y (Table 16) . The average annual f l u x of DIC from t h e sediments ( ca . 4.6 mol m-2 yr-1) i s a l s o about ha l f o f t h e e s t i m a t e f o r o rganic depos i t i on . Water tu rbulence and b i o t u r b a t i o n may i n c r e a s e t h e s e es t i -

DIFFUSIONAL FLUX MMOL 6' d"
I.Oq TOTAL ANNUAL DIFFUSIONAL FLUX C 10
MOL M-2 YR-I M
b I R
plP---p- p-P-p I I I I I I 10 20 30 40 50 60
PAMLICO RIVER KM
Fig. 16. ( a )Di f fus iona l f l u x o f FRP (X10) and N H ~ + from a l l Pamlic River P Estuary s t a t i o n s dur ing 1981. I n s e t da t a a r e m o l m-2 y r - . (b)TotaS annual d i f f u s i o n a l f l ux from t h e sediments wi th d i s t a n c e downri ve r i n t h e Pam1 i co River Es tuary , 1981 . The two i n s e t Cs a r e e x t r a p o l a t e d t o t a l s o f DIC f l u x from t h e 1982 d a t a i n Fig. 14 .


Table 15. Diffusional f l u x of s i l i c a from t h e pore waters of t h e Pamlico River Es tuary , 1981 . a
Bl ounts Sparrow Durham Texas Indian Pamlico Month Bay (C) Bay (D) Creek(E) Gulf(F} I s land(G) Light(H)
Temperature co r r ec t ed f1ux:mmol m-2 d'l
June 0.65 0.79 0.56 1.13 1.10 1 .60 August 0.33 0.41 0.35 0.44 0.21 ---- September 0.53 0.44 0.43 0.48 0.82 0.56 November 0.15 0.28 2.10 0.27 0.35 0.22 December 0.11 0.09 0.12 0.12 0.24 0.09
- X 0.32 0.40 0.71 0.49 0.54 0.62
'1 - S.D. 0.23 0.25 0.79 0.39 0.40 0.69
We assume a value o f Ds6 equal t o t h a t f o r FRP.
Table 16. Tota l annual d i f f u s i o n a l f l u x and nutrient uptake by phytoplankton i n t h e Pamlico River E ~ t u a r y . ~
N H ~ + FS uxb FRP Fl u ~ b N/P S t a t i o n Flux Uptake Uptake Flux Uptake Uptake Flux Uptake - -
mmol m'Z yr"l % mmol m-2 yr-I %
aFlux. da t a from Fig. 16a. Uptake da t a from Kuenzler -- e t a1 . (1979) . b ~ a t i o o f Flux/Uptake X 100.

mates by several fold (Fisher & a1 . , 1982a) and resu l t in rather good agree- ment between deposition and f l ux .-'However, di rect estimates of decomposition presented below show that much more organic material i s required t o support the observed levels of heterotrophy. Thus, N H 4 + , FRP, and DIC appear t o be conserved in the sediments and our estimate of organic matter supply to the sediments must be low. Together with the l ight C isotope depletion data re- ported earl i e r fo r the pore waters, these observations indicate that recycl i ng within the sediment i s also extensive.
The estimated diffusive fluxes of cDIC from Sparrow Bay a n d Indian Island during 1982 follow the same pattern as NHq+ and FRP (Fig. 17) . Relative to estimated inputs of organic matter t o the sediments (surface water ~ 1 1 4 ~ f ix- ation minus respiration in the water column; shown l a t e r ) , sedimentary output of cDIC i s low, even i f we multiply by a bioturbation/advection factor . We must qua1 i fy these concl usions somewhat since we have taken certain 1 i ber t ies with the cDIC diffusion estimates by assuming tha t a l l DIC fractions diffuse equally. Specifically, the pH of these sediments (ca. 6.9 t o 7.6) indicates tha t up to 1/3 of the zDIC may exis t as COZ(~ andTas f o r CH4, may bubble out of the sediments (Martens, 1976). T h u s , t he flux of HC03' is probably less than that of C02 so tha t cDIC may actually diffuse f a s t e r than i f i t con- s is ted of only HCO3'. Nonetheless, f lux of cDIC closely follows tha t of NH4+ ( F i g . 17) and the highest calculated ra te , 56 nnnol m-2 d-1, i s about equal t o the annual average ~ 1 1 4 ~ fixation observed f o r surface water phytoplankton and about 10% of the maximum observed ra te (Davis e t a l . , 1978; Kuenzler e t al-. , 1979). This also indicates tha t both phytaplxkton decomposition in S e water column and atmospheric CO2 must contribute to the LDIC balance.
The flux of SO 2 - , which generally occurs into rather than out of the sediments, closely f ollows the reverse flux of NHq+, FRP, and cDIC (Fig, 16b and 17). The flux of 5 0 ~ 2 - was due mostly t o respiratory 5 0 ~ 2 - reduction in the sediments (~5042-, Figs. 13 and 14) and, t o a lesser extent, t o gradually increasing s a l i n i t i e s d u r i n g summer and fa1 1. D u r i n g s m e r and early fa1 1 , ~ 0 ~ 2 - reduction rates are the highest (see below), but depletion of pore water ~ 0 ~ 2 - never occurred in the top 20 cm and was possibly prevented by the con- tinual su ply of ~ 0 4 2 - from progressively s a l t i e r bottom waters. Thus , e i ther (1 7 the low supplies of lab i le organic matter l imit 5 0 ~ 2 - reduction, (2) average rates of 5042- reduction are less than or equal to 5042- flux into the sediments, or ( 3 ) 5042- i t s e l f i s effectively recycled w i t h i n the upper sediments. These poss ib i l i t ies , as well as direct estimates of 3 5 ~ 0 ~ 2 - re- duction and stoichiometric relationships with other indicators of decomposition will be discussed below. Here we can say tha t , based on depletions re la t ive to C1- ( A S O ~ ~ ~ ) , ~ 0 ~ 2 - appears t o be a major oxidant of organic matter in these sediments and tha t nutr ient regeneration and flux may depend largely on 5042- reduction and also on the subsequent par t ia l depletion of bottom water 02 by ~ 2 - oxidation. As discussed e a r l i e r , the 52- produced by bacteria i n the upper sediments i s a major cause of bottom water anoxia and largely de- termines the dis t r ibut ion, migration, and avai labi 1 i t y of FRP in estuar ies .
In conclusion, the calculated ra te a t which N H ~ * and FRP diffuse from the pore waters t o the surface waters in the N R E and PRE i s much less than the

rate of recycling within the surface waters by the plankton community. Calculated turnover times of nutrients i n the surface waters, pore waters, and particulate sediments are on the order of days, weeks, and months to years, respectively. During calm summer weather, flux from the pore waters may equal recycl ing within surface waters, especial ly when winds destratify the water column and mix the nutrient-rich bottom waters with the surf ace waters. Bioturbation and irrigation by benthos in spring and f a l l often pre- vent the development of strong concentration gradients in the pore waters so t h a t calculated flux from the pore waters i s low. However, actual flux under these circumstances may occur continuously or intermittently (A1 1 e r , 19806) so t h a t diffusive flux calculations may significantly underestimate real flux.
The Stoichiometry of Decomposition
Nutrient elements often display characteristic ratios t o each other and provide information about types of biogeochemi cal processes. Thus, Redfiel d (1958) was able t o describe the effects of biology on the chemistry of seawater by examining the stoichiometric (molar) ratios of C , N , P in open ocean waters. In order to relate 5042- reduction t o organic matter decomposition and the appearance of NHqS, FRP and ZDIC in the pore waters, we plotted the eoncen- trations of each of these solutes against the amount of ~042- that had been removed from solution (Figs. 18a and 180). Sulf t e removal ( ~ ~ 0 4 2 ' ) i s cal- S culated from the difference between observed SO4 ' concentration and that pre- dicted by ambient sa l in i t ies (C1') af ter correction for differential diffusion of the two seawater ions. The inset numbers represent months (i. - - e . , 92 i s December) and a sequence of same numbers represents increasing depth in each core, because NHq+, FRP, and ~ 0 ~ 2 - depletion increase with depth i n the sedi- ments. Minimum stoichiometric ratios can be obtained by inspecting the slopes of the lines a t the lower Y intercept for each solute. For example, the de- pletion of 6 mM ~042- a t bo th stations coincides with the appearance of a t least 0.5 and up t o 1.1 mM N H ~ + in the pore waters, for a rat io of a t least 5.4 and up t o 12 5042' per mol N H ~ * . Richard's (1965) model of organic matter oxidation by SO^^-:
defines a ratio of only 3 . 3 mol ~042- per mol N H ~ + . Therefore, relative t o NHqS accumulation, much more ~042- has been depleted (and presumably an equally higher amount of organi e carbon oxidized) t h a n indicated by Richard's model. I f ~042- reduction i s the only mechanism for organic matter decomposition i n these subsurface sediments, then the decomposed material may have had a C/N rat io closer t o the value typical of these sediments (ca. 10 to 15, Table 3+ and 7a) than the value of 6.7 defined by Richard's modx. A1 ternately, N H q may have been selectively removed from solution af ter release from organic matter. Removal mechanisms could include sorption onto cation pxchange s i t e s (Berner, 1977; Rosenfeld, 9979), uptake by bacteria for biomass production, or differential diffusion. However, we do not consider that a sorption term i s appropriate for these sediments because there was no net increase i n the amount of exchangeable N H ~ + with depth i n any of the June, 1981 cores from

l NDlAN 1': ISLAND
0.4- 7 7 7 0.4 -
0.3 - FRP
0.2
I B 0. I - t2
9 '5 7&,
0 ' I I I I I 0 I I I 1 II
I 2 4 6 8 1 0 0 2 4 6 8
ASO-;, MM A SO$ MM
Fig. 18. Re1 ationships between NH ' and FRP and net ~ 0 ~ ~ - depletion (ASO 2-) in the pore waters a t (af Sparrow Bay and ( b ) Indian Island in 4981. Numbers refer t o the month of sampling and depth in the sediment generally proceeds away from the origin.

either the NRE or ?RE. This indicates to us that the exchange sites are sat- urated before or immediately after deposition in the sediments. Actually, 1981 was a very dry year and salinities were therefore quite high. It is pos- si ble that some NH4+ was displaced from exchange sites by K+ in seawater which gradually irrigated the surface sediments; this would increase the pore water NH4+ concentration and result in even lower So42-/NH4+ ratios. The value for sulfate depletion would not change due to seawater intrusion since depletion is based on sulfate concentrations predicted by C1' levels.
Average annual diffusive flux data can be inspected to determine whether the high S O ~ ~ - / N H ~ + ratio was due to more rapid diffusion of N H ~ + from the 1 pore waters. Average diffusive fluxes were 8.3 and 4.3 mmol 5042- and 1.6 1 and 0.98 mmol NHq+ rn-2 d-l for Sparrow Bay and Indian Island, respectively 1
( ignoring 5042- enri chment temporarily) . The S/N f 1 ux ratios were therefore 5.2 and 4.4 at the two stations and are much closer to Richard's model value than the pore water stoichiometries indicate. If we now consider these stoichiometries in view of the sulfate enrichment data, with its presumed demand for N H ~ + (discussed below), it becomes extremely difficult to interpret decomposition ratios from pore water stoichiometries , regard1 ess of signifi- cant improvements in interpretation of them [Berner, 1980).
For FRP, the stoichiometric ratio with ~ 0 ~ 2 ' is lower than predicted by Richard's mo el. The slope at the lower Y intercept indicates a ratio of B about 40 SO4 '11 FRP, rather than the predicted value of 53/1. This , howe er , may be explained by either the effective "stripping" of FRP from ~ e 3 + by S3- diffusing and FRP accumulation at the sediment/water interface or by mineral formation. Further, the plots of FRP are distinctly nonlinear or parabolic; concentrations peak near the 5 to 10 cm level and decrease with depth (see also Fig. 12b). Net removal below 10 cm may have therefore occurred - via authigenic mineral formation. Alternately, this 10 to 20 cm minimum may only be a minor curve inflection in a generally increasing gradient to deeper sedi- ments (Berner, 1980).
The 1982 Sparrow Bay and Indian Island (PRE Stas. D and G , respectively) pore water data are given in relation to CDIC accumulations in Fig. 19 and regression equations (omitting deeper FRP data) are in Table 17. The regres- sion data (Table 17) for NH4+ and FRP on ~ 0 ~ 2 - depletion (ASO~~-) for both sites show that the latter ss associated with about 76% of the variance ( ~ 2 ) in pore water NH4+ and about 30% sf that in FRP. Because 92 depletion in the bottom waters only "explains" 40% of the NH4+ and FRP accumulations therein (Table Il), it appears that ~042- reduction must also be involved in control- ling the nutrient regimes in these waters. Also, the lower FRP concentration maxima at Indian Island (Figs. 18 and 19) relative to ~ ~ 0 4 2 - and zDIC indicate some salinity effect, such as a decrease in the saturation concentration of apatite (see be1 ow).
At Sparrow Bay, cD%C is only associated with 25, 44, and 60% of the variance in FRP, SO^^^, and NH4+, respectively. At Indian Island, EDIC is much more strongly associated with these variables. These differences between stations are more evident in Fig. 19. EDIC appears to accumulate linearly I

1-07 STA. D. SPARROW BAY 1
STA. G. INDIAN ISLAND
Fig. 19. Pamlico River Estuary por water re la t ionships i n 1982. N H ~ , FRP, I and .Soq2- depletion (B04 -) vs. zDIC, all i n mM.

Table 1 7 . 1982 Pamlico River Estuary pore water chemistry: Linear regress ion equat ions between paired pore water cons t i t uen t s . a
Sparrow Bay Indian I s l and
DIC = o . % A s o ~ ~ - + 3.26 ( R ~ = 0.44) DIC = 1 . ~ ~ A s o ~ ~ - + 1.91 ( R 2 = 0.71)
DIC = 1 2 . 2 ~ ~ 4 + + 1.3 ( R 2 = 0.60) DIC- 14.7NH4++ 0.013 ( R ~ = 0.78)
DIC = 9.6FRP + 3.38 (R2 = 0.25)* DIC = 32FRP + 1.02 ( ~ 2 = 0.61)*
D I C = 0 . 3 8 D e p t h + 2 . 9 6 ( R 2 = 0 . 4 9 ) D I C = 0 . 3 4 D e p t h + 2 . 1 3 ( R 2 = 0 . 7 0 ) I
FRP = 0.33NH4* + 0.064 (R2 = 0.27)* FRP = 0 . 2 6 ~ ~ : + 0.023 (R2 = 0.61)*
FRP = 0 . 0 4 4 ~ ~ 0 ~ 2 - + 0.1 (R' = 0.29)* FRP = 0 . 0 2 4 ~ ~ 0 ~ 2 - + 0.05 (R2 = 0.31)*
a ~ l l concent ra t ions a r e mEl and Depth i s i n on measured p o s i t i v e l y from t h e sediment/water i n t e r f ace . " Indica tes t h a t N = 25 i n s t e a d o f 30 ( i . e . on ly t h e t o p 10 cm data were used ins t ead of inc luding the 20 cm da ta poinT), A1 1 s i g n i f i c a n t a t P = 0.05 o r b e t t e r . Data a r e from Figs. 19a, 19b, and 19c.
Table 18. Flux and production of DIC, N H ~ ' and FRP i n t h r e e cores from Indian I s l a n d , August, 9982,
Predic ted Diffusional F1 ux
Observed Flux i n Supernatants (B) 62 4.6 1.70
Predi c t ed Production from 3 5 ~ 0 4 2- (c) 9.6 1.1 0.15
3 5 ~ 0 4 2 - / ~ i ff usion ( C I A , %) 3 5 ~ ~ 4 2-/observed (C/B, %) Di f f u s i ~n/Observed (A/B , %)
Average summer phytoplankton uptake (Assuming C/N/P = $O/lO/l )a
- - - -- - - - -- - --
% ~ t a k e da ta from Kuenzler -- et a1 . (1979), average f o r warm months.

with ~ ~ 0 4 ~ - a t Indian Island while upriver a t Sparrow Bay, rDlC accumulates independently of ~ ~ 0 ~ 2 - within the top few cm. I n i t i a l l y , we could invoke 02 or N03-/N02' reduction as the cause of cDIC accumulation i n the Sparrow Bay sediments, especial ly during the turbulent r i n t e r months. Sparrow Bay a l so has higher concentrations of pore water NHq avai lable f o r n i t r i f i c a t i o n as we1 1 as higher NO3' values (from freshwater runoff) during winter. The cor- responding plot f o r Indian Island shows a ra ther l i nea r increase i n zDIC w i t h respect t o A S O ~ ~ - , and the regression equation contains a stronger R2 term (10.71 vs. +0.44 f o r Sparrow Bay). Thus, the data (Fig. 19) indicate t ha t ~ 0 4 2 - r x u c t i o n , as indicated by ne t , observed depletion, i s not responsible fo r the accumulations of N H + and FRP in the top 6 cm a t Sparrow Bay. Our 1981 ~ 0 4 2 - enrichment data ?discussed below) indicate t h a t 5 0 ~ 2 - i t s e l f i s rapidly recycled and could therefore take par t in both organic matter pro- duction (chemosynthesis) and oxidation.
With respect t o FRP, the pore water accumulations of ZDIC are n o t l i nea r , and curvi l inear regressions would probably describe the re la t ionship more ac- curately. In contras t with the ~ ~ 0 ~ 2 - p lo t , zDIC accumulates rapidly and l i n - ear ly with FRP up t o an asymptote of about 0.25 mM a t Sparrow Bay, and 0.15 mM a t Indian Island. The behavior of these i s d i f f i c u l t t o explain without i n - voking authigenic mineral formation a t depth in the sediments. Although sedimentary and pore water P dec ease downriver (Table 3; Figs. 4b, if, and 12b), the s a l i n i t y , and hence Gas+ concentrations, increase. The Ca i n - crease may r e su l t in a decrease i n a p a t i t e sa turat ion values downriver and therefore favor mineral formation. The asymptote values f o r pore water FRP cannot be explained by the a v a i l a b i l i t y of HC1-extractable Fe, because t h i s f ract ion does n o t change downriver but remains w i t h i n the 800 t o 1100 pmol . Fe g dry sediment-1 range (data not shown). This implies t h a t the concen- t r a t i on maximum f o r pore water FRP i s controlled by f ac to r s other than the Fe regime. =so42-, NHqi, and.zDIC increase more l i nea r ly than FRP w i t h depth indicates t h a t geochemical ( e . ~ . , a p a t i t e formation) ra ther than biochemical processes are more s ignif i caz t i n regulating the equilibrium pore water FRP concentrations a t depths between 6 and 20 cm.
N H ~ + and zDIC covary more strongly (R2 = +0.60 and +0.78 a t the two s i t e s ) than any other paired pore water :onstituents except N H ~ + and ~ ~ 0 4 ~ - a t Sparrow Bay (Table 17) . The zDIC/NH4 r a t i o of the 1982 pore waters (about 12 t o 15) i s ( 1 ) subs tan t ia l ly h ighe r than the C/N r a t i o of 1976-1977 phytoplankton (Kuenzler e t a1. , 1979) , (2) somewhat lower than t h a t of the bu1 k sediment in 1981 a tSpGrow Bay (C/N = 15) , and (3) much higher than t h a t a t Indian Island (C/N = 9.7) (see Tables 3 and 17). Thus, the pore water con- centrat ion r a t i o s exh ib i t downriver trends which a re opposite those of the bulk sediment. The lower cDIC/NH r a t i o i n the Sparrow Bay pore waters i s due t o a r e l a t i ve enrichment of N f q+ a t t h i s s t a t i on because the cDIC concen- t r a t i ons a t Sparrow Bay and Indian Island a re s imilar . Also, these pore water data were collected during the normal 1982 hydrologic year but the sedimentary C/N data were collected during a higher s a l i n i t y regime of the extremely dry previous year.

There i s n o t an obvious seasonality t o the rat ios between pore water solutes (Figs. 20a, 20b, and 20c). Although the coefficient of determination ( ~ 2 , Fig. 20a) associated w i t h A S O ~ ~ ' and N H ~ ' or FRP i s high and s ignif icant during most of the period, the slopes of the individual monthly regression l ines change rather unpredictably (Figs. 20b and 20c). These slopes vary a l - most 3 and 10 fold a t Sparrow Bay and 3 and 4 fold a t Indian Island fo r N H ~ ' and FRP, respectively. Further, there does n o t appear t o be any d i s t inc t seasonality t o the slopes t h a t coincides with bottom water anoxia in summer, turbulent mixing i n winter, or srganic matter inputs. However, i f we include the pessi bil i ty of 5 0 ~ 2 - recycl i n g within the sediment (discussed 1 a t e r ) , then the slopes of these 1 ines cannot be used t o describe the stoichiometry of phytoplankton decomposition. Also, the pore water cDIC/NH4+/FRP ra t ios are lower than the calculated flux ra t ios . For example, in 1982, average pore water cDIC/NHqS/FRP rat ios a t Sparrow Bay and Indian Island were 37/3/1 and 57/4/1, respectively, while the corresponding average diffusive f lux ra t ios were 98/11/1 and 60/8.5/1. The l a t t e r re f lec t the different D,$ values of the individual ions as well as processes tha t determine individual concen- t ra t ion gradients such as recycling within the sediment microbial community, precipitation oxidation, and/or sorption a t the redox discontinuity layer, and different ial release of constituents from organ? c matter during decompo- s i t i on .
In conclusion, f i r s t order inspection of pore water stoichiometric and flux data indicate tha t ~ 0 4 2 - reduction in the top 10-20 cm of sediment can be associated with more than half of organic matter decomposition i n the sed- iments. Also, because of the following, organic matter input to the sediments i s presumably much lower than primary production i n the water column,
1) The in s i t u water column respiration data (ca. 33 mol 02 m-2 yr-1) of ~ Z i m a l . (1978) indicate t h a t a l l production measured by them 6=.7l-i601 OC m-2 yr-1) and allochthonous Tar River OC (1 1 mol OC m- yr' ) could be decomposed in the water column, i f we assume a respiratory quotient of 9 . 0 ( i . e. , CH20 + 02 -+ C02 + $20).
2) The in v i t ro water ealmn pro&ctisn data s f Kuenzler e t a1 . (9999) (42 E l m m - 2 yr-9, the same as tha t observed i n 1977Tn'h1978 by Fisher e t a l . (1982a) near our Sta. 6 in the N R E ) , indicate tha t a t leas t 9 - 6 0 i - o ~ m-2 yr-1 are available for sedimentation. T h i s f igure i s the difference between the higher estimate of water column produc- t ion (42 mol) and the estimate of water column respiration (33 mol) given i n item ( I ) , above. These calculations do n o t include potential import from or export t o Pamlico Sound and peri heral marshes, so tha t t h i s sedimentation estimate of 9 mol OC m-2 yr-7 i s rather tenuous.
3) Flux of nutrients to the surface waters i s much less than tha t annual- ly required by the phytoplankton so t h a t recycling within the water column i s significant.
Therefwe, the sediments are a s ignif icant , but n o t a major d i rec t source of nutr ients . Direct estimates of f l u x and decomposition, as well as evi- dence fo r internal sedimentary recycling discussed in the following sections show tha t maximum nutr ient regeneration rates approach 50% of average summer

F i g . 20. 1981 and 1982 pore water l i n e a r regress ion da ta f o r Sparrow Bay ( S t a . D) and Indian Is land ( S t a . G) in t h e Pam1 i c o River
I? Estuary. N = 6 f o r each poin t , s i g n i f i c a n t a t P= 0.05. NS = not s i g n i f i - cant .
( a ) Monthly va r i a t ion i n t he c o e f f i c i e n t o f determin- a t ion ( ~ 2 ) .
X 1 As%2 NH: 1 PORE WATER ,/ \
0 Aso;2 FRP PROFILES
t
PROFILES
W
( b ) Monthly v a r i a t i o n i n t h e s lope of t h e regress ion l i n e a t Sparrow Bay.
( c ) Monthly v a r i a t i o n i n t h e s lope of t h e regress ion l i n e a t Indian Is land.

photosynthes i s ( c a . 140 mmol C m-2 d - 1 ; 12-h d a y l i g h t ; Kuenzler e t a l . , 1979) . -- F u r t h e r , i t wil l T e shown t h a t chemosynthetic OC production wi th in t h e sedi- ments may augment t h a t i n t h e water column and enhance the p r o d u c t i v i t y of meio- and macrofaunal biomass i n t h e s e e s t u a r i e s .
Est imates of Benthic Metabolism and Nu t r i en t Regeneration
The k i n e t i c 02, 50q2-, and ZDIC da t a t h a t we obta ined can be used t o e s t i m a t e r a t e s of o rganic m a t t e r decomposition and subsequent product ion of NHq* and FRP in these sediments . In c o n t r a s t t o t h e decomposition e s t i m a t e s based on pore water g r a d i e n t s and d i f f u s i v e s o l u t e f l u x d i scussed above, t h e fo l lowing d a t a and c a l c u l a t i o n s a r e based on d i r e c t measurements of 02 and ~ 0 4 2 - reduc t ion a s well a s on accumulations o f N H ~ + , FRP, and PDIC i n super- n a t a n t s o f i n t a c t co re s incubated a t i n situ tempera tures i n t h e dark. --
Before presen t ing t h e c a l c u l a t i o n s on o rgan ic m a t t e r decomposi t ion, we must e s t a b l ish ( 1 ) t h e composition of t h e sediments undergoing decomposi t i o n , and ( 2 ) t h e amount of o rggnie m a t t e r decomposed (and thus NHq+ and FRP regen- e r a t e d ) during 02 and SOqL- reduc t ion . For o rgan ic m a t t e r composi t ion, we used t h e 1981 C/N/P r a t i o s of t h e s u r f a c e sediments ( s e c t i o n A , F ig . 6 ) ; i . e . t h e same months t h a t our 1982 02 and ~ 0 4 2 ' reduc t ion measurements were - - performed. I t i s recognized t h a t s u r f a c e sediments con ta in a mix ture of ses- ton ( i nc lud ing phytoplankton) depos i ted on t h e s u r f a c e and 01 d e r m a t e r i a l from below which was reworked i n t o t h e s u r f a c e by infauna. The C/N/P r a t i o s of sediments f a l l wi th in t h e phytoplankton range of 21/3.5/1 (up take) and 11 3 / l 6 / l (average s e s t o n ) c a l c u l a t e d from Kuenzler e t a1 . (1 979). Seasonal changes i n s u r f a c e sediment C/N/P composition ( ~ i g s 5 a n d 6 ) occur p a r t l y a s a r e s u l t of varying se s ton cornpesition , depos i t i on , and a c t i v i t y o f decom- posers . For t h e he t e ro t roph ic 02 and ~ 0 4 2 - reduc t ion equa t lons , i t i s gen- e r a l l y assumed t h a t 1 and 2 mo1 of OC, r e s p e c t i v e l y , ( a t t h e ox ida t ion s t a t e o f CH20) a r e ox id ized , For example, given a sediment r a t i o of 110/15/1 and a reduc t ion r a t e o f 10 mmol 02 o r 5 mmol ~ 0 4 2 - m-2 d-l , a r egene ra t i on rate of 7 1 , 1 .5 , and 0.1 mmol cDIC, NHq*, and FRP m-2 d-1 can be calcuf a t e d .
In August, 1982 we measured 355042- r educ t ion , and t h e appearance r a t e s o f cDIC, N H ~ + , and FRP i n t h e s u p e r n a t a n t s , a s we11 a s t h e concen t r a t i ons of these s o l u t e s i n t h e pore waters f o r p r e d i c t i o n o f d i f f u s i o n a l f l u x (Tab le 18) . Total SO$- reduc t ion i n , and c a l c u l a t e d d i f f u s i o n a l f l u x t o , t h e t o p 1 cm a t Indian I s l and were both 4.8 mmol ~ 0 a 2 - m-2 d-1. I f we use an OC/ SO$- r a t i o of 2 (Richards , 1965; i n s p i t e of o u r pore water ~ D I C / A S O ~ ~ ' . r a t i o s of ca. 1 ; Table 17) and ou r August, 1981 sedimentary C/N/P r a t i o (77/8.5/1) , we c a n p r e d i c t t h e product ion of 9.6, 1 .2 , and 0.15 mmol zDIC, NHq+, and FRP m-2 d-1 , r e s p e c t i v e l y . However, i n t h e two p a r a l l e l co re s we incubated , t o t a l n e t observed f l u x t o t h e supe rna t an t s averaged 62, 4.6, and 1 . 7 mmol cDIC, N H ~ + , and FRP m-2 d-1. Also, t h e concen t r a t i on g r a d i e n t s i n t h e pore waters of t h e co re used f o r 5 0 ~ 2 - reduc t ion allowed f o r p r ed i c t ed d i f f u s i o n a l f l u x e s of 4.8, 13, 1 .7 , and 0.26 mmol SO$-, rDIC, N H ~ ' , and FRP m-2 d-1. Thus, d i r e c t measurement o f 5 0 ~ 2 - reduc t ion gave t h e lowest e s t i m a t e o f f l u x , f o l - lowed by p red i c t ed d i f f u s i ~ n and then by observed f l u x . From t h i s experiment

we conclude t h a t :
1 ) oxidants o t h e r than ~ 0 ~ 2 ' were important i n o rgan ic m a t t e r decompo- s i t i o n in t h e incuba ted , i n t a c t cores used f o r f l u x measurement,
2 ) r e l a t i v e t o observed f l u x o r measured 3 5 ~ 0 4 2 - reduc t ion r a t e s , d i f - f u s i v e f l u x e s t ima te s were low by a f a c t o r of 2.7 t o 6 .7 ,
3 ) a t average summer photosynthe t ic r a t e s ( ca . 140 mmol OC m" observed f l u x of ZDIC from t h e s e d i m e n t s 7 6 2 m o l m-2 d-1) car! pro- vide about ha1 f of phytoplankton DIC requirements .
We a l s o measured t h e chemical (COD) and biochemical (BOD) 02 demand of 2 cm s e c t i o n s in t h e t o p 10 cm sediments a t 0 and 20°C with and without 10 mM NaN3 in mud s l u r r i e s f o r 2 d (0°C) and 3 h (20°C). Subsamples of sediments a r e a r t i f i c i a l l y exposed t o excess 02 so t h a t t h e d a t a must be i n t e r p r e t e d a s maximum p o t e n t i a l r a t e s of 02 reduc t ion during biochemical ( r e s p i r a t o r y ) and chemi ca l r e a c t i o n s ( e - .a. , S oxi d a t i on ) .
The COD da t a a r e summarized in Table 19 along w i t h t h e o t h e r metabol ic e s t ima te s d i scussed above. Apparent ly , t h e s e sediments con ta in a s i g n i f i c a n t amount of COD, e s p e c i a l l y during winter. The COD f o r 10 cm of sediment a t 0°C a t Sparrow Bay (1070 mmol 02 m-2 d-1) was about equal t o t h a t a t 20°C a t Indian I s l and (970 m o l 02 rn-2 d-1). These f i g u r e s r e p r e s e n t 02 reduc t ion during r e s p i r a t i o n p lus t h e p o t e n t i a l energy i n reduced compounds ( a s 02 equ iva l en t s ) s t o r e d i n t h e sediments which can serve as o rgan ic and ino rgan ic s u b s t r a t e s o f e l e c t r o n t r a n s p o r t f o r a e r o b i c h e t e r o t r o p h i c and a u t o t r o p h i c organisms, r e s p e c t i v e l y . For example, e s t i m a t e s of ~ 2 ' concen t r a t i ons (252- = HzS, HS-, FeS, and p o l y s u l f i d e s ) were obta ined w i h c o l o r i m e t r i c methods (Matson, 1982) and were a s high a s 15 pmol ~ 2 - - dry sediment o r about 300 mmol m-2 t o 10 cm (600 m o l 02 equ iva l en t s m-8 t o 10 cm). In com- par ison with t h e o t h e r metabol ic e s t i m a t e s , t h e 02 d a t a a r e q u i t e high. This i n d i c a t e s t h a t only a small f r a c t i o n of t h e energy p o t e n t i a l l y a v a i l a b l e is a c t u a l l y r e l ea sed . For example, t h e 3 5 ~ 0 4 2 - reduc t ion da t a (expressed a s 02 equ iva l en t s ; 2 0&-) f o r 25°C a t Indian I s l and were about 6% of t h e 02 re- duct ion da ta f o r 20°C. S i m i l a r l y , t h e h ighes t observed n e t r a t e of cDIC f l u x (1 02/DIC) was a l s o about 6% of t h e 02 r a t e s .
Regeneration of NHqS and FRP from sediment o rgan ic m a t t e r (assumed t o c o n s i s t of 94/9.8/1 mol TOC, T M , and TP from Table 6 ; t h e average f o r PRE) was c a l c u l a t e d from seve ra l sets of da t a (Table 19 ) . The 02 da t a obviously r e f l e c t a s i g n i f i c a n t amount of COD, s o t h a t t h e regenera t ion e s t i m a t e s a r e u n r e a l i s t i c a l l y high. For t h e ~ 0 4 2 - and cDIC d a t a , however, c a l c u l a t e d NH~' r egene ra t i on ranged from 0.79 t o 12 mmol m-2 d-1 (X = 3.8 mmol ) , whi 1 e FRP ranged from 0.079 t o 1 .3 mmol m-2 d-1 (X = 0.40 mmol ) . The average dai 1y d i f f u s i o n a l f l u x e s a t Sparrow Bay and Indian I s l a n d ( r e c a l c u l a t e d from Table 16) f o r NHq+ and FRP were 1.6 and 0.19, and 0.98 and 0.076 mmol m-2 d-1 a t t h e two s t a t i o n s . Thus, t h e average f l u x e s p red i c t ed from 3550~2- reduc t ion and cDIC product ion d a t a were 3.9 t o 5 .3 times g r e a t e r than average d a i l y d i f f u s i o n , which f u r t h e r suppor t s our e a r l i e r argument t h a t advec t ion and b io tu rba t ion inc rease f l u x of pore water s o l u t e s by seve ra l f o l d . As e a r l i e r , t h e s e e s t ima te s desc r ibe a s imple b i d i r e c t i o n a l coupling of o rgan ic m a t t e r

Table 19. Resp i r a t i on , f l u x e s , decomposition, and n u t r i e n t r egene ra t i on i n t h e Pam1 i co River Estuary . a
u n i t s equ?val e n t s O2 reduc t ion i n t o p 10 cm
O0 C ; 2 cm s e c t i o n COD Sparrow Bay ( N = 5) 1070235% Indian I s l a n d " 370250%
20%; 2 cm s e c t i o n COD Indian I s l a n d ( N = 5) 980236%
5 0 ~ ~ - reduc t ion
Top 1 cm:diffusive f l u x ac ros s s u r f a c e (F ig . 17)
Sparrow Bay 8.3212 Indian I s l a n d 4.3z2.8
Top 10 cm: pore water samplers , N = 6 12 - 160 C 48-68 3 ~ 5 0 ~ 2 - a t Indian I s l a n d :
250 C 27 5O C 6 , 4
P red i c t ed N P
DIC f l u x ~ o p l cm:diffusjve f l u x ac ros s s u r f a c e (Fig. 17)
Sparrow Bay 1 8S20 18220 1.9 0.19 Indian I s l a n d 7.4f3.6 7.423.6 0.79 0.079
(range = 3.6 t o 57)
observed f l u x (Table 18) Indian I s l a n d , 2 5 O C 62 62
Each i tern is l i s t e d i n s p e c i f i c units and i n 0 o r OC (=CH20) e q u i v a l e n t s assuming t h a t 1 mol 02 = DIC = OC; 2 mol OC = f mol 50~2 ' . P r e d i c t e d N and P r egene ra t i on from an average s u b s t r a t e C/N/P r a t i o of 94/9.8/1 om a b l e
P 55 5- 6. 0 d a t a a r e t o t a l chemical p lus biochemical reduc t ion . 6 cm SO4
reduc ion d a t a ex t r apo la t ed t o 10 cm t o t a l by manual curve f i t t i n g .

to the sediments and inorganic matter back t o the water column, without any consideration of in ternal sedimentary recycling. Later we question the simplici ty of t h i s model.
Several of our data s e t s can val idate Hargrave's (1973) model of i n - creasing water column recycling a t the expense of benthic metabolism. De- creases downriver, over an increasing depth gradient from 3.2 t o 7.3 m , have been observed for :
1 ) TOC, TP, and EP i n the sediments (Fig. 4c ) , and the C/N r a t i o (Fig. 9 ; Tables 3 and 4 ) ,
2) the r e l a t i ve importance of t e r r e s t r i a l carbon (Figs. 7a, b, 8, 10a) , 3) t o t a l annual diffusional f l ux of nutr ients (Fig. 166; Table 16 ) , and 4) uptake of FRP by phytoplankton (Table 16) .
A1 so, there are d i s t i n c t downriver increases in :
1 ) the C/P and N/P r a t i o of the sediments (Fig. 4d; Tables 3 and 4 ) , 2) the r e l a t i ve importance of phytoplankton carbon (Fig. 9 ) , and 3) uptake of NHqS by phytoplankton (Tab1 e 16).
These trends indicate t h a t metabolism may indeed decrease downriver in agree- ment with the -- in situ primary productivity data of Davis e t a l . (1978), a l - though the i n v i t r o data of Kuenzler e t a l . (1979) show a eneral , but i n - 11 s ign i f i cantTdownr 'ver decrease. In t he l a t t e r s tud , D I ~ C f ixa t ion averaged 6.0 pg-at t l-1 h a t our Sta. C and 2 . 5 pg-at C-1-T h-1 near our Sta . H , but the large variances resul ted i n no s i gn i f i c an t differences. Extrapolated over a 2 m water column and an average annual 12 h photosynthetic day, these ra tes amount t o 53 and 22 mol OC m-2 yr-1.
The inverse downriver re la t ionship between the decreasing sediment f lux and increasing uptake of NHq+ by phytoplankton (Table 16) i s especia l ly pro- vocative, s ince others have concluded t h a t PRE a1 ae can be N 1 imited (Harrison and Hobbie, 1974; Kuenzler e t a1 . , 19797. That NHq+ f lux from sedi- ments decreases w i t h increased uptake7n-e water column indicates an i n - crease i n recycling downriver, possibly under the influence of abundant meso- haline zooplankton. Conversely, f l ux and uptake of FRP both decrease down- r i ve r , but t h i s may be due t o a decrease i n luxury consumption of P. I t is therefore d i f f i c u l t t o separate the e f fec t s of increasing water depth (more recycling in t he water column) from those of increasing distances from nu- t r i en t - r i ch f resh and low s a l i n i t y waters.
In conclusion, sediment metabolism i s high b u t i s lower downriver of Sparrow Bay a t Indian Island. Metabolic r a t e s range between 3.6 and 136 mmol 02 o r OC equivalents m-2 d-1 (assuming OC a t xidation s t a t e 0 (CH20) and ex- B cluding COD data, Table 19) . Together, 3 5 5 0 ~ - reduction (33 mmol CH2O equivalents m-2 d-1, the average of 5°C and 25°C data from Indian Is land, Table 19) and the average 0°C 02 reduction from the top 1 cm a t Sparrow Bay and Indian Island (72 mmol CH20 equivalents m-2 d-1, assuming a l l is bio- chemical i n the top 1 cm) a re equal t o 105 mnol CH20 equivalents m-2 d'l

(38 mol m-2 y r -1 ) o r about twice o r a l l of t h e s u r f a c e water primary product ion measured by Davis e t a l . (1978) and Kuenzler -- e t a1 . (1979) , r e s p e c t i v e l y . Th i s assumes t h a t a l l ~:sedimentary metabol ism i s h e t e r o t r o p h i c and t h a t CH20 i s t h e on ly e l e c t r o n donor f o r r e s p i r a t i o n . However, t h e fo l lowing d i scus s ion of s u l f a t e , carbon, and n u t r i e n t r ecyc l ing wi th in t h e sediments may make our test of Margrave's model incomplete and s u b s t a n t i a l l y diminish i t s val i d i t y .
S u l f a t e Cycling in t h e Neuse and Pamlico River E s t u a r i e s
The h ighes t c a l c u l a t e d r a t e of d i f f u s i o n a l ~ 0 ~ 2 - f l u x a c r o s s t h e s u r f a c e of t h e PRE sediments was 45 mrn 1 m-2 d'l (F ig . 77, Sparrow Bay, September, 1981) . The reduc t ion r a t e of 85S042- a 25 nd 5'C in t h e t op 6 cm of Indian I s l a n d sediment was 18 and 4 .3 mmol SO4 $- d-7 ( J e K. Heath, ECU Biology Dept. , Table l g ) , which we e x t r a p o l a t e d t o 27 and 6.4 m o l over 10 an. Pore water samplers (F ig , 32) i n s t a l l e d nea r S t a s . C, E , and G between March and J u l y , 1981 in t h e PRE ind i ca t ed r a t e s between 48 and 68 m o l 5042- m-2 d-1 ( t h e s e da t a w i l l be d i scussed i n d e t a i l e l sewhere) . If we assume an 0C/So42- r a t i o of 2 (Richards , 19651, then r e s p i r a t o r y SO$- reduc t ion could account f o r t h e ox ida t ion of 54 t o 136 rnrnol OC m-2 d-1 i n t h e t o p 10 cm ( o r about a1 1 of primary product ion) . Elsewhere, r a t e s of 3 5 ~ 2 - product ion can account f o r a t least 75% of o rgan ic ma t t e r ox ida t ion i n a Danish e s t u a r y ( Jorgensen , 1977a) , a Massachusetts s a l t marsh (Howarth and T e a l , 1979) , and a landlocked Norwegian f j o r d (Indrebfi - et - a1 9 1979) .
Respi ra tory ~ 0 ~ 2 ' reduc t ion t h e r e f o r e appears t o be a major decomposition mechanism a s well a s being t h e predominant source o f reduced s u l f u r i n de- p o s i t i o n a l a r e a s of t h e coas t a l zone (Berner, 1980). Ac tua l ly , t h e t o t a l mass and energy contained i n reduced ino rgan ic m a t e r i a l s of anoxic sediments r i v a l s t h a t of o rganic m a t t e r (Sturn and Morgan, l98d 1. P y r i t e (FeS2) and monosulfides of i r on and o t h e r meta l s (MeS) approach molar concen t r a t i ons in some n e r i t i c sediments ( e .3 . , A l l e r , 1980a). The more l a b i l e reduced f o m s of S , e i t h e r s o l u b l e ( e . g . , H S, HS-, p o l y s u l f i d e s , and v o l a t i l e o r g a n i c S) o r p a r t i c u l a t e ( e . ~ . , ??3, FeS 7 , can o f t e n be ox id ized chemical ly wi th 02 which d i f f u s e s o r i s oyherwise t r a n s p o r t e d t o reduced sediments . ( In PRE sed iments , movement of 52- i n t o bottom waters is l a r g e l y prevented by t h e excess Fe3+ i n t h e s u r f a c e sediments. ) The most f r e q u e n t l y observed chemical ox ida t ion products a r e So and ~ 2 , 4 + (Chen and Morris , 1972; Almgren and Hagstrom, 1974) , while biochemical ox ida t ion is assumed t o be r e q u i r d f o r 56' ( ~ 0 ~ 2 . 1 pro- f! duc t ion . Together ae rob ic ox ida t ion of Fez+ and S ' t o ~ e 3 + and ~6 re- l e a s e s 188 K j mol-f, o r about 1.50 times t h e energy r e l e a s e d dur ing t h e aero- b i c ox ida t ion of o rganic ma t t e r (CH20) ( S t u m and Morgan, 1981) .
Completion of t h e S cyc l e r e q u i r e s t h e var ious a c t i v i t i e s o f he te ro- t r o p h i c , mixotrophic , and a u t o t r o p h i c microorganisms (Go1 dhaber and Kaplan, 1974) . The c h a r a c t e r i s t i c s of a few of them have been desc r ibed (T i t t on e t a l . , 1967a,b; Adair and Gundersen, 1969a,b; T u t t l e and Jannasch, 1972, n 7 x Jorgensen, lW7b) . Members of t h e genera Be i a t o a and T h i o t h r i x i n - h a b i t p l aces where SZ-, So, and 02 o r N03- c o e x i s t , * s u c a s w i th in t h e RDL of s u r f a c e sediments . These organisms o x i d i z e reduced s u l f u r , d e p o s i t s u l f u r
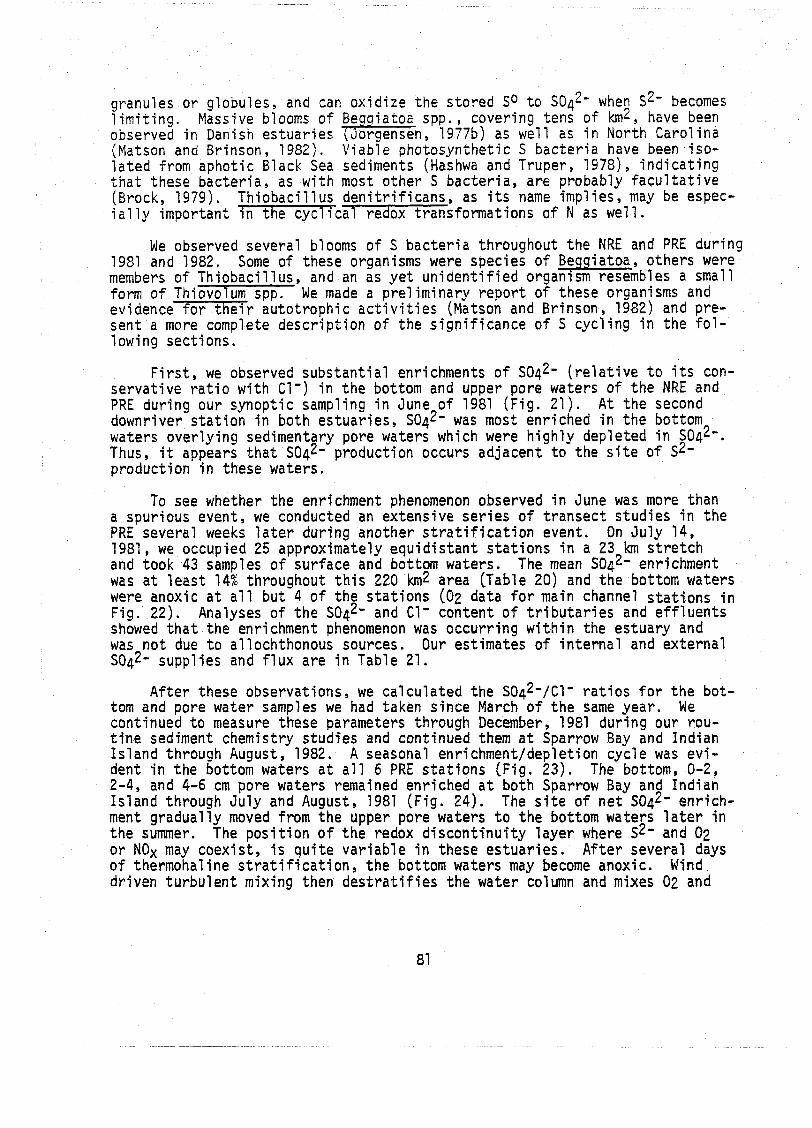
granules or globules, and can oxidize the stored 50 t o 5 0 ~ 2 - when s2' becomes limiting. Massive blooms of Be iatoa spp., covering tens of lan2, have been observed in Danish estuaries ?- Jorgensen, 19776) as we11 as in North Carolina (Matson and Brinson, 1982). Viable photosynthetic S bacteria have been iso- lated from aphotic Black Sea sediments (Hashwa and Truper, 1978), indicating tha t these bacteria, as w i t h most other S bacteria, are probably facul tat ive (Brock, 1979). ~ h i o b a c i l lus denitrificans, as i t s name imp1 ie< may be espec- i a1 ly important in the cycl ical redox transformations of N as we7 1 .
We observed several blooms of S bacteria throughout the NRE and PRE during 1981 and 1982. Some of these organisms were species of Beggiatoa, others were members of Thiobacillus, and an as yet unidentified organism resembles a small form of Thiovolum spp. We made a preliminary report of these organisms and evidence for t h e i r autotrophic ac t iv i t i e s (Matson and Brinson, 1982) and pre- sent a more complete description of the significance of S cycling in the fo l - lowing sections.
F i r s t , we observed substantial enrichments of ~ 0 4 2 - ( re la t ive t o i t s con- servative r a t io with C1') in the bottom and upper pore waters of the NRE and PRE during our synoptic sampling in June of 1981 (Fig. 21). A t the second downriver station in both estuar ies , 5042- was most enriched i n the bottom waters overlying sedimentary pore waters which were highly depleted i n 5042-. T h u s , i t appears that 5042- production occurs adjacent t o the s i t e of 52- production in these waters.
To see whether the enrichment phenomenon observed in June was more than a spurious event, we conducted an extensive ser ies of transect studies i n the PRE several weeks l a t e r during another s t r a t i f i ca t ion event. On July 14, 1981, we occupied 25 approximately equidistant s ta t ions i n a 23 Ian stretch and took 43 samples of surface and bottom waters. The mean ~ 0 ~ 2 ' enrichment was a t leas t 14% throughout t h i s 220 km2 area (Table 20) and the bottom waters were anoxic a t a11 b u t 4 of the s tat ions (02 data f o r main channel s ta t ions i n Fig. 22). Analyses of the ~042' and Cl' content of t r ibutar ies and eff luents showed tha t the enrichment phenomenon was occurring w i t h i n the estuary and was not due t o allochthonous sources. Our estimates of internal and external 5042- supplies and flux are in Table 21.
After these observations, we calculated the S O ~ ~ - / C I ' ra t ios f o r the bot- tom and pore water samples we had taken since March of the same year. We continued to measure these parameters through December, 1981 during our rou- t ine sediment chemistry studies and continued them a t Sparrow Bay and Indian Island through A u g u s t , 1982. A seasonal enrichment/depletion cycle was evi- d e n t i n the bottom waters a t a l l 6 PRE s ta t ions (Fig. 2 3 ) . The bottom, 0-2, 2-4, and 4-6 cm pore waters remained enriched a t both Sparrow Bay and Indian Island through July and August, 1981 (Fig. 24). The s i t e of net 5042' enrich- ment gradually moved from the upper pore waters t o the bottom waters l a t e r in the summer. The position of the redox discontinuity layer where ~ 2 - and 02 or NOx may coexist, i s quite variable in these estuaries . After several days of thermohaline s t r a t i f i ca t ion , the bottom waters may become anoxic. Wind driven turbulent mixing then des t r a t i f i e s the water column and mixes 02 and
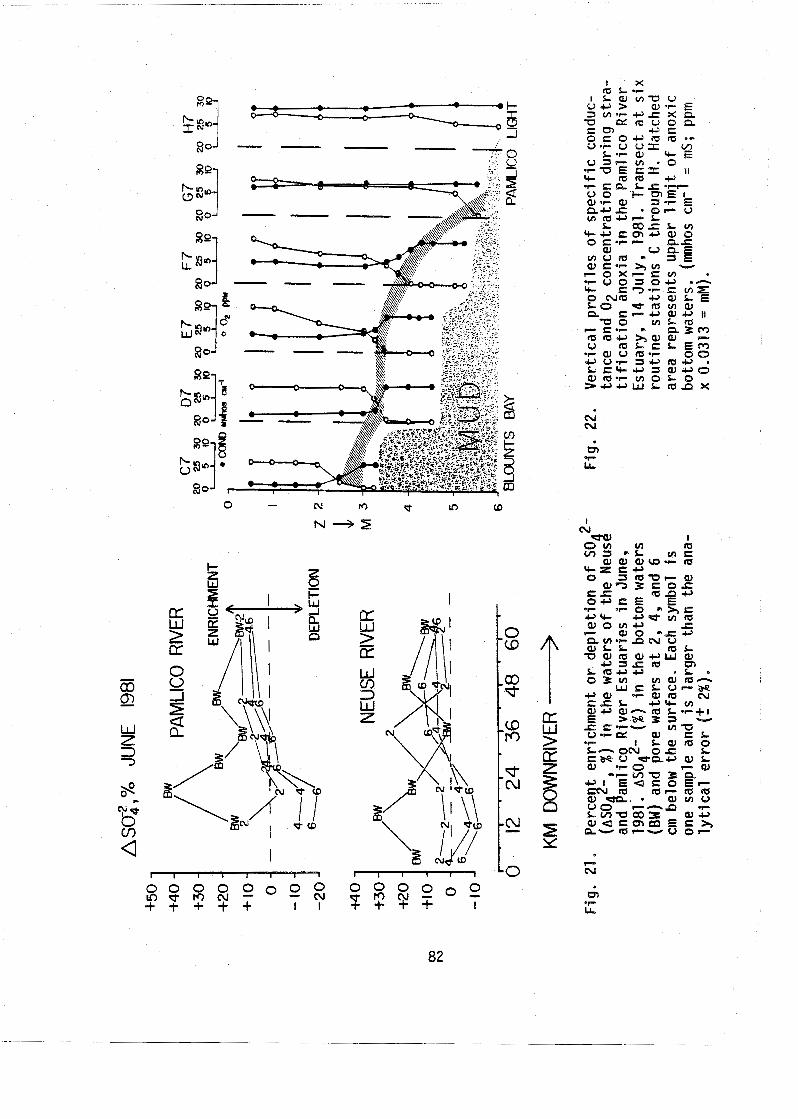

Table 20. Enrichments of ~ 0 ~ ~ ' i n t h e waters of t h e Paml i co River Estuary on 14 J u l y , 1981 during t r a n s e c t s of r i v e r s tudy s e c t i o n s D , E , F, and G.
Surface Waters Bottom Waters
Sec t ion A S O ~ ~ - % mM C1' A S O ~ ~ - % mM C1'
D 194-200 +I 6'3 ( 6 ) 206-282 E +18;414) +12,5 5) 188-21 2 +1&3(7) 294-304 F +16*5(5) 196-220 +I 6?3(6) 282-308 G + 2 l f 7 (4 ) 196-208 +18%(6) 261-312
a Surface (20 cm) and bottom water (5 t o 25 cm above bottom i n s a l t wedge) samples taken from t h e same s t a t i o n s . Number i n pa ren thes i s i s number of samples, which were only taken near bottom when depth was l e s s than 1 m. The range of C1' values i nd ica t e s t h e v a r i a b i l i t y i n s a l i n i t y wi th in each t r a n s e c t a r e a .
Tab'l e 21 . Measured f 1 uxes of ~ 0 ~ ~ - i n t h e Paml i c o River Estuary.
mmol SO4 2- ,-2 d-l
Diffusion i n t o sediments (Fig. 17), Texasgulf Chemic I s , Inc. e f f l u e n t Tar River runoff i? .Soq2- reduct ion i n top 10 cm of sediment:
i n s i tu pore water samplersC 48 - 68 =SF data ex t r apo la t ed from 6 crn (Tab1 e 19) 27
So4'- enrichment, March t o J u l y , 1981d 53
a 7 3 The e f f l u e n t conta ins c a . 0.8 mM 5 0 ~ ~ ' and t o t a l s 9 X 10 m yr-l. The product
of t hese da t a was d i v i z d by t h e a rea o f t h e e s t u a r y (Table 1 ) . b
9 3 The Tar River d ischarges 4 X 10 m yr'l (bu t s e e low runoff da t a i n Fig. 2) and conta ins s. 0.2 mM . 5 0 ~ ~ - .
C Net dep le t ion in samplers l e f t ca . 6 weeks a t S t a s . C , D , and E a f t e r co r r ec t ion f o r di f f e r e n t i a1 di ffusi vi t i e s and changes in ad j acen t sediment conten t .
d Enrichments c a l c u l a t e d from progress ive inc reases i n t h e S O ~ ~ - / C I ' r a t i o between March and June , 1981 ( s e e Figs. 23 and 24).

M A M J J A S O N D
Fig. 23. Percent change (enrichment or depletion) in sod2- concentrations in the bottom waters of the Pam1 ico River Estuary during 1981. Change i s relative t o the conservative ratio with C 1 - (1/19.47) and the symbol i s larger t h a n the analytical error. Letters refer t o routine study stations C through H .

'5 1 0 SPARROW BAY 0 INDIAN ISLAND
0 Z 0 - C
BOTTOM WATERS -1Ocm ABOVE MUD
- 0 z -2cm PORE WATERS 0 0
0 Y * 0
F i g . 24. Monthly v a r i a t i o n i n SO 2- e n r i c h m e n t or d e p l e t i o n i n t h e bo t tom and p o r e w a t e r s a t Spa r row 8ay ( and I n d i a n I s l a n d (0). As i n F i g , 23.
" 1 .= -5 n I - +5 z 0 m PORE WATERS F W
2 O W a b A
-5 + - C +5- z Y - 5 0 E Z - W
-6 cm PORE WATERS
L -5- E 1981 1982
~ M ~ A ~ M ~ J ~ J ~ A ~ S ~ O ~ N ~ D ~ J I F I M I A I M ~ J I d I A ~

what l i t t l e NOx i s available down into the upper several cm of sediment, especially a t the wider downriver stations. Simultaneous increases in ~042- reduction during summer, together with intermittent destratif i cati on, apparent- ly diminished the enrichment such that ~ 0 ~ 2 - ! ~ 7 - ratios in surface and bottom waters returned t o their normal value.
Differential fluxes of ~ 0 4 2 - and Cl- into or out of the sediments cannot account for the enrichments because their fluxes i n the PRE are s ta t i s t i ca l ly unrelated (data n o t shown). If the enrichment had been due to greater f1 ux of C1' (relative t o ~042-) into the sediment, then the bottom waters would be enriched by a factor proportional t o the b u l k sediment Dsb differences for the two ions a t a given chlorinity. No relationship between the fluxes of ~ 0 ~ 2 - and C1' has been identified.
We be1 ieve that the observed enrichments were less than the actual amount of 5042- produced. Because of simultaneous $042- reduction and general ly high- er sa l in i t ies of the bottom waters, the concentration gradient of 5 0 ~ 2 - within the upper pore waters (the presumed s i t e of both enrichment and reduction) would result in net flux of $042- down into the sediments, rather than up into the bottom waters. Therefore, in order for bottom water enrichment t o occur, ~ 0 4 ~ - enri ched pore waters woul d have t o be advectively transported upwards, presumably while oxidants of reduced S were transported down into the surface sediments. sZ- rarely appears in bottom waters due to precipitation with ~ e 2 + which i s in excess of ~ 2 - after reduction of ~ e 3 + a t the sediment surface.
The enrichments of ~ 0 ~ 2 - persisted through extensive periods of bottom water anoxia in the PRE (some of which are evident from other studies in Fig. 25) and we interpret th is as direct evidence for mediation by biochemical, rather than solely chemical reactions. 02 i s required for chemical production of ~ 0 4 2 - from ~ 2 - , b u t whether i t can occur under these ambient temperature and pressure regimes i s debatable (Chen and Morris, 1972). Biochemical 504~- prsducti on (chemol i thotrophy) can occur under anoxic conditions with NOx.
Qther evidence i s less equivocal. The enrichments during June i n the NRE and PRE were associated with low levels of FRP, even though most of the sam- ples were from anoxic waters. Under anoxia, FRP i s mobilized from FeP com- plexes in the surface sediments and would accumulate i n the anoxic pore and bottom waters (Table 9 1 ) . However, high concentrations of FRP accumulated where ~ 0 ~ 2 - was depleted and general ly n o t where it was enriched (Fig, 26a) . An ear l ier study of nutrient uptake in the water column by different s ize classes of microplankton revealed that about 14% of total annual FRP uptake was attributable to organisms smaller than 3 pm (Kuenzler -- e t a l e , 1979). However, these mi crosrganisms, presumably bacteria and mi crofl age1 1 ates, were responsible for 43 to 100% of FRP uptake i n the bottom waters, even though chlorophyll a concentrations were often as high as i n the surface waters. Autotrophic 5 ox-idation would have an FRP demand similar to that of phyto- plankton i f we assume a bacterial C/N/P rat io of 100/10 1. Total annual FRP 6 uptake by th i s smal let- fraction amounted t o 280 mol m' , which could represent bacterial production o f 28 mol OC m-2 yr-1. Similar evidence fo r N H ~ + de- pletions from the .So4*- enriched waters i s given in F i g . 266.


u E I s .

The 61% data presented ea r l i e r indicate tha t some of the 1 ighter fraction of the pore water DIC pool had been preferentially removed from solution. Either or both of two biochemical processes could explain t h i s observation. F i r s t , bacterial autotrophy discriminates against heavier DIC similar to that by eucaryotes, so that autotrophic CHq or 5042- production would cause enrich- ments of the heavier isotope i n the residual DIC pool. Alternately, hetero- trophic bacteria might preferentially respire the heavier C.mo1ecules i n or- ganic matter, and incorporate the l ighter C into biomass d u r i n g anabolism. This would also enrich the residual pool of DIC i n the heavier isotope, b u t not nearly as much as during autotrophic uptake of l igh ter DIC from pore waters. There i s , however, l i t t l e evidence fo r heterotrophic fractionation (Haines and Montague, 1979). '
U n t i l August of 1982, we had no d i rec t , unequivocal evidence fo r s igni f i - cant rates of bacterial autotrophy in these estuar ies , aside from Beggiatoa spp . blooms i n the NRE in 1981 and cyanobacterial blooms upriver a t the fresh- water/seawater interface. A t t ha t time, we and others observed a bloom of what i n i t i a l l y resembled Be iatoa spp. a t our Indian Island s tat ion. This -9LLb bloom appeared similar t o tha t o served i n the NRE d u r i n g September of the previous year. Several days a f t e r we returned one of our day-old cores t o our laboratories i n Greenville, a rich bloom (ca. 5 X 10⁶ l ive ce l l s cm-3) of several organisms developed in the darkenedTore supernatant. We increased the cDIC concentration t o -10 mM t o avoid DIC limitation, subsampled this bloom, and obtained dark ~ 1 1 % fixation rates which were as high as 790 nmol DIC cm-3 h-1. This ra te is 30 times higher than any previously obtained dur- i n g four years of phytoplankton productivity work reported f o r the PRE [Davis e t a l . , 1978; Kuenzler e t a l . , 1979). For r e a l i s t i c comparisons, we present -- these data in both volume a n d area units (Table 22), because the blooms are often restr ic ted t o a t h i n band of water or sediment where the electron donors and acceptors coexist. This r a t e i s based on ~ 1 1 % fixation i n DIC enriched core supernatants. If chemosynthesis i s limited -- i n s i t u by DIC f lux from or production i n the surface sediments, then our estimates are high. If ~ 0 4 2 - reduction actually does produce 2 mol DIC/mol 5 0 ~ 2 - reduced, then the data in Table 23 a1 low a calculated chemosynthesis ra te . This would equal theoretical DIC production from 5042- reduction (24 rnol DIC m-2 yr-1) minus observed tem- perature corrected DIC flux (11 rnol m-2 y r - l ) or ca. 13 mol OC rn-2 yr-l f o r chemosynthesi s . Even w i t h these res t r ic t ions , ch'6iiiosynthesis $an be a signi - f icant addition to the organic carbon ool of the PRE. If SO4 - enrichment observed d u r l n g the s p r i n g (53 mmol m-q d-1) i s coupled w i t h dark DIC fixation a t averages eff ic iencies of 25% (Hswarth and Teal, 1980), then t h i s new s urce P of autotrophic carbon amounts t o 27 mmol OC m-2 d-1 or 9.9 mol OC rn-2 yr' . The summer chemosynthesis datum (Table 22, in 0.2 cm) was 38 mmol OG m-2 d-1, or 14 mol OC m-2 yr-1, and the average of the two i s 12 mol m-2 yr- l .
We have attempted t o measure dark D114c fixation in crude beaker experi- ments with sediment collected d u r i n g January and March, 1983, without success. Sulfur bacteria have been observed in a l l samples, b u t DIC fixation was very low. We are continuing t h i s work and plan more sophisticated experiments w i t h in tac t cores and isotope dilution techniques. However, i f rapid and ef- f i c i en t recycling of respiratory 3552- and organic-14c occurs as in bacterial

Table 22. Chemosynthesis and photosynthes i s i n t h e Pamlico River Es tuary .
DIC Fixa t ion nmol cm-J h-1 mmol m-L d-1
S u l f u r Oxidizing Bac te r iaa 790 2 cm deep bloom 380 1 crn "
I I 190 0.2 cm "
I I 3 8 Plankton Photosynthesis
In v i t r o maximum observed -- b In si tu II I I c
A n a t u r a l mixed bloom o f Beggiatoa and Thiovolum(?) spp. i n c o r e supe rna t an t . b c
Kuenzler -- e t a l . , 1979 Davis e t a1 1978 - -a 9
Table 23. Pre l iminary o rgan ic carbon budget f o r t h e Pamlico River Es tuary .
Sources Tar River Runoff Autochthonous Production
i n situ (Davis e t a1 1978) -- - - 9 2 9
i n v i t r o (Kuenzler e t a1 ., 1979) 42 42 M a a x i o n ( s e e p . K F r e i n ) m ) 7 Import from Pam1 i co Sound (Kuenzler e t a1 . , I 979) 21 ( ? ) ? Chemosynthesis ( s e e p. 89 he re in ) 12 9 2
+72 Sinks
Permanent bur i a1 Water column r e s p i r a t i o n (Davis e t a l . , 1978) Sedimentary r e s p i r a t i o n
D i f fus ive DIC f l u x Observed DIC f l u x (Q10 = 2; 16' C) 3 5 ~ 0 ~ 2 - reduc t ion ( t o p 10 cm) 0 reduc t ion ( t o p 1 em)
fassumi ng a1 1 due t o he te ro t rophy) Export t o Pamlico Sound (Davis e t a l . , 1978)
a The f i r s t column con ta in s t h e e s t i m a t e s t h a t a r e a v a i l a b l e and t h e second con ta in s t hose t h a t we cons ide r a p p r o p r i a t e f o r t h e budget.

respiration of excreted photosynthetic end products, we may be required t o a r t i f i c i a l l y manipulate the system.
Nonetheless, we have convincing evidence f o r potential year round chemo- synthetic production of "new" carbon, supported by the reduced end products of organic matter oxidation. T h i s e f f ic ien t recycling of carbon and energy originally fixed by phototrophs elsewhere may make some of the e a r l i e r discus- sions of sediment nutrient f1 ux and decomposition rather moot points. Inter- nal recycling within the sediments appears t o conserve the carbon supply and diversify the energy packages f o r detr i t ivores .
Organic Carbon Flux in the Pamlico River Estuary: An Update
The data presented i n t h i s report can be used to update an e a r l i e r organ- i c carbon budget for the PRE presented by Davis e t a1 . (1978). Their water column carbon supply and respiration data indicated tha t , i n order f o r sedi- mentary metabolism t o ex is t , a s ignif icant amount of organic material would have to be imported or produced. Further, they realized the need f o r studies of the sedimentary environment (hence th i s work), especially since i t was obvious that large fluxes of carbon occurred t o and from the sediments. A l - though import from Pamlico Sound i s potentially s igni f icant , i t has not been measured. Kuenzler -- e t a1 . (1979) calculated tha t up to 21 mol OC m-2 yr-1 could be imported, based on differences i n surface and bottom water concen- t ra t ions. This estimate equals tha t fo r autochthonous production presented by Davis e t a l . (1978) and could help to mathematically balance a carbon bud- get i n view of the sedimentary metabolism estimates presented herein. Actual- ly, most investigators observe extremely large carbon fluxes, w i t h l i t t l e or no net exchange between adjacent waters or marshes (Woodwell -- e t a l . , 1977; Ni ~ o n , 1978).
Our updated budget appears in Tab1 e 23, and includes a1 1 known and guess- timated sources and sinks of OC. In the r ight hand column, we have tabulated the most reasonable estimates of 1 i kely f 1 ux in order to exclude some data which we question. Measured sources include Tar River runoff, phytoplankton productivity, and chemosynthesi s . Calculated sources include import from Pamlico Sound and erosional marsh material. Measured sinks include respiration in the water column and sediments, and possible exports t o Pamlico Sound.
For our updated flux budget, we include Tar River runoff, marsh erosion, chemosynthesis, and the higher of the two estimates f o r annual phytoplankton production. These to ta l 72 mol OC m-2 yr-l t o the PRE. Our sinks include water column respirat ion, and the estimates of 10 cm 35~042- reduction and biochemical 02 reduction i n the top 1 cm of sediment only. The 02 data are res t r ic ted t o t h i s layer because during the warmer months the sediments a re almost always anoxic below this depth, and deeper 02 reduction includes a dis- proportionate amount of COD. We also don't use the estimates of cDIC f lux, since we would need to double tha t estimate t o account f o r chemosynthetic C02 recycling i n the sediments. Thus, chemosynthesis and ~ 0 ~ 2 - reduction appear to be equal i n terms of carbon f lux.

In summary, we f ind t ha t the act ive surface sediments contain amounts of TOC, I K N , and TP t ha t correspond t o only about 1 t o 4 times t h a t f ixed i n a year by phytoplankton. Therefore, phytoplankton debris t h a t i s deposited on the sediments must be recycled within a t l e a s t 1 t o 4 years . Organic carbon from freshwater runoff i s only important in the upper t h i r d of the es tuar ies near t he deposition zones, and i s not evident in deeper sediments a t km 20 or 60. Recycling of N and P within the surface water plankton community ap- pears t o be more important than NH~' and FRP f lux from the sediments. Also, recycling of carbon and nutr ients w i t h i n the sediments appears t o account f o r major discrepancies between ra tes of benthic metabolism and estimated deposi- t ion of phytoplankton. Further, import of organic carbon from Pamlico Sound and i t s peripheral marshes may add t o the carbon pool of these e s tua r i e s , b u t may a lso be masked by a carbon isotope signature t h a t is s imi la r t o t h a t of estuar ine phytoplankton.
These es tuar ies a r e among the most thoroughly examined i n t he world and our new da ta indicate t h a t we may be close t o a s impl i s t i c description of how these systems function. A major research e f f o r t on sedimentary recycl i n g and material exchange with Pamlico Sound i s recommended t o fu r the r our knowledge of es tuar ine s t ruc ture and function.

1 LITERATURE CITED
Adair , F.W. and K. Gundersen. 1969a,b. Chemoautotrophic s u l f u r b a c t e r i a i n t h e marine environment. 1 ( a ) , 2 ( b ) . Can. J . Microbial . 15:345-53,355-9.
Al len , S .E. , H.M. Grimshaw, J.A. Parkinson, and C. Quarmby. 1974. Chemical Ana- l y s i s of Ecological Ma te r i a l s . John Wiley and Sons, New York.
A1 l e r , R. C. 1978. Experimental s t u d i e s of changes produced by d e p o s i t f e e d e r s on pore wa te r , sediment , and over ly ing water chemistry. Amer. J . S c i . 278: 1185-1234.
A1 l e r , R. C. l98Oa. Diagenet ic processes near t h e sediment-water i n t e r f a c e of Long I s l and Sound. I , Decomposition and nutrient element geochemistry (S , N , P) . In B. Sal tzman (ed. ) , Estuar ine Physics and Chemistry:Studies i n long 1 s l and Sound. Advances i n Geophysi c s , vol . 22 Academi c P r e s s , New Y o r k .
A1 l e r , R. C. 1980b. Quan t i fy ing s o l u t e d i s t r i b u t i o n s i n t h e b io tu rba t ed zone of marine sediments by de f in ing an average m i croenvi ronment, Geochim. Cosmochim. Acta 44 : 1955-65.
Almgren, T. and I . Hagstrom. 1974. The ox ida t ion r a t e o f s u l f i d e i n seawater . Wat. Res. 8:395-400.
American Publ i c Health Assoc ia t ion , American Water Works Assoc i a t i on , and Feder- a l Water Po l lu t i on Control Adminis t ra t ion . 1975. Standard Methods f o r The Examination of Water and Wastewater. 14 th e d i t i o n . A.P.H.A. -- e t a1. , Wash- ing ton , D.C.
Aspi la , K . E . , H. Agemian, and A.S.Y. Chau. 1976. A semiautomated method f o r t h e determinat ion of i no rgan ic , o rgan ic , and t o t a l phosphorus i n sediments . Ana- l y s t 101 : 187-97.
Be1 1 i s , V . , M.P. 0 ' Connor, and S.R. Riggs. 1975. Es tua r ine shore1 i n e e ros ion i n t h e A1 bemarle-Pam1 i c o reg ion of North Carol i na . Univers i ty of North Caro- l i n a Sea Grant Publ . No. UNC-SG-75-29, Raleigh.
Berner , R.A.
Berner, R.A. phosphorus berg (ed . )
Berner, R.A. sediments.
971. P r i n c i p l e s of Chemical Sedimentblogy. McGraw-Hill. New York.
974. K ine t i c models f o r t h e e a r l y d i agenes i s of n i t r o g e n , s u l f u r , and s i l i c o n i n anoxic marine sediments . pp. 427-50. - In E.D. Gold-
The Sea. vol . 5. John Wiley and Sons, New York.
977. S to i ch iomet r ic models f o r nutrient r egene ra t i on i n anoxic Limn01 . Oceanogr . 22 : 781 -6.
Berner , R.A. 1980. Ear ly Diagenesis:A Theore t i ca l Approach. Pr ince ton Univ . Press, New Je r sey .
Biggs, R . B . 1970. Source and d i s t r i b u t i o n of suspended sediment i n nor thern Chesapeake Bay. Mar. Geol . 9: 187-301.

I Botell o , A. V . , E . F. Mandell i , S. Macko, and P . L. Parker. 1980. Organic carbon
isotope r a t i o s of recent sediments from coastal lagoons of the Gulf of Mexi- co, Mexico. Geochim. Cosmochim. Acta 44:557-9.
Boyle , E. , J . Edmond, and E . R . Shol kovi t z . 1977. The mechani srn of iron removal i n e s tuar ies . Geochim. Cosmochim. Acta 38:1719-28.
Bray, J.T., O.P, Bricker, and B.N. Troup. 1973. Phosphate i n i n t e r s t i t i a l wa- t e r s of anoxic sediments:oxidation effects during sampling procedure. Science 180: 1362-4.
Bremner, J.M. 1965. Total Nitrogen. pp. 1149-78. In C.A. Black (ed. ) .Methods of Soil Analysis, Par t 2 . Amer, Soc. Agron. ad is on, Wisconsin.
Brinson, M.M. 1977. Decomposition and nu t r ien t exchange of l i t t e r i n an a l l u - vial swamp fo re s t . Ecology 58:601-9.
Brock, T.D. 1979. The Biology of Microorganisms. 3rd Edition. Prentice-Hall , New York.
Brown, F.S., M.J. Baedecker, A. Nissenbaum, and 1.R.Kaplan. 1972. Early dia- genesis i n a reducing f j o r d , Saanich I n l e t , B . C . 111. Changes i n organic consti tuents of the sediments. Geochim. Cosmochim. Acta 36: lI85-12O3.
Burton, J.D. 1976. Basic propert ies and processes i n es tuar ine chemistry. pp. 1-36. In J.D.Burton and P.S. Liss (eds . ) . Estuarine Chemistry. Academic Press, NewTork.
Cabaniss, S.E. 1982. The e f fec t s of bottom water anoxia on benthic nu t r ien t f lux ra tes i n the Pamlico River. Thesis. University of North Carolina, Chapel Hi 11.
Call endar , E. and B.E. Hammond. 1982. Nutrient exchange across the sedirnent- water in te r face i n the Potomac River estuary. Estuar. Coast. Mar. Sc i . l5:395-413.
Chen, K.Y. and J.C. Morris. 1972. Kinetics of oxidation of aqueous su l f i de by 82. Envi ronmental Sci . Techno1 . 6:529-37.
Cavies, J.M. 1975. Energy flow through the benthos i n a Scot t ish sealoch. Mar. Biol . 3l : 353-62.
Davis, G . J . and M.M. Brinson. 1976. The submersed macrophytes of the Paml ico . River es tuary, North Carol i n a . Water Resources Research I n s t i t u t e , Uni ver- s i t y of North Carolina. Rept. No. 112. Raleigh.
Davis, G.J., M.M. Brinson, and W.A. Burke. 1978. Organic carbon and deoxygen- a t ion i n the Paml ico River estuary. Water Resources Research I n s t i t u t e , University of North Carolina. Rept, No. 131. Raleigh.
Davis, R.B. 1974. Stratigraphi'c e f fec t s of t ub i f i c id s i n profundal lake sedi-

ments. Limnol. Oceanogr. 19:466-88.
Degens , E.T. 1969. Bi ogeochemistry of s tab1 e carbon i so topes . pp. 304-29. - In G. Egl ington and M.T. J . Murphy (eds . ) Organic Geochemistry:Methods and Resu l t s . Springer-Verlag, Heidel berg , F . R . G .
I I De Jonge, V . N . and L .A . V i l l e r i u s . 1980. I n t e r f e r e n c e s o f s u l f i d e i n inor -
gani c phosphate de te rmina t ion i n na tu ra l waters . Mar. Chem. 9 : 191 -7.
, Dobbins, D.A. , P.C. Ragland, and J.D. Johnson. 1970. Water-clay i n t e r a c t i o n s I i n North Caro l ina Pamlico Estuary. Environm. S c i . Technol. 4:743-8.
Doel le , H.W. 1975. Bac t e r i a l Metabolism. 2nd e d i t i o n . Academic Press, N . Y .
Eaton, A. 1979. Removal of "so luble" i r o n i n t h e Potomac River e s t u a r y . Es tuar . Coast. Mar. S c i . 9:41-9.
Ecker t , J.M. and E.R. Sholkovi tz . 1976. The f l o c c u l a t i o n o f i r o n , aluminum, and humates from r i v e r water by e l e c t r o l y t e s . Geochim. Cosmochim. Acta 40 : 847-8.
Fea thers tone , R. P. and M. 3. Risk. 1977. Effects o f tube-bui ld ing polychaetes on t h e i n t e r t i d a l sediments o f t h e Minas Basin, Bay o f Fundy. Jour . Sed. P e t r o l . 47:446-50.
Fenchel , T.M. and B.B. Jorgensen. 1977. D e t r i t u s food cha ins o f a q u a t i c eco- systems :The r o l e o f b a c t e r i a . Adv. Microbial Ecol . 1 : 1-58.
F i she r , T.R., P.R. Car l son , and R.T. Barber. 1982a. Sediment n u t r i e n t regen- e r a t i o n i n t h r e e North Caro l ina e s t u a r i e s . Es tua r . Coast. S h e l f S c i . 14: 101-16.
F i she r , T.R., P.R. Carlson, and R.T. Barber. 1982b. Carbon and n i t rogen p r i - mary p roduc t iv i t y i n t h r e e North Carol ina e s t u a r i e s . Es tuar . Coast. She l f S c i . 15:621-44.
Folk, R.L. 1968. Petrology o f Sedimentary Rocks. Hemphill ' s , Aus t in , Texas.
Fontugne, M.R. and J.-C. Duplessey. 1981. Organic carbon i s o t o p i c f r a c t i o n a - t i o n by marine plankton i n t h e temperature range -1 t o 31° C. Oceanologica Acta 4:85-90.
Frankenberg, D. ,S.S.L. Coles , and R.E. Johannes. 1967. The p o t e n t i a l t r o p h i c s i g n i f i c a n c e o f Cal l i anassa - major f e c a l p e l l e t s . Limn01 . Oceanogr. 12: 11 3-20.
Gearing, P. 3. and J.N. Gearing. 1982 .D i s t r i bu t ion o f s t a b l e carbon i so topes i n con t ro l and eu t rophied microcosms (MERL) and i n Nar raganse t t Bay. EOS 63: 955 ( a b s t r a c t ) .
Giese, G . L . , H.B.Wilder, and G . G . Parker , J r . 1979. Hydrology o f major e s t u a r i e s and sounds o f North Caro7ina. U.S,Geol. Sur . Mat. Resour. I nves t . 79-46.

U.S.G.S., Raleigh.
Goldhaber, M.B. and I.R. Kaplan. 1974. The su l fu r cycle. p p . 565-655. - 1n:E.D. Goldberg ( ed . ) . The Sea, vol . 5. John Wiley and Sons, New York.
Graf , G. , W . Bengtsson, U. Diesneer, R. Schulz, and H . Theede. 1982, Benthic response t o sedimentation of a spring phytoplankton bloom:process and bud- get . Mar. Biol. 67:201-8.
Grundmanis , V. and J.W. Murray. 1977. Ni t r i f i ca t ion and deni t r i f i c a t i o n i n marine sediments from Puget Sound. Limn01 . Oceanogr. 22:804-13.
Haines, E .B . 1976. Stable carbon isotope r a t i o s i n the b io ta , s o i l s , and t i da l water of a Georgia s a l t marsh. Estuar. Coast. Mar. Sci . 4:609-16.
Haines , E.B. and C. L . Montague. 1979. Food sources of es tuar ine inver tebrates analyzed using 1 3 ~ / 1 2 ~ r a t i o s . Ecology 60:48-56.
Hale, S.S. 1975. The ro l e of benthic communities i n the nitrogen and phosphorus cycles of an estuary. pp. 291 -308. In F.G. Howel 1 , -J.B.Gentry, and M.H. Smith (eds. ) . Mineral Cycl ing in SKtheastern Ecosys terns. U.S, E. R. D. A. Symposium Ser ies CONF 740513.
Hal lberg, R.O. 1972. Iron and zinc su l f ides formed i n a continuous cu l t u r e of s u l f a t e reducing bacter ia . Neves. Jahrb. Mineral. Monatsh. 11:481-500.
Handschuh , G. J . and L. E . Orgel. 1973. Struvi t e and prebiot ic phosphorylation. Science 179: 483-5.
Hashwa, F.A. and H.G. Truper. 1978. Viable phototrsphic su l fu r bacter ia from the Black Sea bottom. Helgol . wiss. Meeres. 31 :249-53.
Hargrave, B.T. 1973. Coupling carbon flow through some benthic and pelagic communities. 9. Fish. Res. Bd. Can. 30:1317-26.
Harrison, W.G. and JOE. Hobbie. 1974. Nitrogen budget of a North Carolina es tu , ary. Water Resources Research I n s t i t u t e , University of North Cavolina. Rept. No. 86. Raleigh.
Hartness, T.S. 1977. Distribution and clay mineralogy of organic-rich sediment i n the Pamlico River estuary, North Carolina. Thesis. East Carolina Univer s i t y . Greenville.
Hartwig, E.O. 1976. Nutrient cycling between the water column and a marine sediment. I . Organic carbon. Mar. Biol . 34:285-95.
Head, P.C, 1976. Organic processes i n es tuar ies . pp. 53-91. In J.D. Burton and P .S . b i ss (eds. ) . Estuarine Chemistry. Academic PressTNew York.
Hedges, J . I . and P.L. Parker. 1976. Land-derived organic matter i n surface sedi ments from the Gulf of Mexico. Geochim. Cosmochim Acta 40: 1019-29.
9 6

Hedges, J . I . , J . R. E r t e l , and E . B . Leopold. 1982. Lignin geochemistry of a Late Quaternary sediment core from Lake Washington. Geochim. Cosmochim. Acta 46 : 1869-77.
Heinle , D . R . and D. A . Flemer. 1975. Carbon requirements of a populat ion of t h e e s t u a r i n e copepod, Eurytemora a f f i n i s . Mar. Biol . 31 :235-48.
Hein le , D. R. and D. A. Flemer. 1976. Flow of m a t e r i a l s between a poorly f looded t i d a l marsh and an e s tua ry . Mar. B io l . 35:359-74.
Hobbie, J . E . , B . J . Copeland, and W . G . Harrison. 1972. Nu t r i en t s i n t h e Pam1 i c o River Estuary, N. C . , 1969-1971. Water Resources Research I n s t i - t u t e , U n i v . North Carol ina. Rept. No. 76. Raleigh.
Hobbie, J . E. 1974. Nu t r i en t s and eu t roph ica t ion i n t h e Pamlico River Es tuary , N . C . , 1971-1973. Water Resources Research I n s t i t u t e , Univ. North Carol ina. Rept. No. 100. Raleigh.
Hobbie, J . E. and B . J . Pe te rson . In p repa ra t i on . The Pamlico River Estuary.
Hobbie, J . E. and N . Id. Smith. 1975. Nutrients i n t h e Neuse River Estuary. Sea Grant Publ. UNC-SG-75-21. Raleigh.
Howarth, R. W. 1979. P y r i t e : I t s r ap id formation i n a s a l t marsh and i t s importance t o ecosystem metabol ism. Sc ience 203:49-51.
Howarth, R. W . and J . M. Teal . 1979. S u l f a t e reduc t ion i n a New England s a l t marsh. Limn01 . Oceanogr. 24:999-1013.
Howarth, R. W. and J . M. Tea l . 1980. Energy f low i n a s a l t marsh ecosystem: The r o l e o f reduced ino rgan ic s u l f u r compounds. Amer. Nat. 11 6 :862-72.
Indrebfi, G. , B . Pengerud, and I . Dundas. 1979. Microbial a c t i v i t i e s a t t h e oxic/anoxic i n t e r f a c e . I . Primary product ion and s u l f a t e reduc t ion . Mar. Bio l . 51 :295-304.
Jackson, T. A. 1975. Humic m a t t e r i n n a t u r a l waters and sediments . S o i l Sci . 119:56-64.
Jensen, M. L. 1965. Su l fu r i so topes i n t h e marine environment, pp. 131-48. In K. R. Schink (ed.1. Symposium on Marine Geochemistry. Univ. Rhode E l a n d Publ. No. 3.
J o i r i s , C. 1977. On t h e r o l e of h e t e r o t r o p h i c b a c t e r i a i n marine ecosystems: Some problems. Helgol . wiss Meeres. 30:611-21.
J o r ensen, B. B. 1977a. The s u l f u r cyc l e of a c o a s t a l marine sediment TLimfjorden , Denmark). Limn01 . Oceanogr. 22:814-32.

Jorgensen, 6. B . 1977b. Distr ibution of co lo r less (Beggiatoa s p p . ) in a coastal marine sediment.
su l fu r bacter ia Mar. Biol . 41 :19-28.
Klump, J . V . and C. S. Martens. 1981. Biogeochemical cycling i n an organic r ich coastal marine basin. 11. Nutrient sediment-water exchange processes. Geochim. Cosmochim. Acta 45:101-21.
Krom, M . B. and R. A. Berner. 1980a. Adsorption of phosphate in anoxic marine sediments. Limnol. Oceanogr. 25:797-806.
Krom, M . D . and R.A . Berner. 1980b. The di f fus ion coef f i c ien t s of s u l f a t e , ammonium, and phosphate ions i n anoxic marine sediments. Limnol. Oceanogr. 25 : 327-37.
Kuenzler, E.J., D.W. Stanley, and J.P. Koenings. 1979. Nutrient k ine t i cs of phytoplankton i n the Pamlico River, North Carolina. Water Resources Research I n s t i t u t e , Univ . North Carolina. Rept. No. 139, Raleigh.
Kuenzler, E.J . , K . L . Stone, and D . B . Albert. 1982. Phytoplankton uptake and sediment re lease s f nitrogen and phosphorus i n the Chowan River, North Carolina. Water Resources Research I n s t i t u t e , Univ. North Carolina. Rept. No. 181, Raleigh.
Lauria, D.T. and C.R. OIMelia. 1980. Nutrient models f o r engineerjng management of Pam1 i co Estuary, North Carol ina. Water Resources Research I n s t i t u t e , Univ. North Carolina. Rept. No. 146, Raleigh.
L i ss, P. S. 1976. Conservative and non-conservative behavior of dissolved const i tuents during es tuar ine mixing, pp. 93-130. In J.D. Burton and P. S. Liss (eds. ) . Estuarine Chemistry. Academic Pzss, N . Y .
Malone, Ph.G. and K.M. Towe. 1970. Microbial carbonate and phosphate p rec ip i t a t ion from seawater cul tures . Mar, Geol . 9~301-9.
Martens, C.S. 7976. Control of methane sediment-water bubble t r anspor t by macrofauna i r r i ga t i on i n Cape Lookout Bight, North Carolina. Science 192 :998-1000.
Martens, C.S., R.A. Berner, and J.K. Rosenfeld. 1978. I n t e r s t i t i a l water chemistry of anoxic Long Island Sound sediments. XI. Nutrient regeneration and phosphate removal. Limnol. Oceanogr. 23:605-17.
Matson, E.A. 1982, The use of t e t r a zo l ium s a l t s in s tud ies of carbon and energy dynamics i n anoxi c sediments. Disser ta t ion. Univ . Connecticut, S to r r s .
Matson, E.A. and M.M. Brinson. 1982. Su l fa te enrichment i n bottom and sedi- ment pore waters of the Neuse and Pamlico River Estuaries of North Carol ina. EOS 63:57. (abs t ract )

McCaffrey, R.J., A.C. Myers, E. Davey, G . Morrison, M . Bender, N . Luedtke, D. Cul len, P . F roe l i ch , and G. Kl inkhamer . 1980. The r e l a t i o n between pore water chemistry and ben th i c f l u x e s of n u t r i e n t s and manganese i n Narraganse t t Bay, Rhode I s l and . Limnol. Oceanogr. 25:31-44.
McCarthy, J . J . , W.R. Taylor , and J.L. Ta f t . 1977. Nitrogenous n u t r i t i o n o f t h e plankton i n t h e Chesapeake Bay. I . Nu t r i en t a v a i l a b i l i t y and phytoplankton preference . Limnol . Oceanogr. 22 :996-1011.
McCave, I.N. ( E d i t o r ) . 1976. The Benthic Boundary Layer. Plenum Press, N . Y .
McMil l a n , C . P . , P . L . Parker , and B. Fry. 1980. 1 3 ~ / ~ ~ ~ r a t i o s i n s eag ra s se s . Aquatic Botany 9 :237-49.
Menzel, D.W. and R.F. Vaccaro. 1964. The measurement of d i s so lved o rgan ic and p a r t i c u l a t e o rgan ic carbon i n seawater . Limnol. Oceanogr. 9:138-42.
Morr is , A.W. , R. F. C, Mantoura, A. J . Bale , and R.J.M. Howland. 1978. Very low s a l i n i t y reg ions o f estuaries : Important s i tes f o r chemical and b io log i ca l r e a c t i o n s . Nature 274 :678-80.
Morr is , A.W., A.J. Bale , and R.J.M. Howland. 1981. Nu t r i en t d i s t r i b u t i o n s i n an e s tua ry : Evidence of chemical p r e c i p i t a t i o n o f d i s so lved s i l i c a t e and phosphate. Es tuar . Coast. She1 f Sc i . l2:205-16
Muller , P.J. 1977. C/N r a t i o s of marine sediments: Effect o f i no rgan ic amonium and sorbed o rgan ic n i t rogen o f c l ays . Geochim. Conochim. Acta 41 : 765-76.
Naiman, R.J. and J.R. S i b e r t . 1978. Transpor t of n u t r i e n t s and carbon from t h e Nanaimo River t o i t s e s tua ry . Limnol. Oceanogr. 23:1183-93,
Nissenbaum, A * , 8 .3 . P re s l ey , and I.R. Kaplan. 1972. Early d i agenes i s in a reducing f j o r d , Saani ch I n l e t , B r i t i s h Columbia--1. Chemical and i s o t o p i c changes in major components of i n t e r s t i t i a l water . Geochim. Cosmochim. Acta 36 : 1007-27.
Nissenbaum, A. and I.R. Kaplan. 1972. Chemical and i s o t o p i c evidence f o r t h e i n s i t u o r i g i n of marine humic subs tances . Limnol. Oceanogr. 17:570-82. --
Nixon, S.W. 1978. Between coas t a l marshes and coas t a l waters--a review of twenty y e a r s of specu la t i on and r e sea rch on t h e r o l e of s a l t marshes i n e s t u a r i n e p r o d u c t i v i t y and water chemistry. pp. 437-525. In P. Hamilton and K.B. McDonald (eds. ) . Es tua r ine and Wetlands P roces seTwi th Emphasis on Modeling. Plenum Pres s , N.Y.
Nixon, S. W. 1981. Remineral i z a t i o n and n u t r i e n t cycl i ng i n coas t a l marine ecosystems. pp. 111-38. - In B. Nelson and L.E. Cronin (eds . ) . N u t r i e n t Enrichment i n Es tua r i e s . Humana P re s s , C l i f t o n , N.J.

Nixon, S.W. and P .F . Roques. 1982. Anoxic nutrient regeneration and the eutro- phication of es tuar ine waters. U n i v . Rhode Island Water Research Insti- t u t e , Proj. No. B-082-RI.
Otte, L.J. and R.L . Ingram. 1980. Peat Resources of North Carolina. U.S. DOE Contract No. DE-AC01-79ET-14693. N. C. Energy I n s t i t u t e . , Research Triangle Park, N . C .
Ovia t t , C.A. and S.W. Nixon. 1975. Sediment resuspension and deposition i n Narragansett Bay. Estuar. Coast. Shelf Sci . 3:201-18.
Paer l , H . and J.F. Ustach. 1982. Blue-green a lgal scums: An explanation f o r t h e i r occurrence d u r i n g freshwater a1 gal blooms . Limnol . Oceanogr. 27 : 212-17.
Pocklington, R. 1976. Terrigenous organic matter i n surface sediments from the Gulf of St . Lawrence. Jour. Fish. Res. Board Can. 33:93-7.
Rashid, M.A. 1969. Contribution of humic substances t o the cation exchange capacity of d i f fe ren t marine sediments. Marit. Sediments 5:44-50.
Rashid, M.A. and G . E . Reinson. 1979. Organic matter i n s u r f i c i a l sediments of the Miramichi Estuery, New Brunswick, Canada. Estuar. Coast. Marine Sci . 8: 23-36.
Redfield, A.C. 1958. The biological control of chemical f a c to r s i n the environment. h e r . Sci. 46:205-22.
Reid, J.W. 1978. Seasonal changes of the meiobenthos of t he Pam1 ico River Estuary, North Carolina. Disser ta t ion, North Carolina S t a t e Univ., Raleigh.
Rhoads, D. C. 1967. Biogeni c reworking of i n t e r t i da l and subtidal sediments i n Barnstable Harbor and Buzzards Bay, Massachusetts. J . Geol. 75~461-76.
Rice, D.L. 1982. The de t r i t u s nitrogen problem: New observations and per- spectives from organic geochemistry. Mar. Ecol . Prog. Ser. 9:153-62.
Richards, F.A. 1965. Anoxic basins and f jo rds . pp. 611-45. In J .P. Riley and G. Skirrow (eds. ). Chemical Oceanography. Vol . I . Aczemic Press, N.Y .
Rittenberg, S.C., K.O. Emery, and W.L. Orr. 1955. Regeneration of nu t r i en t s i n sediments of marine basins. Deep-sea Res. 3:23-45.
Rosenfeld, J . K. 1979. Ammonium adsorption i n nearshore anoxic sediments. Limnol . Oceanogr. 24:356-64.
Rowe, G . T e y C.H. Clifford, K.L. Smith, J r . , and P.L. Hamilton. 1975. Benthic nu t r i en t regeneration and i t s coupling t o primary productivi ty i n coastal waters. Nature 255:215-7.

S a c k e t t , W.M. 1964. The depos i t i ona l h i s t o r y and i s o t o p i c organic carbon composition of marine sediments . Mar. Geol. 2:173-85.
S a c k e t t , W . M . and R . R . Thompson. 1963. I s o t o p i c carbon composition of Recent con t inen ta l der ived c l a s t i c sediments of e a s t e r n gu l f c o a s t , Gulf o f Mexico. Bu l l . Am. Assoc. P e t r o l . Geologis t s 47:525-31.
S c h e l l , D.M. 1983. Carbon-13 and carbon-14 abundances i n Alaskan a a u a t i c organisms: Delayed product ion from pea t i n A r c t i c food webs. s c i e n c e 219:1068-71.
Schwartz, F.T. and A.F. Chestnut. 1972. Hydrographic a t l a s o f North Carol ina e s t u a r i e s and sound wa te r s , 1972. Sea Grant Publ. No. UNC-SG-73-12. Raleigh.
Shol kovi tz , E. R. 1976. F loccula t ion of d i sso lved o rgan ic and ino rgan ic m a t t e r during t h e mixing of r i v e r water and seawater . Geochim. Cosmochim. Acta 40:831-45.
Sholkovi tz , E . R . , E.A. Boyle, and N . B . P r i ce . 1978. The removal o f d i s so lved humic a c i d s and i ron during e s t u a r i n e mixing. Earth P l ane t . S c i . Lett. 40:130-6.
S h ~ l t z , D.J. and J.A. Calder. 1976. Organic carbon 1 3 ~ / 1 2 C v a r i a t i o n s i n e s t u a r i n e sediments. Geochim. Cosmochim. Acta 40:381-5.
S i b e r t , J.R. and R.J. Naiman. 1979. The r o l e of d e t r i t u s and t h e n a t u r e of e s t u a r i n e ecosystems. pp. 311-24. In K.R. Tenore and B.C . Coull ( e d s . ) . Marine Benthic Dynamics. Univ. S o u 5 Carol i n a Press, Columbia.
S i ebu r th , J .McN. 1975. Microbial Seascapes. Un ive r s i t y Park P r e s s , Baltimore.
Smith, B.N. and S. Epstein. 1971. Two c a t e g o r i e s of I%/% r a t i o s f o r h ighe r p l a n t s . P l an t Physiol . 47:380-4.
So fe r , Zvi. 1980. Prepara t ion of carbon d ioxide f o r s t a b l e carbon. i so tope a n a l y s i s of petroleum f r a c t i o n s . Anal. Chem. 52:1389-91.
Solorozano, L . 1969. Determination of ammonia i n n a t u r a l waters by t h e phenol- hypochlor i te method. Limnol. Oceanogr. 14:799-801.
Sp ike r , E.C. and L . E . Schemel. 1979. D i s t r i b u t i o n of s t a b l e i so tope compo- s i t i o n o f carbon i n San Francisco Bay. pp. 195-212. In T.J. Conomos (ed. ). San Francisco Bay: The Urbanized Estuary. p a c i f i c Div., MAS. San Francisco, C a l i f .
S t a i n t o n , M. P . , M. J . Capel, and F.A.J. Armstrong. 1974. The Chemical Analysis o f Fresh Water. Environment Canada Mi s c e l laneous Publ . No. 25. Research and Development D i r e c t o r a t e , Freshwater I n s t i t u t e , Winnipeg, Canada.

Stanley, D.W. 1971. A method f o r measuring the productivi ty of benthic micro- algae. Thesis. North Carolina S t a t e U n i v . , Raleigh.
Stanley, D.W. and J.E. Hobbie. 1981. Nitrogen recycling i n a North Carolina coastal r i ve r . Limnol. Oceanogr. 26:30-42.
Strom, R . N , and R . B . Biggs. 1982. Phosphorus d i s t r ibu t ion i n sediments of the Be1 aware River Estuary. Estuaries 5 : 95-1 01 .
Stumm, W . and J .J . Morgan. 1981. Aquatic Chemistry: An Introduction Emphasizing Chemical Equi l ibr ia i n Natural Waters. 2nd ed i t ion . Wiley Intersc ience, N . Y .
Tan, F.C. and P.M. St ra in . 1979. Organic carbon isotope r a t i o s in Recent sediments i n the S t . Lawrence Estuary and the Gulf of S t . Lawrence. Estuar. Coast. Marine Sci . 8:%13-25.
Tenore, K.R. 1972. Macrobenthos of the Pamlico River Estuary, North Carolina. Ecol . Monsgr. 42~51-69.
T i l t on , R. C . , A.B. Cobet, and G . E . Jones. 1967a. Marine t h i o b a c i l l i . I . Can. 3. Microbiol. 13:1529-8.
T i l t on , R . C . , G.J. Stewart, and G.E. Jones. 1967b. Marine t h i o b a c i l l i . 11. Can. J . Microbiol. 13:1529-34.
Troelsen , H. and B .B. Jorgensen. 1982. Seasonal dynamics of elemental su l fu r i n two coastal sediments. Estuar. Coast. Shelf Sci . 15955-66.
Turekian, K. K . , G . J . Benoit, and L.K. Benninger. 1980. The mean residence time of plankton-derived carbon i n a Long Island Sound core: A correct ion. Estuar. Coast. Mar. Sci . 11 :583
Tu t t l e , J.H. and H.W. Jannasch. 1972. Occurrence and types of t h i sbac i l l u s - l i k e bacter ia i n the sea. bimnol. Oceanogr. 17:532-543.
Tu t t l e , J . H . and H.W. Jannasch. 1973. Dissimilatory reduction of inorganic s u l f u r by f acu l t a t i ve ly anaerobic marine bacteria. 3 . Bact. 115:732-7.
Upchurch, J.B., J.K. Edzwald, and C.R . O'Melia. 1974. Phosphates in sediments o f Pamlico Estuary. Environ. Sci . Technol. 8:56-8.
U.S.D.A. Soi 1 Conservation Service. 1977. Erosion and sediment inventory f o r North Carol ina. Raleigh.
U.S. G.S. 1981. Water resources data :North Carolina water year 1981. U.S. Geological Survey Water-data Report NC-81-1. Raleigh.

Vanderborght, J . -P . , R. Wol las t , and G . B i l l e n . 1977. K ine t i c models o f d iagenes i s in d i s tu rbed sediments . P a r t 2. Nitrogen d i agenes i s . Limnol. Oceanogr. 22 : 794-803,
Waslenchuk, D . G . , E .A . Matson, R . N . Za jac , F.C. Dobbs, and 3 . Tramontano. 1983. Geochemistry of burrow waters vented by a b io tu rba t ing shrimp i n Bermudian sediments. Mar. Biol . 72:219-25.
Welsh, B . L . , R .B. Whit la tch, and W.F. Bohlen. 1982. Re la t i onsh ip between physical c h a r a c t e r i s t i c s and organic carbon sources a s a b a s i s f o r com- par ing e s t u a r i e s i n southern New England. pp. 53-67. In S. Kennedy ( e d . ) . - Estuar ine Comparisons. Academic P re s s , N . Y.
Whelan, T. 1974. Methane, carbon d ioxide and d isso lved s u l f a t e from i n t e r - s t i t i a l water of coas t a l marsh sediments . Estuar . Coast. Mar. S c i . 2: 407-1 5.
Williams, A . B . , S. Posner, W.J. Woods, and E.E. Deubler, J r . 1973. A hydrologic a t l a s of l a r g e r North Carol ina sounds. UNC Sea Grant, Pub1 . NO. UNC-SG-73-02.
Woodwell, G.M. , D.E. Uhitney, C.A.S. b a l l , and R.A. Houghton. 1977. The Flax Pond ecosystem s tudy: Exchanges of carbon i n water between a s a l t marsh and Long I s1 and Sound. Limnol . Oceanogr. 22 :833-8.
-