Webinar Bim Forum Bim After Construction Final Copyright Version

Tablets and BIM in Construction
Returns on Innovation Investments A Case Study on the James B. Hunt Jr.
Library Project At North Carolina State University
Will Senner, Skanska
12/2/2011


The Associated General Contractors of America (AGC) is a
Registered Provider with The American Institute of Architects
Continuing Education Systems. Credit earned on completion of
this program will be reported to CES Records for AIA members.
Certificates of Completion are available on request.
This program is registered with the AIA/CES for continuing
professional education. As such it does not include content that
may be deemed or construed to be an approval or endorsement
by the AIA of any material of construction or any method or
manner of handling, using, distributing, or dealing in any material
or product. Questions related to specific materials, methods, and
services will be addressed at the conclusion of this presentation.

NC State
Centennial Campus

NC State
Centennial Campus

NC State
Centennial Campus
Agenda
Technology Overview
• BIM in Estimating & Preconstruction
• Visualization & Smart Boards
• Logistics Planning & 4D Scheduling
• Field Mobility & Mobile Electronic Resource Stations
• Material Tracking
• MEP Coordination & As-Built BIM Handover
ROI / Cost-Benefit Research
• Research Methodology/Approach
• Direct & Indirect Costs
• Benefits
• Efficiency Gains & Rework Reductions
• ROI Calculations
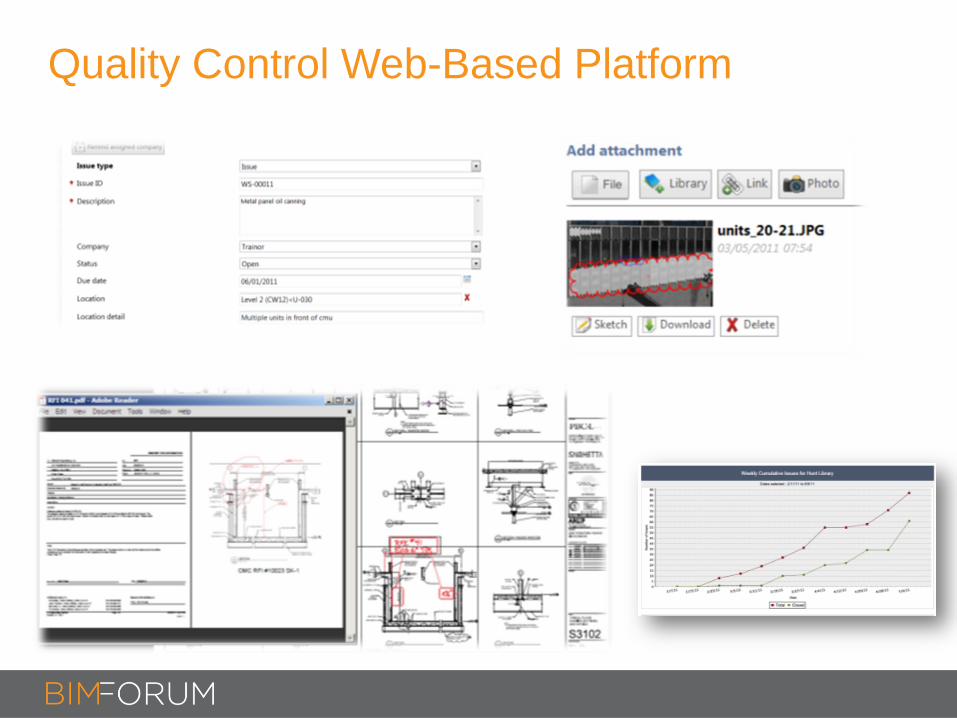
Quality Control Web-Based Platform

Quality Control – Field Mobility
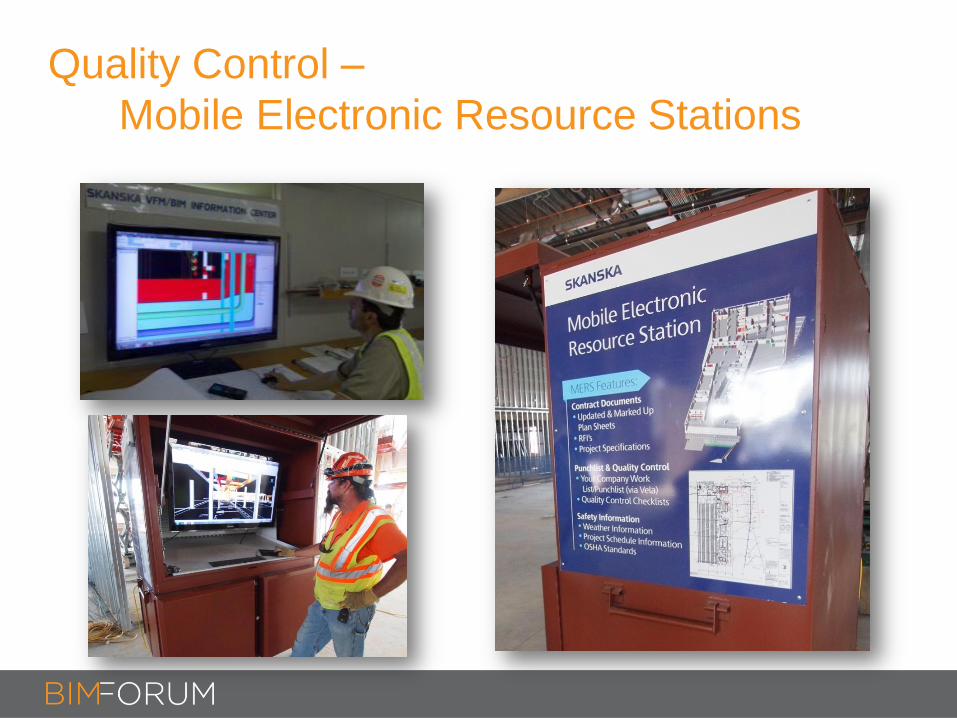
Quality Control –
Mobile Electronic Resource Stations

Exterior Envelope

Material Tracking for Unitized Curtainwall
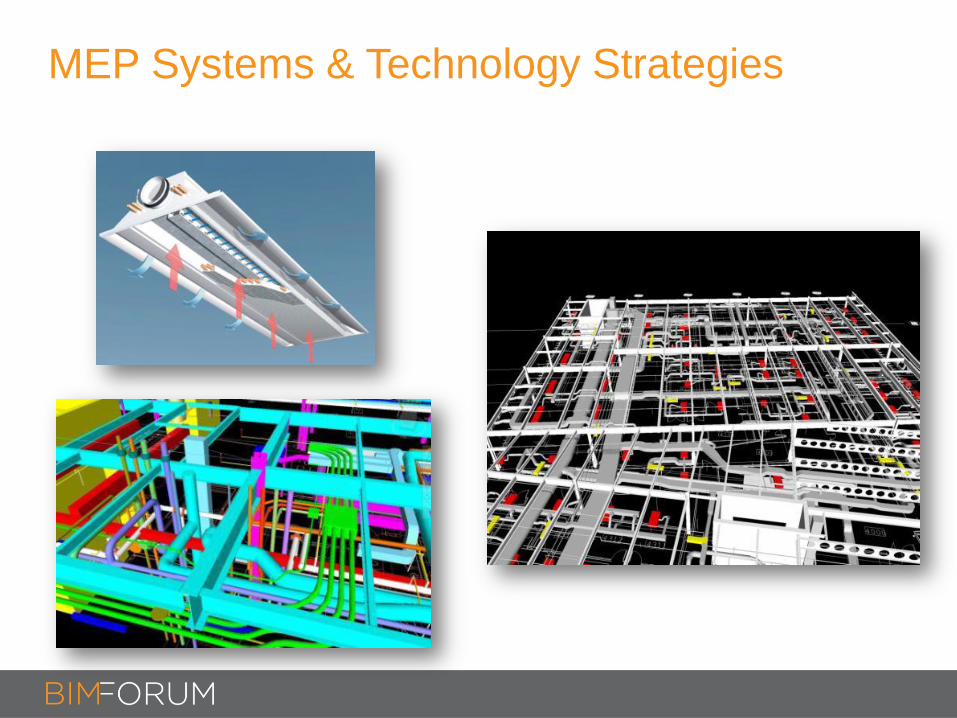
MEP Systems & Technology Strategies
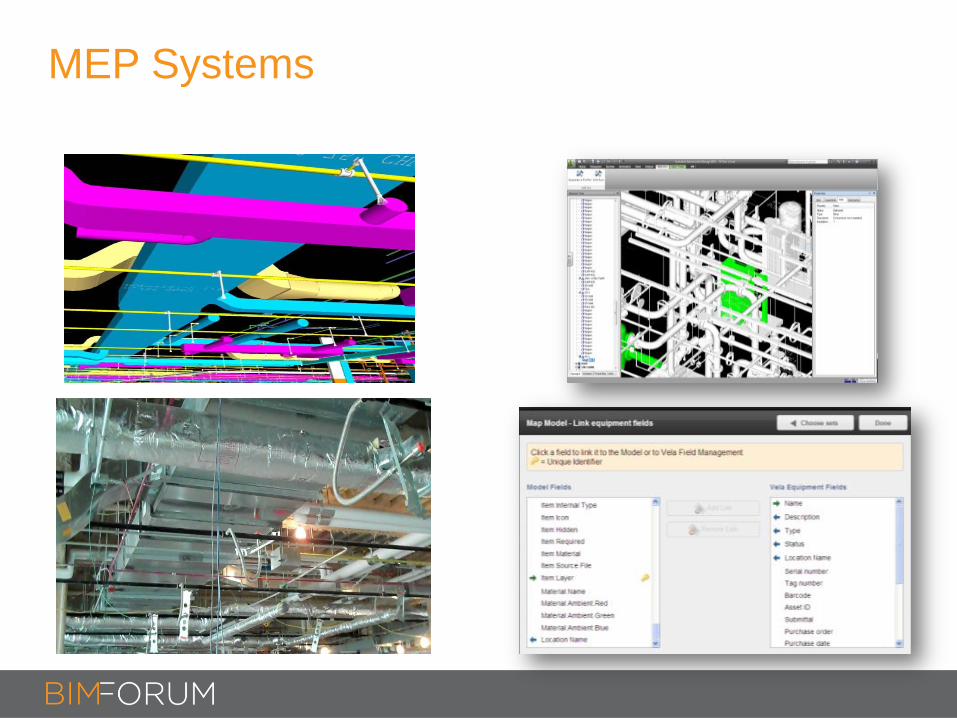
MEP Systems
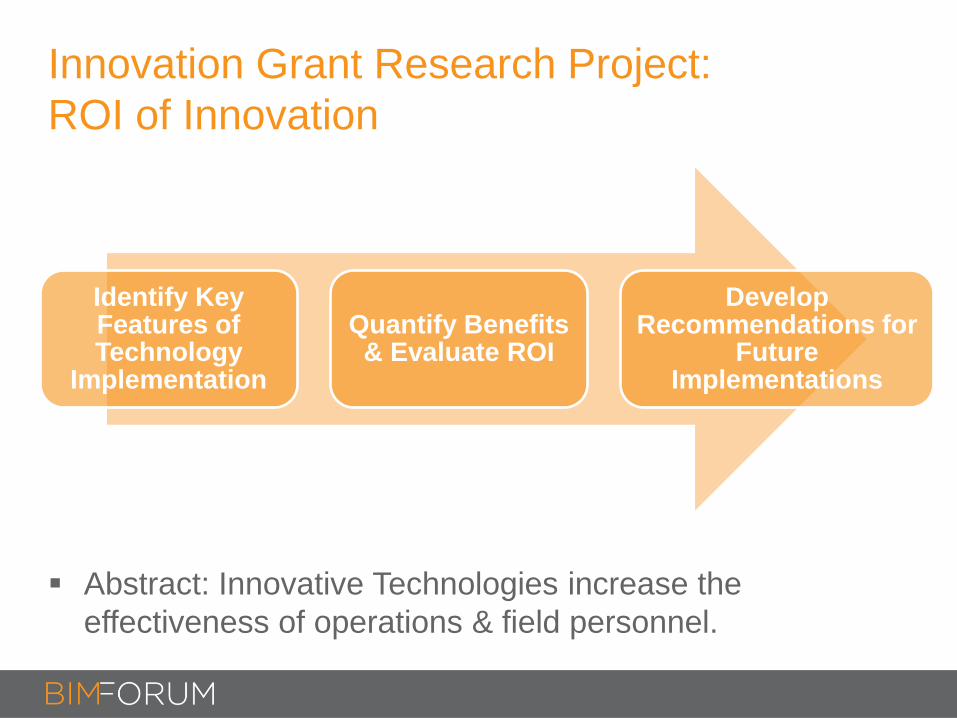
Innovation Grant Research Project:
ROI of Innovation
Abstract: Innovative Technologies increase the
effectiveness of operations & field personnel.
Identify Key Features of Technology
Implementation
Quantify Benefits & Evaluate ROI
Develop Recommendations for
Future Implementations
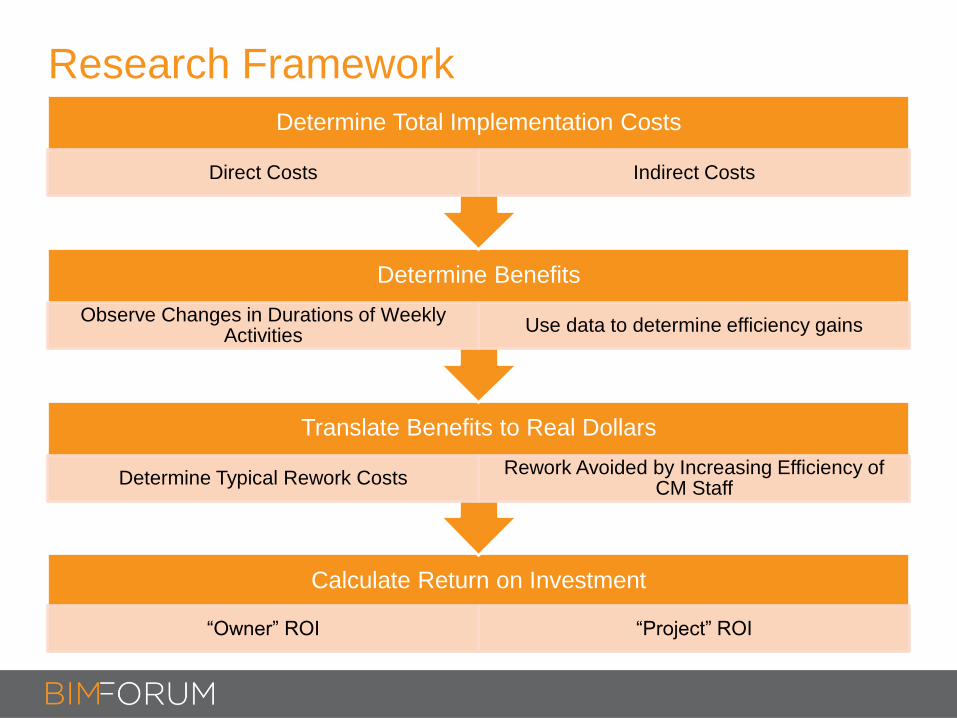
Research Framework
Calculate Return on Investment
“Owner” ROI “Project” ROI
Translate Benefits to Real Dollars
Determine Typical Rework Costs Rework Avoided by Increasing Efficiency of
CM Staff
Determine Benefits
Observe Changes in Durations of Weekly Activities
Use data to determine efficiency gains
Determine Total Implementation Costs
Direct Costs Indirect Costs
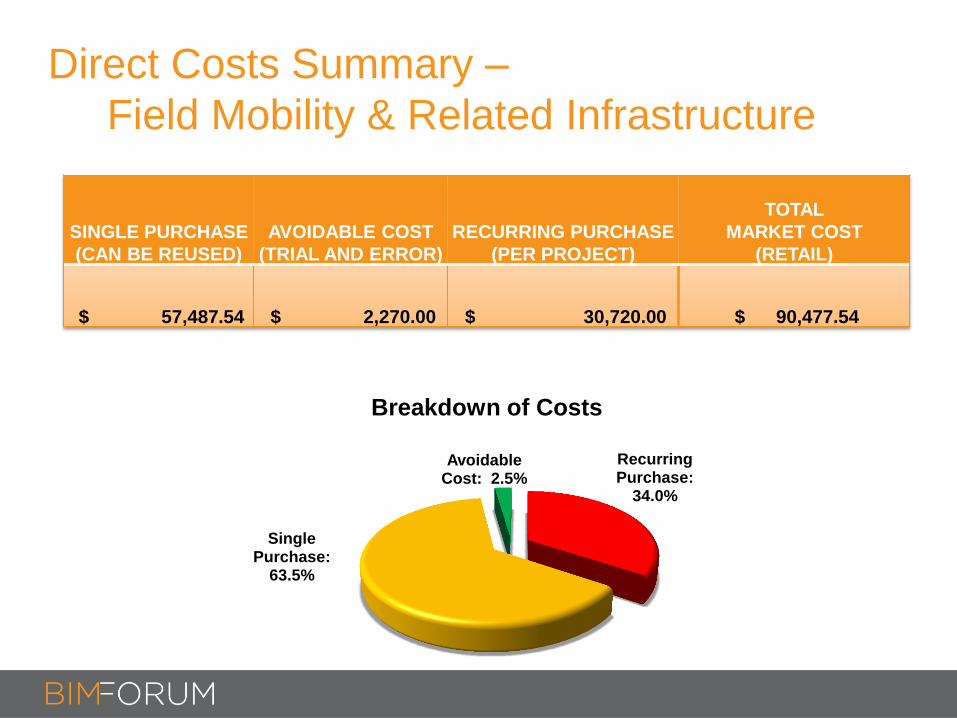
Direct Costs Summary –
Field Mobility & Related Infrastructure
SINGLE PURCHASE
(CAN BE REUSED)
AVOIDABLE COST
(TRIAL AND ERROR)
RECURRING PURCHASE
(PER PROJECT)
TOTAL
MARKET COST
(RETAIL)
$ 57,487.54 $ 2,270.00 $ 30,720.00 $ 90,477.54
Single Purchase:
63.5%
Avoidable Cost: 2.5%
Recurring Purchase:
34.0%
Breakdown of Costs
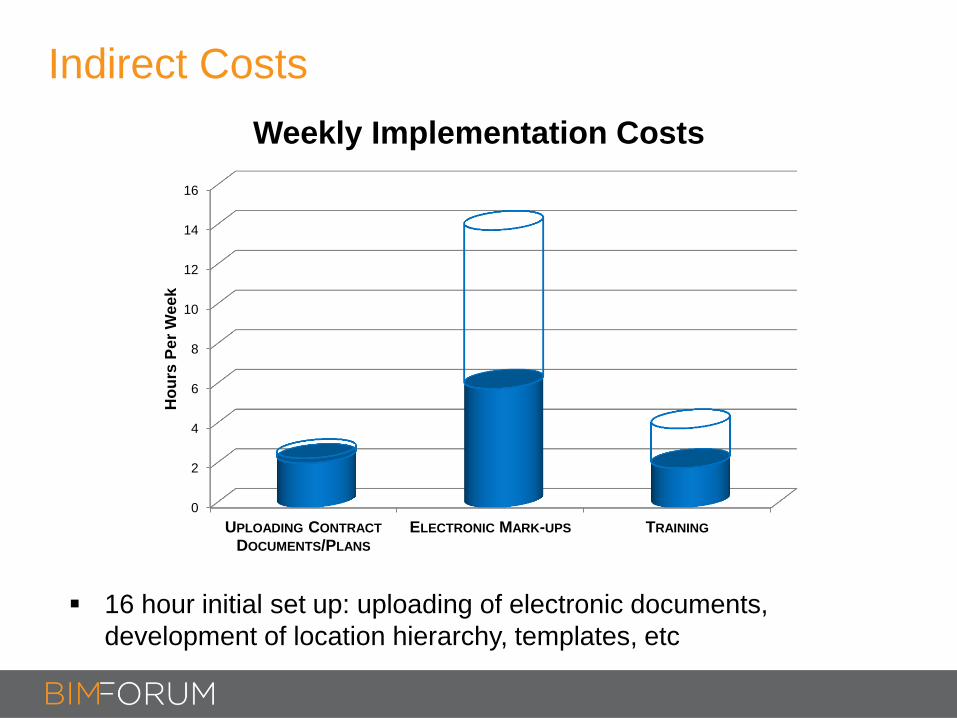
Indirect Costs
16 hour initial set up: uploading of electronic documents,
development of location hierarchy, templates, etc
0
2
4
6
8
10
12
14
16
UPLOADING CONTRACT DOCUMENTS/PLANS
ELECTRONIC MARK-UPS TRAINING
Ho
urs
Pe
r W
ee
k
Weekly Implementation Costs
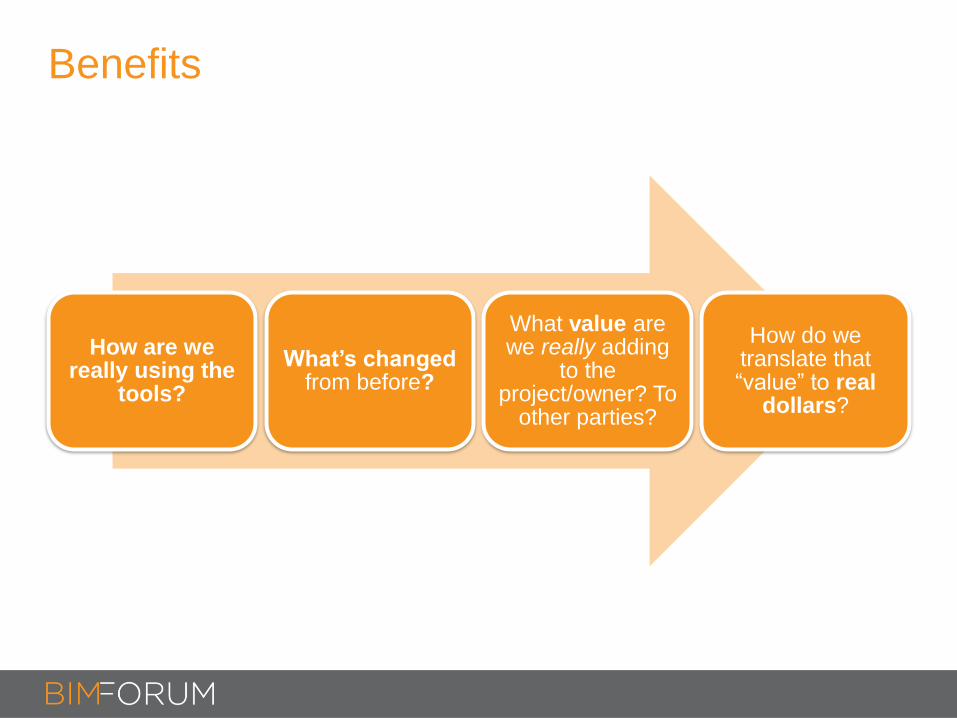
Benefits
How are we really using the
tools?
What’s changed from before?
What value are we really adding
to the project/owner? To
other parties?
How do we translate that “value” to real
dollars?
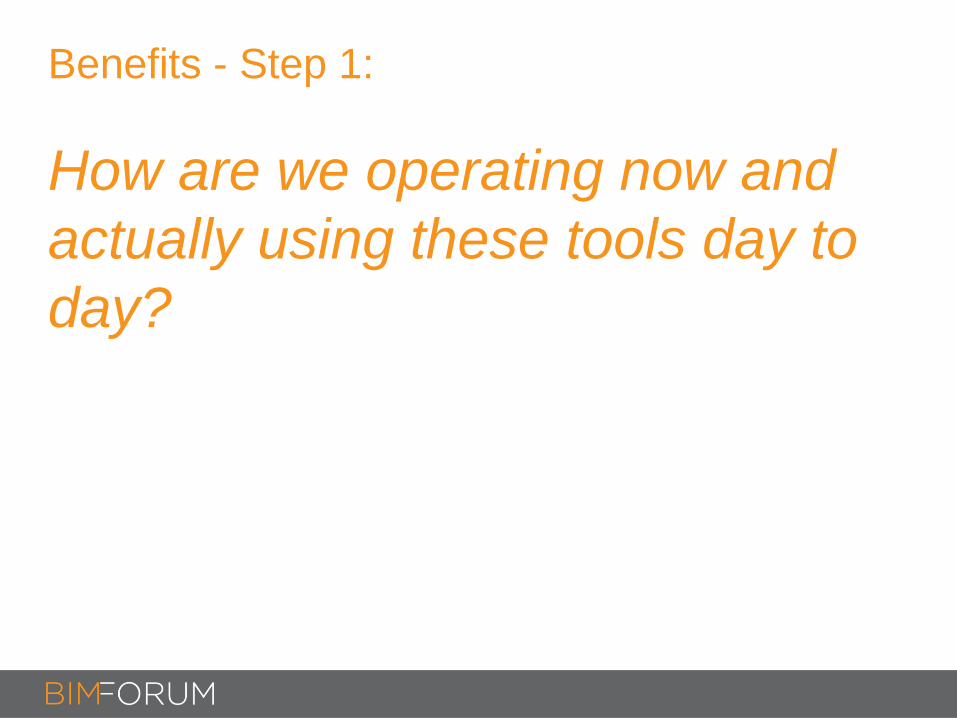
Benefits - Step 1:
How are we operating now and
actually using these tools day to
day?
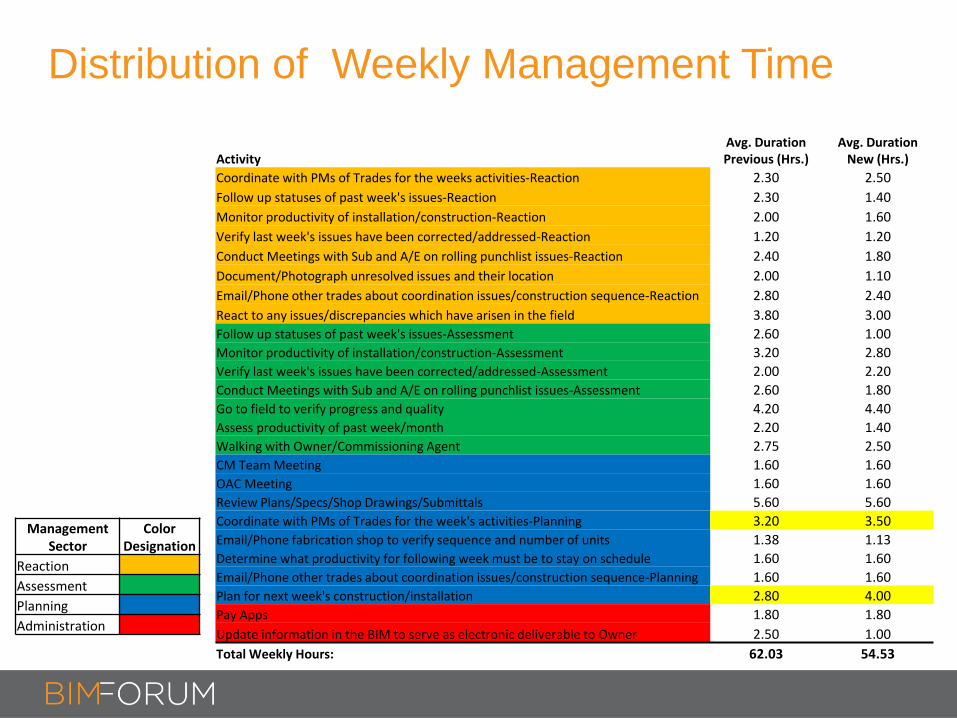
Distribution of Weekly Management Time
Management Sector
Color Designation
Reaction
Assessment
Planning
Administration
Activity Avg. Duration Previous (Hrs.)
Avg. Duration New (Hrs.)
Coordinate with PMs of Trades for the weeks activities-Reaction 2.30 2.50
Follow up statuses of past week's issues-Reaction 2.30 1.40
Monitor productivity of installation/construction-Reaction 2.00 1.60
Verify last week's issues have been corrected/addressed-Reaction 1.20 1.20
Conduct Meetings with Sub and A/E on rolling punchlist issues-Reaction 2.40 1.80
Document/Photograph unresolved issues and their location 2.00 1.10
Email/Phone other trades about coordination issues/construction sequence-Reaction 2.80 2.40
React to any issues/discrepancies which have arisen in the field 3.80 3.00
Follow up statuses of past week's issues-Assessment 2.60 1.00
Monitor productivity of installation/construction-Assessment 3.20 2.80
Verify last week's issues have been corrected/addressed-Assessment 2.00 2.20
Conduct Meetings with Sub and A/E on rolling punchlist issues-Assessment 2.60 1.80
Go to field to verify progress and quality 4.20 4.40
Assess productivity of past week/month 2.20 1.40
Walking with Owner/Commissioning Agent 2.75 2.50
CM Team Meeting 1.60 1.60
OAC Meeting 1.60 1.60
Review Plans/Specs/Shop Drawings/Submittals 5.60 5.60
Coordinate with PMs of Trades for the week's activities-Planning 3.20 3.50
Email/Phone fabrication shop to verify sequence and number of units 1.38 1.13
Determine what productivity for following week must be to stay on schedule 1.60 1.60
Email/Phone other trades about coordination issues/construction sequence-Planning 1.60 1.60
Plan for next week's construction/installation 2.80 4.00
Pay Apps 1.80 1.80
Update information in the BIM to serve as electronic deliverable to Owner 2.50 1.00
Total Weekly Hours: 62.03 54.53

Benefits - Step 2:
What’s changed from the old
way?
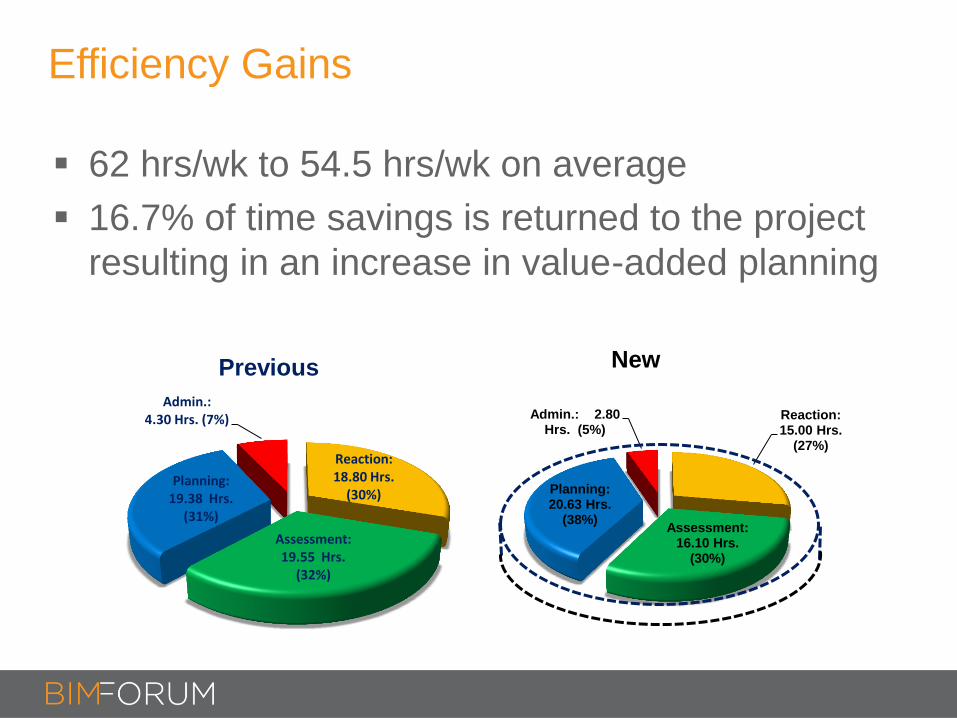
Efficiency Gains
62 hrs/wk to 54.5 hrs/wk on average
16.7% of time savings is returned to the project
resulting in an increase in value-added planning
Reaction: 18.80 Hrs.
(30%)
Assessment: 19.55 Hrs.
(32%)
Planning: 19.38 Hrs.
(31%)
Admin.: 4.30 Hrs. (7%)
Previous
Reaction: 15.00 Hrs.
(27%)
Assessment: 16.10 Hrs.
(30%)
Planning: 20.63 Hrs.
(38%)
Admin.: 2.80 Hrs. (5%)
New
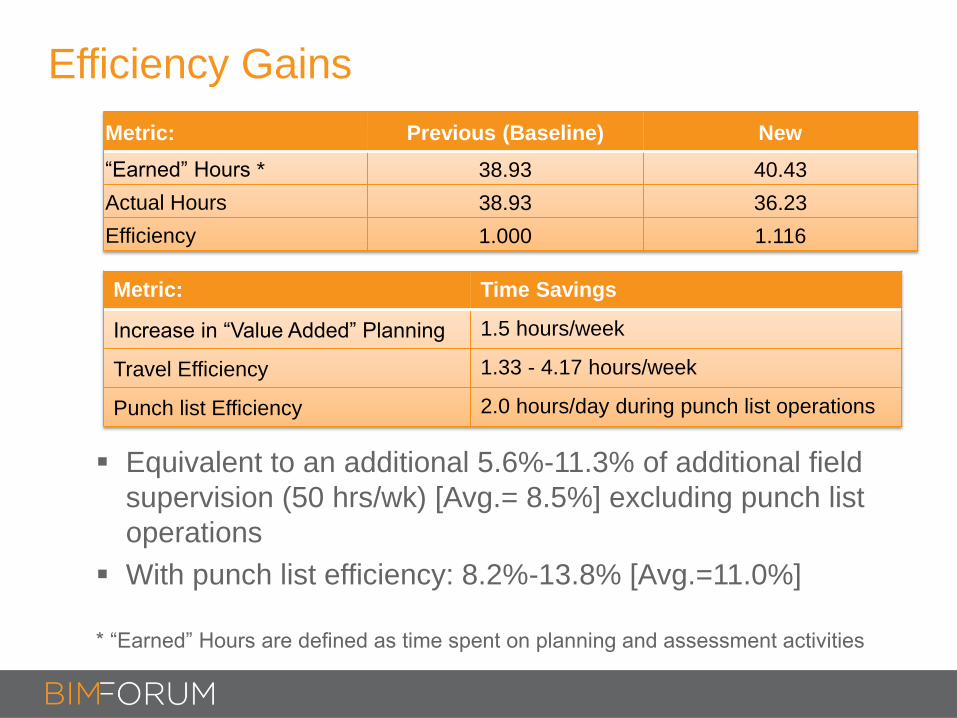
Efficiency Gains
Equivalent to an additional 5.6%-11.3% of additional field
supervision (50 hrs/wk) [Avg.= 8.5%] excluding punch list
operations
With punch list efficiency: 8.2%-13.8% [Avg.=11.0%]
* “Earned” Hours are defined as time spent on planning and assessment activities
Metric: Previous (Baseline) New
“Earned” Hours * 38.93 40.43
Actual Hours 38.93 36.23
Efficiency 1.000 1.116
Metric: Time Savings
Increase in “Value Added” Planning 1.5 hours/week
Travel Efficiency 1.33 - 4.17 hours/week
Punch list Efficiency 2.0 hours/day during punch list operations
Benefits - Step 3:
What part(s) of this change really
result in added value to the
project/owner?
To other parties?
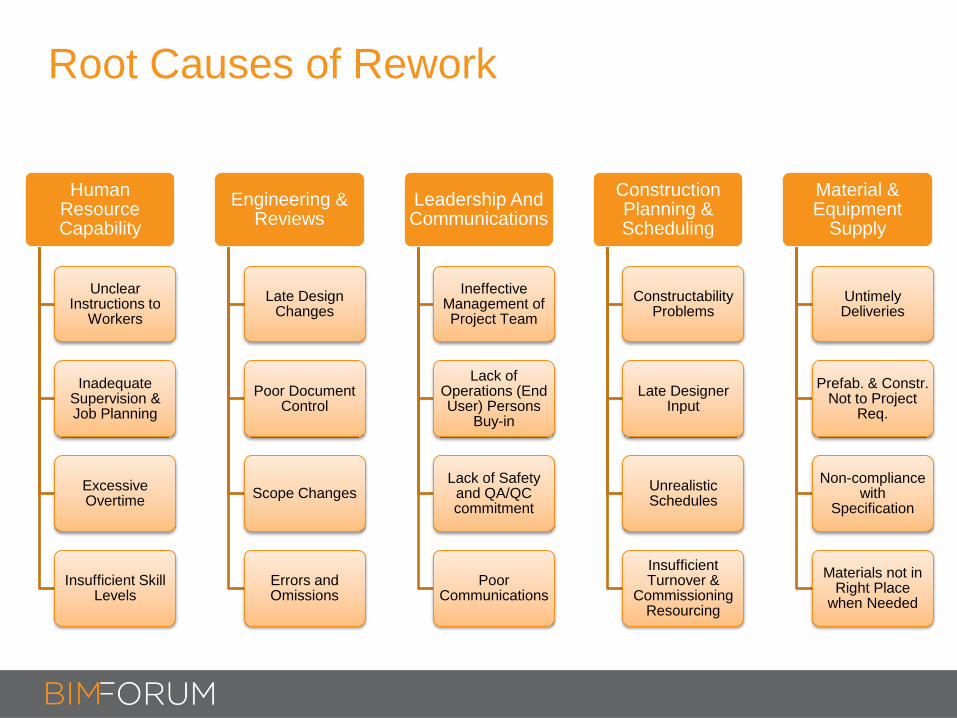
Root Causes of Rework
Human Resource Capability
Unclear Instructions to
Workers
Inadequate Supervision & Job Planning
Excessive Overtime
Insufficient Skill Levels
Engineering & Reviews
Late Design Changes
Poor Document Control
Scope Changes
Errors and Omissions
Leadership And Communications
Ineffective Management of Project Team
Lack of Operations (End User) Persons
Buy-in
Lack of Safety and QA/QC commitment
Poor Communications
Construction Planning & Scheduling
Constructability Problems
Late Designer Input
Unrealistic Schedules
Insufficient Turnover &
Commissioning Resourcing
Material & Equipment
Supply
Untimely Deliveries
Prefab. & Constr. Not to Project
Req.
Non-compliance with
Specification
Materials not in Right Place
when Needed
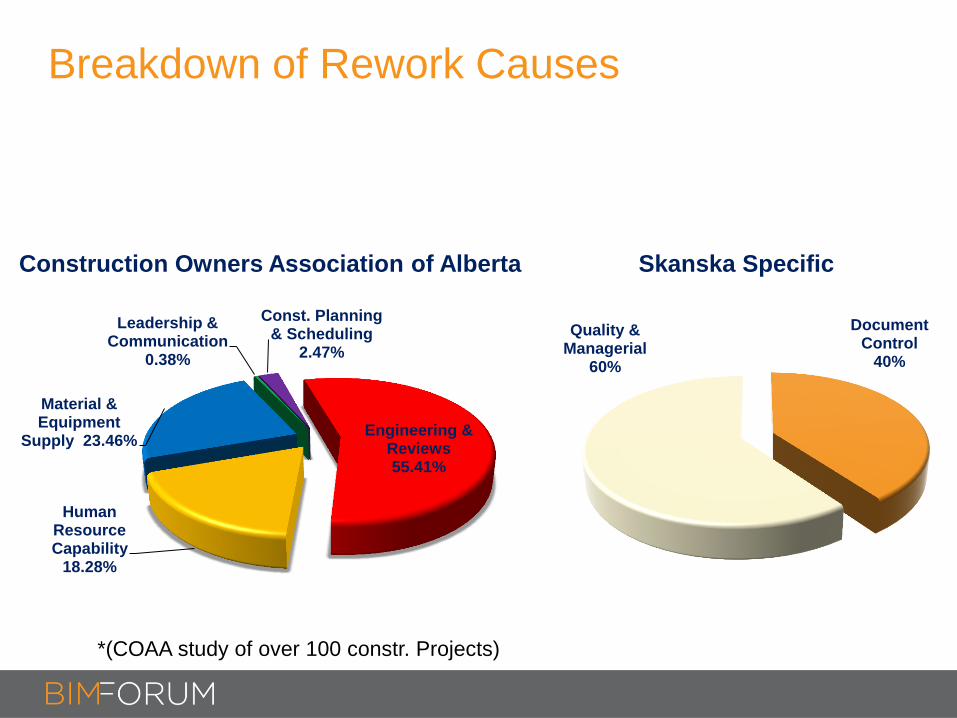
Breakdown of Rework Causes
*(COAA study of over 100 constr. Projects)
Engineering & Reviews 55.41%
Human Resource Capability
18.28%
Material & Equipment
Supply 23.46%
Leadership & Communication
0.38%
Const. Planning & Scheduling
2.47%
Construction Owners Association of Alberta
Document Control
40%
Quality & Managerial
60%
Skanska Specific

Benefits - Step 4:
How do we translate that “value”
into real dollars?
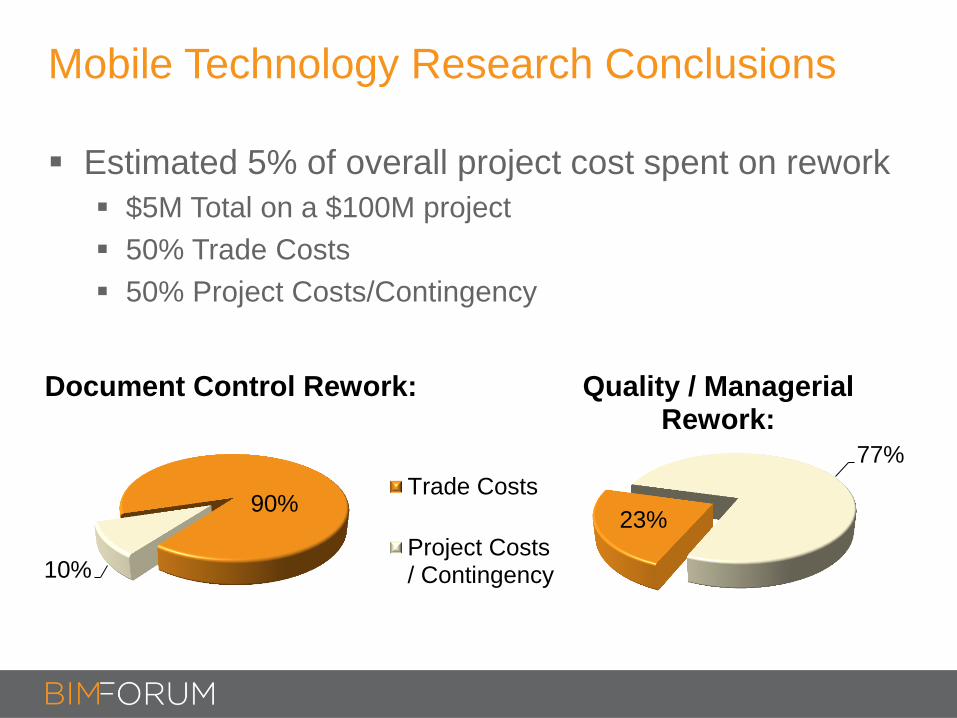
Mobile Technology Research Conclusions
Estimated 5% of overall project cost spent on rework
$5M Total on a $100M project
50% Trade Costs
50% Project Costs/Contingency
90%
10%
Document Control Rework:
Trade Costs
Project Costs/ Contingency
23%
77%
Quality / Managerial Rework:
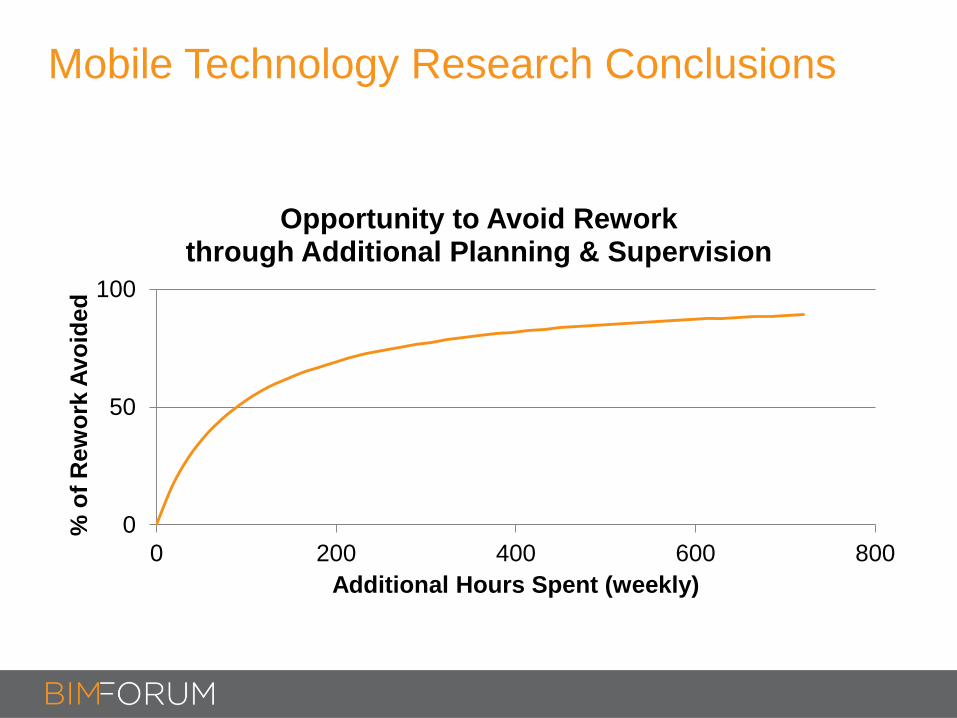
Mobile Technology Research Conclusions
0
50
100
0 200 400 600 800
% o
f R
ew
ork
Avo
ided
Additional Hours Spent (weekly)
Opportunity to Avoid Rework through Additional Planning & Supervision
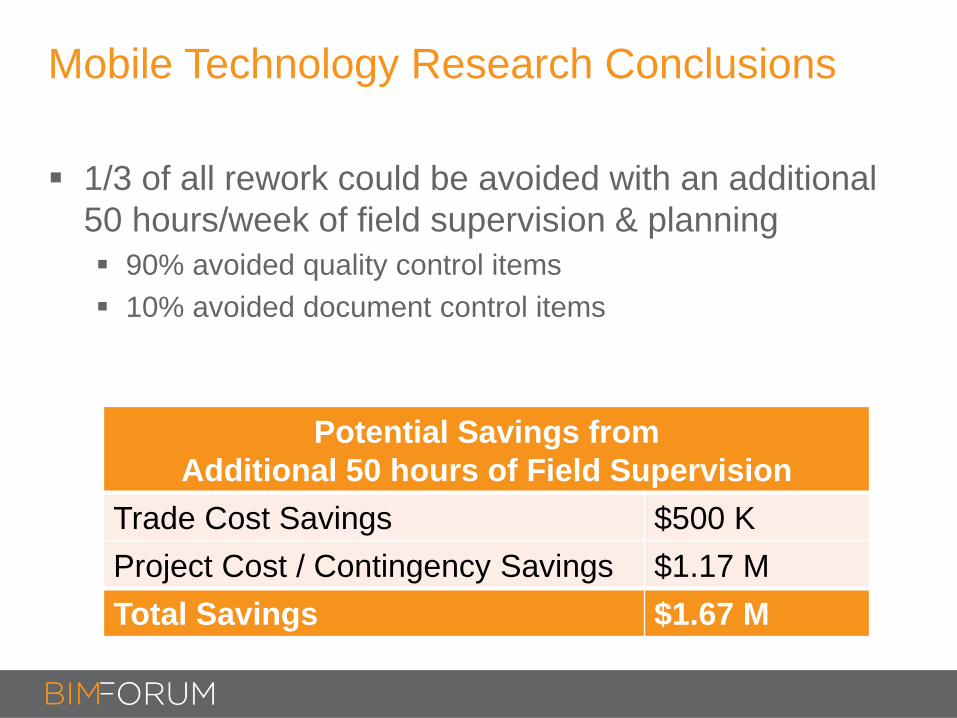
Mobile Technology Research Conclusions
1/3 of all rework could be avoided with an additional
50 hours/week of field supervision & planning
90% avoided quality control items
10% avoided document control items
Potential Savings from
Additional 50 hours of Field Supervision
Trade Cost Savings $500 K
Project Cost / Contingency Savings $1.17 M
Total Savings $1.67 M
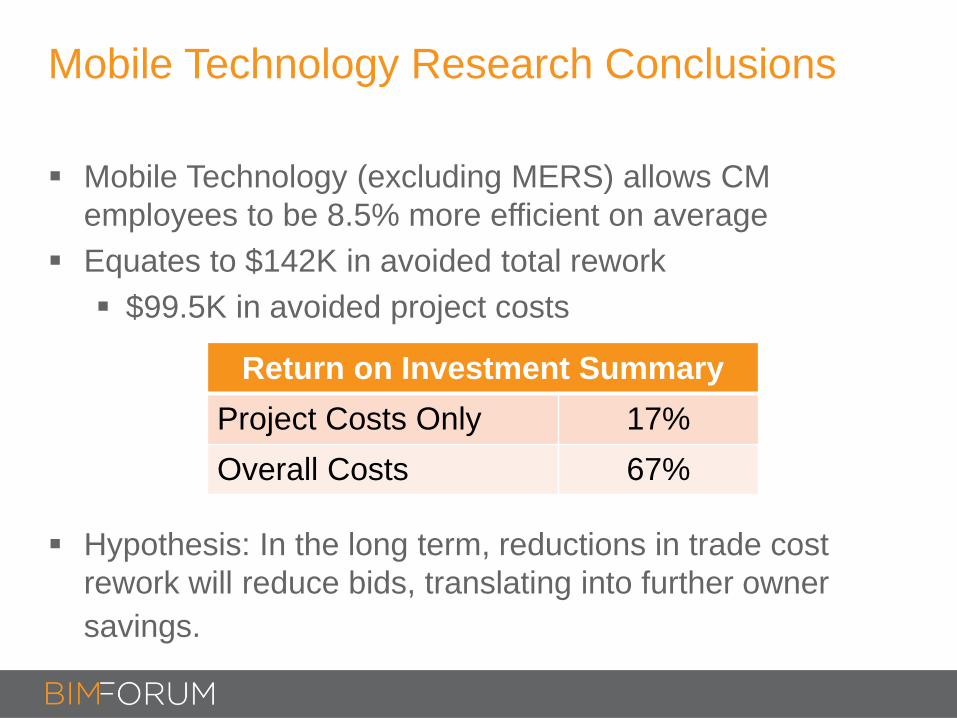
Mobile Technology Research Conclusions
Mobile Technology (excluding MERS) allows CM
employees to be 8.5% more efficient on average
Equates to $142K in avoided total rework
$99.5K in avoided project costs
Hypothesis: In the long term, reductions in trade cost
rework will reduce bids, translating into further owner
savings.
Return on Investment Summary
Project Costs Only 17%
Overall Costs 67%
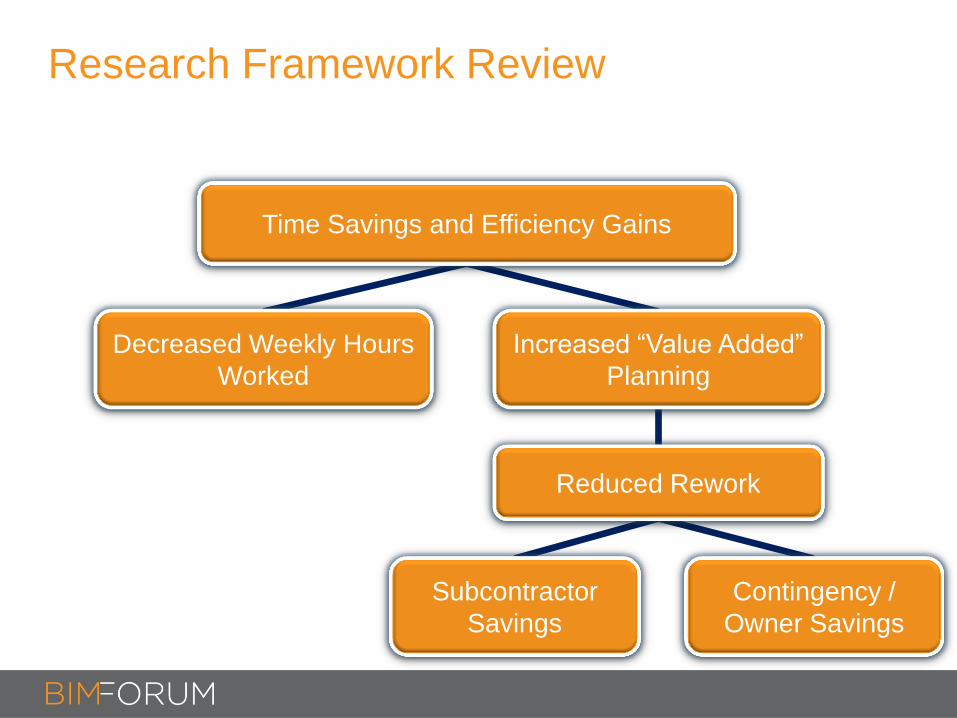
Research Framework Review
Time Savings and Efficiency Gains
Decreased Weekly Hours
Worked
Increased “Value Added”
Planning
Reduced Rework
Contingency /
Owner Savings
Subcontractor
Savings
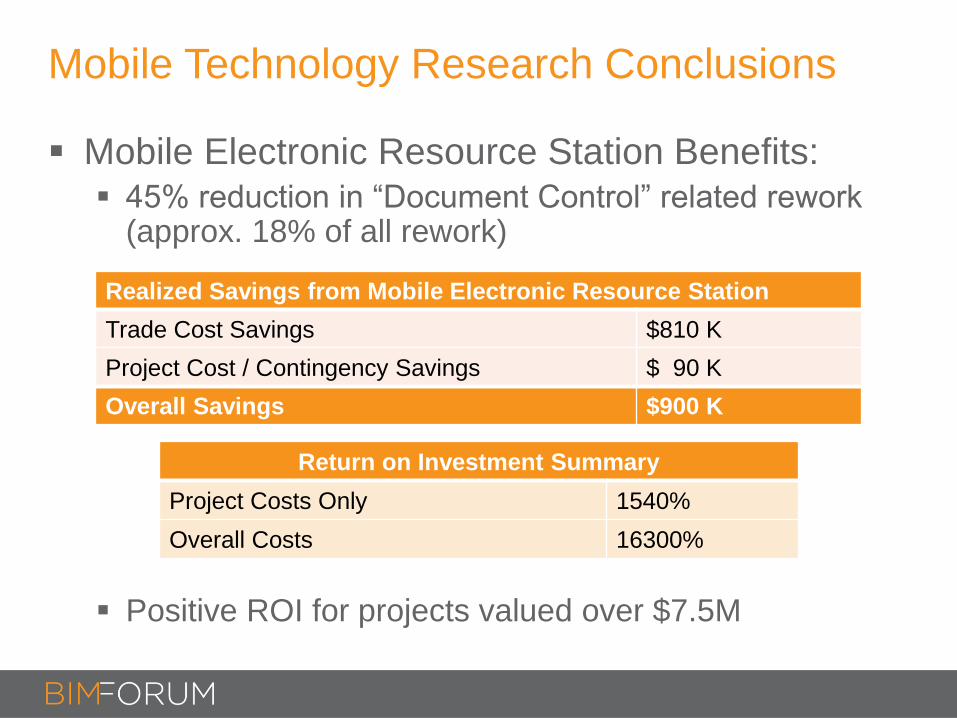
Mobile Technology Research Conclusions
Mobile Electronic Resource Station Benefits: 45% reduction in “Document Control” related rework
(approx. 18% of all rework)
Positive ROI for projects valued over $7.5M
Realized Savings from Mobile Electronic Resource Station
Trade Cost Savings $810 K
Project Cost / Contingency Savings $ 90 K
Overall Savings $900 K
Return on Investment Summary
Project Costs Only 1540%
Overall Costs 16300%
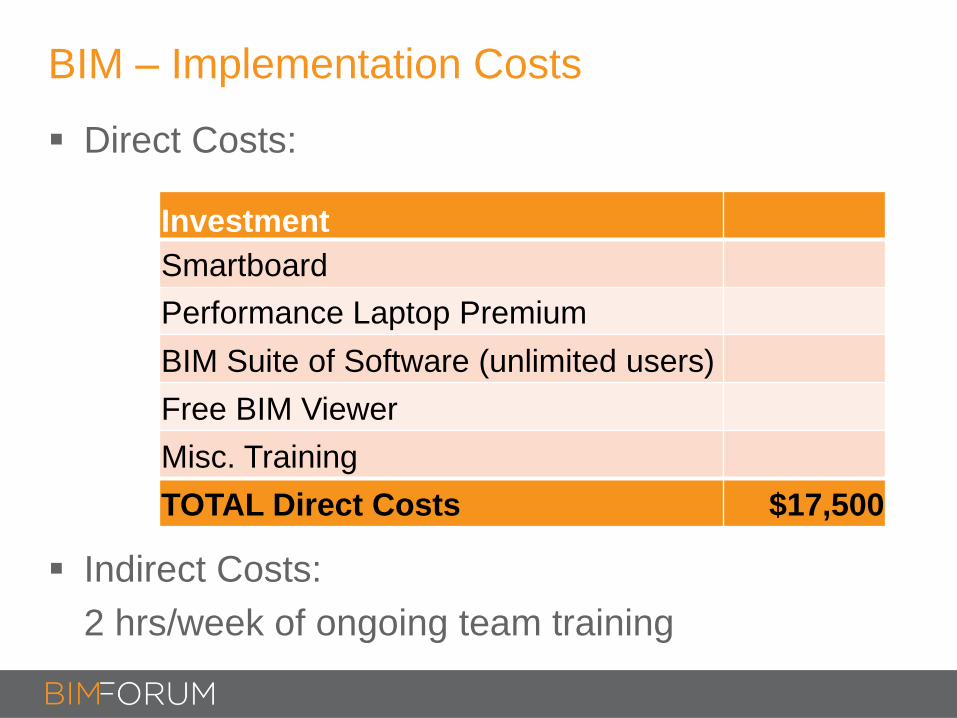
BIM – Implementation Costs
Direct Costs:
Indirect Costs:
2 hrs/week of ongoing team training
Investment
Smartboard
Performance Laptop Premium
BIM Suite of Software (unlimited users)
Free BIM Viewer
Misc. Training
TOTAL Direct Costs $17,500

BIM – Realized Benefits
Pre-Construction Benefits:
3-4 Days saved through model quantity verification
Clash Detection & Coordination Benefits
33% reduction in MEP coordination time
$90K in overall avoided rework
BIM Coordination Savings from Avoided Rework
Trade Cost Savings $40 K
Project Cost / Contingency Savings $50 K
Total Rework Savings $90 K
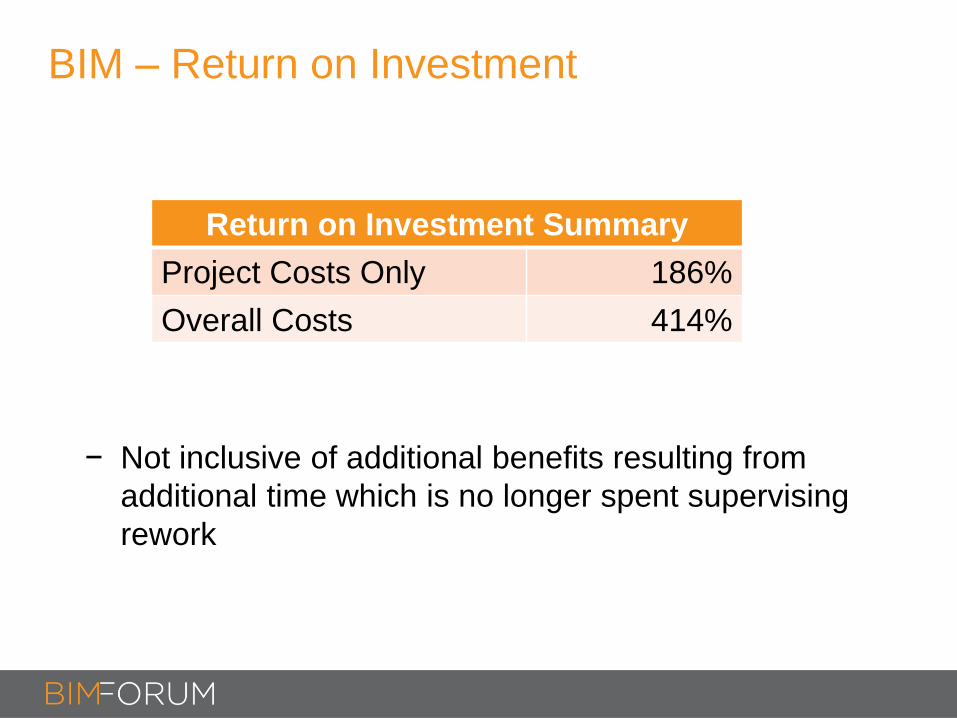
BIM – Return on Investment
Return on Investment Summary
Project Costs Only 186%
Overall Costs 414%
− Not inclusive of additional benefits resulting from
additional time which is no longer spent supervising
rework
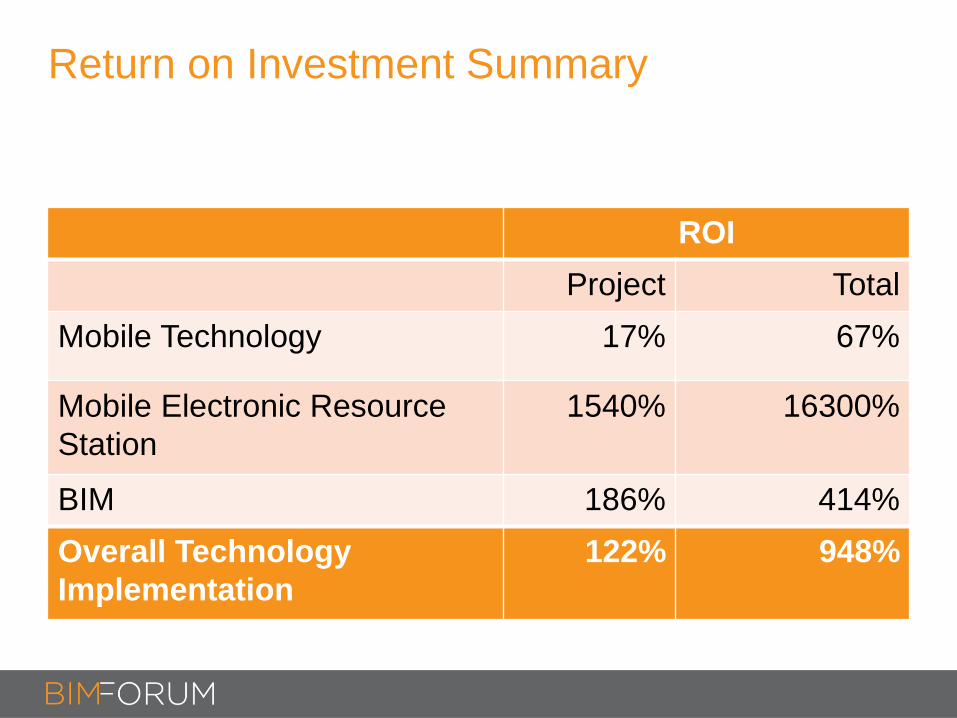
Return on Investment Summary
ROI
Project Total
Mobile Technology 17% 67%
Mobile Electronic Resource
Station
1540% 16300%
BIM 186% 414%
Overall Technology
Implementation
122% 948%
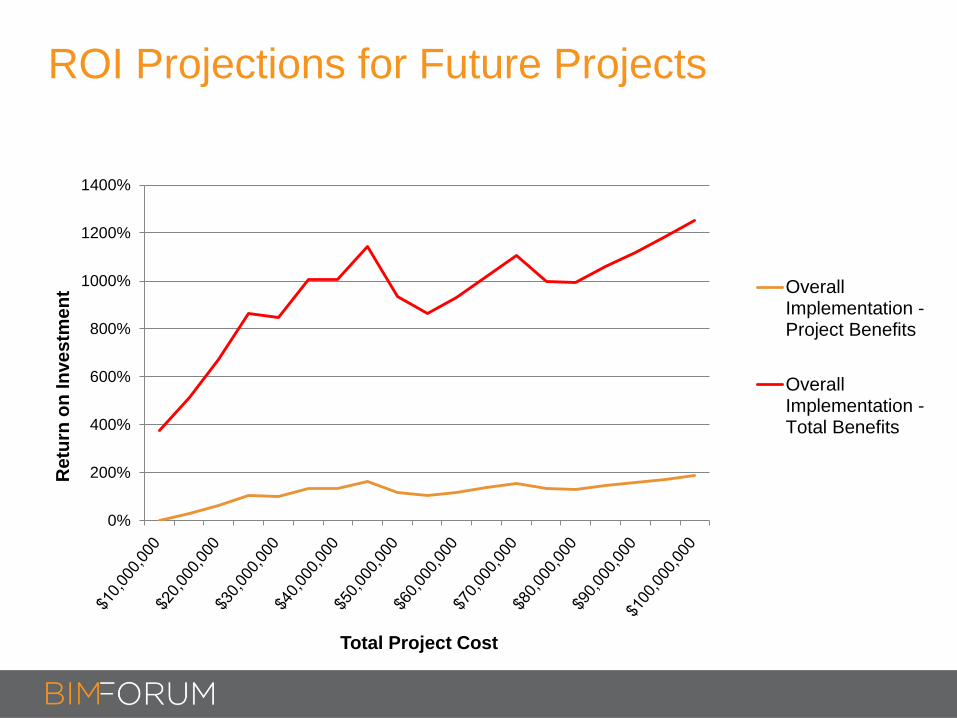
ROI Projections for Future Projects
0%
200%
400%
600%
800%
1000%
1200%
1400%
Re
turn
on
In
ve
stm
en
t
Total Project Cost
OverallImplementation -Project Benefits
OverallImplementation -Total Benefits
Questions
Will Senner
Assistant Project Manager
919-291-1425