BIKE & PED SAFETY IMPROVEMENT STUDY
67
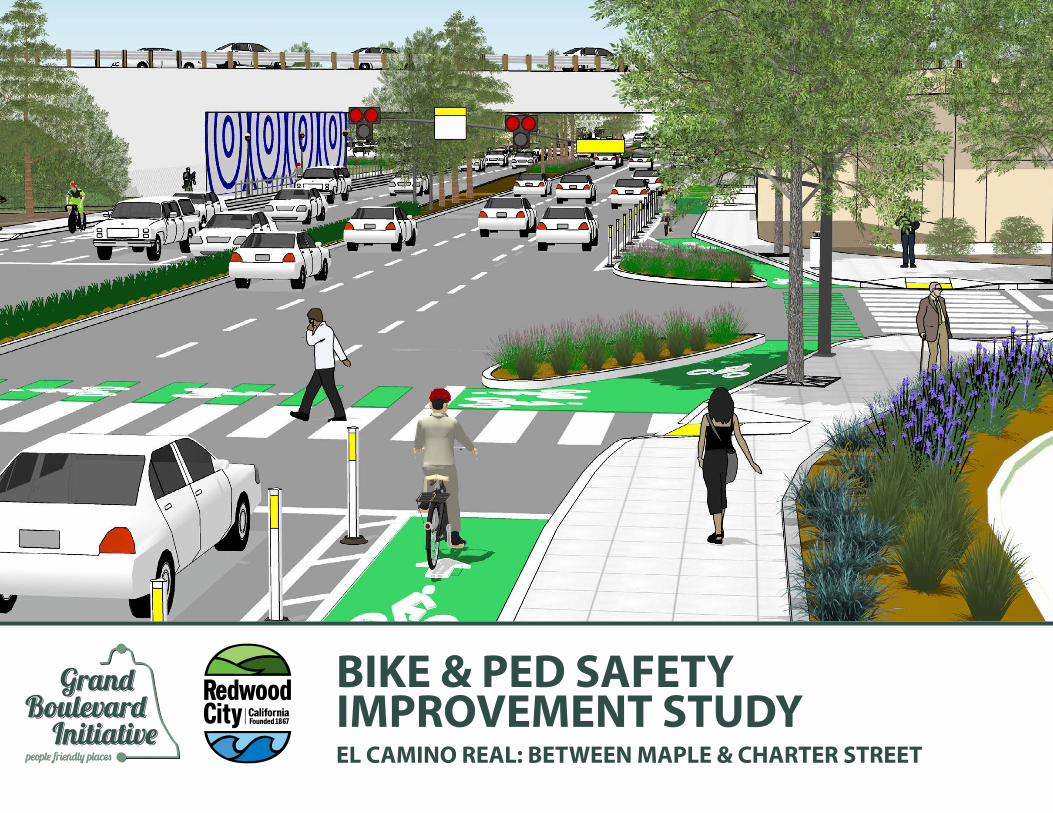
BIKE & PED SAFETY IMPROVEMENT STUDY EL CAMINO REAL: BETWEEN MAPLE & CHARTER STREET
Transcript of BIKE & PED SAFETY IMPROVEMENT STUDY
BIKE & PED SAFETY IMPROVEMENT STUDYEL CAMINO REAL: BETWEEN MAPLE & CHARTER STREET

Inside Cover blank

Table of Contents
Acknowledgments . . . . . . . . . . . . . . . . . . . . . . . . . . . . . . . . . . . . . . . . . iExecutive Summary . . . . . . . . . . . . . . . . . . . . . . . . . . . . . . . . . . . . . . . . 1Introduction . . . . . . . . . . . . . . . . . . . . . . . . . . . . . . . . . . . . . . . . . . . . . . .4Context . . . . . . . . . . . . . . . . . . . . . . . . . . . . . . . . . . . . . . . . . . . . . . . . . . . .7Community Engagement . . . . . . . . . . . . . . . . . . . . . . . . . . . . . . . . . .18Local Vision . . . . . . . . . . . . . . . . . . . . . . . . . . . . . . . . . . . . . . . . . . . . . . .25Next Steps . . . . . . . . . . . . . . . . . . . . . . . . . . . . . . . . . . . . . . . . . . . . . . . .41Appendix . . . . . . . . . . . . . . . . . . . . . . . . . . . . . . . . . . . . . . . . . . . . . . . . .46

Acknowledgments
City CouncilIan Bain - MayorDiane Howard - Vice MayorAlicia C. AguirreJanet BorgensGiselle HaleShelly MasurDiana Reddy
Technical Advisory CommitteeCaltransSamTransSanta Clara Valley Transportation Authority San Mateo County Public HealthCounty of Santa Clara Public HealthCity/County Association of Governments of San Mateo CountyThe City of Redwood CityThe City of Palo Alto
Agency Management TeamDavid Pape, SamTransLindy Chan , City of Redwood City
Consultant TeamFehr & Peers
CD+A
The Bike & Ped Safety Improvement Study was funded by grants provided by the California Department of Transportation (Caltrans). The contents of this report reflect the view of the authors, who are responsible for the facts and accuracy of the data presented herein. The contents do not necessarily reflect the views of Caltrans.
i

ii
This page intentionally left blank

1
EXECUTIVE SUMMARY
Why Study El Camino from Maple Street to Charter Street?The regional Grand Boulevard Initiative, and local plans, including Redwood City’s El Camino Real Corridor Plan and RWCmoves, call for El Camino to be a more vibrant and accessible street, with safe transportation options for all modes.
The stretch of El Camino from Maple to Charter was selected based on the high opportunity for bicycle and pedestrian safety improvements. The bicycle and pedestrian collision rate for the study area is significantly higher with about 2.32 collisions per million vehicle miles as compared to the statewide average of 1.48 for similar roadways.
What are the Study Outcomes?The new concept designs include pedestrian crossing improvements, turn restrictions, and a simplified street grid among other streetscape improvements. Explore the full concept design in the Local Vision Chapter. Additional studies and engineering refinements are needed before these designs are ready for construction.
El Camino Real - Redwood CityMaple Street to Manzanita Street
Figure 5
CONCEPTUAL - NOT FOR CONSTRUCTIONDETAILED ANALYSIS AND ENGINEERING DESIGN REQUIRED
OPPORTUNITY FOR GREEN INFRASTRUCTURE (GI) LOW SHRUBSOR GRASSES
HARDSCAPE AREA
LANDSCAPE MEDIANS:6 FT TO 17 FT USE LOW SHRUBS OR GRASSES17 FT ADD NEW CANOPY TREES
REMOVED CURB
EXISTING CURB
PROPOSED CURB
SAMPLE INTERSECTION TREATMENTS PROPOSED TRAFFIC SIGN
FUTURE DEVELOPMENT AREA
El Camino Real
1
61
2
12
31
1
33
21
42
112 11
X - Number of collisions (2006-2015)
R E DWO O D C I T Y
E L C A M I N O R E A L CO R R I D O R P L A N
Charter St
Maple St
see
page
32
for f
ull c
once
ptua
l des
igns
Roosevelt Ave
Chestnut St
Lathrop St

2
The new cross-section design will replace on street parking with 5- to 7-foot, barrier-protected bike lanes. The travel lanes will also be narrowed slightly to allow for more vegetation in the median and pedestrian refuges at intersections.
What Informed the Design?Design treatments that mitigate common collision factors and align with community visions were revised through an iterative design process. Each set of concept ideas and designs were workshopped with study area stakeholders and community members. Read more about the collision analysis and community engagement activities in the Context Chapter.
Collision Trend Analysis
Community Input
Iterative Design

3
INTRODUCTION

4
INTRODUCTIONEl Camino is a critical arterial that connects communities from Daly City to San Jose. Once the peninsula’s only highway, El Camino retains the auto-oriented character that first emerged in the 1920’s. Today, El Camino functions more like a local arterial than a state highway, but struggles to tie into the community due to the vehicular focus of its land use and streetscape design.
Many cities along the corridor, including Redwood City, desire improved access and safety for all modes along and across El Camino. These cities are supported by the Grand Boulevard Initiative, a collaboration of nineteen cities, two counties, and a number of local and regional agencies united to improve the performance, safety and aesthetics of El Camino. The Vision of the Initiative, adopted in October 2006, is that “El Camino Real will achieve its full potential as a place for residents to work, live, shop and play, creating links between communities that promote walking and transit and an improved quality of life.” In practice, this has prompted a shift to denser and more mixed-use
zoning and land use plans along the corridor, a focus on placemaking and activation of ground-floor retail, and, as with this project, an emphasis on safe, multi-modal streetscape designs.
Two segments of El Camino one in Redwood City and one in Palo Alto, were selected for a streetscape safety study due to their high proportion of bicycle and pedestrian collisions as compared to the statewide average collisions for similar roadways. Between 2006 and 2015, 39 collisions involving bicycles or pedestrians took place on the Redwood City study segment. The aim of the study was to develop conceptual designs that address the collision trends in Redwood City. The solutions proposed for this segment can serve as guidance for other jurisdictions along the corridor that participate in the Grand Boulevard Initiative.
In Redwood City, the safety study is called the Bike and Ped Safety Improvement Study and focuses on the segment between Maple Street and
Charter Street. This study area touches the edge of Downtown Redwood City, but has generally not experienced the same level of economic growth and success in recent years. This study is an opportunity to support existing businesses and residents, improve the experience for all users, and encourage investment along the City’s southern stretch of the El Camino. The study builds off of the City’s approved El Camino Real Corridor Plan (2017) by advancing the Plan’s vision for protected bike lanes on El Camino, safer crossings for people crossing the corridor and removal of dangerous vehicle movements at intersections and driveways. The study segment also provides a distinct opportunity to enhance social equity; the streetscape improvements will encourage more foot traffic to multicultural stores. The study area includes the El Camino (SR 82)/Woodside Road (SR 84) interchange, offering opportunities for safety improvements for pedestrians and bicyclists traveling across the interchange ramps and cross streets that merge with El Camino.

5
Heller St
Center St
Cypress St
Park St
Popl
ar A
ve
Oak
Ave
Red
woo
d A
ve
Madrone St
Locust St
Roos
evel
t Ave
Linden StHemlock A
ve
Pennsylvania Ave
Addison St
Franklin St
Hazel Ave
Dille
r St
Adams St
Monroe St
Northum
berland Ave
Mcenvoy St
Woodrow St
El Camino Real El Camino Real
Charter St
Willow
St
Laurel St
Manzanita St
Hancock St
Shasta St
Shasta St
Buckeye St
Pine St
Chestnut St
Cedar St
Beech St
Main St
Ced
ar S
t
Beec
h StElm
St
Lanthrop St
Maple St
Woodside Rd
Woodside Rd
84
84
82
DOWNTOWN
STAMBAUGH-HELLER REDWOOD VILLAGE
REDWOOD OAKS
PALMUNION
CEMETERY
TARGET CENTER
ROSELLIMINI-PARK
FLEISHMANPARK
Mi RanchoSupermarket
Bed Bath& Beyond
BevMo
REDWOODCITY
EL CAMINO REAL
STUDYAREA
INSET
Study Area
Caltrain Rail Line
As part of the study, data and public input was collected to identify existing conditions and community preferences for the study area. Outreach included three pop-up tabling events (at Fair Oaks Community Center, Target, and BevMo), stakeholder interviews with neighborhood associations, and an online survey (see Community Engagement chapter). The resulting designs were then shared with community members and
Figure 1Study Area
the Redwood City Complete Streets Advisory Committee to collect feedback. Final concepts presented in this report explore options for:
• crosswalk location and design
• protected bike lane configuration
• intersection safety treatments
• specialized pedestrian signals at mid-block locations
• bus stop design, and
• removal of slip lanes near the Woodside interchange.
All of the concepts presented here advance the goals and ideas laid out in the El Camino Real Corridor Plan. Each concept is accompanied by a planning-level cost estimate and funding plan presented in the Next Steps Chapter.
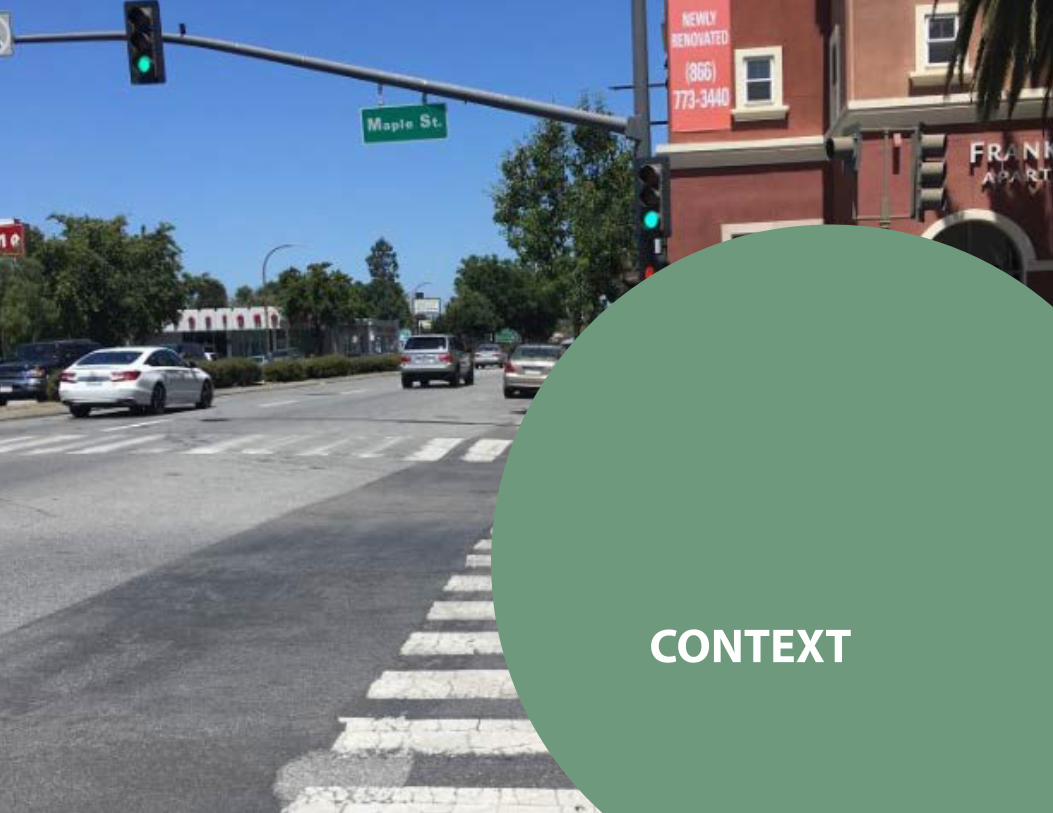
CONTEXT
7
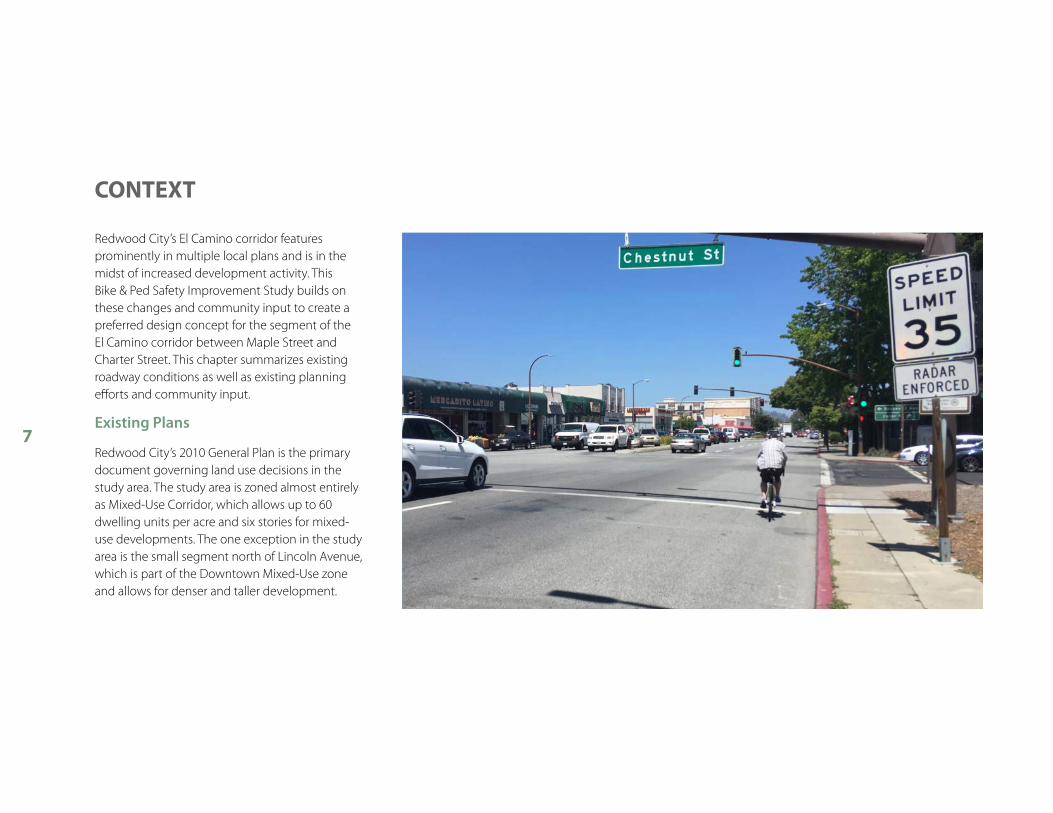
Redwood City’s El Camino corridor features prominently in multiple local plans and is in the midst of increased development activity. This Bike & Ped Safety Improvement Study builds on these changes and community input to create a preferred design concept for the segment of the El Camino corridor between Maple Street and Charter Street. This chapter summarizes existing roadway conditions as well as existing planning efforts and community input.
Existing Plans
Redwood City’s 2010 General Plan is the primary document governing land use decisions in the study area. The study area is zoned almost entirely as Mixed-Use Corridor, which allows up to 60 dwelling units per acre and six stories for mixed-use developments. The one exception in the study area is the small segment north of Lincoln Avenue, which is part of the Downtown Mixed-Use zone and allows for denser and taller development.
CONTEXT

8
Recent planning efforts pertaining to the study area include the RWCmoves Citywide Transportation Plan adopted in July 2018, and the El Camino Real Corridor Plan, approved in December 2017. RWCmoves provides a high-level, citywide assessment of the existing transportation system and proposes goals and possible projects for the future. The Corridor Plan is a policy document that provides a comprehensive land use, transportation, and streetscape approach for El Camino Real within the City’s jurisdiction, including the study area. These proposals are summarized in Figure 2: Summary of El Camino Real Corridor Plan. Some of the proposals, such as protected bike lanes on El Camino, are corridor-wide improvements, while others, such as speeding countermeasures at Woodside Road, are location specific. The land use visions and streetscape concepts proposed in RWCmoves and the Corridor Plan provided a foundation for the design concepts developed as part of this study. High-level concepts, such as the protected bike lanes, were refined and tailored to fit with the particular roadway width and intersection configurations, safety challenges, and observed traffic operations in the Maple Street to Charter Street segment.
El Camino RealEl Camino Real
Woodside Rd
Woodside Rd
Maple Street
Maple Street
Linc
oln
Ave
Linc
oln
Ave
Beec
h St
Beec
h St
Ceda
r St
Ceda
r St
Ches
tnut
St
Ches
tnut
St
Lathrop StLathrop St
Pine
St
Pine
St
Ross
evel
t Ave
Ross
evel
t Ave
Oak
Ave
Oak
Ave
Spruce StSpruce St
Manzanita St
Manzanita St
Laurel StLaurel St
Willow
StW
illow St
Hazel AveHazel Ave
Hemlock Ave
Hemlock Ave
Charter StCharter St
Redw
ood
Ave
Redw
ood
Ave
Add median canopy trees and replace existing small trees
Remove slip lane or right turn lane
Median refuge
Bus shelter
New marked crosswalk across side street
Consider right turn only
Consider removal of signal
Add new signal
Consider redevelopment land as pocket park or plaza
Existing signal
CORRIDOR-WIDE IMPROVEMENTS:
Consider modifications to Woodside Underpass for improved pedestrian access and comfort
CONCEPTS IDENTIFIED IN EL CAMINO REAL CORRIDOR PLAN (Further refined through this study)
New crosswalks based on land use and activity, generally spaced at 600ft
The Corridor Plan identified a series of high-level recommendations that were approved and will be carried forward to this study, illustrated in dark green below. This study will build upon the concepts from the Plan, providing further detail and study as needed.
The purpose of the current Bike and Ped Safety Improvement Study is to lay out the approved improvements and see how they fit, evaluate alternative options for what they might look like, and to take a closer look at the appropriate location for crosswalk enhancements and new crosswalks.
• Sidewalk improvements, including street trees, lighting, bike racks, and clearance zones• Class IV protected bike lanes
Summary of El Camino Corridor Plan (Adopted December 2017)
Figure 2Summary of El Camino Corridor Plan

Who’s Using the Corridor
Figure 3 summarizes land use conditions and community context surrounding the study area. The majority of the study area is defined as a Community of Concern by the Metropolitan Transportation Commission. The definition of Communities of Concern is intended to represent a diverse cross-section of populations and communities that could be considered disadvantaged or vulnerable in terms of both current conditions and potential impacts of future growth. Census tracts are designated as Communities of Concern if more than thirty percent of the households are low-income and more than seventy percent of the households are minority. The Communities of Concern in the study area are majority Hispanic and majority low-income.
Existing Conditions
As a precursor to the El Camino Real Corridor Plan, a series of Existing Conditions Memorandums were published in Fall 2016. Memorandum #1: Land use, Streetscape, and Public Realm and Memorandum #3: Transportation serve as the basis for the following existing conditions discussion. To supplement and summarize the Existing Conditions memorandums, Figure 3: Who’s Using the Corridor and Figure 4: Existing Network were prepared.
Land Use Context
In general, this segment of the corridor is commercial in nature with very few residential or civic land uses fronting El Camino Auto industry businesses are a dominant commercial use and tend to use much of their land for parking or vehicle storage. Although the study area has a stretch of pedestrian-oriented businesses between Roosevelt and Pine, the majority of stores do not have entrances on El Camino and instead provide access from adjacent rear or side parking lots. Most of the buildings in the study area are 1-2 stories, which is below the allowable height limit for the Mixed-Use El Camino Real district. Due to the prevalence of surface parking lots, most parcels are also underutilized given the allowable Floor-Area-Ratio in the district.
There are no open spaces, parks, or schools directly on this segment of El Camino, but Sequoia High School is a few blocks north and several elementary schools are within a half mile of the study area.

10
Heller St
Center St
Cypress St
Park St
Popl
ar A
ve
Oak
Ave
Red
woo
d A
ve
Madrone St
Ver
a A
ve
Locust St
Roos
evel
t Ave
Linden St
Hemlock A
ve
Pennsylvania Ave
Addison St
Franklin St
Hazel Ave
Mad
ison
Ave
Dille
r St
Adams St
Clinton St
Monroe St
Linco
ln A
ve
Northum
berland Ave
Mcenvoy St
Woodrow St
El Camino Real El Camino Real
Charter St
Woodside Rd
Woodside Rd
Willow
St
Laurel St
Manzanita St
Hancock St
Shasta St
Shasta St
Buckeye St
Pine St
Chestnut St
Cedar St
Beech St
Main St
Pine
StChe
stnut
St
Ced
ar S
t
Beec
h St
Elm S
t
Lanthrop St
Maple St
84
84
82
DOWNTOWN
STAMBAUGH-HELLER
REDWOOD VILLAGE
REDWOOD OAKS
PALM
CENTRAL
UNIONCEMETERY
TARGET CENTER
ROSELLIMINI-PARK
FLEISHMANPARK
MI RANCHOSUPERMARKET
BED BATH& BEYOND
BEVMO
LINDENPARK
MAIN STREET DOG AGILITY
PARK
Mixed-Use Neighborhood
Zoning
Mixed-Use El Camino Real
Mixed-Use Live-Work
Industrial Park
Industry Restricted
Downtown Precise Plan
Public Facility
Professional Office
Residential 3
Residential 4
Commercial-General-Residential
Hetch-Hetchy
Study Area
Communities of Concern (MTC 2017)
Caltrain Rail Line
To Sequoia High School 0.4 miles
To North Star Academy, McKinley Intermediate, Redeemer Lutheran Elementary & Our Lady of Mt. Carmel Elementary0.4 miles To Hawes Elementary
0.5 miles
To Hoover Elementary0.5 miles
Who’s Using the CorridorFigure 1
Figure 3Land Use and Neighborhood Context

11
Very few enhanced pedestrian amenities exist within the study area and the width and quality of sidewalks are inadequate to comfortably carry pedestrians from one end of the corridor to the other. Maple Street is designated as a pedestrian street in the General Plan, but under present conditions offers similar pedestrian amenities as the rest of the corridor. There is a higher visibility, striped crosswalk across El Camino at the Maple Street intersection, while all other crosswalks use a standard design (without striping).
Although not unique to the study area, the street grid is offset or skewed at the majority of intersections between Maple Street and Charter Street. This pattern creates connectivity challenges for all modes trying to cross El Camino, and creates a barrier between east and west Redwood City. Several realignment options have been discussed as part of the El Camino Real Corridor Plan and are included as part of this study.
The Woodside Road overpass sits in the middle of the longest gap between crosswalks for pedestrians trying to cross El Camino in Redwood City; a 1,665 feet gap between Oak Avenue and
Existing Transportation Network
The study area largely mirrors the transportation characteristics found along the rest of El Camino in Redwood City (see Appendix). The Woodside Road overpass is one major exception and the full cloverleaf design impacts approximately 850 feet of El Camino frontage. Woodside Road (SR-84) is a four-lane, east-west boulevard that connects Redwood City to US-101 and I-280. The Woodside Road and El Camino interchange presents a significant barrier for pedestrian travel and has historically experienced worse delays, collision rates, and queuing than other sections of El Camino in Redwood City.
Most Redwood City El Camino intersections operate at LOS D or better, with the exception of the El Camino/Laurel Street and El Camino/Hazel Avenue intersections, which operate at LOS F in both the AM and PM peak hours. El Camino intersections at Roosevelt Avenue, Oak Avenue, Hazel Avenue, and Laurel Street all experience higher than statewide average collision rates. The majority of the vehicle-to-vehicle collisions are rear-end collisions.
Charter Street. Existing crosswalks are between 75 and 90 feet long across El Camino without any pedestrian refuges. The right-turn lanes at Main, Redwood, Laurel, and Hazel present additional crossing challenges for pedestrians walking along El Camino under the overpass, as do narrow sidewalks throughout much of the study area.
Collision Analysis
An analysis of pedestrian collisions revealed that in the ten year period 2006-2015, 14 pedestrian-involved collisions occurred on the study corridor. Factors contributing to many collisions include drivers running red lights, drivers failing to yield when pedestrians have the right of way, poor sight lines for drivers, aggressive merges onto El Camino from side streets, and complex intersection geometries. A summary of these incidents is shown in the Pedestrian Collision Profiles.

12
Woodside Rd
El Camino Real
Northum
berland Ave
Maple St
Laurel St
Center S
t
Chestnut St
Oak
Ave
Madrone St
Park S
t
Vera
Ave
Red
woo
d A
ve
Pop
lar
Ave
Roo
seve
lt A
ve
Shasta St
Ced
ar S
t
Heller St
Lathrop St
Linden St
Pine S
t
Pennsylvania Ave
Main St
Franklin St
Elm
St
Bee
ch S
t
Charter St
Hazel A
ve
Willow
St
Manzanita St
Hem
lock Ave
Dill
er S
t
Adams St
Clinton St
Mad
ison
Ave
Linc
oln
Ave
Pedestrian Collision Profiles
What Do We Know about These Collisions?
The Most Common Pedestrian Collision Profiles on El Camino Are:
Fewer(0)
More(2)
Collision Intensity
Crosswalk
Raised median
Signalized intersection
Points on the Map
Stop Sign
Pedestrian-involved collisions along theEl Camino Real corridor
Collision Type
14Total collisions
Note: Percentages do not add up to 100% due to overlapping collision types
14%Red light violation
14%Pedestrians in road
14%Exiting side streets
21%At complex intersections
50%At marked crosswalks
Collisions that occur in marked crosswalks are often the result of red light violations by a vehicle or pedestrian. Permitted turns (either left or right), which conflict with pedestrian walk signals, and inadequate pedestrian crossing times are possible causes of collisions at signalized intersections. Potential countermeasures include: • giving pedestrians a “head start” for their walk signal (called a leading pedestrian interval) • increasing pedestrian crossing time • installing pedestrian median refuges • restricting right turns on red • implementing a protected left-turn phase for vehicles
In the ten year period 2006-2015, 14 pedestrian-involved collisions occurred within the study corridor. Major collision trends include red light violations and permitted turns at signalized intersections, sight lines and gaps in traffic for vehicles entering El Camino Real, and complex intersection geometries.
Offset intersections along the corridor result in long and sometimes unclear crossings with multiple conflict points between vehicles and pedestrians. Intersection geometries such as right turn slip lanes and skewed approaches allow vehicles to enter/exit El Camino at a high speed. Potential countermeasures include: • consolidating access to side streets and driveways at signalized intersections, to reduce the number of conflict points to fewer, controlled locations • redesigning intersection approaches to encourage slower vehicle turning speeds and improved pedestrian visibility
Pedestrians may walk in the roadway when there are sidewalk gaps or in the event that they need to access on-street parking. Potential countermeasures include: • closing sidewalk gaps adjacent to El Camino (such as along both sides of Maple Street) to ensure pedestrian access remains continuous • implementing traffic calming through visual cues and reduced lane widths • increasing parking lane widths or removing on-street parking
These collisions occur when a vehicle enters El Camino Real from a side street and does not yield to a pedestrian. Obscured sight lines for vehicles turning off of side streets, limited gaps in traffic on El Camino, and high vehicle speeds all increase the likelihood of this collision type. Potential countermeasures include: • daylighting (removing one parking space before and after an intersection) to improve sight lines • installing signals at stop-controlled side streets with limited gaps in traffic to provide better access for both vehicles and pedestrians
Crosswalks Violations at Signals Complex Intersections
Exiting Side Streets Pedestrians in Road
Source: SWITRS, 2006 – 2015
Figure 4Pedestrian Collision Profiles

13
Woodside Rd
El Camino Real
Northum
berland Ave
Maple St
Laurel St
Center S
t
Chestnut St
Oak
Ave
Madrone St
Park S
t
Vera
Ave
Red
woo
d A
ve
Pop
lar
Ave
Roo
seve
lt A
ve
Shasta St
Ced
ar S
t
Heller St
Lathrop St
Linden St
Pine S
t
Pennsylvania Ave
Main St
Franklin St
Elm
St
Bee
ch S
t
Charter St
Hazel A
ve
Willow
St
Manzanita St
Hem
lock Ave
Dill
er S
t
Adams St
Clinton St
Mad
ison
Ave
Linc
oln
Ave
Pedestrian Collision Profiles
What Do We Know about These Collisions?
The Most Common Pedestrian Collision Profiles on El Camino Are:
Fewer(0)
More(2)
Collision Intensity
Crosswalk
Raised median
Signalized intersection
Points on the Map
Stop Sign
Pedestrian-involved collisions along theEl Camino Real corridor
Collision Type
14Total collisions
Note: Percentages do not add up to 100% due to overlapping collision types
14%Red light violation
14%Pedestrians in road
14%Exiting side streets
21%At complex intersections
50%At marked crosswalks
Collisions that occur in marked crosswalks are often the result of red light violations by a vehicle or pedestrian. Permitted turns (either left or right), which conflict with pedestrian walk signals, and inadequate pedestrian crossing times are possible causes of collisions at signalized intersections. Potential countermeasures include: • giving pedestrians a “head start” for their walk signal (called a leading pedestrian interval) • increasing pedestrian crossing time • installing pedestrian median refuges • restricting right turns on red • implementing a protected left-turn phase for vehicles
In the ten year period 2006-2015, 14 pedestrian-involved collisions occurred within the study corridor. Major collision trends include red light violations and permitted turns at signalized intersections, sight lines and gaps in traffic for vehicles entering El Camino Real, and complex intersection geometries.
Offset intersections along the corridor result in long and sometimes unclear crossings with multiple conflict points between vehicles and pedestrians. Intersection geometries such as right turn slip lanes and skewed approaches allow vehicles to enter/exit El Camino at a high speed. Potential countermeasures include: • consolidating access to side streets and driveways at signalized intersections, to reduce the number of conflict points to fewer, controlled locations • redesigning intersection approaches to encourage slower vehicle turning speeds and improved pedestrian visibility
Pedestrians may walk in the roadway when there are sidewalk gaps or in the event that they need to access on-street parking. Potential countermeasures include: • closing sidewalk gaps adjacent to El Camino (such as along both sides of Maple Street) to ensure pedestrian access remains continuous • implementing traffic calming through visual cues and reduced lane widths • increasing parking lane widths or removing on-street parking
These collisions occur when a vehicle enters El Camino Real from a side street and does not yield to a pedestrian. Obscured sight lines for vehicles turning off of side streets, limited gaps in traffic on El Camino, and high vehicle speeds all increase the likelihood of this collision type. Potential countermeasures include: • daylighting (removing one parking space before and after an intersection) to improve sight lines • installing signals at stop-controlled side streets with limited gaps in traffic to provide better access for both vehicles and pedestrians
Crosswalks Violations at Signals Complex Intersections
Exiting Side Streets Pedestrians in Road
Source: SWITRS, 2006 – 2015

14
Woodside Rd
El Camino RealN
orthumberland A
ve
Maple St
Laurel St
Center S
t
Chestnut St
Oak
Ave
Madrone St
Park S
t
Vera
Ave
Red
woo
d A
ve
Pop
lar
Ave
Roo
seve
lt A
ve
Shasta St
Ced
ar S
t
Heller St
Lathrop St
Linden St
Pine S
t
Pennsylvania Ave
Main St
Franklin St
Elm
St
Bee
ch S
t
Charter St
Hazel A
ve
Willow
St
Manzanita St
Hem
lock Ave
Dill
er S
t
Adams St
Clinton St
Mad
ison
Ave
Linc
oln
Ave
Bicycle Collision Profiles
What Do We Know about These Collisions?
Fewer(0)
More(6)
Collision Intensity
Points on the Map
Bicycle-involved collisions along theEl Camino Real corridor
Collision Type
In the ten year period 2006-2015, 25 bicyclist-involved collisions occurred on El Camino Real between Maple and Charter streets. These collisions are explained by a mix of factors, which indicates that many different elements on the corridor influence bicycle safety. Some of those elements include red light violations and permitted turns at signalized intersections, numerous conflict points at side streets and driveways, and complex intersection geometries.
Source: SWITRS, 2006 – 2015
Raised median
Signalized intersection
Stop Sign
25Total collisions
Note: Percentages do not add up to 100% due to overlapping collision types
40%Other factors• High traffic speed• and shared travel lane• Right hook• Wrong way bicycling
12%At complex intersections
16%Full access unsignalizedintersections
20%Exiting side streetsand driveways
28%Broadside at signal
The Most Common Bicycle Collision Profiles on El Camino Are:
Broadside collisions occur when the front of an auto collides with the side of a bicyclist. These typically occur when either a vehicle or a bicyclist fails to observe the red light or yield on a signalized turn. Potential countermeasures include: • updating signal timing to lengthen red time • updating signal timing to separate bicyclist and vehicle turning movements • adding bicycle visibility treatments at intersections, such as green paint
These collisions occur when a vehicle enters El Camino from a side street or driveway, and fails to yield to a bicyclist. Unclear sight lines at side streets, limited gaps in traffic for vehicles exiting a side street or driveway, and high vehicle speeds all increase the likelihood for this collision type. Potential countermeasures include: • daylighting (removing one parking space before and after an intersection or driveway) to improve sight lines • adding green paint across side streets and driveways to improve visibility of bicyclists • implementing traffic calming at intersections to reduce speeds
The mix of issues observed on the corridor reflect the complexity of navigating El Camino as a bicyclist. Other collision factors observed include: • complex intersections where side streets are skewed or intersect at an offset • “right hooks” when a driver is traveling in the same direction as a bicyclist and turns right across the rider’s path • wrong way bicycling • high traffic speeds while bicyclists and vehicles share the same lane • parking-related issues
These collisions occur when a vehicle makes either a left turn into a side street or cuts across El Camino in a location where there is no center median. Limited gaps in traffic at intersections and high vehicle speeds on El Camino increase the likelihood of this collision type. Potential countermeasures include: • restricting side street access (e.g. installing medians) at these locations • adding a new signal at these locations
Broadside at Signal Exiting Side Streets and Driveways
Full Access Unsignalized Intersections Other Factors
Figure 5Bicycle Collision Profiles

15
Woodside Rd
El Camino Real
Northum
berland Ave
Maple St
Laurel St
Center S
t
Chestnut St
Oak
Ave
Madrone St
Park S
t
Vera
Ave
Red
woo
d A
ve
Pop
lar
Ave
Roo
seve
lt A
ve
Shasta St
Ced
ar S
t
Heller St
Lathrop St
Linden St
Pine S
t
Pennsylvania Ave
Main St
Franklin St
Elm
St
Bee
ch S
t
Charter St
Hazel A
ve
Willow
St
Manzanita St
Hem
lock Ave
Dill
er S
t
Adams St
Clinton St
Mad
ison
Ave
Linc
oln
Ave
Bicycle Collision Profiles
What Do We Know about These Collisions?
Fewer(0)
More(6)
Collision Intensity
Points on the Map
Bicycle-involved collisions along theEl Camino Real corridor
Collision Type
In the ten year period 2006-2015, 25 bicyclist-involved collisions occurred on El Camino Real between Maple and Charter streets. These collisions are explained by a mix of factors, which indicates that many different elements on the corridor influence bicycle safety. Some of those elements include red light violations and permitted turns at signalized intersections, numerous conflict points at side streets and driveways, and complex intersection geometries.
Source: SWITRS, 2006 – 2015
Raised median
Signalized intersection
Stop Sign
25Total collisions
Note: Percentages do not add up to 100% due to overlapping collision types
40%Other factors• High traffic speed• and shared travel lane• Right hook• Wrong way bicycling
12%At complex intersections
16%Full access unsignalizedintersections
20%Exiting side streetsand driveways
28%Broadside at signal
The Most Common Bicycle Collision Profiles on El Camino Are:
Broadside collisions occur when the front of an auto collides with the side of a bicyclist. These typically occur when either a vehicle or a bicyclist fails to observe the red light or yield on a signalized turn. Potential countermeasures include: • updating signal timing to lengthen red time • updating signal timing to separate bicyclist and vehicle turning movements • adding bicycle visibility treatments at intersections, such as green paint
These collisions occur when a vehicle enters El Camino from a side street or driveway, and fails to yield to a bicyclist. Unclear sight lines at side streets, limited gaps in traffic for vehicles exiting a side street or driveway, and high vehicle speeds all increase the likelihood for this collision type. Potential countermeasures include: • daylighting (removing one parking space before and after an intersection or driveway) to improve sight lines • adding green paint across side streets and driveways to improve visibility of bicyclists • implementing traffic calming at intersections to reduce speeds
The mix of issues observed on the corridor reflect the complexity of navigating El Camino as a bicyclist. Other collision factors observed include: • complex intersections where side streets are skewed or intersect at an offset • “right hooks” when a driver is traveling in the same direction as a bicyclist and turns right across the rider’s path • wrong way bicycling • high traffic speeds while bicyclists and vehicles share the same lane • parking-related issues
These collisions occur when a vehicle makes either a left turn into a side street or cuts across El Camino in a location where there is no center median. Limited gaps in traffic at intersections and high vehicle speeds on El Camino increase the likelihood of this collision type. Potential countermeasures include: • restricting side street access (e.g. installing medians) at these locations • adding a new signal at these locations
Broadside at Signal Exiting Side Streets and Driveways
Full Access Unsignalized Intersections Other Factors

16
There are no dedicated bicycle lanes on El Camino and only a few provided on cross streets in the study area. These routes include a Class II bike lane on Maple Street from El Camino to Main Street (0.2 miles) and Class III sharrows on Roosevelt Avenue from Ruby to El Camino (1.1 miles). In general, the cross streets in this area experience low to moderate bicycle volumes.
An analysis of bicycle collisions revealed that in the ten year period 2006-2015, 25 bicyclist-involved collisions occurred on El Camino between Maple and Charter streets. These collisions are explained by a mix of factors, which indicates that many different elements on the corridor influence bicycle safety. Some of the most common factors include drivers running red lights, drivers failing to yield when pedestrians have the right of way, conflicts at side street intersections, and complex intersection geometries. A summary of these incidents is shown in the Bicycle Collision Profiles.
Transit Operations
Buses operate in mixed-traffic in the study area, the same way as throughout all of Redwood City. Northbound bus stops are located at Redwood Avenue and Cedar Street and southbound bus stops are located at Lincoln Avenue and Oak Avenue.

17
COMMUNITY ENGAGEMENT

18
Key elements of the engagement plan included:
Pop-up Events
Three “pop-up” workshops were hosted at community venues during Round 1:
1. Target: Saturday, March 17
2. BevMo: Wednesday, March 28
3. Fair Oaks Community Center: Friday, April 13
Large-format maps and storyboards allowed participants to explore the study area, describe their experiences, and identify issues and possible solutions at a zoomed-in scale. Participants were asked to vote on alternative cross-sections, bus
From the start, the Bike and Ped Safety Improvement Study aimed to be a collaborative planning effort that resulted in an actionable, community-based design. The Study team implemented a 9-month public engagement program with innovative techniques that allowed the project team to work with key stakeholders and crowdsource the lived experience of community members who use the corridor on a regular basis. Two rounds of concentrated in-person outreach bookended the study. Round 1 was hosted in March and April 2018 and sought feedback on early concepts. Round 2 was hosted in October 2018 and presented full draft concepts to both focused stakeholder groups and the general public.
stop amenities, preferred open space designs, and underpass safety treatments. A fourth interactive board asked attendees to mark-up a map of the study area with their most frequent destinations and their desired routes along or across El Camino.
Hosting these events as pop-ups allowed the outreach team to meet community members in a place that was convenient and comfortable for the participants. The conversations happened during their regular errands within or adjacent to the study corridor, which helped facilitate conversation and prompt ideas. Round 1 pop-up activities were attended by a combined total of approximately 75 people.
COMMUNITY ENGAGEMENT

19
Where Do You Want to Cross El Camino Real?
Which Bus Stop Amenities Would You Like to See?
What Should the Separated Bikeways Look and Feel Like?
What Improvements Would You Like To See at Opportunity Areas and Underutilized Spaces
What are your important Destinations?
Near Main Street: Near Woodside Underpass:
Option 1: Wide median + minimum bikeway dimensions
Option 2: Mid-sized median + preferred bikeway dimensions
Option 3: Narrow median + wide bikeway dimensions with landscaping/art opportunities
49%
28%
28%Landscape Green Infrastructure
Urban Plaza
Pocket Park
22%
41%
37%
Low Cost: Barrier from Vehicles
Medium Cost:Improved Lighting
High Cost:
Open Up Space (with public art component)
14%Downtown Redwood City
6%BevMo
16%Target Center
8%Mi Rancho Supermarket
6%Bed, Bath & Beyond
49%Other
14%Maple Street
19%Roosevelt Ave
10%Charter St
10%Oak Ave
10%Redwood/Main St
38%Other
33% 25% 22% 21%Bus Stop Shelter Benches
Real-TimeArrival Info
Pedestrian-Scale Lighting
Opt
ion
3Option 1
Option 2 49%
18%33
%
20
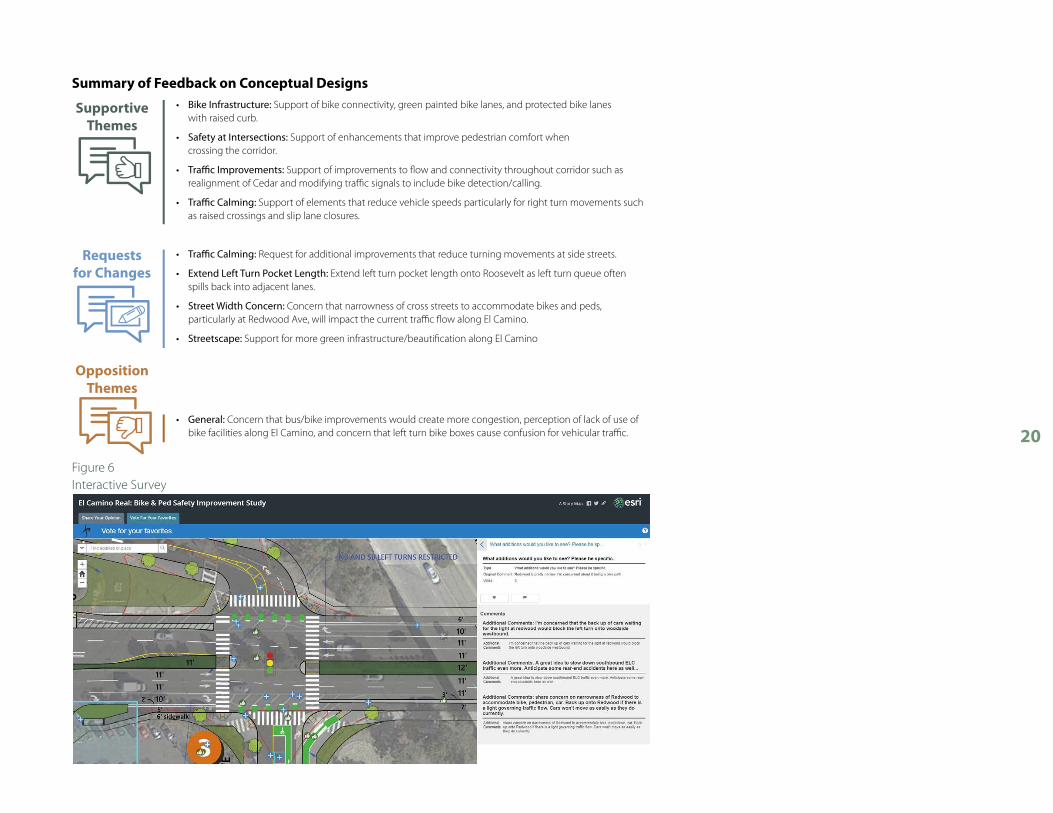
Supportive Themes
Requests for Changes
Opposition Themes
• Bike Infrastructure: Support of bike connectivity, green painted bike lanes, and protected bike lanes with raised curb.
• Safety at Intersections: Support of enhancements that improve pedestrian comfort when crossing the corridor.
• Traffic Improvements: Support of improvements to flow and connectivity throughout corridor such as realignment of Cedar and modifying traffic signals to include bike detection/calling.
• Traffic Calming: Support of elements that reduce vehicle speeds particularly for right turn movements such as raised crossings and slip lane closures.
Summary of Feedback on Conceptual Designs
• Traffic Calming: Request for additional improvements that reduce turning movements at side streets.
• Extend Left Turn Pocket Length: Extend left turn pocket length onto Roosevelt as left turn queue often spills back into adjacent lanes.
• Street Width Concern: Concern that narrowness of cross streets to accommodate bikes and peds, particularly at Redwood Ave, will impact the current traffic flow along El Camino.
• Streetscape: Support for more green infrastructure/beautification along El Camino
• General: Concern that bus/bike improvements would create more congestion, perception of lack of use of bike facilities along El Camino, and concern that left turn bike boxes cause confusion for vehicular traffic.
Figure 6Interactive Survey
21
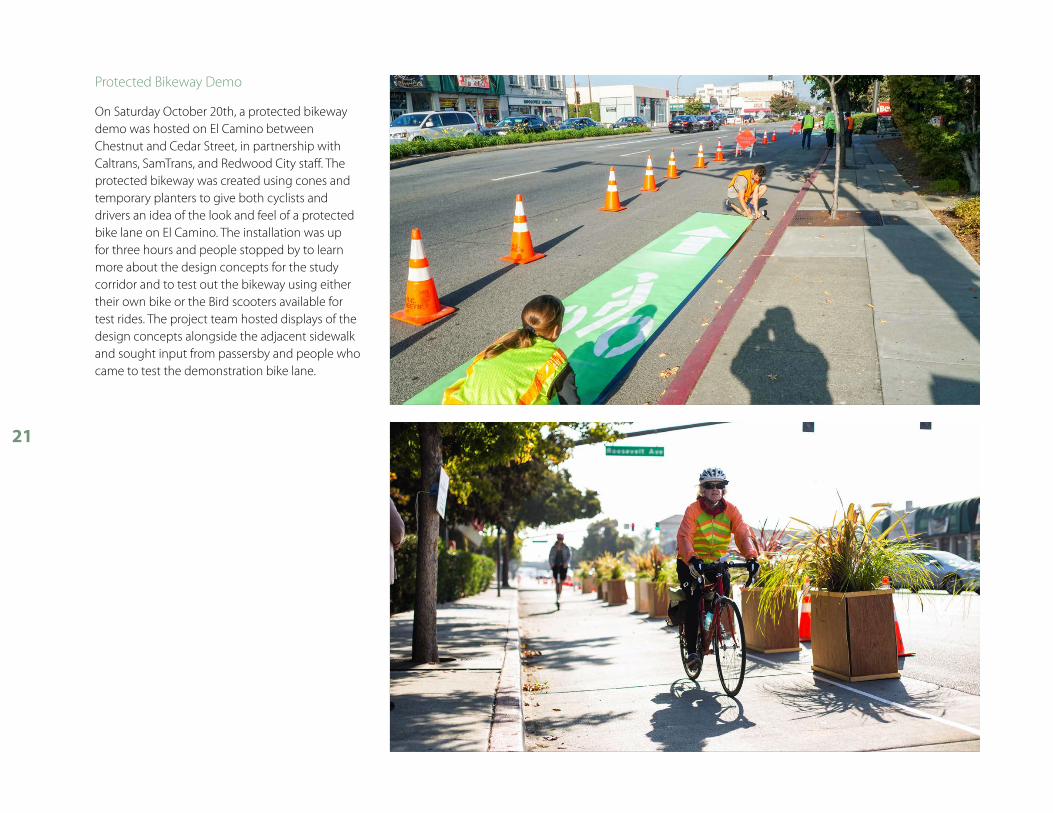
Protected Bikeway Demo
On Saturday October 20th, a protected bikeway demo was hosted on El Camino between Chestnut and Cedar Street, in partnership with Caltrans, SamTrans, and Redwood City staff. The protected bikeway was created using cones and temporary planters to give both cyclists and drivers an idea of the look and feel of a protected bike lane on El Camino. The installation was up for three hours and people stopped by to learn more about the design concepts for the study corridor and to test out the bikeway using either their own bike or the Bird scooters available for test rides. The project team hosted displays of the design concepts alongside the adjacent sidewalk and sought input from passersby and people who came to test the demonstration bike lane.

22
Online Engagement
The team developed an online interactive survey tool using the same materials from the pop-up workshops to bring the experience of the in-person workshops online. People could view the large-format poster boards online and record their preferences on potential needs and improvements, such as desired routes, gaps and barriers; important destinations; the preferred look and feel of the protected bike lanes; and other design preferences. This tool was open between late-March and early-May 2018 to coincide with the first round of outreach. Over 100 comments were collected through the online project survey.
The survey was linked through the City’s project web page, which also included project status updates and a Frequently Asked Questions (FAQs) document that was created to address comments and questions that emerged during the course of study.
Stakeholder Engagement
Gathering input from stakeholders unique to the El Camino corridor was key to achieving a cohesive vision for the study corridor. Stakeholders included agencies involved with the Grand Boulevard Initiative as well as the Complete Streets Advisory Committee in Redwood City.
Neighborhood Roundtable Discussion
As part of the first round of public outreach, a roundtable discussion was hosted at City Hall with representatives from the neighborhood associations adjacent to the study segment on the evening of Thursday, March 29th. Neighborhoods of Central, Palm, Redwood Oaks, Stambaugh-Heller, Redwood Village, Downtown, and Roosevelt
were invited to attend. The discussion included an update on past efforts such as the El Camino Real Corridor Plan, progress on the current safety study, as well as information on how to provide additional input on the study. Attendees were invited to share input on general issues and opportunities and specific topics used at the pop-up events; they were encouraged to provide any additional input through an online survey and to spread the word to the rest of their neighborhood association.
Highlights from the input shared from the group include:
General issues/opportunities
• Visibility at intersections is challenging due to above-ground utility boxes
• While bicycle and pedestrian volumes are perceived to be lower on this segment compared to El Camino to the north, improvements within the study segment are needed since drivers may not expect as many bikes and pedestrians to be present
• Include coordination with existing signals if pedestrian hybrid beacons are installed; there’s a concern they will impact vehicle delay
Maple Street intersection:
• The pedestrian signal at Maple Street is a long wait, which is believed to cause people to cross at Lincoln instead
Laurel Street / Hazel Avenue:
• The westbound right at Laurel St is a congested movement for vehicles (heading north on El Camino)
• The set-back crosswalk at Hazel Avenue (on westbound slip lane) is a safety concern; This crosswalk is perceived to have more pedestrians than Laurel Street.
Woodside Underpass:
• Improved lighting perceived to be bare minimum needed to feel comfortable walking here

23
The Technical Advisory Committee convened four times throughout the project for collaboration on the process and input on relevant deliverables.
• Meeting 1: Kick-Off Meeting, June 2017 (Purpose: Confirm goals, data collection needs, and review project scope and schedule)
• Meeting 2: Performance Measures and Virtual Walk Audits, December 2017 (Purpose: Share corridor summary graphics, review initial draft performance measures, and identify specific issues and concerns on the study corridor via Google aerials and street view)
• Meeting 3: Revised Performance Measure Matrix, Outreach Debrief and Initial Draft Concepts, May 2018 (Purpose: Share and review summary of feedback from community outreach, resulting initial design concepts, and revised performance measure matrix)
• Meeting 4: Draft Report Review, November 2018 (Purpose: Review and discuss comments on draft report)
Technical Advisory Committee
A Technical Advisory Committee (TAC) was assembled at the beginning of the grant timeline to guide the process and provide feedback on key deliverables for both case study cities. Project partners on the TAC were included from both the San Mateo County region and the Santa Clara County region such that each city could learn from each other throughout the parallel processes. The following agencies were represented on the TAC:
• Caltrans
• SamTrans
• Santa Clara Valley Transportation Authority
• San Mateo County Public Health
• County of Santa Clara Public Health
• City/County Association of Governments of San Mateo County
• The City of Redwood City
• The City of Palo Alto
Complete Streets Advisory Committee
Draft design concepts were shared and reviewed with the Redwood City Complete Streets Advisory Committee on August 14th 2018, prior to the final round of outreach to evaluate design options at intersections and bus stops. Feedback was focused on choosing a preferred layout for accommodating protected bike lanes at bus stops and the preferred application of safety treatments at intersections to address right turn conflicts along the protected bikeway. The design feedback was used to refine the design concepts before sharing with the public for feedback during the final stage of outreach
Caltrans Design Review
As a state-owned facility, improvements on El Camino will require final approval from Caltrans. The design concepts in the next section were reviewed by Caltrans for consistency with the agency’s goals and general design guidelines. A design review meeting was held on October 5th 2018 with key reviewers from the agency to discuss the process for implementation, including focus areas for future study. More detail on specific areas of study is included in the Next Steps section.

24
LOCAL VISION

25
The adopted El Camino Real Corridor Plan calls for multi-modal improvements on El Camino within City limits (generally between F Street and Oakwood Drive). This Bike & Ped Safety Improvement Study builds off those concepts between Maple Street and Charter Street, which includes a protected bikeway through parking removal, crosswalk safety improvements at intersections and potential new crossings, and enhanced opportunities for public spaces and landscaping. The refined vision includes details of how these concepts would fit within the street cross-section, complementary safety improvements at intersections, and detailed bus stop layouts to develop a cohesive set of conceptual drawings for the corridor.
Plans presented in this memo are conceptual in nature; further work is required before the improvements are implemented, which is considered a long-term action. It is important to note that the removal of parking, for example, will require the development of a parking management program prior to removing on-street parking on El Camino.
For context, the existing cross-section for the segment of the corridor between Maple Street and Redwood Avenue is shown on the top right.
Between Maple and Redwood Avenue, where the removal of on-street parking provides additional width, protected bike lanes and crosswalk improvements would be laid out as shown in the figure at bottom right.
Figure 7Existing: Maple Street to Redwood Avenue
Figure 8 Proposed: Maple Street to Redwood Avenue
17’ median with canopy trees midblock
LOCAL VISION

26
On the two block segment between Redwood Avenue and Charter Streets, site constraints such as an additional travel lane and a left turn lane would require reduced urban lane widths of ten feet and a reduction in the sidewalk width for one block in order to accommodate protected bike lanes, as shown in the figures below. The preferred cross-sections reflect an 84 feet curb-to-curb width.
Figure 9Existing: Redwood Avenue to Willow Street
Figure 10Proposed: Redwood Avenue to Willow Street

27
Figure 11Existing: Willow Street to Charter Street
Figure 12Proposed: Willow Street to Charter Street
sidewalk width reduced by 1’ to accommodate
protected bikeway; existing width 8’
sidewalk width reduced by 1’ to accommodate
protected bikeway; existing width 8’

Figure 13 3D Renderings El Camino Real & Lathrop Street - Proposed Concept
The design concepts and renderings presented on the following pages include all proposed treatments along the study corridor. This includes ideas recommended from the Corridor Plan, additional opportunities for green infrastructure, safety countermeasures identified to address collision trends, intersection treatments and bus stop layouts reviewed by the Complete Streets Advisory Committee, and crosswalk enhancements at community-identified priority locations.

29
El Camino Real & Main Street/Redwood Avenue - Existing Conditions
El Camino Real & Main Street/Redwood Avenue - Proposed Concept

30
El Camino Real & Laurel Street looking northbound - Existing Conditions
El Camino Real & Laurel Street looking northbound - Proposed Concept
Opportunity for public art and improved lighting

31
El Camino Real & Oak Avenue looking southbound - Existing Conditions
El Camino Real & Oak Avenue looking southbound - Proposed Concept

32
Figure 14Conceptual Designs
1 32 24Shared Right Turn Zone(see page 34)
Protected Corner/Intersection (see page 35)
Separate Right Turn Phase (see page 36)
Raised Crossing (see page 37)
BEECH STREET REALIGNMENT ANDBUILDING FOOTPRINT BY OTHERS
REDUCE DRIVEWAY WIDTH TOALLOW ADEQUATE SPACE FOR
BIKE RAMP. BUS ISLAND IS 76' ANDDESIGNED FOR 60' BUS. CONFIRM
BUS SIZE BEFORE FINAL DESIGN.
SIDEWALK REDUCED FROM8' TO 5.5' TO PROVIDEADEQUATE SPACE FOR NEWBUS ISLAND
SIDEWALK REDUCED FROM8' TO 5.5' TO PROVIDE
ADEQUATE SPACE FOR NEWBUS ISLAND
MAP
LE ST BEEC
H ST
CEDA
R ST
CHES
TNUT
ST
LINCO
LN A
VE
ROOS
EVEL
TAV
E
BUS STOP
4.5' 11'
4.5'
7'
LATHROPST
4.5' 11'7'
11'11'
11'
7'
BUS STOP
11'11'
11'
7'4.5'
17' 17'
FROMTO
9'5'
5'
9'
5.5' sidewalk
5.5' sidewalk
BUS ISLAND IS 76' AND DESIGNEDFOR 60' BUS. CONFIRM BUS SIZE
BEFORE FINAL DESIGN.PROPOSED LEFTTURN REMOVAL
PROPOSEDLEFT TURNREMOVAL
IMPROVED LIGHTING UNDERWOODSIDE ROAD UNDERPASS
(CONSIDER INCORPORATINGPUBLIC ART)
SIDEWALK REDUCED FROM8' TO 5.5' TO PROVIDEADEQUATE SPACE FOR NEWBUS ISLAND
SIDEWALK REDUCED FROM 8'TO 5.5' TO PROVIDE ADEQUATESPACE FOR NEW BUS ISLAND
OPPORTUNITY FOR POCKET PARKWITH COMBINATION OF HARDSCAPE
AND GREEN INFRASTRUCTURE
PINE
ST
OAK
AVE
REDW
OOD
AVE
WOODSIDE RD
EXISTINGBUS STOP
BUS STOP
10'11'
12'11'11'3'
6'2'
7'
RELOCATEDBUS STOP
MAN
ZANI
TA ST
11'10'
10'5'
2'11'11'
11'
6' sidewalk
11'17'
9'
5'
9'
5.5' sidewalk
5.5' sidewalk 5'
BUS ISLAND IS 76' ANDDESIGNED FOR 60' BUS.CONFIRM BUS SIZE BEFOREFINAL DESIGN
BUS ISLAND IS 76' AMDDESIGNED FOR 60' BUS.CONFIRM BUS SIZE BEFOREFINAL DESIGN
PROVIDE SEPARATED PHASINGFOR BICYCLISTS. SEE
APPENDIX FOR PHASINGASSUMPTIONS.
PROVIDE SEPARATION FOR BIKESTURNING SOUTHBOUND (AS
PROTECTION FROM HIGH VOLUME OFVEHICLES EXITING FREEWAY)
ADD BIKE LANE WITH BIKE BOX TOPROVIDE CLEAR PLACEMENT FOR BIKESTURNING LEFT AND GOING THROUGH.
NB AND SB LEFT TURNS RESTRICTED
PROVIDE SEPARATEDPHASING FOR BICYCLISTS.
SEE APPENDIX FORPHASING ASSUMPTIONS.
El Camino Real - Redwood CityMaple Street to Manzanita Street
Figure 5
CONCEPTUAL - NOT FOR CONSTRUCTIONDETAILED ANALYSIS AND ENGINEERING DESIGN REQUIRED
SAMPLE RAISED CROSSING(OPTION 4).
ALTERNATIVE TREATMENT IFLEFT TURN REMAINS:PROTECTED CORNER (OPTION 2)
SAMPLE RAISED CROSSING(OPTION 4)
LEGENDOPPORTUNITY FOR GREEN INFRASTRUCTURE (GI) LOW SHRUBSOR GRASSES
HARDSCAPE AREA
LANDSCAPE MEDIANS:6 FT TO 17 FT USE LOW SHRUBS OR GRASSES17 FT ADD NEW CANOPY TREES
SAMPLE PROTECTED CORNER(OPTION 2)
REMOVED CURB
EXISTING CURB
PROPOSED CURB
SAMPLE INTERSECTION TREATMENTS PROPOSED TRAFFIC SIGN
FUTURE DEVELOPMENT AREA BUFFER WITH SOFT-HIT POSTS
224
2 2
24 2
MAP
LE ST
LINCO
LN A
VE
PROPOSEDLEFT TURNREMOVAL
BEECH STREET REALIGNMENTAND BUILDING FOOTPRINT
DESIGNED BY OTHERS
PROPOSEDLEFT TURNREMOVAL
4.5' 11'7'
11'11'
11'
7'
4.5'
17'
5'
5.5' sidewalk
9'
Beech Street Realignment: Alternative LayoutFigure A
LEGEND
CONCEPTUAL - NOT FOR CONSTRUCTIONDETAILED ANALYSIS AND ENGINEERING DESIGN REQUIRED
SAMPLE RAISED CROSSING(OPTION 4).
ALTERNATIVE TREATMENT IFLEFT TURN REMAINS:PROTECTED CORNER (OPTION 2)
HARDSCAPE AREA
LANDSCAPE MEDIANS:6 FT TO 17 FT USE LOW SHRUBS OR GRASSES17 FT ADD NEW CANOPY TREES
SAMPLE PROTECTEDCORNER (OPTION 2)
REMOVED CURB
EXISTING CURB
PROPOSED CURB
PROPOSED TRAFFIC SIGN
FUTURE DEVELOPMENT AREA
Alternative Intersection Alignment (Beech St at El Camino)

33
BEECH STREET REALIGNMENT ANDBUILDING FOOTPRINT BY OTHERS
REDUCE DRIVEWAY WIDTH TOALLOW ADEQUATE SPACE FOR
BIKE RAMP. BUS ISLAND IS 76' ANDDESIGNED FOR 60' BUS. CONFIRM
BUS SIZE BEFORE FINAL DESIGN.
SIDEWALK REDUCED FROM8' TO 5.5' TO PROVIDEADEQUATE SPACE FOR NEWBUS ISLAND
SIDEWALK REDUCED FROM8' TO 5.5' TO PROVIDE
ADEQUATE SPACE FOR NEWBUS ISLAND
MAP
LE ST BEEC
H ST
CEDA
R ST
CHES
TNUT
ST
LINCO
LN A
VE
ROOS
EVEL
TAV
E
BUS STOP
4.5' 11'
4.5'
7'
LATHROPST
4.5' 11'7'
11'11'
11'
7'
BUS STOP
11'11'
11'
7'4.5'
17' 17'
FROMTO
9'5'
5'
9'
5.5' sidewalk
5.5' sidewalk
BUS ISLAND IS 76' AND DESIGNEDFOR 60' BUS. CONFIRM BUS SIZE
BEFORE FINAL DESIGN.PROPOSED LEFTTURN REMOVAL
PROPOSEDLEFT TURNREMOVAL
IMPROVED LIGHTING UNDERWOODSIDE ROAD UNDERPASS
(CONSIDER INCORPORATINGPUBLIC ART)
SIDEWALK REDUCED FROM8' TO 5.5' TO PROVIDEADEQUATE SPACE FOR NEWBUS ISLAND
SIDEWALK REDUCED FROM 8'TO 5.5' TO PROVIDE ADEQUATESPACE FOR NEW BUS ISLAND
OPPORTUNITY FOR POCKET PARKWITH COMBINATION OF HARDSCAPE
AND GREEN INFRASTRUCTURE
PINE
ST
OAK
AVE
REDW
OOD
AVE
WOODSIDE RD
EXISTINGBUS STOP
BUS STOP
10'11'
12'11'11'3'
6'2'
7'
RELOCATEDBUS STOP
MAN
ZANI
TA ST
11'10'
10'5'
2'11'11'
11'
6' sidewalk
11'17'
9'
5'
9'
5.5' sidewalk
5.5' sidewalk 5'
BUS ISLAND IS 76' ANDDESIGNED FOR 60' BUS.CONFIRM BUS SIZE BEFOREFINAL DESIGN
BUS ISLAND IS 76' AMDDESIGNED FOR 60' BUS.CONFIRM BUS SIZE BEFOREFINAL DESIGN
PROVIDE SEPARATED PHASINGFOR BICYCLISTS. SEE
APPENDIX FOR PHASINGASSUMPTIONS.
PROVIDE SEPARATION FOR BIKESTURNING SOUTHBOUND (AS
PROTECTION FROM HIGH VOLUME OFVEHICLES EXITING FREEWAY)
ADD BIKE LANE WITH BIKE BOX TOPROVIDE CLEAR PLACEMENT FOR BIKESTURNING LEFT AND GOING THROUGH.
NB AND SB LEFT TURNS RESTRICTED
PROVIDE SEPARATEDPHASING FOR BICYCLISTS.
SEE APPENDIX FORPHASING ASSUMPTIONS.
El Camino Real - Redwood CityMaple Street to Manzanita Street
Figure 5
CONCEPTUAL - NOT FOR CONSTRUCTIONDETAILED ANALYSIS AND ENGINEERING DESIGN REQUIRED
SAMPLE RAISED CROSSING(OPTION 4).
ALTERNATIVE TREATMENT IFLEFT TURN REMAINS:PROTECTED CORNER (OPTION 2)
SAMPLE RAISED CROSSING(OPTION 4)
LEGENDOPPORTUNITY FOR GREEN INFRASTRUCTURE (GI) LOW SHRUBSOR GRASSES
HARDSCAPE AREA
LANDSCAPE MEDIANS:6 FT TO 17 FT USE LOW SHRUBS OR GRASSES17 FT ADD NEW CANOPY TREES
SAMPLE PROTECTED CORNER(OPTION 2)
REMOVED CURB
EXISTING CURB
PROPOSED CURB
SAMPLE INTERSECTION TREATMENTS PROPOSED TRAFFIC SIGN
FUTURE DEVELOPMENT AREA BUFFER WITH SOFT-HIT POSTS
OPTIONAL FUTURE LOCATION FOR PHB BASED ONADEQUATE SPACING ALONG THE CORRIDOR.CONTINGENT ON FUTURE DEMAND AND LAND USE.
LAUR
EL ST
WILL
OW ST
CHAR
TER
ST
HAZE
L AVE
HEM
LOCK
AVE
10'11'
10'10'10'10'11'2'
2'
11'11'
11'11'11'11'2'
6'2'
2'
11'5'
5'
2'5'
2'
10'
10'11'
10'
10'10'
10'
5'
10'10'4'7'
10'10'10'6'
5'6'
CONCEPTUAL - NOT FOR CONSTRUCTIONDETAILED ANALYSIS AND ENGINEERING DESIGN REQUIRED
El Camino Real - Redwood CityManzanita Street to Charter Street
Figure 5
LEGENDOPPORTUNITY FOR GREEN INFRASTRUCTURE (GI) LOW SHRUBSOR GRASSES LANDSCAPE MEDIANS:
6 FT TO 17 FT USE LOW SHRUBS OR GRASSES17 FT ADD NEW CANOPY TREES
SAMPLE SHARED RIGHT TURNZONE (OPTION 1)
REMOVED CURB
EXISTING CURB
PROPOSED CURB
PROPOSED TRAFFIC SIGN
SAMPLE PROTECTEDCORNER (OPTION 2)
SAMPLE INTERSECTION TREATMENTS
HARDSCAPE AREAFUTURE DEVELOPMENT AREA
BUFFER WITH SOFT-HIT POSTS
2 1
2 2
1
1 32 24Shared Right Turn Zone(see page 34)
Protected Corner/Intersection (see page 35)
Separate Right Turn Phase (see page 36)
Raised Crossing (see page 37)
BEECH STREET REALIGNMENT ANDBUILDING FOOTPRINT BY OTHERS
REDUCE DRIVEWAY WIDTH TOALLOW ADEQUATE SPACE FOR
BIKE RAMP. BUS ISLAND IS 76' ANDDESIGNED FOR 60' BUS. CONFIRM
BUS SIZE BEFORE FINAL DESIGN.
SIDEWALK REDUCED FROM8' TO 5.5' TO PROVIDEADEQUATE SPACE FOR NEWBUS ISLAND
SIDEWALK REDUCED FROM8' TO 5.5' TO PROVIDE
ADEQUATE SPACE FOR NEWBUS ISLAND
MAP
LE ST BEEC
H ST
CEDA
R ST
CHES
TNUT
ST
LINCO
LN A
VE
ROOS
EVEL
TAV
E
BUS STOP
4.5' 11'
4.5'
7'
LATHROPST
4.5' 11'7'
11'11'
11'
7'
BUS STOP
11'11'
11'
7'4.5'
17' 17'
FROMTO
9'5'
5'
9'
5.5' sidewalk
5.5' sidewalk
BUS ISLAND IS 76' AND DESIGNEDFOR 60' BUS. CONFIRM BUS SIZE
BEFORE FINAL DESIGN.PROPOSED LEFTTURN REMOVAL
PROPOSEDLEFT TURNREMOVAL
IMPROVED LIGHTING UNDERWOODSIDE ROAD UNDERPASS
(CONSIDER INCORPORATINGPUBLIC ART)
SIDEWALK REDUCED FROM8' TO 5.5' TO PROVIDEADEQUATE SPACE FOR NEWBUS ISLAND
SIDEWALK REDUCED FROM 8'TO 5.5' TO PROVIDE ADEQUATESPACE FOR NEW BUS ISLAND
OPPORTUNITY FOR POCKET PARKWITH COMBINATION OF HARDSCAPE
AND GREEN INFRASTRUCTURE
PINE
ST
OAK
AVE
REDW
OOD
AVE
WOODSIDE RD
EXISTINGBUS STOP
BUS STOP
10'11'
12'11'11'3'
6'2'
7'
RELOCATEDBUS STOP
MAN
ZANI
TA ST
11'10'
10'5'
2'11'11'
11'
6' sidewalk
11'17'
9'
5'
9'
5.5' sidewalk
5.5' sidewalk 5'
BUS ISLAND IS 76' ANDDESIGNED FOR 60' BUS.CONFIRM BUS SIZE BEFOREFINAL DESIGN
BUS ISLAND IS 76' AMDDESIGNED FOR 60' BUS.CONFIRM BUS SIZE BEFOREFINAL DESIGN
PROVIDE SEPARATED PHASINGFOR BICYCLISTS. SEE
APPENDIX FOR PHASINGASSUMPTIONS.
PROVIDE SEPARATION FOR BIKESTURNING SOUTHBOUND (AS
PROTECTION FROM HIGH VOLUME OFVEHICLES EXITING FREEWAY)
ADD BIKE LANE WITH BIKE BOX TOPROVIDE CLEAR PLACEMENT FOR BIKESTURNING LEFT AND GOING THROUGH.
NB AND SB LEFT TURNS RESTRICTED
PROVIDE SEPARATEDPHASING FOR BICYCLISTS.
SEE APPENDIX FORPHASING ASSUMPTIONS.
El Camino Real - Redwood CityMaple Street to Manzanita Street
Figure 5
CONCEPTUAL - NOT FOR CONSTRUCTIONDETAILED ANALYSIS AND ENGINEERING DESIGN REQUIRED
SAMPLE RAISED CROSSING(OPTION 4).
ALTERNATIVE TREATMENT IFLEFT TURN REMAINS:PROTECTED CORNER (OPTION 2)
SAMPLE RAISED CROSSING(OPTION 4)
LEGENDOPPORTUNITY FOR GREEN INFRASTRUCTURE (GI) LOW SHRUBSOR GRASSES
HARDSCAPE AREA
LANDSCAPE MEDIANS:6 FT TO 17 FT USE LOW SHRUBS OR GRASSES17 FT ADD NEW CANOPY TREES
SAMPLE PROTECTED CORNER(OPTION 2)
REMOVED CURB
EXISTING CURB
PROPOSED CURB
SAMPLE INTERSECTION TREATMENTS PROPOSED TRAFFIC SIGN
FUTURE DEVELOPMENT AREA BUFFER WITH SOFT-HIT POSTS
24
2 3
1

34
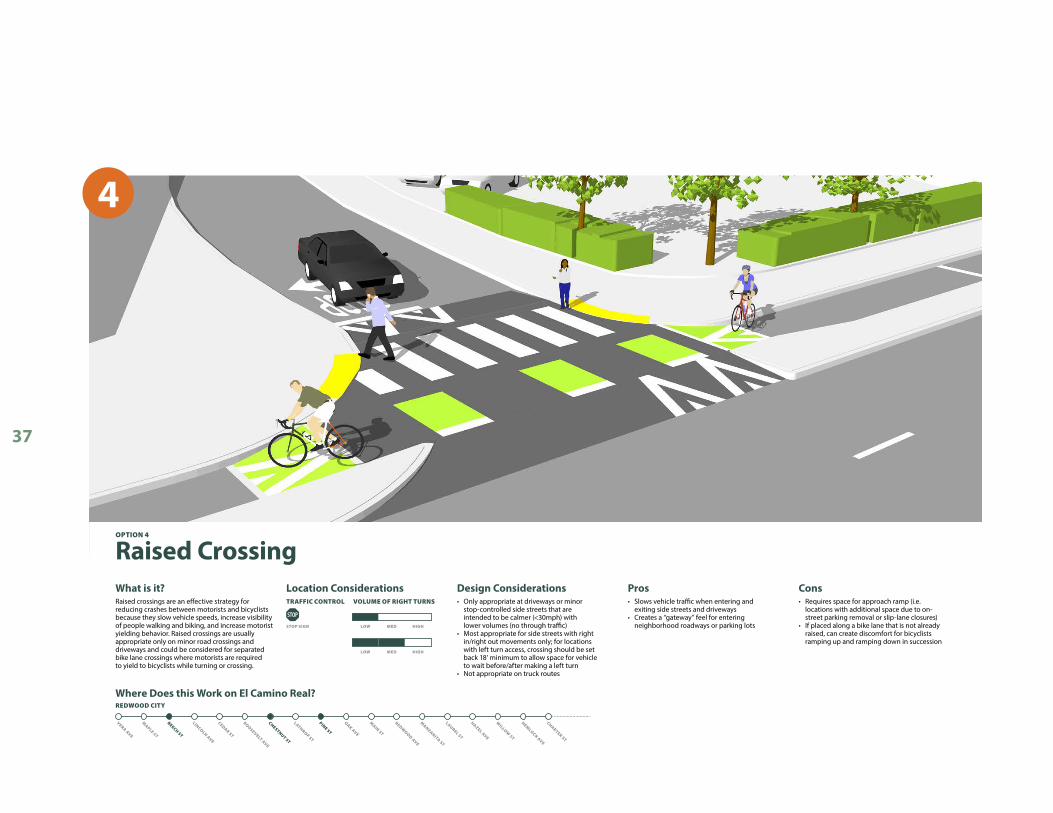
What is it?
Where Does this Work on El Camino Real?
Design Considerations Pros ConsLocation ConsiderationsTRAFFIC CONTROL
REDWOOD CITY PALO ALTO
VOLUME OF RIGHT TURNS
SIGNAL
VERA AVE
MAPLE ST
BEECH ST
LINCOLN AVE
CEDAR ST
ROOSEVELT AVE
CHESTNUT ST
LATHROP ST
PINE ST
OAK AVE
MAIN ST
REDWOOD AVE
LAUREL ST
HAZEL AVE
CALIFORNIA AVE
SHERMAN AVE
GRANT AVE
SHERIDAN AVE
OREGON EXPWY
PEPPER AVE
PORTAGE AVE
HANSEN WAY
STOP SIGN LOW MED HIGH
CHARTER ST
HEMLOCK AVE
WILLOW
ST
MANZANITA ST
LAMBERT AVE
ACACIA AVE
OLIVE AVE
CAMBRIDGE AVE
COLLEGE AVE
OXFORD AVE
STANFORD AVE
• Only recommended for physically constrained locations
• Does not require dedicated right-of-way for bicyclists at intersections in constrained locations
• Allows vehicles to merge with bikes against the curb prior to turning, reducing the likelihood of the “right hook”
• Requires vehicles to look over their shoulder to avoid conflicts with bicyclists
• Does not provide physical separation for vehicles and bicyclists
Cars and bikes share the same road space in shared right turn zones, which help position vehicles closer to the curb to help facilitate the right turn and reduce “right hook” collisions with bicyclists. A dashed green bike lane is used to indicate that cars and bikes may “mix” in this area.
OPTION 1
Shared Right Turn Zone
Addressing Safety at Intersections
Intersection treatments summarized in the following sections were chosen on a technical basis, following best practices for intersection design along protected bikeways and feedback from the Complete Streets Advisory Committee while considering the constraints and context of El Camino. The focus for these treatments is minimizing potential “right hook” conflicts between vehicles and bicycles at intersections. Main considerations include existing traffic control, available right-of-way, and the volume of conflicting right turns during the peak periods.
1

35
What is it?
Where Does this Work on El Camino Real?
Design Considerations Pros ConsLocation ConsiderationsTRAFFIC CONTROL
REDWOOD CITY PALO ALTO
VOLUME OF RIGHT TURNS
SIGNAL
VERA AVE
BEECH ST
CEDAR ST
CHESTNUT ST
PINE ST
MAIN ST
REDWOOD AVE
MANZANITA ST
WILLOW
ST
HEMLOCK AVE
CHARTER ST
STANFORD AVE
OXFORD AVE
SHERMAN AVE
GRANT AVE
SHERIDAN AVE
OREGON EXPWY
PEPPER AVE
ACACIA AVE
STOP SIGN
HAZEL AVE
LAUREL ST
OAK AVE
LATHROP ST
ROOSEVELT AVE
LINCOLN AVE
MAPLE ST
LAMBERT AVE
PORTAGE AVE
HANSEN WAY
OLIVE AVE
CAMBRIDGE AVE
COLLEGE AVE
CALIFORNIA AVE
LOW
LOW
MED
MED
HIGH
HIGH
• Requires adequate space for dedicated right-of-way for people who walk and bike and for corner refuge islands
• Extends the physical barrier of the protected bike lane into the intersection, creating a refuge and a clear path of travel for bicyclists
• Provides a forward stop bar for cyclists to provide a “head start” and improve visibility of bicyclists
• Setback crossing prevents vehicles from turning right into their blind spot, thus improving visibility of bicyclists and pedestrians
• Reduces vehicle exposure for pedestrians/bicyclists• Helps facilitate left turns for bicyclists
• Requires space for set-back placement of bike crossing (i.e. locations with additional space due to on-street parking removal or slip-lane closures)
• Recommended where it’s important to facilitate left turns for cyclists
Protected intersections clearly define pedestrian and bicyclist operating spaces and minimize potential conflicts between users. For example, the corner refuge island protects bicyclists from right-turning vehicles by physically separating the bike lane up to the point where the bicyclist crosses the side street, while reducing vehicle turning speeds and guiding vehicles to meet the bicycle crossing at a near-90 degree angle to improve sight lines of oncoming bicycles.
Protected Corner/IntersectionOPTION 2
4” mountable curb for compliance with fire department vehicles
2

36
What is it?
Where Does this Work on El Camino Real?
Design Considerations Pros ConsLocation ConsiderationsTRAFFIC CONTROL
REDWOOD CITY PALO ALTO
VOLUME OF RIGHT TURNS
SIGNAL
VERA AVE
MAPLE ST
BEECH ST
LINCOLN AVE
CEDAR ST
CHESTNUT ST
LATHROP ST
PINE ST
OAK AVE
MAIN ST
MANZANITA ST
LAUREL ST
HAZEL AVE
WILLOW
ST
HEMLOCK AVE
CHARTER ST
OXFORD AVE
COLLEGE AVE
CAMBRIDGE AVE
CALIFORNIA AVE
SHERMAN AVE
GRANT AVE
SHERIDAN AVE
PEPPER AVE
OLIVE AVE
ACACIA AVE
PORTAGE AVE
HANSEN WAY
LAMBERT AVE
LOW MED HIGH
REDWOOD AVE
OREGON EXPWY
STANFORD AVE
• Dedicated right turn pocket required• Consider electronic LED blank-out
signs to emphasize no right turn on red during bicycle phase
• Separates signal phase for right-turning vehicles and bicyclists, removing the “right hook” conflict
• Requires dedicated right turn pocket, pocket length
• Can result in longer cycle lengths at signals, and thus increased delay, at intersections where right-turn vehicle volumes are high
Protected bicycle phases are desirable in locations where high volumes of right turning vehicles conflict with a parallel separated bike lane. Provision of a protected bicycle phase requires a dedicated right turn lane and should be tested for potential impacts to intersection delay and queueing.
Separate Bicycle PhaseOPTION 3
Separate right-turn phase
Bikes proceedwith through tra�c
Optional near-sidesignal for bikes
Separate right-turn phase
Bikes proceedwith through tra�c
Optional near-sidesignal for bikes
ROOSEVELT AVE
3
37
What is it?
Where Does this Work on El Camino Real?
Design Considerations Pros ConsLocation ConsiderationsTRAFFIC CONTROL
REDWOOD CITY PALO ALTO
VOLUME OF RIGHT TURNS
VERA AVE
MAPLE ST
LINCOLN AVE
CEDAR ST
ROOSEVELT AVE
LATHROP ST
OAK AVE
MAIN ST
REDWOOD AVE
MANZANITA ST
LAUREL ST
HAZEL AVE
WILLOW
ST
HEMLOCK AVE
CHARTER ST
STANFORD AVE
COLLEGE AVE
CAMBRIDGE AVE
CALIFORNIA AVE
OREGON EXPWY
OLIVE AVE
PORTAGE AVE
HANSEN WAY
LAMBERT AVE
PINE ST
CHESTNUT ST
BEECH ST
PEPPER AVE
ACACIA AVE
SHERIDAN AVE
GRANT AVE
SHERMAN AVE
OXFORD AVE
STOP SIGN
• Only appropriate at driveways or minor stop-controlled side streets that are intended to be calmer (<30mph) with lower volumes (no through traffic)
• Most appropriate for side streets with right in/right out movements only; for locations with left turn access, crossing should be set back 18’ minimum to allow space for vehicle to wait before/after making a left turn
• Not appropriate on truck routes
• Slows vehicle traffic when entering and exiting side streets and driveways
• Creates a “gateway” feel for entering neighborhood roadways or parking lots
• Requires space for approach ramp (i.e. locations with additional space due to on-street parking removal or slip-lane closures)
• If placed along a bike lane that is not already raised, can create discomfort for bicyclists ramping up and ramping down in succession
Raised crossings are an effective strategy for reducing crashes between motorists and bicyclists because they slow vehicle speeds, increase visibility of people walking and biking, and increase motorist yielding behavior. Raised crossings are usually appropriate only on minor road crossings and driveways and could be considered for separated bike lane crossings where motorists are required to yield to bicyclists while turning or crossing.
Raised CrossingOPTION 4
LOW
LOW
MED
MED
HIGH
HIGH
4

38
Bus Stop Design
Buses along El Camino currently travel in the same lane as cars and pull out into the parking lane at bus stops to pick up passengers at the curb. Before the protected bike lanes are installed, bus stops along the corridor will need to be carefully designed in order to maintain a consistent level of comfort for bicyclists traveling in the protected bikeway. Based on community preferences voiced during the Corridor Plan and this study, the design should prioritize transit shelters and eliminate mixing of buses and bikes. Based on the available width to the back of the sidewalk and feedback from the Complete Streets Advisory Committee, the preferred bus stop design allows the bus to stop in the travel lane to accommodate space for a raised bike lane, transit shelter, and a separate bus boarding island. Trade-offs for this design are noted below.
Figure 15Bus Stop Design: Separate Bus Boarding Platform ( In-lane stop, separate from bike lane)
BUS STOP DESIGN TRADEOFFSDESIGN OPTIONS
TRADEOFFS
TRADEOFFS
SHARED BUS BOARDING PLATFORM (IN-LANE STOP, BOARDING PLATFORM SHARED WITH BICYCLES)
Transit Travel TimeBus travel time reduced by 5-10 seconds at each stop by stopping in the lane
Bicycle ComfortLow level of stress for bicycles due to separated bus activity
Bicycle SafetyRemoves bus-bike conflict at curb
Transit AmenitiesRoom for bus shelter
Bus Rider ComfortDedicated bus boarding and waiting area, separate from bicycles
Construction ComplexityMedium level of construction complexity
Vehicle DelayAbout 20 seconds of delay every 7 min during peak bus service if vehicles are unable to change lanes
Sidewalk Width2.5’ reduction in sidewalk width
Shared drive lane/ bus stop
101/2’Shared raised bike lane/ bus boarding platform
Buses along El Camino Real currently travel in the same lane as cars and pull out into the parking lane at bus stops to pick up passengers at the curb. The approved El Camino Real Corridor Plan calls for protected bike lanes against the curb in place of parking. Before these bike lanes are installed, the design of the bus stops will need to be carefully considered. Based on community preferences voiced during the Corridor Plan and the current Safety Study, the design should prioritize transit shelters and eliminating mixing of buses and bikes. Based on the available width to the back of the sidewalk, the city could install bus stop improvements according to Option 1 or 2 shown below. Both allow the bus to stop in the travel lane to accommodate space for a raised bike lane and transit shelter. There are trade-offs to both options which are noted below.
Separated Bike Lane Planning & Design Guide, Massachusetts Department of Transportation, 2012 (https://www.mass.gov/lists/separated-bike-lane-planning-design-guide)
SEPARATE BUS BOARDING PLATFORM (IN-LANE STOP, SEPARATE FROM BIKE LANE)
Shared drive lane/bus stop
Raised bike lane
8’Existing
sidewalk width
8’Existing
sidewalk width
8’ clearrequired for
wheelchair lift
Transit Travel TimeBus travel time reduced by 5-10 seconds at each stop by stopping in the lane
Bicycle ComfortLow level of stress for bicycles due to separated bus activity and direct path of travel
Bicycle SafetyRemoves bus-bike conflict at curb
Transit AmenitiesRoom for bus shelter
Sidewalk Width1‘ expansion in sidewalk width
Construction ComplexityMedium level of construction complexity
Vehicle DelayAbout 20 seconds of delay every 7 min during peak bus service if vehicles are unable to change lanes
Bus Rider ComfortBus boarding area shared with bicycles
Bus Boarding Island
9’Sidewalk
9’
11’
11’
5’
5.5’
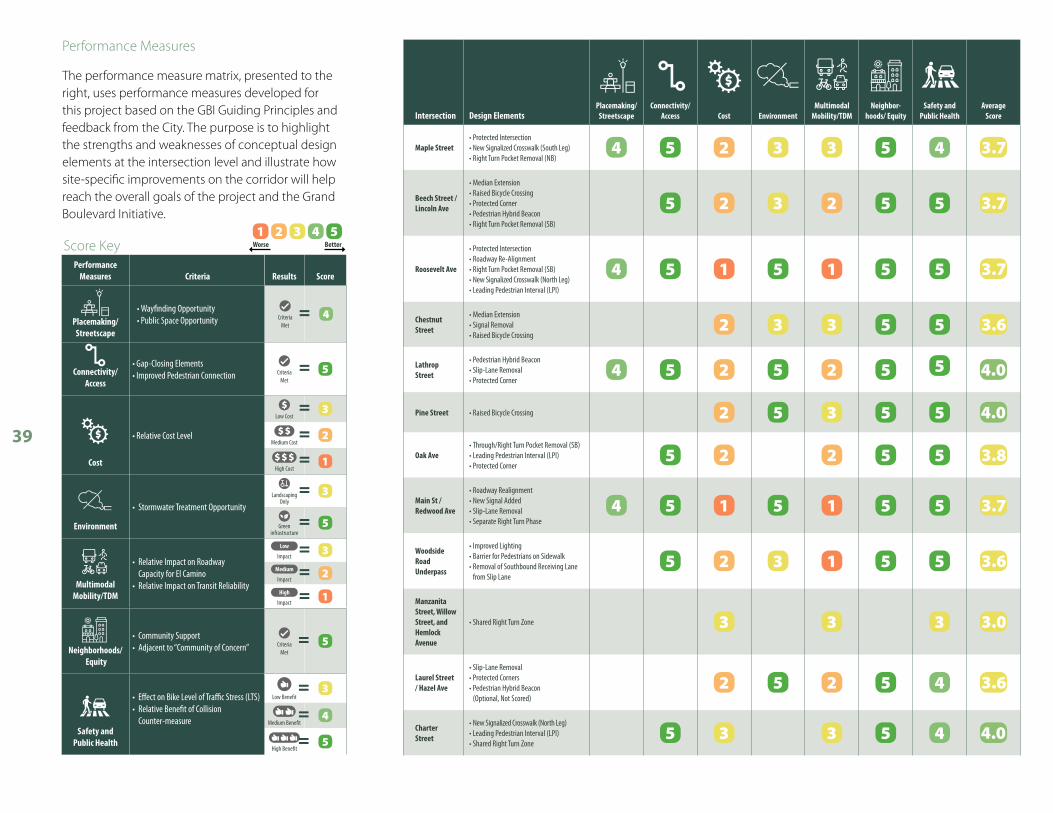
39
1 2 3 4 5BetterWorse
Intersection Design ElementsPlacemaking/
StreetscapeConnectivity/
Access Cost EnvironmentMultimodal
Mobility/TDMNeighbor-
hoods/ EquitySafety and
Public HealthAverage
Score
Maple Street• Protected Intersection• New Signalized Crosswalk (South Leg)• Right Turn Pocket Removal (NB)
4 5 2 3 3 5 4 3.7
Beech Street / Lincoln Ave
• Median Extension • Raised Bicycle Crossing • Protected Corner• Pedestrian Hybrid Beacon • Right Turn Pocket Removal (SB)
5 2 3 2 5 5 3.7
Roosevelt Ave
• Protected Intersection• Roadway Re-Alignment • Right Turn Pocket Removal (SB)• New Signalized Crosswalk (North Leg)• Leading Pedestrian Interval (LPI)
4 5 1 5 1 5 5 3.7
Chestnut Street
• Median Extension• Signal Removal• Raised Bicycle Crossing
2 3 3 5 5 3.6
Lathrop Street
• Pedestrian Hybrid Beacon• Slip-Lane Removal• Protected Corner
4 5 2 5 2 5 5 4.0
Pine Street • Raised Bicycle Crossing 2 5 3 5 5 4.0
Oak Ave• Through/Right Turn Pocket Removal (SB)• Leading Pedestrian Interval (LPI)• Protected Corner
5 2 2 5 5 3.8
Main St / Redwood Ave
• Roadway Realignment • New Signal Added• Slip-Lane Removal• Separate Right Turn Phase
4 5 1 5 1 5 5 3.7
Woodside Road Underpass
• Improved Lighting• Barrier for Pedestrians on Sidewalk• Removal of Southbound Receiving Lane
from Slip Lane5 2 3 1 5 5 3.6
Manzanita Street, Willow Street, and Hemlock Avenue
• Shared Right Turn Zone 3 3 3 3.0
Laurel Street / Hazel Ave
• Slip-Lane Removal• Protected Corners• Pedestrian Hybrid Beacon
(Optional, Not Scored)2 5 2 5 4 3.6
Charter Street
• New Signalized Crosswalk (North Leg)• Leading Pedestrian Interval (LPI)• Shared Right Turn Zone
5 3 3 5 4 4.0
Performance Measures
The performance measure matrix, presented to the right, uses performance measures developed for this project based on the GBI Guiding Principles and feedback from the City. The purpose is to highlight the strengths and weaknesses of conceptual design elements at the intersection level and illustrate how site-specific improvements on the corridor will help reach the overall goals of the project and the Grand Boulevard Initiative.
Performance Measures Criteria Results Score
Placemaking/ Streetscape
• Wayfinding Opportunity• Public Space Opportunity
Criteria
Met4
Connectivity/ Access
• Gap-Closing Elements• Improved Pedestrian Connection Criteria
Met5
Cost
• Relative Cost Level
Low Cost
3
Medium Cost2
High Cost1
Environment
• Stormwater Treatment Opportunity
Landscaping
Only3
Green
infrastructure5
Multimodal Mobility/TDM
• Relative Impact on Roadway Capacity for El Camino
• Relative Impact on Transit Reliability
Low
Impact3
Medium
Impact2
High
Impact1
Neighborhoods/ Equity
• Community Support• Adjacent to “Community of Concern” Criteria
Met5
Safety and Public Health
• Effect on Bike Level of Traffic Stress (LTS)• Relative Benefit of Collision
Counter-measure
Low Benefit3
Medium Benefit4
High Benefit5
=
=
===
=
====
===
=
Score Key

NEXT STEPS
Photo: Evan Ajuria, 2018

41
This chapter covers potential next steps that the City of Redwood City and Caltrans may undertake to implement the proposed vision for the El Camino corridor. In addition to the planning-level cost estimates, funding strategies, list of Caltrans design decisions, and additional recommended studies discussed in this chapter, opportunities for “quick-build” improvements and a “living preview strategy” are also identified in the Lessons Learned Report to continue the momentum of the project through near-term phasing options and community engagement.
This Study represents a unique partnership between SamTrans, the City of Redwood City, and Caltrans in which SamTrans, on behalf of GBI, took the lead on securing funding and managing the study development. This strategy may be beneficial moving forward to secure funding for construction and final design before the City and Caltrans ultimately deliver the project.
Cost Estimates
Planning level costs were developed as part of the conceptual design process. While more detailed cost estimates will be needed as part of final design, the long-term corridor improvements are estimated to cost approximately $11,057,000. The demolition cost includes items such as removing curb, sidewalk, and traffic signals. The roadway improvements category summarizes costs for installing minor concrete including curb, curb and gutter, sidewalk, ADA ramps, and raised transit islands at the bus stops. There is also a 2” AC
overlay for the entire length of the corridor in this section. The traffic improvements section includes all signing and striping. The signal and lighting section summarizes the cost of new traffic signals, pedestrian hybrid beacons, improved lighting, and additional signal infrastructure at existing signalized intersections for the installation of new crosswalks. Lastly, the landscaping section includes costs for general landscaping, green infrastructure opportunities, and installation of trees.
$150k Demolition
$165k Drainage & Utilities
$2.1m Roadway Improvements
$310k Traffic Improvements
$890k Signals and Lighting
$1.4m Landscaping
$6m Soft Costs (Contingency, Design, Construction Management, and permitting)
Estimated Total Cost
$11.1m
NEXT STEPS

42
Potential Funding Sources
Implementing the local vision for the corridor will require securing funding from many different sources. The following funding sources are anticipated to be the best fits for the project:
• Caltrans Active Transportation Program (ATP): While ATP is one of the most competitive statewide and regional grant funding sources, the El Camino corridor in Redwood City is likely a strong contender for grant funding. One of the primary scoring criteria is benefit to disadvantaged communities, which is applicable to most of the corridor. With the safety benefits for active modes and the significant walking and biking comfort improvements, the project would likely rank high. This grant would likely only be applicable to the walking and biking related improvements. It is anticipated that some of the landscape and transit improvements would not be eligible. ATP Cycle 5 is expected to start in Spring 2020.
• Caltrans Highway Safety Improve Program (HSIP): HSIP intends to address areas with serious documented safety records. The primary metric for this a cost benefit ratio that heavily weighs fatal and severe injuries. As this segment of El Camino has a high proportion of bicycle and pedestrian-related collisions, the project will likely be very competitive for this funding source. This grant is primarily used to fund specific safety countermeasures, so project definition requires documented safety benefits for collision type. Collision types on the study corridor identified through this study should be a useful reference for an HSIP application. Another round of HSIP grants is likely to be announced in spring of 2019 or 2020.
• Bicycle/Pedestrian Improvement Program (BPIP): As the local congestion management agency, C/CAG distributes One Bay Area Grant (OBAG) grant funding through the BPIP and the Transportation for Livable Communities (TLC) Program every 4-5 years. As a part of OBAG funding, priority is given to projects either fully or partially within a Metropolitan Transportation Commission (MTC)-designated Priority Development Area (PDA) or providing access to/from within 0.5 mile of a PDA. PDAs are designated locations where the region strategically wants to grow. Portions of the study segment are within PDAs and the corridor provides access to PDAs located Downtown. The goal of the BPIP is to continue to build out bicycle and pedestrian improvements to better connect San Mateo County to local destinations and the multimodal transportation network. An application for the same project cannot be submitted to both the BPIP and the TLC program. The last BPIP grant cycle was in 2016.
• Transportation for Livable Communities (TLC) Program: As the local congestion management agency, C/CAG distributes One Bay Area Grant (OBAG) grant funding through their TLC Program. As a part of OBAG funding, priority is given to projects either fully or partially within a Metropolitan Transportation Commission (MTC)-designated Priority Development Area (PDA) or providing access to/from within 0.5 mile of a PDA. PDAs are designated locations where the region strategically wants to grow. Portions of the study segment are within PDAs and the corridor provides access to PDAs located Downtown. Bicycle and pedestrian improvements as well as multi-modal streetscape improvements (pedestrian-scale
lighting, way-finding signage, and bicycle/pedestrian treatments) are eligible for the TLC program; the program focuses on capital improvements and construction for amenities that “revitalize public spaces and promote and enhance alternative transportation”. An application for the same project cannot be submitted to both the BPIP and the TLC program. The last TLC grant cycle was in 2016.
• Affordable Housing and Sustainable Communities (AHSC) program: Funded through statewide Cap and Trade funds, the AHSC grants help fund affordable housing but can include substantial transportation improvements within one mile of the affordable housing site. Recent cycles have placed greater emphasis on transportation improvements. Given the need for affordable housing in the area identified in the Corridor Plan, this could be an important grant funding source. However, it is reliant upon opportunities to coordinate with housing developers. The City should flag and pursue the grant as interest in affordable housing development arises on parcels along or near the corridor.
• Senate Bill 1: With the passage of the statewide transportation bill in 2017, additional funding sources are likely to become available for transit projects to reduce vehicle miles traveled (VMT). Bus stop improvements for this corridor, such as bus boarding islands, may be eligible.
43
Implementation Process
As a state-owned facility, improvements along El Camino will require final approval from Caltrans through the Project Initiation Documents (PID) process. Specific improvements will require varying levels of documentation, additional study, or review in order to receive approval. The table below summarizes the next steps prior to implementation. The list includes documents required for approval of certain improvements, also called a “Design Standard Decision Document”. A full list of project improvements and the applicable input received during preliminary design review meetings with Caltrans can be found in the Appendix of this report. Although not necessarily required by Caltrans, additional studies or supportive programs are also recommended prior to implementation to address lingering community concerns for the project.
Overall, a network traffic analysis is recommended as the most immediate next step to capture the impact of the full project build out on traffic flow on El Camino. Studying the effects of the full project build out, although a long-term vision, will give the city the most flexibility to evaluate and pursue multiple phasing options.
Many improvements being considered are consistent with the Caltrans Strategic Management Plan (2015-2020), which strives to fully integrate bicycles into all aspects of the California transportation system, and are not subject to the Caltrans Design Standard Decision process.
Early Phasing Strategies
Development Project Coordination: Quick-Build and Pilot Projects
While the full implementation of this plan is considered a long term vision, there are strategies that the city can consider for testing portions of
the design prior to full implementation. Quick-build construction strategies, such as those that use a “paint and plastic” approach, can be a useful way to install temporary versions of improvements as part of a pilot program or a phased approach to construction. The city could coordinate with new development projects that overlap with the study area to ensure that site plans consider installation of plan elements using this low-cost approach. Candidate treatments could include those with minimal construction barriers such as crosswalk enhancements or stretches of the protected bike lanes where parking is already prohibited. Specific quick-build strategies are included in the Lessons Learned and Design Library report for this study.
Caltrans Coordination: Pavement Rehabilitation Project
The State Highway Operation and Protection Program (SHOPP) is a “fix-it-first” program that Caltrans uses to fund the repair and preservation on State highways, with four key assets including pavement, bridges, culverts, and Transportation Magnagement Systems (TMS). SHOPP projects provide opportunities to address other State priorities, such as the implementation of Complete Streets elements, including pedestrian and bicycle facilities identified by Caltrans or local jurisdictions through various planning efforts. For pavement projects, opportunities may include quick-build elements that are consistent with this study such as curb ramp upgrades, dedicated bikeways, crosswalk enhancements, and other low-cost measures. When SHOPP projects are scoped and developed, Caltrans coordinates with the local jurisdiction and stakeholders to identify opportunities for Complete Streets improvements.In Redwood City, pavement improvements are identified within the study limits and have not yet been programmed in the SHOPP, with anticipated
implementation in Fiscal Year 2025/26, with scheduling subject to change.
Caltrans Coordination: Bicyclist Collision Monitoring Program (2018 Pilot)
The 2018 Pilot Caltrans Bicyclist Collision Monitoring Program identifies bicyclist-related high collision concentration locations (HCCLs) and corridors for investigation and potential short-term countermeasures, with an emphasis on low-cost improvements that can be applied on a large scale. The pilot program identified this segment of El Camino Realin Redwood City as an HCCL corridor. A Bicycle Road Safety Audit was conducted in June 2018 withrepresentatives from Federal Highway Administration, Caltrans, Redwood City, and other stakeholders to preliminarily assess bicycle safety issues and potential countermeasures. Caltrans will coordinate with the Cityto finalize the outcome of the Safety Audit, including potential short-term countermeasures thatwill consider recommendations from this plan
Maintaining Momentum
There are many strategies the city can use to maintain the momentum from the recent efforts of this plan and the El Camino Corridor Plan. Living preview events that demonstrate the design concepts in real time, such as the event that was hosted during this study, are a great way to bring a concept to life and create a venue for discussion and excitement. Specific information on living previews are included in the Lessons Learned and Design Library document from this study. For additional information and to stay informed about ongoing efforts for improving El Camino in Redwood City, updates will be provided on the project’s website at www.redwoodcity.org/elcaminoplan.

44
Study or Program Specific Locations and Purpose
Required by Caltrans
Caltrans Design Standard Decision Document (DSDD)
Corridor-wide to document justification for design variances from the Highway Design Manual.
Specific improvements include:
• Lane Widths < 11’
• Net reduction in shoulder width (conversion of the on-street parking lane to a bike lane with a raised permanent barrier)
Caltrans Intersection Control Evaluation
Examples include: All study intersections where a signal warrant would need to be met.
• Addition of signal at Main St (with relevant signal timing recommendations from this study)
• Addition of fourth leg at Cedar/Roosevelt intersection
Network Traffic Analysis (Existing and Existing + Project Scenario)
Corridor-level to evaluate circulation changes and impacts to overall delay to give the city maximum flexibility to pursue multiple phasing options
Examples include:
• Roadway realignment at Cedar/Roosevelt Ave
• Median extensions at Beech St and Chestnut Street (restricted access from mainline)
• Signal removal at Chestnut Street
• Roadway realignment, signal timing changes, and queueing at Redwood Ave/Main Street (see Appendix for initial signal phasing and geometry assumptions)
• Removal of southbound receiving lane from slip lane at Redwood Ave/Woodside Road Underpass
• New signalized crosswalks and Leading Pedestrian Intervals
• Right turn pocket removals
• Pedestrian Hybrid Beacons
• In-Lane Bus Boarding Islands
Signal Warrant Analysis (Existing + Project Scenario)
Chestnut Signal Removal: study to demonstrate that the projected intersection volumes (from Network Traffic Analysis above) no longer satisfies signal warrant analysis
Sight Distance Study At Lincoln Avenue and Lathrop Street (PHB locations) for Caltrans approval of longitudinal setback of canopy trees from crosswalk of less than 100’.
Table 1Studies and Strategies for Implementation

45
Study or Program Specific Locations and Purpose
Recommended by Consultant Team
Additional Design Considerations
• Wayfinding at transitions to guide people to adjacent or nearby bicycle routes
• Alternative materials or design for protective elements along the bike lanes (continuing to work with stakeholders and building off the Design Library for this plan)
• Options or opportunities for a raised bike lane design
Neighborhood Traffic Study Circulation study to determine potential impacts of roadway realignments at Roosevelt and Main Street on levels of neighborhood traffic. Identify potential traffic calming measures as needed.
Specific deliverables could include:• Holistic analysis of traffic circulation, to include potential rerouting of traffic from adjacent roadway changes and traffic from
Woodside Road on/off ramps
• Queueing for all legs of study intersections
• Pros/cons and tradeoffs for roadway re-alignments (building off of the performance measure results in this plan)
Neighborhood Transitions Program
Consider holding neighborhood-based meetings on a consistent basis to build community support, address existing concerns, and identify additional studies needed prior to implementation. Topics could include residential parking permit programs, traffic calming, place-making opportunities, maintaining existing character, and organizing additional living previews.
Bicycle Volume Projections Corridor-wide for grant applications and to understand benefits of project to increase bicycle volumes
Parking and Access Management Study
Corridor-wide to work with impacted businesses along El Camino Real to identify strategies to address potential loss of on-street parking and access, especially for those that have limited off-street parking.
Potential strategies include: • Inventory of off-street parking supply (public and private surface parking lots, parking structures, etc.) and
daily utilization patterns to identify shared parking opportunities based on complementary use patterns.
• Off-site employee parking
• Restriping for compact parking on side streets (angled parking)
• Short-term limits for parking on side streets to encourage turnover
• Residential permit parking
• Designated loading/unloading zones at nearby locations (curbside management)
Property Based Improvement District
Consider establishment of a Property Based Improvement District (PBID) to organize business support and to fund implementation of FHWA-recommended maintenance strategies for the protected bike lanes, including street sweeping.
Ongoing Business Coordination Continued robust outreach to business owners at a door-to-door scale to discuss concerns and implementation updates. Mechanisms for this outreach could include a Property Based Improvement District as a forum for business organization and discussion. Outreach topics could include:
• Strategies to retain small businesses
• Business collaboration
• Shared parking strategies
• Opportunities for placemaking, art, and wayfinding
• Additional “living preview” opportunities
APPENDIX

STOP STOP
STOP STOP STOPSTOP STOP STOP
STOPSTOP
Heller St
Center St
Cypress St
Park St
Popl
ar A
ve
Oak
Ave
Red
woo
d A
ve
Madrone St
Ver
a A
ve
Locust St
Roos
evel
t Ave
Linden St
Hemlock A
ve
Pennsylvania Ave
Addison St
Franklin StHazel A
ve
Mad
ison
Ave
Dille
r St
Adams St
Clinton St
Monroe St
Linco
ln A
ve
Northum
berland Ave
Mcenvoy St
Woodrow St
El Camino Real El Camino Real
Charter St
Willow
St
Laurel St
Manzanita St
Hancock St
Shasta St
Shasta St
Buckeye St
Pine St
Chestnut St
Cedar St
Beech St
Main St
Pine
StChe
stnut
St
Ced
ar S
t
Beec
h St
Elm S
t
Lanthrop St
Maple St
Woodside Rd
Woodside Rd
84
84
82
DOWNTOWN
STAMBAUGH-HELLER REDWOOD VILLAGE
REDWOOD OAKS
PALM
CENTRAL
UNIONCEMETERY
TARGET CENTER
ROSELLIMINI-PARK
FLEISHMANPARK
MI RANCHOSUPERMARKET
BED BATH& BEYOND
BEVMO
Pedestrian Street 1
Connector Street 1
Class II Bike Lane
Class III Bike Route Bus Stop with ShelterTransit Street 1
Bicycle Boulevard 1
1Source: Redwood City General Plan and El Camino Real Corridor Plan
Study Area
Caltrain Rail Line
Crosswalk
Signalized Intersection
Stop SignSTOP
Bus Stop and Direction of Travel
Existing Transportation NetworkFigure 2

PERFORMANCE MEASURE RESULTS – REDWOOD CITY EL CAMINO REAL BIKE AND PED SAFETY IMPROVEMENT STUDY
SCORE KEY
Performance Measure Criteria Result and Corresponding Score
Placemaking / Streetscape • Wayfinding Opportunity • Public Space Opportunity Criteria Met = 4
Connectivity / Access • Gap-Closing Elements • Improved Pedestrian Connection Criteria Met = 5
Cost • Relative Cost Level ($ / $$ / $$$) $ = 3
$$ = 2 $$$ = 1
Environment • Stormwater Treatment Opportunity1 Landscaping only = 3
Green Infrastructure (storm water treatment) = 5
Multimodal Mobility / TDM
• Relative Impact to Roadway Capacity along El Camino Real (high/med/low2)
• Relative Impact to Transit Reliability along El Camino Real (high/med/low2)
Low Impact = 3 Medium Impact = 2
High Impact = 1
Neighborhoods / Equity • Community Support3 • Adjacent to “Community of Concern” Criteria Met =5
Safety and Public Health • Effect on Bike Level of Traffic Stress (LTS) • Relative Benefit of Collision Counter-measure (low/med/ high) • Addresses specific collision profile4
= 3 = 4 = 5
1 Stormwater Treatment Opportunities are high-level and pending detailed review of location-specific conditions (e.g. roadway and sidewalk grades, presence of existing drain inlets, storm sewer lines, percolation rate of local soils and others) with respect to constructability of green infrastructure features at size and with capacity needed to achieve benefit. 2 High: significant impact to roadway capacity that is likely to create high delays, a worse level of service, or increased travel times, or significant detours. Low: Little to no impacts to roadway capacity; not likely to create high delays or worsen the level of service, or significantly alter the travel patterns. Note that these “scores” reflect the impact to flow on the mainline at each intersection individually rather than cumulatively along the corridor. 3 Community support is defined as a priority crossing location identified by the public during outreach or an improvement that was part of the approved Corridor Plan. 4 Specific collision profiles and whether they were addressed were used to “bump up” the safety performance result from low to medium or medium to high.

INTERSECTION RESULTS
Intersection and Design Elements
Average Score Performance Measure Score Score Narrative
Maple Street • Protected Intersection • New Signalized
Crosswalk (South Leg) • Right Turn Pocket
Removal (NB)
3.7
Placemaking / Streetscape 4 • Wayfinding for downtown connection
Connectivity / Access 5 • Connection to Maple Street bike facility • Improved ped connection to downtown
Cost 2 • Medium cost level ($$)
Environment 3 • Landscaping only
Multimodal Mobility / TDM 3 • Low impact
o Approximately 1.5 added seconds of delay during PM peak hour from Right Turn Pocket Removals5
Neighborhoods / Equity 5 • Priority crossing location during outreach • Adjacent to Community of Concern
Safety and Public Health 4 • Medium benefit
o Reduces Bike LTS (Protected Intersection) o Low countermeasure benefit (Protected Intersection)
Beech Street / Lincoln Ave • Median Extension • Raised Crossing • Protected Corner • Pedestrian Hybrid
Beacon (PHB) • Right Turn Pocket
Removal (SB)
3.7
Placemaking / Streetscape - -
Connectivity / Access 5 • Improved ped connection to future Beech Street Office project
Cost 2 • Medium cost level ($$) Environment 3 • Landscaping only
Multimodal Mobility / TDM 2
• Medium impact o Pedestrian hybrid beacon (PHB) expected to add delay to vehicular
movements along ECR o Low impact due to right turn pocket removal6 and left turns being
shifted to nearby streets from median extension7
Neighborhoods / Equity 5 • Right Turn Pocket removal part of approved Corridor Plan • Adjacent to Community of Concern
Safety and Public Health 5 • High benefit
o Reduces Bike LTS (Right Turn Pocket Removal) o High collision countermeasure benefit (PHB)
5 Source: W-Trans June 2017 Memorandum El Camino Real – Traffic/Bikeway Analysis 6 Approximately 1.5 added seconds of delay for through traffic on ECR during the PM peak hour. Source: W-Trans June 2017 Memorandum El Camino Real – Traffic/Bikeway Analysis. 7 Approximately 87 SB left turns redistributed to Maple or future Roosevelt signal during the peak hour. 4 WB left turns and 8 EB left turns redistributed to Maple St or future re-aligned Roosevelt signal.

Roosevelt Ave • Protected Intersection • Roadway Re-Alignment • Right Turn Pocket
Removal (SB) • New Signalized
Crosswalk (North Leg) • Leading Pedestrian
Interval (LPI)
3.7
Placemaking / Streetscape 4 • Opportunity for public space with roadway re-alignment
Connectivity / Access 5 • Improved ped connection to BevMo and Mi Rancho supermarket
Cost 1 • High cost level ($$$)
Environment 5 • Green infrastructure opportunity
Multimodal Mobility / TDM 1
• High impact o Reduced capacity for ECR traffic due to addition of signal phases
for new movements (SBL and WBT/WBL) as a result of Roadway Re-Alignment.8
o Minor impact due to right turn pocket removal7 o New Signalized Crosswalk and Leading Pedestrian Interval are
also likely to add delay to vehicular movements along ECR.
Neighborhoods / Equity 5 • Priority crossing location during outreach • Adjacent to Community of Concern
Safety and Public Health 5
• High benefit o Reduces Bike LTS (Right Turn Pocket Removal and Protected
Corners) o Medium collision countermeasure benefit (LPI) o Addresses collision profiles (Complex Intersections)
Chestnut Street • Median Extension • Signal Removal • Raised Crossing
3.6
Placemaking / Streetscape - -
Connectivity / Access - -
Cost 2 • Medium cost level ($$)
Environment 3 • Landscaping only
Multimodal Mobility / TDM 3
• Low impact o Left turns shifted to neighboring streets due to median extension.9 o Improved flow on mainline from Signal Removal; may increase
delay on neighboring side streets.10
Neighborhoods / Equity 5 • Signal removal part of approved Corridor Plan • Adjacent to Community of Concern
Safety and Public Health 5 • High benefit
o Reduces Bike LTS (Raised Crossing) o High collision countermeasure benefit (Median Extension)
8 WBR phase is assumed to be timed concurrently with the NBL and SBL as an overlap phase. Minor impact due to re-routing of SB left turns from Beech and Chestnut. 9 Approx. 130 SB left turns redistributed to future re-aligned Roosevelt or future Main St signal. Approx. 236 WB left turns redistributed to Roosevelt or Main. 10 408 WB vehicles/hour during the PM peak potentially shifted to Maple Street, future re-aligned Roosevelt, or future Main St signal.

Lathrop Street • Pedestrian Hybrid
Beacon • Slip-Lane Removal • Protected Corner
4.0
Placemaking / Streetscape 4 • Wayfinding for Lathrop bike boulevard and downtown • Opportunity for pocket park
Connectivity / Access 5 • Connection to Lathrop bike boulevard • Improved ped connection to future Lathrop plaza and downtown
Cost 2 • Medium cost level ($$) Environment 5 • Green Infrastructure Multimodal Mobility / TDM 2 • Medium impact due to Pedestrian hybrid beacon (PHB)
Neighborhoods / Equity 5 • Part of approved Corridor Plan
• Adjacent to Community of Concern
Safety and Public Health 5 • High benefit
o Reduces Bike LTS (Protected Corner) o High collision countermeasure benefit (PHB)
Pine Street Raised Crossing 4.0
Placemaking / Streetscape - -
Connectivity / Access - -
Cost 2 • Medium cost level ($$)
Environment 5 • Green Infrastructure
Multimodal Mobility / TDM 3 • Low impact
Neighborhoods / Equity 5 • Adjacent to Community of Concern
Safety and Public Health 5 • High benefit
o Reduces Bike LTS o Medium collision countermeasure
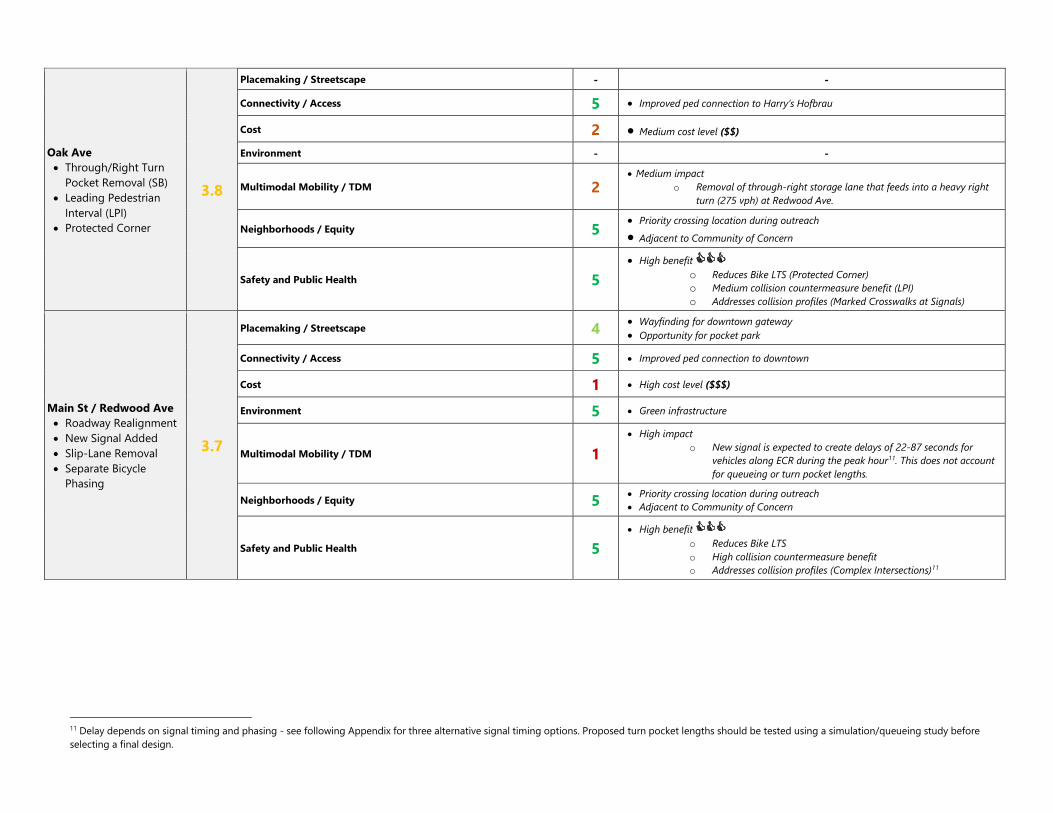
Oak Ave Through/Right Turn
Pocket Removal (SB) Leading Pedestrian
Interval (LPI) Protected Corner
3.8
Placemaking / Streetscape - - Connectivity / Access 5 Improved ped connection to Harry’s Hofbrau
Cost 2 Medium cost level ($$) Environment - -
Multimodal Mobility / TDM 2 Medium impact
o Removal of through-right storage lane that feeds into a heavy right turn (275 vph) at Redwood Ave.
Neighborhoods / Equity 5 Priority crossing location during outreach Adjacent to Community of Concern
Safety and Public Health 5
High benefit o Reduces Bike LTS (Protected Corner) o Medium collision countermeasure benefit (LPI) o Addresses collision profiles (Marked Crosswalks at Signals)
Main St / Redwood Ave Roadway Realignment New Signal Added Slip-Lane Removal Separate Bicycle
Phasing
3.7
Placemaking / Streetscape 4 Wayfinding for downtown gateway Opportunity for pocket park
Connectivity / Access 5 Improved ped connection to downtown
Cost 1 High cost level ($$$)
Environment 5 Green infrastructure
Multimodal Mobility / TDM 1 High impact
o New signal is expected to create delays of 22-87 seconds for vehicles along ECR during the peak hour11. This does not account for queueing or turn pocket lengths.
Neighborhoods / Equity 5 Priority crossing location during outreach Adjacent to Community of Concern
Safety and Public Health 5 High benefit
o Reduces Bike LTS o High collision countermeasure benefit o Addresses collision profiles (Complex Intersections)11
11 Delay depends on signal timing and phasing - see following Appendix for three alternative signal timing options. Proposed turn pocket lengths should be tested using a simulation/queueing study before selecting a final design.

Woodside Road Underpass • Improved Lighting • Barrier for Pedestrians
on Sidewalk • Removal of SB
Receiving Lane from slip-Lane
3.6
Placemaking / Streetscape 4 • Wayfinding to downtown
Connectivity / Access 5 • Improved ped connection to downtown
Cost 2 • Medium cost level ($$)
Environment 3 • Landscaping only
Multimodal Mobility / TDM 1 • High impact
o Removal of receiving lane limits the capacity for the heavy right turn volume of about 800 vph
Neighborhoods / Equity 5 • Preferred treatment level during outreach for underpass • Adjacent to Community of Concern
Safety and Public Health 5 • High benefit
o Reduces Bike LTS o Medium benefit of collision countermeasure (Protected Bike Lanes)
Manzanita Street, Willow Street, and Hemlock Avenue Shared Right Turn Zone
3.0
Placemaking / Streetscape - -
Connectivity / Access - -
Cost 3 • Low cost level ($)
Environment - -
Multimodal Mobility / TDM 3 • Low impact
Neighborhoods / Equity - -
Safety and Public Health 3 • Low benefit
o Does not improve Bike LTS o Low benefit of collision countermeasure
Laurel Street / Hazel Ave • Slip-Lane Removal • Protected Corners • Pedestrian Hybrid
Beacon (Optional, Not Scored)
3.6
Placemaking / Streetscape - -
Connectivity / Access - -
Cost 2 • Medium cost ($$)
Environment 5 • Green infrastructure opportunity
Multimodal Mobility / TDM 2 • Medium impact
o Removal of slip lanes and signalizing movements lowers capacity for right-turn movements of about 300 vph each.
Neighborhoods / Equity 5 • Part of approved Corridor Plan
Safety and Public Health 4 • Medium benefit
o Reduces Bike LTS (Protected Corners) o Low collision countermeasure benefit

Charter Street • New Signalized
Crosswalk (North Leg) • Leading Pedestrian
Interval (LPI)
4.0
Placemaking / Streetscape - -
Connectivity / Access 5 • Improved ped connection to Target Center
Cost 3 • Low cost ($)
Environment - -
Multimodal Mobility / TDM 3 • Low impact
Neighborhoods / Equity 5 • Priority crossing location during outreach
Safety and Public Health 4 • Medium benefit
o Does not improve Bike LTS o Medium collision countermeasure benefit (LPI) o Addresses collision profiles (Marked Crosswalks at Signals)

Timings SamTans Grand Boulevard Complete Streets1: El Camino Real & Redwood Ave (Single Right)/Main Street PM Peak Hour
02/14/2019 Synchro 10 ReportPage 1
Lane Group EBT EBR WBT NBT NBR SBT SBR Ø1 Ø2 Ø5 Ø6Lane ConfigurationsTraffic Volume (vph) 50 679 50 1520 687 1433 268Future Volume (vph) 50 679 50 1520 687 1433 268Turn Type NA Perm NA NA custom NA customProtected Phases 7 8 6 5 5 8 2 1 1 7 1 2 5 6Permitted Phases 7Detector Phase 7 7 8 6 5 5 2 1 1Switch PhaseMinimum Initial (s) 10.0 10.0 10.0 10.0 10.0 10.0 10.0Minimum Split (s) 29.0 29.0 29.0 14.0 24.0 14.0 24.0Total Split (s) 39.0 39.0 29.0 38.0 24.0 38.0 24.0Total Split (%) 30.0% 30.0% 22.3% 29% 18% 29% 18%Yellow Time (s) 3.0 3.0 3.0 3.0 3.0 3.0 3.0All-Red Time (s) 1.0 1.0 1.0 1.0 1.0 1.0 1.0Lost Time Adjust (s) 0.0 0.0 0.0Total Lost Time (s) 4.0 4.0 4.0Lead/Lag Lead Lead Lag Lag Lead Lag LeadLead-Lag Optimize? Yes Yes Yes Yes Yes Yes YesRecall Mode None None None Min None Min NoneAct Effct Green (s) 35.1 35.1 15.2 58.1 49.3 58.1 73.1Actuated g/C Ratio 0.29 0.29 0.13 0.48 0.41 0.48 0.61v/c Ratio 0.22 1.22 0.60 1.02 1.22 0.96 0.32Control Delay 35.1 139.1 58.5 59.6 139.1 46.4 13.6Queue Delay 0.0 0.0 0.0 0.0 0.0 0.0 0.0Total Delay 35.1 139.1 58.5 59.6 139.1 46.4 13.6LOS D F E E F D BApproach Delay 125.8 58.5 84.4 41.2Approach LOS F E F D
Intersection SummaryCycle Length: 130Actuated Cycle Length: 120.4Natural Cycle: 130Control Type: Actuated-UncoordinatedMaximum v/c Ratio: 1.22Intersection Signal Delay: 75.2 Intersection LOS: EIntersection Capacity Utilization 117.1% ICU Level of Service HAnalysis Period (min) 15Description: Single Right Turn from Redwood Avenue
Splits and Phases: 1: El Camino Real & Redwood Ave (Single Right)/Main Street

HCM Signalized Intersection Capacity Analysis SamTans Grand Boulevard Complete Streets1: El Camino Real & Redwood Ave (Single Right)/Main Street PM Peak Hour
02/14/2019 Synchro 10 ReportPage 2
Movement EBL EBT EBR WBL WBT WBR NBL NBT NBR SBL SBT SBRLane ConfigurationsTraffic Volume (vph) 50 50 679 50 50 20 0 1520 687 0 1433 268Future Volume (vph) 50 50 679 50 50 20 0 1520 687 0 1433 268Ideal Flow (vphpl) 1900 1900 1900 1900 1900 1900 1900 1900 1900 1900 1900 1900Total Lost time (s) 4.0 4.0 4.0 4.0 4.0 4.0 4.0Lane Util. Factor 1.00 1.00 1.00 0.95 1.00 0.95 1.00Frpb, ped/bikes 1.00 0.96 0.99 1.00 1.00 1.00 1.00Flpb, ped/bikes 1.00 1.00 1.00 1.00 1.00 1.00 1.00Frt 1.00 0.85 0.98 1.00 0.85 1.00 0.85Flt Protected 0.98 1.00 0.98 1.00 1.00 1.00 1.00Satd. Flow (prot) 1652 1381 1610 3217 1439 3217 1439Flt Permitted 0.98 1.00 0.98 1.00 1.00 1.00 1.00Satd. Flow (perm) 1652 1381 1610 3217 1439 3217 1439Peak-hour factor, PHF 0.96 0.96 0.96 0.96 0.96 0.96 0.96 0.96 0.96 0.96 0.96 0.96Adj. Flow (vph) 52 52 707 52 52 21 0 1583 716 0 1493 279RTOR Reduction (vph) 0 0 179 0 6 0 0 0 0 0 0 0Lane Group Flow (vph) 0 104 528 0 119 0 0 1583 716 0 1493 279Confl. Peds. (#/hr) 20 20Turn Type Split NA Perm Split NA NA custom NA customProtected Phases 7 7 8 8 6 5 5 8 2 1 1 7Permitted Phases 7Actuated Green, G (s) 35.1 35.1 15.2 58.1 49.3 58.1 73.2Effective Green, g (s) 35.1 35.1 15.2 58.1 49.3 58.1 73.2Actuated g/C Ratio 0.29 0.29 0.13 0.48 0.41 0.48 0.61Clearance Time (s) 4.0 4.0 4.0Vehicle Extension (s) 3.0 3.0 3.0Lane Grp Cap (vph) 481 402 203 1552 589 1552 874v/s Ratio Prot 0.06 0.07 c0.49 c0.50 0.46 0.19v/s Ratio Perm c0.38v/c Ratio 0.22 1.31 0.59 1.02 1.22 0.96 0.32Uniform Delay, d1 32.2 42.7 49.6 31.2 35.6 30.1 11.5Progression Factor 1.00 1.00 1.00 1.00 1.00 1.00 1.00Incremental Delay, d2 0.2 158.3 4.3 28.0 112.0 14.8 0.2Delay (s) 32.5 200.9 53.9 59.2 147.5 44.8 11.7Level of Service C F D E F D BApproach Delay (s) 179.3 53.9 86.7 39.6Approach LOS F D F D
Intersection SummaryHCM 2000 Control Delay 84.2 HCM 2000 Level of Service FHCM 2000 Volume to Capacity ratio 1.23Actuated Cycle Length (s) 120.4 Sum of lost time (s) 16.0Intersection Capacity Utilization 117.1% ICU Level of Service HAnalysis Period (min) 15Description: Single Right Turn from Redwood Avenuec Critical Lane Group

Timings SamTans Grand Boulevard Complete Streets2: El Camino Real & Redwood Ave (Dual Right Opt1)/Main Street PM Peak Hour
02/14/2019 Synchro 10 ReportPage 3
Lane Group EBT EBR WBT NBT NBR SBT SBR Ø1 Ø2 Ø5 Ø6Lane ConfigurationsTraffic Volume (vph) 50 679 50 1520 687 1433 268Future Volume (vph) 50 679 50 1520 687 1433 268Turn Type NA Perm NA NA custom NA customProtected Phases 7 8 6 5 5 8 2 1 1 7 1 2 5 6Permitted Phases 7Detector Phase 7 7 8 6 5 5 2 1 1Switch PhaseMinimum Initial (s) 10.0 10.0 10.0 10.0 10.0 10.0 10.0Minimum Split (s) 29.0 29.0 29.0 14.0 24.0 14.0 24.0Total Split (s) 39.0 39.0 29.0 38.0 24.0 38.0 24.0Total Split (%) 30.0% 30.0% 22.3% 29% 18% 29% 18%Yellow Time (s) 3.0 3.0 3.0 3.0 3.0 3.0 3.0All-Red Time (s) 1.0 1.0 1.0 1.0 1.0 1.0 1.0Lost Time Adjust (s) 0.0 0.0 0.0Total Lost Time (s) 4.0 4.0 4.0Lead/Lag Lead Lead Lag Lag Lead Lag LeadLead-Lag Optimize? Yes Yes Yes Yes Yes Yes YesRecall Mode None None None Min None Min NoneAct Effct Green (s) 32.2 32.2 15.2 58.3 49.4 58.3 70.5Actuated g/C Ratio 0.27 0.27 0.13 0.49 0.42 0.49 0.60v/c Ratio 0.91 0.73 0.59 0.99 1.19 0.94 0.32Control Delay 55.0 23.0 57.4 52.0 126.8 41.6 13.8Queue Delay 0.0 0.0 0.0 0.0 0.0 0.0 0.0Total Delay 55.0 23.0 57.4 52.0 126.8 41.6 13.8LOS E C E D F D BApproach Delay 39.4 57.4 75.3 37.2Approach LOS D E E D
Intersection SummaryCycle Length: 130Actuated Cycle Length: 117.8Natural Cycle: 150Control Type: Actuated-UncoordinatedMaximum v/c Ratio: 1.19Intersection Signal Delay: 55.5 Intersection LOS: EIntersection Capacity Utilization 101.5% ICU Level of Service GAnalysis Period (min) 15Description: Dual Right Turn from Redwood Avenue - Option 1
Splits and Phases: 2: El Camino Real & Redwood Ave (Dual Right Opt1)/Main Street

HCM Signalized Intersection Capacity Analysis SamTans Grand Boulevard Complete Streets2: El Camino Real & Redwood Ave (Dual Right Opt1)/Main Street PM Peak Hour
02/14/2019 Synchro 10 ReportPage 4
Movement EBL EBT EBR WBL WBT WBR NBL NBT NBR SBL SBT SBRLane ConfigurationsTraffic Volume (vph) 50 50 679 50 50 20 0 1520 687 0 1433 268Future Volume (vph) 50 50 679 50 50 20 0 1520 687 0 1433 268Ideal Flow (vphpl) 1900 1900 1900 1900 1900 1900 1900 1900 1900 1900 1900 1900Total Lost time (s) 4.0 4.0 4.0 4.0 4.0 4.0 4.0Lane Util. Factor 0.95 0.95 1.00 0.95 1.00 0.95 1.00Frpb, ped/bikes 0.97 0.96 0.99 1.00 1.00 1.00 1.00Flpb, ped/bikes 1.00 1.00 1.00 1.00 1.00 1.00 1.00Frt 0.89 0.85 0.98 1.00 0.85 1.00 0.85Flt Protected 0.99 1.00 0.98 1.00 1.00 1.00 1.00Satd. Flow (prot) 1377 1313 1610 3217 1439 3217 1439Flt Permitted 0.99 1.00 0.98 1.00 1.00 1.00 1.00Satd. Flow (perm) 1377 1313 1610 3217 1439 3217 1439Peak-hour factor, PHF 0.96 0.96 0.96 0.96 0.96 0.96 0.96 0.96 0.96 0.96 0.96 0.96Adj. Flow (vph) 52 52 707 52 52 21 0 1583 716 0 1493 279RTOR Reduction (vph) 0 82 183 0 6 0 0 0 0 0 0 0Lane Group Flow (vph) 0 333 213 0 119 0 0 1583 716 0 1493 279Confl. Peds. (#/hr) 20 20Turn Type Split NA Perm Split NA NA custom NA customProtected Phases 7 7 8 8 6 5 5 8 2 1 1 7Permitted Phases 7Actuated Green, G (s) 32.2 32.2 15.2 58.3 49.4 58.3 70.4Effective Green, g (s) 32.2 32.2 15.2 58.3 49.4 58.3 70.4Actuated g/C Ratio 0.27 0.27 0.13 0.50 0.42 0.50 0.60Clearance Time (s) 4.0 4.0 4.0Vehicle Extension (s) 3.0 3.0 3.0Lane Grp Cap (vph) 376 359 207 1593 603 1593 860v/s Ratio Prot c0.24 0.07 c0.49 c0.50 0.46 0.19v/s Ratio Perm 0.16v/c Ratio 0.89 0.59 0.57 0.99 1.19 0.94 0.32Uniform Delay, d1 41.0 37.1 48.2 29.5 34.1 28.0 11.8Progression Factor 1.00 1.00 1.00 1.00 1.00 1.00 1.00Incremental Delay, d2 21.2 2.6 3.8 20.9 100.2 10.8 0.2Delay (s) 62.2 39.7 52.0 50.4 134.4 38.8 12.0Level of Service E D D D F D BApproach Delay (s) 51.2 52.0 76.6 34.6Approach LOS D D E C
Intersection SummaryHCM 2000 Control Delay 57.0 HCM 2000 Level of Service EHCM 2000 Volume to Capacity ratio 1.07Actuated Cycle Length (s) 117.7 Sum of lost time (s) 16.0Intersection Capacity Utilization 101.5% ICU Level of Service GAnalysis Period (min) 15Description: Dual Right Turn from Redwood Avenue - Option 1c Critical Lane Group

Timings SamTans Grand Boulevard Complete Streets3: El Camino Real & Redwood Ave (Dual Right Opt2)/Main Street PM Peak Hour
02/14/2019 Synchro 10 ReportPage 5
Lane Group EBT EBR WBL WBT NBT NBR SBT SBR Ø1 Ø2 Ø6Lane ConfigurationsTraffic Volume (vph) 50 679 50 50 1520 687 1433 268Future Volume (vph) 50 679 50 50 1520 687 1433 268Turn Type NA Prot Perm NA NA custom NA customProtected Phases 7 7 8 6 5 5 2 1 1 7 1 2 6Permitted Phases 8Detector Phase 7 7 8 8 6 5 5 2 1 1Switch PhaseMinimum Initial (s) 10.0 10.0 10.0 10.0 10.0 10.0 10.0 10.0Minimum Split (s) 14.0 14.0 29.0 29.0 14.0 14.0 24.0 24.0Total Split (s) 31.0 31.0 29.0 29.0 66.0 66.0 24.0 24.0Total Split (%) 20.7% 20.7% 19.3% 19.3% 44.0% 44% 16% 16%Yellow Time (s) 3.0 3.0 3.0 3.0 3.0 3.0 3.0 3.0All-Red Time (s) 1.0 1.0 1.0 1.0 1.0 1.0 1.0 1.0Lost Time Adjust (s) 0.0 0.0 0.0 0.0Total Lost Time (s) 4.0 4.0 4.0 4.0Lead/Lag Lead Lead Lag Lag Lag Lag Lead LeadLead-Lag Optimize? Yes Yes Yes Yes Yes Yes Yes YesRecall Mode None None None None Min Min None NoneAct Effct Green (s) 27.0 27.0 19.4 86.1 62.1 86.1 93.1Actuated g/C Ratio 0.19 0.19 0.13 0.60 0.43 0.60 0.64v/c Ratio 1.23 0.96 0.80 0.83 1.16 0.78 0.30Control Delay 165.5 63.7 92.0 28.9 126.7 26.5 13.1Queue Delay 0.0 0.0 0.0 0.0 0.0 0.0 0.0Total Delay 165.5 63.7 92.0 28.9 126.7 26.5 13.1LOS F E F C F C BApproach Delay 115.8 92.0 59.3 24.4Approach LOS F F E C
Intersection SummaryCycle Length: 150Actuated Cycle Length: 144.6Natural Cycle: 145Control Type: Actuated-UncoordinatedMaximum v/c Ratio: 1.23Intersection Signal Delay: 56.9 Intersection LOS: EIntersection Capacity Utilization 99.6% ICU Level of Service FAnalysis Period (min) 15Description: Dual Right Turn from Redwood Avenue - Option 2
Splits and Phases: 3: El Camino Real & Redwood Ave (Dual Right Opt2)/Main Street

HCM Signalized Intersection Capacity Analysis SamTans Grand Boulevard Complete Streets3: El Camino Real & Redwood Ave (Dual Right Opt2)/Main Street PM Peak Hour
02/14/2019 Synchro 10 ReportPage 6
Movement EBL EBT EBR WBL WBT WBR NBL NBT NBR SBL SBT SBRLane ConfigurationsTraffic Volume (vph) 50 50 679 50 50 20 0 1520 687 0 1433 268Future Volume (vph) 50 50 679 50 50 20 0 1520 687 0 1433 268Ideal Flow (vphpl) 1900 1900 1900 1900 1900 1900 1900 1900 1900 1900 1900 1900Total Lost time (s) 4.0 4.0 4.0 4.0 4.0 4.0 4.0Lane Util. Factor 0.95 0.95 1.00 0.95 1.00 0.95 1.00Frpb, ped/bikes 1.00 1.00 0.99 1.00 1.00 1.00 1.00Flpb, ped/bikes 1.00 1.00 0.99 1.00 1.00 1.00 1.00Frt 0.89 0.85 0.98 1.00 0.85 1.00 0.85Flt Protected 0.99 1.00 0.98 1.00 1.00 1.00 1.00Satd. Flow (prot) 1419 1367 1595 3217 1439 3217 1439Flt Permitted 0.99 1.00 0.69 1.00 1.00 1.00 1.00Satd. Flow (perm) 1419 1367 1125 3217 1439 3217 1439Peak-hour factor, PHF 0.96 0.96 0.96 0.96 0.96 0.96 0.96 0.96 0.96 0.96 0.96 0.96Adj. Flow (vph) 52 52 707 52 52 21 0 1583 716 0 1493 279RTOR Reduction (vph) 0 72 159 0 5 0 0 0 0 0 0 0Lane Group Flow (vph) 0 343 237 0 120 0 0 1583 716 0 1493 279Confl. Peds. (#/hr) 20 20Turn Type Split NA Prot Perm NA NA custom NA customProtected Phases 7 7 7 8 6 5 5 2 1 1 7Permitted Phases 8Actuated Green, G (s) 27.0 27.0 19.4 86.1 62.1 86.1 93.1Effective Green, g (s) 27.0 27.0 19.4 86.1 62.1 86.1 93.1Actuated g/C Ratio 0.19 0.19 0.13 0.60 0.43 0.60 0.64Clearance Time (s) 4.0 4.0 4.0 4.0Vehicle Extension (s) 3.0 3.0 3.0 3.0Lane Grp Cap (vph) 265 255 151 1916 618 1916 927v/s Ratio Prot c0.24 0.17 c0.49 c0.50 0.46 0.19v/s Ratio Perm c0.11v/c Ratio 1.30 0.93 0.79 0.83 1.16 0.78 0.30Uniform Delay, d1 58.8 57.8 60.6 23.2 41.2 22.0 11.3Progression Factor 1.00 1.00 1.00 1.00 1.00 1.00 1.00Incremental Delay, d2 158.2 37.0 24.2 3.1 88.5 2.1 0.2Delay (s) 217.0 94.8 84.8 26.3 129.7 24.1 11.5Level of Service F F F C F C BApproach Delay (s) 157.3 84.8 58.5 22.1Approach LOS F F E C
Intersection SummaryHCM 2000 Control Delay 62.3 HCM 2000 Level of Service EHCM 2000 Volume to Capacity ratio 1.09Actuated Cycle Length (s) 144.5 Sum of lost time (s) 16.0Intersection Capacity Utilization 99.6% ICU Level of Service FAnalysis Period (min) 15Description: Dual Right Turn from Redwood Avenue - Option 2c Critical Lane Group

Improvement LocationCaltrans Study or
Documentation Needed Additional
Notes
Corridor Level
Protected Bike Lanes within Shoulder Area (no on-street parking) – includes raised buffer for bikeway protection -
Caltrans Design Standard Decision Document (DSDD) Caltrans requires a DSDD if there is a net reduction in shoulder width. Although an on-street parking lane counts as a shoulder, a bikeway with a permanent vertical barrier does not count as part of the shoulder. Documentation will be needed to justify the variance. Relevant Caltrans support for Class IV bikeways:
Relevant Caltrans support for Class IV bikeways:
- Refer to Design Information Bulletin Number 89-01 (Caltrans Class IV Bikeway Guidance) as well as guidance from FHWA
- Deputy Directive 64-R-2, the Caltrans Complete Streets Policy, requires that the safety and mobility needs of bicyclists are addressed in all projects, regardless of funding where they are legal highway users, which includes El Camino Real
Lane Widths < 11’ -DSDD Caltrans Standard of minimum 11-foot urban lane
widths (Index 301.1 of Highway Design Manual) – documentation needed to justify variance
Multiple Access Restrictions and Signal Modifications -Network Traffic Analysis (Existing and Existing + Project Scenario)
Documentation of circulation changes and impacts to overall delay on El Camino Real to give city maximum flexibility to pursue multiple phasing options
Bus Boarding Islands (In-Lane) -
- Network Traffic Analysis (Existing and Existing + Project Scenario) - Document applicable design guidelines (VTA, NACTO, etc.)
Caltrans is supportive based on multi-modal benefits
Median Refuges (6’) - Refer to details in Caltrans Standard Plan A88B
Canopy Trees -
Caltrans-approved sight distance study required for longitudinal set back from crosswalk of less than 100’ (applicable at PHB locations)
Caltrans prefers minimum 100’ longitudinal setback from intersection or signalized crosswalk.
Caltrans Standards require 18” lateral clearance from trunk of tree to face of curb.
Caltrans Design Review: Required Studies

Improvement LocationCaltrans Study or
Documentation NeededAdditional
Notes
Intersection Level
Protected Corner / Intersection Maple St, Roosevelt Ave, Lathrop St, Oak Ave, Laurel/Hazel St
Document applicable design decision process (refer to Addressing Safety at Intersections section of this report)
Document applicable design guidelines (MassDOT, FHWA, etc.)
No Caltrans standard for protected intersections
New Signalized Crosswalk Maple St, Roosevelt Ave, and Charter St
Network traffic analysis (see Corridor Level improvements)
Document need for crosswalk (Refer to performance measure results in this report)
Raised Bicycle Crossing Beech St, Chestnut St, and Pine St
Document applicable design decision process (refer to Addressing Safety at Intersections section of this report)
Document applicable design guidelines (MassDOT, FHWA, etc.)
Caltrans prefers raising the crossing 3-4 inches maximum to be sensitive to bicyclists
Right Turn Pocket Removal Maple St, Lincoln Ave, Roosevelt Ave, and Oak Ave
Network traffic analysis (see Corridor Level improvements)
Median Extension (With Restricted Access from Mainline) Beech St, Chestnut St Network traffic analysis
(see Corridor Level improvements)
Median Extension (With Restricted Access from Side Street Only) Lincoln Ave N/A No study requirement if impact is outside Caltrans
right-of-way
Pedestrian Hybrid Beacon (PHB) Beech/Lincoln and Laurel St Network traffic analysis (see Corridor Level improvements)
Shared Right Turn Zone Manzanita St, Willow St, Hemlock Ave and Charter St
Network traffic analysis (see Corridor Level improvements)
Document applicable design guidelines (NACTO, FHWA, etc.) and design decision process (refer to Addressing Safety at Intersections section of this report)
Roadway Re-Alignment (Adding Access from Mainline with addition of fourth leg) Roosevelt Ave Possible Intersection Control Evaluation (ICE) Report
Signal Removal Chestnut St
Network traffic analysis (see Corridor Level improvements) -Must demonstrate that projected intersection volumes no longer satisfies signal warrant analysis
Roadway Re-A lignment with New Signal Added Main St
Network traffic analysis (see Corridor Level improvements)
Possible ICE Report -Consider using results of roundabout analysis from Redwood City Corridor Plan (include delay implications as well as right-of-way impacts) -New signal analysis to reflect updated design assumptions from this study (right-of-way impacts as well as bicycle phasing, closure of receiving lanes from slip lane, turn pocket lengths and queueing
Leading Pedestrian Interval (LPI) Roosevelt Ave, Oak Ave, and Charter St Network traffic analysis (see Corridor Level improvements)
Slip Lane Removal Main St, Laurel / Hazel StN/A No study requirement if final curb radii accommodates
appropriate design vehicle per Caltrans Highway Design Manual Chapter 400
Improved Lighting Woodside Rd Underpass Lighting study using Caltrans Traffic Manual (Chapter 9)
Barrier for Pedestrians on Sidewalk (Freeway Underpass) Woodside Rd Underpass N/A Coordinate with Caltrans review in advance for acceptable design guidance
Removal of Receiving Lane From Slip Lane Woodside Rd Underpass (southbound) Network traffic analysis (see Corridor Level improvements)