Benefits of X-ray CMT for the modelling of C/C...
28
Benefits of X-ray CMT for the modelling of C/C composites Gerard L. Vignoles *, O. Coindreau*, C. Mulat* , °, C. Germain°, J. Lachaud* *LCTS – UMR 5801 CNRS-Université Bordeaux 1-Safran-CEA, 3, Allée La Boëtie 33600 Pessac °IMS- UMR5218 CNRS-Université Bordeaux 1- ENSEIRB - ENSCBP C/C composites have application in very demanding areas like aerospace, fusion technology, etc ... and thus their optimization is crucial, both in the control of processing routes and in the prediction of their behaviour in use. Intense modelling efforts have been developed in these directions. To help a direct application on actual materials, with possibly complex reinforcement architectures, X-ray Computerized Micro-Tomography (CMT) is a beneficial technique, since it allows producing extremely detailed representations on these architectures. However, there is a long way from the crude X-ray projections to the information that is directly usable in C/C composite modelling. This talk summarizes several achievements in this domain and discusses the obtained results, concerning (i) composites imaging by phase contrast CMT and holographic CMT, (ii) evaluation of effective geometrical and transfer coefficients in fibre arrangements and actual composites, (iii) modelling of degradation by ablation and (iv) modelling of processing by chemical vapour infiltration. Keywords: X-ray microtomography, phase contrast imaging, holotomography, carbon/carbon composites, physico-chemical modelling.
Transcript of Benefits of X-ray CMT for the modelling of C/C...

Benefits of X-ray CMT for the modelling of C/C
composites
Gerard L. Vignoles*, O. Coindreau*, C. Mulat*,°, C. Germain°, J. Lachaud*
*LCTS – UMR 5801 CNRS-Université Bordeaux 1-Safran-CEA, 3, Allée La Boëtie
33600 Pessac
°IMS- UMR5218 CNRS-Université Bordeaux 1- ENSEIRB - ENSCBP
C/C composites have application in very demanding areas like aerospace, fusion technology,
etc ... and thus their optimization is crucial, both in the control of processing routes and in the
prediction of their behaviour in use. Intense modelling efforts have been developed in these
directions.
To help a direct application on actual materials, with possibly complex reinforcement
architectures, X-ray Computerized Micro-Tomography (CMT) is a beneficial technique, since
it allows producing extremely detailed representations on these architectures. However, there
is a long way from the crude X-ray projections to the information that is directly usable in
C/C composite modelling. This talk summarizes several achievements in this domain and
discusses the obtained results, concerning (i) composites imaging by phase contrast CMT and
holographic CMT, (ii) evaluation of effective geometrical and transfer coefficients in fibre
arrangements and actual composites, (iii) modelling of degradation by ablation and (iv)
modelling of processing by chemical vapour infiltration.
Keywords: X-ray microtomography, phase contrast imaging, holotomography, carbon/carbon
composites, physico-chemical modelling.

TEXT
1. INTRODUCTION
Fibre-reinforced carbon-matrix (C/C) composites are dedicated to very high-performance and
high-cost applications, mainly in the domain of aerospace technology [1], as thermal
protection systems, rocket engine hot parts, or aircraft brakes, as well as plasma-facing
components in Tokamak reactors [2]. Design, fabrication and characterization of this class of
materials involve large efforts towards the best possible quality, in terms of mechanical and
thermal performances, and resistance to physico-chemical erosion. Since the fabrication
processes and the high-temperature tests are extremely expensive, there is an evident interest
in increasing as much as possible the knowledge on the involved physics and chemistry, in
order to produce reliable modelling approaches. One part of the knowledge on the C/C
materials that has to enter the modelling approaches is a sound description of the composite
morphology, which may be rather complex in some cases. This is where the use of X-ray
Computed Micro-Tomography brings help, because of its exceptional capacity for the
acquisition of large, accurate 3D images of the material structure.
There are various stages of the material life where X-ray CMT has an interest: first, in the
study of the material fabrication, when the carbon matrix is progressively inserted in the
arrangement of carbon fibres; second, when the composite is ready for use and one wants to
evaluate its properties; third, when it is used in a harsh environment, in order to evaluate its
degradation. In this paper, we will try to review some CMT-based modelling efforts in these
three directions. The first part will address the preliminary duty of 3D image (block)
acquisition, which in the case of synchrotron X-ray CMT is already an issue; the second part
recalls some results on the assessment of geometrical and transport properties in C fibre

preforms partly infiltrated with C matrix, and addresses infiltration modelling; and the third
one discusses the use of CMT for the characterization, modelling and simulation of C/C
composite ablation. Finally, some conclusive remarks and guidelines are given.
2. IMAGE ACQUISITION AND PROCESSING
In order to have a good representation of the C/C composite architecture, CMT scans may be
performed at various scales: indeed, the diameter of a single fibre is roughly 14 µm, while the
space period of the textile arrangement may span several millimetres. Fortunately, all these
scales are accessible to X-ray CMT, using classical X-ray sources for the largest ones and
Synchrotron Radiation X-ray CMT (XRCT) for the smallest. However, in this last case, one
has not a direct access to the density distribution in the material. Indeed, the difference
between the absorption coefficients of the carbon fibres, the carbon matrix, the embedding
matrix that has sometimes to be used in sample preparation, and air is small and the contrast is
faint. Nonetheless, the highly coherent character of the quasi-parallel, monochromatic X-ray
beam from synchrotron sources allows for characterizations based on the refractive index
contrasts, which are approximately 1000 times larger than the absorption contrasts [3]. Two
approaches are then possible: first, the complete refraction index reconstruction, called
holotomography, and second, the phase-contrast edge-detection mode, associated to image
processing for the segmentation of the constitutive phases. These extra difficulties partly
explain why there has been a large time gap between the first successful characterizations of
the structure of SiC fiber cloth lay-up preforms at bundle scale (pixel size of 15.6 mm) [4,5]
and the same kind of work on C/C composites.
Details on the experimental procedure have been given in [6,7]. The samples were raw and
partly infiltrated C fibre preforms made of stacked satin weaves held together by stitching;
they have been scanned with a 0.7 µm voxel edge size resolution, using the setup of the ESRF
ID 19 beamline [ID19]. Lower resolution scans (6.7 µm/voxel) were also made on the same

samples, in order to connect with a maximal confidence the fibre-scale and larger scales, like
the Representative Elementary Volume (REV) scale. Figure 1 displays a lower resolution
image of the whole sample, the upper part of which has been scanned with higher resolution.
Fig. 1.
2.1. Holotomography : results
The first step of holotomographic acquisition [8] is to perform various (3 or 4) classical
tomographic acquisitions, with distinct values of the detector-to-sample distance. Then, it is
possible to combine together the various projections obtained at the same angle in order to
produce a “phase projection” for each angle. Finally, all phase projections are used in a
classical reconstruction algorithm, resulting in a 3D map of the imaginary absorption
coefficient (or refraction index decrement) . Applied to C fibre preforms partially infiltrated
with pyrocarbon and embedded in a polycarbonate resin [6] yields results as illustrated in
Figure 2: since is closely related to the local material density, it is possible to infer from the
map a distribution of density, with quantitative values, accurate within 1% error. So, for
example, carbon fibres ( ~1.7 g.cm-3) and pyrocarbon ( ~2.0 g.cm-3) are neatly
distinguished from each other. Direct segmentation is then feasible, turning easier all posterior

image processing and quantification. However, a problem arises in the case of fibres lying
perpendicularly to the sample rotation axis: their very high aspect ratio, combined to the
strong sensitivity of the detection method, produces blurring artefacts. Indeed, there is a large
difference between the phase lag obtained when projecting in parallel and perpendicular
directions with respect to these fibres; using only 3 or 4 projections for the phase projection
image construction is not enough in this case. So, even if useful local information is available,
it is not possible to obtain a full representation of the material.
Fig. 2a) Fig. 2b)
2.2. Phase-contrast edge-detection tomography
The alternate approach is to apply image processing to the tomographic reconstruction
obtained with only one set of projections, with a sample-to-detector distance chosen such as
Fresnel fringes are clearly visible [9,10]. This provides a strong edge-enhancement effect at
any material discontinuity, which has principally been used in a qualitative way. However,
there are possibilities of extracting a full representation of the material phases through image
processing techniques. In the case of C/C composites, a first algorithm has been developed for
the separation of void (or resin) and solid phases, which display the strongest edge-
enhancement effect [11]. It consists in a region-growing algorithm, preceded by a hysteresis

step which ensures the continuity of the edge-enhancement pattern. The result of this
procedure, applied to a raw fibre preform, is illustrated in Figure 3.
Fig. 3.
Later on, more elaborate techniques have been applied, in the aim of providing a full
segmentation of fibres, matrix and void phases. For instance, Martin-Herrero and Germain
[12] have designed and successfully tested an algorithm based on a differential profiling
method to detect areas between intensity edges on every 2D cross section parallel to the
reference system, which are then refined by correlating the outputs in 3D, followed by a
“heavy-ball” fibre individuation procedure. Another method [13] uses directly the image
gradient (and principally the edge-enhancement patterns) for the estimation of the localization
of fibre axes; once the axes have been isolated, a gradient-sensitive region-growing procedure
may be applied for the segmentation of the fibres first and then of the matrix. The result of
this algorithm is presented in figure 4.
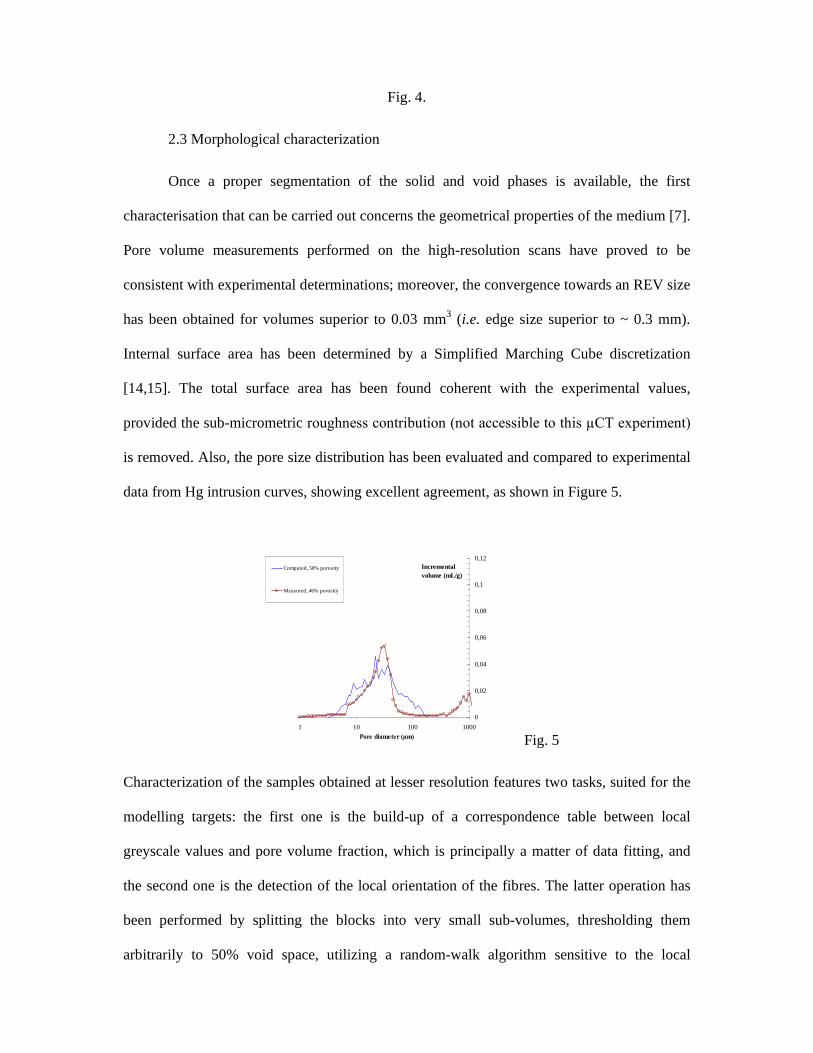
Fig. 4.
2.3 Morphological characterization
Once a proper segmentation of the solid and void phases is available, the first
characterisation that can be carried out concerns the geometrical properties of the medium [7].
Pore volume measurements performed on the high-resolution scans have proved to be
consistent with experimental determinations; moreover, the convergence towards an REV size
has been obtained for volumes superior to 0.03 mm3 (i.e. edge size superior to ~ 0.3 mm).
Internal surface area has been determined by a Simplified Marching Cube discretization
[14,15]. The total surface area has been found coherent with the experimental values,
provided the sub-micrometric roughness contribution (not accessible to this µCT experiment)
is removed. Also, the pore size distribution has been evaluated and compared to experimental
data from Hg intrusion curves, showing excellent agreement, as shown in Figure 5.
0
0,02
0,04
0,06
0,08
0,1
0,12
1 10 100 1000Pore diameter (µm)
Incremental volume (mL/g)
Computed, 50% porosity
Measured, 46% porosity
Fig. 5
Characterization of the samples obtained at lesser resolution features two tasks, suited for the
modelling targets: the first one is the build-up of a correspondence table between local
greyscale values and pore volume fraction, which is principally a matter of data fitting, and
the second one is the detection of the local orientation of the fibres. The latter operation has
been performed by splitting the blocks into very small sub-volumes, thresholding them
arbitrarily to 50% void space, utilizing a random-walk algorithm sensitive to the local

anisotropy, and extracting the eigenvectors and eigenvalues of the pseudo-diffusion tensor.
The largest eigenvalue indicates the direction of preferred diffusion, which is assimilated to
the local fiber orientation
High anisotropy
Low anisotropy
High anisotropy
Low anisotropy
Fig. 6
3. PHYSICO-CHEMICAL MODELING FOR CVI BASED ON CMT IMAGES
a. Context : Chemical Vapour Infiltration
Carbon-carbon composites are produced, among other processes, by chemical vapour
infiltration (CVI): a heated fibrous preform is infiltrated by the chemical cracking of a vapour
precursor of the matrix material inside the pore space of the preform[16]. The quality of
materials prepared by CVI relies on processing conditions (such as vapour precursor
concentration, temperature and pressure), as well as on intrinsic properties of the preform.
Experimental determination of the conditions which lead to an optimal infiltration is time-
consuming and expensive. That is the reason why a global modelling of CVI is of great
interest to optimize the final density and homogeneity of the composites [17-22]. This
modelling requires a good knowledge of geometrical characteristics and transport properties
of the preform at various stages of infiltration [23], namely: the effective gas diffusivity,

either in continuum or in rarefied regime, the gas permeability to viscous flow, and the heat
conductivity, in the case of thermal-gradient modifications of CVI [24].
b. Gas transport
Effective transport coefficients are calculated in high-resolution images with a random walk
algorithm, making use of our surface triangulation scheme. Indeed, there are three diffusion
regimes depending on the Knudsen number Kn, which is the ratio between the mean free path
of the molecules and the pore diameter : the ordinary regime (Kn << 1), the transition regime
(Kn ~ 1), the Knudsen or rarefied regime (Kn >> 1), all three of importance in CVI. The
random walk performed by the molecules introduced in the void space is directly linked to the
Knudsen number and it allows to determine the effective diffusivity tensor D at any value of
Kn. Tortuosity factors (ij) are then calculated using the equation ij = Dref.Dij-1 where is
the porosity and Dref the gas diffusivity in void space. Fig. 7 is an example of the results
produced by this method for Knudsen transport in transverse direction in numerous sub-
samples with 100x100x100 cubic voxels size [25]. The laws that have been fitted to the
values computed from the CMT sub-samples are somewhat intermediate between ideal media
made of random straight cylinders: parallel (1D) with or without overlap, grouped into mats
(2D), or isotropic (3D). Although most of the fibres are rather locally oriented in a parallel
fashion, it appears that the 1D models are not the most suited to describe them. Indeed, the
discrepancies with the 1D non-overlapping, random cylinder ideal media arises principally
from the non-strict alignment between contiguous fibres, a fact which lowers considerably the
percolation threshold [26].

Fig. 7
Estimates of the gas transport properties at a larger scale have been performed using a second
change-of-scale strategy based on the correlation between greyscale levels and pore space,
plus the computation of the local fibre orientation as mentioned earlier. Fig. 8 shows a
reasonable agreement with experimental determinations performed at our lab [25].
Fig. 8
c. Heat conduction

In the case of heat conduction, it has been possible to provide a direct comparison with
experimental data. The microscopic laws have been produced through the study of ideal
structures made of an isotropic fibre surrounded by an anisotropic pyrocarbon deposit (with
cylindrical symmetry). Values for the individual components have been selected from
experimental measurements at LCTS[28] and CEA[29], and inserted into a periodic unit cell
effective property computation code. By varying the pyrocarbon volume fraction, taken as (0
- ), a microscopic-scale law has been produced. Then, the second change of scale performed
on low-resolution images with local orientation detection gave predictions in good agreement
with direct experimental thermal measurements on the composites [30], as shown in fig. 9.
d. Infiltration
Finally, an adaptation of the Monte-Carlo Random-Walk algorithm has been designed for the
fibre-scale modelling of chemical vapour infiltration. It allows an easy handling of sticking
events for the walkers, the sticking coefficient being computed from the diffusion/reaction
ratio ; in case of surface growth, the surface triangulation update is fast and efficient thanks to
the Simplified Marching Cube algorithm. A closed porosity detecting routine is used to avoid
unrealistic pore infiltration. Fig. 10 is an example of infiltration movie obtained on a
100x100x100 cubic voxels image. Moderate values of the mean free path and sticking
probabilities have been chosen. The total infiltration has been run in 6 hours 30 on a Pentium4
CPU with 3.2 GHz clock rate. Such a kind of program is able to deliver a precise evolution of
the internal surface area and transport properties (diffusivities, etc …) as a function of
infiltration progress, which is a valuable tool for large-scale infiltration modelling [31].
4. ABLATION STUDY
Another application domain in which X-ray CMT has proved useful is the study of ablation of
C/C composites. This phenomenon is well known to occur when the material is exposed to

extreme conditions of heat and chemical aggression, e.g. oxidants. It participates to thermal
protection because it is globally endothermic [32]. C/C composites are used as ablative
thermal protection systems for atmospheric re-entry and as rocket nozzles because they offer
the best performance/weight ratio at the very elevated temperatures to which they are exposed
[1].
Ablation of C/C composites leads to a typical surface roughness which induces an
enhancement of heat and mass transfer between the protection wall and the surrounding
environment via two major phenomena: (i) it increases the chemically active surface of the
wall; (ii) it contributes to the laminar-to-turbulent transition in the dynamic boundary layer.
The NASA PANT program results show that the heat flux may be multiplied by a factor up to
three in turbulent regime [33]. The obvious consequence is a considerable enhancement of
global ablation velocity. So, it is of utmost importance to understand what mechanisms lead to
the acquisition of a surface roughness and how they work. In this context, a characterization
and modelling study has been developed [34-37]. The first step was a qualitative study of the
surface morphology, which helped settling the physical bases for the phenomena. Principally,
the morphologies are guided by differences of chemical reactivity between constituents, and
by the competition between heterogeneous transfer (i. e. chemical reaction) and bulk transfer.
Analytical [38] and numerical [39,40] simulations of a simple diffusion/reaction model with
surface recession have been performed on composites containing fibre bundles perpendicular
to the average surface, and the denuded fibre tip height and angle are shown to be in direct
relationship with the fibre/weak phase reactivity ratio and to the diffusion/reaction ratio.
Accordingly, a measurement of these parameters on actual surfaces provides an identification
of these quantities. Here, high-resolution X-ray CMT is a very interesting tool since it allows
easily such measurements. The fact that the images of C/C composites are principally phase
contrast images even makes the measurement easier. Figure 11 displays the case of the same

material ablated in two ways: the left image is obtained in a simple oxidation test at 625°C
[41], while the right image results from ablation in a plasma jet facility. We can easily see that
the Sherwood number, which measures the reaction/diffusion rate ratio, is neatly higher in the
second case: this could be expected from the more sever nature of the test in this case.
5. CONCLUSION AND OUTLOOK
This paper has summarized some efforts made in the characterization of C/C composites as a
tool for modelling their lifecycle, featuring preparation by chemical vapour infiltration and
ablation. High-resolution X-ray tomographic imaging has proved extremely valuable, even
though the phase contrast mode was most frequently encountered. The studies have involved
image processing and pattern recognition, morphological analysis, and direct numerical
simulation of reaction/diffusion systems with moving boundaries. Results show that the
assessment of geometrical and transport properties throughout the material evolution is
possible on the basis of phase-contrast CMT images ; the incorporation of the structure-
property relationships in large-scale models of processes and/or degradation tests is indeed of
large value and is still currently undergoing.
Further directions are the development of more adapted holotomographic conditions,
imaging with off-axis fibres, and the extension of the computational procedures to larger
datasets.
References
[1] G. Savage, Carbon/Carbon composites, Chapman & Hall, London, 1993.
[2] H.C. Mantz, D.A. Bowers, F.R. Williams, M.A. Witten, in Proceedings – IEEE 13th
Symposium on Fusion Engineering vol. 2, IEEE-89CH2820-9, 1990, 947.

[3] P. Cloetens, W. Ludwig, J. P. Guigay, J. Baruchel, M. Schlenker, D. Van Dyck, in : X-ray
tomography in material science (Eds : J. Baruchel, J.-Y. Buffière, E. Maire, P. Merle, G.
Peix,) Hermès, Paris, 2000, 30.
[4] J. H. Kinney, T. M. Breunig, T. L. Starr, D. Haupt, M. C. Nichols, S. R. Stock, M. D.
Butts, R. A. Saroyan, Science 1993, 260, 789.
[5] S-B. Lee, S. R. Stock, M. D. Butts, T. L. Starr, T. M. Breunig, J. H. Kinney, J. Mater. Res.
1998, 13, 1209.
[6] O. Coindreau, P. Cloetens, G. L. Vignoles, Nucl. Instr. and Meth. in Phys. Res. B 2003,
200, 295.
[7] O. Coindreau, G. L. Vignoles, J. Mater. Res. 2005, 20, 2328.
[8] P. Cloetens, W. Ludwig, J. Baruchel, D. Van Dyck, J. Van Landuyt, J. P. Guigay, M.
Schlenker, Appl. Phys. Lett. 1999, 75, 2912.
[9] M. Ando, S. Hosoya, in Proc. 6th Intern. Conf. On X-ray Optics and Microanalysis (Eds.
G. Shinoda, K. Kohra, T. Ichinokawa), Univ. of Tokyo Press, Tokyo, 1972, 63.
[10] P. Cloetens, M. Pateyron-Salomé, J.-Y. Buffière, G. Peix, J. Baruchel, F. Peyrin, M.
Schlenker, J. Appl. Phys. 1997, 81, 5878.
[11] G. L. Vignoles, Carbon 2001, 39, 167.
[12] J. Martín-Herrero, C. Germain, Carbon 2007, 45, 1242.
[13] C. Mulat, M. Donias, P. Baylou, G. L. Vignoles, C. Germain, J. Electronic Imaging
2008, 17, 0311081.
[14] G. L. Vignoles, J. Phys. IV France 1995, C5, 159.
[15] M. Donias, G. L. Vignoles, C. Mulat, C. Germain, submitted to IEEE Trans. on
Visualization & Computer Graphics 2008.

[16] R. Naslain, F. Langlais, High Temperature Science, 1990, 27, 221
[17] T. L. Starr, A. W. Smith, Mat. Res. Soc. Symp. Proc. 1992, 250, 207. [18] P. McAllister, E. E.Wolf, AIChE J., 1993, 39, 1196.
[19] G. L. Vignoles, C. Descamps, N. Reuge, J. Phys. IV France 2000, 10, Pr2-9.
[20] N. Reuge, G. L. Vignoles, J. Mater. Proc. Technol 2005, 166, 15.
[21] D. Leutard, G. L. Vignoles, F. Lamouroux, B. Bernard, J. Mater. Synth. and Proc. 2002,
9, 259.
[22] I. Golecki, Mater. Sci. Eng. 1997, R20, 37.
[23] J. Y. Ofori, S. V. Sotirchos, J. Electrochem. Soc. 1996, 143, 1962.
[24] G.L. Vignoles, J.M. Goyhénèche, P. Sébastian, J.R. Puiggali, J.F. Lines, J. Lachaud,
P. Delhaès, M. Trinquecoste, Chem. Eng. Sci. 2006, 61, 5336.
[25] G. L. Vignoles, O. Coindreau, A. Ahmadi, D. Bernard, J. Mater. Res. 2007, 22, 1537.
[26] O. Coindreau, G. L. Vignoles, J.-M. Goyhénèche, in Advances in Ceramic-Matrix
Composites XI (Eds: N. P. Bansal, J. P. Singh and W. M. Kriven), Ceram. Trans. 175, Wiley,
New York, 2005, 77.
[27] O. Coindreau, G. L .Vignoles, in Advanced Materials Forum II (Eds.: R. Martins, E.
Fortunato, I. Ferreira and C. Dias) Mater. Sci. Forum 455-456, Trans. Tech. Publications,
Zurich 2004, 751.
[28] C. Sauder, PhD dissertation, Université Bordeaux 1 (2001).
[29] J. Jumel, F. Lepoutre, J-P. Roger, G. Neuer, M. Cataldi, F. Enguehardt, Rev. Sci. Instrum.
2003, 74, 537.
[30] D. Demange, J. C. Laizet, Technical Report RT 1/03519 DMSC, ONERA, Châtillon,
France (2000).
[31] G. L. Vignoles, in Advanced Fibrous Inorganic Composites V (Ed: P. Vicenzini) Adv.
Sci. Technol. 50, Trans Tech Publications, Zürich 2006, 97.
[32] J. Couzi, J. de Winne, B. Leroy, in Proc. 3rd Eur. symp. on Aerothermodynamics for
space vehicles. Noordwijk, The Netherlands: ESA 1998, 493.
[33] M. D. Jackson MD. Report SAMSO-TR7486 of Passive Nosetip Technology (PANT)
Program No. 15, 1974.
[34] Y. Aspa, M. Quintard, F. Plazanet, C. Descamps, G. L. Vignoles, in Mechanical
Properties and Performance of Engineering Ceramics and Composites, (Eds.: E. Lara-Curzio,
D. Zhu and W. M. Kriven), Ceram. Eng. and Sci. Proc. 26(2), Wiley, New York 2005, 99.
[35] J. Lachaud, G. L. Vignoles, J.-M. Goyheneche, J.-F. Epherre, in Thermochemistry and
Metrology of Interfaces, (Ed.: L. P. Cook), Ceram. Trans. 191, The American Ceramic
Society, Westerville, OH 2005, 149.
[36] G. L. Vignoles, J. Lachaud And Y. Aspa, in Proc. 5th European Workshop on Thermal
Protection Systems and Hot Structures, (Ed. : K. Fletcher), ESA Conf. Procs. SP-631, ESA
Publications, Noordwijk, The Netherlands 2006 (CDROM)
[37] G. L. Vignoles, J. Lachaud, Y. Aspa, J.-M. Goyhénèche, Compos. Sci. and Technol.
2008, DOI:10.1016/j.compscitech.2008.09.019.
[38] J. Lachaud, Y. Aspa, G. L. Vignoles, Int. J. Heat and Mass Transfer 2008, 51, 2614.
[39] Y. Aspa, J. Lachaud, G. L. Vignoles, M. Quintard, in Proc. 9th joint AIAA/ASME
Thermophysics and Heat Transfer Conference, AIAA Papers 2006 ref. 2006-2911, 52
[40] J. Lachaud, G. L. Vignoles, Comput. Mater. Sci. 2008, DOI:
10.1016/j.commatsci.2008.07.015

[41] J. Lachaud, N. Bertrand, G. L. Vignoles, G. Bourget, F. Rebillat, P. Weisbecker, Carbon
2007,45, 2768.
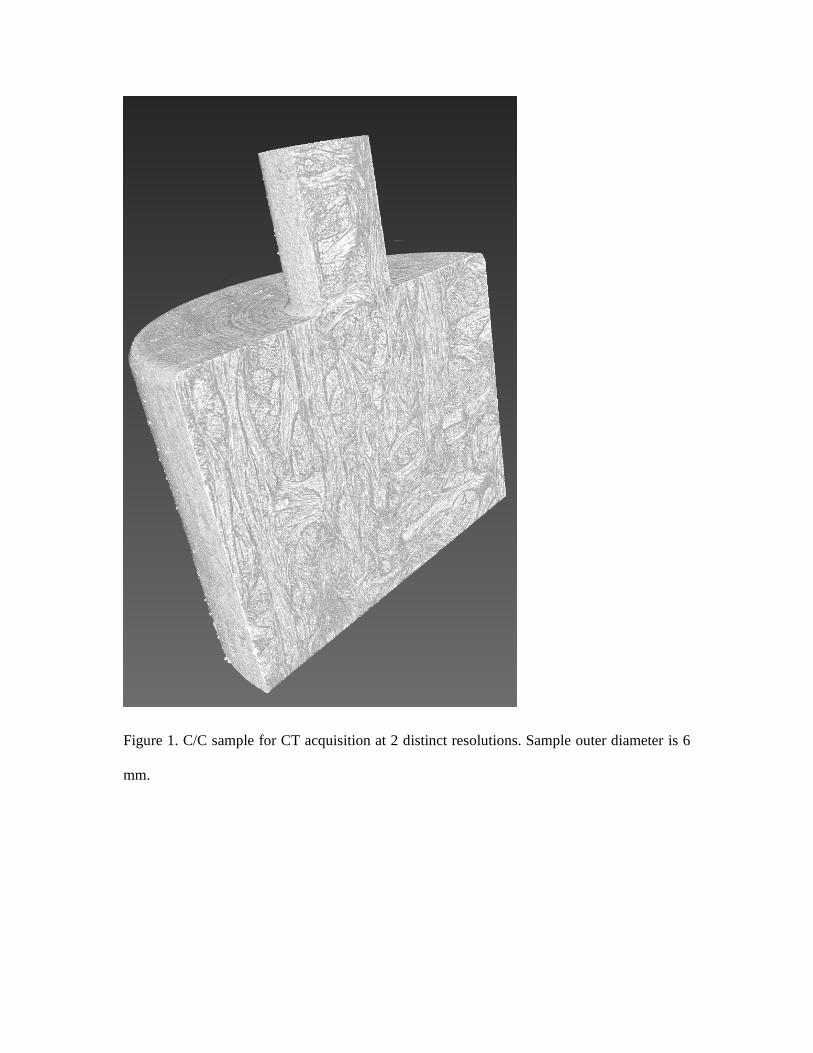
Figure 1. C/C sample for CT acquisition at 2 distinct resolutions. Sample outer diameter is 6
mm.

a)
b)
Figure 2. 3D renderings of a C/C sample, as scanned by holotomography. Fibres, matrix and
void space are directly segmentable in the perpendicular bundles. Parallel bundles are blurred.

Figure 3. Segmentation of C fibres in a raw preform from an edge-detection tomography.
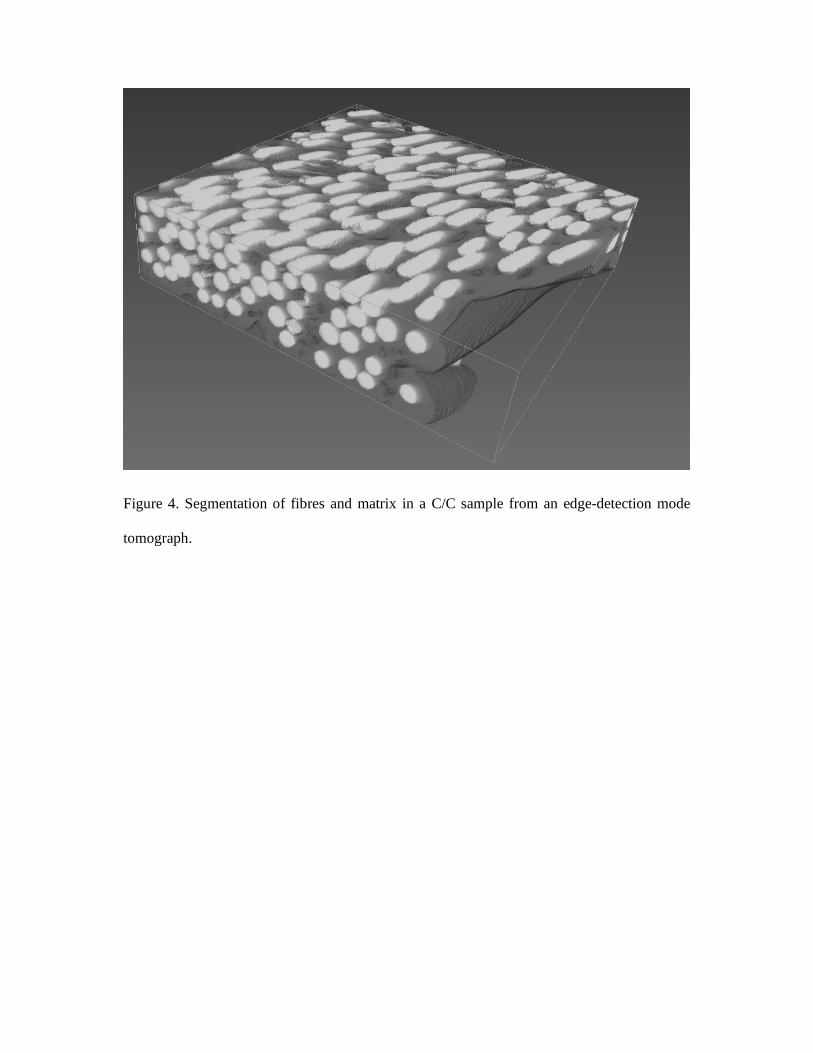
Figure 4. Segmentation of fibres and matrix in a C/C sample from an edge-detection mode
tomograph.

0
0,02
0,04
0,06
0,08
0,1
0,12
1 10 100 1000Pore diameter (µm)
Incremental volume (mL/g)
Computed, 50% porosity
Measured, 46% porosity
Figure 5. Comparison of experimental and modeled Hg intrusion data on C/C samples with
~50% pore volume fraction.

High anisotropy
Low anisotropy
High anisotropy
Low anisotropy
Figure 6 : Visual inspection of the efficiency of the local anisotropy detector : the direction of
highest conductivity is determined on 7x7x7 voxel size zones and are plotted as constant-
length arrows with color associated to the degree of anisotropy (highest-to-lowest eigenvalue
ratio).

1
10
100
0 0.2 0.4 0.6 0.8Pore volume fraction (-)
Transverse tortuosity in rarefied regime (-)
Partly infiltratedRaw preform
Fit on samples
3D random
2D random
1D random
1D random, non-overlapping
Ideal fibrous media (random cylinders)
X-ray µ-CT and image processing
11
10
100
0 0.2 0.4 0.6 0.8Pore volume fraction (-)
Transverse tortuosity in rarefied regime (-)
Partly infiltratedRaw preform
Fit on samples
3D random
2D random
1D random
1D random, non-overlapping
Ideal fibrous media (random cylinders)
X-ray µ-CT and image processing
1
10
100
0 0.2 0.4 0.6 0.8Pore volume fraction (-)
Transverse tortuosity in rarefied regime (-)
Partly infiltratedRaw preform
Fit on samples
3D random
2D random
1D random
1D random, non-overlapping
Ideal fibrous media (random cylinders)
X-ray µ-CT
1
10
100
0 0.2 0.4 0.6 0.8Pore volume fraction (-)
Transverse tortuosity in rarefied regime (-)
Partly infiltratedRaw preform
Fit on samples
3D random
2D random
1D random
1D random, non-overlapping
Ideal fibrous media (random cylinders)
X-ray µ-CT and image processing
1
Fig. 7. Tortuosity–porosity correlation plots for Knudsen transport in transverse direction.
Comparison of CMT data with correlations for ideal fibrous media.

Scaled Knudsen diffusivity DK/<v> (m)
1.00E-08
1.00E-07
1.00E-06
1.00E-05
1.00E-04
0 0.1 0.2 0.3 0.4 0.5 0.6 0.7 0.8
Pore volume fraction
measured (parallel)
measured (perpendicular)
computed (parallel)
computed (perpendicular)
Scaled Knudsen diffusivity DK/<v> (m)
1.00E-08
1.00E-07
1.00E-06
1.00E-05
1.00E-04
0 0.1 0.2 0.3 0.4 0.5 0.6 0.7 0.8
Pore volume fraction
measured (parallel)
measured (perpendicular)
computed (parallel)
computed (perpendicular)
1.00E-08
1.00E-07
1.00E-06
1.00E-05
1.00E-04
0 0.1 0.2 0.3 0.4 0.5 0.6 0.7 0.8
Pore volume fraction
measured (parallel)
measured (perpendicular)
computed (parallel)
computed (perpendicular)
Fig. 8. Comparison of computed and experimental values of Knudsen diffusivities.

Thermal conductivity at 20°C (W/m/K)
0.1
1
10
0.3 0.35 0.4 0.45 0.5 0.55 0.6 0.65 0.7 0.75Pore volume fraction
measured (parallel)computed (parallel)measured (perp.)computed (perp.)
Thermal conductivity at 20°C (W/m/K)
0.1
1
10
0.3 0.35 0.4 0.45 0.5 0.55 0.6 0.65 0.7 0.75Pore volume fraction
measured (parallel)computed (parallel)measured (perp.)computed (perp.)
Fig. 9. Comparison of computed and experimental values of thermal conductivities.

0
0.5
1
1.5
2
2.5
3
3.5
4
4.5
0 0.2 0.4 0.6 0.8 1
Pore volume fraction (-)
Scal
ed T
hiel
e M
odul
us (-
)
X directionY directionZ direction
0
0.5
1
1.5
2
2.5
3
3.5
4
4.5
0 0.2 0.4 0.6 0.8 1
Pore volume fraction (-)
Scal
ed T
hiel
e M
odul
us (-
)
X directionY directionZ direction
Fig. 10. An example of infiltration simulation in a 100x100x100 block. Mean free path : 1
voxel (0.7 µm) ; sticking probability : 0.166. The graph is the evolution of the scaled Thiele
modulus 0
00/
v
v DD
as the pore volume decreases.

Analytical
NumericalSteady state
Sh = kmrf/D
Analytical
NumericalSteady state
Sh = kmrf/D
Fig. 11 : Identification from X-ray CMT slices of the reaction/diffusion ratio on samples of a
C/C composite ablated in different conditions : left, oxidation in mild conditions, right,
plasma jet ablation.