BENCHMARKING BENCHMARKS: MEASURING … · Chapter 2: Benchmarking Benchmarks: Measuring...
26
BENCHMARKING BENCHMARKS: MEASURING CHARACTERISTIC SELECTIVITY USING PORTFOLIO HOLDINGS DATA Adrian D. Lee ∗ School of Banking and Finance Australian School of Business The University of New South Wales Phone: 02 9385 7864 Fax: 02 9385 6347 Email: [email protected] ∗ I am indebted to my supervisors Associate Professor David Gallagher and Dr. Kingsley Fong for their research direction and supervision. I am also grateful for the helpful comments from a number of individuals, including Doug Foster, Eric Smith and Scott Lawrence. I thank Vanguard Investments Australia for research support. This research was funded through an ARC Linkage Grant (LP0561160) involving Vanguard Investments Australia and SIRCA.
Transcript of BENCHMARKING BENCHMARKS: MEASURING … · Chapter 2: Benchmarking Benchmarks: Measuring...
BENCHMARKING BENCHMARKS: MEASURING CHARACTERISTIC
SELECTIVITY USING PORTFOLIO HOLDINGS DATA
Adrian D. Lee∗
School of Banking and Finance
Australian School of Business
The University of New South Wales
Phone: 02 9385 7864
Fax: 02 9385 6347
Email: [email protected]
∗I am indebted to my supervisors Associate Professor David Gallagher and Dr. Kingsley Fong for their research direction and supervision. I am also grateful for the helpful comments from a number of individuals, including Doug Foster, Eric Smith and Scott Lawrence. I thank Vanguard Investments Australia for research support. This research was funded through an ARC Linkage Grant (LP0561160) involving Vanguard Investments Australia and SIRCA.

Preface
Title of Thesis: TBA
Supervisors: Associate Professor David Gallagher and Dr. Kingsley Fong
Active equity fund management performance is reliant on a fund’s ability to exploit
private information while minimizing transaction costs (both implicit and explicit). My
thesis first considers the robustness of a popular benchmark used in the academic
literature in capturing fund abnormal return (or alpha). Second, I look at a strategy
using active equity fund stock holding information to form an alpha superior portfolio.
Third I look at the extent of which funds use well-known anomalies to outperform the
market. Finally I look at the ability of funds minimise transaction costs through the use
of multiple brokers.
My thesis is structured as follows:
Chapter 1: Introduction
Chapter 2: Benchmarking Benchmarks: Measuring Characteristic Selectivity Using
Equity Portfolio Holdings
Chapter 3: The Value of Alpha Forecasts in Portfolio Construction
Chapter 4: The Use of Anomalies by Active Fund Managers
Chapter 5: The Performance of Multiple Broker Trade Packages
Chapter 6: Conclusion
The following paper is based on Chapter 2.
Abstract
This study proposes methodological adjustments to the widely adopted performance
benchmarking methodology of Daniel et al. (1997) as a means of improving the
precision of alpha measurement for active equity fund managers. We achieve this by
considering adjustments for style migration and monthly updating of characteristic
benchmarks to ensure neutrality to the broad-based index. Applying this new
benchmark to a representative sample of active Australian equity funds in the period
January 1995 to June 2002, we find tracking error is almost halved while stock
selectivity is 0.14% lower compared with using the standard characteristic benchmark
methodology. The reduction in tracking error is robust when benchmarking funds by
style and by characteristics of stocks held. We also find tracking error is improved with
more characteristic portfolio sorts and longer holding periods consistent with literature
showing characteristic returns occur in annual cycles.
1. Introduction
Do active equity managers possess skill? Academics, investors, investment
consultants and the financial press have been debating this issue since fees associated
with actively managed funds should be justifiable. At the centre of this argument is an
accurate benchmark to quantify fund manager skill. While the literature has
demonstrated the impossibility of constructing a perfect benchmark1, improving
benchmarking methods remains an important area of research. In the case of stock
portfolios, benchmark construction philosophy has evolved from market capitalization
indexing to returns-based regression and holding based methodologies that adjust for
stock characteristics (or investment styles).
Daniel, Grinblatt, Titman and Wermers (1997) (hereafter DGTW), propose an
important method of incorporating style information in the use of characteristic-based
benchmarks. Research findings based on such benchmarks has re-opened the debate on
the value of active management. For U.S. mutual funds, DGTW (1997), Wermers
(2000) and Avramov and Wermers (2006), and in the Australian context Pinnuck
(2003) and Gallagher and Looi (2006), find active fund managers possess sufficient
skill to earn returns to cover their costs, consistent with the Grossman and Stiglitz
(1980) information equilibrium. This is in contrast to the literature over a number of
decades documenting that active funds possess no skill when assessed on their
aggregate net returns2.
The characteristic-based benchmark developed by DGTW (1997) utilizes a stock
holding performance measure based on passive benchmarks incorporating size, book-
to-market and momentum characteristics. This benchmark also includes a measure of
1 Using ex-ante inefficient benchmarks in mean-beta space results in performance measures which are
benchmark dependent (Roll (1977, 1978)). Indeed, Green (1986) and Lehmann and Modest (1987) find
performance evaluation rankings are sensitive to the benchmark employed. Similarly Chen and Knez
(1996) show there are an infinite set of admissible benchmarks of which provide an infinite number of
ranking orders. Also, Kothari and Warner (2001) and Pástor and Stambaugh (2002a, 2002b) identify
possible biases in performance measurement where returns-based measures are used in the estimation of
risk-adjusted performance (measured as the intercept in a returns regression).
2 See for example Jensen (1968), Malkiel (1995), Gruber (1996), Ferson and Schadt (1996).
1
Style Timing ability, as well as the average style return of a fund (the idiosyncratic
return a fund manager that is generated by simply holding stocks with particular
characteristics). A benefit of using benchmarks formed using portfolio holdings is the
ability of researchers to decompose a fund’s raw return into (1) stock selection ability,
(2) style timing, and (3) the returns accounted for by the characteristics of the actual
stocks held in a fund’s portfolio. They further argue that this improved ability to
explain the variance of fund returns reduces the standard error of estimating a fund's
skill.
The intuitive design and ease of implementation of the DGTW (1997) benchmark
has made it a popular choice by researchers with more granular portfolio information,
such as portfolio holdings3. Chan, Dimmock and Lakonishok (2006) also show
empirically that such benchmarking techniques work better in tracking passive styles
than either the regression or independent sorting techniques of Fama and French
(1996).
Our study proposes several modifications to the original DGTW benchmark
methodology in order to improve the benchmark’s ability to capture characteristic
returns. First, we consider weighting characteristic benchmarks based on the
composition of a commonly referenced broad-based index. In our case, this index is the
S&P/ASX 300 which Australian fund managers track. This design results in a
benchmark that assigns zero alpha to a pure capitalization-weighted index
representative of the investable universe. This feature is particularly relevant when a
fund’s mandate specifies a passive benchmark index that does not include all listed
securities to evaluate manager performance.4
3 See studies such as Chen, Hong, Huang and Kubik (2004) Coval and Moskowitz (2001) and
Kacperczyk, Sialm and Zheng (2005).
4 Chen and Knez (1996) state in Condition I that any portfolio return achievable by an uninformed
investor is automatically assigned zero performance. Most equity market indices such as S&P 500,
FTSE, Hang Seng, Nikkei, include far fewer stocks than all those listed in their corresponding market. In
the Australian context, we use month-end index weights to measure the alpha of the S&P/ASX 300, the
most commonly tracked and broad-based index in Australia cited by fund managers, using
characteristic-based benchmarks following DGTW (1997)/Pinnuck (2003) for the period January 1995
to June 2002. We find the alpha of the index to be on average 1.27% per year.
2
Second, by using a monthly portfolio formation approach, we incorporate more
timely characteristic-based information of a stock, compared with annual updating.
Also, we are able to assess the performance of a larger pool of stocks as opposed to the
annual portfolio formation approach. Using a monthly portfolio formation process also
improves tracking of the broad-based index due to monthly rebalancing of the
benchmark. Third, we employ an overlapping benchmark approach (similar to
Jegadeesh and Titman (1993, 2001)) to better match the characteristic return of a stock.
Fama and French (2007) find that stocks ‘migrating’ from value to growth (and vice
versa) and from small to large represents a significant factor in explaining the value
and size premiums. Thus, a stock’s return is assessed against a style benchmark
representing the stock’s average characteristic over the past L months, where L is the
number of periods of which a characteristic benchmark portfolio is held for. Using this
overlapping methodology also provides us with the flexibility to test different
benchmark portfolio holding (overlapping) lengths.
Applying this benchmark to monthly portfolio holdings of Australian active equity
managers, we find a near halving in tracking error volatility of the overlapping
benchmark compared with the DGTW benchmark from 2.11% to 1.26% per year for
the value-weighted sample of fund managers. Even when using a simpler non-
overlapping benchmark, where characteristic benchmarks are monthly value-weighted
and restricting to the S&P/ASX 300 Index, tracking error volatility is 1.34% thus
showing improvements to the benchmark with simple modifications.
The results are robust when we use the benchmarks to measure stock selection
ability with respect to fund style, and the characteristic of stocks held by funds with the
overlapping benchmark approach generally shows lower tracking error volatility across
groups than the non-overlapping benchmark method.
When adjusting the parameters of the overlapping benchmark, we find tracking
error is lower when increasing the number of characteristic portfolio sorts (and
therefore less stocks in each characteristic portfolio) and increasing the length at which
the benchmark is held from one to twelve months. This suggests a benchmark’s ability
to capture characteristic returns is improved when a stock is measured against a smaller
number of stocks with similar characteristics. Further, the improvements achieved
using longer holding periods (of up to twelve months) is consistent with the literature
on characteristic returns such as Fama and French (1992, 1996) and Jegadeesh and
3
Titman (1993, 2001) finding size, book-to-market and momentum effects occurring
over twelve-month periods.
The paper is structured as follows. Section 2 outlines the data used and this is
followed by the descriptive statistics in Section 3. Section 4 describes our
characteristic-based benchmark methodology. Section 5 presents our empirical results
and Section 6 concludes the paper.
2. Data
We collect month-end portfolio holdings data from the Portfolio Analytics
Database (PAD). This database comprises the holdings of 38 active Australian equity
fund managers (PAD funds hereafter). Further details of this database are detailed in
Gallagher and Looi (2006). Our sample period is from January 1995 to June 2002.
Monthly dilution-adjusted share returns, month-end market capitalization data are
extracted from the CRIF Share Price and Price Relative (SPPR) database.
Monthly returns of the S&P/ASX 300 Accumulation Index (S&P/ASX300A) are
sourced from SIRCA. The Aspect Financial database is used for financial year end
book value (Aspect item ID 7010). Month-end weight compositions of the S&P/ASX
300 are sourced from Vanguard Investments Australia.
3. Descriptive Statistics
Table 1 presents the average monthly weight distribution of stocks held by our fund
sample on a value-weighted basis sorted by size (MCAP), book-to-market ratio (BMC)
and prior 1-year return (PR1YR) deciles. MCAP is the month-end market
capitalization; BMC is the prior financial year book value over the month-end market
capitalization and PR1YR is the past 1-year return with one month lag. Panel A reports
the distribution using the S&P/ASX 300 universe of stocks in benchmark formation
and Panel B using the CRIF SPPR universe (i.e. all stocks listed on the Australian
Stock Exchange at any given time). There are approximately 260 stocks in the
S&P/ASX 300 universe5 and 950 stocks in the CRIF universe at any given time that
fulfils our data requirement above.
5 Aside from being unable to account for IPO stock holdings due to lack of past returns data, our other
limitations are the absence of book value data from the Aspect database for some stocks and omitting
non-ordinary stocks which are not in the CRIF SPPR database.
4
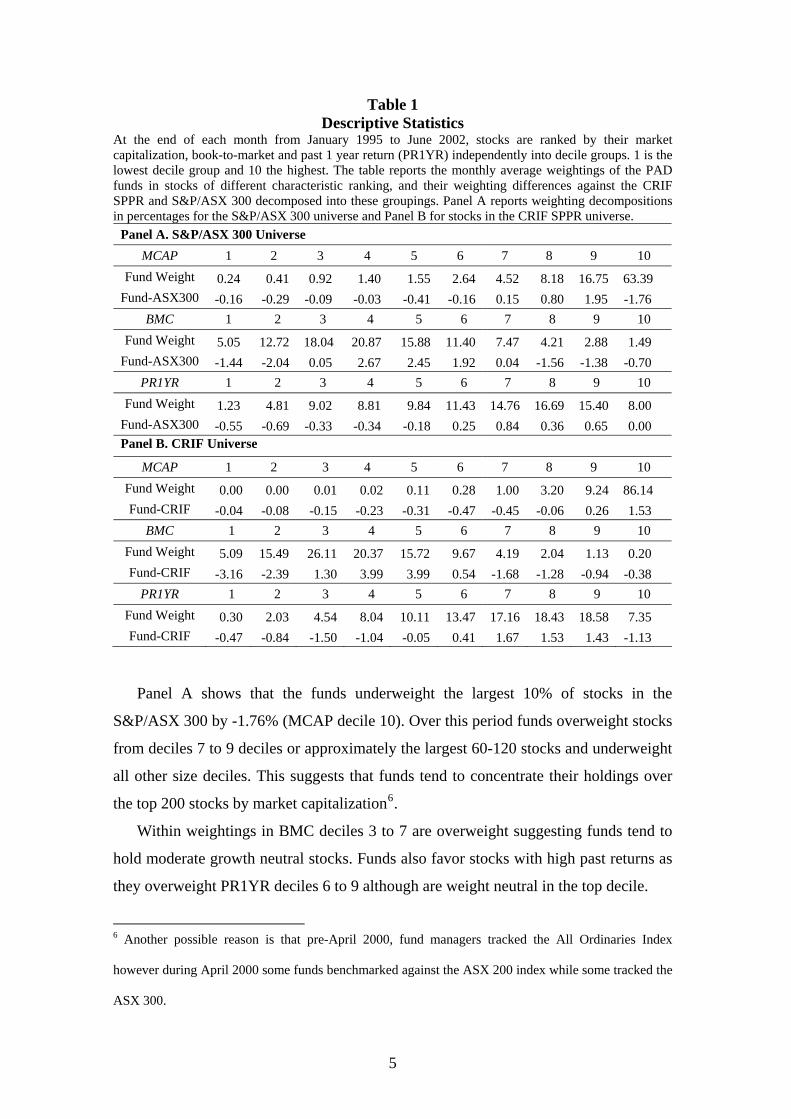
Table 1 Descriptive Statistics
At the end of each month from January 1995 to June 2002, stocks are ranked by their market capitalization, book-to-market and past 1 year return (PR1YR) independently into decile groups. 1 is the lowest decile group and 10 the highest. The table reports the monthly average weightings of the PAD funds in stocks of different characteristic ranking, and their weighting differences against the CRIF SPPR and S&P/ASX 300 decomposed into these groupings. Panel A reports weighting decompositions in percentages for the S&P/ASX 300 universe and Panel B for stocks in the CRIF SPPR universe.
Panel A. S&P/ASX 300 Universe MCAP 1 2 3 4 5 6 7 8 9 10
Fund Weight 0.24 0.41 0.92 1.40 1.55 2.64 4.52 8.18 16.75 63.39 Fund-ASX300 -0.16 -0.29 -0.09 -0.03 -0.41 -0.16 0.15 0.80 1.95 -1.76
BMC 1 2 3 4 5 6 7 8 9 10 Fund Weight 5.05 12.72 18.04 20.87 15.88 11.40 7.47 4.21 2.88 1.49
Fund-ASX300 -1.44 -2.04 0.05 2.67 2.45 1.92 0.04 -1.56 -1.38 -0.70 PR1YR 1 2 3 4 5 6 7 8 9 10
Fund Weight 1.23 4.81 9.02 8.81 9.84 11.43 14.76 16.69 15.40 8.00 Fund-ASX300 -0.55 -0.69 -0.33 -0.34 -0.18 0.25 0.84 0.36 0.65 0.00 Panel B. CRIF Universe
MCAP 1 2 3 4 5 6 7 8 9 10 Fund Weight 0.00 0.00 0.01 0.02 0.11 0.28 1.00 3.20 9.24 86.14 Fund-CRIF -0.04 -0.08 -0.15 -0.23 -0.31 -0.47 -0.45 -0.06 0.26 1.53
BMC 1 2 3 4 5 6 7 8 9 10 Fund Weight 5.09 15.49 26.11 20.37 15.72 9.67 4.19 2.04 1.13 0.20 Fund-CRIF -3.16 -2.39 1.30 3.99 3.99 0.54 -1.68 -1.28 -0.94 -0.38
PR1YR 1 2 3 4 5 6 7 8 9 10 Fund Weight 0.30 2.03 4.54 8.04 10.11 13.47 17.16 18.43 18.58 7.35 Fund-CRIF -0.47 -0.84 -1.50 -1.04 -0.05 0.41 1.67 1.53 1.43 -1.13
Panel A shows that the funds underweight the largest 10% of stocks in the
S&P/ASX 300 by -1.76% (MCAP decile 10). Over this period funds overweight stocks
from deciles 7 to 9 deciles or approximately the largest 60-120 stocks and underweight
all other size deciles. This suggests that funds tend to concentrate their holdings over
the top 200 stocks by market capitalization6.
Within weightings in BMC deciles 3 to 7 are overweight suggesting funds tend to
hold moderate growth neutral stocks. Funds also favor stocks with high past returns as
they overweight PR1YR deciles 6 to 9 although are weight neutral in the top decile.
6 Another possible reason is that pre-April 2000, fund managers tracked the All Ordinaries Index
however during April 2000 some funds benchmarked against the ASX 200 index while some tracked the
ASX 300.
5
Panel B shows that funds hold about 86% of their portfolio value in the largest
decile of stocks in the CRIF universe or in the 95 largest stocks. Overweighting in
growth neutral (BMC deciles 3 to 6) and past winner stocks (except for the highest
PR1YR decile) also occurs, similar to the evidence for the S&P/ASX 300 universe.
4. Overlapping Characteristic Benchmark Portfolio Methodology
4.1. Index Constituent Value-Weighted Characteristic Benchmark
Our benchmark portfolio formation methodology bears similarities to that of DGTW
(1997) and Pinnuck (2003). A stock enters a characteristic benchmark portfolio in a
given month t if it meets our following data criteria: market capitalization and share
price data for month t-1 (from the Centre for Research in Finance’s (CRIF) SPPR),
book value data in the previous year (ASPECT item ID 7010) or if the stock’s current
year reporting date is three or more months earlier than month t-1, the current year’s
book value7, monthly returns in the past 13 months (CRIF’s SPPR) and has a positive
weight in the S&P/ASX 300 index for month t-1.
We use the S&P/ASX 300 as the universe in recognition of the skewed market
capitalization distribution to the largest stocks in the Australian market, as evident in
Table 1. Stocks beyond the largest 300 stocks very rarely fall in the tradable universe
for fund managers.
The benchmark portfolios are formed as follows. At the end of each month, all
stocks which meet our data criteria are placed into a portfolios ranked upon their
month-end market capitalization. Within each of these tercile portfolios, the stocks are
then further sorted into b portfolios by their current/prior year book-to-market ratio.
The book-to-market ratio is the prior year book value over the month-end market
capitalization.
Finally, each market capitalization/book-to-market portfolio is sorted into c
portfolios by past 12 month returns with one month skip to prevent bid-ask bounce and
compounding microstructure effects. For example, a triple sort procedure (a/b/c)
produces 27 characteristic portfolios using a=3/b=3/c=3 sort with approximately 10
7 Under Australian Stock Exchange (ASX) periodic disclosure rules for our sample period, an entity
must disclose its accounts no later than 75 days after the end of its accounting period.
6
stocks each. We denote this procedure as a 3/3/3 sort. We also examine 2/2/2 (8
portfolios) and 4/3/2 (24 portfolio) sorts.
Each portfolio of stocks is then monthly ranked by the triple sorting procedure and
returns are value-weighted based on the S&P/ASX 300 weightings for the previous
month-end and held for L months to form the monthly characteristic benchmark
returns. Thus, a given stock’s respective benchmark portfolio is the equal-weighted
return of L overlapping benchmark portfolios.
In essence the value-weighted return across all characteristic benchmark portfolios
is equivalent to the return on the S&P/ASX 300A. The importance of this feature is
evident in our construction of the Characteristic Selectivity and Style Return measures.
4.2. Choice of Length L and Portfolio Combinations
In the non-overlapping characteristic-based methodology of DGTW (1997), the
benchmark portfolio length is set at 12 months. While this remains consistent to the
portfolio construction methodology of Fama and French (1992) and Carhart (1997) and
also to the frequency of their ranking, our overlapping methodology provides
flexibility to vary the holding period length of each benchmark portfolio. As we have
no a priori belief the use of one length may be better than another, we test lengths of
18, 3, 6 and 12 months. We set the upper limit of 12 months for two reasons. First our
least frequent data, book value, occurs yearly and second, prior literature suggests style
return effects are relatively short lived.
Our choice of portfolio sorting combinations is due to practicality. For the U.S.
market, DGTW (1997) use a 5/5/5 combination. Due to the limited number of stocks in
the S&P/ASX 300 index we are not offered the luxury of such diverse style
benchmarks. Our choice of portfolio combinations is thus a trade-off between style
noise and style refinement ability. With more sorting portfolios, we are able to have
more refined style definitions. However, reducing the number of stocks in each
portfolio increases the noise in style returns and vice versa. As our sample ranges from
250-270 stocks in any given month, we are limited to 2/2/2 (about 30 to 33 stocks per
portfolio), 3/3/3 (10 stocks) and 4/3/2 (10 to 11 stocks).
8 Holding for one month represents a special case of the overlapping methodology since no overlapping
occurs.
7
4.3. Rationale and Suitability of Overlapping Method
Our use of an overlapping benchmark in contrast to the annually revised benchmark of
DGTW (1997) allows for the incorporation of timely information into our benchmarks.
In the DGTW (1997) framework, a stock’s style characteristics may be up to 12
months old. Thus, a winner momentum stock 12 months ago may be a neutral
momentum stock 6 months later. In our overlapping methodology however, the latest
characteristic information is used in order to form more timely benchmarks. To reduce
noise in benchmarks from solely weighting on the past month’s characteristic
information, the past L month average benchmark of a stock is used. Thus, if a stock is
in transition from growth to value during the period, it will be considered on average, a
growth neutral stock.
A further and more practical reason for overlapping and consequently monthly
ranking is to increase the sample population of stocks benchmarked. In a market
benchmark such as the S&P/ASX 300 with a changing stock composition over time,
stocks frequently enter and exit the benchmark intra-year. As such, if we rank once
yearly we bias our benchmarks by only assessing surviving stocks which tend to be the
largest stocks.
4.4. Characteristic Selectivity Measure
Following DGTW (1997), Characteristic Selectivity is measured by aggregating
individual security returns in excess of its respective benchmark portfolio. Thus a
fund’s return attributed to stock selectivity is the value-weighted gross return of each
stock9 held less each stock’s characteristic portfolio benchmark. Put another way, the
fund’s gross return of the portfolio less the fund’s value-weighted characteristic
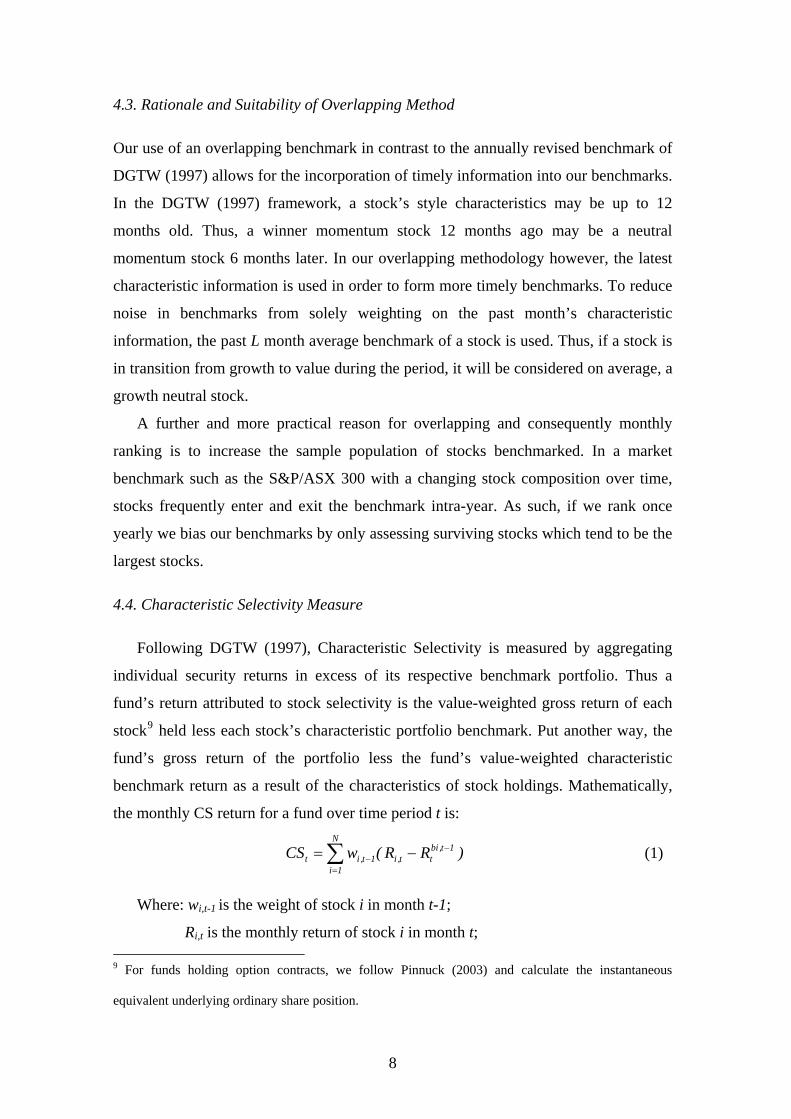
benchmark return as a result of the characteristics of stock holdings. Mathematically,
the monthly CS return for a fund over time period t is:
(1) ∑=
−− −=
N
1i
1t,bitt,i1t,it )RR(wCS
Where: wi,t-1 is the weight of stock i in month t-1;
Ri,t is the monthly return of stock i in month t; 9 For funds holding option contracts, we follow Pinnuck (2003) and calculate the instantaneous
equivalent underlying ordinary share position.
8

Rtbi,t-1 is the monthly return of the matching characteristic benchmark
portfolio to stock i at month t-1 in month t.
Our benchmark is more restrictive than that used by Pinnuck (2003) who uses the
CRIF universe rather than the S&P/ASX 300 weightings. An important property
unique to our measure is that by definition, holding the index portfolio will yield a zero
Characteristic Selectivity measure due to the benchmark portfolio formation
methodology. Thus, a fund’s holding is simultaneously being assessed against
deviation from the S&P/ASX 300 index as well as against the characteristics of stocks.
4.5. Style Return and Excess Style Return
By construct, the DGTW (1997) components are a decomposition of a portfolio's raw
return. One limitation of this decomposition is the requirement of a fund’s past year
holdings history in the Characteristic Timing (CT) and Average Style (AS) measures
which imposes data restrictions to our relatively short holdings history. In order to
reduce this requirement, we merge the CT and AS measures to form the Style Return
(SR) measure as:
(2) ∑=
−−= N
i
tbittit RwSR
1
1,1,
Where the notations are the same as those used in Equation 1. By definition, if all
characteristic benchmark stocks are held using index weights (reweighted over the sum
of all stock index weights in the characteristic benchmark), the SR measure equates to
the implied market (IM) return which is the return inferred by the characteristic
benchmark:
(3) ∑=
−−=
N
1i
1t,bit1t,i,mt RwIM
Where wm,i,t-1 is the one month lagged index weight in stock i.
We can therefore measure the style return of a fund in excess of the market, Excess
Style (ES) as:
ESt = SRt - IMt (4) The Excess Style represents a concise measure of whether a fund is able to time or
pick styles (or a mixture of both) over the market return.
4.6. Returns Decomposition
9
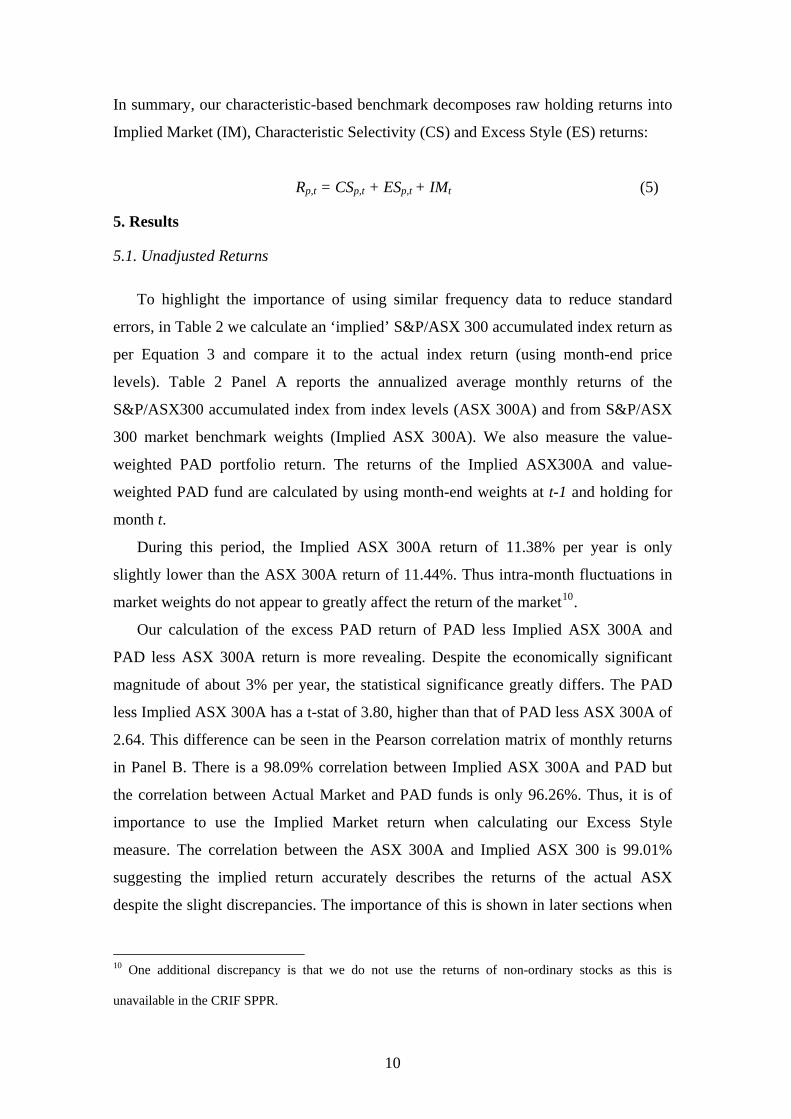
In summary, our characteristic-based benchmark decomposes raw holding returns into
Implied Market (IM), Characteristic Selectivity (CS) and Excess Style (ES) returns:
Rp,t = CSp,t + ESp,t + IMt (5)
5. Results
5.1. Unadjusted Returns
To highlight the importance of using similar frequency data to reduce standard
errors, in Table 2 we calculate an ‘implied’ S&P/ASX 300 accumulated index return as
per Equation 3 and compare it to the actual index return (using month-end price
levels). Table 2 Panel A reports the annualized average monthly returns of the
S&P/ASX300 accumulated index from index levels (ASX 300A) and from S&P/ASX
300 market benchmark weights (Implied ASX 300A). We also measure the value-
weighted PAD portfolio return. The returns of the Implied ASX300A and value-
weighted PAD fund are calculated by using month-end weights at t-1 and holding for
month t.
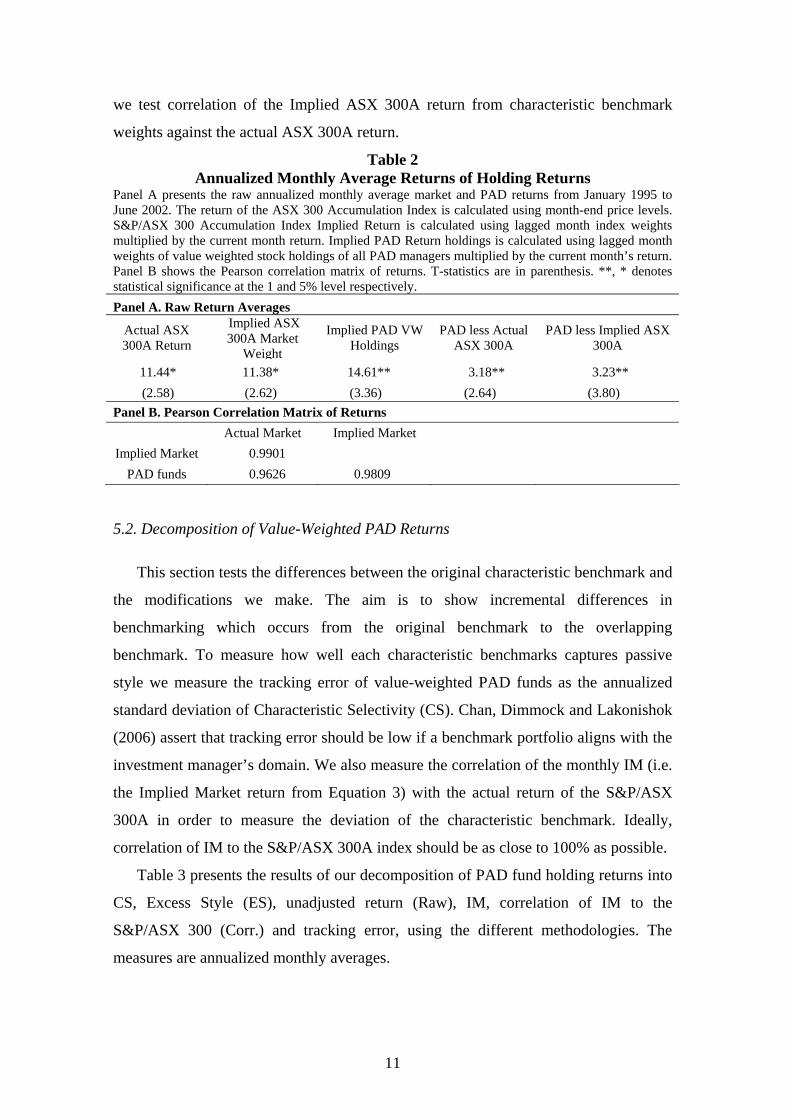
During this period, the Implied ASX 300A return of 11.38% per year is only
slightly lower than the ASX 300A return of 11.44%. Thus intra-month fluctuations in
market weights do not appear to greatly affect the return of the market10.
Our calculation of the excess PAD return of PAD less Implied ASX 300A and
PAD less ASX 300A return is more revealing. Despite the economically significant
magnitude of about 3% per year, the statistical significance greatly differs. The PAD
less Implied ASX 300A has a t-stat of 3.80, higher than that of PAD less ASX 300A of
2.64. This difference can be seen in the Pearson correlation matrix of monthly returns
in Panel B. There is a 98.09% correlation between Implied ASX 300A and PAD but
the correlation between Actual Market and PAD funds is only 96.26%. Thus, it is of
importance to use the Implied Market return when calculating our Excess Style
measure. The correlation between the ASX 300A and Implied ASX 300 is 99.01%
suggesting the implied return accurately describes the returns of the actual ASX
despite the slight discrepancies. The importance of this is shown in later sections when
10 One additional discrepancy is that we do not use the returns of non-ordinary stocks as this is
unavailable in the CRIF SPPR.
10
we test correlation of the Implied ASX 300A return from characteristic benchmark
weights against the actual ASX 300A return.
Table 2 Annualized Monthly Average Returns of Holding Returns
Panel A presents the raw annualized monthly average market and PAD returns from January 1995 to June 2002. The return of the ASX 300 Accumulation Index is calculated using month-end price levels. S&P/ASX 300 Accumulation Index Implied Return is calculated using lagged month index weights multiplied by the current month return. Implied PAD Return holdings is calculated using lagged month weights of value weighted stock holdings of all PAD managers multiplied by the current month’s return. Panel B shows the Pearson correlation matrix of returns. T-statistics are in parenthesis. **, * denotes statistical significance at the 1 and 5% level respectively. Panel A. Raw Return Averages
Actual ASX 300A Return
Implied ASX 300A Market
Weight
Implied PAD VW Holdings
PAD less Actual ASX 300A
PAD less Implied ASX 300A
11.44* 11.38* 14.61** 3.18** 3.23** (2.58) (2.62) (3.36) (2.64) (3.80)
Panel B. Pearson Correlation Matrix of Returns Actual Market Implied Market
Implied Market 0.9901 PAD funds 0.9626 0.9809
5.2. Decomposition of Value-Weighted PAD Returns
This section tests the differences between the original characteristic benchmark and
the modifications we make. The aim is to show incremental differences in
benchmarking which occurs from the original benchmark to the overlapping
benchmark. To measure how well each characteristic benchmarks captures passive
style we measure the tracking error of value-weighted PAD funds as the annualized
standard deviation of Characteristic Selectivity (CS). Chan, Dimmock and Lakonishok
(2006) assert that tracking error should be low if a benchmark portfolio aligns with the
investment manager’s domain. We also measure the correlation of the monthly IM (i.e.
the Implied Market return from Equation 3) with the actual return of the S&P/ASX
300A in order to measure the deviation of the characteristic benchmark. Ideally,
correlation of IM to the S&P/ASX 300A index should be as close to 100% as possible.
Table 3 presents the results of our decomposition of PAD fund holding returns into
CS, Excess Style (ES), unadjusted return (Raw), IM, correlation of IM to the
S&P/ASX 300 (Corr.) and tracking error, using the different methodologies. The
measures are annualized monthly averages.
11
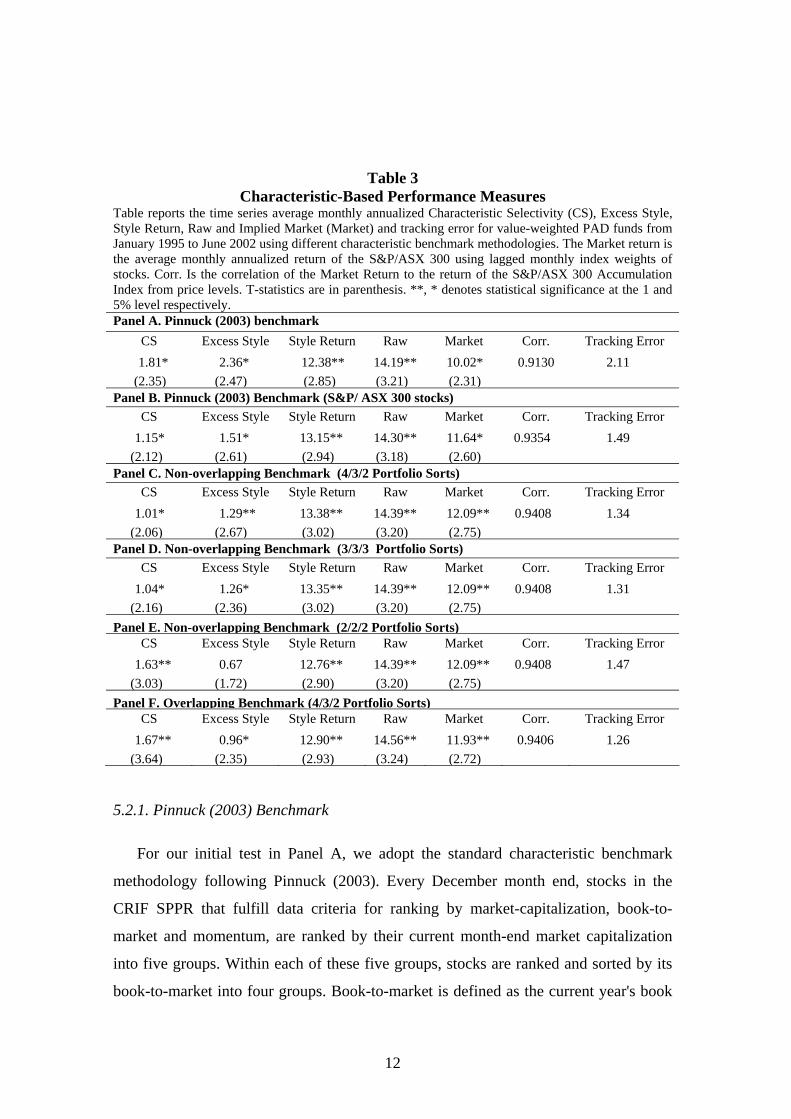
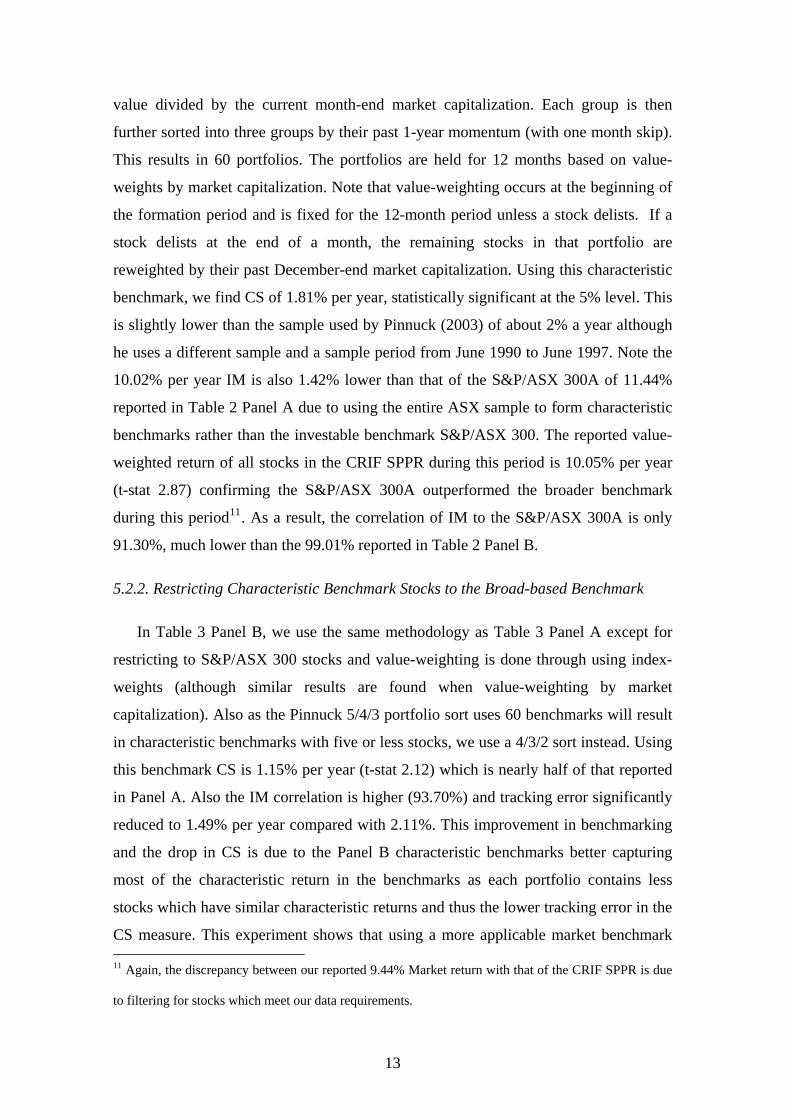
Table 3 Characteristic-Based Performance Measures
Table reports the time series average monthly annualized Characteristic Selectivity (CS), Excess Style, Style Return, Raw and Implied Market (Market) and tracking error for value-weighted PAD funds from January 1995 to June 2002 using different characteristic benchmark methodologies. The Market return is the average monthly annualized return of the S&P/ASX 300 using lagged monthly index weights of stocks. Corr. Is the correlation of the Market Return to the return of the S&P/ASX 300 Accumulation Index from price levels. T-statistics are in parenthesis. **, * denotes statistical significance at the 1 and 5% level respectively. Panel A. Pinnuck (2003) benchmark
CS Excess Style Style Return Raw Market Corr. Tracking Error 1.81* 2.36* 12.38** 14.19** 10.02* 0.9130 2.11
(2.35) (2.47) (2.85) (3.21) (2.31) Panel B. Pinnuck (2003) Benchmark (S&P/ ASX 300 stocks)
CS Excess Style Style Return Raw Market Corr. Tracking Error 1.15* 1.51* 13.15** 14.30** 11.64* 0.9354 1.49
(2.12) (2.61) (2.94) (3.18) (2.60) Panel C. Non-overlapping Benchmark (4/3/2 Portfolio Sorts)
CS Excess Style Style Return Raw Market Corr. Tracking Error 1.01* 1.29** 13.38** 14.39** 12.09** 0.9408 1.34
(2.06) (2.67) (3.02) (3.20) (2.75) Panel D. Non-overlapping Benchmark (3/3/3 Portfolio Sorts)
CS Excess Style Style Return Raw Market Corr. Tracking Error 1.04* 1.26* 13.35** 14.39** 12.09** 0.9408 1.31
(2.16) (2.36) (3.02) (3.20) (2.75) Panel E. Non-overlapping Benchmark (2/2/2 Portfolio Sorts)
CS Excess Style Style Return Raw Market Corr. Tracking Error 1.63** 0.67 12.76** 14.39** 12.09** 0.9408 1.47
(3.03) (1.72) (2.90) (3.20) (2.75) Panel F. Overlapping Benchmark (4/3/2 Portfolio Sorts)
CS Excess Style Style Return Raw Market Corr. Tracking Error 1.67** 0.96* 12.90** 14.56** 11.93** 0.9406 1.26
(3.64) (2.35) (2.93) (3.24) (2.72)
5.2.1. Pinnuck (2003) Benchmark
For our initial test in Panel A, we adopt the standard characteristic benchmark
methodology following Pinnuck (2003). Every December month end, stocks in the
CRIF SPPR that fulfill data criteria for ranking by market-capitalization, book-to-
market and momentum, are ranked by their current month-end market capitalization
into five groups. Within each of these five groups, stocks are ranked and sorted by its
book-to-market into four groups. Book-to-market is defined as the current year's book
12
value divided by the current month-end market capitalization. Each group is then
further sorted into three groups by their past 1-year momentum (with one month skip).
This results in 60 portfolios. The portfolios are held for 12 months based on value-
weights by market capitalization. Note that value-weighting occurs at the beginning of
the formation period and is fixed for the 12-month period unless a stock delists. If a
stock delists at the end of a month, the remaining stocks in that portfolio are
reweighted by their past December-end market capitalization. Using this characteristic
benchmark, we find CS of 1.81% per year, statistically significant at the 5% level. This
is slightly lower than the sample used by Pinnuck (2003) of about 2% a year although
he uses a different sample and a sample period from June 1990 to June 1997. Note the
10.02% per year IM is also 1.42% lower than that of the S&P/ASX 300A of 11.44%
reported in Table 2 Panel A due to using the entire ASX sample to form characteristic
benchmarks rather than the investable benchmark S&P/ASX 300. The reported value-
weighted return of all stocks in the CRIF SPPR during this period is 10.05% per year
(t-stat 2.87) confirming the S&P/ASX 300A outperformed the broader benchmark
during this period11. As a result, the correlation of IM to the S&P/ASX 300A is only
91.30%, much lower than the 99.01% reported in Table 2 Panel B.
5.2.2. Restricting Characteristic Benchmark Stocks to the Broad-based Benchmark
In Table 3 Panel B, we use the same methodology as Table 3 Panel A except for
restricting to S&P/ASX 300 stocks and value-weighting is done through using index-
weights (although similar results are found when value-weighting by market
capitalization). Also as the Pinnuck 5/4/3 portfolio sort uses 60 benchmarks will result
in characteristic benchmarks with five or less stocks, we use a 4/3/2 sort instead. Using
this benchmark CS is 1.15% per year (t-stat 2.12) which is nearly half of that reported
in Panel A. Also the IM correlation is higher (93.70%) and tracking error significantly
reduced to 1.49% per year compared with 2.11%. This improvement in benchmarking
and the drop in CS is due to the Panel B characteristic benchmarks better capturing
most of the characteristic return in the benchmarks as each portfolio contains less
stocks which have similar characteristic returns and thus the lower tracking error in the
CS measure. This experiment shows that using a more applicable market benchmark 11 Again, the discrepancy between our reported 9.44% Market return with that of the CRIF SPPR is due
to filtering for stocks which meet our data requirements.
13
provides more accuracy in forming characteristic benchmarks. However, as the
benchmark value weights are held constant throughout the holding period, this results
in the IM deviating from the actual market return. To measure the extent of deviation,
we calculate the CS of the S&P/ASX 300 using lagged S&P/ASX 300 month-end
weights (with appropriate re-weighting for only stocks in the characteristic benchmark)
and apply it to this benchmark. We find a CS of 1.00% per year suggesting the bias in
the benchmark is economically significant, despite the improvements upon the former
benchmark. This suggests a fund which tracks the S&P/ASX 300 would have its CS
overestimated by about 1% per year using this characteristic benchmark.
5.2.3. Non-overlapping Benchmark
In Table 3 Panel C we use the same methodology except that for every month,
stocks in a benchmark portfolio are rebalanced by their month-end index-weights and
held for the next month. We do this to avoid the IM deviating from actual market
weights. Notable improvements to the benchmark’s correlation of 94.08% and tracking
error of 1.34% are made to the benchmark used in Panel B. The statistically significant
CS of 1.01% is also lower than that of the former benchmark suggesting more of the
excess market return is being captured by the characteristic benchmarks.
5.2.4. Varying the Number of Characteristic Benchmark Sorting Groups
In this section, we use the same methodology as Panel C except in altering the
number of characteristic benchmark portfolios to measure the CS of PAD funds. In
Panel D we use more portfolios by employing a 3/3/3 = 27 sort and in Panel E, less
portfolios by using a 2/2/2 = 8 portfolio sort. The 3/3/3 benchmark has slightly lower
tracking error than the Panel C benchmark of 1.31% despite CS being slightly higher at
1.03% per year. The broader 2/2/2 however has increased tracking error and also
increased CS of 1.63% consistent with the above findings in Section 5.2.2. where using
a broader benchmark captures less of the characteristic returns.
5.2.5. Overlapping Benchmark
In Table 3 Panel F, we use the overlapping methodology as described in Section
4.1. in order to use up-to-date characteristic information and to capture stocks which
may enter a portfolio in the middle of the year. Essentially this not only results in
14
monthly reweighting of characteristic benchmarks as used in the Panel C,D and E
benchmarks, but also a monthly resorting of characteristic portfolios. We use 4/3/2
groupings for comparability to the Panel C benchmark. The benchmark’s correlation to
the market of 94.06% is 0.02% lower than the Panel C benchmark although has lower
tracking error of 1.26%. However despite this lower tracking error, the CS is much
higher of 1.67% per year compared with the CS of 1.01% of the non-overlapping
benchmark in Section 5.2.3. We remove mid-entry stocks from the overlapping
benchmark to make it more comparable to the non-overlapping benchmark. While CS
falls to 1.51% (t-stat 3.26), this measure is not statistically different to the CS when
including mid entry stocks. However when comparing this CS to the Panel C
benchmark, the difference of 0.50% is statistically significant (t-stat 3.63) suggesting
the higher CS is systematic. This suggests there is higher CS towards stocks chosen by
PAD funds in the overlapping benchmark, while those not chosen have lower CS than
the non-overlapping benchmark.
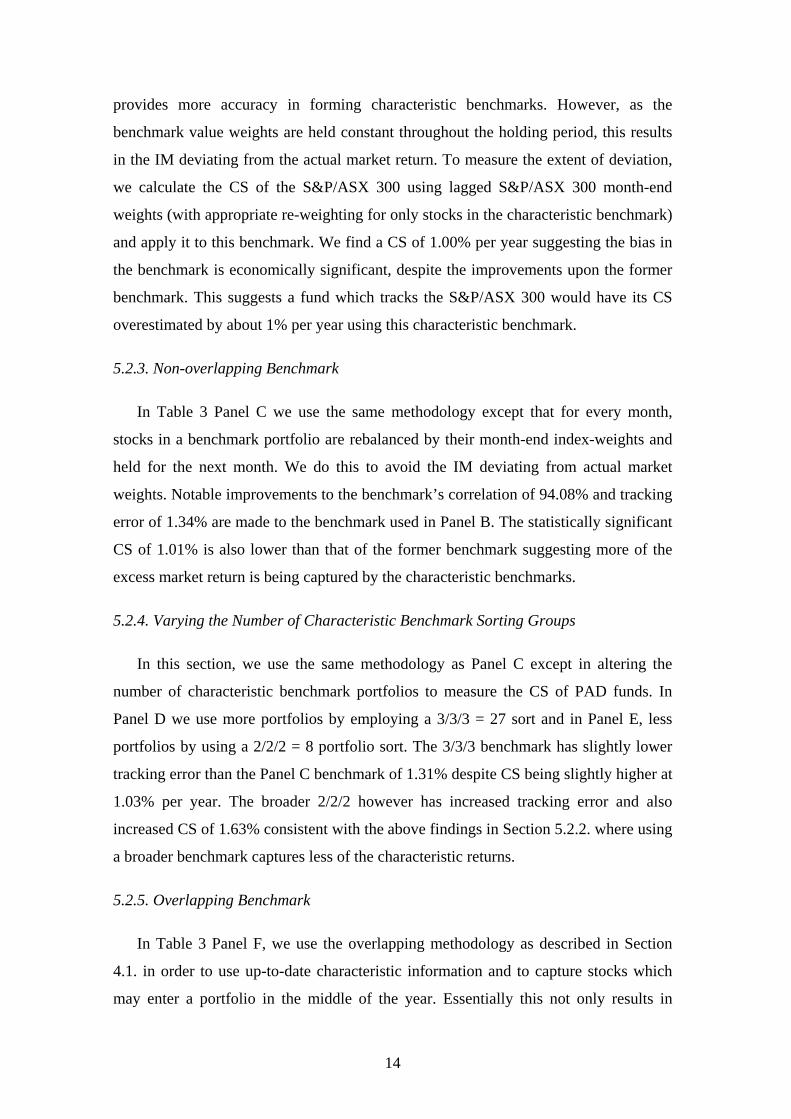
5.2. Performance of Overlapping and Non-overlapping Benchmarks by Fund Style
This section compares the ability and reconciles the measurement differences of the
non-overlapping (as used in Section 5.2.3.) and overlapping (from Section 5.2.5.)
benchmarks to track characteristic returns by measuring the CS of funds by self-
reported style. A characteristic benchmark able to closely match the style returns of
funds will result in low tracking. Table 4 reports the average CS, percentage of total
PAD assets in a style (% PAD) and tracking error using the non-overlapping
benchmark in Panel A and using the overlapping benchmark in Panel B.
Both benchmarks show Growth, Style Neutral and Value funds earn statistically
significant CS while GARP (Growth at a Reasonable Price) and Other funds do not.
However the benchmarks differ by the magnitude of measured CS. The CS of Value
funds measured by the non-overlapping benchmark is 1.85% per year (t-stat 2.26)
while using the overlapping benchmark is nearly 1% higher at 2.75% (t-stat 3.75). As
Value funds account for some 41% of total fund assets, this partially explains the
0.66% difference in CS of value-weighted PAD funds using the two benchmarks in the
previous section. Similarly CS of Style Neural funds is 2.71% (t-stat 2.26) using the
non-overlapping benchmark and is lower using the overlapping benchmark 2.26% (t-
stat 2.33). However as Style Neutral funds constitute about only 5% of total PAD
15
assets, this difference in CS does not greatly affect the magnitude of value-weighted
PAD fund CS.
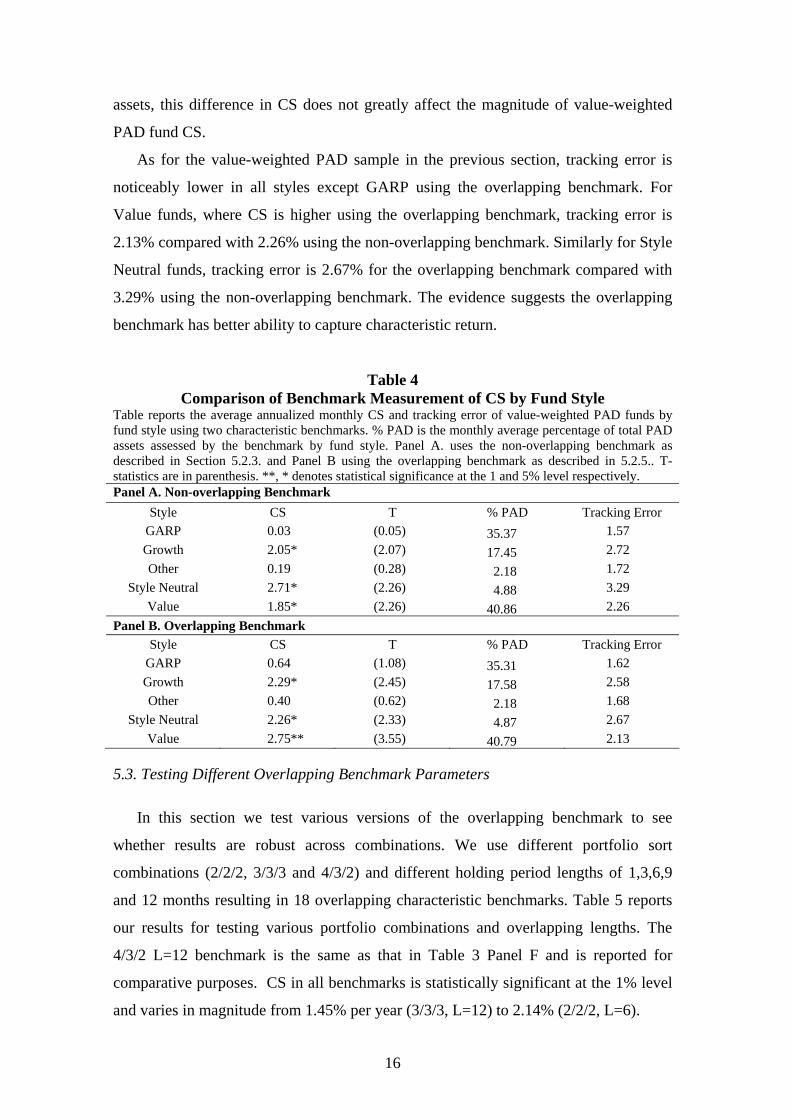
As for the value-weighted PAD sample in the previous section, tracking error is
noticeably lower in all styles except GARP using the overlapping benchmark. For
Value funds, where CS is higher using the overlapping benchmark, tracking error is
2.13% compared with 2.26% using the non-overlapping benchmark. Similarly for Style
Neutral funds, tracking error is 2.67% for the overlapping benchmark compared with
3.29% using the non-overlapping benchmark. The evidence suggests the overlapping
benchmark has better ability to capture characteristic return.
Table 4 Comparison of Benchmark Measurement of CS by Fund Style
Table reports the average annualized monthly CS and tracking error of value-weighted PAD funds by fund style using two characteristic benchmarks. % PAD is the monthly average percentage of total PAD assets assessed by the benchmark by fund style. Panel A. uses the non-overlapping benchmark as described in Section 5.2.3. and Panel B using the overlapping benchmark as described in 5.2.5.. T-statistics are in parenthesis. **, * denotes statistical significance at the 1 and 5% level respectively. Panel A. Non-overlapping Benchmark
Style CS T % PAD Tracking Error GARP 0.03 (0.05) 35.37 1.57 Growth 2.05* (2.07) 17.45 2.72 Other 0.19 (0.28) 2.18 1.72
Style Neutral 2.71* (2.26) 4.88 3.29 Value 1.85* (2.26) 40.86 2.26
Panel B. Overlapping Benchmark Style CS T % PAD Tracking Error
GARP 0.64 (1.08) 35.31 1.62 Growth 2.29* (2.45) 17.58 2.58 Other 0.40 (0.62) 2.18 1.68
Style Neutral 2.26* (2.33) 4.87 2.67 Value 2.75** (3.55) 40.79 2.13
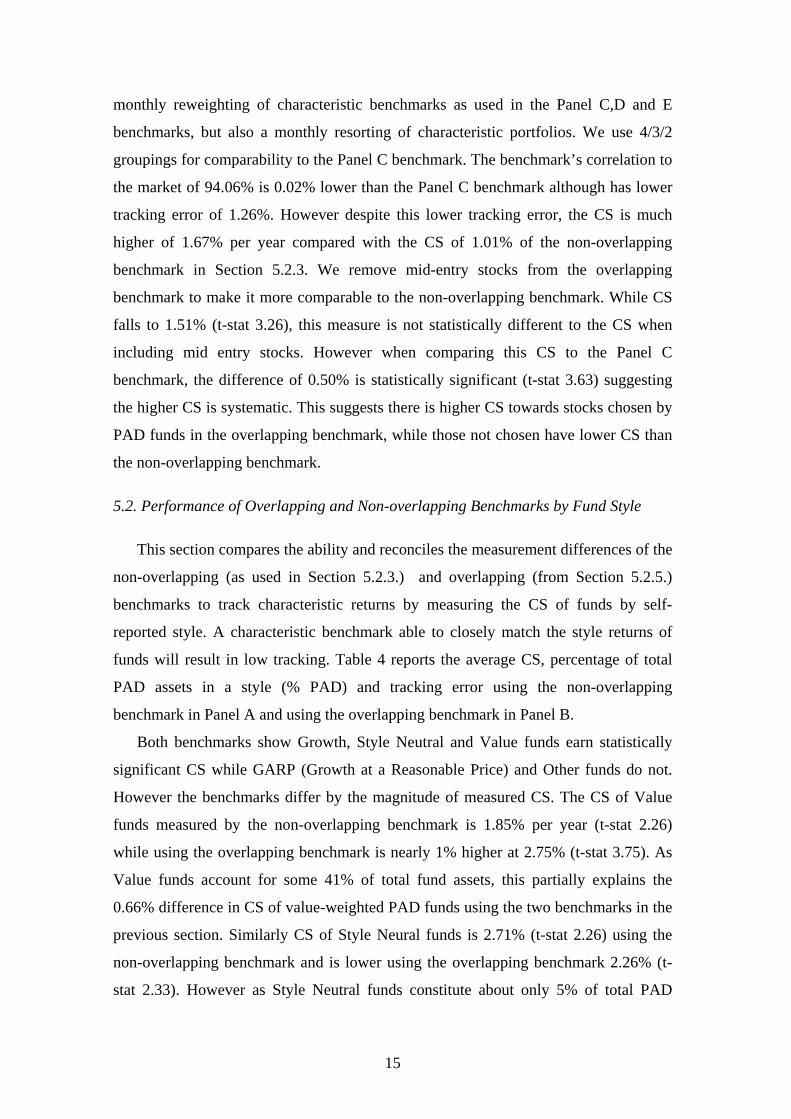
5.3. Testing Different Overlapping Benchmark Parameters
In this section we test various versions of the overlapping benchmark to see
whether results are robust across combinations. We use different portfolio sort
combinations (2/2/2, 3/3/3 and 4/3/2) and different holding period lengths of 1,3,6,9
and 12 months resulting in 18 overlapping characteristic benchmarks. Table 5 reports
our results for testing various portfolio combinations and overlapping lengths. The
4/3/2 L=12 benchmark is the same as that in Table 3 Panel F and is reported for
comparative purposes. CS in all benchmarks is statistically significant at the 1% level
and varies in magnitude from 1.45% per year (3/3/3, L=12) to 2.14% (2/2/2, L=6).
16
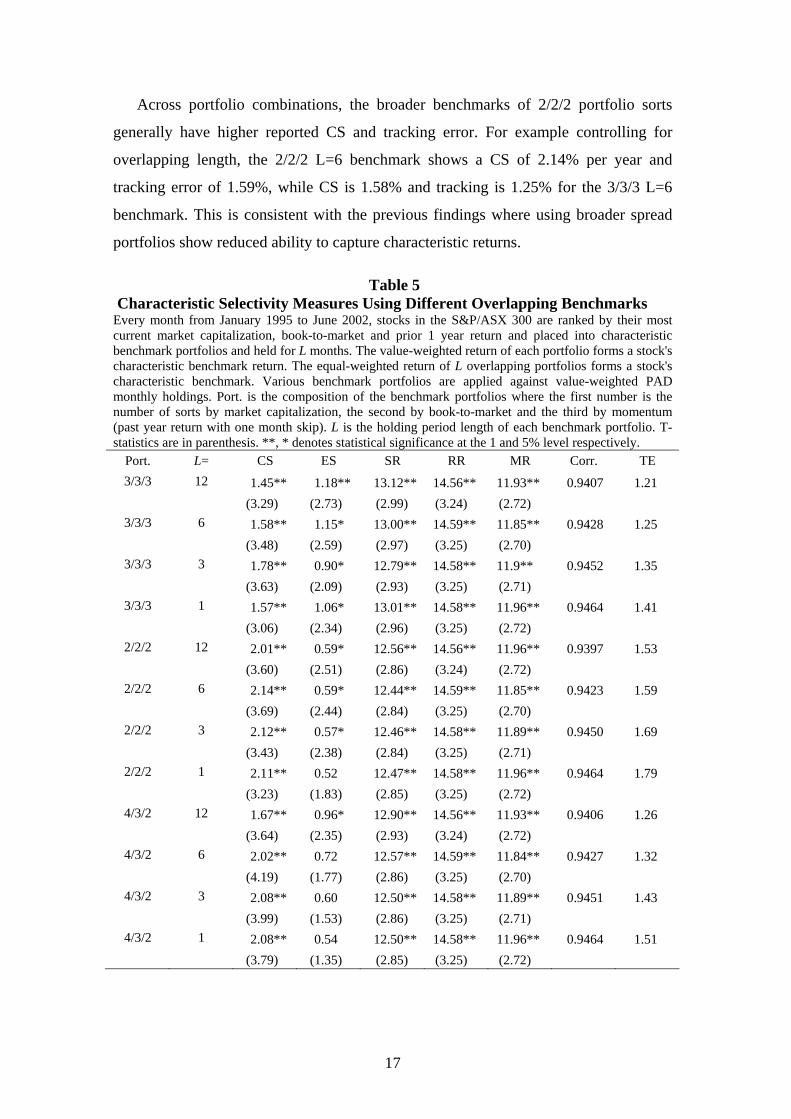
Across portfolio combinations, the broader benchmarks of 2/2/2 portfolio sorts
generally have higher reported CS and tracking error. For example controlling for
overlapping length, the 2/2/2 L=6 benchmark shows a CS of 2.14% per year and
tracking error of 1.59%, while CS is 1.58% and tracking is 1.25% for the 3/3/3 L=6
benchmark. This is consistent with the previous findings where using broader spread
portfolios show reduced ability to capture characteristic returns.
Table 5 Characteristic Selectivity Measures Using Different Overlapping Benchmarks Every month from January 1995 to June 2002, stocks in the S&P/ASX 300 are ranked by their most current market capitalization, book-to-market and prior 1 year return and placed into characteristic benchmark portfolios and held for L months. The value-weighted return of each portfolio forms a stock's characteristic benchmark return. The equal-weighted return of L overlapping portfolios forms a stock's characteristic benchmark. Various benchmark portfolios are applied against value-weighted PAD monthly holdings. Port. is the composition of the benchmark portfolios where the first number is the number of sorts by market capitalization, the second by book-to-market and the third by momentum (past year return with one month skip). L is the holding period length of each benchmark portfolio. T-statistics are in parenthesis. **, * denotes statistical significance at the 1 and 5% level respectively.
Port. L= CS ES SR RR MR Corr. TE 3/3/3 12 1.45** 1.18** 13.12** 14.56** 11.93** 0.9407 1.21
(3.29) (2.73) (2.99) (3.24) (2.72) 3/3/3 6 1.58** 1.15* 13.00** 14.59** 11.85** 0.9428 1.25
(3.48) (2.59) (2.97) (3.25) (2.70) 3/3/3 3 1.78** 0.90* 12.79** 14.58** 11.9** 0.9452 1.35
(3.63) (2.09) (2.93) (3.25) (2.71) 3/3/3 1 1.57** 1.06* 13.01** 14.58** 11.96** 0.9464 1.41
(3.06) (2.34) (2.96) (3.25) (2.72) 2/2/2 12 2.01** 0.59* 12.56** 14.56** 11.96** 0.9397 1.53
(3.60) (2.51) (2.86) (3.24) (2.72) 2/2/2 6 2.14** 0.59* 12.44** 14.59** 11.85** 0.9423 1.59
(3.69) (2.44) (2.84) (3.25) (2.70) 2/2/2 3 2.12** 0.57* 12.46** 14.58** 11.89** 0.9450 1.69
(3.43) (2.38) (2.84) (3.25) (2.71) 2/2/2 1 2.11** 0.52 12.47** 14.58** 11.96** 0.9464 1.79
(3.23) (1.83) (2.85) (3.25) (2.72) 4/3/2 12 1.67** 0.96* 12.90** 14.56** 11.93** 0.9406 1.26
(3.64) (2.35) (2.93) (3.24) (2.72) 4/3/2 6 2.02** 0.72 12.57** 14.59** 11.84** 0.9427 1.32
(4.19) (1.77) (2.86) (3.25) (2.70) 4/3/2 3 2.08** 0.60 12.50** 14.58** 11.89** 0.9451 1.43
(3.99) (1.53) (2.86) (3.25) (2.71) 4/3/2 1 2.08** 0.54 12.50** 14.58** 11.96** 0.9464 1.51
(3.79) (1.35) (2.85) (3.25) (2.72)
17
When controlling for holding period lengths, we find correlation of IM linearly
improves as we reduce the holding period length from twelve to one month. However
at the same time tracking error also increases. This suggests reducing the holding
period length fails to systematically capture characteristic returns. This is consistent
with literature finding that characteristic returns occur over a one year horizon (e.g.
Fama and French (1992, 1996), Jegadeesh and Titman (1993, 2001)). The results thus
suggest overlapping benchmark with longer holding periods and more portfolio
combinations result in better matching of characteristic returns.
5.4. Where Do Fund Managers Outperform? Characteristic Selectivity across Stock
Characteristics
This section examines whether PAD funds earn CS in stocks with specific
characteristics and compares the results with using the non-overlapping monthly index
reweighted benchmark from Section 5.2.3. and using the overlapping benchmark
methodology as used in Section 5.2.5. Every period, depending on the frequency of
ranking12, stocks in a characteristic benchmark are ranked placed into quintiles by its
size by market capitalization, book-to-market or past year return. Stocks held by PAD
funds are placed into each quintile group and its value-weighted CS return calculated.
For example large stocks held by PAD funds in the highest size quintile are treated as
an individual portfolio and CS is measured.
Table 6 reports the average monthly annualized CS, average fund weight, average
number of stocks and average tracking errors. Panel A reports results using the non-
overlapping benchmark and Panel B for the overlapping benchmark for size (MCAP),
book-to-market (BMC) and momentum (PR1YR) quintile groups. For the non-
overlapping benchmark, stocks are grouped at December end and remain in the same
quintile group for 12 months. In the overlapping benchmark, stocks are ranked into
quintiles at the end of each month and remain in the group for the next twelve months.
The average quintile group of overlapping quintiles (rounded up) is then calculated to
determine the grouping.
12 I.e. annually in the non-overlapping benchmark, and every month using the overlapping benchmark.
18
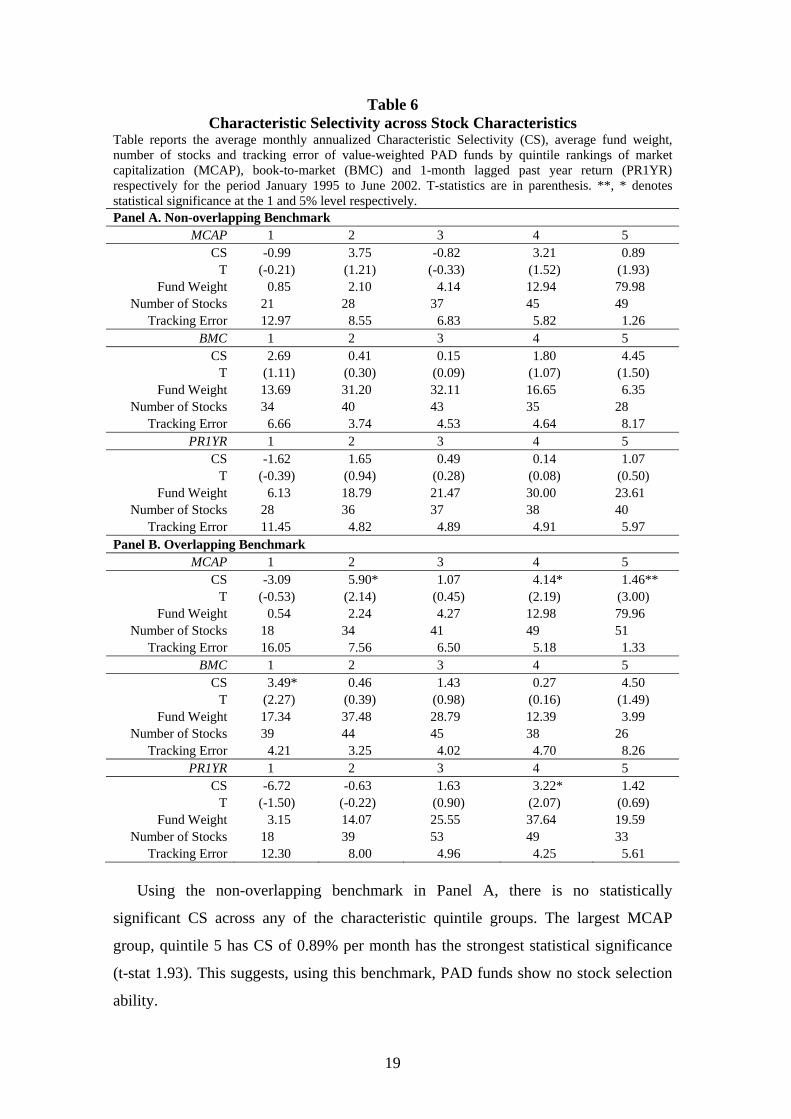
Table 6 Characteristic Selectivity across Stock Characteristics
Table reports the average monthly annualized Characteristic Selectivity (CS), average fund weight, number of stocks and tracking error of value-weighted PAD funds by quintile rankings of market capitalization (MCAP), book-to-market (BMC) and 1-month lagged past year return (PR1YR) respectively for the period January 1995 to June 2002. T-statistics are in parenthesis. **, * denotes statistical significance at the 1 and 5% level respectively. Panel A. Non-overlapping Benchmark
MCAP 1 2 3 4 5 CS -0.99 3.75 -0.82 3.21 0.89
T (-0.21) (1.21) (-0.33) (1.52) (1.93) Fund Weight 0.85 2.10 4.14 12.94 79.98
Number of Stocks 21 28 37 45 49 Tracking Error 12.97 8.55 6.83 5.82 1.26
BMC 1 2 3 4 5 CS 2.69 0.41 0.15 1.80 4.45
T (1.11) (0.30) (0.09) (1.07) (1.50) Fund Weight 13.69 31.20 32.11 16.65 6.35
Number of Stocks 34 40 43 35 28 Tracking Error 6.66 3.74 4.53 4.64 8.17
PR1YR 1 2 3 4 5 CS -1.62 1.65 0.49 0.14 1.07
T (-0.39) (0.94) (0.28) (0.08) (0.50) Fund Weight 6.13 18.79 21.47 30.00 23.61
Number of Stocks 28 36 37 38 40 Tracking Error 11.45 4.82 4.89 4.91 5.97
Panel B. Overlapping Benchmark MCAP 1 2 3 4 5
CS -3.09 5.90* 1.07 4.14* 1.46** T (-0.53) (2.14) (0.45) (2.19) (3.00)
Fund Weight 0.54 2.24 4.27 12.98 79.96 Number of Stocks 18 34 41 49 51
Tracking Error 16.05 7.56 6.50 5.18 1.33 BMC 1 2 3 4 5
CS 3.49* 0.46 1.43 0.27 4.50 T (2.27) (0.39) (0.98) (0.16) (1.49)
Fund Weight 17.34 37.48 28.79 12.39 3.99 Number of Stocks 39 44 45 38 26
Tracking Error 4.21 3.25 4.02 4.70 8.26 PR1YR 1 2 3 4 5
CS -6.72 -0.63 1.63 3.22* 1.42 T (-1.50) (-0.22) (0.90) (2.07) (0.69)
Fund Weight 3.15 14.07 25.55 37.64 19.59 Number of Stocks 18 39 53 49 33
Tracking Error 12.30 8.00 4.96 4.25 5.61
Using the non-overlapping benchmark in Panel A, there is no statistically
significant CS across any of the characteristic quintile groups. The largest MCAP
group, quintile 5 has CS of 0.89% per month has the strongest statistical significance
(t-stat 1.93). This suggests, using this benchmark, PAD funds show no stock selection
ability.
19
Using the overlapping benchmark in Panel B, we find statistically significant CS in
large (MCAP quintiles 4 and 5) and small stocks (MCAP quintile 2), growth stocks
(BMC quintile 1) and moderate momentum stocks (PR1YR quintile 4). Again, when
we restrict our analysis to only stocks entering the sample December end, the statistical
significance of results remains consistent. This suggests the difference in results to that
in Panel A is not due to including mid-entry stocks.
When comparing the tracking error of the statistically significant groups using the
overlapping benchmark in Panel B, to the respective groups in Panel A, the non-
overlapping benchmark reports lower tracking error for MCAP quintile 5 group
(1.26% compared to 1.33%). However in the other four groups is higher compared to
the overlapping benchmark. Of the remaining groups, the non-overlapping benchmark
has lower tracking error in all except four groups (MCAP 1, BMC 2 and 3, PR1YR 5).
This suggests better ability to detect stock selection ability in the overlapping
benchmark.
6. Conclusion
We explore the application of characteristic benchmarks and propose a modified
DGTW benchmark. The methodology we offer enables a more precise measurement of
stock selection ability through better capturing characteristic stock returns. In forming
this benchmark, we consider issues of incorporating more timely characteristic
information in the formation of characteristic portfolios, matching characteristic
portfolios to migrating stocks, an ability to benchmark stocks entering the market index
intra-year and assigning zero alpha to a market index replicating strategy.
Applying this modified benchmark to Australian fund manager monthly holdings,
we find a near halving in tracking error volatility of the overlapping benchmark
compared with the DGTW benchmark and also lower tracking error when
benchmarking by fund style and stock characteristics compared with a non-overlapping
benchmark with the same number of portfolio sorts and holding period.
Also when modifying the parameters of the overlapping benchmark, we find
tracking error is lower when increasing the number of characteristic portfolios and
when increasing the holding period length. This suggests a benchmark’s ability to
capture characteristic returns improves when a stock is measured against a benchmark
comprising of a smaller group of stocks with similar characteristics and allowing for
longer holding period lengths.
20

Our findings show simple modifications in the characteristic benchmark
methodology improves the ability of the benchmark to capture characteristic stock
returns and thus more accurately measure stock selection ability. This has implications
for future research in considering the methodology of characteristic benchmark to use.
21
References
Avramov, D., Wermers, R., 2006. Investing in mutual funds when returns are
predictable. Journal of Financial Economics 81, 339-377.
Carhart, M.M., 1997. On persistence in mutual fund performance. Journal of Finance
52, 57-82
Chan, L.K.C., Dimmock, S.G., Lakonishok, J., 2006. Benchmarking money manager
performance: Issues and evidence. Working Paper, University of Illinois at
Urbana-Champaign.
Chen, H.L., Jegadeesh, N., Wermers, R., 2000. The value of active mutual fund
management: An examination of the stockholdings and trades of fund
managers. Journal of Financial & Quantitative Analysis 35, 343-368.
Chen, J., Hong, H., Huang, M., Kubik, J.D., 2004. Does fund size erode mutual fund
performance? The role of liquidity and organization. American Economic
Review 94, 1276-1302.
Coval, J.D., Moskowitz, T.J., 2001. The geography of investment: informed trading
and asset prices. Journal of Political Economy 109, 811-841.
Daniel, K., Grinblatt, M., Titman, S., Wermers, R., 1997. Measuring mutual fund
performance with characteristic-based benchmarks. Journal of Finance 52,
1035-1058.
Fama, E.F., French, K.R., 1992. The Cross-Section of Expected Stock Returns. Journal
of Finance 47, 427-465.
Fama, E.F., French, K.R., 1996. Multifactor Explanations of Asset Pricing Anomalies.
Journal of Finance 51, 55-84.
Fama, E.F., French, K.R., 2007. Migration. Working Paper, University of Chicago.
Ferson, W.E., Schadt, R.W., 1996. Measuring Fund Strategy and Performance in
Changing Economic Conditions. Journal of Finance 51, 425-461.
Gallagher, D.R., Looi, A., 2006. Trading behaviour and the performance of daily
institutional trades. Accounting and Finance 46, 125-147.
Green, R.C., 1986. Benchmark portfolio inefficiency and deviations from the security
market line. Journal of Finance 41, 295-312.
Gruber, M.J., 1996. Another Puzzle: The Growth in Actively Managed Mutual Funds.
Journal of Finance 51, 783-810.
Jegadeesh, N., Titman, S., 1993. Returns to buying winners and selling losers:
Implications for stock market efficiency. Journal of Finance 48, 65-91.
22
Jegadeesh, N., Titman, S., 2001. Profitability of momentum strategies: An evaluation
of alternative explanations. Journal of Finance 56, 699-720.
Jensen, M.C., 1968. The Performance of Mutual Funds in the Period 1945-1964.
Journal of Finance 23, 389-416.
Kacperczyk, M., Sialm, C., Zheng, L.U., 2005. On the Industry Concentration of
Actively Managed Equity Mutual Funds. Journal of Finance 60, 1983-2011.
Lehmann, B.N., Modest, D.M., 1987. Mutual Fund Performance Evaluation: A
Comparison of Benchmarks and Benchmark Comparisons. Journal of Finance
42, 233-265.
Malkiel, B.G., 1995. Returns from Investing in Equity Mutual Funds 1971 to 1991.
Journal of Finance 50, 549-572.
Pástor, L., Stambaugh, R.F., 2002a. Investing in equity mutual funds. Journal of
Financial Economics 63, 351-380.
Pástor, L., Stambaugh, R.F., 2002b. Mutual fund performance and seemingly unrelated
assets. Journal of Financial Economics 63, 315-349.
Pinnuck, M., 2003. An Examination of the Performance of the Trades and Stock
Holdings of Fund Managers: Further Evidence. Journal of Financial &
Quantitative Analysis 38, 811-828.
Roll, R., 1977. A critique of the asset pricing theory's tests Part I: On past and potential
testability of the theory. Journal of Financial Economics 4, 129-176.
Roll, R., 1978. Ambiguity when Performance is Measured by the Securities Market
Line. Journal of Finance 33, 1051-1069.
Wermers, R., 2000. Mutual Fund Performance: An Empirical Decomposition into
Stock-Picking Talent, Style, Transactions Costs, and Expenses. Journal of
Finance 55, 1655-1703.
23