
The Use of Benchmarks in Public Reporting: Measuring ... Use of Benchmarks in Public Reporting:...
52
The Use of Benchmarks in Public Reporting: Measuring Performance & Setting Meaningful Goals Moderator: Miin Alikhan Director, Health Quality Branch Ministry of Health and Long-Term Care
Transcript of The Use of Benchmarks in Public Reporting: Measuring ... Use of Benchmarks in Public Reporting:...

The Use of Benchmarks in Public Reporting: Measuring Performance & Setting Meaningful
Goals
Moderator: Miin AlikhanDirector, Health Quality Branch Ministry of Health and Long-Term Care
Presenter Disclosure
• Session Name: The Use of Benchmarks in Public Reporting: Measuring Performance & Setting Meaningful Goals
• Presenters: Miin Alikhan (moderator), Dr. Astrid Guttmann, Dr. Walter Wodchis, Jonathan Wiersma, Corry O’Neil, Stella Leung, Cathy Fiore
• Relationships with commercial interests:
– Not Applicable
2

Disclosure of Commercial Support
• This session has received no commercial support
3

Mitigating Potential Bias
• Not applicable
4
Learning Objectives
5
1. Develop an understanding of benchmarks and how they are both practically and appropriately applied to health system public reporting.
2. Discover the tactical approaches organizations in Ontario have used to drive sustained improvement and breakthrough performances.
Overview
6
Item SpeakerWelcome/Introductions Miin Alikhan
Driving Performance Improvement:
Measurement & QI
Dr. Astrid Guttmann
Benchmark Theory Burst Dr. Walter Wodchis
Hospital Representatives Jonathan Wiersma (Royal Victoria Regional
Health Centre)
Corry O’Neil (Windsor Regional Hospital)
LTC Home Representatives Stella Leung (Mon Sheong)
Cathy Fiore (O’Neill Centre)
Closing Remarks Dr. Astrid Guttmann
Question & Answer Period Panel
Tools & Resources Miin Alikhan

Driving Performance Improvement: Measurement & QI
Astrid GuttmannSenior Scientist
Institute for Clinical Evaluative Sciences

8
“Measurement is the first step that leads to control and eventually to improvement. If you can’t measure something, you can’t understand it. If you can’t
understand it, you can’t control it. If you can’t control it, you can’t improve it.”
H. James Harrington

9
10
Department of Veterans Affairs Hospital Compare
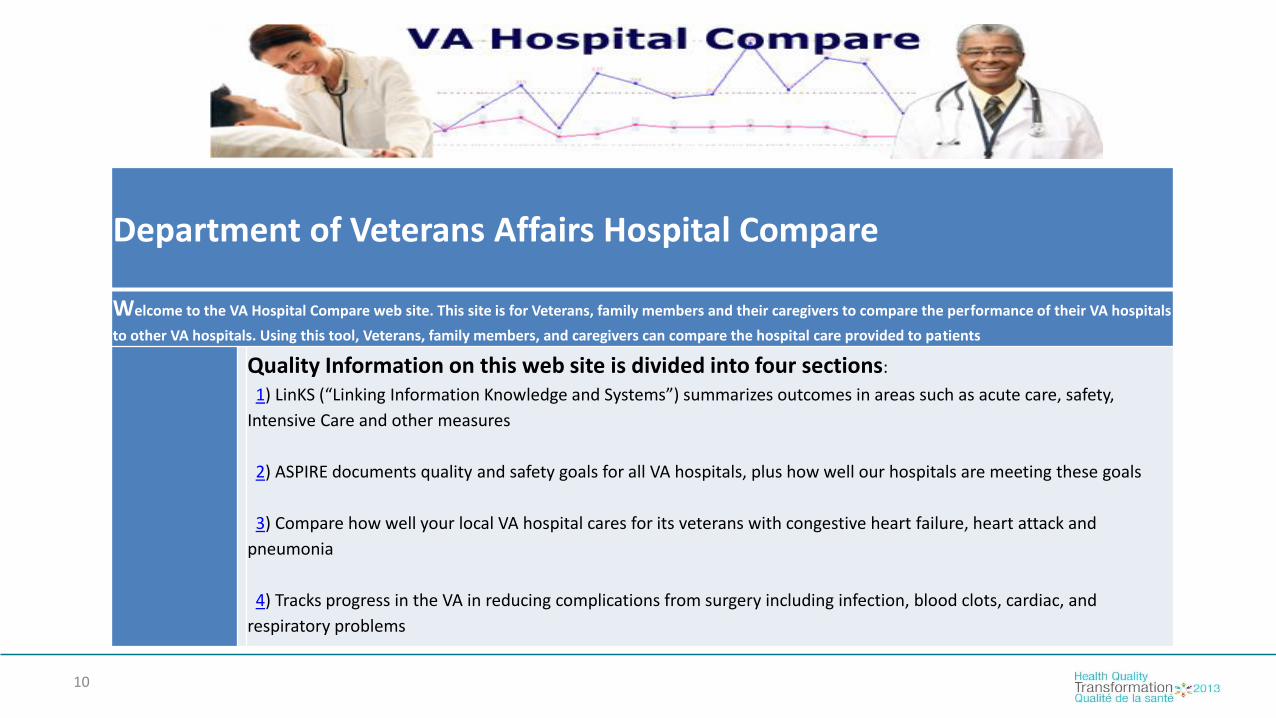
Welcome to the VA Hospital Compare web site. This site is for Veterans, family members and their caregivers to compare the performance of their VA hospitals
to other VA hospitals. Using this tool, Veterans, family members, and caregivers can compare the hospital care provided to patients
Quality Information on this web site is divided into four sections:
1) LinKS (“Linking Information Knowledge and Systems”) summarizes outcomes in areas such as acute care, safety,
Intensive Care and other measures
2) ASPIRE documents quality and safety goals for all VA hospitals, plus how well our hospitals are meeting these goals
3) Compare how well your local VA hospital cares for its veterans with congestive heart failure, heart attack and
pneumonia
4) Tracks progress in the VA in reducing complications from surgery including infection, blood clots, cardiac, and
respiratory problems

11
Effect of the Transformation of the Veterans Affairs Health Care System on the Quality of Care Jha A et al, www.nejm.org may 29, 2003Making performance indicators work: experiences of US Veterans Health Administration Kerr E and Fleming B. BMJ2007;335doi: http://dx.doi.org/10.1136/bmj.39358.498889.94(Published 8 November 2007)
• Performance Measurement System
• IT system for clinical use as well as performance monitoring • Benchmarks for comparisons• Quality Improvement support • Realignment of incentives to encourage better performance
Key Ingredients to Success of the VA System

12
Early Evidence: Positive Impact of Public Reporting in Ontario
Daneman N, Stukel, T, Ma X, Guttmann A Reduction in C.difficile Infection Rates After Mandatory Hospital Public Reporting: Findings From a Longitudinal Cohort Study in Canada, PLOS Medicine 2012

13
10 Recommendations for Successful Implementation of Quality Improvement Interventions
(10 Ontario Hospitals; ED-PIP)
1. Need strong CEO and senior administration support2. Careful preparation and information leading up to intervention3. Careful and early selection of intervention team members4. Need explicit & shared understanding of role of external consultant5. Brand the intervention carefully6. Invest in capacity for performance measurement7. Remember it’s a marathon and not a sprint 8. Communicate frequently and in all ways, but don’t forget face-to-face9. Ensure you have effective physician leadership10.Develop a plan for sustainability early

Benchmark Theory Burst
Walter WodchisAssociate Professor
University of Toronto, Institute of Health Policy, Management and Evaluation

Setting Targets for Performance Indicators
• Performance indicators are useful measurement tools to highlight current state.
• Performance management requires goals.
• Targets for performance indicators are required for performance management.
15

Common Quality Agenda: Indicator Targets
• HQO has developed a set of health system performance indicators across all care sectors and measures of system integration.
• How should targets be set?
• How are targets set?
16
Target Setting Framework
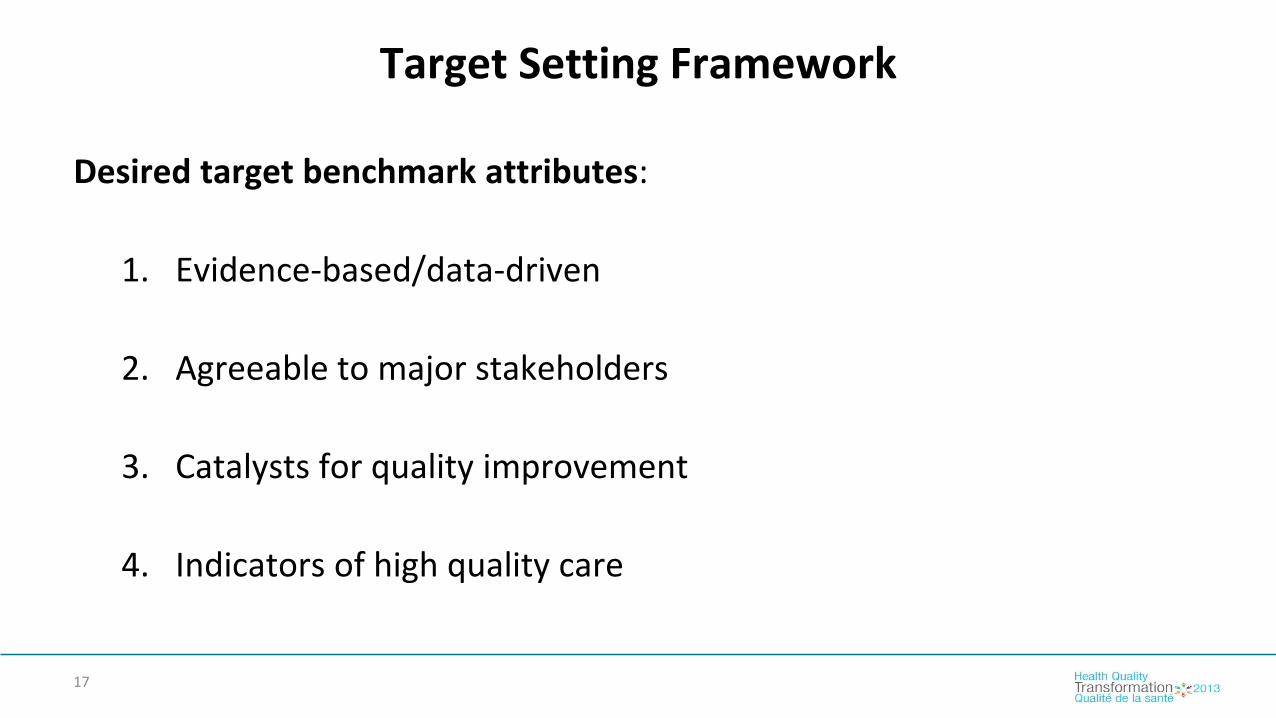
Desired target benchmark attributes:
1. Evidence-based/data-driven
2. Agreeable to major stakeholders
3. Catalysts for quality improvement
4. Indicators of high quality care
17

Target Setting Framework
• Some indicators have a natural target (e.g., never events)
• Some indicators have a known epidemiology
• Some indicators have best practice evidence
All of these are important considerations in choosing a method to select targets. HQO mostly employs a modified Delphi process incorporating all approaches that ultimately results in benchmarks having all four of the desired attributes
A case example: Long Term Care
18
Which Quality Indicators were Selected for Benchmarking?
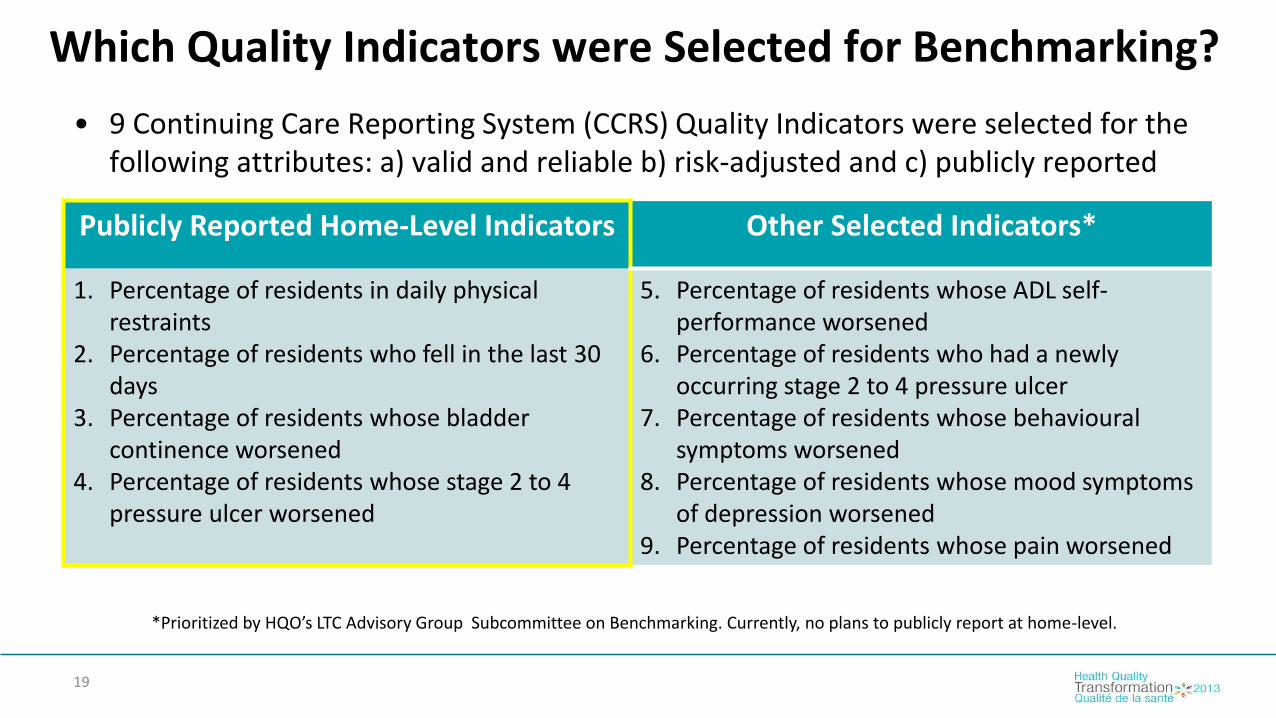
• 9 Continuing Care Reporting System (CCRS) Quality Indicators were selected for the following attributes: a) valid and reliable b) risk-adjusted and c) publicly reported
Publicly Reported Home-Level Indicators Other Selected Indicators*
1. Percentage of residents in daily physical restraints
2. Percentage of residents who fell in the last 30 days
3. Percentage of residents whose bladder continence worsened
4. Percentage of residents whose stage 2 to 4 pressure ulcer worsened
5. Percentage of residents whose ADL self-performance worsened
6. Percentage of residents who had a newly occurring stage 2 to 4 pressure ulcer
7. Percentage of residents whose behavioural symptoms worsened
8. Percentage of residents whose mood symptoms of depression worsened
9. Percentage of residents whose pain worsened
*Prioritized by HQO’s LTC Advisory Group Subcommittee on Benchmarking. Currently, no plans to publicly report at home-level.
19
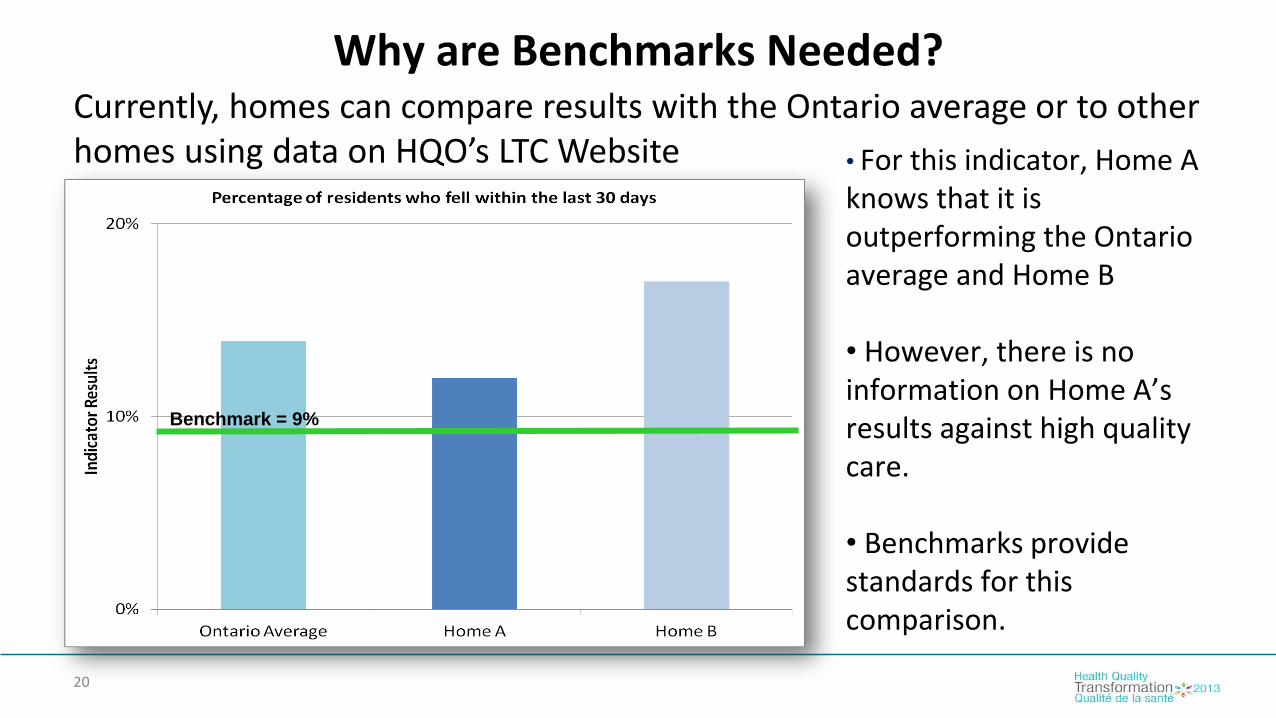
Why are Benchmarks Needed?Currently, homes can compare results with the Ontario average or to other homes using data on HQO’s LTC Website • For this indicator, Home A
knows that it is outperforming the Ontario average and Home B
• However, there is no information on Home A’s results against high quality care.
• Benchmarks provide standards for this comparison.
Benchmark = 9%
20
21
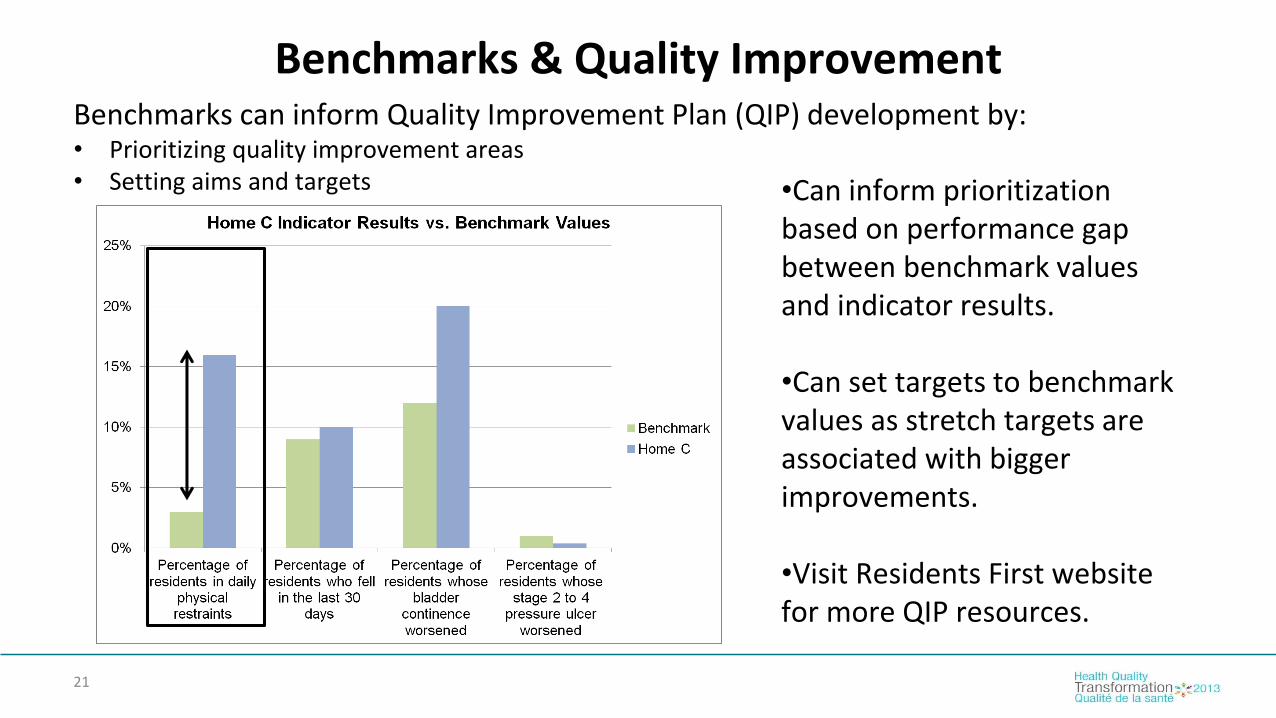
Benchmarks & Quality ImprovementBenchmarks can inform Quality Improvement Plan (QIP) development by:• Prioritizing quality improvement areas• Setting aims and targets •Can inform prioritization
based on performance gap between benchmark values and indicator results.
•Can set targets to benchmark values as stretch targets are associated with bigger improvements.
•Visit Residents First website for more QIP resources.
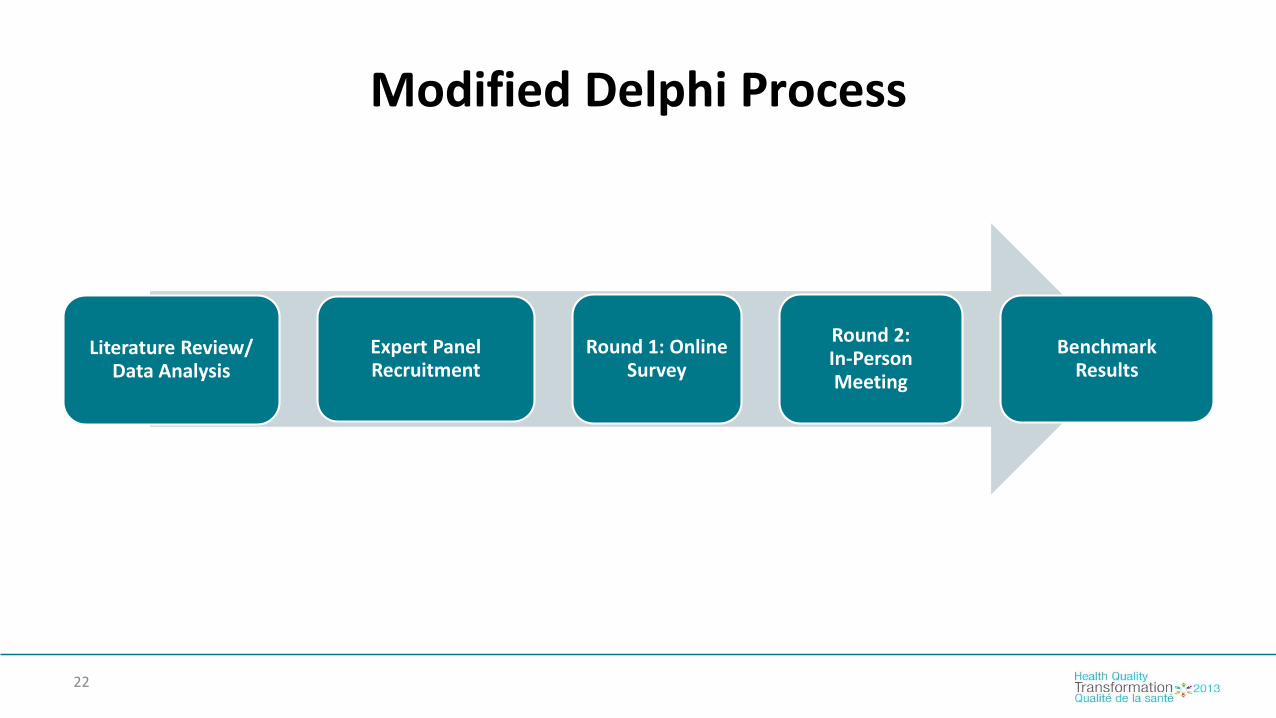
Modified Delphi Process
22
Literature Review/ Data Analysis
Expert Panel Recruitment
Round 1: Online Survey
Round 2:In-Person Meeting
BenchmarkResults

23
Information Provided to Expert Panel1. Indicator Description
2. Literature Search Results 4. Indicator Performance in Ontario
3. Indicator Performance in Canada

Modified Delphi Process
24
Regional distributions with markers for expert panel responses• The x’s mark the expert panel members’ suggested benchmarks. • The red circle is the expert panel mean response. The box-plots show the 10th, 25th, median, 75th, and
90th percentiles of the provincial rates.• Indicator is percent of LTC residents who fell.
9.5%
0.0% 5.0% 10.0% 15.0% 20.0% 25.0%
Yukon (n=4)
Nova Scotia (n=6)
Newfoundland and Labrador (n=7)
Manitoba (n=38)
British Columbia (n=274)
Ontario (n=637)
Indicator Rate (%)

Modified Delphi Process
25

Publicly Reported LTC CCRS Home-Level Indicators
26
Indicator BenchmarkOntario Rate,
Q4 11/12
Ontario Facility-Level Distribution (Percentile)
Q4 2011/12
10th 25th Median 75th 90th
1. Percentage of residents
in daily physical restraints 3% 14% 2% 6% 13% 21% 27%
2. Percentage of residents
who fell in the last 30 days 9% 14% 9% 11% 14% 17% 19%
3. Percentage of residents
whose bladder continence
worsened12% 19% 9% 14% 20% 27% 32%
4. Percentage of residents
whose stage 2 to 4
pressure ulcer worsened1% 3% 1% 2% 3% 4% 5%

Target Setting Framework
27
• The Modified Delphi process will largely be applied in the Common Quality Agenda.
• Some targets will adopt MOHLTC standards (e.g., ALC).
• Some targets will adopt other groups standards (e.g., Stroke Network, Public Health Agency of Canada, Cancer Care Ontario etc.).
Royal Victoria Regional Health Centre
Jonathan Wiersma M.Sc.Director – Decision Support
(Royal Victoria Regional Health Centre)
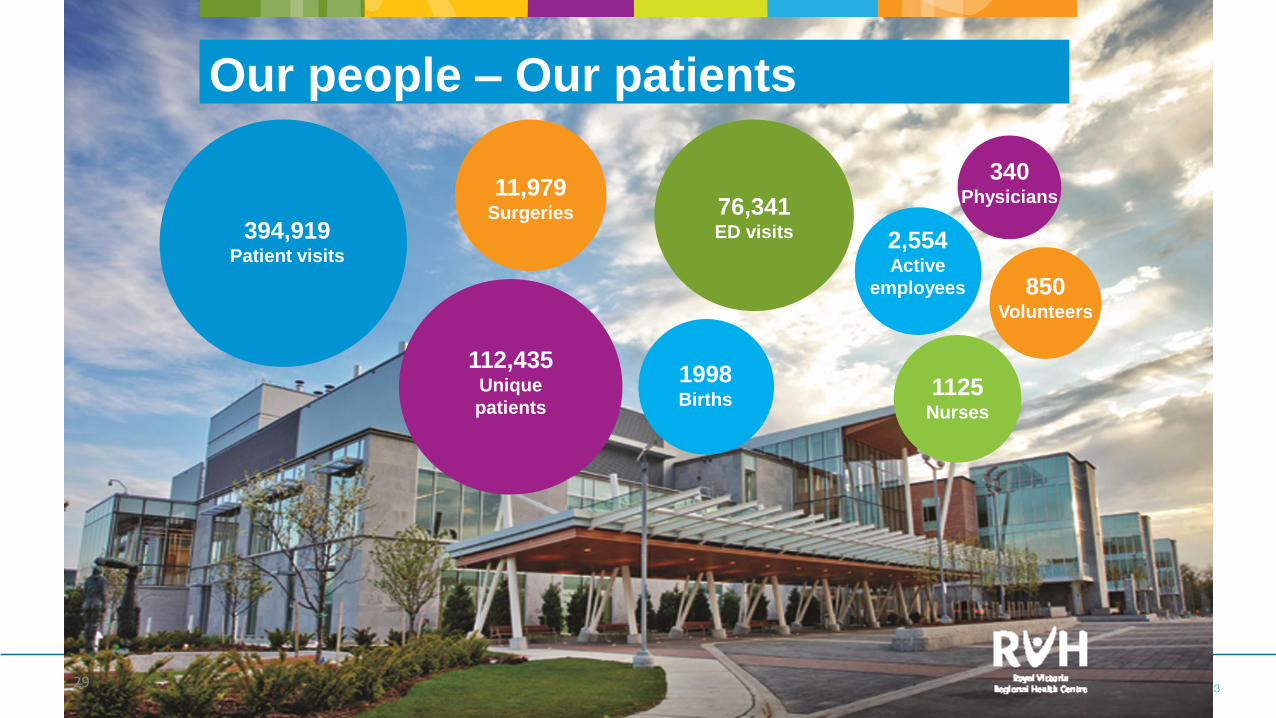
Our people – Our patients
394,919Patient visits
112,435Unique
patients
850 Volunteers
76,341ED visits 2,554
Active
employees
1125 Nurses
340 Physicians
1998 Births
11,979 Surgeries
29

SMART Indicators / Targets
• Specific – Thank you HQO, What can we do about it?
• Measurable – Big data!!! (HQO, MOHLTC, CIHI and RVH)
• Achievable – Target Setting process
• Relevant / Reasonable – LEM™, SLT, Org Goals
• Time-bound – Quarterly Reporting
30

Know Thyself…“Big Data”
Patient Safety Indicator Summary of data for :
Clostridium Difficile
Infection (CDI)Hospital Name Type LHIN Nov-
09
Dec-
09
Jan-
10
Feb-
10
Mar-
10
Apr-
10
May-
10
Jun-
10
Jul-
10
Aug-
10
Sep-
10
Oct-
10
Nov-
10
Dec-
10
Jan-
11
Feb-
11
Mar-
11
Apr-
11
May-
11
Jun-
11
Jul-
11
Aug-
11
Sep-
11
Oct-
11
Nov-
11 AverageMax Min 10th %-ile20th %-ile30th %-ile40th %-ile50th %-ile60th %-ile70th %-ile80th %-ile90th %-ileQuinte Healthcare - Bancroft North
Hastings Site
Large Community South East 0 0 0 0 0 0 0 0 0 0 0 0 0 0 0 0 0 0 0 5.18 0 0 0 0 00.3 5.2 - - - - - - - - - -
Quinte Healthcare - Belleville
General Site
Large Community South East 0.42 0.21 0.59 0.67 0.21 0.42 0 0 0.21 0.41 0.41 0.19 1.43 0.83 0.34 0.99 0.37 0.37 0.75 1.18 0.93 0.55 0.36 0.33 0.350.5 1.4 - 0.2 0.3 0.3 0.4 0.4 0.4 0.6 0.9 1.0
Quinte Healthcare - Picton Prince
Edward Site
Large Community South East 0 1.55 0 0 0 3.51 1.73 3.75 3.09 1.46 0 0 0 0 0 1.75 0 1.78 1.74 0 0 0 0 0 00.9 3.8 - - - - - - 0.6 1.7 1.8 3.1
Quinte Healthcare - Trenton
Memorial Site
Large Community South East 0 0 0 1.19 0 0 0 0 0 0 0 0 0 0 0 1.09 0 1.03 0 0 1.98 0 2.04 0.97 00.4 2.0 - - - - - - - - 1.0 1.2
Rainy River Unit - Riverside Health
Care Facilities
Large Community North West 0 0 0 0 0 0 0 0 0 0 0 0 0 0 0 0 0 0 0 0 0 0 0 0 0- - - - - - - - - - - -
Ross Memorial Hospital Large Community Central East 0.21 0.22 0.2 0 0.62 0.22 0.44 0 0.23 0.21 0.23 0 0.23 0.23 0.2 0 0 0.45 0.23 0 0.26 0 0 0 0.22 0.2 0.5 - - - - 0.1 0.2 0.2 0.2 0.2 0.3 Royal Victoria Hospital Of Barrie
(The)
Large Community North Simcoe
Muskoka
0.46 0.47 0.34 1.2 0.57 0.5 0.58 0.38 0.79 0.56 0.14 0.53 0.42 0.27 0.12 0.14 0 0.13 0.12 0.25 0.38 0 0.12 0.37 0.370.3 0.8 - 0.1 0.1 0.1 0.2 0.3 0.4 0.4 0.5 0.6
Sault Area Hospital - General Site Large Community North East 0.9 0 0.2 0.21 0.19 0.39 0.57 0.4 0.2 0.19 0.2 1 0.24 0.48 0 0.96 0 0.14 0 0 0.29 0.43 0.42 0.42 0.540.3 1.0 - - 0.1 0.2 0.2 0.3 0.4 0.4 0.5 0.6
Sault Area Hospital - Plummer Site Large Community North East 0 0 0 0 0 0.25 0 0 0 0 0 0 0 0.25 0 0 0 0 0 0 0 0 0 0 00.0 0.3 - - - - - - - - - 0.0
Scarborough General Hospital Large Community Central East 0.35 0.12 0.56 0.36 0.23 0.24 0.46 0.37 0.13 0.13 0.26 0.58 0.58 0.45 0.53 0.25 0.45 1.09 0.48 0.25 0.24 0.47 0.73 0.82 0.35 0.4 1.1 0.1 0.2 0.2 0.3 0.4 0.5 0.5 0.5 0.6 0.7 Scarborough Salvation Army Grace
Hospital
Large Community Central East 0.48 0 0.31 0.51 0.49 0.16 0.49 0 0.34 0 0 0.33 0 0.16 0.15 0.17 0.15 0.34 0.47 0.85 0.17 0.34 0.52 0.15 0.330.3 0.9 - - 0.1 0.2 0.2 0.2 0.3 0.3 0.4 0.5
Simcoe Norfolk General Hospital Large Community Hamilton Niagara
Haldimand Brant
(HNHB)
0.33 1.02 2.3 0.72 0.93 1.05 0.33 0 0 0.65 0.34 0 0.75 0 0.33 0.39 0.34 0 0.36 0 0.34 0.34 0.35 0 1.02
0.3 1.1 - - - - 0.3 0.3 0.3 0.4 0.4 0.8 Smiths Falls Community Hospital
Site
Large Community South East 0 0 0 0 0 0 0 0 0 0 0 0.95 0 0 0 0 0 0.96 1.92 0 0 0 0 0 00.2 1.9 - - - - - - - - - 1.0
Southhampton Hospital - Grey
Bruce Health Services
Large Community South West 0 0 0 0 0 0 0 0 0 0 0 2.36 0 0 0 0 0 0 2.29 0 0 0 0 0 00.2 2.4 - - - - - - - - - 0.2
Southlake Regional Health Centre Large Community Central 0.61 0.49 0.59 0.28 0.78 0.52 0.12 0.37 0.91 0.89 0.27 0.68 0.26 0.52 0.32 0.42 0.26 0.29 0.56 0.89 0.37 0.47 0.73 0.72 0.360.5 0.9 0.1 0.3 0.3 0.3 0.4 0.4 0.5 0.6 0.7 0.9
St Catharines General Hospital Site
- Niagara Health System
Large Community Hamilton Niagara
Haldimand Brant
(HNHB)
0 0.31 0.43 0.62 0.14 0.45 1.17 0.44 0.43 0.57 0.15 0.15 0.15 0.44 0.55 0.74 0.43 0.72 3.48 2.53 1.47 1.17 0.8 0.15 0.15
0.8 3.5 0.2 0.2 0.2 0.4 0.4 0.5 0.6 0.8 1.2 1.6
Peer 0.3 1.4 0.0 0.1 0.1 0.1 0.2 0.2 0.3 0.4 0.5 0.7
RVH 0.309 0.79 0 0.108 0.12 0.137 0.206 0.32 0.374 0.392 0.506 0.562
1 0.72
2 0.51 0.42
3 0.41 0.24
4 0.23 0.08
5 0.07
1 0.52
2 0.51 0.32
3 0.31 0.24
4 0.23 0.08
5 0.07
(0.1)
-
0.1
0.2
0.3
0.4
0.5
0.6
0.7
0.8
0.9
5 4 3 2 1
20th
Avg
80th
Ap
r-1
0
May
-10
Jun
-10
Jul-
10
Au
g-1
0
Sep
-10
Oct
-10
No
v-10
Dec
-10
Jan
-11
Feb
-11
Mar
-11
Ap
r-1
1
May
-11
Jun
-11
Jul-
11
Au
g-1
1
Sep
-11
Oct
-11
No
v-11
Dec
-11
LEM Score Peer RVH Data
Cdiff
5
3
1
QIP Proposed Baseline
Clostridium Difficile Infection (CDI)
QIP Proposed Baseline
0%
5%
10%
15%
20%
25%
5 4 3 2 1
20
th
Avg
80
th
Ap
r-1
0
May
-10
Jun
-10
Jul-
10
Au
g-1
0
Sep
-10
Oct
-10
No
v-1
0
Dec
-10
Jan
-11
Feb
-11
Mar
-11
Ap
r-1
1
May
-11
Jun
-11
Jul-
11
Au
g-1
1
Sep
-11
Oct
-11
No
v-1
1
Dec
-11
LEM Score Peer RVH Data
Alternate Level of Care
5
3
1
QIP Proposed Baseline
0%
5%
10%
15%
20%
25%
5 4 3 2 1
20
th
Avg
80
th
Ap
r-1
0
May
-10
Jun
-10
Jul-
10
Au
g-1
0
Sep
-10
Oct
-10
No
v-1
0
Dec
-10
Jan
-11
Feb
-11
Mar
-11
Ap
r-1
1
May
-11
Jun
-11
Jul-
11
Au
g-1
1
Sep
-11
Oct
-11
No
v-1
1
Dec
-11
LEM Score Peer RVH Data
Alternate Level of Care
5
3
1
31

Where You Are and Where To Go?Royal Victoria Regional Health Centre Targets Compared to Past Performance
Peer Percentiles
Indicators 10th 20th 30th 40th 50th 60th 70th 80th 90th
Use of Physical Restraints2 Baseline-
Target
Medication Reconcilitation at Admission Baseline Target
Hospital Standardized Mortality Ratio1 Target Baseline
ER Wait Times - 90th Percentile Admitted Patients Baseline Target
ER Wait Times - 90th Percentile Complex Care Baseline Target
"Would You Recommend" Baseline Target
"Overal Satisfaction" Baseline Target
1. Current baseline is below recognizable targets.
2. Baseline and Target are in the same percentile range due to the width of the range.
32

Keys to Success
• Diversity in Target Setting, not just the “Math Guys”
• Senior Leadership Team Buy In (~ 1 day)
• Make it relatable to everyone
• Keep it focused, allow for variation (ranges)
• Intertwine Quality with Performance Measurement
• Reporting (Quarterly Integrated: Front lines to Board)
• Don’t make in “another thing”
• Demonstrate Action – What we doing? What can we do
• Demonstrate Results: No complex tools (Excel, PowerPoint, Adobe)
• Celebrate Success
33
Windsor RegionalHospital
Corry O’NeilDirector – Org. Effectiveness, Patient Safety and Quality
(Windsor Regional Hospital)

35
About Windsor Regional Hospital (WRG)

Monitoring Performance
36

37
Monitoring Performance

38
Setting Goals
Mon Sheong
Stella LeungSenior Administrator
(Mon Sheong Scarborough Long Term Care Centre)

Mon Sheong ScarboroughLong Term Care Centre
40
• Operation Since: 27 September, 2004
• Capacity: 160 beds
• Home Layout: 7 Units, Four Floor Levels
• Special Programs and Services: Secure Unit, Dementia Care, PD Services, G-tube Feeding, Oxygen Therapy, Palliative Care

Develop Benchmarks and Targets
41
References:
• Industrial reference
• Home historical performance

Industrial Reference
42
0
5
10
15
2009Q4 2010Q1 2010Q2 2010Q3
Province Fall Rate
CIHI 2010 data on rate of fall
2010 Province median rate: 13.4 %
%

Set Your Benchmarks and Targets
43
Outcome: 2011 home median rate: 7.2%
Use CIHI 2010 province median rate (13.4%) as home target goal for 2011
0
2
4
6
8
10
12
14
16
2010Q4 2011Q1 2011Q2 2011Q3
Home Fall Rate
Target Goal
%
(2011 Home actual performance)
(2010 Province median rate)

Target Goals VS Historical Data
44
Based on 2011 home median rate (7.2%) to set 2012 target goal for home CQI
Outcome: 2012 home median rate: 6.15%
%
0
2
4
6
8
10
12
14
16
2011Q4 2012Q1 2012Q2 2012Q3
Home Fall Rate(2012 Home actual performance)
Province Fall Rate(2012)
Target Goal(2011 Home median rate)
• add equipment• reinforce on medication review• reinforce on toileting plan review
• implement daily census & analysis on each incident• activation implement Assistive Devices Program

Continuous Quality Improvement on Benchmarking
45
Use 2012 home median rate (6.15%) as target goal for 2013
%
0
2
4
6
8
10
12
14
16
2012Q4 2013Q1 2013Q2 2013Q3
Province Fall Rate(2013)
Home Fall Rate(2013 Home actualperformance)
Target Goal(2013 Home median rate)
The O’Neill Centre
Cathy FioreAdministrator
(The O’Neill Centre Long Term Care and Retirement Home)

47
48
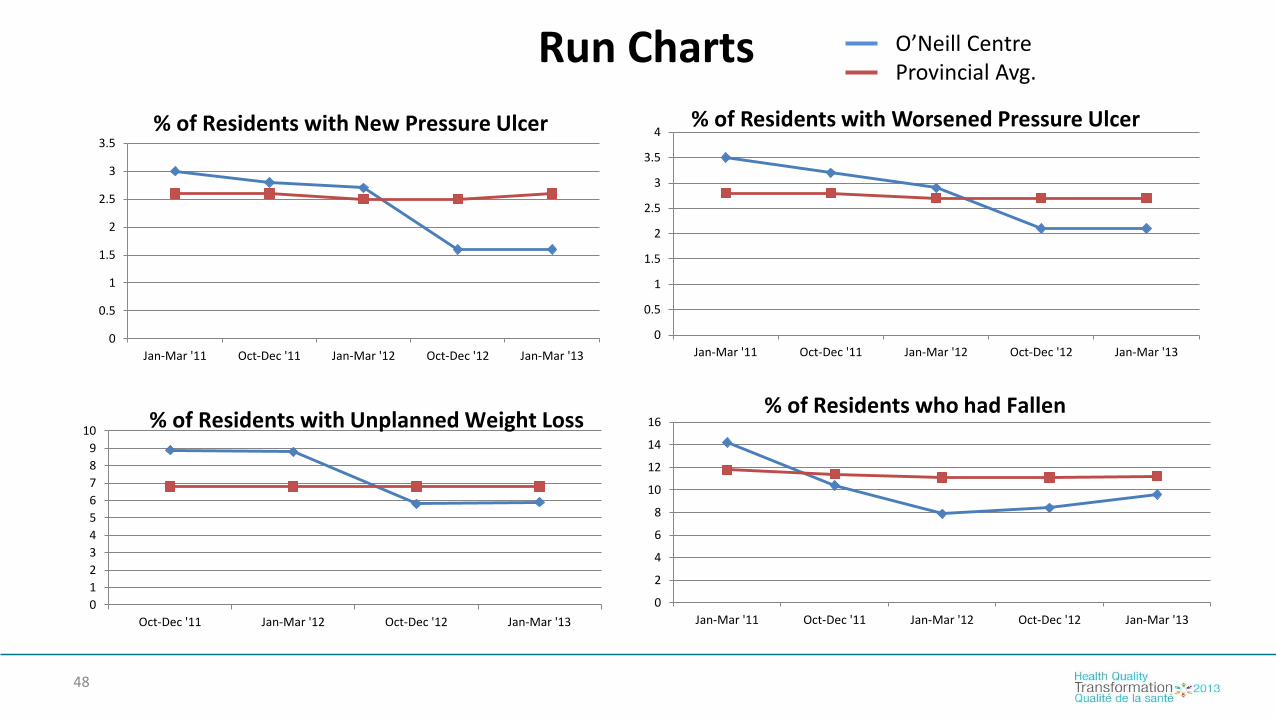
Run Charts
0
2
4
6
8
10
12
14
16
Jan-Mar '11 Oct-Dec '11 Jan-Mar '12 Oct-Dec '12 Jan-Mar '13
% of Residents who had Fallen
0
1
2
3
4
5
6
7
8
9
10
Oct-Dec '11 Jan-Mar '12 Oct-Dec '12 Jan-Mar '13
% of Residents with Unplanned Weight Loss
0
0.5
1
1.5
2
2.5
3
3.5
Jan-Mar '11 Oct-Dec '11 Jan-Mar '12 Oct-Dec '12 Jan-Mar '13
% of Residents with New Pressure Ulcer
0
0.5
1
1.5
2
2.5
3
3.5
4
Jan-Mar '11 Oct-Dec '11 Jan-Mar '12 Oct-Dec '12 Jan-Mar '13
% of Residents with Worsened Pressure Ulcer
O’Neill CentreProvincial Avg.

Challenges and Successes
49

Closing Remarks
Astrid Guttmann
Questions & Answers

www.hqontario.ca
HQO and Links to Provincial, Federal and InternationalTools & Resources
• Quality Compass
• QI Reporting Platforms
• EDS/OHTAC Recommendations & Supporting Resources
• Quality Improvement Tools & Resources
• Print and Web-Based Public Reporting Resources
52


![NOUTATI NOV 2012 FULL VERSION - drept.unibuc.ro · Socio-economic benefits of intellectual property protection in developing countries [Text tiparit] / Shahid Alikhan. - Alikhan,](https://static.fdocuments.in/doc/165x107/5e09a413db512b7aec31becc/noutati-nov-2012-full-version-drept-socio-economic-benefits-of-intellectual-property.jpg)
![Benchmarks - June, 2013 | Benchmarks Onlineit.unt.edu/sites/default/files/benchmarks-06-2013.pdf · Benchmarks - June, 2013 | Benchmarks Online 4/26/16, 8:52:25 AM] Skip to content](https://static.fdocuments.in/doc/165x107/5f9d6dd4a6e586755376b37d/benchmarks-june-2013-benchmarks-benchmarks-june-2013-benchmarks-online.jpg)


![STR2RTS: Refactored StreamIT benchmarks into statically …embedded.cs.uni-saarland.de/wcet-presentations/STR2RTS.pdf · 2017-06-28 · [1] Enrico Bini and Giorgio C Bu‘azzo. Measuring](https://static.fdocuments.in/doc/165x107/5f5937703d361d1396626c53/str2rts-refactored-streamit-benchmarks-into-statically-2017-06-28-1-enrico.jpg)

