BCSSE Summary Report - Indiana University Bloomingtonbcsse.indiana.edu/pdf/2015/BCSSE15 Summary...
34
BCSSE Summary Report Public
Transcript of BCSSE Summary Report - Indiana University Bloomingtonbcsse.indiana.edu/pdf/2015/BCSSE15 Summary...
BCSSE Summary Report
Public
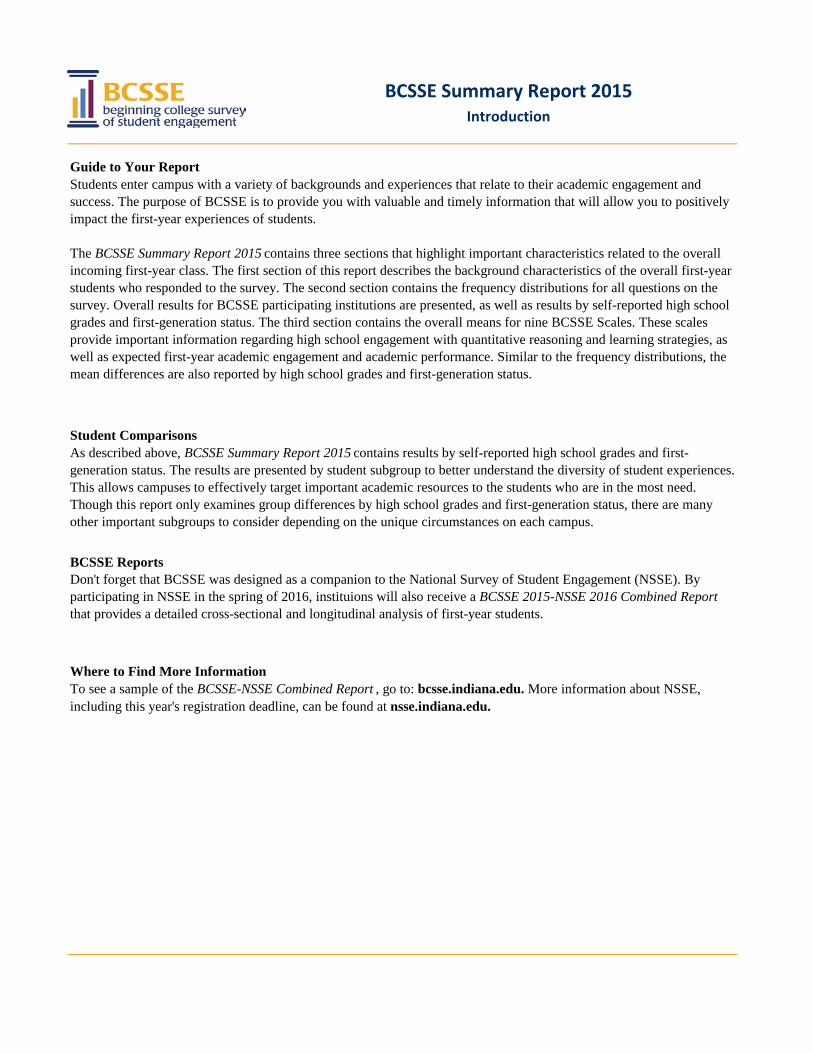
Guide to Your Report
Student Comparisons
BCSSE Summary Report 2015Introduction
To see a sample of the BCSSE-NSSE Combined Report , go to: bcsse.indiana.edu. More information about NSSE, including this year's registration deadline, can be found at nsse.indiana.edu.
Don't forget that BCSSE was designed as a companion to the National Survey of Student Engagement (NSSE). By participating in NSSE in the spring of 2016, instituions will also receive a BCSSE 2015-NSSE 2016 Combined Report that provides a detailed cross-sectional and longitudinal analysis of first-year students.
Where to Find More Information
BCSSE Reports
As described above, BCSSE Summary Report 2015 contains results by self-reported high school grades and first-generation status. The results are presented by student subgroup to better understand the diversity of student experiences. This allows campuses to effectively target important academic resources to the students who are in the most need. Though this report only examines group differences by high school grades and first-generation status, there are many other important subgroups to consider depending on the unique circumstances on each campus.
Students enter campus with a variety of backgrounds and experiences that relate to their academic engagement and success. The purpose of BCSSE is to provide you with valuable and timely information that will allow you to positively impact the first-year experiences of students.
The BCSSE Summary Report 2015 contains three sections that highlight important characteristics related to the overall incoming first-year class. The first section of this report describes the background characteristics of the overall first-year students who responded to the survey. The second section contains the frequency distributions for all questions on the survey. Overall results for BCSSE participating institutions are presented, as well as results by self-reported high school grades and first-generation status. The third section contains the overall means for nine BCSSE Scales. These scales provide important information regarding high school engagement with quantitative reasoning and learning strategies, as well as expected first-year academic engagement and academic performance. Similar to the frequency distributions, the mean differences are also reported by high school grades and first-generation status.

a. Student reported characteristics for all BCSSE 2015 respondents.b. First generation is defined as no parent or guardian having graduated with a 4-year college degree.
Count %Number of Surveys Completed 48110 100
Mode of CompletionPaper 30400 63Web 17710 37
When Student Completed BCSSEPrior to the start of fall term classes 41665 88During the first week of fall term classes 3436 7After the first week of fall term classes 2191 5
Student CharacteristicsEnrollment Status
Full-time 44505 99Less than full-time 510 1
GenderMan 13433 39Women 20697 60Another gender identity 107 0Prefer not to respond 179 1
American Indian or Alaska Native 201 0Asian 2146 5Black or African American 5170 11Hispanic or Latino 3610 8Native Hawaiian or Other Pacific Islander 98 0White 29211 65Other 461 1Multiracial 3683 8I prefer not to respond 628 1
High School Graduation Year2012 or earlier 492 12013 336 12014 1150 22015 45906 96
First Generation Status b
Yes 23100 52No 21711 48
International or Foreign National StudentYes 1307 3No 43663 97
BCSSE 2015 Administration DetailsPublic
Respondentsa
Race/Ethnicity(Select all that apply)
BCSSE Summary Report Frequency Distributions
Public
1. 4.
5.
2.6.
3.7.
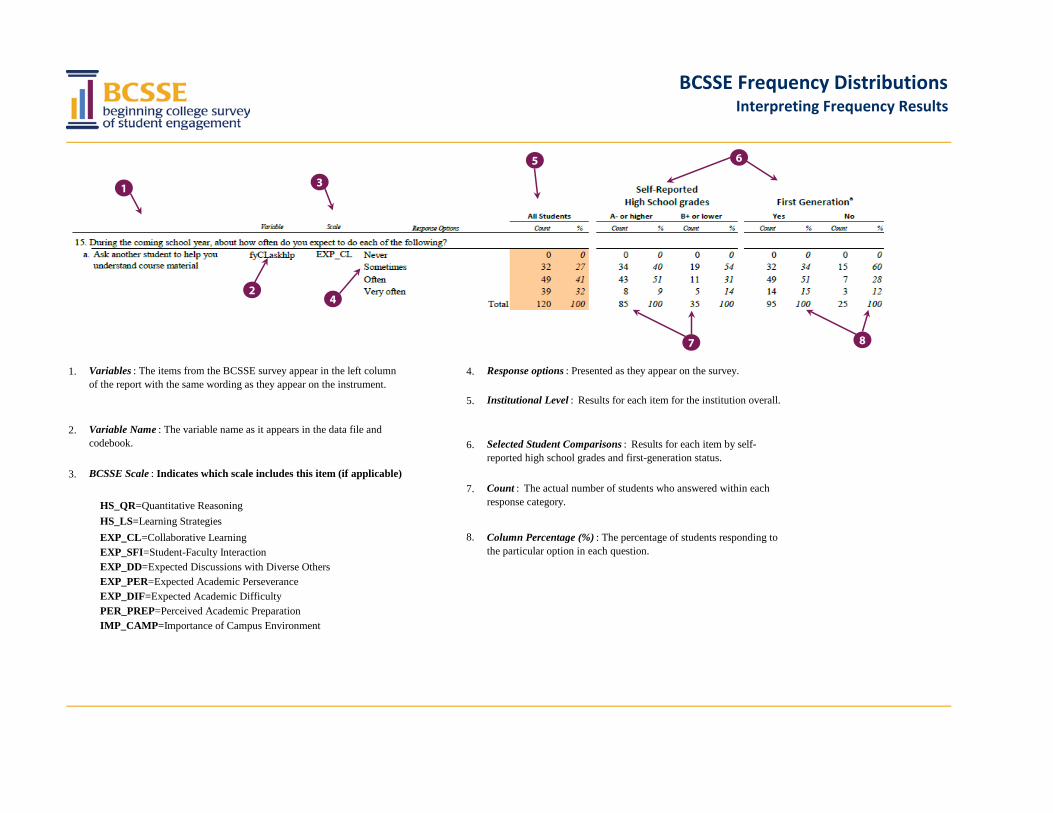
HS_QR=Quantitative ReasoningHS_LS=Learning StrategiesEXP_CL=Collaborative Learning 8.EXP_SFI=Student-Faculty InteractionEXP_DD=Expected Discussions with Diverse OthersEXP_PER=Expected Academic PerseveranceEXP_DIF=Expected Academic DifficultyPER_PREP=Perceived Academic Preparation IMP_CAMP=Importance of Campus Environment
BCSSE Frequency Distributions Interpreting Frequency Results
Variables : The items from the BCSSE survey appear in the left column of the report with the same wording as they appear on the instrument.
Variable Name : The variable name as it appears in the data file and codebook.
Column Percentage (%) : The percentage of students responding to the particular option in each question.
BCSSE Scale : Indicates which scale includes this item (if applicable)
Response options : Presented as they appear on the survey.
Institutional Level : Results for each item for the institution overall.
Selected Student Comparisons : Results for each item by self-reported high school grades and first-generation status.
Count : The actual number of students who answered within each response category.
1
2
3
4
5 6
7 8
BCSSE 2015 FREQUENCY DISTRIBUTIONS • 6
Variable Scale Response Options Count % Count % Count % Count % Count %
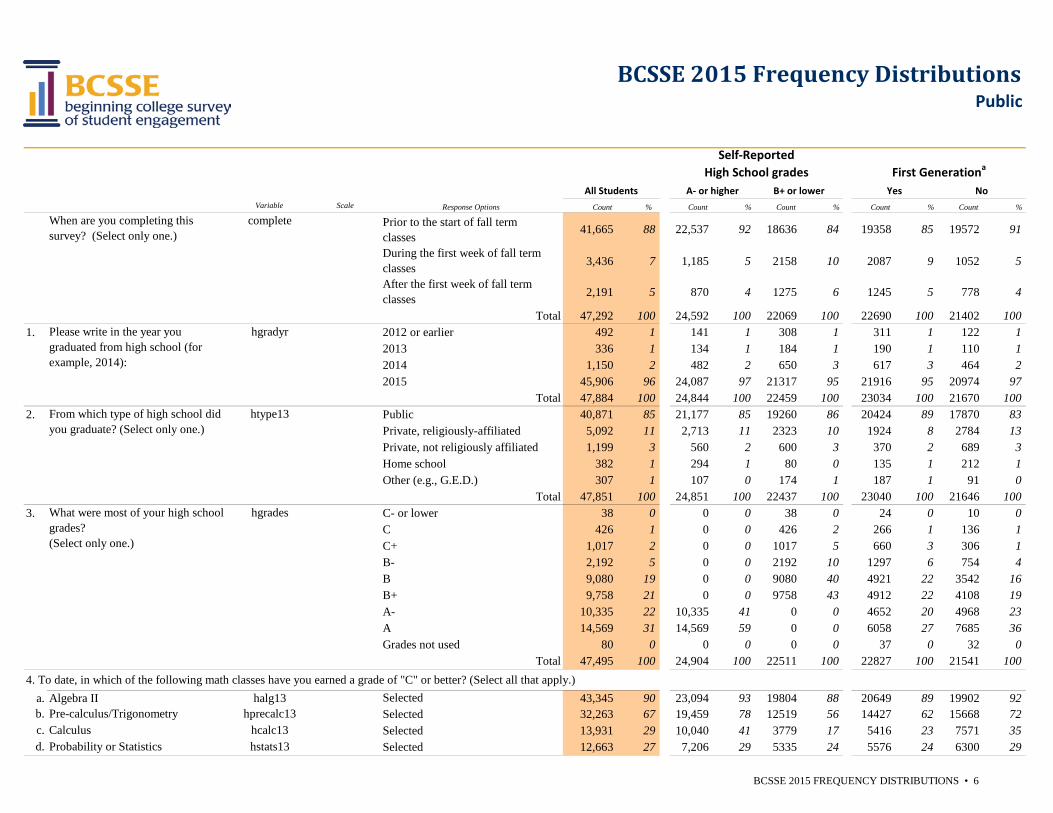
Prior to the start of fall termclasses
41,665 88 22,537 92 18636 84 19358 85 19572 91
During the first week of fall term classes 3,436 7 1,185 5 2158 10 2087 9 1052 5
After the first week of fall term classes 2,191 5 870 4 1275 6 1245 5 778 4
Total 47,292 100 24,592 100 22069 100 22690 100 21402 1001. 2012 or earlier 492 1 141 1 308 1 311 1 122 1
2013 336 1 134 1 184 1 190 1 110 12014 1,150 2 482 2 650 3 617 3 464 22015 45,906 96 24,087 97 21317 95 21916 95 20974 97
Total 47,884 100 24,844 100 22459 100 23034 100 21670 1002. Public 40,871 85 21,177 85 19260 86 20424 89 17870 83
Private, religiously-affiliated 5,092 11 2,713 11 2323 10 1924 8 2784 13Private, not religiously affiliated 1,199 3 560 2 600 3 370 2 689 3Home school 382 1 294 1 80 0 135 1 212 1Other (e.g., G.E.D.) 307 1 107 0 174 1 187 1 91 0
Total 47,851 100 24,851 100 22437 100 23040 100 21646 1003. C- or lower 38 0 0 0 38 0 24 0 10 0
C 426 1 0 0 426 2 266 1 136 1C+ 1,017 2 0 0 1017 5 660 3 306 1B- 2,192 5 0 0 2192 10 1297 6 754 4B 9,080 19 0 0 9080 40 4921 22 3542 16B+ 9,758 21 0 0 9758 43 4912 22 4108 19A- 10,335 22 10,335 41 0 0 4652 20 4968 23A 14,569 31 14,569 59 0 0 6058 27 7685 36Grades not used 80 0 0 0 0 0 37 0 32 0
Total 47,495 100 24,904 100 22511 100 22827 100 21541 1004. To date, in which of the following math classes have you earned a grade of "C" or better? (Select all that apply.)
a. Algebra II halg13 Selected 43,345 90 23,094 93 19804 88 20649 89 19902 92b. Pre-calculus/Trigonometry hprecalc13 Selected 32,263 67 19,459 78 12519 56 14427 62 15668 72c. Calculus hcalc13 Selected 13,931 29 10,040 41 3779 17 5416 23 7571 35d. Probability or Statistics hstats13 Selected 12,663 27 7,206 29 5335 24 5576 24 6300 29
BCSSE 2015 Frequency Distributions
Self-ReportedHigh School grades First Generationa
Public
Please write in the year you graduated from high school (for example, 2014):
hgradyr
From which type of high school did you graduate? (Select only one.)
htype13
Yes NoB+ or lower
complete
All Students A- or higher
What were most of your high school grades?(Select only one.)
hgrades
When are you completing this survey? (Select only one.)

BCSSE 2015 FREQUENCY DISTRIBUTIONS • 7
Variable Scale Response Options Count % Count % Count % Count % Count %
BCSSE 2015 Frequency Distributions
Self-ReportedHigh School grades First Generationa
Public
Yes NoB+ or lowerAll Students A- or higher
5. Did you take the SAT or ACT? hsatact No 490 1 156 1 292 1 277 1 155 1Yes 47,185 99 24,636 99 22047 99 22685 99 21445 99
Total 47,675 100 24,792 100 22339 100 22962 100 21600 100900 or lower 4,279 10 995 4 3213 17 3089 15 984 5901-1000 7,491 17 2,763 12 4641 24 4483 22 2591 131001-1100 7,685 18 3,533 15 4088 21 3957 19 3277 161101-1200 10,547 25 6,142 27 4313 22 4612 23 5247 261201-1300 7,497 17 5,262 23 2182 11 2754 14 4334 221301-1400 3,317 8 2,649 11 649 3 955 5 2165 111401-1600 2,038 5 1,749 8 277 1 456 2 1470 7
Total 42,854 100 23,093 100 19363 100 20306 100 20068 1006. During high school, how many of the following types of classes did you complete?
a. 0 12,406 28 4,719 20 7523 36 6898 32 4759 231-2 14,240 32 7,064 31 7039 34 7161 34 6211 313-4 8,850 20 5,330 23 3430 17 3889 18 4454 225-6 4,861 11 3,227 14 1599 8 1889 9 2669 137-8 2,372 5 1,669 7 688 3 869 4 1368 79-10 992 2 718 3 264 1 365 2 570 311 or more 574 1 401 2 165 1 219 1 323 2
Total 44,295 100 23,128 100 20708 100 21290 100 20354 100b. 0 19,768 53 8,762 45 10803 62 9864 54 8729 52
1-2 9,109 24 5,141 26 3869 22 4422 24 4170 253-4 3,938 11 2,643 14 1266 7 1781 10 1931 115-6 1,772 5 1,269 6 480 3 786 4 900 57-8 871 2 615 3 247 1 415 2 424 39-10 427 1 280 1 138 1 212 1 191 111 or more 1,415 4 838 4 556 3 757 4 579 3
Total 37,300 100 19,548 100 17359 100 18237 100 16924 100
Advanced Placement (AP) classes hapcl13
Recode of SAT Composite Score variable sat_act into categories
sat_actr
College or university courses for credit
hhonor13
BCSSE 2015 FREQUENCY DISTRIBUTIONS • 8
Variable Scale Response Options Count % Count % Count % Count % Count %
BCSSE 2015 Frequency Distributions
Self-ReportedHigh School grades First Generationa
Public
Yes NoB+ or lowerAll Students A- or higher
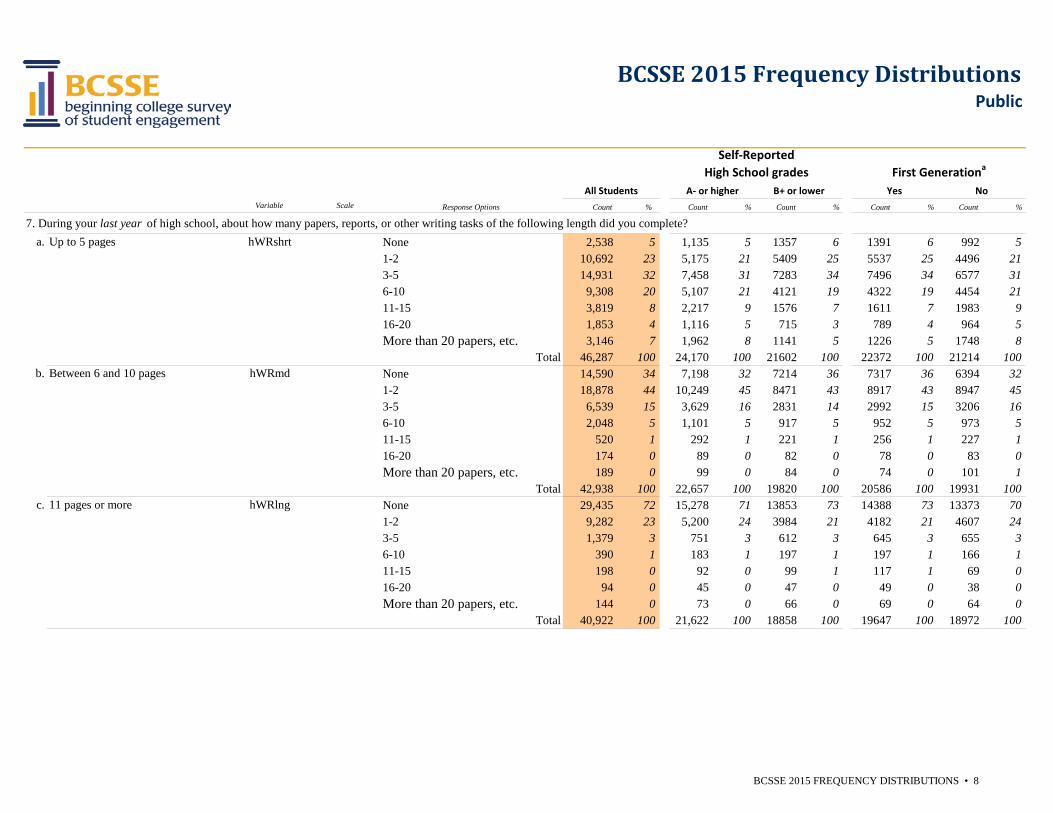
7. During your last year of high school, about how many papers, reports, or other writing tasks of the following length did you complete?a. None 2,538 5 1,135 5 1357 6 1391 6 992 5
1-2 10,692 23 5,175 21 5409 25 5537 25 4496 213-5 14,931 32 7,458 31 7283 34 7496 34 6577 316-10 9,308 20 5,107 21 4121 19 4322 19 4454 2111-15 3,819 8 2,217 9 1576 7 1611 7 1983 916-20 1,853 4 1,116 5 715 3 789 4 964 5More than 20 papers, etc. 3,146 7 1,962 8 1141 5 1226 5 1748 8
Total 46,287 100 24,170 100 21602 100 22372 100 21214 100b. None 14,590 34 7,198 32 7214 36 7317 36 6394 32
1-2 18,878 44 10,249 45 8471 43 8917 43 8947 453-5 6,539 15 3,629 16 2831 14 2992 15 3206 166-10 2,048 5 1,101 5 917 5 952 5 973 511-15 520 1 292 1 221 1 256 1 227 116-20 174 0 89 0 82 0 78 0 83 0More than 20 papers, etc. 189 0 99 0 84 0 74 0 101 1
Total 42,938 100 22,657 100 19820 100 20586 100 19931 100c. None 29,435 72 15,278 71 13853 73 14388 73 13373 70
1-2 9,282 23 5,200 24 3984 21 4182 21 4607 243-5 1,379 3 751 3 612 3 645 3 655 36-10 390 1 183 1 197 1 197 1 166 111-15 198 0 92 0 99 1 117 1 69 016-20 94 0 45 0 47 0 49 0 38 0More than 20 papers, etc. 144 0 73 0 66 0 69 0 64 0
Total 40,922 100 21,622 100 18858 100 19647 100 18972 100
Between 6 and 10 pages hWRmd
11 pages or more hWRlng
Up to 5 pages hWRshrt
BCSSE 2015 FREQUENCY DISTRIBUTIONS • 9
Variable Scale Response Options Count % Count % Count % Count % Count %
BCSSE 2015 Frequency Distributions
Self-ReportedHigh School grades First Generationa
Public
Yes NoB+ or lowerAll Students A- or higher
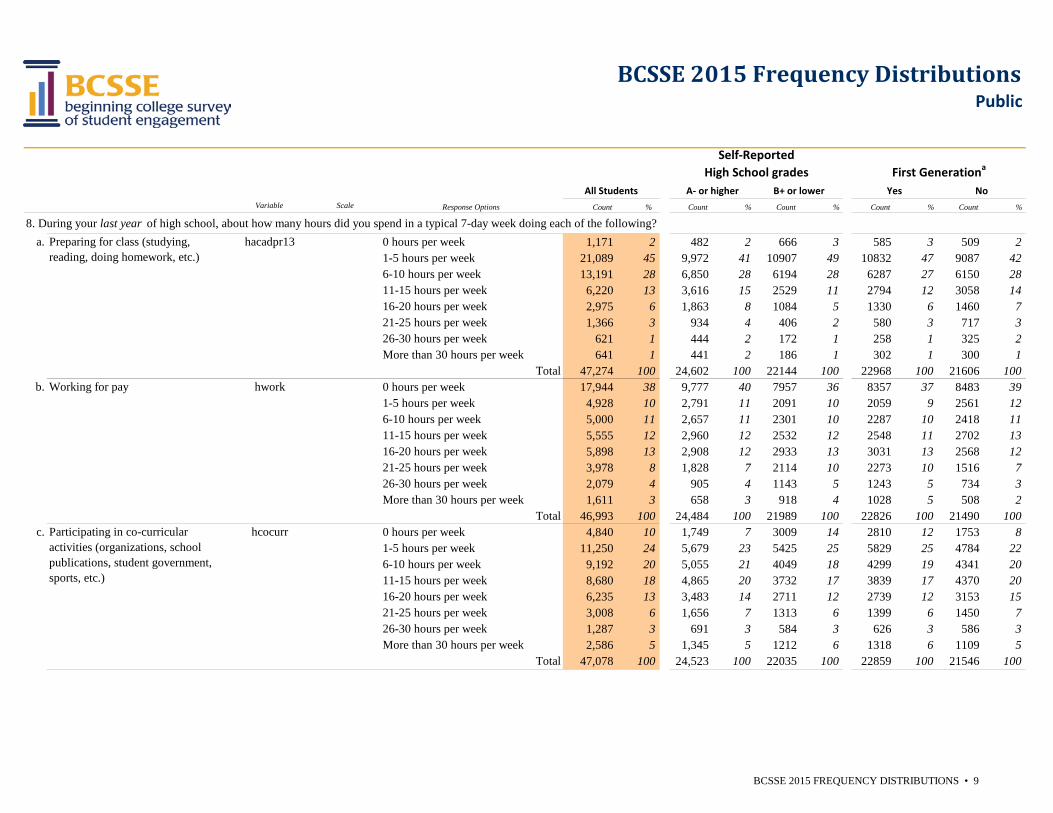
8. During your last year of high school, about how many hours did you spend in a typical 7-day week doing each of the following?a. 0 hours per week 1,171 2 482 2 666 3 585 3 509 2
1-5 hours per week 21,089 45 9,972 41 10907 49 10832 47 9087 426-10 hours per week 13,191 28 6,850 28 6194 28 6287 27 6150 2811-15 hours per week 6,220 13 3,616 15 2529 11 2794 12 3058 1416-20 hours per week 2,975 6 1,863 8 1084 5 1330 6 1460 721-25 hours per week 1,366 3 934 4 406 2 580 3 717 326-30 hours per week 621 1 444 2 172 1 258 1 325 2More than 30 hours per week 641 1 441 2 186 1 302 1 300 1
Total 47,274 100 24,602 100 22144 100 22968 100 21606 100b. 0 hours per week 17,944 38 9,777 40 7957 36 8357 37 8483 39
1-5 hours per week 4,928 10 2,791 11 2091 10 2059 9 2561 126-10 hours per week 5,000 11 2,657 11 2301 10 2287 10 2418 1111-15 hours per week 5,555 12 2,960 12 2532 12 2548 11 2702 1316-20 hours per week 5,898 13 2,908 12 2933 13 3031 13 2568 1221-25 hours per week 3,978 8 1,828 7 2114 10 2273 10 1516 726-30 hours per week 2,079 4 905 4 1143 5 1243 5 734 3More than 30 hours per week 1,611 3 658 3 918 4 1028 5 508 2
Total 46,993 100 24,484 100 21989 100 22826 100 21490 100c. 0 hours per week 4,840 10 1,749 7 3009 14 2810 12 1753 8
1-5 hours per week 11,250 24 5,679 23 5425 25 5829 25 4784 226-10 hours per week 9,192 20 5,055 21 4049 18 4299 19 4341 2011-15 hours per week 8,680 18 4,865 20 3732 17 3839 17 4370 2016-20 hours per week 6,235 13 3,483 14 2711 12 2739 12 3153 1521-25 hours per week 3,008 6 1,656 7 1313 6 1399 6 1450 726-30 hours per week 1,287 3 691 3 584 3 626 3 586 3More than 30 hours per week 2,586 5 1,345 5 1212 6 1318 6 1109 5
Total 47,078 100 24,523 100 22035 100 22859 100 21546 100
Participating in co-curricular activities (organizations, school publications, student government, sports, etc.)
hcocurr
Preparing for class (studying, reading, doing homework, etc.)
hacadpr13
Working for pay hwork
BCSSE 2015 FREQUENCY DISTRIBUTIONS • 10
Variable Scale Response Options Count % Count % Count % Count % Count %
BCSSE 2015 Frequency Distributions
Self-ReportedHigh School grades First Generationa
Public
Yes NoB+ or lowerAll Students A- or higher
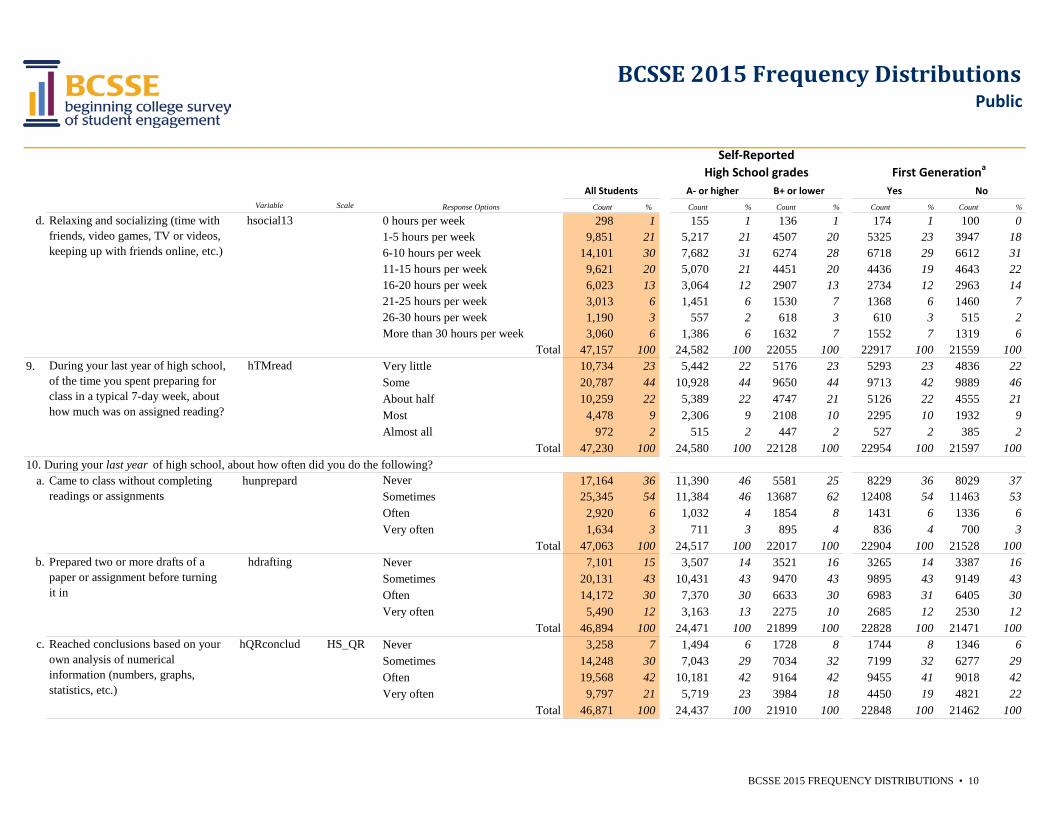
d. 0 hours per week 298 1 155 1 136 1 174 1 100 01-5 hours per week 9,851 21 5,217 21 4507 20 5325 23 3947 186-10 hours per week 14,101 30 7,682 31 6274 28 6718 29 6612 3111-15 hours per week 9,621 20 5,070 21 4451 20 4436 19 4643 2216-20 hours per week 6,023 13 3,064 12 2907 13 2734 12 2963 1421-25 hours per week 3,013 6 1,451 6 1530 7 1368 6 1460 726-30 hours per week 1,190 3 557 2 618 3 610 3 515 2More than 30 hours per week 3,060 6 1,386 6 1632 7 1552 7 1319 6
Total 47,157 100 24,582 100 22055 100 22917 100 21559 1009. Very little 10,734 23 5,442 22 5176 23 5293 23 4836 22
Some 20,787 44 10,928 44 9650 44 9713 42 9889 46About half 10,259 22 5,389 22 4747 21 5126 22 4555 21Most 4,478 9 2,306 9 2108 10 2295 10 1932 9Almost all 972 2 515 2 447 2 527 2 385 2
Total 47,230 100 24,580 100 22128 100 22954 100 21597 10010. During your last year of high school, about how often did you do the following?
a. Never 17,164 36 11,390 46 5581 25 8229 36 8029 37Sometimes 25,345 54 11,384 46 13687 62 12408 54 11463 53Often 2,920 6 1,032 4 1854 8 1431 6 1336 6Very often 1,634 3 711 3 895 4 836 4 700 3
Total 47,063 100 24,517 100 22017 100 22904 100 21528 100b. Never 7,101 15 3,507 14 3521 16 3265 14 3387 16
Sometimes 20,131 43 10,431 43 9470 43 9895 43 9149 43Often 14,172 30 7,370 30 6633 30 6983 31 6405 30Very often 5,490 12 3,163 13 2275 10 2685 12 2530 12
Total 46,894 100 24,471 100 21899 100 22828 100 21471 100c. HS_QR Never 3,258 7 1,494 6 1728 8 1744 8 1346 6
Sometimes 14,248 30 7,043 29 7034 32 7199 32 6277 29Often 19,568 42 10,181 42 9164 42 9455 41 9018 42Very often 9,797 21 5,719 23 3984 18 4450 19 4821 22
Total 46,871 100 24,437 100 21910 100 22848 100 21462 100
Relaxing and socializing (time with friends, video games, TV or videos, keeping up with friends online, etc.)
hsocial13
hTMread
Prepared two or more drafts of a paper or assignment before turning it in
hdrafting
hunprepard
Reached conclusions based on your own analysis of numerical information (numbers, graphs, statistics, etc.)
hQRconclud
Came to class without completing readings or assignments
During your last year of high school, of the time you spent preparing for class in a typical 7-day week, about how much was on assigned reading?
BCSSE 2015 FREQUENCY DISTRIBUTIONS • 11
Variable Scale Response Options Count % Count % Count % Count % Count %
BCSSE 2015 Frequency Distributions
Self-ReportedHigh School grades First Generationa
Public
Yes NoB+ or lowerAll Students A- or higher
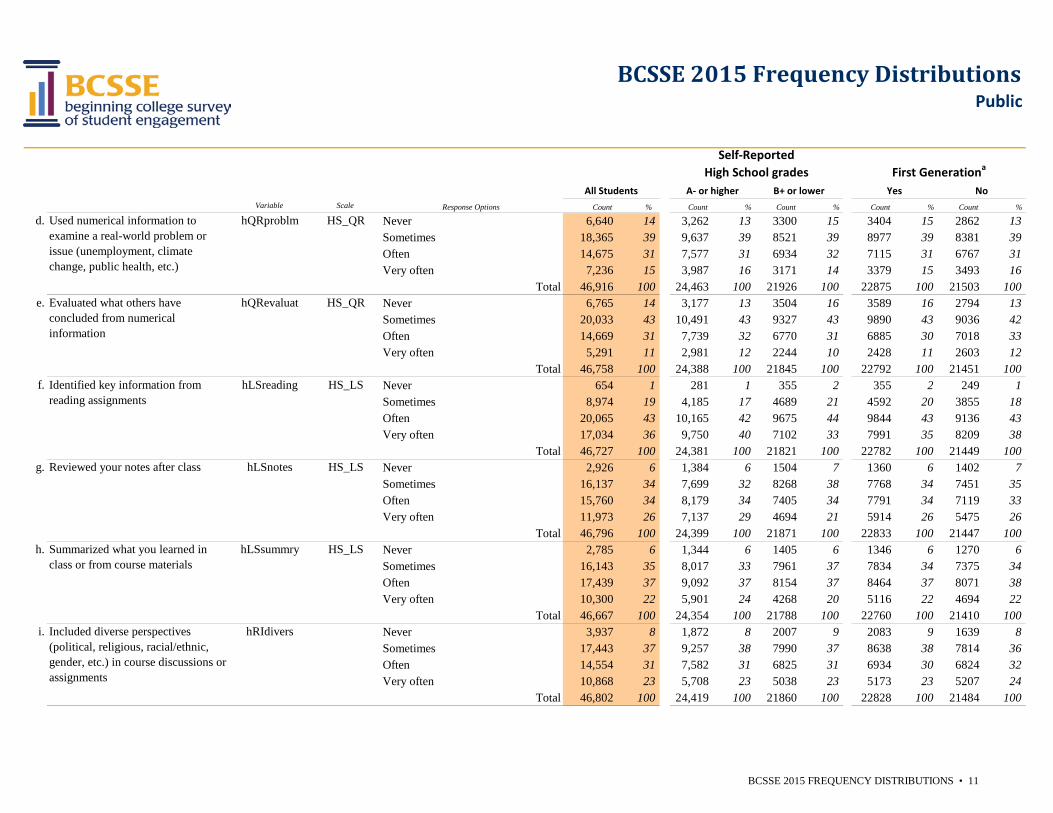
d. HS_QR Never 6,640 14 3,262 13 3300 15 3404 15 2862 13Sometimes 18,365 39 9,637 39 8521 39 8977 39 8381 39Often 14,675 31 7,577 31 6934 32 7115 31 6767 31Very often 7,236 15 3,987 16 3171 14 3379 15 3493 16
Total 46,916 100 24,463 100 21926 100 22875 100 21503 100e. HS_QR Never 6,765 14 3,177 13 3504 16 3589 16 2794 13
Sometimes 20,033 43 10,491 43 9327 43 9890 43 9036 42Often 14,669 31 7,739 32 6770 31 6885 30 7018 33Very often 5,291 11 2,981 12 2244 10 2428 11 2603 12
Total 46,758 100 24,388 100 21845 100 22792 100 21451 100f. HS_LS Never 654 1 281 1 355 2 355 2 249 1
Sometimes 8,974 19 4,185 17 4689 21 4592 20 3855 18Often 20,065 43 10,165 42 9675 44 9844 43 9136 43Very often 17,034 36 9,750 40 7102 33 7991 35 8209 38
Total 46,727 100 24,381 100 21821 100 22782 100 21449 100g. HS_LS Never 2,926 6 1,384 6 1504 7 1360 6 1402 7
Sometimes 16,137 34 7,699 32 8268 38 7768 34 7451 35Often 15,760 34 8,179 34 7405 34 7791 34 7119 33Very often 11,973 26 7,137 29 4694 21 5914 26 5475 26
Total 46,796 100 24,399 100 21871 100 22833 100 21447 100h. HS_LS Never 2,785 6 1,344 6 1405 6 1346 6 1270 6
Sometimes 16,143 35 8,017 33 7961 37 7834 34 7375 34Often 17,439 37 9,092 37 8154 37 8464 37 8071 38Very often 10,300 22 5,901 24 4268 20 5116 22 4694 22
Total 46,667 100 24,354 100 21788 100 22760 100 21410 100i. Never 3,937 8 1,872 8 2007 9 2083 9 1639 8
Sometimes 17,443 37 9,257 38 7990 37 8638 38 7814 36Often 14,554 31 7,582 31 6825 31 6934 30 6824 32Very often 10,868 23 5,708 23 5038 23 5173 23 5207 24
Total 46,802 100 24,419 100 21860 100 22828 100 21484 100
Reviewed your notes after class hLSnotes
Used numerical information to examine a real-world problem or issue (unemployment, climate change, public health, etc.)
hQRproblm
Evaluated what others have concluded from numerical information
hQRevaluat
Identified key information from reading assignments
hLSreading
Summarized what you learned in class or from course materials
hLSsummry
Included diverse perspectives (political, religious, racial/ethnic, gender, etc.) in course discussions or assignments
hRIdivers
BCSSE 2015 FREQUENCY DISTRIBUTIONS • 12
Variable Scale Response Options Count % Count % Count % Count % Count %
BCSSE 2015 Frequency Distributions
Self-ReportedHigh School grades First Generationa
Public
Yes NoB+ or lowerAll Students A- or higher
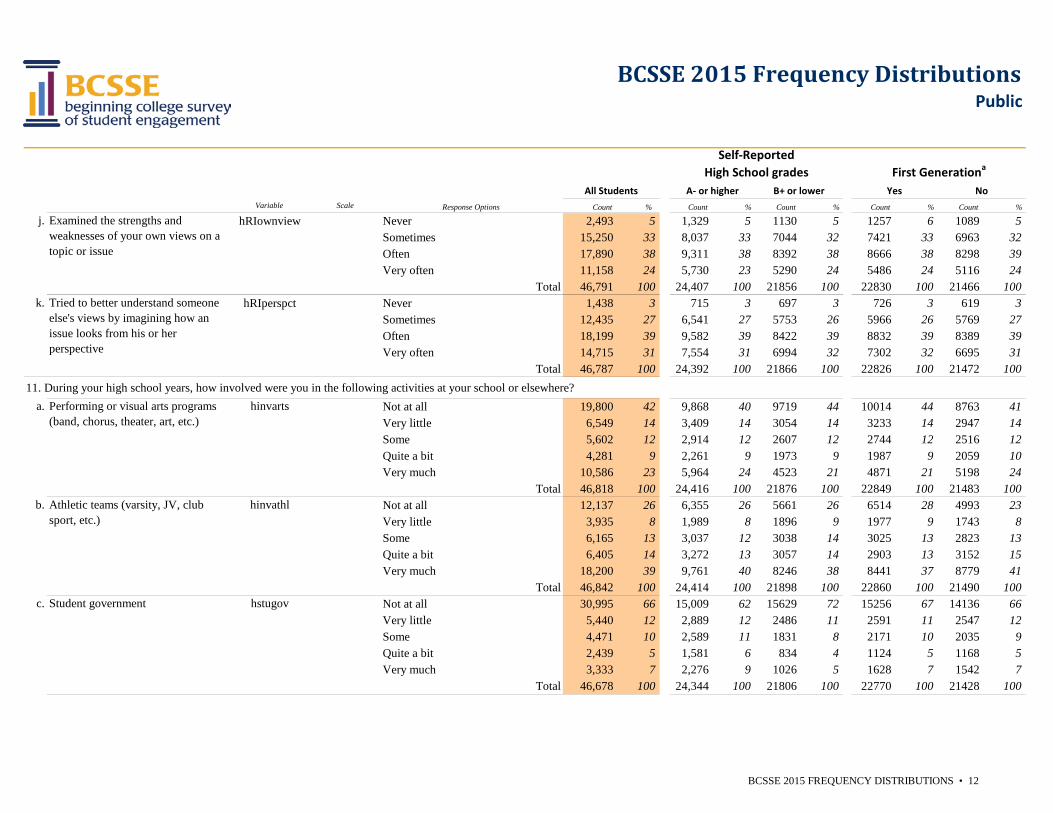
j. hRIownview Never 2,493 5 1,329 5 1130 5 1257 6 1089 5Sometimes 15,250 33 8,037 33 7044 32 7421 33 6963 32Often 17,890 38 9,311 38 8392 38 8666 38 8298 39Very often 11,158 24 5,730 23 5290 24 5486 24 5116 24
Total 46,791 100 24,407 100 21856 100 22830 100 21466 100k. hRIperspct Never 1,438 3 715 3 697 3 726 3 619 3
Sometimes 12,435 27 6,541 27 5753 26 5966 26 5769 27Often 18,199 39 9,582 39 8422 39 8832 39 8389 39Very often 14,715 31 7,554 31 6994 32 7302 32 6695 31
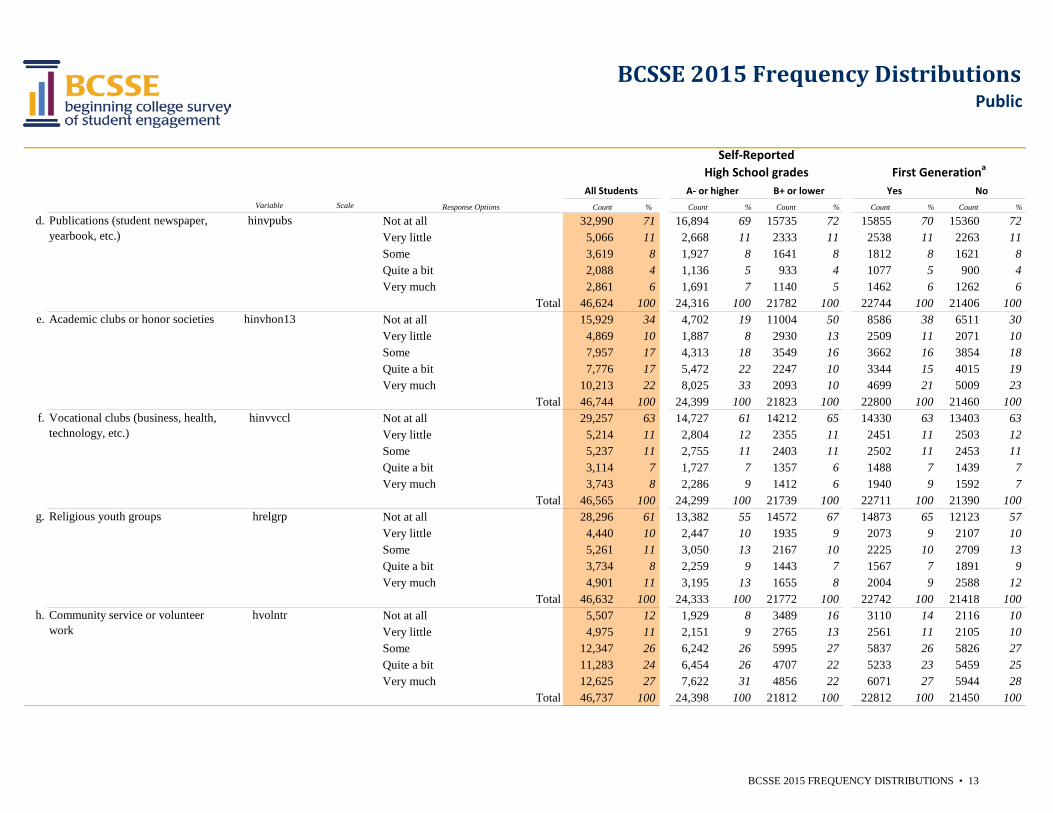
Total 46,787 100 24,392 100 21866 100 22826 100 21472 10011. During your high school years, how involved were you in the following activities at your school or elsewhere?
a. Not at all 19,800 42 9,868 40 9719 44 10014 44 8763 41Very little 6,549 14 3,409 14 3054 14 3233 14 2947 14Some 5,602 12 2,914 12 2607 12 2744 12 2516 12Quite a bit 4,281 9 2,261 9 1973 9 1987 9 2059 10Very much 10,586 23 5,964 24 4523 21 4871 21 5198 24
Total 46,818 100 24,416 100 21876 100 22849 100 21483 100b. Not at all 12,137 26 6,355 26 5661 26 6514 28 4993 23
Very little 3,935 8 1,989 8 1896 9 1977 9 1743 8Some 6,165 13 3,037 12 3038 14 3025 13 2823 13Quite a bit 6,405 14 3,272 13 3057 14 2903 13 3152 15Very much 18,200 39 9,761 40 8246 38 8441 37 8779 41
Total 46,842 100 24,414 100 21898 100 22860 100 21490 100c. Not at all 30,995 66 15,009 62 15629 72 15256 67 14136 66
Very little 5,440 12 2,889 12 2486 11 2591 11 2547 12Some 4,471 10 2,589 11 1831 8 2171 10 2035 9Quite a bit 2,439 5 1,581 6 834 4 1124 5 1168 5Very much 3,333 7 2,276 9 1026 5 1628 7 1542 7
Total 46,678 100 24,344 100 21806 100 22770 100 21428 100
Examined the strengths and weaknesses of your own views on a topic or issue
Tried to better understand someone else's views by imagining how an issue looks from his or her perspective
Performing or visual arts programs (band, chorus, theater, art, etc.)
hinvarts
Athletic teams (varsity, JV, club sport, etc.)
hinvathl
Student government hstugov
BCSSE 2015 FREQUENCY DISTRIBUTIONS • 13
Variable Scale Response Options Count % Count % Count % Count % Count %
BCSSE 2015 Frequency Distributions
Self-ReportedHigh School grades First Generationa
Public
Yes NoB+ or lowerAll Students A- or higher
d. Not at all 32,990 71 16,894 69 15735 72 15855 70 15360 72Very little 5,066 11 2,668 11 2333 11 2538 11 2263 11Some 3,619 8 1,927 8 1641 8 1812 8 1621 8Quite a bit 2,088 4 1,136 5 933 4 1077 5 900 4Very much 2,861 6 1,691 7 1140 5 1462 6 1262 6
Total 46,624 100 24,316 100 21782 100 22744 100 21406 100e. Not at all 15,929 34 4,702 19 11004 50 8586 38 6511 30
Very little 4,869 10 1,887 8 2930 13 2509 11 2071 10Some 7,957 17 4,313 18 3549 16 3662 16 3854 18Quite a bit 7,776 17 5,472 22 2247 10 3344 15 4015 19Very much 10,213 22 8,025 33 2093 10 4699 21 5009 23
Total 46,744 100 24,399 100 21823 100 22800 100 21460 100f. Not at all 29,257 63 14,727 61 14212 65 14330 63 13403 63
Very little 5,214 11 2,804 12 2355 11 2451 11 2503 12Some 5,237 11 2,755 11 2403 11 2502 11 2453 11Quite a bit 3,114 7 1,727 7 1357 6 1488 7 1439 7Very much 3,743 8 2,286 9 1412 6 1940 9 1592 7
Total 46,565 100 24,299 100 21739 100 22711 100 21390 100g. Not at all 28,296 61 13,382 55 14572 67 14873 65 12123 57
Very little 4,440 10 2,447 10 1935 9 2073 9 2107 10Some 5,261 11 3,050 13 2167 10 2225 10 2709 13Quite a bit 3,734 8 2,259 9 1443 7 1567 7 1891 9Very much 4,901 11 3,195 13 1655 8 2004 9 2588 12
Total 46,632 100 24,333 100 21772 100 22742 100 21418 100h. Not at all 5,507 12 1,929 8 3489 16 3110 14 2116 10
Very little 4,975 11 2,151 9 2765 13 2561 11 2105 10Some 12,347 26 6,242 26 5995 27 5837 26 5826 27Quite a bit 11,283 24 6,454 26 4707 22 5233 23 5459 25Very much 12,625 27 7,622 31 4856 22 6071 27 5944 28
Total 46,737 100 24,398 100 21812 100 22812 100 21450 100
hvolntrCommunity service or volunteer work
Publications (student newspaper, yearbook, etc.)
hinvpubs
Academic clubs or honor societies hinvhon13
Religious youth groups hrelgrp
Vocational clubs (business, health, technology, etc.)
hinvvccl
BCSSE 2015 FREQUENCY DISTRIBUTIONS • 14
Variable Scale Response Options Count % Count % Count % Count % Count %
BCSSE 2015 Frequency Distributions
Self-ReportedHigh School grades First Generationa
Public
Yes NoB+ or lowerAll Students A- or higher
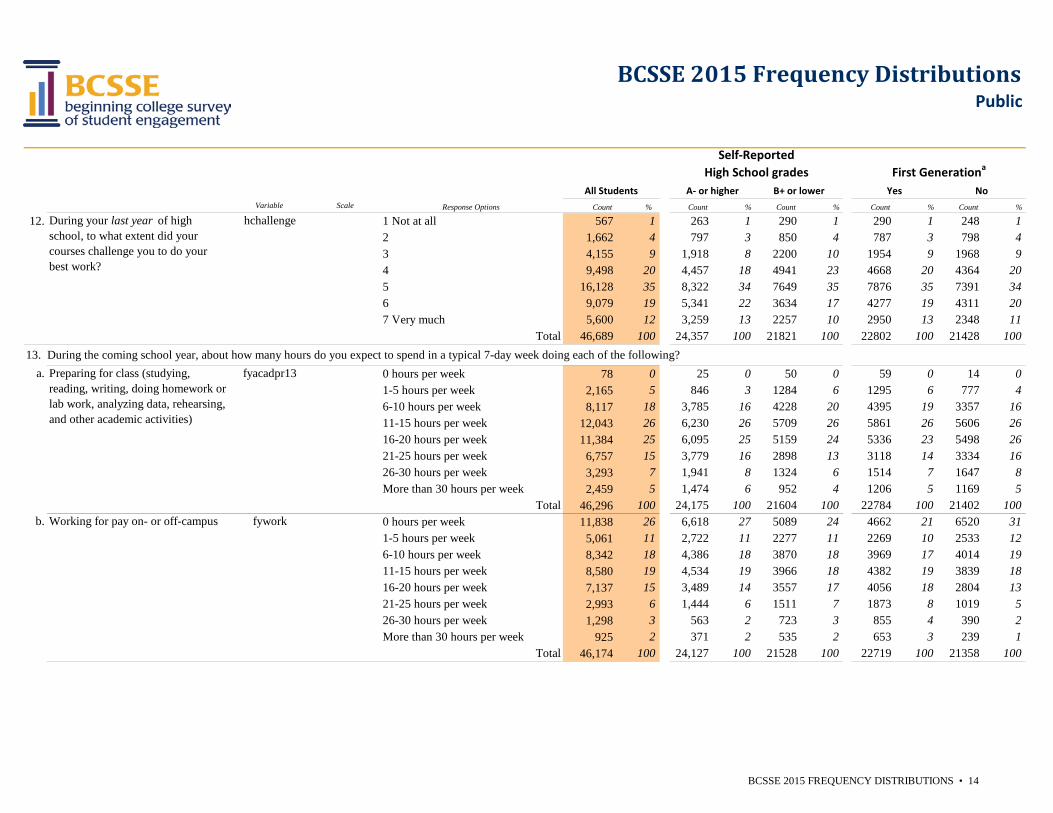
12. 1 Not at all 567 1 263 1 290 1 290 1 248 12 1,662 4 797 3 850 4 787 3 798 43 4,155 9 1,918 8 2200 10 1954 9 1968 94 9,498 20 4,457 18 4941 23 4668 20 4364 205 16,128 35 8,322 34 7649 35 7876 35 7391 346 9,079 19 5,341 22 3634 17 4277 19 4311 207 Very much 5,600 12 3,259 13 2257 10 2950 13 2348 11
Total 46,689 100 24,357 100 21821 100 22802 100 21428 10013. During the coming school year, about how many hours do you expect to spend in a typical 7-day week doing each of the following?
a. 0 hours per week 78 0 25 0 50 0 59 0 14 01-5 hours per week 2,165 5 846 3 1284 6 1295 6 777 46-10 hours per week 8,117 18 3,785 16 4228 20 4395 19 3357 1611-15 hours per week 12,043 26 6,230 26 5709 26 5861 26 5606 2616-20 hours per week 11,384 25 6,095 25 5159 24 5336 23 5498 2621-25 hours per week 6,757 15 3,779 16 2898 13 3118 14 3334 1626-30 hours per week 3,293 7 1,941 8 1324 6 1514 7 1647 8More than 30 hours per week 2,459 5 1,474 6 952 4 1206 5 1169 5
Total 46,296 100 24,175 100 21604 100 22784 100 21402 100b. 0 hours per week 11,838 26 6,618 27 5089 24 4662 21 6520 31
1-5 hours per week 5,061 11 2,722 11 2277 11 2269 10 2533 126-10 hours per week 8,342 18 4,386 18 3870 18 3969 17 4014 1911-15 hours per week 8,580 19 4,534 19 3966 18 4382 19 3839 1816-20 hours per week 7,137 15 3,489 14 3557 17 4056 18 2804 1321-25 hours per week 2,993 6 1,444 6 1511 7 1873 8 1019 526-30 hours per week 1,298 3 563 2 723 3 855 4 390 2More than 30 hours per week 925 2 371 2 535 2 653 3 239 1
Total 46,174 100 24,127 100 21528 100 22719 100 21358 100
Preparing for class (studying, reading, writing, doing homework or lab work, analyzing data, rehearsing, and other academic activities)
fyacadpr13
Working for pay on- or off-campus fywork
During your last year of high school, to what extent did your courses challenge you to do your best work?
hchallenge
BCSSE 2015 FREQUENCY DISTRIBUTIONS • 15
Variable Scale Response Options Count % Count % Count % Count % Count %
BCSSE 2015 Frequency Distributions
Self-ReportedHigh School grades First Generationa
Public
Yes NoB+ or lowerAll Students A- or higher
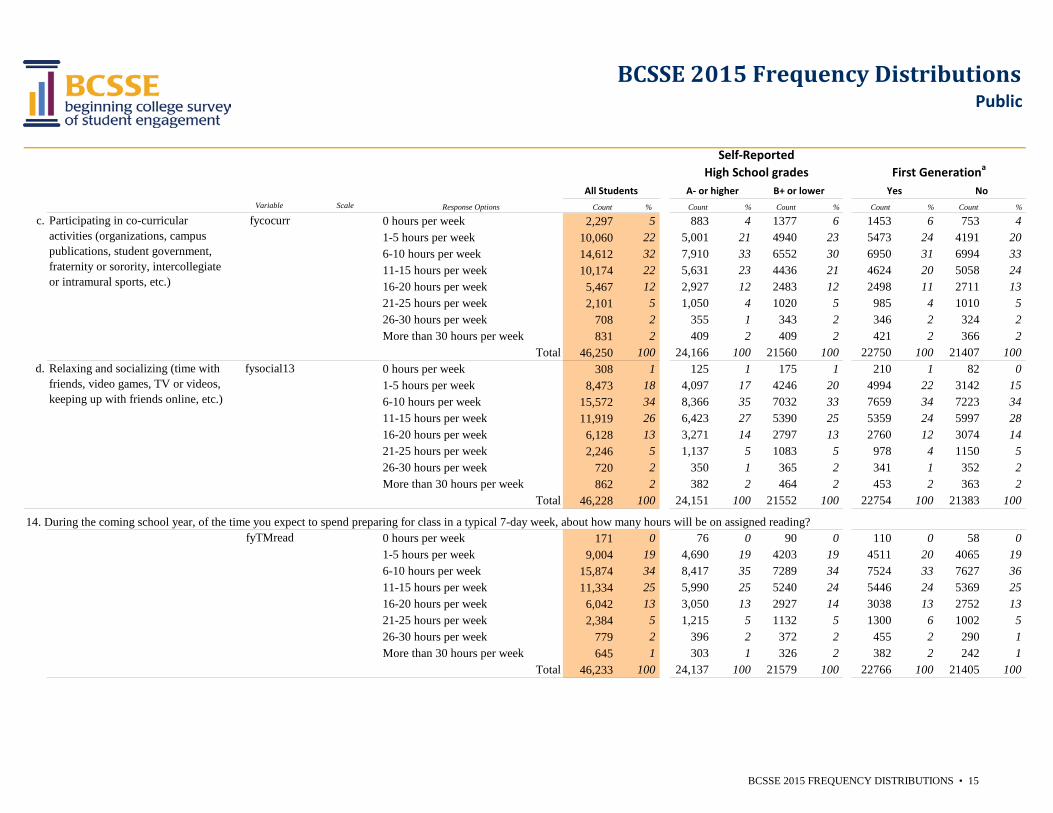
c. 0 hours per week 2,297 5 883 4 1377 6 1453 6 753 41-5 hours per week 10,060 22 5,001 21 4940 23 5473 24 4191 206-10 hours per week 14,612 32 7,910 33 6552 30 6950 31 6994 3311-15 hours per week 10,174 22 5,631 23 4436 21 4624 20 5058 2416-20 hours per week 5,467 12 2,927 12 2483 12 2498 11 2711 1321-25 hours per week 2,101 5 1,050 4 1020 5 985 4 1010 526-30 hours per week 708 2 355 1 343 2 346 2 324 2More than 30 hours per week 831 2 409 2 409 2 421 2 366 2
Total 46,250 100 24,166 100 21560 100 22750 100 21407 100d. 0 hours per week 308 1 125 1 175 1 210 1 82 0
1-5 hours per week 8,473 18 4,097 17 4246 20 4994 22 3142 156-10 hours per week 15,572 34 8,366 35 7032 33 7659 34 7223 3411-15 hours per week 11,919 26 6,423 27 5390 25 5359 24 5997 2816-20 hours per week 6,128 13 3,271 14 2797 13 2760 12 3074 1421-25 hours per week 2,246 5 1,137 5 1083 5 978 4 1150 526-30 hours per week 720 2 350 1 365 2 341 1 352 2More than 30 hours per week 862 2 382 2 464 2 453 2 363 2
Total 46,228 100 24,151 100 21552 100 22754 100 21383 100
14. During the coming school year, of the time you expect to spend preparing for class in a typical 7-day week, about how many hours will be on assigned reading?0 hours per week 171 0 76 0 90 0 110 0 58 01-5 hours per week 9,004 19 4,690 19 4203 19 4511 20 4065 196-10 hours per week 15,874 34 8,417 35 7289 34 7524 33 7627 3611-15 hours per week 11,334 25 5,990 25 5240 24 5446 24 5369 2516-20 hours per week 6,042 13 3,050 13 2927 14 3038 13 2752 1321-25 hours per week 2,384 5 1,215 5 1132 5 1300 6 1002 526-30 hours per week 779 2 396 2 372 2 455 2 290 1More than 30 hours per week 645 1 303 1 326 2 382 2 242 1
Total 46,233 100 24,137 100 21579 100 22766 100 21405 100
Participating in co-curricular activities (organizations, campus publications, student government, fraternity or sorority, intercollegiate or intramural sports, etc.)
fycocurr
Relaxing and socializing (time with friends, video games, TV or videos, keeping up with friends online, etc.)
fysocial13
fyTMread
BCSSE 2015 FREQUENCY DISTRIBUTIONS • 16
Variable Scale Response Options Count % Count % Count % Count % Count %
BCSSE 2015 Frequency Distributions
Self-ReportedHigh School grades First Generationa
Public
Yes NoB+ or lowerAll Students A- or higher
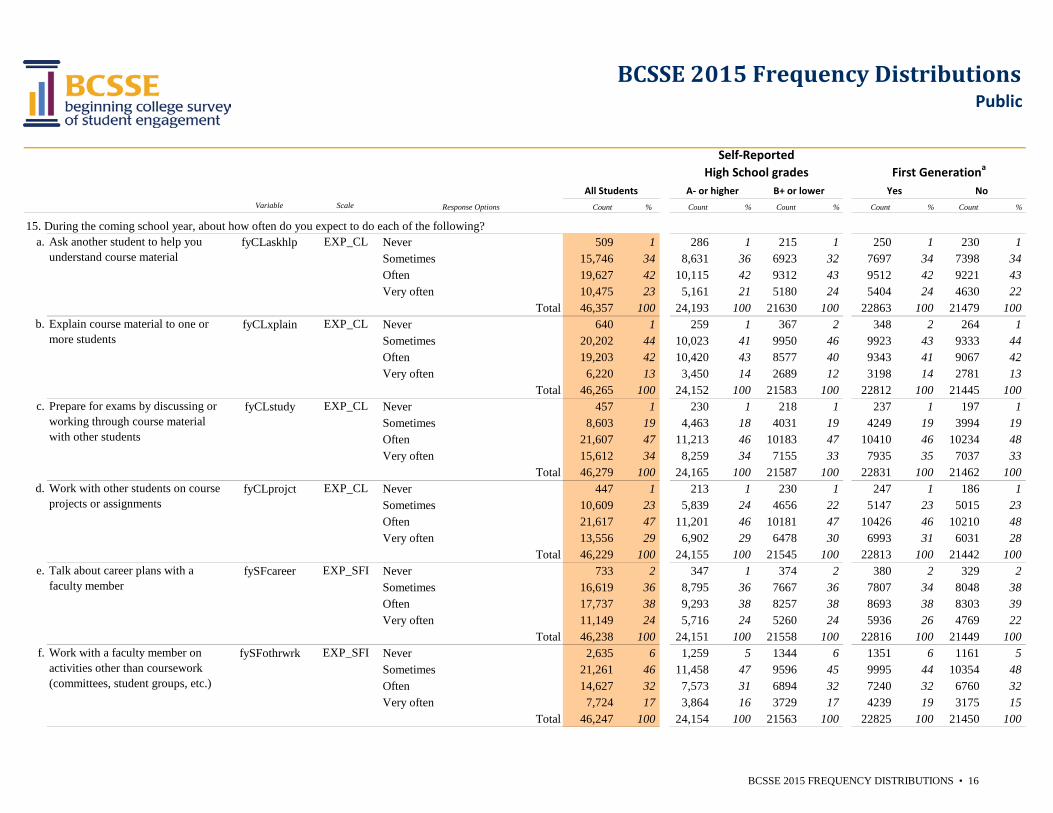
15. During the coming school year, about how often do you expect to do each of the following?a. fyCLaskhlp EXP_CL Never 509 1 286 1 215 1 250 1 230 1
Sometimes 15,746 34 8,631 36 6923 32 7697 34 7398 34Often 19,627 42 10,115 42 9312 43 9512 42 9221 43Very often 10,475 23 5,161 21 5180 24 5404 24 4630 22
Total 46,357 100 24,193 100 21630 100 22863 100 21479 100b. fyCLxplain EXP_CL Never 640 1 259 1 367 2 348 2 264 1
Sometimes 20,202 44 10,023 41 9950 46 9923 43 9333 44Often 19,203 42 10,420 43 8577 40 9343 41 9067 42Very often 6,220 13 3,450 14 2689 12 3198 14 2781 13
Total 46,265 100 24,152 100 21583 100 22812 100 21445 100c. fyCLstudy EXP_CL Never 457 1 230 1 218 1 237 1 197 1
Sometimes 8,603 19 4,463 18 4031 19 4249 19 3994 19Often 21,607 47 11,213 46 10183 47 10410 46 10234 48Very often 15,612 34 8,259 34 7155 33 7935 35 7037 33
Total 46,279 100 24,165 100 21587 100 22831 100 21462 100d. fyCLprojct EXP_CL Never 447 1 213 1 230 1 247 1 186 1
Sometimes 10,609 23 5,839 24 4656 22 5147 23 5015 23Often 21,617 47 11,201 46 10181 47 10426 46 10210 48Very often 13,556 29 6,902 29 6478 30 6993 31 6031 28
Total 46,229 100 24,155 100 21545 100 22813 100 21442 100e. fySFcareer EXP_SFI Never 733 2 347 1 374 2 380 2 329 2
Sometimes 16,619 36 8,795 36 7667 36 7807 34 8048 38Often 17,737 38 9,293 38 8257 38 8693 38 8303 39Very often 11,149 24 5,716 24 5260 24 5936 26 4769 22
Total 46,238 100 24,151 100 21558 100 22816 100 21449 100f. fySFothrwrk EXP_SFI Never 2,635 6 1,259 5 1344 6 1351 6 1161 5
Sometimes 21,261 46 11,458 47 9596 45 9995 44 10354 48Often 14,627 32 7,573 31 6894 32 7240 32 6760 32Very often 7,724 17 3,864 16 3729 17 4239 19 3175 15
Total 46,247 100 24,154 100 21563 100 22825 100 21450 100
Explain course material to one or more students
Ask another student to help you understand course material
Prepare for exams by discussing or working through course material with other students
Work with a faculty member on activities other than coursework (committees, student groups, etc.)
Work with other students on course projects or assignments
Talk about career plans with a faculty member
BCSSE 2015 FREQUENCY DISTRIBUTIONS • 17
Variable Scale Response Options Count % Count % Count % Count % Count %
BCSSE 2015 Frequency Distributions
Self-ReportedHigh School grades First Generationa
Public
Yes NoB+ or lowerAll Students A- or higher
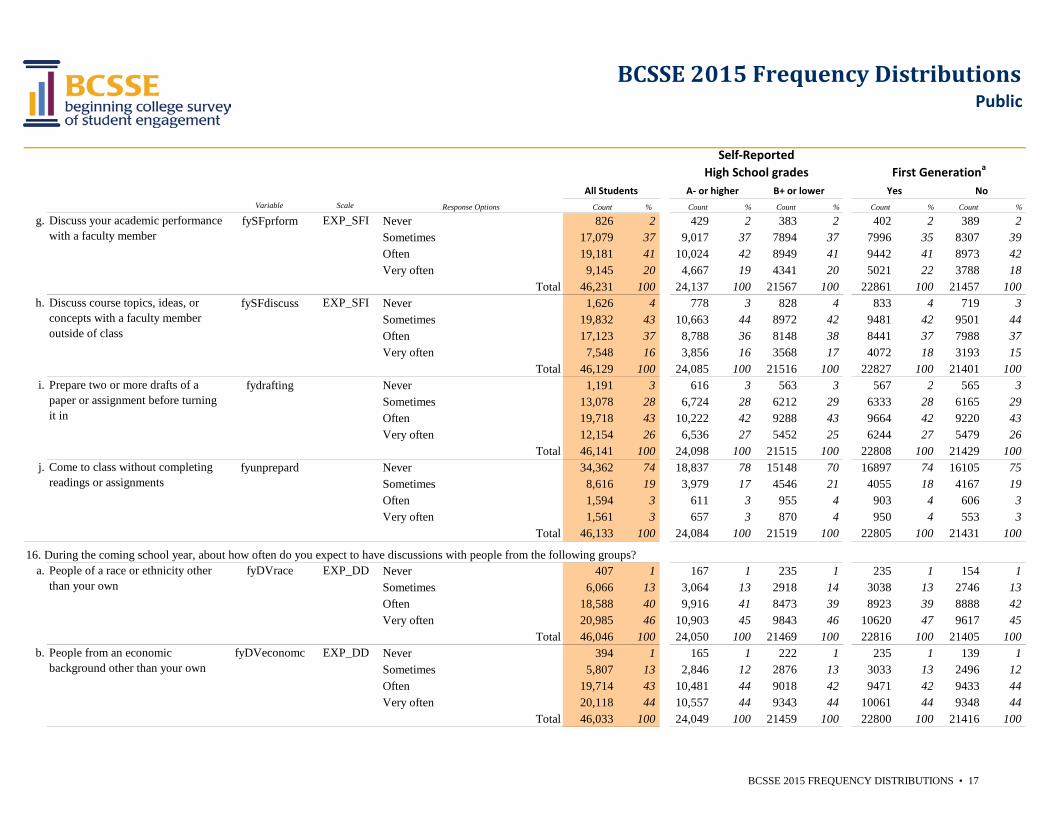
g. fySFprform EXP_SFI Never 826 2 429 2 383 2 402 2 389 2Sometimes 17,079 37 9,017 37 7894 37 7996 35 8307 39Often 19,181 41 10,024 42 8949 41 9442 41 8973 42Very often 9,145 20 4,667 19 4341 20 5021 22 3788 18
Total 46,231 100 24,137 100 21567 100 22861 100 21457 100h. fySFdiscuss EXP_SFI Never 1,626 4 778 3 828 4 833 4 719 3
Sometimes 19,832 43 10,663 44 8972 42 9481 42 9501 44Often 17,123 37 8,788 36 8148 38 8441 37 7988 37Very often 7,548 16 3,856 16 3568 17 4072 18 3193 15
Total 46,129 100 24,085 100 21516 100 22827 100 21401 100i. fydrafting Never 1,191 3 616 3 563 3 567 2 565 3
Sometimes 13,078 28 6,724 28 6212 29 6333 28 6165 29Often 19,718 43 10,222 42 9288 43 9664 42 9220 43Very often 12,154 26 6,536 27 5452 25 6244 27 5479 26
Total 46,141 100 24,098 100 21515 100 22808 100 21429 100j. fyunprepard Never 34,362 74 18,837 78 15148 70 16897 74 16105 75
Sometimes 8,616 19 3,979 17 4546 21 4055 18 4167 19Often 1,594 3 611 3 955 4 903 4 606 3Very often 1,561 3 657 3 870 4 950 4 553 3
Total 46,133 100 24,084 100 21519 100 22805 100 21431 100
16. During the coming school year, about how often do you expect to have discussions with people from the following groups?a. EXP_DD Never 407 1 167 1 235 1 235 1 154 1
Sometimes 6,066 13 3,064 13 2918 14 3038 13 2746 13Often 18,588 40 9,916 41 8473 39 8923 39 8888 42Very often 20,985 46 10,903 45 9843 46 10620 47 9617 45
Total 46,046 100 24,050 100 21469 100 22816 100 21405 100b. EXP_DD Never 394 1 165 1 222 1 235 1 139 1
Sometimes 5,807 13 2,846 12 2876 13 3033 13 2496 12Often 19,714 43 10,481 44 9018 42 9471 42 9433 44Very often 20,118 44 10,557 44 9343 44 10061 44 9348 44
Total 46,033 100 24,049 100 21459 100 22800 100 21416 100
Discuss course topics, ideas, or concepts with a faculty member outside of class
Discuss your academic performance with a faculty member
People of a race or ethnicity other than your own
fyDVrace
People from an economic background other than your own
fyDVeconomc
Prepare two or more drafts of a paper or assignment before turning it in
Come to class without completing readings or assignments
BCSSE 2015 FREQUENCY DISTRIBUTIONS • 18
Variable Scale Response Options Count % Count % Count % Count % Count %
BCSSE 2015 Frequency Distributions
Self-ReportedHigh School grades First Generationa
Public
Yes NoB+ or lowerAll Students A- or higher
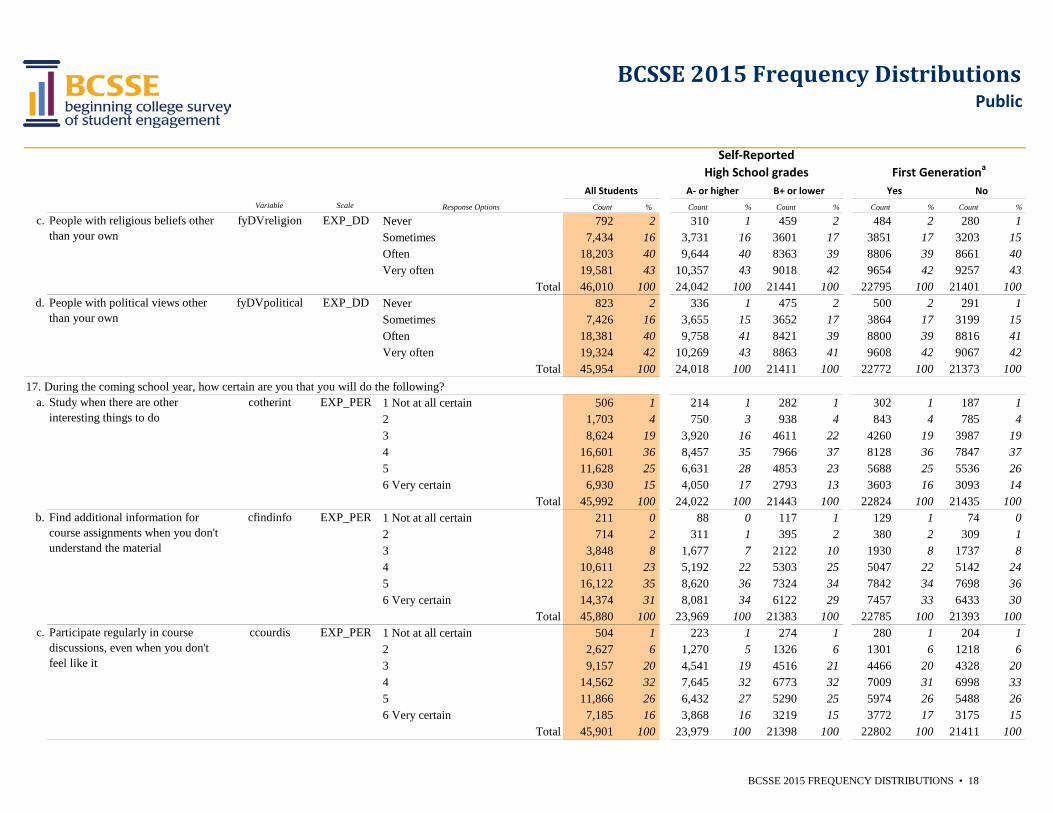
c. EXP_DD Never 792 2 310 1 459 2 484 2 280 1Sometimes 7,434 16 3,731 16 3601 17 3851 17 3203 15Often 18,203 40 9,644 40 8363 39 8806 39 8661 40Very often 19,581 43 10,357 43 9018 42 9654 42 9257 43
Total 46,010 100 24,042 100 21441 100 22795 100 21401 100d. EXP_DD Never 823 2 336 1 475 2 500 2 291 1
Sometimes 7,426 16 3,655 15 3652 17 3864 17 3199 15Often 18,381 40 9,758 41 8421 39 8800 39 8816 41Very often 19,324 42 10,269 43 8863 41 9608 42 9067 42
Total 45,954 100 24,018 100 21411 100 22772 100 21373 10017. During the coming school year, how certain are you that you will do the following?
a. EXP_PER 1 Not at all certain 506 1 214 1 282 1 302 1 187 12 1,703 4 750 3 938 4 843 4 785 43 8,624 19 3,920 16 4611 22 4260 19 3987 194 16,601 36 8,457 35 7966 37 8128 36 7847 375 11,628 25 6,631 28 4853 23 5688 25 5536 266 Very certain 6,930 15 4,050 17 2793 13 3603 16 3093 14
Total 45,992 100 24,022 100 21443 100 22824 100 21435 100b. EXP_PER 1 Not at all certain 211 0 88 0 117 1 129 1 74 0
2 714 2 311 1 395 2 380 2 309 13 3,848 8 1,677 7 2122 10 1930 8 1737 84 10,611 23 5,192 22 5303 25 5047 22 5142 245 16,122 35 8,620 36 7324 34 7842 34 7698 366 Very certain 14,374 31 8,081 34 6122 29 7457 33 6433 30
Total 45,880 100 23,969 100 21383 100 22785 100 21393 100c. EXP_PER 1 Not at all certain 504 1 223 1 274 1 280 1 204 1
2 2,627 6 1,270 5 1326 6 1301 6 1218 63 9,157 20 4,541 19 4516 21 4466 20 4328 204 14,562 32 7,645 32 6773 32 7009 31 6998 335 11,866 26 6,432 27 5290 25 5974 26 5488 266 Very certain 7,185 16 3,868 16 3219 15 3772 17 3175 15
Total 45,901 100 23,979 100 21398 100 22802 100 21411 100
People with religious beliefs other than your own
fyDVreligion
People with political views other than your own
fyDVpolitical
Find additional information for course assignments when you don't understand the material
cfindinfo
Study when there are other interesting things to do
cotherint
Participate regularly in course discussions, even when you don't feel like it
ccourdis
BCSSE 2015 FREQUENCY DISTRIBUTIONS • 19
Variable Scale Response Options Count % Count % Count % Count % Count %
BCSSE 2015 Frequency Distributions
Self-ReportedHigh School grades First Generationa
Public
Yes NoB+ or lowerAll Students A- or higher
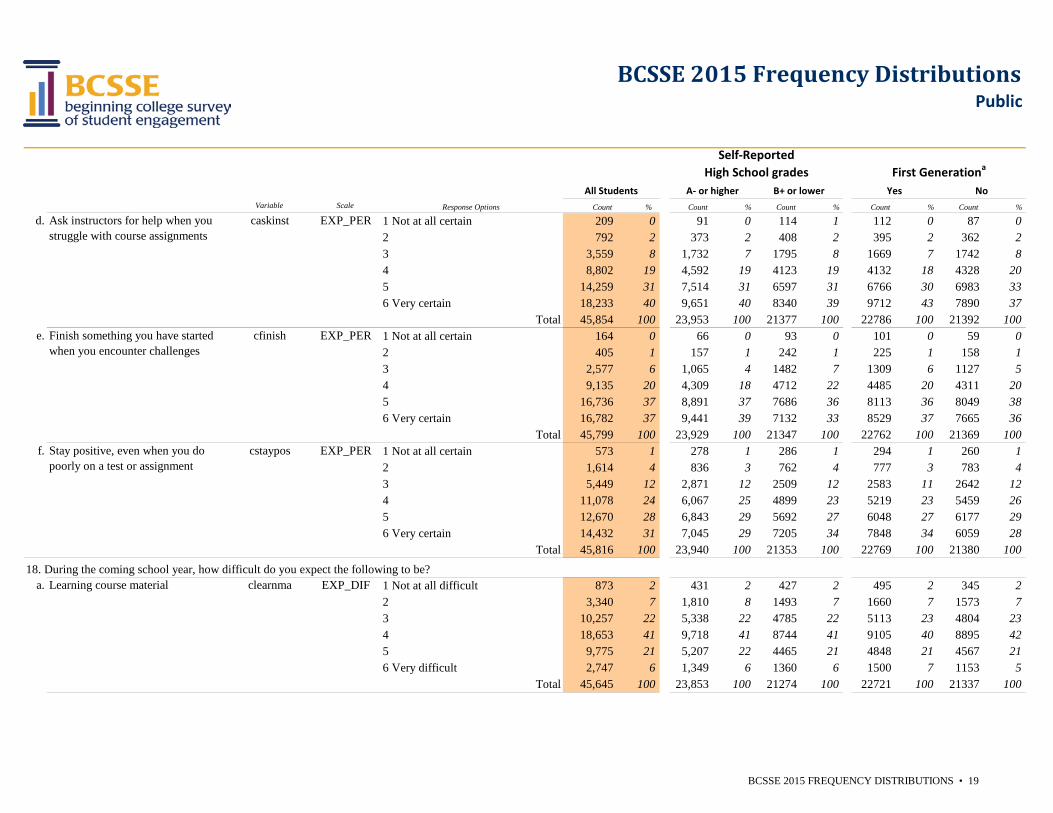
d. EXP_PER 1 Not at all certain 209 0 91 0 114 1 112 0 87 02 792 2 373 2 408 2 395 2 362 23 3,559 8 1,732 7 1795 8 1669 7 1742 84 8,802 19 4,592 19 4123 19 4132 18 4328 205 14,259 31 7,514 31 6597 31 6766 30 6983 336 Very certain 18,233 40 9,651 40 8340 39 9712 43 7890 37
Total 45,854 100 23,953 100 21377 100 22786 100 21392 100e. EXP_PER 1 Not at all certain 164 0 66 0 93 0 101 0 59 0
2 405 1 157 1 242 1 225 1 158 13 2,577 6 1,065 4 1482 7 1309 6 1127 54 9,135 20 4,309 18 4712 22 4485 20 4311 205 16,736 37 8,891 37 7686 36 8113 36 8049 386 Very certain 16,782 37 9,441 39 7132 33 8529 37 7665 36
Total 45,799 100 23,929 100 21347 100 22762 100 21369 100f. EXP_PER 1 Not at all certain 573 1 278 1 286 1 294 1 260 1
2 1,614 4 836 3 762 4 777 3 783 43 5,449 12 2,871 12 2509 12 2583 11 2642 124 11,078 24 6,067 25 4899 23 5219 23 5459 265 12,670 28 6,843 29 5692 27 6048 27 6177 296 Very certain 14,432 31 7,045 29 7205 34 7848 34 6059 28
Total 45,816 100 23,940 100 21353 100 22769 100 21380 10018. During the coming school year, how difficult do you expect the following to be?
a. EXP_DIF 1 Not at all difficult 873 2 431 2 427 2 495 2 345 22 3,340 7 1,810 8 1493 7 1660 7 1573 73 10,257 22 5,338 22 4785 22 5113 23 4804 234 18,653 41 9,718 41 8744 41 9105 40 8895 425 9,775 21 5,207 22 4465 21 4848 21 4567 216 Very difficult 2,747 6 1,349 6 1360 6 1500 7 1153 5
Total 45,645 100 23,853 100 21274 100 22721 100 21337 100
Stay positive, even when you do poorly on a test or assignment
cstaypos
Ask instructors for help when you struggle with course assignments
caskinst
Finish something you have started when you encounter challenges
cfinish
Learning course material clearnma
BCSSE 2015 FREQUENCY DISTRIBUTIONS • 20
Variable Scale Response Options Count % Count % Count % Count % Count %
BCSSE 2015 Frequency Distributions
Self-ReportedHigh School grades First Generationa
Public
Yes NoB+ or lowerAll Students A- or higher
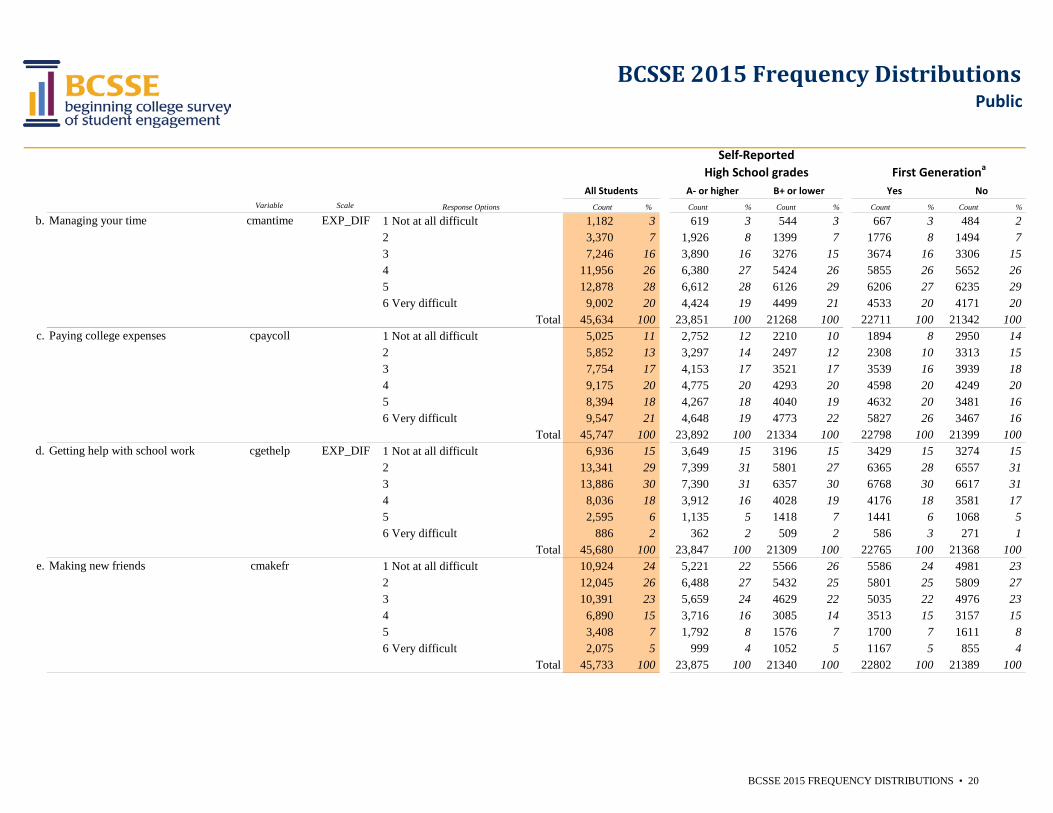
b. EXP_DIF 1 Not at all difficult 1,182 3 619 3 544 3 667 3 484 22 3,370 7 1,926 8 1399 7 1776 8 1494 73 7,246 16 3,890 16 3276 15 3674 16 3306 154 11,956 26 6,380 27 5424 26 5855 26 5652 265 12,878 28 6,612 28 6126 29 6206 27 6235 296 Very difficult 9,002 20 4,424 19 4499 21 4533 20 4171 20
Total 45,634 100 23,851 100 21268 100 22711 100 21342 100c. 1 Not at all difficult 5,025 11 2,752 12 2210 10 1894 8 2950 14
2 5,852 13 3,297 14 2497 12 2308 10 3313 153 7,754 17 4,153 17 3521 17 3539 16 3939 184 9,175 20 4,775 20 4293 20 4598 20 4249 205 8,394 18 4,267 18 4040 19 4632 20 3481 166 Very difficult 9,547 21 4,648 19 4773 22 5827 26 3467 16
Total 45,747 100 23,892 100 21334 100 22798 100 21399 100d. EXP_DIF 1 Not at all difficult 6,936 15 3,649 15 3196 15 3429 15 3274 15
2 13,341 29 7,399 31 5801 27 6365 28 6557 313 13,886 30 7,390 31 6357 30 6768 30 6617 314 8,036 18 3,912 16 4028 19 4176 18 3581 175 2,595 6 1,135 5 1418 7 1441 6 1068 56 Very difficult 886 2 362 2 509 2 586 3 271 1
Total 45,680 100 23,847 100 21309 100 22765 100 21368 100e. 1 Not at all difficult 10,924 24 5,221 22 5566 26 5586 24 4981 23
2 12,045 26 6,488 27 5432 25 5801 25 5809 273 10,391 23 5,659 24 4629 22 5035 22 4976 234 6,890 15 3,716 16 3085 14 3513 15 3157 155 3,408 7 1,792 8 1576 7 1700 7 1611 86 Very difficult 2,075 5 999 4 1052 5 1167 5 855 4
Total 45,733 100 23,875 100 21340 100 22802 100 21389 100
Getting help with school work cgethelp
Paying college expenses cpaycoll
Managing your time cmantime
Making new friends cmakefr
BCSSE 2015 FREQUENCY DISTRIBUTIONS • 21
Variable Scale Response Options Count % Count % Count % Count % Count %
BCSSE 2015 Frequency Distributions
Self-ReportedHigh School grades First Generationa
Public
Yes NoB+ or lowerAll Students A- or higher
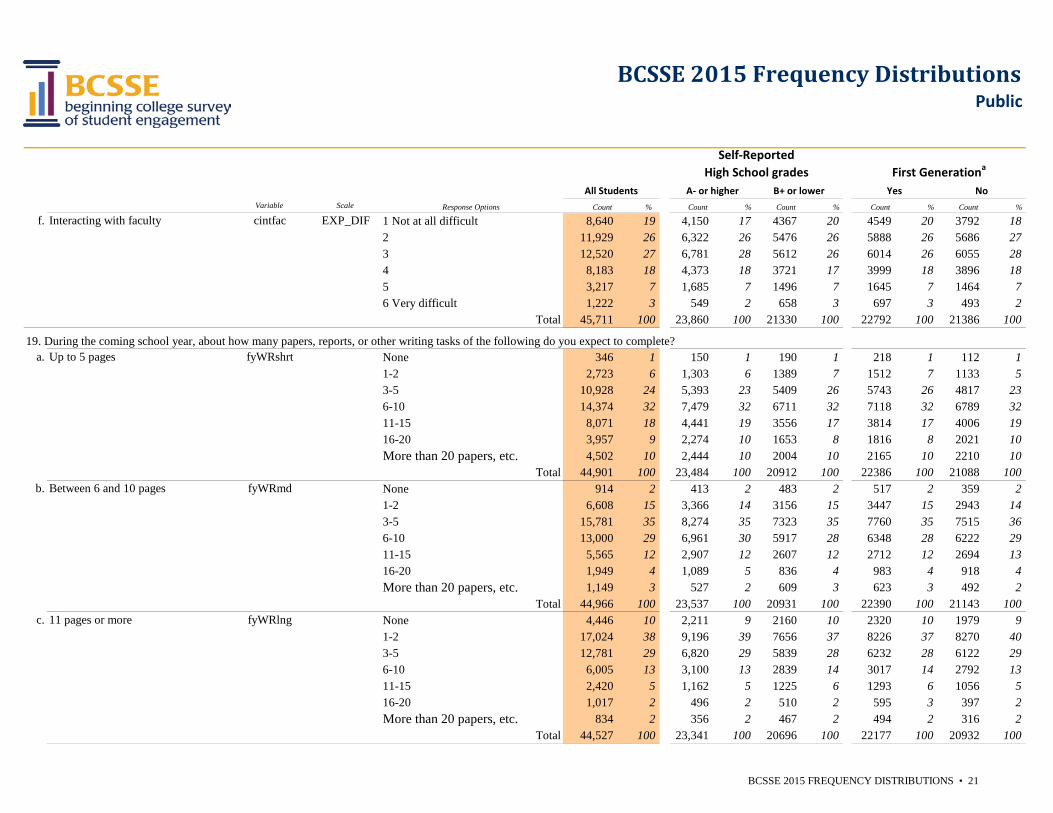
f. EXP_DIF 1 Not at all difficult 8,640 19 4,150 17 4367 20 4549 20 3792 182 11,929 26 6,322 26 5476 26 5888 26 5686 273 12,520 27 6,781 28 5612 26 6014 26 6055 284 8,183 18 4,373 18 3721 17 3999 18 3896 185 3,217 7 1,685 7 1496 7 1645 7 1464 76 Very difficult 1,222 3 549 2 658 3 697 3 493 2
Total 45,711 100 23,860 100 21330 100 22792 100 21386 100
19. During the coming school year, about how many papers, reports, or other writing tasks of the following do you expect to complete?a. None 346 1 150 1 190 1 218 1 112 1
1-2 2,723 6 1,303 6 1389 7 1512 7 1133 53-5 10,928 24 5,393 23 5409 26 5743 26 4817 236-10 14,374 32 7,479 32 6711 32 7118 32 6789 3211-15 8,071 18 4,441 19 3556 17 3814 17 4006 1916-20 3,957 9 2,274 10 1653 8 1816 8 2021 10More than 20 papers, etc. 4,502 10 2,444 10 2004 10 2165 10 2210 10
Total 44,901 100 23,484 100 20912 100 22386 100 21088 100b. None 914 2 413 2 483 2 517 2 359 2
1-2 6,608 15 3,366 14 3156 15 3447 15 2943 143-5 15,781 35 8,274 35 7323 35 7760 35 7515 366-10 13,000 29 6,961 30 5917 28 6348 28 6222 2911-15 5,565 12 2,907 12 2607 12 2712 12 2694 1316-20 1,949 4 1,089 5 836 4 983 4 918 4More than 20 papers, etc. 1,149 3 527 2 609 3 623 3 492 2
Total 44,966 100 23,537 100 20931 100 22390 100 21143 100c. None 4,446 10 2,211 9 2160 10 2320 10 1979 9
1-2 17,024 38 9,196 39 7656 37 8226 37 8270 403-5 12,781 29 6,820 29 5839 28 6232 28 6122 296-10 6,005 13 3,100 13 2839 14 3017 14 2792 1311-15 2,420 5 1,162 5 1225 6 1293 6 1056 516-20 1,017 2 496 2 510 2 595 3 397 2More than 20 papers, etc. 834 2 356 2 467 2 494 2 316 2
Total 44,527 100 23,341 100 20696 100 22177 100 20932 100
fyWRmd
Interacting with faculty cintfac
11 pages or more fyWRlng
Up to 5 pages fyWRshrt
Between 6 and 10 pages
BCSSE 2015 FREQUENCY DISTRIBUTIONS • 22
Variable Scale Response Options Count % Count % Count % Count % Count %
BCSSE 2015 Frequency Distributions
Self-ReportedHigh School grades First Generationa
Public
Yes NoB+ or lowerAll Students A- or higher
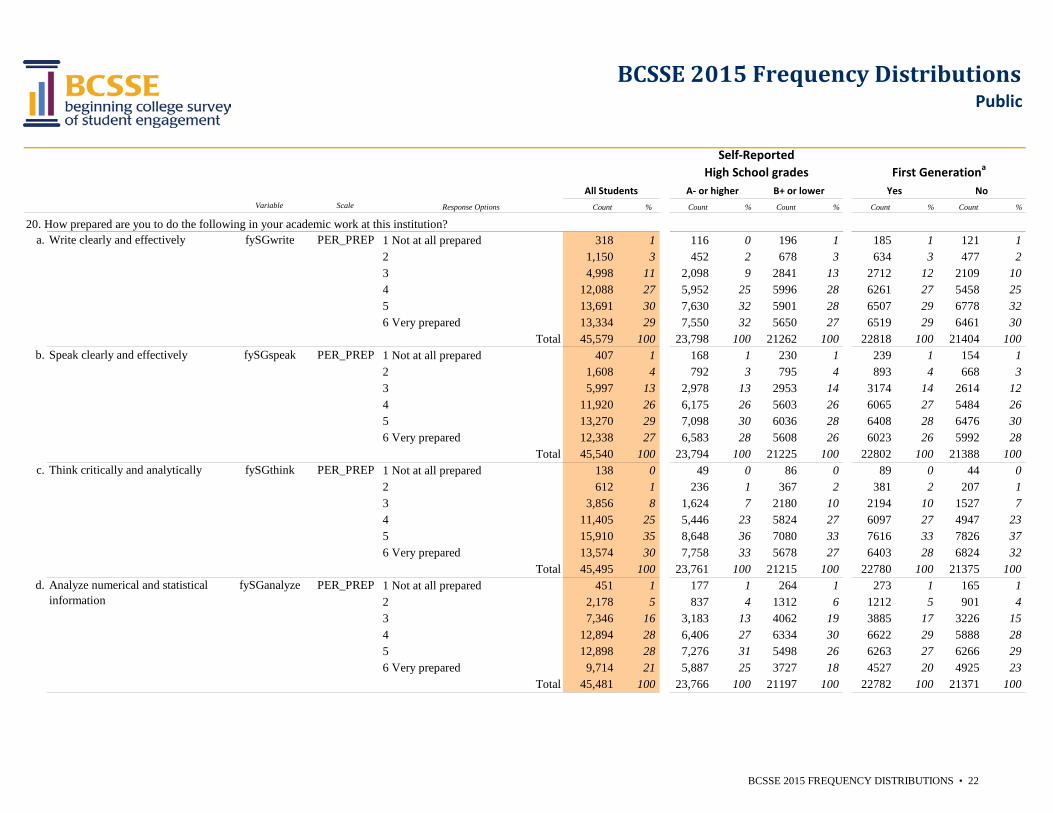
20. How prepared are you to do the following in your academic work at this institution?a. PER_PREP 1 Not at all prepared 318 1 116 0 196 1 185 1 121 1
2 1,150 3 452 2 678 3 634 3 477 23 4,998 11 2,098 9 2841 13 2712 12 2109 104 12,088 27 5,952 25 5996 28 6261 27 5458 255 13,691 30 7,630 32 5901 28 6507 29 6778 326 Very prepared 13,334 29 7,550 32 5650 27 6519 29 6461 30
Total 45,579 100 23,798 100 21262 100 22818 100 21404 100b. PER_PREP 1 Not at all prepared 407 1 168 1 230 1 239 1 154 1
2 1,608 4 792 3 795 4 893 4 668 33 5,997 13 2,978 13 2953 14 3174 14 2614 124 11,920 26 6,175 26 5603 26 6065 27 5484 265 13,270 29 7,098 30 6036 28 6408 28 6476 306 Very prepared 12,338 27 6,583 28 5608 26 6023 26 5992 28
Total 45,540 100 23,794 100 21225 100 22802 100 21388 100c. PER_PREP 1 Not at all prepared 138 0 49 0 86 0 89 0 44 0
2 612 1 236 1 367 2 381 2 207 13 3,856 8 1,624 7 2180 10 2194 10 1527 74 11,405 25 5,446 23 5824 27 6097 27 4947 235 15,910 35 8,648 36 7080 33 7616 33 7826 376 Very prepared 13,574 30 7,758 33 5678 27 6403 28 6824 32
Total 45,495 100 23,761 100 21215 100 22780 100 21375 100d. PER_PREP 1 Not at all prepared 451 1 177 1 264 1 273 1 165 1
2 2,178 5 837 4 1312 6 1212 5 901 43 7,346 16 3,183 13 4062 19 3885 17 3226 154 12,894 28 6,406 27 6334 30 6622 29 5888 285 12,898 28 7,276 31 5498 26 6263 27 6266 296 Very prepared 9,714 21 5,887 25 3727 18 4527 20 4925 23
Total 45,481 100 23,766 100 21197 100 22782 100 21371 100
Write clearly and effectively fySGwrite
Speak clearly and effectively fySGspeak
Think critically and analytically fySGthink
Analyze numerical and statistical information
fySGanalyze
BCSSE 2015 FREQUENCY DISTRIBUTIONS • 23
Variable Scale Response Options Count % Count % Count % Count % Count %
BCSSE 2015 Frequency Distributions
Self-ReportedHigh School grades First Generationa
Public
Yes NoB+ or lowerAll Students A- or higher
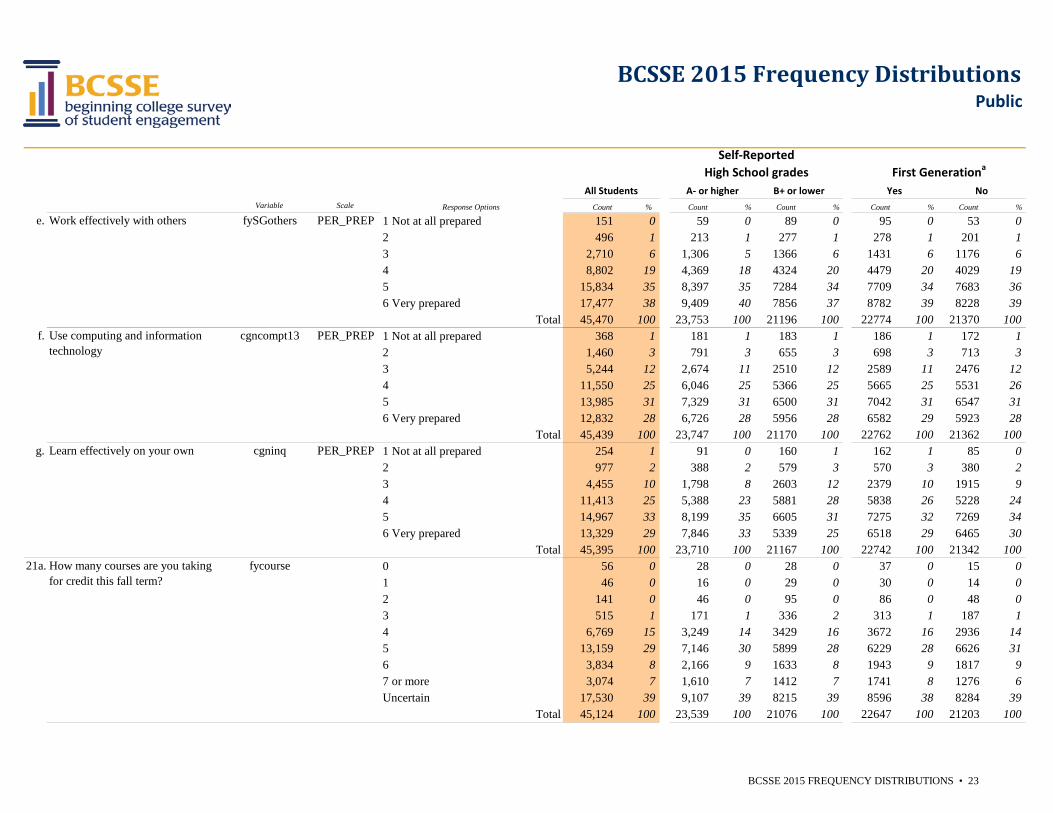
e. PER_PREP 1 Not at all prepared 151 0 59 0 89 0 95 0 53 02 496 1 213 1 277 1 278 1 201 13 2,710 6 1,306 5 1366 6 1431 6 1176 64 8,802 19 4,369 18 4324 20 4479 20 4029 195 15,834 35 8,397 35 7284 34 7709 34 7683 366 Very prepared 17,477 38 9,409 40 7856 37 8782 39 8228 39
Total 45,470 100 23,753 100 21196 100 22774 100 21370 100f. PER_PREP 1 Not at all prepared 368 1 181 1 183 1 186 1 172 1
2 1,460 3 791 3 655 3 698 3 713 33 5,244 12 2,674 11 2510 12 2589 11 2476 124 11,550 25 6,046 25 5366 25 5665 25 5531 265 13,985 31 7,329 31 6500 31 7042 31 6547 316 Very prepared 12,832 28 6,726 28 5956 28 6582 29 5923 28
Total 45,439 100 23,747 100 21170 100 22762 100 21362 100g. PER_PREP 1 Not at all prepared 254 1 91 0 160 1 162 1 85 0
2 977 2 388 2 579 3 570 3 380 23 4,455 10 1,798 8 2603 12 2379 10 1915 94 11,413 25 5,388 23 5881 28 5838 26 5228 245 14,967 33 8,199 35 6605 31 7275 32 7269 346 Very prepared 13,329 29 7,846 33 5339 25 6518 29 6465 30
Total 45,395 100 23,710 100 21167 100 22742 100 21342 10021a. 0 56 0 28 0 28 0 37 0 15 0
1 46 0 16 0 29 0 30 0 14 02 141 0 46 0 95 0 86 0 48 03 515 1 171 1 336 2 313 1 187 14 6,769 15 3,249 14 3429 16 3672 16 2936 145 13,159 29 7,146 30 5899 28 6229 28 6626 316 3,834 8 2,166 9 1633 8 1943 9 1817 97 or more 3,074 7 1,610 7 1412 7 1741 8 1276 6Uncertain 17,530 39 9,107 39 8215 39 8596 38 8284 39
Total 45,124 100 23,539 100 21076 100 22647 100 21203 100
Learn effectively on your own cgninq
Use computing and information technology
cgncompt13
fycourse
Work effectively with others fySGothers
How many courses are you taking for credit this fall term?
BCSSE 2015 FREQUENCY DISTRIBUTIONS • 24
Variable Scale Response Options Count % Count % Count % Count % Count %
BCSSE 2015 Frequency Distributions
Self-ReportedHigh School grades First Generationa
Public
Yes NoB+ or lowerAll Students A- or higher
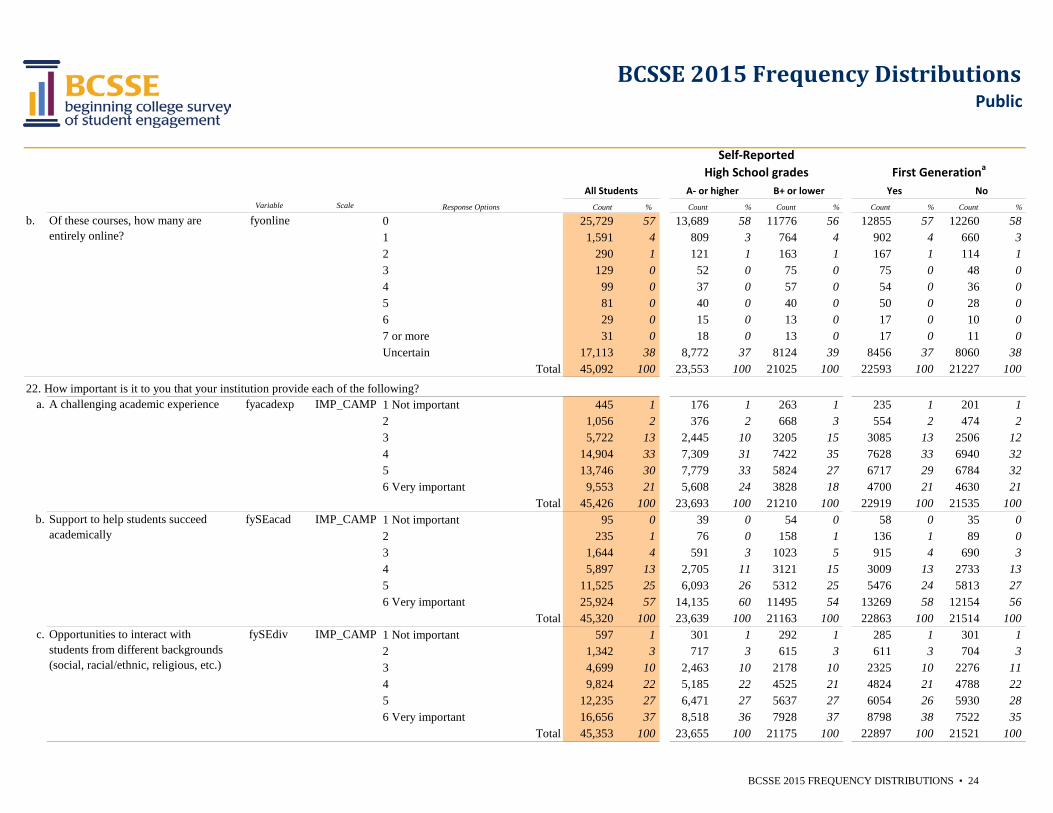
b. 0 25,729 57 13,689 58 11776 56 12855 57 12260 581 1,591 4 809 3 764 4 902 4 660 32 290 1 121 1 163 1 167 1 114 13 129 0 52 0 75 0 75 0 48 04 99 0 37 0 57 0 54 0 36 05 81 0 40 0 40 0 50 0 28 06 29 0 15 0 13 0 17 0 10 07 or more 31 0 18 0 13 0 17 0 11 0Uncertain 17,113 38 8,772 37 8124 39 8456 37 8060 38
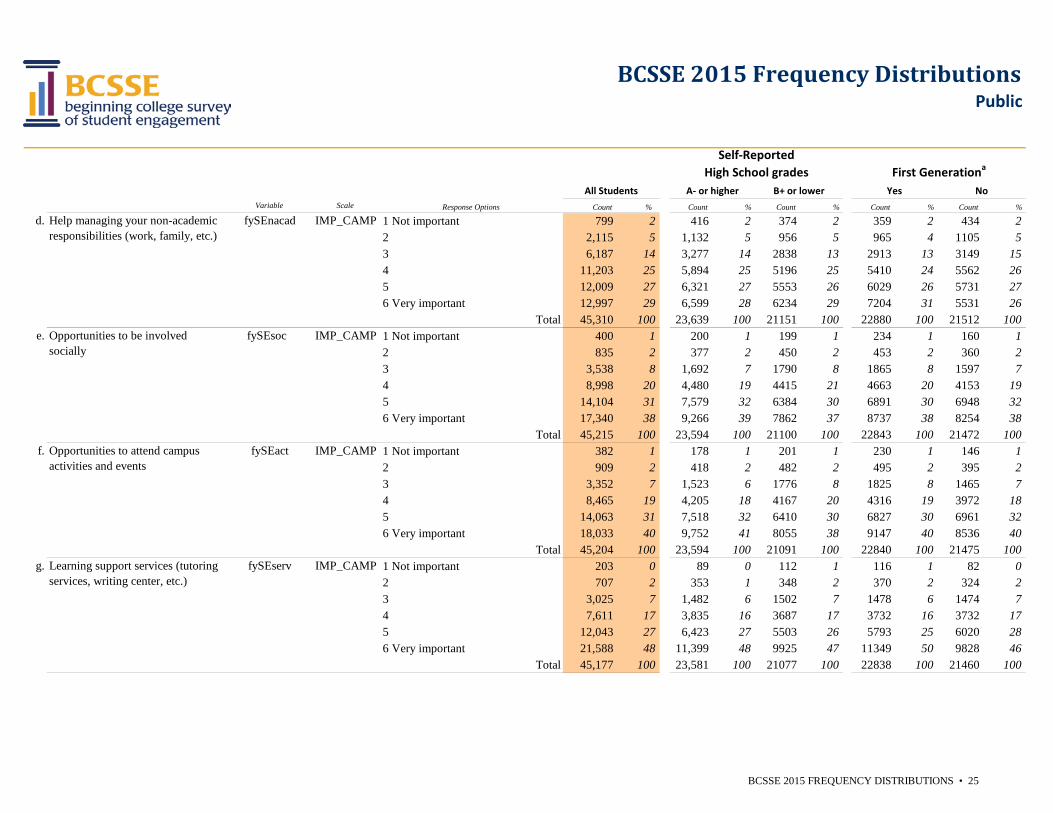
Total 45,092 100 23,553 100 21025 100 22593 100 21227 10022. How important is it to you that your institution provide each of the following?
a. IMP_CAMP 1 Not important 445 1 176 1 263 1 235 1 201 12 1,056 2 376 2 668 3 554 2 474 23 5,722 13 2,445 10 3205 15 3085 13 2506 124 14,904 33 7,309 31 7422 35 7628 33 6940 325 13,746 30 7,779 33 5824 27 6717 29 6784 326 Very important 9,553 21 5,608 24 3828 18 4700 21 4630 21
Total 45,426 100 23,693 100 21210 100 22919 100 21535 100b. IMP_CAMP 1 Not important 95 0 39 0 54 0 58 0 35 0
2 235 1 76 0 158 1 136 1 89 03 1,644 4 591 3 1023 5 915 4 690 34 5,897 13 2,705 11 3121 15 3009 13 2733 135 11,525 25 6,093 26 5312 25 5476 24 5813 276 Very important 25,924 57 14,135 60 11495 54 13269 58 12154 56
Total 45,320 100 23,639 100 21163 100 22863 100 21514 100c. IMP_CAMP 1 Not important 597 1 301 1 292 1 285 1 301 1
2 1,342 3 717 3 615 3 611 3 704 33 4,699 10 2,463 10 2178 10 2325 10 2276 114 9,824 22 5,185 22 4525 21 4824 21 4788 225 12,235 27 6,471 27 5637 27 6054 26 5930 286 Very important 16,656 37 8,518 36 7928 37 8798 38 7522 35
Total 45,353 100 23,655 100 21175 100 22897 100 21521 100
Support to help students succeed academically
fySEacad
fyacadexp
Of these courses, how many are entirely online?
fyonline
A challenging academic experience
Opportunities to interact with students from different backgrounds (social, racial/ethnic, religious, etc.)
fySEdiv
BCSSE 2015 FREQUENCY DISTRIBUTIONS • 25
Variable Scale Response Options Count % Count % Count % Count % Count %
BCSSE 2015 Frequency Distributions
Self-ReportedHigh School grades First Generationa
Public
Yes NoB+ or lowerAll Students A- or higher
d. IMP_CAMP 1 Not important 799 2 416 2 374 2 359 2 434 22 2,115 5 1,132 5 956 5 965 4 1105 53 6,187 14 3,277 14 2838 13 2913 13 3149 154 11,203 25 5,894 25 5196 25 5410 24 5562 265 12,009 27 6,321 27 5553 26 6029 26 5731 276 Very important 12,997 29 6,599 28 6234 29 7204 31 5531 26
Total 45,310 100 23,639 100 21151 100 22880 100 21512 100e. IMP_CAMP 1 Not important 400 1 200 1 199 1 234 1 160 1
2 835 2 377 2 450 2 453 2 360 23 3,538 8 1,692 7 1790 8 1865 8 1597 74 8,998 20 4,480 19 4415 21 4663 20 4153 195 14,104 31 7,579 32 6384 30 6891 30 6948 326 Very important 17,340 38 9,266 39 7862 37 8737 38 8254 38
Total 45,215 100 23,594 100 21100 100 22843 100 21472 100f. IMP_CAMP 1 Not important 382 1 178 1 201 1 230 1 146 1
2 909 2 418 2 482 2 495 2 395 23 3,352 7 1,523 6 1776 8 1825 8 1465 74 8,465 19 4,205 18 4167 20 4316 19 3972 185 14,063 31 7,518 32 6410 30 6827 30 6961 326 Very important 18,033 40 9,752 41 8055 38 9147 40 8536 40
Total 45,204 100 23,594 100 21091 100 22840 100 21475 100g. IMP_CAMP 1 Not important 203 0 89 0 112 1 116 1 82 0
2 707 2 353 1 348 2 370 2 324 23 3,025 7 1,482 6 1502 7 1478 6 1474 74 7,611 17 3,835 16 3687 17 3732 16 3732 175 12,043 27 6,423 27 5503 26 5793 25 6020 286 Very important 21,588 48 11,399 48 9925 47 11349 50 9828 46
Total 45,177 100 23,581 100 21077 100 22838 100 21460 100
Opportunities to attend campus activities and events
fySEact
Learning support services (tutoring services, writing center, etc.)
fySEserv
Help managing your non-academic responsibilities (work, family, etc.)
fySEnacad
Opportunities to be involved socially
fySEsoc
BCSSE 2015 FREQUENCY DISTRIBUTIONS • 26
Variable Scale Response Options Count % Count % Count % Count % Count %
BCSSE 2015 Frequency Distributions
Self-ReportedHigh School grades First Generationa
Public
Yes NoB+ or lowerAll Students A- or higher
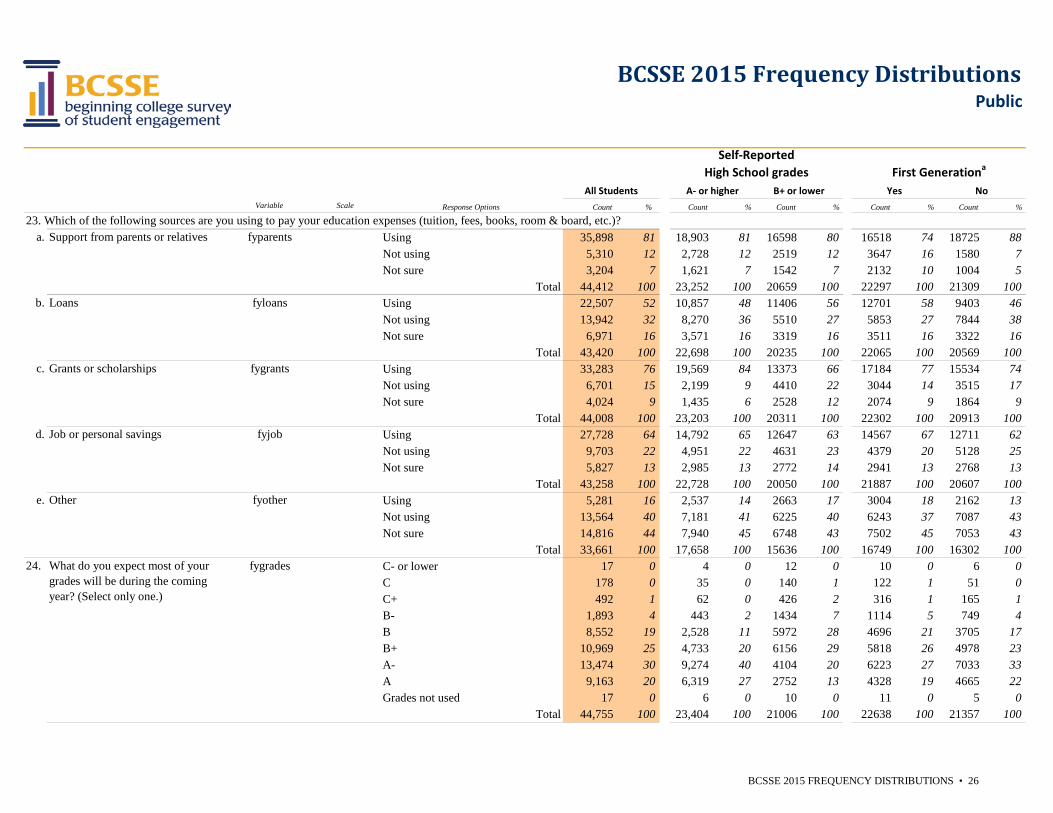
23. Which of the following sources are you using to pay your education expenses (tuition, fees, books, room & board, etc.)?a. Support from parents or relatives Using 35,898 81 18,903 81 16598 80 16518 74 18725 88
Not using 5,310 12 2,728 12 2519 12 3647 16 1580 7Not sure 3,204 7 1,621 7 1542 7 2132 10 1004 5
Total 44,412 100 23,252 100 20659 100 22297 100 21309 100b. Using 22,507 52 10,857 48 11406 56 12701 58 9403 46
Not using 13,942 32 8,270 36 5510 27 5853 27 7844 38Not sure 6,971 16 3,571 16 3319 16 3511 16 3322 16
Total 43,420 100 22,698 100 20235 100 22065 100 20569 100c. Using 33,283 76 19,569 84 13373 66 17184 77 15534 74
Not using 6,701 15 2,199 9 4410 22 3044 14 3515 17Not sure 4,024 9 1,435 6 2528 12 2074 9 1864 9
Total 44,008 100 23,203 100 20311 100 22302 100 20913 100d. Using 27,728 64 14,792 65 12647 63 14567 67 12711 62
Not using 9,703 22 4,951 22 4631 23 4379 20 5128 25Not sure 5,827 13 2,985 13 2772 14 2941 13 2768 13
Total 43,258 100 22,728 100 20050 100 21887 100 20607 100e. Using 5,281 16 2,537 14 2663 17 3004 18 2162 13
Not using 13,564 40 7,181 41 6225 40 6243 37 7087 43Not sure 14,816 44 7,940 45 6748 43 7502 45 7053 43
Total 33,661 100 17,658 100 15636 100 16749 100 16302 10024. C- or lower 17 0 4 0 12 0 10 0 6 0
C 178 0 35 0 140 1 122 1 51 0C+ 492 1 62 0 426 2 316 1 165 1B- 1,893 4 443 2 1434 7 1114 5 749 4B 8,552 19 2,528 11 5972 28 4696 21 3705 17B+ 10,969 25 4,733 20 6156 29 5818 26 4978 23A- 13,474 30 9,274 40 4104 20 6223 27 7033 33A 9,163 20 6,319 27 2752 13 4328 19 4665 22Grades not used 17 0 6 0 10 0 11 0 5 0
Total 44,755 100 23,404 100 21006 100 22638 100 21357 100
fyparents
Loans
fygrants
Other fyother
What do you expect most of your grades will be during the coming year? (Select only one.)
fygrades
Grants or scholarships
fyloans
Job or personal savings fyjob
BCSSE 2015 FREQUENCY DISTRIBUTIONS • 27
Variable Scale Response Options Count % Count % Count % Count % Count %
BCSSE 2015 Frequency Distributions
Self-ReportedHigh School grades First Generationa
Public
Yes NoB+ or lowerAll Students A- or higher
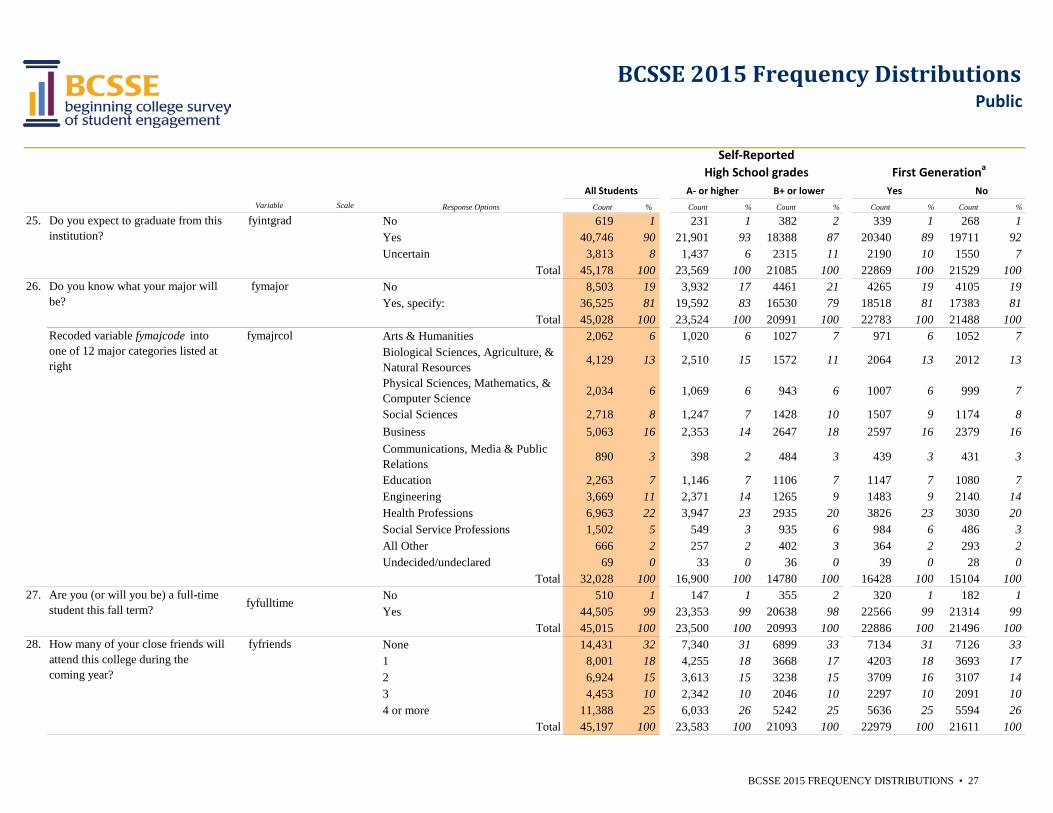
25. fyintgrad No 619 1 231 1 382 2 339 1 268 1Yes 40,746 90 21,901 93 18388 87 20340 89 19711 92Uncertain 3,813 8 1,437 6 2315 11 2190 10 1550 7
Total 45,178 100 23,569 100 21085 100 22869 100 21529 10026. fymajor No 8,503 19 3,932 17 4461 21 4265 19 4105 19
Yes, specify: 36,525 81 19,592 83 16530 79 18518 81 17383 81Total 45,028 100 23,524 100 20991 100 22783 100 21488 100
Arts & Humanities 2,062 6 1,020 6 1027 7 971 6 1052 7Biological Sciences, Agriculture, & Natural Resources 4,129 13 2,510 15 1572 11 2064 13 2012 13
Physical Sciences, Mathematics, & Computer Science 2,034 6 1,069 6 943 6 1007 6 999 7
Social Sciences 2,718 8 1,247 7 1428 10 1507 9 1174 8Business 5,063 16 2,353 14 2647 18 2597 16 2379 16Communications, Media & Public Relations 890 3 398 2 484 3 439 3 431 3
Education 2,263 7 1,146 7 1106 7 1147 7 1080 7Engineering 3,669 11 2,371 14 1265 9 1483 9 2140 14Health Professions 6,963 22 3,947 23 2935 20 3826 23 3030 20Social Service Professions 1,502 5 549 3 935 6 984 6 486 3All Other 666 2 257 2 402 3 364 2 293 2Undecided/undeclared 69 0 33 0 36 0 39 0 28 0
Total 32,028 100 16,900 100 14780 100 16428 100 15104 10027. No 510 1 147 1 355 2 320 1 182 1
Yes 44,505 99 23,353 99 20638 98 22566 99 21314 99Total 45,015 100 23,500 100 20993 100 22886 100 21496 100
28. None 14,431 32 7,340 31 6899 33 7134 31 7126 331 8,001 18 4,255 18 3668 17 4203 18 3693 172 6,924 15 3,613 15 3238 15 3709 16 3107 143 4,453 10 2,342 10 2046 10 2297 10 2091 104 or more 11,388 25 6,033 26 5242 25 5636 25 5594 26
Total 45,197 100 23,583 100 21093 100 22979 100 21611 100
fymajrcol
How many of your close friends will attend this college during the coming year?
fyfriends
Do you expect to graduate from this institution?
Are you (or will you be) a full-time student this fall term? fyfulltime
Do you know what your major will be?
Recoded variable fymajcode into one of 12 major categories listed at right
BCSSE 2015 FREQUENCY DISTRIBUTIONS • 28
Variable Scale Response Options Count % Count % Count % Count % Count %
BCSSE 2015 Frequency Distributions
Self-ReportedHigh School grades First Generationa
Public
Yes NoB+ or lowerAll Students A- or higher
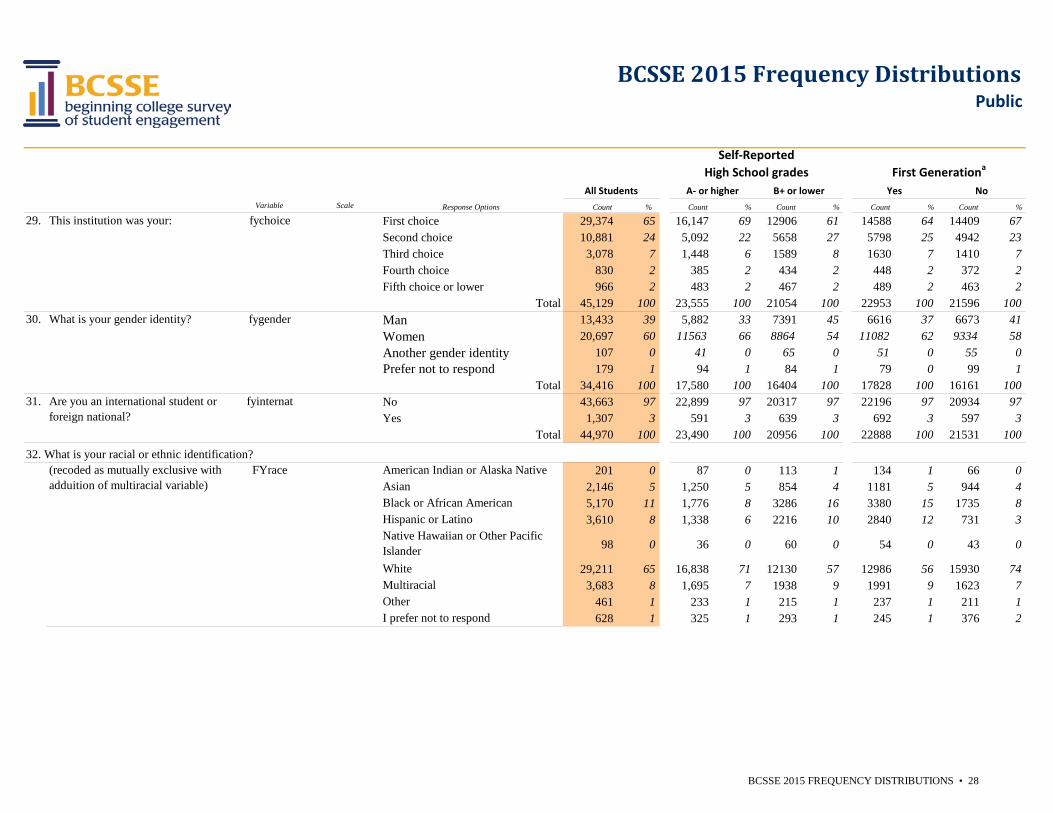
29. First choice 29,374 65 16,147 69 12906 61 14588 64 14409 67Second choice 10,881 24 5,092 22 5658 27 5798 25 4942 23Third choice 3,078 7 1,448 6 1589 8 1630 7 1410 7Fourth choice 830 2 385 2 434 2 448 2 372 2Fifth choice or lower 966 2 483 2 467 2 489 2 463 2
Total 45,129 100 23,555 100 21054 100 22953 100 21596 10030. fygender Man 13,433 39 5,882 33 7391 45 6616 37 6673 41
Women 20,697 60 11563 66 8864 54 11082 62 9334 58Another gender identity 107 0 41 0 65 0 51 0 55 0Prefer not to respond 179 1 94 1 84 1 79 0 99 1
Total 34,416 100 17,580 100 16404 100 17828 100 16161 10031. fyinternat No 43,663 97 22,899 97 20317 97 22196 97 20934 97
Yes 1,307 3 591 3 639 3 692 3 597 3Total 44,970 100 23,490 100 20956 100 22888 100 21531 100
32. What is your racial or ethnic identification?FYrace American Indian or Alaska Native 201 0 87 0 113 1 134 1 66 0
Asian 2,146 5 1,250 5 854 4 1181 5 944 4Black or African American 5,170 11 1,776 8 3286 16 3380 15 1735 8Hispanic or Latino 3,610 8 1,338 6 2216 10 2840 12 731 3Native Hawaiian or Other Pacific Islander 98 0 36 0 60 0 54 0 43 0
White 29,211 65 16,838 71 12130 57 12986 56 15930 74Multiracial 3,683 8 1,695 7 1938 9 1991 9 1623 7Other 461 1 233 1 215 1 237 1 211 1I prefer not to respond 628 1 325 1 293 1 245 1 376 2
(recoded as mutually exclusive with adduition of multiracial variable)
What is your gender identity?
Are you an international student or foreign national?
This institution was your: fychoice
BCSSE 2015 FREQUENCY DISTRIBUTIONS • 29
Variable Scale Response Options Count % Count % Count % Count % Count %
BCSSE 2015 Frequency Distributions
Self-ReportedHigh School grades First Generationa
Public
Yes NoB+ or lowerAll Students A- or higher
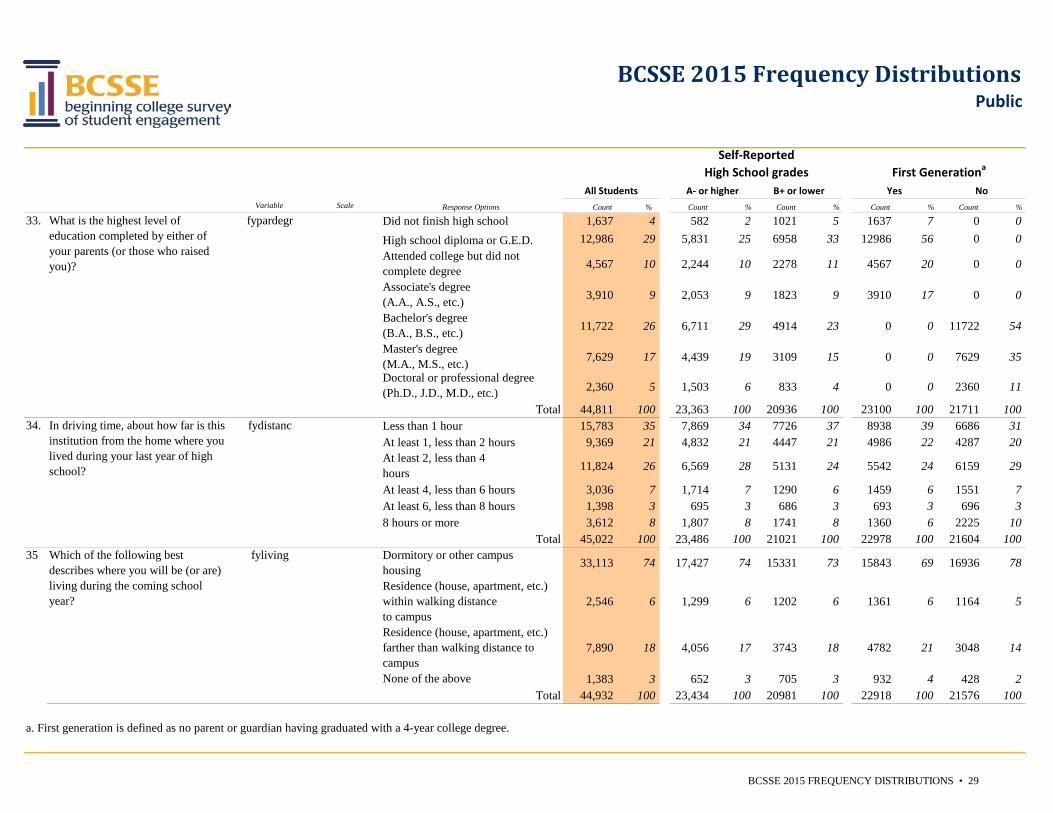
33. Did not finish high school 1,637 4 582 2 1021 5 1637 7 0 0High school diploma or G.E.D. 12,986 29 5,831 25 6958 33 12986 56 0 0Attended college but did not complete degree 4,567 10 2,244 10 2278 11 4567 20 0 0
Associate's degree (A.A., A.S., etc.) 3,910 9 2,053 9 1823 9 3910 17 0 0
Bachelor's degree (B.A., B.S., etc.) 11,722 26 6,711 29 4914 23 0 0 11722 54
Master's degree (M.A., M.S., etc.) 7,629 17 4,439 19 3109 15 0 0 7629 35
Doctoral or professional degree (Ph.D., J.D., M.D., etc.) 2,360 5 1,503 6 833 4 0 0 2360 11
Total 44,811 100 23,363 100 20936 100 23100 100 21711 10034. Less than 1 hour 15,783 35 7,869 34 7726 37 8938 39 6686 31
At least 1, less than 2 hours 9,369 21 4,832 21 4447 21 4986 22 4287 20At least 2, less than 4hours 11,824 26 6,569 28 5131 24 5542 24 6159 29
At least 4, less than 6 hours 3,036 7 1,714 7 1290 6 1459 6 1551 7At least 6, less than 8 hours 1,398 3 695 3 686 3 693 3 696 38 hours or more 3,612 8 1,807 8 1741 8 1360 6 2225 10
Total 45,022 100 23,486 100 21021 100 22978 100 21604 10035 Dormitory or other campus
housing 33,113 74 17,427 74 15331 73 15843 69 16936 78
Residence (house, apartment, etc.) within walking distance to campus
2,546 6 1,299 6 1202 6 1361 6 1164 5
Residence (house, apartment, etc.) farther than walking distance to campus
7,890 18 4,056 17 3743 18 4782 21 3048 14
None of the above 1,383 3 652 3 705 3 932 4 428 2Total 44,932 100 23,434 100 20981 100 22918 100 21576 100
a. First generation is defined as no parent or guardian having graduated with a 4-year college degree.
What is the highest level of education completed by either of your parents (or those who raised you)?
fypardegr
In driving time, about how far is this institution from the home where you lived during your last year of high school?
fydistanc
Which of the following best describes where you will be (or are) living during the coming school year?
fyliving
BCSSE Summary ReportMean Scale Scores and Selected Student Comparisons
Public
1. 6. 7.
2.
3.
4.
5.
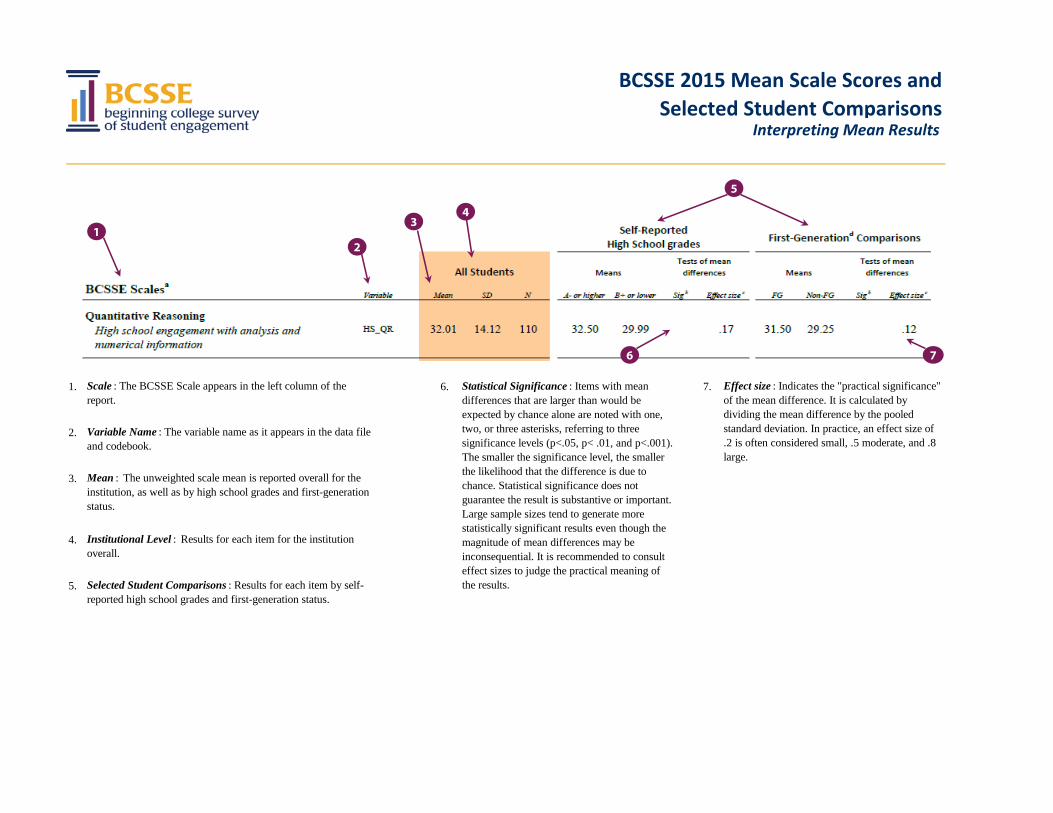
BCSSE 2015 Mean Scale Scores andSelected Student Comparisons
Interpreting Mean Results
Institutional Level : Results for each item for the institution overall.
Statistical Significance : Items with mean differences that are larger than would be expected by chance alone are noted with one, two, or three asterisks, referring to three significance levels (p<.05, p< .01, and p<.001). The smaller the significance level, the smaller the likelihood that the difference is due to chance. Statistical significance does not guarantee the result is substantive or important. Large sample sizes tend to generate more statistically significant results even though the magnitude of mean differences may be inconsequential. It is recommended to consult effect sizes to judge the practical meaning of the results.
Effect size : Indicates the "practical significance" of the mean difference. It is calculated by dividing the mean difference by the pooled standard deviation. In practice, an effect size of .2 is often considered small, .5 moderate, and .8 large.
Variable Name : The variable name as it appears in the data file and codebook.
Scale : The BCSSE Scale appears in the left column of the report.
Mean : The unweighted scale mean is reported overall for the institution, as well as by high school grades and first-generation status.
Selected Student Comparisons : Results for each item by self-reported high school grades and first-generation status.
1 2
3 4
5
6 7
BCSSE 2015 MEAN FIRST-YEAR INDICATOR SCORES AND SELECTED STUDENT COMPARISONS • 32
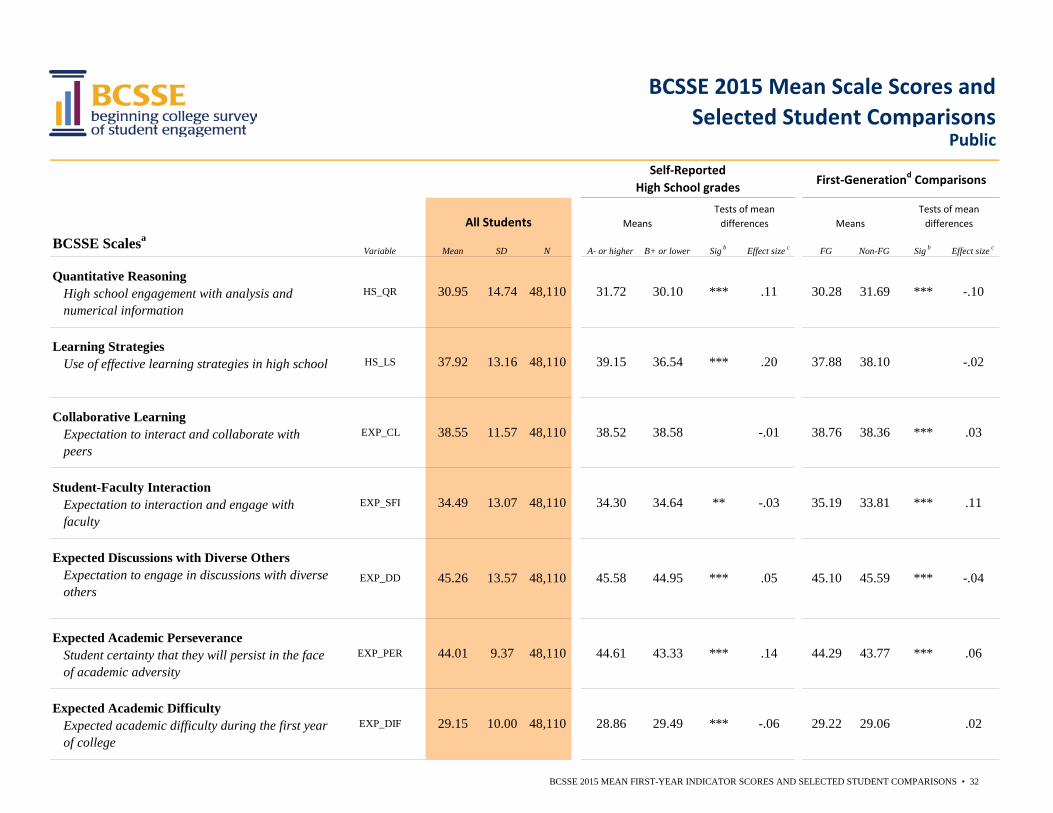
BCSSE ScalesaVariable Mean SD N A- or higher B+ or lower Sig b Effect size c FG Non-FG Sig b Effect size c
Quantitative ReasoningHigh school engagement with analysis and numerical information
Learning StrategiesUse of effective learning strategies in high school
Collaborative LearningExpectation to interact and collaborate with peers
Student-Faculty InteractionExpectation to interaction and engage with faculty
Expected Discussions with Diverse OthersExpectation to engage in discussions with diverse others
Expected Academic PerseveranceStudent certainty that they will persist in the face of academic adversity
Expected Academic DifficultyExpected academic difficulty during the first year of college
PublicSelf-Reported
High School grades First-Generationd Comparisons
HS_QR
36.54 *** .20 37.88
All Students
-.02
***
Tests of mean differences
Tests of mean differences
38.10
Means
.03
Means
31.69
HS_LS 37.92 13.16 48,110
*** -.10
.05
***43.77
BCSSE 2015 Mean Scale Scores andSelected Student Comparisons
.11 30.2831.72 30.10
-.03
44.95 *** 45.10
38.52
30.95 14.74 48,110
39.15
38.55 11.57 48,110
48,110
38.36 ***
.06
EXP_CL
29.22
48,110
-.06*** .02
13.07
EXP_DD
EXP_PER
-.0445.26
38.58 -.01 38.76
34.64
45.58
44.61
48,110
EXP_SFI 33.81 .11
EXP_DIF
48,110
13.57
34.49 ***
9.37
29.0629.49
.14
10.0029.15
44.01
28.86
45.59
35.19
***
***
**
44.29
34.30
43.33
BCSSE 2015 MEAN FIRST-YEAR INDICATOR SCORES AND SELECTED STUDENT COMPARISONS • 33
BCSSE ScalesaVariable Mean SD N A- or higher B+ or lower Sig b Effect size c FG Non-FG Sig b Effect size c
PublicSelf-Reported
High School grades First-Generationd Comparisons
All StudentsTests of mean
differencesTests of mean
differences MeansMeans
BCSSE 2015 Mean Scale Scores andSelected Student Comparisons
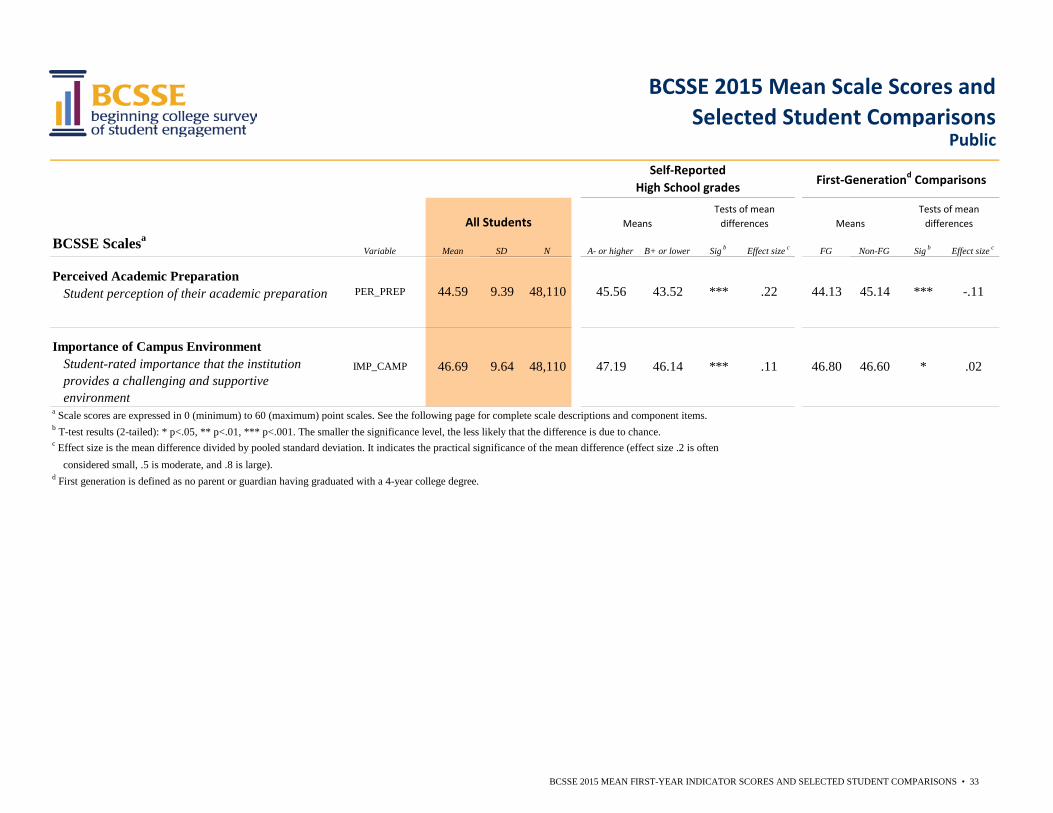
Perceived Academic PreparationStudent perception of their academic preparation
Importance of Campus EnvironmentStudent-rated importance that the institution provides a challenging and supportive environment
c Effect size is the mean difference divided by pooled standard deviation. It indicates the practical significance of the mean difference (effect size .2 is oftenconsidered small, .5 is moderate, and .8 is large).
.2243.52 *** 44.13 ***PER_PREP 44.59 9.39
48,110
d First generation is defined as no parent or guardian having graduated with a 4-year college degree.
IMP_CAMP 47.19 .11 46.80
b T-test results (2-tailed): * p<.05, ** p<.01, *** p<.001. The smaller the significance level, the less likely that the difference is due to chance.
-.11
46.6046.14 *
a Scale scores are expressed in 0 (minimum) to 60 (maximum) point scales. See the following page for complete scale descriptions and component items.
.02***46.69 9.64
48,110 45.56 45.14
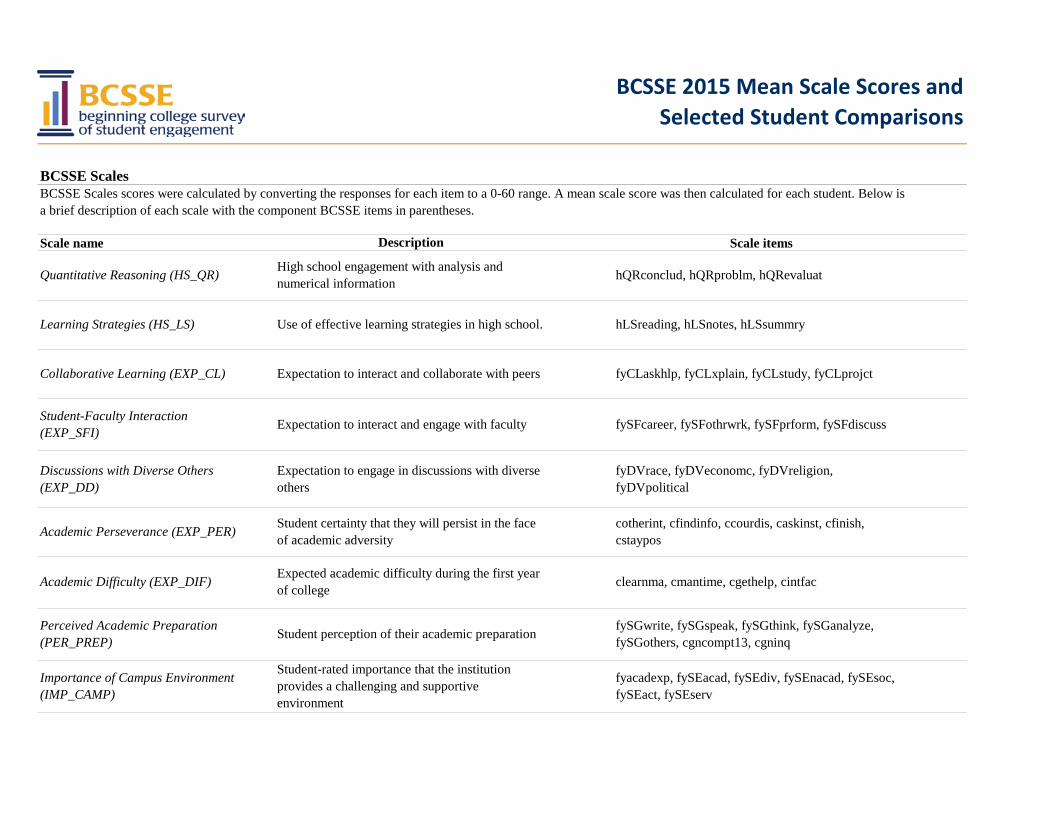
BCSSE Scales
Student perception of their academic preparation
Student-rated importance that the institution provides a challenging and supportive environment
fyacadexp, fySEacad, fySEdiv, fySEnacad, fySEsoc, fySEact, fySEserv
fySGwrite, fySGspeak, fySGthink, fySGanalyze, fySGothers, cgncompt13, cgninq
fySFcareer, fySFothrwrk, fySFprform, fySFdiscuss
Expectation to engage in discussions with diverse others
fyDVrace, fyDVeconomc, fyDVreligion, fyDVpolitical
BCSSE 2015 Mean Scale Scores andSelected Student Comparisons
Expectation to interact and engage with faculty
cotherint, cfindinfo, ccourdis, caskinst, cfinish, cstaypos
clearnma, cmantime, cgethelp, cintfac
High school engagement with analysis and numerical information
Use of effective learning strategies in high school.
Expectation to interact and collaborate with peers
hQRconclud, hQRproblm, hQRevaluat
BCSSE Scales scores were calculated by converting the responses for each item to a 0-60 range. A mean scale score was then calculated for each student. Below is a brief description of each scale with the component BCSSE items in parentheses.
Description
hLSreading, hLSnotes, hLSsummry
fyCLaskhlp, fyCLxplain, fyCLstudy, fyCLprojct
Scale items
Student certainty that they will persist in the face of academic adversity
Expected academic difficulty during the first year of college
Discussions with Diverse Others (EXP_DD)
Academic Perseverance (EXP_PER)
Academic Difficulty (EXP_DIF)
Perceived Academic Preparation (PER_PREP)
Importance of Campus Environment (IMP_CAMP)
Scale name
Quantitative Reasoning (HS_QR)
Learning Strategies (HS_LS)
Collaborative Learning (EXP_CL)
Student-Faculty Interaction (EXP_SFI)